Embed Size (px)
Citation preview
Volume 1, Issue 1 , September 2017, ISSN 2456 - 9151
36
Risk and Return Analysis of Pharmaceutical Industry
Dr.Prameela S. Shetty, Professor, SDM PG Centre for Management Studies and
Research, Mangalore, Phone : 9886177446, Email : [email protected]
Dr.Devaraj K, Director, SDM PG Centre for Management Studies and Research,
Mangalore
Key words
Pharmaceutical industry
Rational Investor
Beta value
Ratio Analysis
Returns.
ABSTRACT
Purchase and sale of listed securities happen in the organized market called as
stock exchange. Any investor, would analyze the risk associated with the stock
which he is concerned about before investing his investible wealth. One of
potential industry considered by the investors for investment in this decade is the
Indian pharmaceuticals industry. This market is the third largest in terms of volume
and thirteenth largest in terms of value, as per a report by Equity Master. Even in
the global pharmaceuticals sector India enjoys an important position which is a
major factor to be considered by the investors.
The objective of the study is to analyse the risk and returns of investment made in
the Indian pharmaceutical industry. This study is done by selecting A group stock
of the pharmaceutical sector listed in BSE. Beta, Alpha and Returns are calculated
for every stock over a period of 5 years by taking the yearly opening price and
closing price of these selected stocks.
Based on the analysis and interpretation derived from the calculations it can be
concluded that the investors should analyse the market on a continuous basis which
will help him to pick the right combination to construct the portfolio for investment.
Higher the risk, higher the returns. Even though the pharmaceutical industry is
doing well, it doesn’t come up to the level of market returns.
1.0 Introduction:
Stock exchange is an organized market for
purchase and sale of listed securities.
Various services for stock brokers and
traders in terms of trading of stocks, bonds
and other securities are provided by the
stock exchanges. These exchanges also
provide other facilities for the issue and
redemption of securities and other financial
instruments. It also provides capital events
including the payment of income and
dividends.

Volume 1, Issue 1 , September 2017, ISSN 2456 - 9151
37
Any investor, would analyse the risk
associated with the avenue of their concern
before investing his investible part of the
wealth. The actual return which he receives
from a stock may vary from his expected
return and depends on the risk he is ready to
bear. The risk is measured in terms of
variability of return. There are several
factors that cause risk. They are either
common to all stocks or specific to a
particular stock. Every investor would
prefer to analyze the risk factors which
would help him to plan his portfolio, so that
he can minimize his risk and maximize his
return by diversifying into right avenues.
The risk and return relationship is a concept
applicable in real life situations as well as
in terms of financial analysis. The amount
of risk assumed should be proportionate to
the expected returns. Managing risk is very
important aspect for an investor.
The Indian pharmaceuticals market is the
third largest in terms of volume and
thirteenth largest in terms of value, as per a
report by Equity Master. Branded drugs
dominate the pharmaceuticals market,
constituting nearly 70 to 80 per cent of the
market. India is the largest provider of
generic drugs globally with the Indian
generics accounting for 20 per cent of
global exports in terms of volume.
2.0 Purpose of the Research:
If a company which has a higher intrinsic
value, it doesn’t always mean that it is the
best stock to buy. The prospects for growth
of that company may be lower or it may be
overpriced due to various other reasons
affecting the market. Similarly, if a
company performs well during any one
year it need not be the best one to buy. A
company which has been performing badly
for some period of time might turn up to be
the best company to buy. Even though the
shares are underpriced it may have good
prospects of growth. It all depends on the
fundamentals of the company. Hence the
analysis of risk and return would guide the
investor in planning a proper profitable
investment option and also to select the best
portfolio as well.
Risk is measured in terms of variability of
returns. There are two types of risk-
systematic and unsystematic risk.
Systematic risk is the one which affects the
market as a whole. Example : interest rate,
inflation. Unsystematic risk is unique to a
particular industry or company. Here there
are two types - business risk and financial
risk. Business risk is the risk caused by the
operating environment of the business. This
intern is has two types- internal factors like
sales and external factors like government
policies. Financial risk is the one which
emerges from the debt component of the
capital structure.
The healthcare index is bullish. There is
heavy buying of pharmaceutical
companies listed in Bombay Stock
Volume 1, Issue 1 , September 2017, ISSN 2456 - 9151
38
Exchange (BSE). This has led Healthcare
index, to grow from 10,212 on 8 January
2014 to 15,014 on June 17, 2016.
BSE health care index is comprises of 56
Pharmaceutical companies, 5 Hospital and
medical services and 2 miscellaneous
companies.
An analyst Sriram Rathi from Anand Rathi
Institutional Research said "Pharmaceutical
stocks have been largely driven by
companies' strong performance, increase in
free cash flows, bright outlook, particularly
in the US market, and valuation rerating,".
A global consultancy McKinsey & Co, has
endorsed that the Indian pharmaceutical
sector is on a strong footing. It also says that
the sector could grow to $55 billion by
2020. The current market size of the
pharmaceutical industry in India is US$ 20
billion. Domestic Pharmaceutical market
grew at a CAGR ( Compound Annual
Growth Rate ) of 12% year on year in
February 2016 which is in line with average
of 12.9% since April 2015.
Literature Review
Ramsey and Zhang (1995) and Ramsey and
Lampart (1998) have used discrete wavelet
decomposition to test the models in which
there was variation in beta value and risk
premium. Wavelets are those functions
with properties used to decompose a time
series of frequency and time. This gives
scope to study the correlation of the markets
at different times. Therefore calculating and
analyzing beta becomes more relevant. The
decomposition of series of returns gives
scope for a researcher to observe the risk
and return ratio. This intern gives the
solution to the question regarding the scale
to be used to explain beta. It also analyses
the risk – return relationship. It also
explains if higher risk is accompanied by
higher.
Fernandez (2006) has analyzed Chile stock
market with 24 stocks, about 85% of which
were traded in Santiago stock exchange
during January 1997 to September 2002.
The researcher used the price index of
selected stocks (IPSA), which is a proxy.
The proxy for risk free investments is the
rate of return on the deposits for 30 days.
The average premium of the market was -
9.06% annually. When tested at 5% level of
significance it shows that coefficients are
not significant. This shows that there is no
significant. This shows that there is no
significant relation between risk and
returns. It is concluded that capital asset
pricing models predicts better when it
comes to 4 to 8 days the estimated risk
premium is almost similar to actual risk
premium.
amaei (2012) analyzed the risk that is that
systematic risk component of Iran stock
market. The sample size was 15 companies
listed in Tehran Stock exchange. These
stocks were traded during June 2004 and
Volume 1, Issue 1 , September 2017, ISSN 2456 - 9151
39
June 2009. Here the proxy used is the
annual interest rate of the bonds issued by
Central Bank. This study also proved that
the market is more efficient at first to fourth
scales.
Dimitrov and Jain (2005) measured the
changes in leverage on the returns of the
stock. The researcher also studied the
earnings based performance. The study
output showed that debt to equity ratio and
risk adjusted stock returns are negatively
correlated. The researchers also studied the
negative correlated between changes in
levels of debt and future adjusted returns.
The researcher also studied the ability of the
leverage to predict the stock returns by
using ratios. The authors did not distinguish
between the operating and investing
activities of a firm.
Campbell, Lo and MacKinlay (1997), have
analysed the factor models are based on
Arbitrage Price Theory (APT) given by
Ross in 1976. This model estimates the
systematic risk by a single factor that is the
market portfolio. The criticism of the
Arbitrage Price Theory (APT) is that the
number of factors is not known in advance.
It must be determined using statistical tools.
Objectives of the study
To analyze the risk and return of the A
group shares of pharmaceutical
industry listed in BSE.
To calculate the returns of these
companies for past 5 years (2011-
2015).
To calculate the Beta and Alpha of
these companies for past 5 years
(2011-2015).
To guide the investors regarding
various investment opportunities.
To find if there is any relation between
the beta and returns of the industry and
the market.
4 .0 Methodology:
Sources of Data
The secondary data is collected from
various sources like internet, journals and
other publications. The opening and closing
stock prices and market index values are
obtained from the official websites
www.bseindia.com and
www.moneycontrol.com.
This study is undertaken to determine the
risk and return prevailing in the stock
market by analyzing the selected companies
stocks. A group stock of the pharmaceutical
sector listed in BSE are selected for the
study. 21 stocks come under this group.
Later Alpha beta and Returns involved in
the stock are calculated using excel. Beta is
calculated for every stock for five years.
Returns are calculated for 5 years by taking
Volume 1, Issue 1 , September 2017, ISSN 2456 - 9151
40
=
the yearly opening price and closing price
of all the 21 stocks selected for the study.
A group shares are the most liquid shares
among the whole lot of stocks listed in the
BSE. These are companies which are rated
excellent in all aspects. These are the safe
options for an investor to consider in his
portfolio. The fundamental information of
these companies is extensively available.
The group A companies selected for the
study are Cipla Ltd., Dr.Reddy’s
Laboratories Ltd., Lupin Ltd., Piramal
Enterprises Ltd., Torrent Pharmaceutical
Ltd., Glaxosmithkline Pharmaceuticals
Ltd., Sanofi India Ltd., Pfizer Ltd., IPCA
Laboratories., Sun Pharmaceutical
Industries Ltd., Aurobindo Pharma Ltd.,
Natco Pharma Ltd., Jubilant Life Sciences
Limited, Glenmark Pharmaceutical Ltd.,
Wochardt Ltd., Cadila Healcare Ltd.,
Ajanta Pharma Ltd., Divis Laboratories
Ltd., Strides Shasun Ltd., Sun Pharma
Advanced Research company Ltd. and
Alembic Pharmaceutical Ltd.
Hypothesis 1: There is no significant
difference between the calculated beta and
market beta
Hypothesis 2: There is no significant
difference between the average returns and
market returns
Beta is calculated by the formula:
n ∑ xy − ∑x. ∑y β =
n∑x2 − (∑x) ²
β ∑ (Ri−Ri) (Rm−Rm)
∑ (Rm−Rm) ²
Where n= no of years
x= independent factor (i.e. market)
y= dependent factor (i.e. individual firm)
Ri= individual return
Ri= average individual return
Rm= mark5et return
Rm= average market return
Alpha is calculated by the formula:
α = Y⃐ – β �⃐�
Where �⃐� =∑y/n and �⃐� =∑x/n
α = R⃐ i − βRm
Returns are calculated using the formula
R= α+ β (Rm). t- test and Anova are the tools
used to test the hypothesis
Volume 1, Issue 1 , September 2017, ISSN 2456 - 9151
41
1.2 1
0.8
0.6
0.4
0.2
0
-0.2
Beta
Mkt Beta
Analysis:
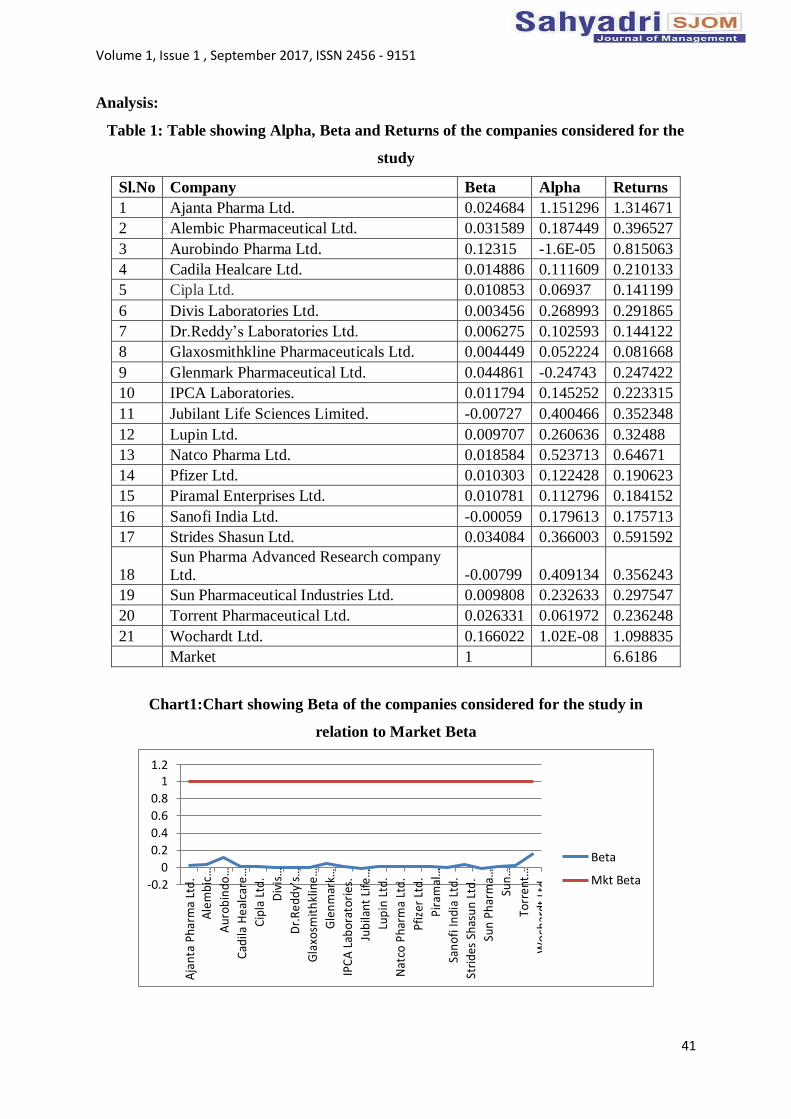
Table 1: Table showing Alpha, Beta and Returns of the companies considered for the
study
Sl.No Company Beta Alpha Returns
1 Ajanta Pharma Ltd. 0.024684 1.151296 1.314671
2 Alembic Pharmaceutical Ltd. 0.031589 0.187449 0.396527
3 Aurobindo Pharma Ltd. 0.12315 -1.6E-05 0.815063
4 Cadila Healcare Ltd. 0.014886 0.111609 0.210133
5 Cipla Ltd. 0.010853 0.06937 0.141199
6 Divis Laboratories Ltd. 0.003456 0.268993 0.291865
7 Dr.Reddy’s Laboratories Ltd. 0.006275 0.102593 0.144122
8 Glaxosmithkline Pharmaceuticals Ltd. 0.004449 0.052224 0.081668
9 Glenmark Pharmaceutical Ltd. 0.044861 -0.24743 0.247422
10 IPCA Laboratories. 0.011794 0.145252 0.223315
11 Jubilant Life Sciences Limited. -0.00727 0.400466 0.352348
12 Lupin Ltd. 0.009707 0.260636 0.32488
13 Natco Pharma Ltd. 0.018584 0.523713 0.64671
14 Pfizer Ltd. 0.010303 0.122428 0.190623
15 Piramal Enterprises Ltd. 0.010781 0.112796 0.184152
16 Sanofi India Ltd. -0.00059 0.179613 0.175713
17 Strides Shasun Ltd. 0.034084 0.366003 0.591592
18
Sun Pharma Advanced Research company
Ltd. -0.00799
0.409134
0.356243
19 Sun Pharmaceutical Industries Ltd. 0.009808 0.232633 0.297547
20 Torrent Pharmaceutical Ltd. 0.026331 0.061972 0.236248
21 Wochardt Ltd. 0.166022 1.02E-08 1.098835
Market 1 6.6186
Chart1:Chart showing Beta of the companies considered for the study in
relation to Market Beta
Aja
nta
Pha
rma
Ltd
. A
lem
bic
…
Au
rob
ind
o…
Cad
ila H
ealc
are…
Cip
la L
td.
Div
is…
Dr.
Re
dd
y’s…
Gla
xosm
ith
klin
e…
Gle
nm
ark…
IPC
A L
abo
rato
ries
.
Jub
ilan
t Li
fe…
Lup
in L
td.
Nat
co P
har
ma
Ltd
.
Pfiz
er L
td.
Pira
mal
…
San
ofi
Ind
ia L
td.
Stri
des
Sh
asu
n Lt
d.
Sun
Phar
ma…
Sun
…
Torr
en
t…
Wo
char
dt
Ltd.
Volume 1, Issue 1 , September 2017, ISSN 2456 - 9151
42
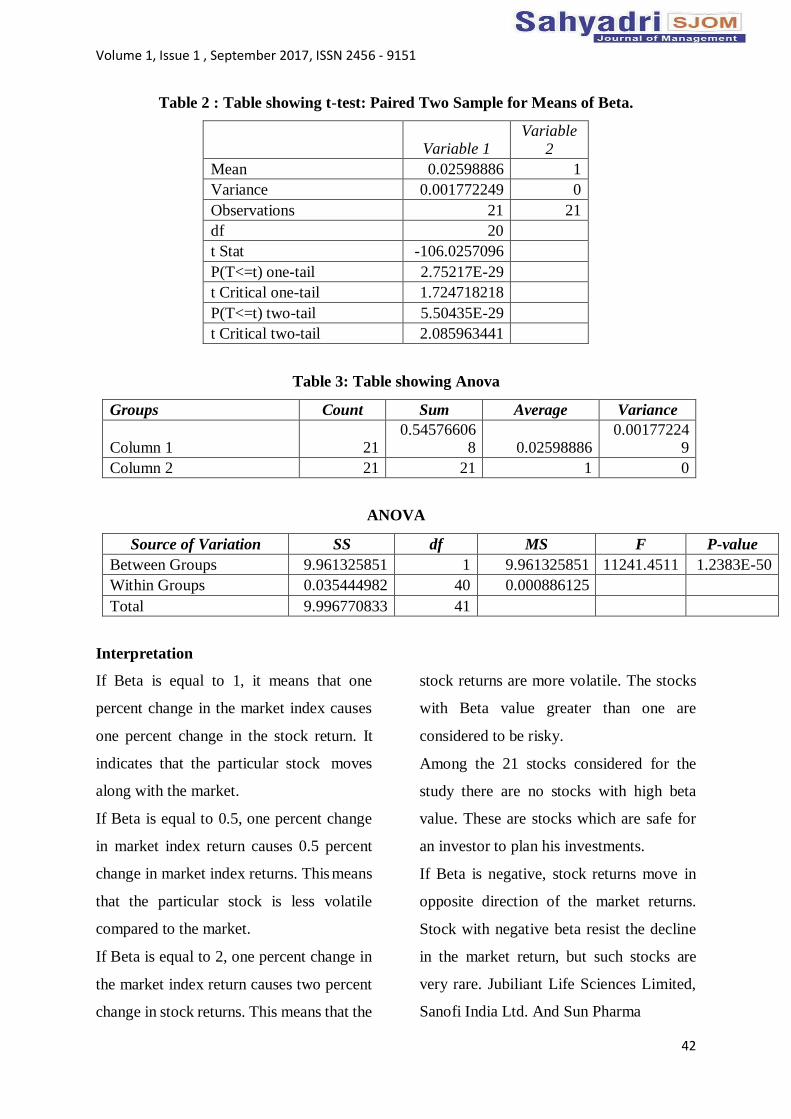
Table 2 : Table showing t-test: Paired Two Sample for Means of Beta.
Variable 1
Variable
2
Mean 0.02598886 1
Variance 0.001772249 0
Observations 21 21
df 20
t Stat -106.0257096
P(T<=t) one-tail 2.75217E-29
t Critical one-tail 1.724718218
P(T<=t) two-tail 5.50435E-29
t Critical two-tail 2.085963441
Table 3: Table showing Anova
Groups Count Sum Average Variance
Column 1
21
0.54576606 8
0.02598886
0.00177224 9
Column 2 21 21 1 0
ANOVA
Source of Variation SS df MS F P-value
Between Groups 9.961325851 1 9.961325851 11241.4511 1.2383E-50
Within Groups 0.035444982 40 0.000886125
Total 9.996770833 41
Interpretation
If Beta is equal to 1, it means that one
percent change in the market index causes
one percent change in the stock return. It
indicates that the particular stock moves
along with the market.
If Beta is equal to 0.5, one percent change
in market index return causes 0.5 percent
change in market index returns. This means
that the particular stock is less volatile
compared to the market.
If Beta is equal to 2, one percent change in
the market index return causes two percent
change in stock returns. This means that the
stock returns are more volatile. The stocks
with Beta value greater than one are
considered to be risky.
Among the 21 stocks considered for the
study there are no stocks with high beta
value. These are stocks which are safe for
an investor to plan his investments.
If Beta is negative, stock returns move in
opposite direction of the market returns.
Stock with negative beta resist the decline
in the market return, but such stocks are
very rare. Jubiliant Life Sciences Limited,
Sanofi India Ltd. And Sun Pharma
Volume 1, Issue 1 , September 2017, ISSN 2456 - 9151
43
Advanced Research Company Ltd are the
companies in the study sample which have
negative Beta values.
The average beta of the 21 companies
considered for the study is 0.026 with
almost zero variance. It means beta values
for all companies in the sample is almost
same.
Analysis of variance between the groups
and within the groups is analysed and it is
found that f value is 11241 and p value is
Since the p value is much greater than
0.05, the null hypotheses is accepted.
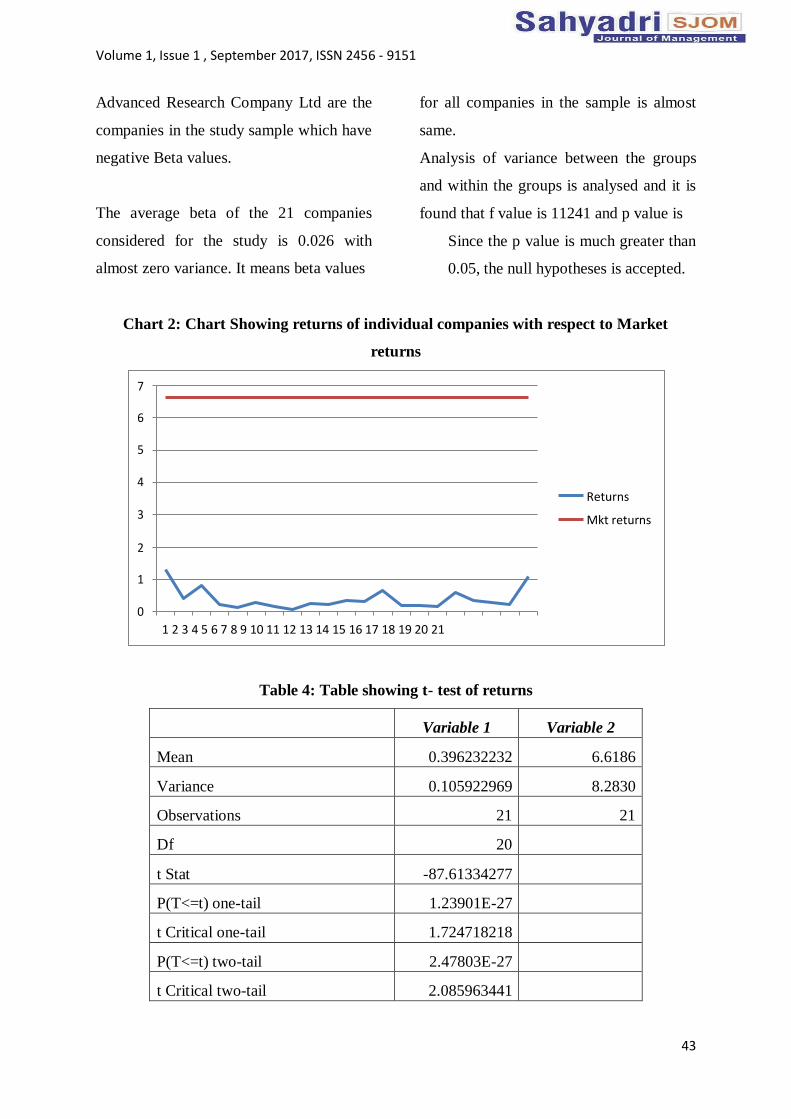
Chart 2: Chart Showing returns of individual companies with respect to Market
returns
Table 4: Table showing t- test of returns
Variable 1 Variable 2
Mean 0.396232232 6.6186
Variance 0.105922969 8.2830
Observations 21 21
Df 20
t Stat -87.61334277
P(T<=t) one-tail 1.23901E-27
t Critical one-tail 1.724718218
P(T<=t) two-tail 2.47803E-27
t Critical two-tail 2.085963441
7
6
5
4
3
Returns
Mkt returns
2
1
0
1 2 3 4 5 6 7 8 9 10 11 12 13 14 15 16 17 18 19 20 21
Volume 1, Issue 1 , September 2017, ISSN 2456 - 9151
44
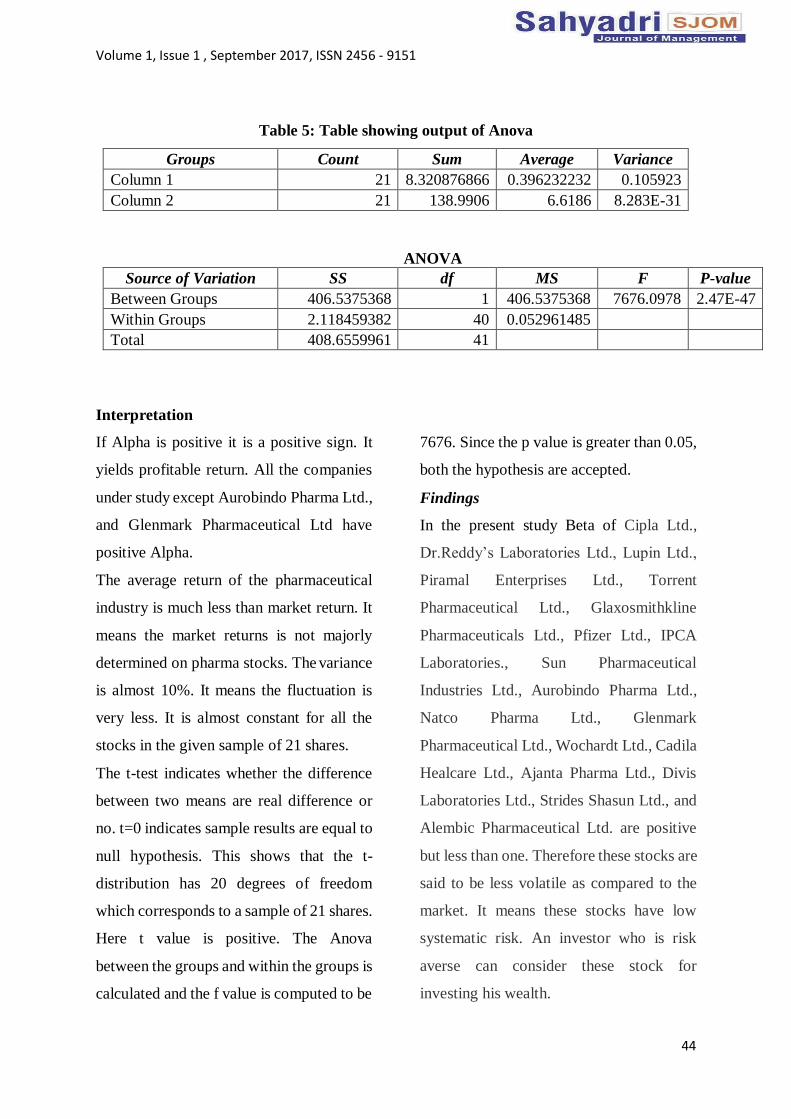
Table 5: Table showing output of Anova
Groups Count Sum Average Variance
Column 1 21 8.320876866 0.396232232 0.105923
Column 2 21 138.9906 6.6186 8.283E-31
ANOVA
Source of Variation SS df MS F P-value
Between Groups 406.5375368 1 406.5375368 7676.0978 2.47E-47
Within Groups 2.118459382 40 0.052961485
Total 408.6559961 41
Interpretation
If Alpha is positive it is a positive sign. It
yields profitable return. All the companies
under study except Aurobindo Pharma Ltd.,
and Glenmark Pharmaceutical Ltd have
positive Alpha.
The average return of the pharmaceutical
industry is much less than market return. It
means the market returns is not majorly
determined on pharma stocks. The variance
is almost 10%. It means the fluctuation is
very less. It is almost constant for all the
stocks in the given sample of 21 shares.
The t-test indicates whether the difference
between two means are real difference or
no. t=0 indicates sample results are equal to
null hypothesis. This shows that the t-
distribution has 20 degrees of freedom
which corresponds to a sample of 21 shares.
Here t value is positive. The Anova
between the groups and within the groups is
calculated and the f value is computed to be
7676. Since the p value is greater than 0.05,
both the hypothesis are accepted.
Findings
In the present study Beta of Cipla Ltd.,
Dr.Reddy’s Laboratories Ltd., Lupin Ltd.,
Piramal Enterprises Ltd., Torrent
Pharmaceutical Ltd., Glaxosmithkline
Pharmaceuticals Ltd., Pfizer Ltd., IPCA
Laboratories., Sun Pharmaceutical
Industries Ltd., Aurobindo Pharma Ltd.,
Natco Pharma Ltd., Glenmark
Pharmaceutical Ltd., Wochardt Ltd., Cadila
Healcare Ltd., Ajanta Pharma Ltd., Divis
Laboratories Ltd., Strides Shasun Ltd., and
Alembic Pharmaceutical Ltd. are positive
but less than one. Therefore these stocks are
said to be less volatile as compared to the
market. It means these stocks have low
systematic risk. An investor who is risk
averse can consider these stock for
investing his wealth.
Volume 1, Issue 1 , September 2017, ISSN 2456 - 9151
45
Jubilant Life Sciences Ltd., Sanofi India
Ltd., and Sun Pharma Advanced Research
Company have negative Beta. It means that
these stock move in the opposite direction
of the market. These are stocks which
cannot be analysed based on the market
study. Strong fundamental analysis of these
companies may be necessary to rely on this
for investment since the behavior of these
companies are difficult to predict based on
just technical analysis.
All the companies considered for the study
except Aurobindo Pharma Ltd., and
Glenmark Pharmaceuticals are having
positive Alpha which is a healthy sign.
Returns of all the companies under study
are positive but comparatively less than the
market returns.
It can be concluded that there is no
significant difference between the
calculated beta of the companies under
study and the market beta. Also there is no
significant difference between the average
returns of the pharmaceutical industry and
the market returns hence accepting the
hypotheses formulated to be tested.
Suggestions
Based on the calculations made it can be
concluded that investors should analyse the
market on a continuous basis in order to
select the right companies to include in their
portfolio. The returns and the Beta values
will help the investors in analyzing his
portfolio or avenue of investment. The t test
and Anova performed to test the hypothesis
has led to the conclusion that the market and
the pharmaceutical industry in particular
are moving in the same direction. The
investors should always perform a thorough
economic, fundamental and company
analysis along with technical analysis in the
right manner to arrive at that, important
conclusion of investment decisions.
The A group shares of pharmaceutical
companies have yielded good returns in the
past 5 years. These are shares which are
strongly recommended for investment. The
stock market is usually highly volatile. It
depends upon the investors how to make
use of the situation in order to reap the
money back with good returns. An investor
should be wise enough to analyze the
various investment options available to him
and thus minimize the risk and maximize
the returns.
Conclusion
The Indian pharmaceutical industry, which
is growing at a very fast rate is expected to
grow over 15 per cent per annum between
2017 and 2020. It will outperform the
global pharmaceutical industry, which is
expected to grow at an annual rate of five
per cent between the same period. The
investible companies will have to face and
overcome various challenges like
competition, price wars and government
Volume 1, Issue 1 , September 2017, ISSN 2456 - 9151
46
policies and interventions. Challenges will
be tougher for companies whose focus is
only on Indian market. Increasing
competitiveness, patent issues and coping
with the Drug Price Control Order (DPCO),
which prescribes a cap on prices of several
essential medicines, are some issues our
pharmaceutical companies will have to face
and survive.
Reference:
Ahn, S., Denis, D. J., & Denis, D. K.
“Leverage and investment in
diversified firms”. Journal of Financial
Economics, (2006)
Aiwazian, VV., Booth, I., Cleary, S.
“Do emerging market firms follow
different dividend policies from US
firms ?”, Journal of financial Research,
Vol.26 No.3. (2003)
Berk, Jonathan; DeMarzo, Peter,
“Corporate Finance”, ,Third Edition,
Pearson Education, USA; (2014)
Cyert, R.M., and March, J.G. “A
Behavioral Theory of the firm”,
Englewood Cliffs, NJ: Prentice Hall.
(1963)
Goodman, M. “Pharmaceutical
Industry- Financial Performance”,
Nature Review, Drug Discovery
(2009)
Guthrie, G. “Regulating Infrastructure:
The impact on risk and investment”,
Journal of Economic Literature.,
December, (2006)
Karadžić, V., Cerović, J. “Market Risk
of the Western Balkans Countries
during the Global Financial Crisis”,
Economic Annals-XXI, Vol. 2014, No.
11-12, (2014)
Lewellen, J “Predicting returns with
financial ratios”, Journal of Financial
Economics, (2014)
Prasanna Chandra, “Finanacial Theory
and Practice”, Tata Mc Graw Hill
Publication Private Ltd., Eighth
Edition, (2011)
Ross, S. “The Arbitrage Theory of
Capital Asset Pricing”, Journal of
Economic Theory, (1976)
Volume 1, Issue 1 , September 2017, ISSN 2456 - 9151
47
ANNEXURE
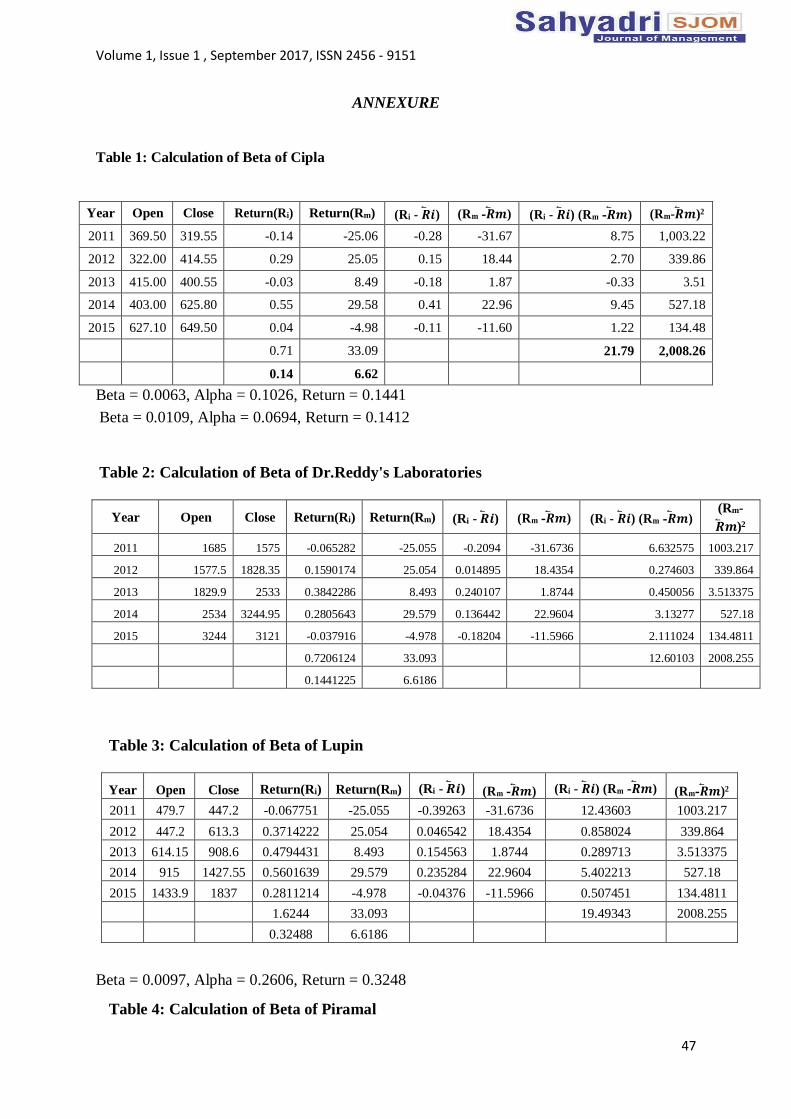
Table 1: Calculation of Beta of Cipla
Year Open Close Return(Ri) Return(Rm) (Ri - �⃐� 𝒊 ) (Rm -�⃐� 𝒎 ) (Ri - �⃐� 𝒊 ) (Rm -�⃐� 𝒎 ) (Rm-�⃐� 𝒎 )2
2011 369.50 319.55 -0.14 -25.06 -0.28 -31.67 8.75 1,003.22
2012 322.00 414.55 0.29 25.05 0.15 18.44 2.70 339.86
2013 415.00 400.55 -0.03 8.49 -0.18 1.87 -0.33 3.51
2014 403.00 625.80 0.55 29.58 0.41 22.96 9.45 527.18
2015 627.10 649.50 0.04 -4.98 -0.11 -11.60 1.22 134.48
0.71 33.09 21.79 2,008.26
0.14 6.62
Beta = 0.0063, Alpha = 0.1026, Return = 0.1441
Beta = 0.0109, Alpha = 0.0694, Return = 0.1412
Table 2: Calculation of Beta of Dr.Reddy's Laboratories
Year Open Close Return(Ri) Return(Rm) (Ri - �⃐� 𝒊 ) (Rm -�⃐� 𝒎 ) (Ri - �⃐� 𝒊 ) (Rm -�⃐� 𝒎 ) (Rm-
�⃐� 𝒎 )2
2011 1685 1575 -0.065282 -25.055 -0.2094 -31.6736 6.632575 1003.217
2012 1577.5 1828.35 0.1590174 25.054 0.014895 18.4354 0.274603 339.864
2013 1829.9 2533 0.3842286 8.493 0.240107 1.8744 0.450056 3.513375
2014 2534 3244.95 0.2805643 29.579 0.136442 22.9604 3.13277 527.18
2015 3244 3121 -0.037916 -4.978 -0.18204 -11.5966 2.111024 134.4811
0.7206124 33.093
12.60103 2008.255
0.1441225 6.6186
Table 3: Calculation of Beta of Lupin
Year Open Close Return(Ri) Return(Rm) (Ri - �⃐� 𝒊 ) (Rm -�⃐� 𝒎 ) (Ri - �⃐� 𝒊 ) (Rm -�⃐� 𝒎 ) (Rm-�⃐� 𝒎 )2
2011 479.7 447.2 -0.067751 -25.055 -0.39263 -31.6736 12.43603 1003.217
2012 447.2 613.3 0.3714222 25.054 0.046542 18.4354 0.858024 339.864
2013 614.15 908.6 0.4794431 8.493 0.154563 1.8744 0.289713 3.513375
2014 915 1427.55 0.5601639 29.579 0.235284 22.9604 5.402213 527.18
2015 1433.9 1837 0.2811214 -4.978 -0.04376 -11.5966 0.507451 134.4811
1.6244 33.093 19.49343 2008.255
0.32488 6.6186
Beta = 0.0097, Alpha = 0.2606, Return = 0.3248
Table 4: Calculation of Beta of Piramal
Volume 1, Issue 1 , September 2017, ISSN 2456 - 9151
48
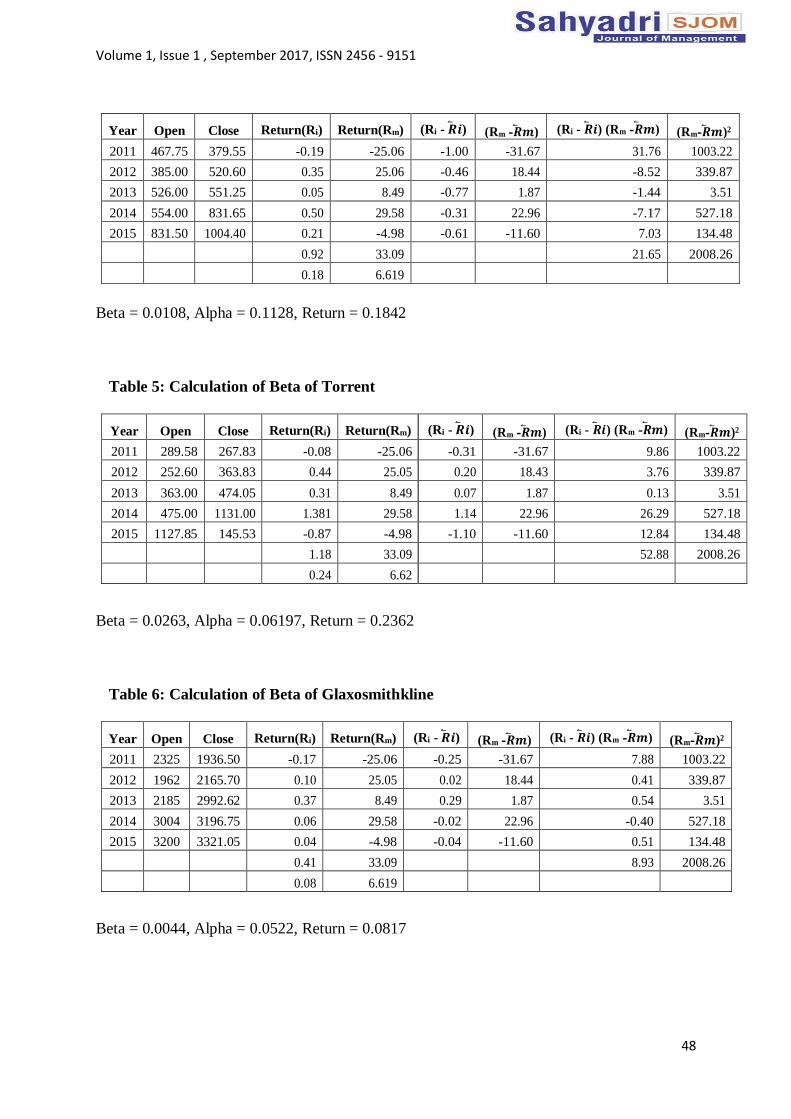
Year Open Close Return(Ri) Return(Rm) (Ri - �⃐� 𝒊 ) (Rm -�⃐� 𝒎 ) (Ri - �⃐� 𝒊 ) (Rm -�⃐� 𝒎 ) (Rm-�⃐� 𝒎 )2
2011 467.75 379.55 -0.19 -25.06 -1.00 -31.67 31.76 1003.22
2012 385.00 520.60 0.35 25.06 -0.46 18.44 -8.52 339.87
2013 526.00 551.25 0.05 8.49 -0.77 1.87 -1.44 3.51
2014 554.00 831.65 0.50 29.58 -0.31 22.96 -7.17 527.18
2015 831.50 1004.40 0.21 -4.98 -0.61 -11.60 7.03 134.48
0.92 33.09 21.65 2008.26
0.18 6.619
Beta = 0.0108, Alpha = 0.1128, Return = 0.1842
Table 5: Calculation of Beta of Torrent
Year Open Close Return(Ri) Return(Rm) (Ri - �⃐� 𝒊 ) (Rm -�⃐� 𝒎 ) (Ri - �⃐� 𝒊 ) (Rm -�⃐� 𝒎 ) (Rm-�⃐� 𝒎 )2
2011 289.58 267.83 -0.08 -25.06 -0.31 -31.67 9.86 1003.22
2012 252.60 363.83 0.44 25.05 0.20 18.43 3.76 339.87
2013 363.00 474.05 0.31 8.49 0.07 1.87 0.13 3.51
2014 475.00 1131.00 1.381 29.58 1.14 22.96 26.29 527.18
2015 1127.85 145.53 -0.87 -4.98 -1.10 -11.60 12.84 134.48
1.18 33.09 52.88 2008.26
0.24 6.62
Beta = 0.0263, Alpha = 0.06197, Return = 0.2362
Table 6: Calculation of Beta of Glaxosmithkline
Year Open Close Return(Ri) Return(Rm) (Ri - �⃐� 𝒊 ) (Rm -�⃐� 𝒎 ) (Ri - �⃐� 𝒊 ) (Rm -�⃐� 𝒎 ) (Rm-�⃐� 𝒎 )2
2011 2325 1936.50 -0.17 -25.06 -0.25 -31.67 7.88 1003.22
2012 1962 2165.70 0.10 25.05 0.02 18.44 0.41 339.87
2013 2185 2992.62 0.37 8.49 0.29 1.87 0.54 3.51
2014 3004 3196.75 0.06 29.58 -0.02 22.96 -0.40 527.18
2015 3200 3321.05 0.04 -4.98 -0.04 -11.60 0.51 134.48
0.41 33.09 8.93 2008.26
0.08 6.619
Beta = 0.0044, Alpha = 0.0522, Return = 0.0817
Volume 1, Issue 1 , September 2017, ISSN 2456 - 9151
49
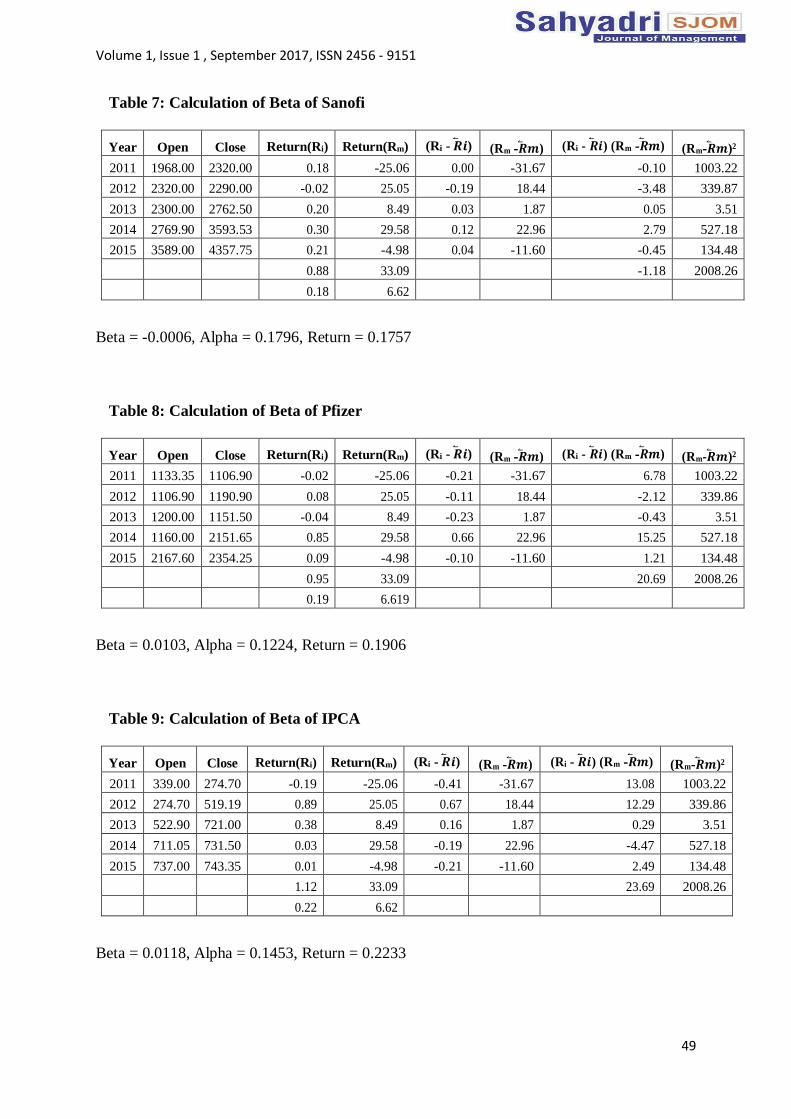
Table 7: Calculation of Beta of Sanofi
Year Open Close Return(Ri) Return(Rm) (Ri - �⃐� 𝒊 ) (Rm -�⃐� 𝒎 ) (Ri - �⃐� 𝒊 ) (Rm -�⃐� 𝒎 ) (Rm-�⃐� 𝒎 )2
2011 1968.00 2320.00 0.18 -25.06 0.00 -31.67 -0.10 1003.22
2012 2320.00 2290.00 -0.02 25.05 -0.19 18.44 -3.48 339.87
2013 2300.00 2762.50 0.20 8.49 0.03 1.87 0.05 3.51
2014 2769.90 3593.53 0.30 29.58 0.12 22.96 2.79 527.18
2015 3589.00 4357.75 0.21 -4.98 0.04 -11.60 -0.45 134.48
0.88 33.09 -1.18 2008.26
0.18 6.62
Beta = -0.0006, Alpha = 0.1796, Return = 0.1757
Table 8: Calculation of Beta of Pfizer
Year Open Close Return(Ri) Return(Rm) (Ri - �⃐� 𝒊 ) (Rm -�⃐� 𝒎 ) (Ri - �⃐� 𝒊 ) (Rm -�⃐� 𝒎 ) (Rm-�⃐� 𝒎 )2
2011 1133.35 1106.90 -0.02 -25.06 -0.21 -31.67 6.78 1003.22
2012 1106.90 1190.90 0.08 25.05 -0.11 18.44 -2.12 339.86
2013 1200.00 1151.50 -0.04 8.49 -0.23 1.87 -0.43 3.51
2014 1160.00 2151.65 0.85 29.58 0.66 22.96 15.25 527.18
2015 2167.60 2354.25 0.09 -4.98 -0.10 -11.60 1.21 134.48
0.95 33.09 20.69 2008.26
0.19 6.619
Beta = 0.0103, Alpha = 0.1224, Return = 0.1906
Table 9: Calculation of Beta of IPCA
Year Open Close Return(Ri) Return(Rm) (Ri - �⃐� 𝒊 ) (Rm -�⃐� 𝒎 ) (Ri - �⃐� 𝒊 ) (Rm -�⃐� 𝒎 ) (Rm-�⃐� 𝒎 )2
2011 339.00 274.70 -0.19 -25.06 -0.41 -31.67 13.08 1003.22
2012 274.70 519.19 0.89 25.05 0.67 18.44 12.29 339.86
2013 522.90 721.00 0.38 8.49 0.16 1.87 0.29 3.51
2014 711.05 731.50 0.03 29.58 -0.19 22.96 -4.47 527.18
2015 737.00 743.35 0.01 -4.98 -0.21 -11.60 2.49 134.48
1.12 33.09 23.69 2008.26
0.22 6.62
Beta = 0.0118, Alpha = 0.1453, Return = 0.2233
Volume 1, Issue 1 , September 2017, ISSN 2456 - 9151
50
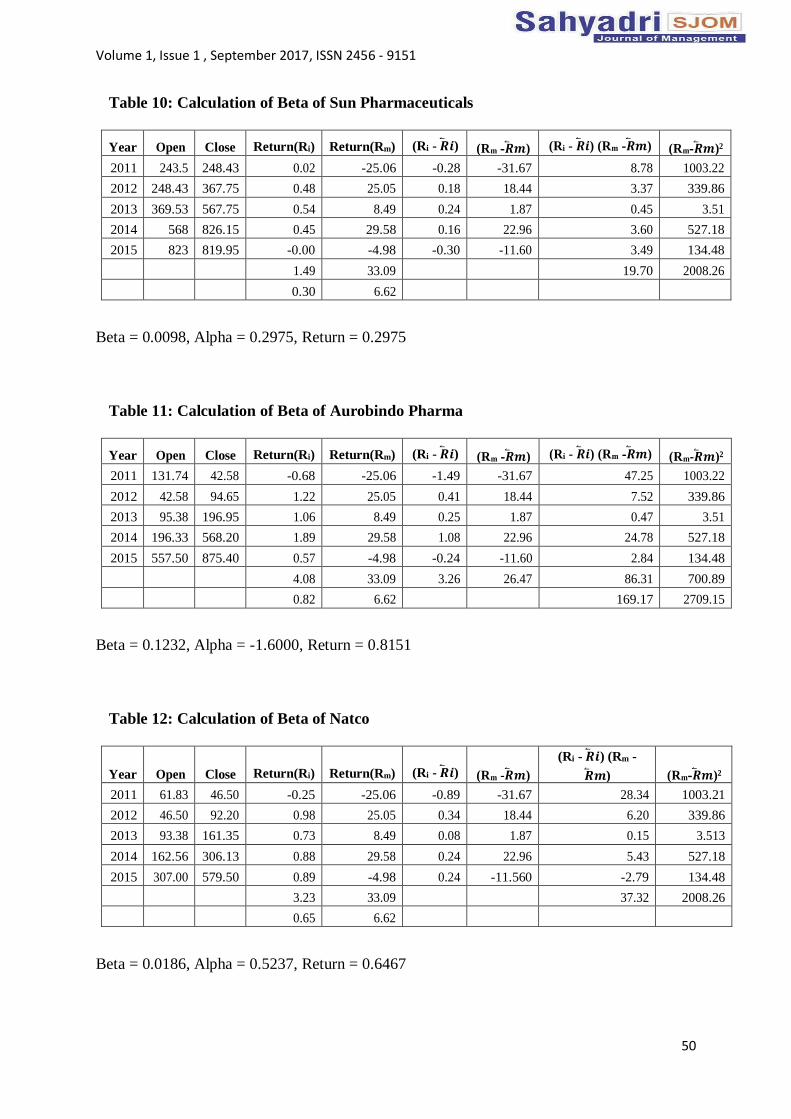
Table 10: Calculation of Beta of Sun Pharmaceuticals
Year Open Close Return(Ri) Return(Rm) (Ri - �⃐� 𝒊 ) (Rm -�⃐� 𝒎 ) (Ri - �⃐� 𝒊 ) (Rm -�⃐� 𝒎 ) (Rm-�⃐� 𝒎 )2
2011 243.5 248.43 0.02 -25.06 -0.28 -31.67 8.78 1003.22
2012 248.43 367.75 0.48 25.05 0.18 18.44 3.37 339.86
2013 369.53 567.75 0.54 8.49 0.24 1.87 0.45 3.51
2014 568 826.15 0.45 29.58 0.16 22.96 3.60 527.18
2015 823 819.95 -0.00 -4.98 -0.30 -11.60 3.49 134.48
1.49 33.09 19.70 2008.26
0.30 6.62
Beta = 0.0098, Alpha = 0.2975, Return = 0.2975
Table 11: Calculation of Beta of Aurobindo Pharma
Year Open Close Return(Ri) Return(Rm) (Ri - �⃐� 𝒊 ) (Rm -�⃐� 𝒎 ) (Ri - �⃐� 𝒊 ) (Rm -�⃐� 𝒎 ) (Rm-�⃐� 𝒎 )2
2011 131.74 42.58 -0.68 -25.06 -1.49 -31.67 47.25 1003.22
2012 42.58 94.65 1.22 25.05 0.41 18.44 7.52 339.86
2013 95.38 196.95 1.06 8.49 0.25 1.87 0.47 3.51
2014 196.33 568.20 1.89 29.58 1.08 22.96 24.78 527.18
2015 557.50 875.40 0.57 -4.98 -0.24 -11.60 2.84 134.48
4.08 33.09 3.26 26.47 86.31 700.89
0.82 6.62 169.17 2709.15
Beta = 0.1232, Alpha = -1.6000, Return = 0.8151
Table 12: Calculation of Beta of Natco
Year
Open
Close
Return(Ri)
Return(Rm)
(Ri - �⃐� 𝒊 )
(Rm -�⃐� 𝒎 )
(Ri - �⃐� 𝒊 ) (Rm -
�⃐� 𝒎 )
(Rm-�⃐� 𝒎 )2
2011 61.83 46.50 -0.25 -25.06 -0.89 -31.67 28.34 1003.21
2012 46.50 92.20 0.98 25.05 0.34 18.44 6.20 339.86
2013 93.38 161.35 0.73 8.49 0.08 1.87 0.15 3.513
2014 162.56 306.13 0.88 29.58 0.24 22.96 5.43 527.18
2015 307.00 579.50 0.89 -4.98 0.24 -11.560 -2.79 134.48
3.23 33.09 37.32 2008.26
0.65 6.62
Beta = 0.0186, Alpha = 0.5237, Return = 0.6467
Volume 1, Issue 1 , September 2017, ISSN 2456 - 9151
51
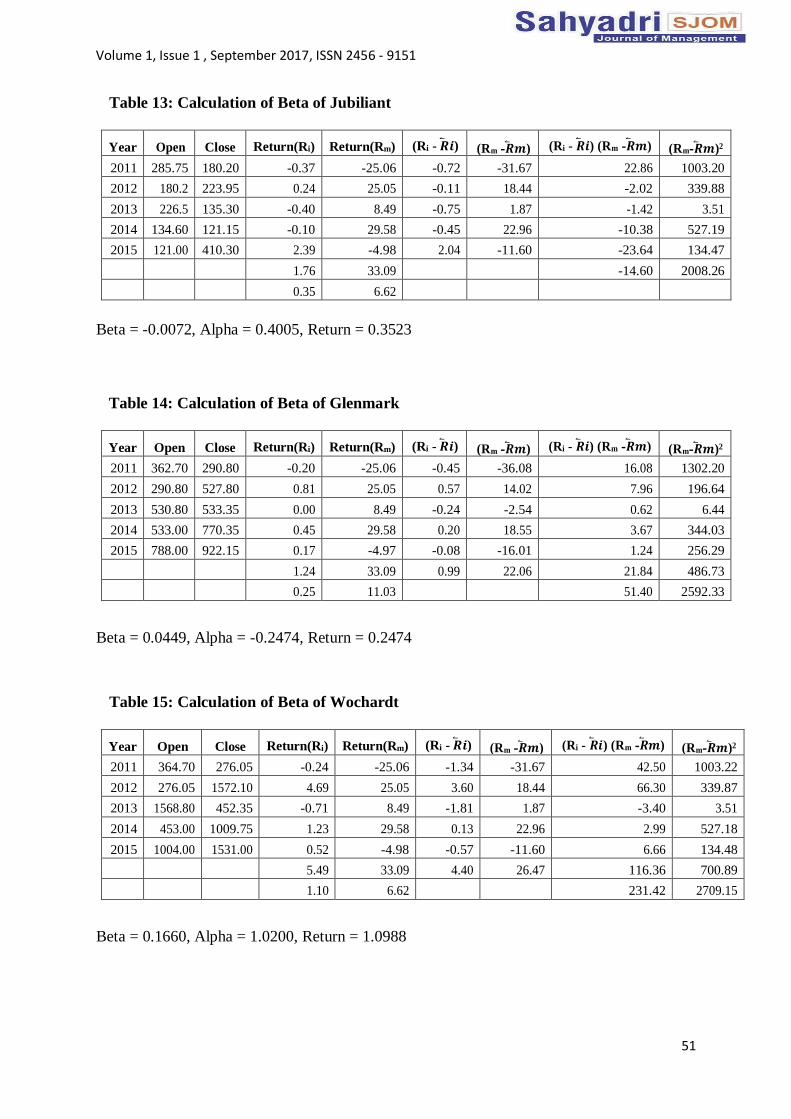
Table 13: Calculation of Beta of Jubiliant
Year Open Close Return(Ri) Return(Rm) (Ri - �⃐� 𝒊 ) (Rm -�⃐� 𝒎 ) (Ri - �⃐� 𝒊 ) (Rm -�⃐� 𝒎 ) (Rm-�⃐� 𝒎 )2
2011 285.75 180.20 -0.37 -25.06 -0.72 -31.67 22.86 1003.20
2012 180.2 223.95 0.24 25.05 -0.11 18.44 -2.02 339.88
2013 226.5 135.30 -0.40 8.49 -0.75 1.87 -1.42 3.51
2014 134.60 121.15 -0.10 29.58 -0.45 22.96 -10.38 527.19
2015 121.00 410.30 2.39 -4.98 2.04 -11.60 -23.64 134.47
1.76 33.09 -14.60 2008.26
0.35 6.62
Beta = -0.0072, Alpha = 0.4005, Return = 0.3523
Table 14: Calculation of Beta of Glenmark
Year Open Close Return(Ri) Return(Rm) (Ri - �⃐� 𝒊 ) (Rm -�⃐� 𝒎 ) (Ri - �⃐� 𝒊 ) (Rm -�⃐� 𝒎 ) (Rm-�⃐� 𝒎 )2
2011 362.70 290.80 -0.20 -25.06 -0.45 -36.08 16.08 1302.20
2012 290.80 527.80 0.81 25.05 0.57 14.02 7.96 196.64
2013 530.80 533.35 0.00 8.49 -0.24 -2.54 0.62 6.44
2014 533.00 770.35 0.45 29.58 0.20 18.55 3.67 344.03
2015 788.00 922.15 0.17 -4.97 -0.08 -16.01 1.24 256.29
1.24 33.09 0.99 22.06 21.84 486.73
0.25 11.03 51.40 2592.33
Beta = 0.0449, Alpha = -0.2474, Return = 0.2474
Table 15: Calculation of Beta of Wochardt
Year Open Close Return(Ri) Return(Rm) (Ri - �⃐� 𝒊 ) (Rm -�⃐� 𝒎 ) (Ri - �⃐� 𝒊 ) (Rm -�⃐� 𝒎 ) (Rm-�⃐� 𝒎 )2
2011 364.70 276.05 -0.24 -25.06 -1.34 -31.67 42.50 1003.22
2012 276.05 1572.10 4.69 25.05 3.60 18.44 66.30 339.87
2013 1568.80 452.35 -0.71 8.49 -1.81 1.87 -3.40 3.51
2014 453.00 1009.75 1.23 29.58 0.13 22.96 2.99 527.18
2015 1004.00 1531.00 0.52 -4.98 -0.57 -11.60 6.66 134.48
5.49 33.09 4.40 26.47 116.36 700.89
1.10 6.62 231.42 2709.15
Beta = 0.1660, Alpha = 1.0200, Return = 1.0988
Volume 1, Issue 1 , September 2017, ISSN 2456 - 9151
52
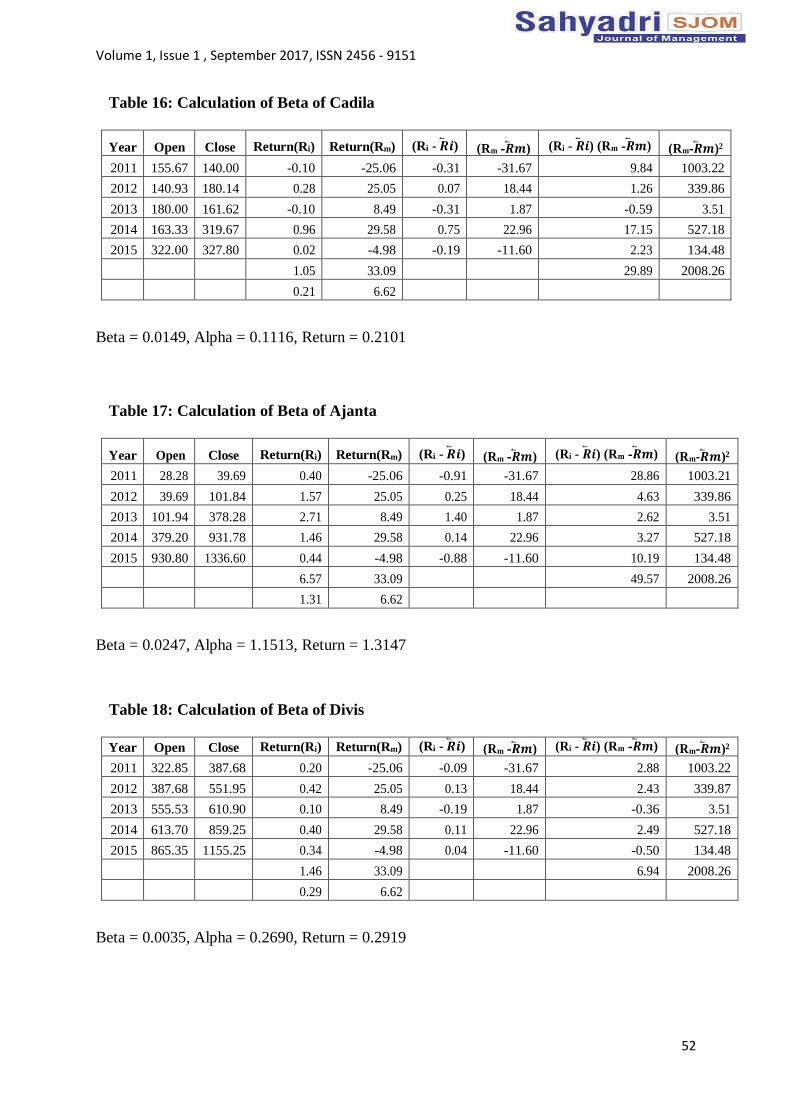
Table 16: Calculation of Beta of Cadila
Year Open Close Return(Ri) Return(Rm) (Ri - �⃐� 𝒊 ) (Rm -�⃐� 𝒎 ) (Ri - �⃐� 𝒊 ) (Rm -�⃐� 𝒎 ) (Rm-�⃐� 𝒎 )2
2011 155.67 140.00 -0.10 -25.06 -0.31 -31.67 9.84 1003.22
2012 140.93 180.14 0.28 25.05 0.07 18.44 1.26 339.86
2013 180.00 161.62 -0.10 8.49 -0.31 1.87 -0.59 3.51
2014 163.33 319.67 0.96 29.58 0.75 22.96 17.15 527.18
2015 322.00 327.80 0.02 -4.98 -0.19 -11.60 2.23 134.48
1.05 33.09 29.89 2008.26
0.21 6.62
Beta = 0.0149, Alpha = 0.1116, Return = 0.2101
Table 17: Calculation of Beta of Ajanta
Year Open Close Return(Ri) Return(Rm) (Ri - �⃐� 𝒊 ) (Rm -�⃐� 𝒎 ) (Ri - �⃐� 𝒊 ) (Rm -�⃐� 𝒎 ) (Rm-�⃐� 𝒎 )2
2011 28.28 39.69 0.40 -25.06 -0.91 -31.67 28.86 1003.21
2012 39.69 101.84 1.57 25.05 0.25 18.44 4.63 339.86
2013 101.94 378.28 2.71 8.49 1.40 1.87 2.62 3.51
2014 379.20 931.78 1.46 29.58 0.14 22.96 3.27 527.18
2015 930.80 1336.60 0.44 -4.98 -0.88 -11.60 10.19 134.48
6.57 33.09 49.57 2008.26
1.31 6.62
Beta = 0.0247, Alpha = 1.1513, Return = 1.3147
Table 18: Calculation of Beta of Divis
Year Open Close Return(Ri) Return(Rm) (Ri - �⃐� 𝒊 ) (Rm -�⃐� 𝒎 ) (Ri - �⃐� 𝒊 ) (Rm -�⃐� 𝒎 ) (Rm-�⃐� 𝒎 )2
2011 322.85 387.68 0.20 -25.06 -0.09 -31.67 2.88 1003.22
2012 387.68 551.95 0.42 25.05 0.13 18.44 2.43 339.87
2013 555.53 610.90 0.10 8.49 -0.19 1.87 -0.36 3.51
2014 613.70 859.25 0.40 29.58 0.11 22.96 2.49 527.18
2015 865.35 1155.25 0.34 -4.98 0.04 -11.60 -0.50 134.48
1.46 33.09 6.94 2008.26
0.29 6.62
Beta = 0.0035, Alpha = 0.2690, Return = 0.2919
Volume 1, Issue 1 , September 2017, ISSN 2456 - 9151
53
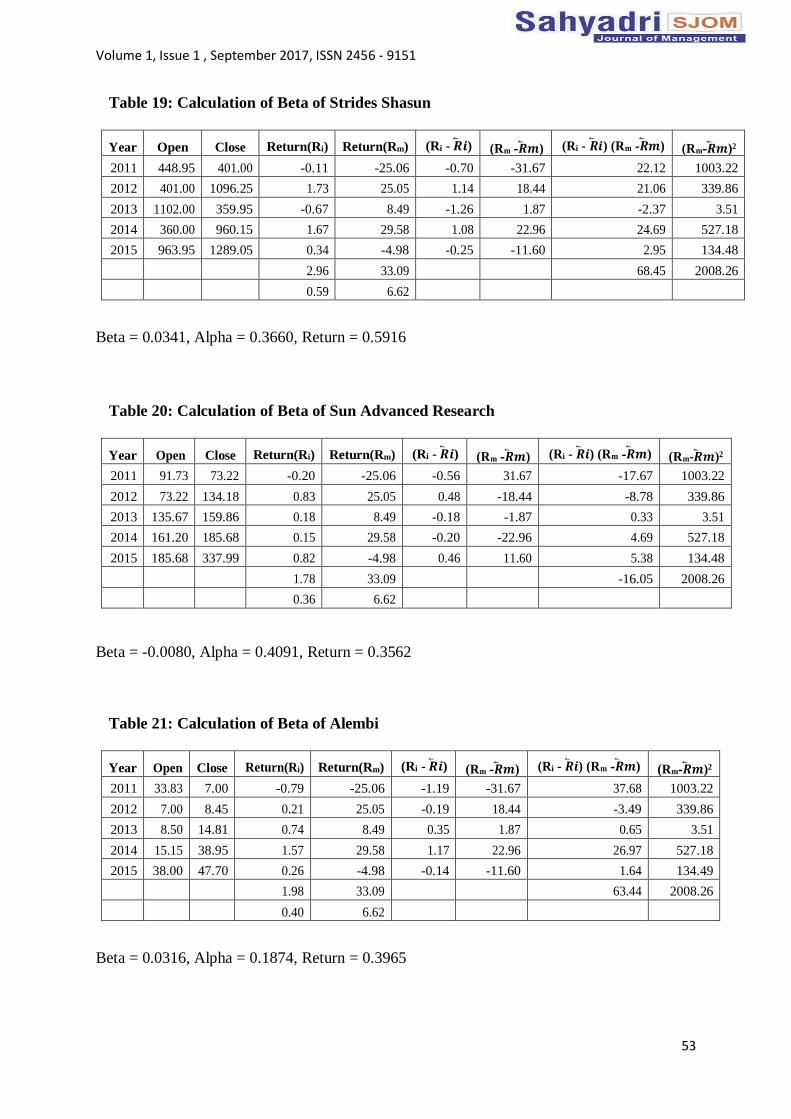
Table 19: Calculation of Beta of Strides Shasun
Year Open Close Return(Ri) Return(Rm) (Ri - �⃐� 𝒊 ) (Rm -�⃐� 𝒎 ) (Ri - �⃐� 𝒊 ) (Rm -�⃐� 𝒎 ) (Rm-�⃐� 𝒎 )2
2011 448.95 401.00 -0.11 -25.06 -0.70 -31.67 22.12 1003.22
2012 401.00 1096.25 1.73 25.05 1.14 18.44 21.06 339.86
2013 1102.00 359.95 -0.67 8.49 -1.26 1.87 -2.37 3.51
2014 360.00 960.15 1.67 29.58 1.08 22.96 24.69 527.18
2015 963.95 1289.05 0.34 -4.98 -0.25 -11.60 2.95 134.48
2.96 33.09 68.45 2008.26
0.59 6.62
Beta = 0.0341, Alpha = 0.3660, Return = 0.5916
Table 20: Calculation of Beta of Sun Advanced Research
Year Open Close Return(Ri) Return(Rm) (Ri - �⃐� 𝒊 ) (Rm -�⃐� 𝒎 ) (Ri - �⃐� 𝒊 ) (Rm -�⃐� 𝒎 ) (Rm-�⃐� 𝒎 )2
2011 91.73 73.22 -0.20 -25.06 -0.56 31.67 -17.67 1003.22
2012 73.22 134.18 0.83 25.05 0.48 -18.44 -8.78 339.86
2013 135.67 159.86 0.18 8.49 -0.18 -1.87 0.33 3.51
2014 161.20 185.68 0.15 29.58 -0.20 -22.96 4.69 527.18
2015 185.68 337.99 0.82 -4.98 0.46 11.60 5.38 134.48
1.78 33.09 -16.05 2008.26
0.36 6.62
Beta = -0.0080, Alpha = 0.4091, Return = 0.3562
Table 21: Calculation of Beta of Alembi
Year Open Close Return(Ri) Return(Rm) (Ri - �⃐� 𝒊 ) (Rm -�⃐� 𝒎 ) (Ri - �⃐� 𝒊 ) (Rm -�⃐� 𝒎 ) (Rm-�⃐� 𝒎 )2
2011 33.83 7.00 -0.79 -25.06 -1.19 -31.67 37.68 1003.22
2012 7.00 8.45 0.21 25.05 -0.19 18.44 -3.49 339.86
2013 8.50 14.81 0.74 8.49 0.35 1.87 0.65 3.51
2014 15.15 38.95 1.57 29.58 1.17 22.96 26.97 527.18
2015 38.00 47.70 0.26 -4.98 -0.14 -11.60 1.64 134.49
1.98 33.09 63.44 2008.26
0.40 6.62
Beta = 0.0316, Alpha = 0.1874, Return = 0.3965