Embed Size (px)
Citation preview
Risk and Returns: part 1
Economics 71a: Spring 2007
Mayo chapter 8Malkiel, Chap 9-10Lecture notes 3.2a
Goals
Return reminderWhat is risk?Types of riskStatistics backgroundRisk return tradeoff
Returns
Total percentage gain on investment Includes dividends for stocksExample
Price : 100 - 105 Pays: $2 dividend Return = (105+2-100)/100 = 7%
What is Risk?
Hard questionNo good answerStatistical Features
Variance/Standard deviation Histograms (probability distributions)
Types of Risk
Market Default (financial risk) Business Interest rate Liquidity Tax Event Political
Statistics
Random variables and histograms Expected returnsVariancesCovarianceCorrelation
Histogram
Frequency with which random variable takes value
Gives a pictorial indication of riskMany possible shapesMost famous is the Normal Distribution
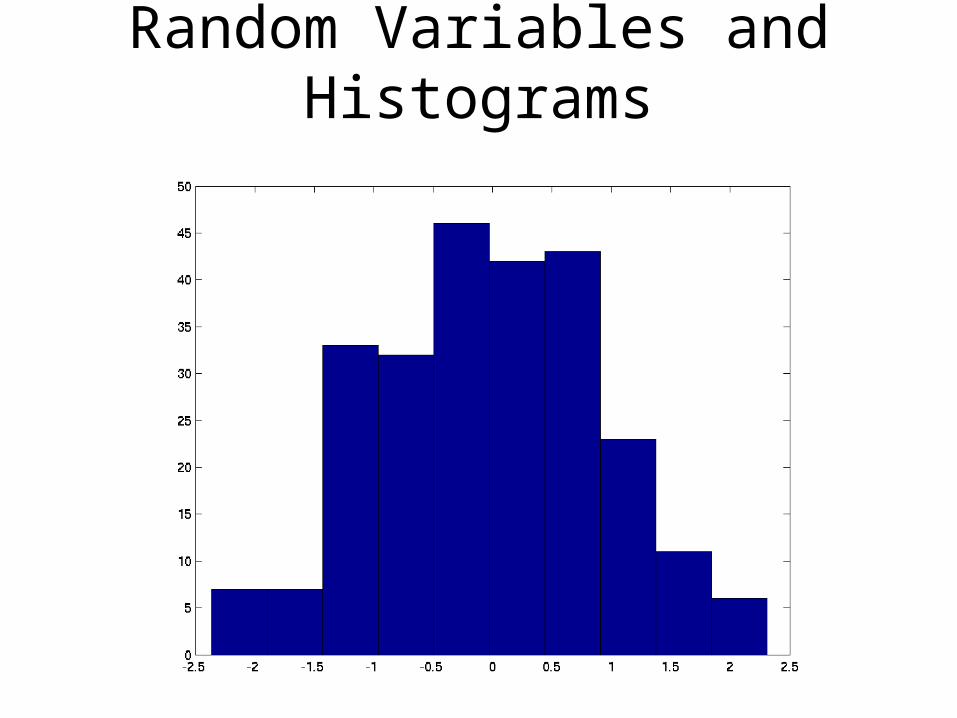
Random Variables and Histograms
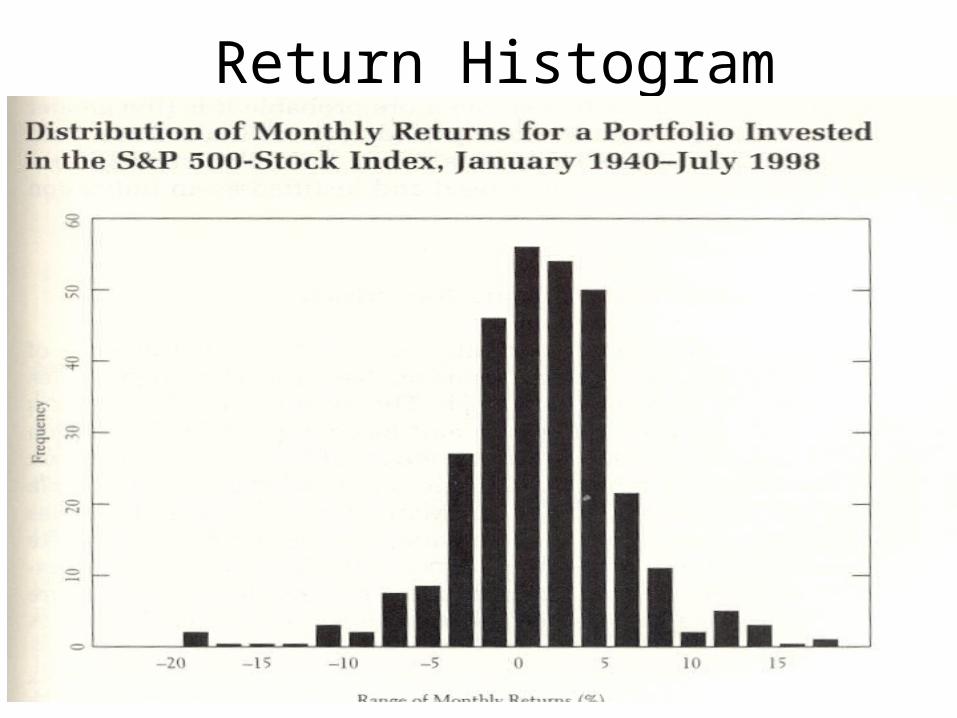
Return Histogram
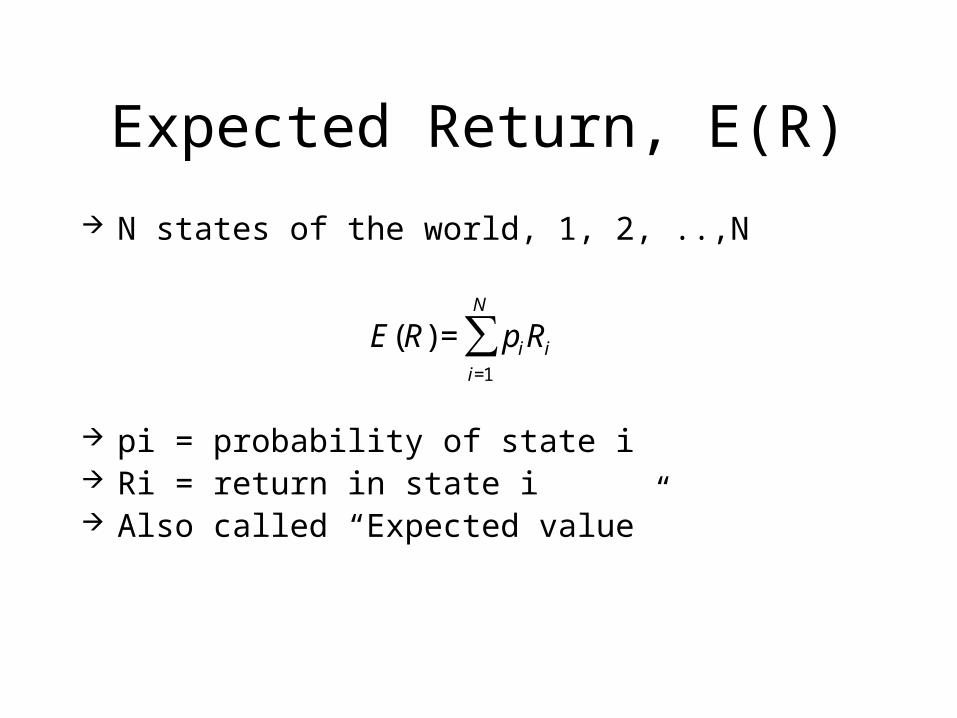
Expected Return, E(R)
N states of the world, 1, 2, ..,N
pi = probability of state i Ri = return in state i Also called “Expected value”
€
E(R) = piRi
i=1
N
∑
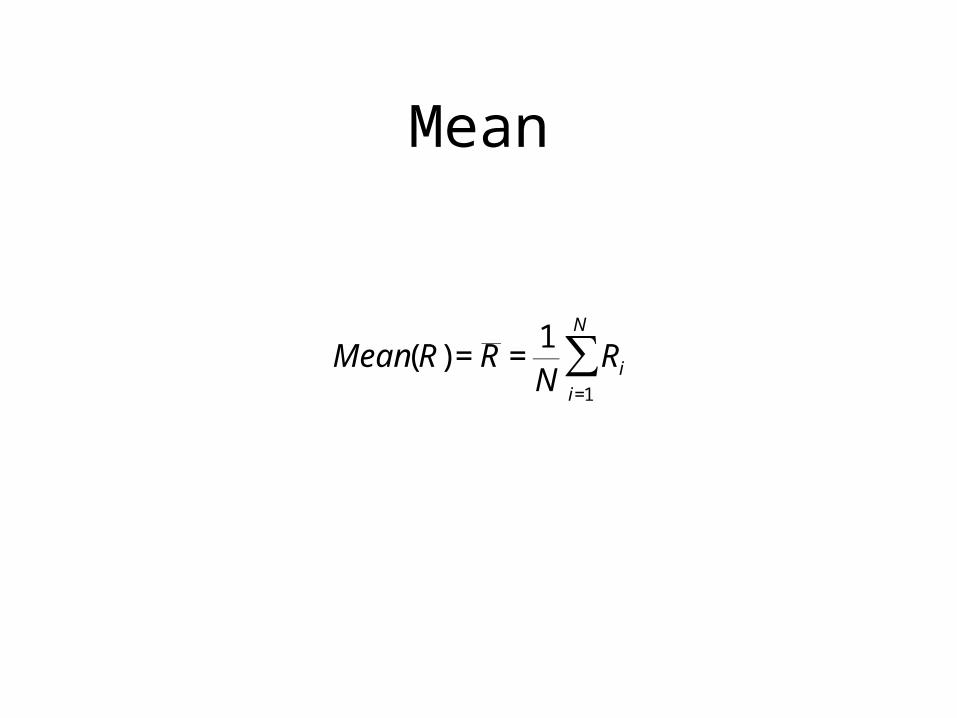
Mean
€
Mean(R) = R =1N
Ri
i=1
N
∑
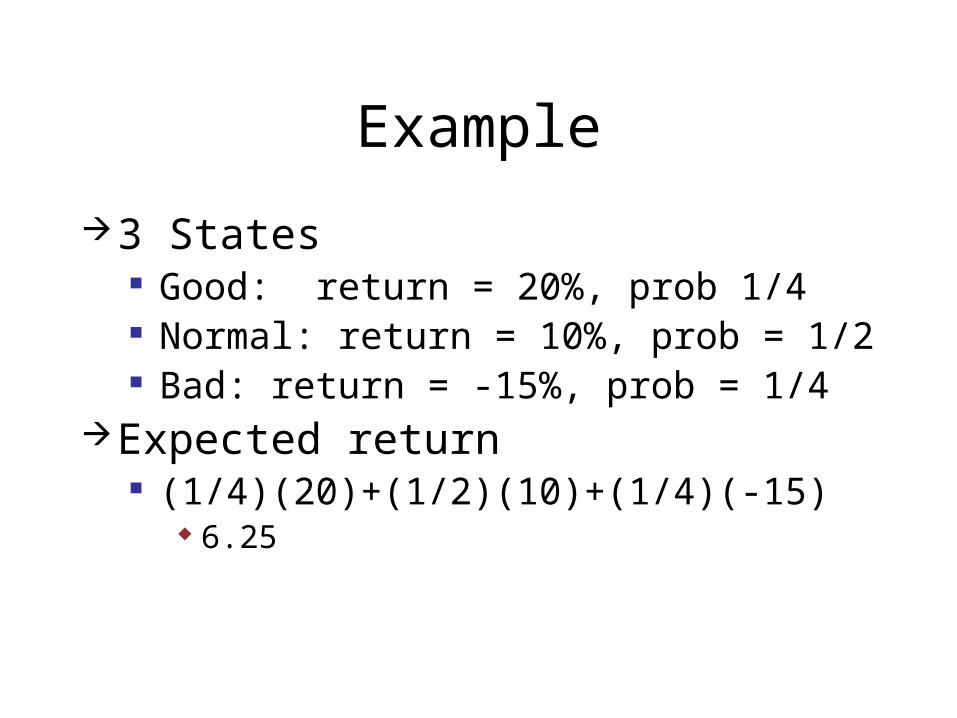
Example
3 States Good: return = 20%, prob 1/4 Normal: return = 10%, prob = 1/2 Bad: return = -15%, prob = 1/4
Expected return (1/4)(20)+(1/2)(10)+(1/4)(-15)
6.25
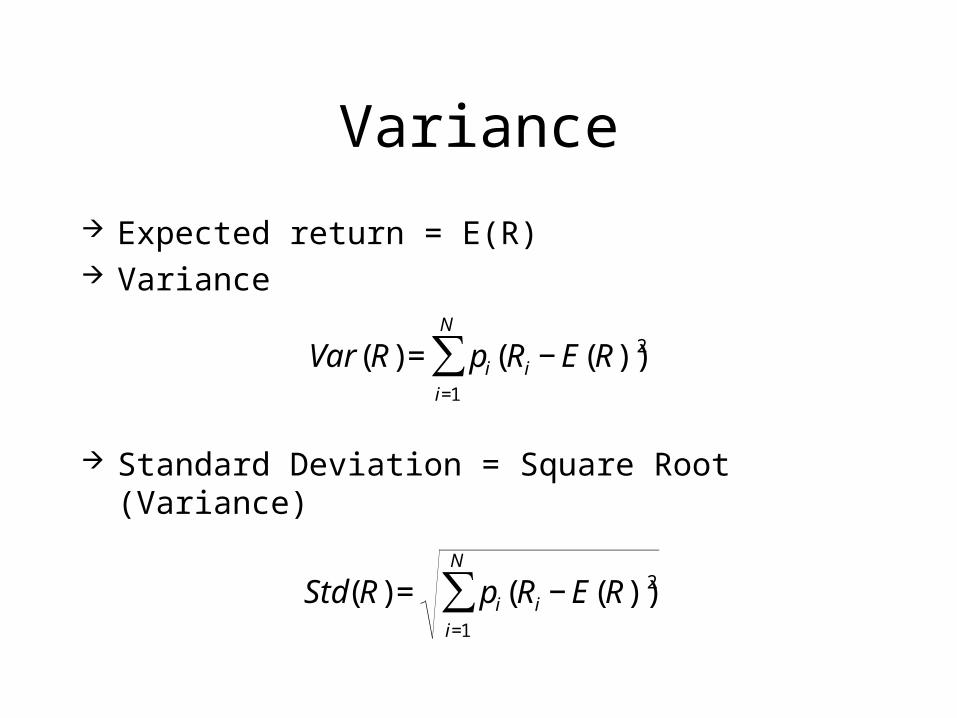
Variance
Expected return = E(R) Variance
Standard Deviation = Square Root (Variance)
€
Var (R) = pi (Ri − E(R))2
i=1
N
∑
€
Std(R) = pi (Ri − E(R))2
i=1
N
∑
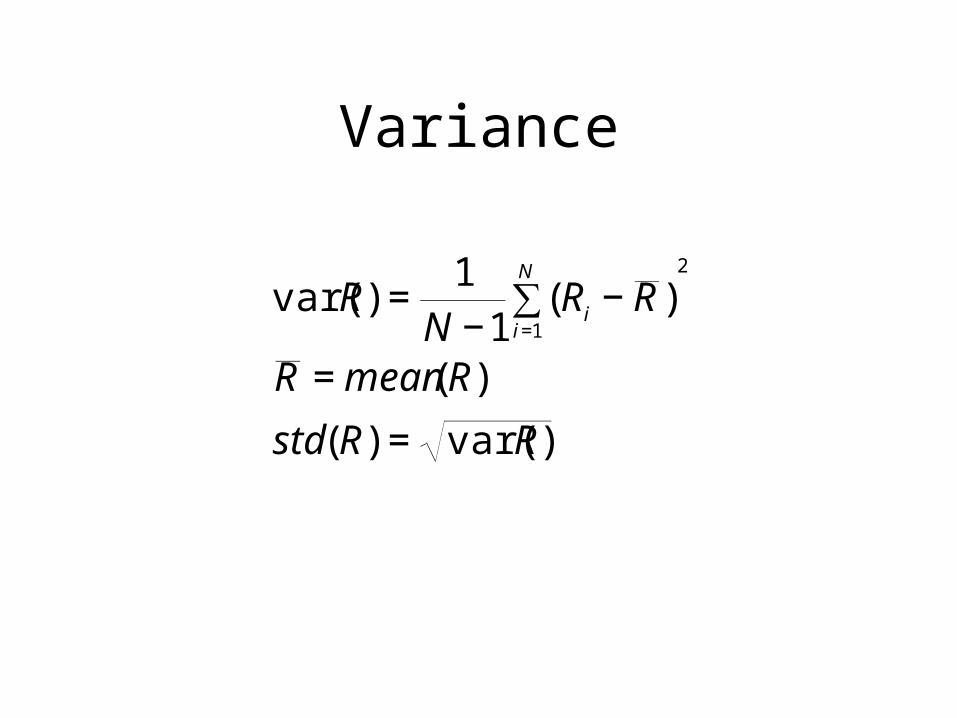
Variance
€
var(R) =1
N −1(Ri − R )
i=1
N
∑2
R = mean(R)
std(R) = var(R)
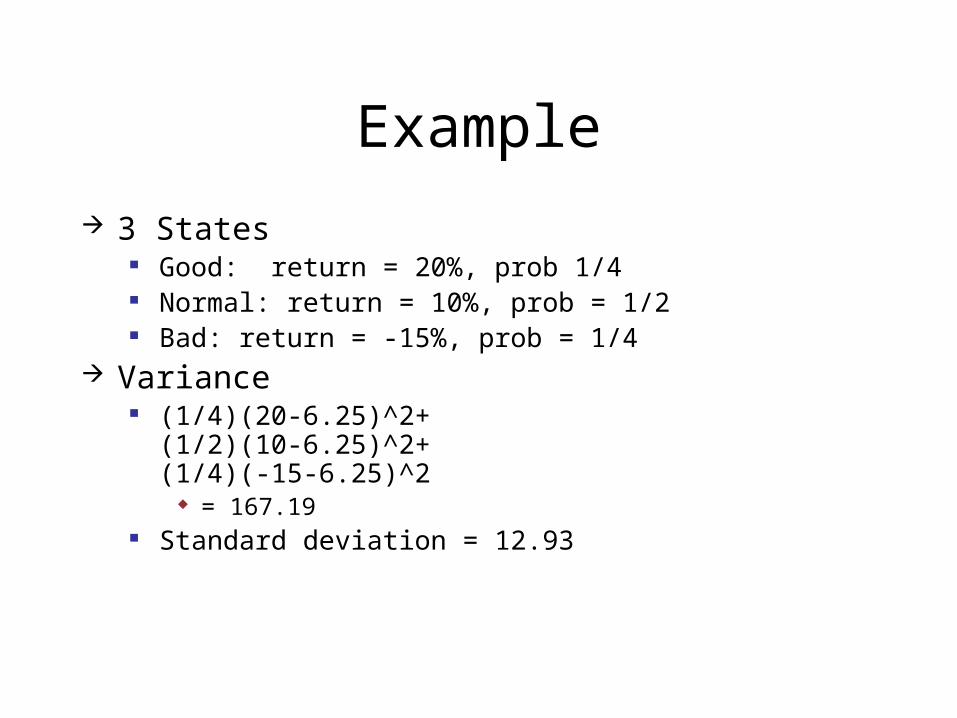
Example
3 States Good: return = 20%, prob 1/4 Normal: return = 10%, prob = 1/2 Bad: return = -15%, prob = 1/4
Variance (1/4)(20-6.25)^2+
(1/2)(10-6.25)^2+(1/4)(-15-6.25)^2
= 167.19 Standard deviation = 12.93
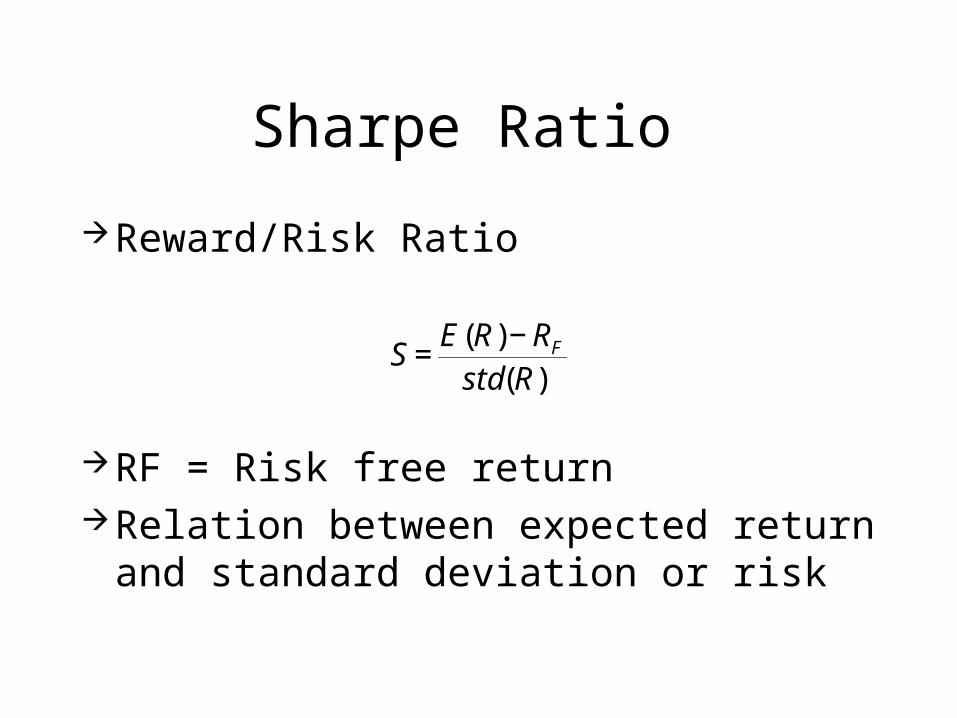
Sharpe Ratio
Reward/Risk Ratio
RF = Risk free returnRelation between expected return and
standard deviation or risk
€
S =E(R) − RF
std(R)
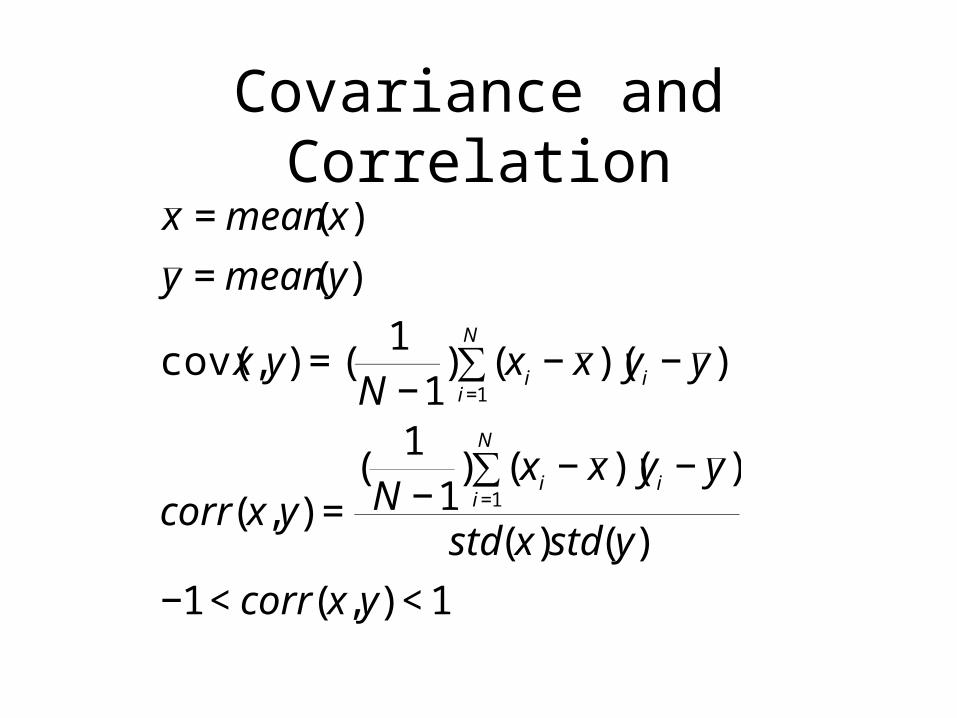
Covariance and Correlation
€
x = mean(x)
y = mean(y)
cov(x,y) = (1
N −1) (xi − x )(yi − y )
i=1
N
∑
corr(x,y) =(
1N −1
) (xi − x )(yi − y )i=1
N
∑
std(x)std(y)
−1 < corr(x,y) < 1
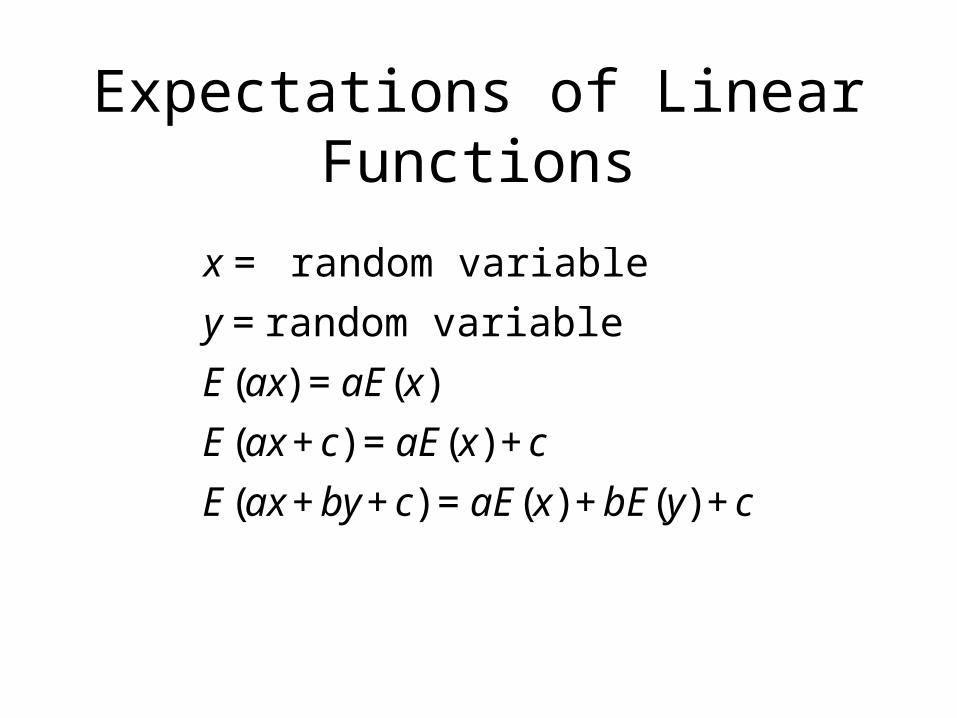
Expectations of Linear Functions
€
x = random variable
y = random variable
E(ax) = aE(x)
E(ax + c) = aE(x) + c
E(ax + by + c) = aE(x) + bE(y) + c
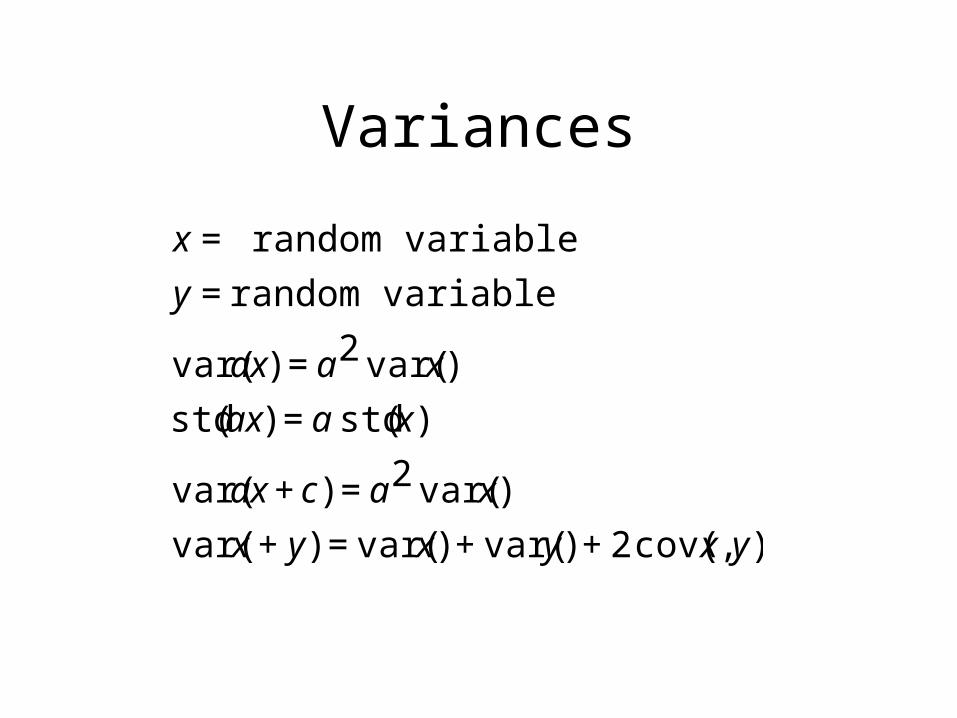
Variances
€
x = random variable
y = random variable
var(ax) = a2 var(x)
std(ax) = a std(x)
var(ax + c) = a2 var(x)
var(x + y) = var(x) + var(y) + 2 cov(x, y)
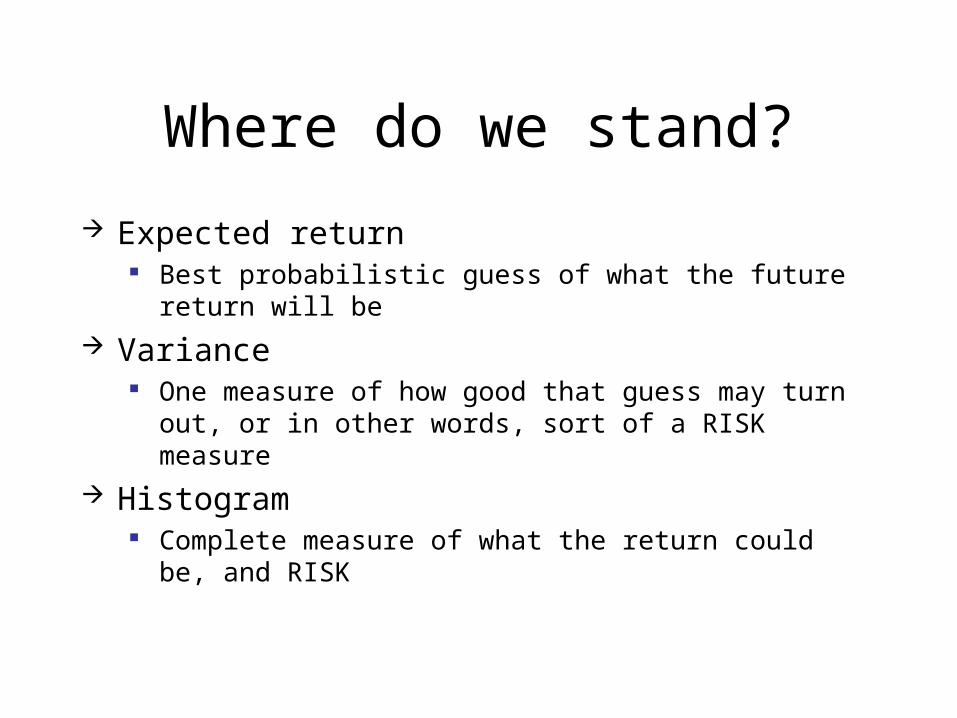
Where do we stand?
Expected return Best probabilistic guess of what the future return will be
Variance One measure of how good that guess may turn out, or in
other words, sort of a RISK measure
Histogram Complete measure of what the return could be, and RISK
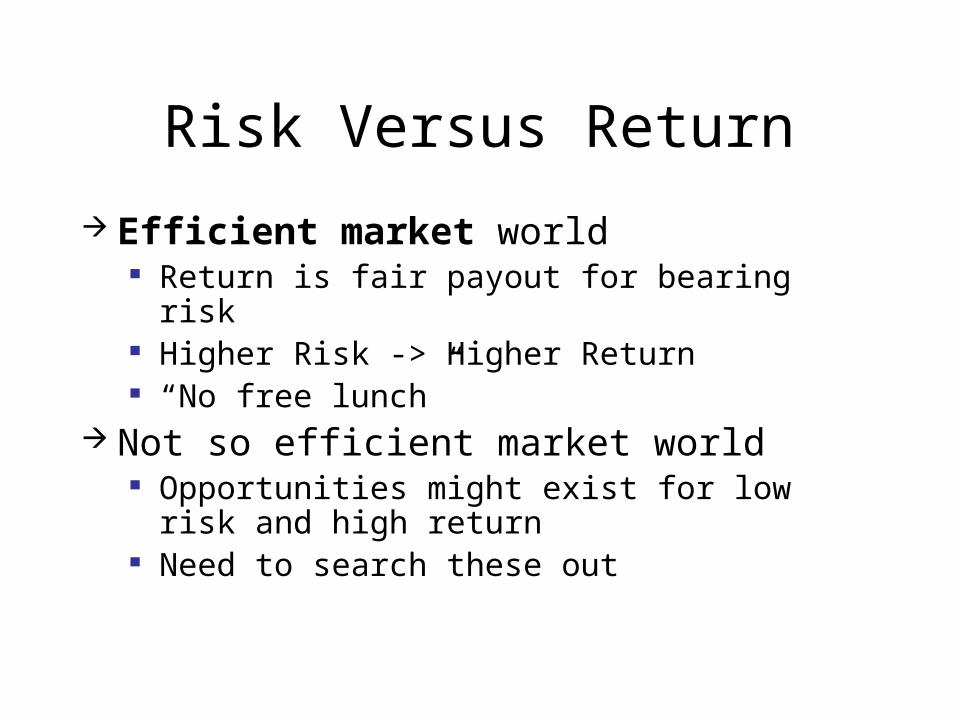
Risk Versus Return
Efficient market world Return is fair payout for bearing risk Higher Risk -> Higher Return “No free lunch”
Not so efficient market world Opportunities might exist for low risk and high
return Need to search these out
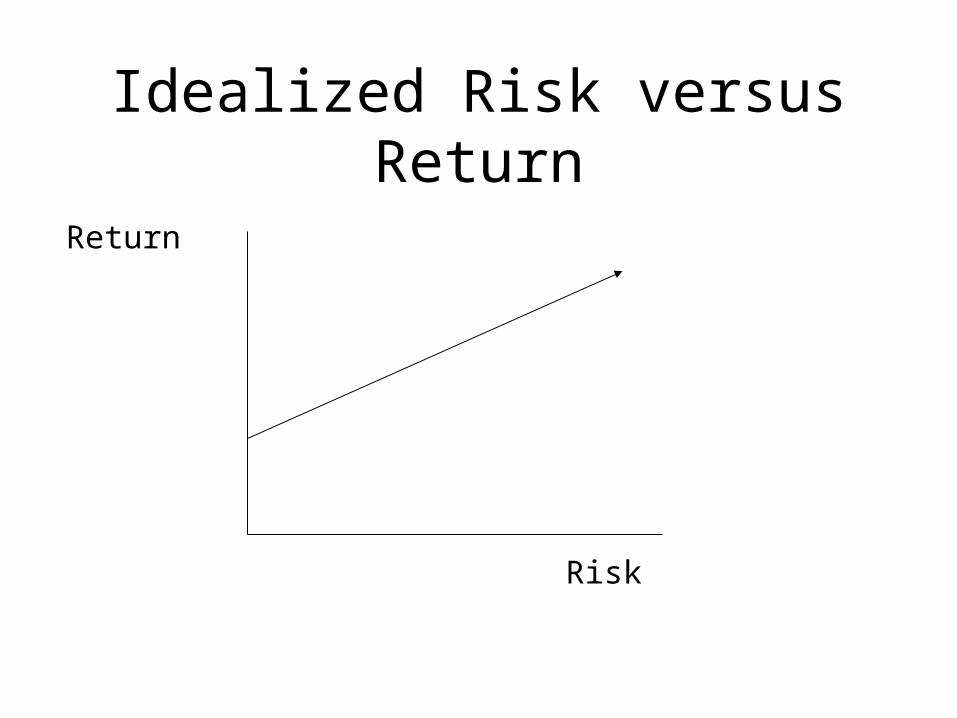
Idealized Risk versus Return
Risk
Return
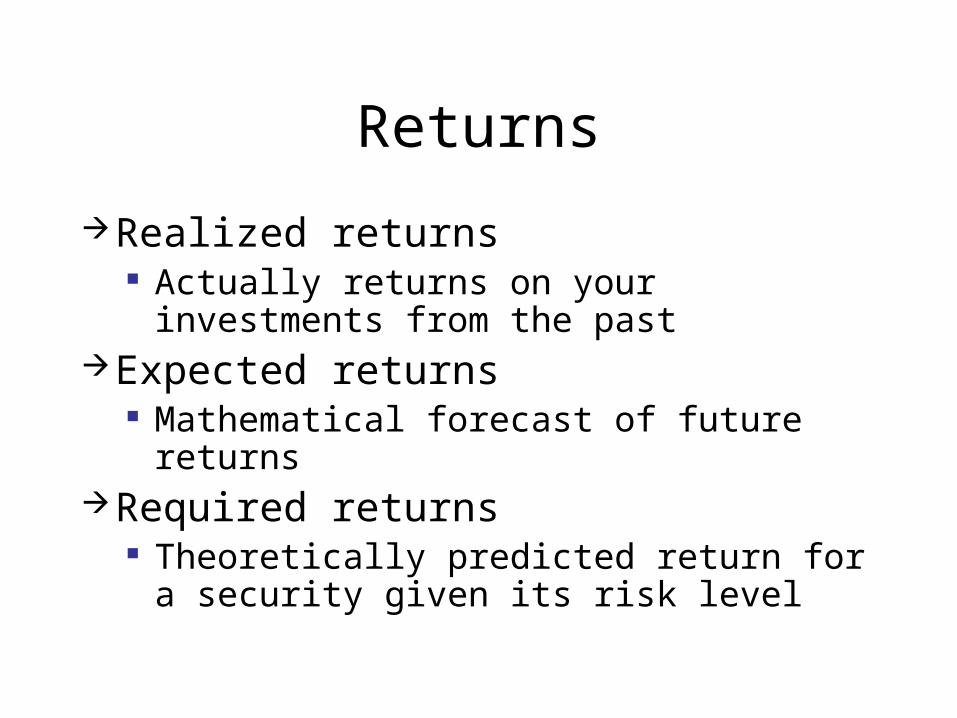
Returns
Realized returns Actually returns on your investments from
the pastExpected returns
Mathematical forecast of future returnsRequired returns
Theoretically predicted return for a security given its risk level
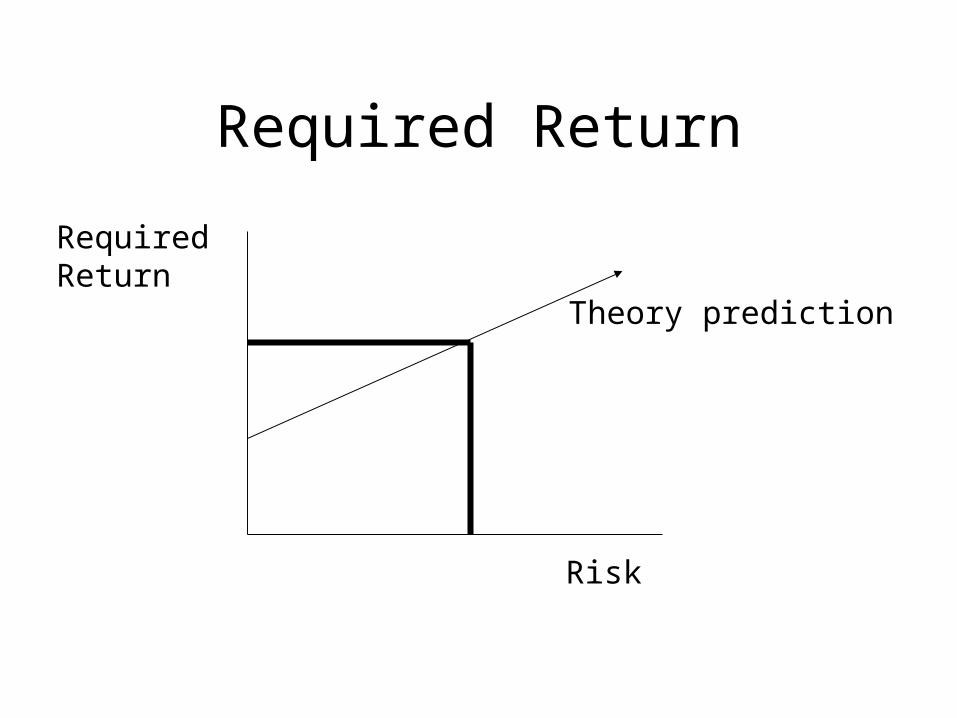
Required Return
Risk
Required Return
Theory prediction
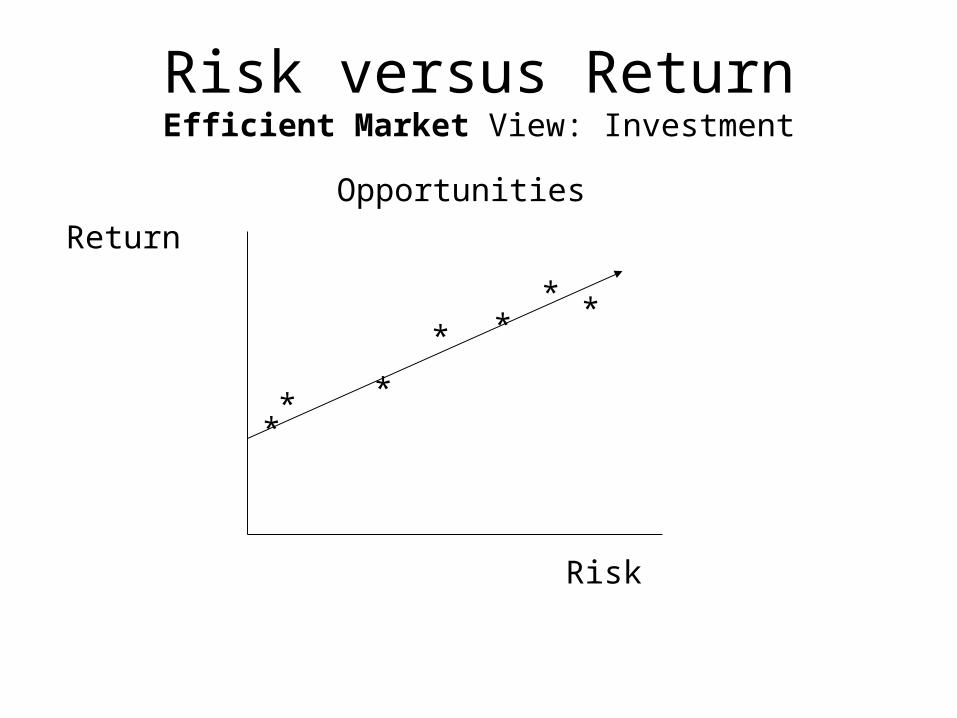
Risk versus ReturnEfficient Market View: Investment Opportunities
Risk
Return
*
* **
*
*
*
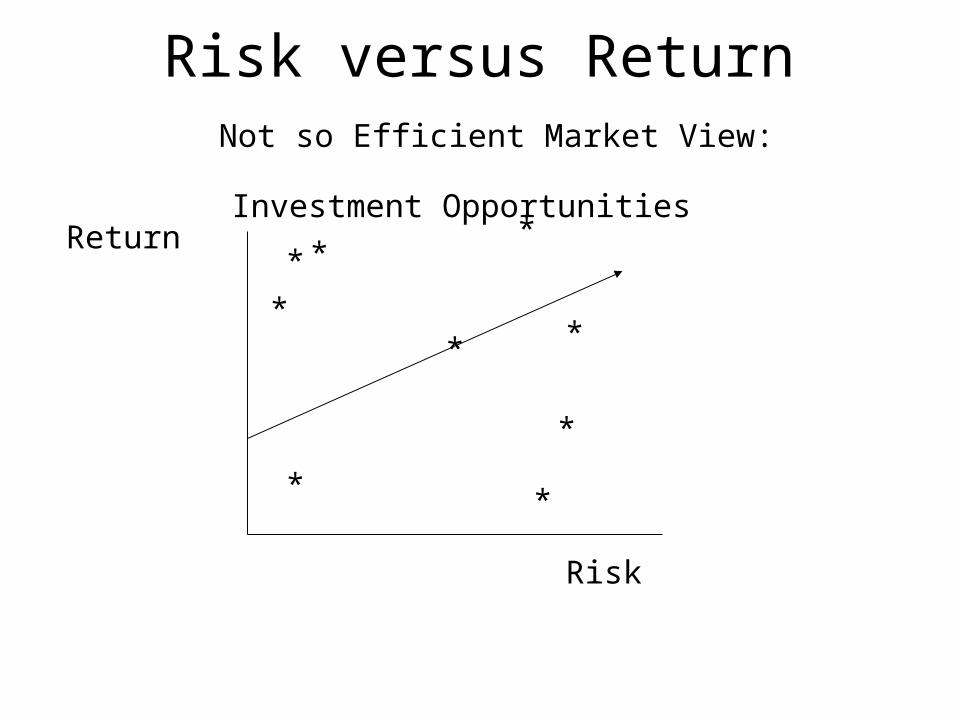
Risk versus Return Not so Efficient Market View: Investment Opportunities
Risk
Return*
**
*
*
**
*
*
Key Questions on Risk
What is the “right” measure of risk?How much risk do you want to bear
yourself?