Embed Size (px)
Citation preview
RISK AND TERM STRUCTURE OF INTEREST RATES
Fundamentals of Finance – Lecture 5
Risk Structure of Interest Rates
• Bonds with the same maturity have different interest rates due to:– Default risk– Liquidity – Tax considerations
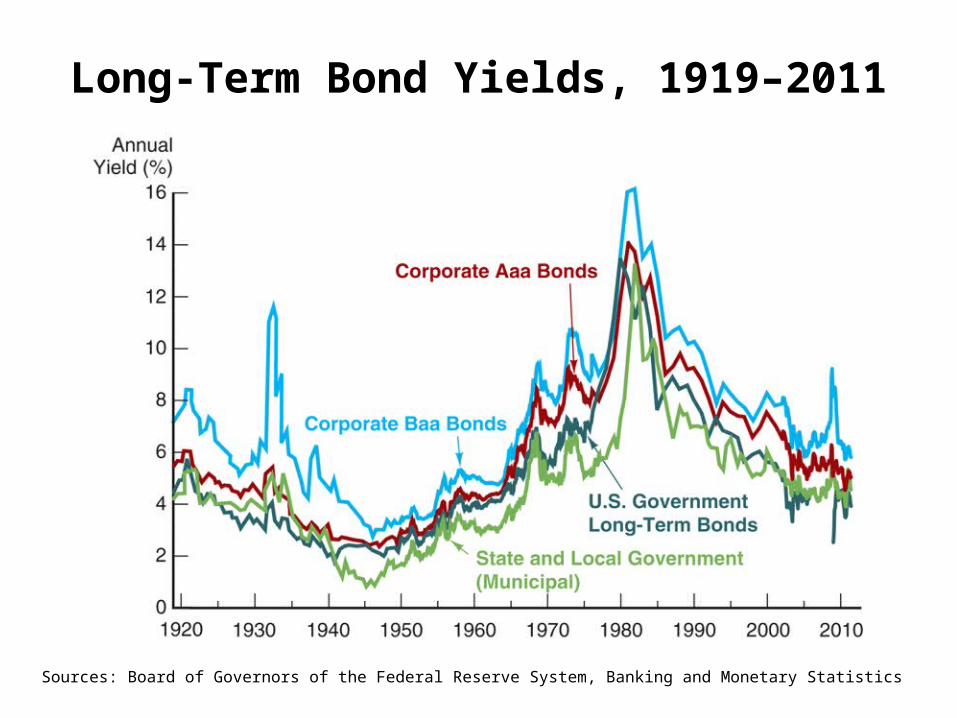
Long-Term Bond Yields, 1919–2011
Sources: Board of Governors of the Federal Reserve System, Banking and Monetary Statistics
Risk Structure of Interest Rates (cont’d)
• Default risk: probability that the issuer of the bond is unable or unwilling to make interest payments or pay off the face value
– Treasury bonds are considered default free (government can raise taxes).
• Risk premium: the spread between the interest rates on bonds with default risk and the interest rates on (same maturity) Treasury bonds
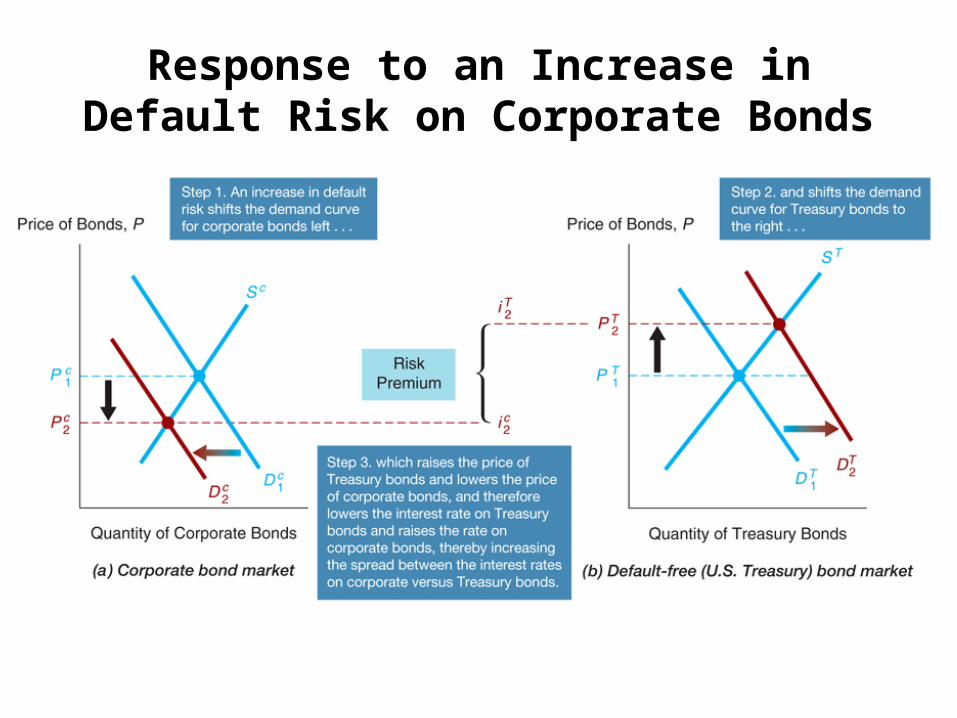
Response to an Increase in Default Risk on Corporate Bonds
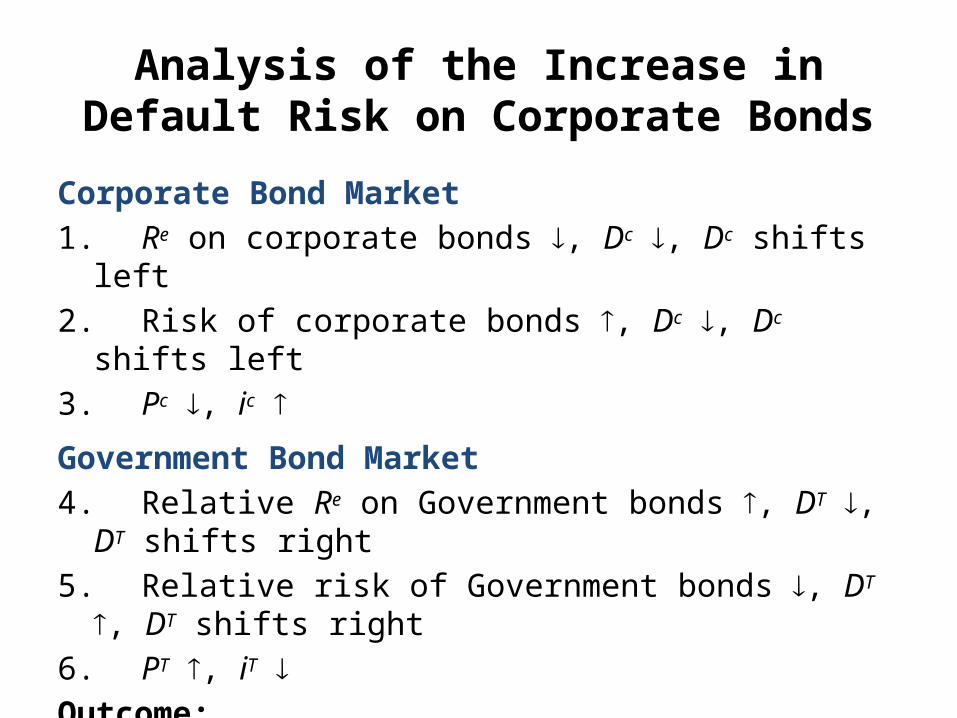
Analysis of the Increase inDefault Risk on Corporate Bonds
Corporate Bond Market1. Re on corporate bonds , Dc , Dc shifts left2. Risk of corporate bonds , Dc , Dc shifts left3. Pc , ic
Government Bond Market4. Relative Re on Government bonds , DT , DT shifts right5. Relative risk of Government bonds , DT , DT shifts right6. PT , iT Outcome:Risk premium, ic – iT, rises

Bond Ratings by Moody’s, Standard
and Poor’s, and Fitch
Risk Structure of Interest Rates (cont’d)
• Liquidity: the relative ease with which an asset can be converted into cash
– Cost of selling a bond
– Number of buyers/sellers in a bond market
• Income tax considerations
– Interest payments on municipal bonds are exempt from federal income taxes.
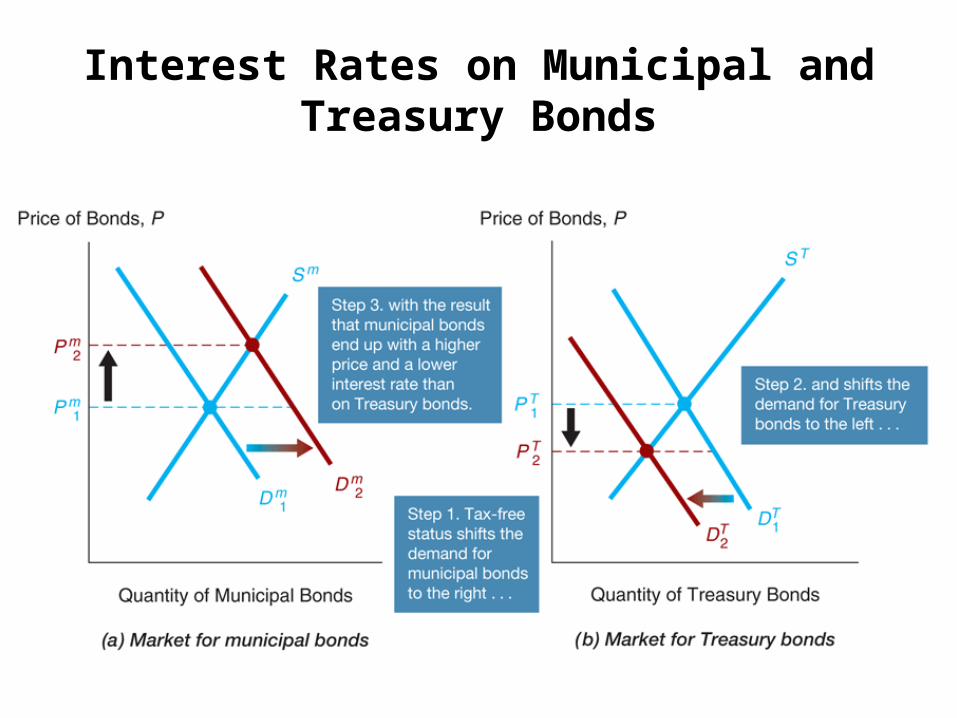
Interest Rates on Municipal and Treasury Bonds
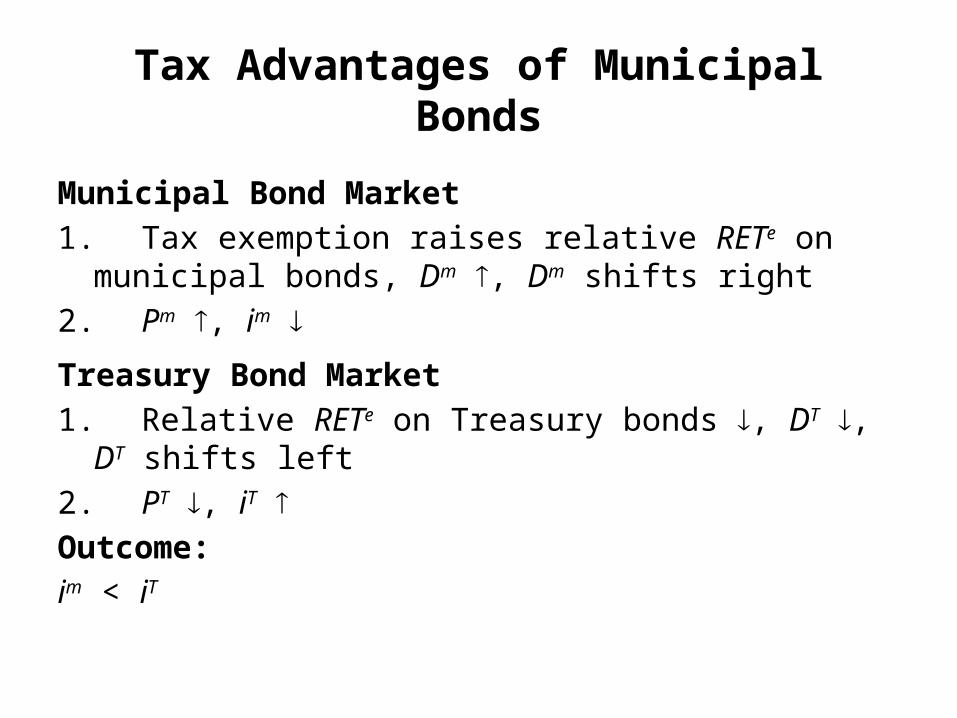
Tax Advantages of Municipal Bonds
Municipal Bond Market1. Tax exemption raises relative RETe on municipal bonds, Dm ,
Dm shifts right2. Pm , im
Treasury Bond Market1. Relative RETe on Treasury bonds , DT , DT shifts left2. PT , iT Outcome:im < iT
Term Structure of Interest Rates
Bonds with identical risk, liquidity, and tax characteristics may have different interest rates because the time remaining to maturity is different.
Term Structure of Interest Rates (cont’d)
• Yield curve: a plot of the yield on bonds with differing terms to maturity but the same risk, liquidity and tax considerations
– Upward-sloping: long-term rates are above short-term rates
– Flat: short- and long-term rates are the same
– Inverted: long-term rates are below short-term rates

Yield Curves
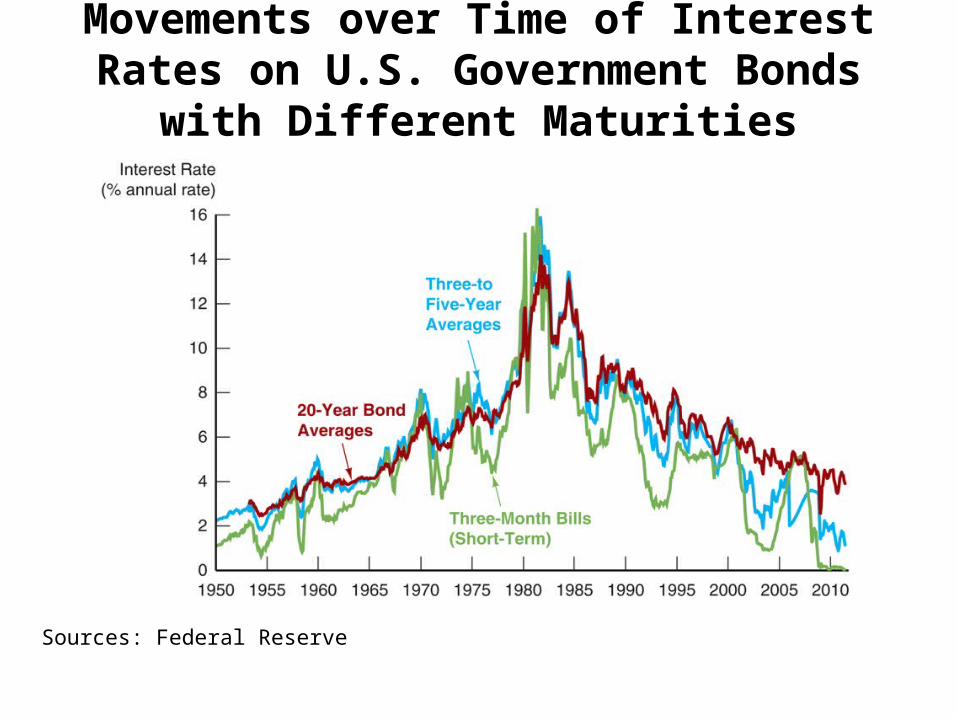
Movements over Time of Interest Rates on U.S. Government Bonds with Different Maturities
Sources: Federal Reserve
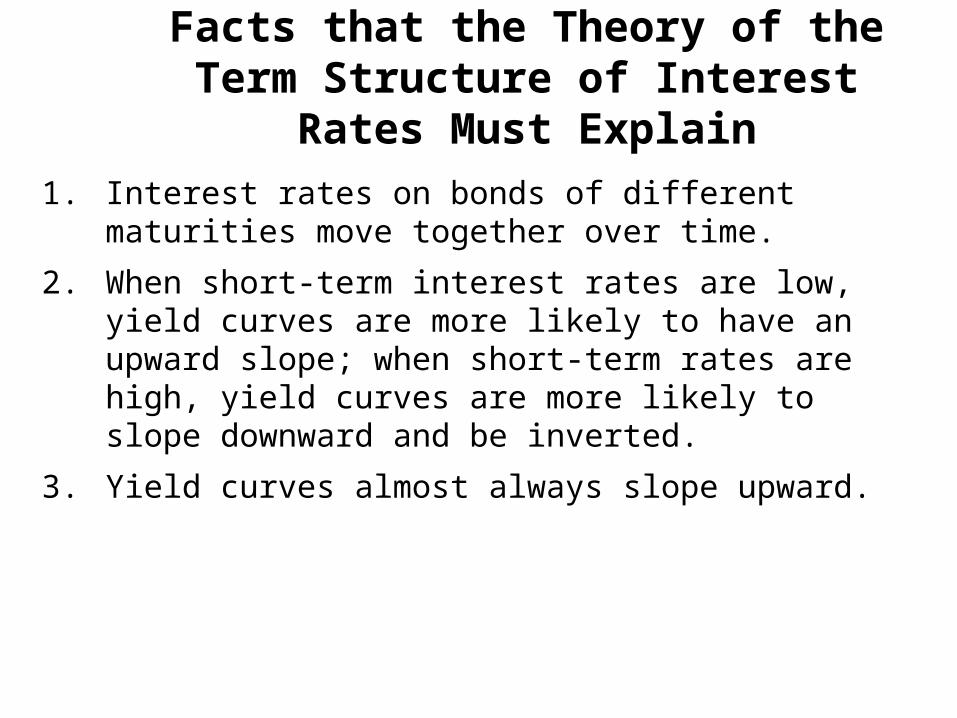
Facts that the Theory of the Term Structure of Interest Rates Must Explain
1. Interest rates on bonds of different maturities move together over time.
2. When short-term interest rates are low, yield curves are more likely to have an upward slope; when short-term rates are high, yield curves are more likely to slope downward and be inverted.
3. Yield curves almost always slope upward.
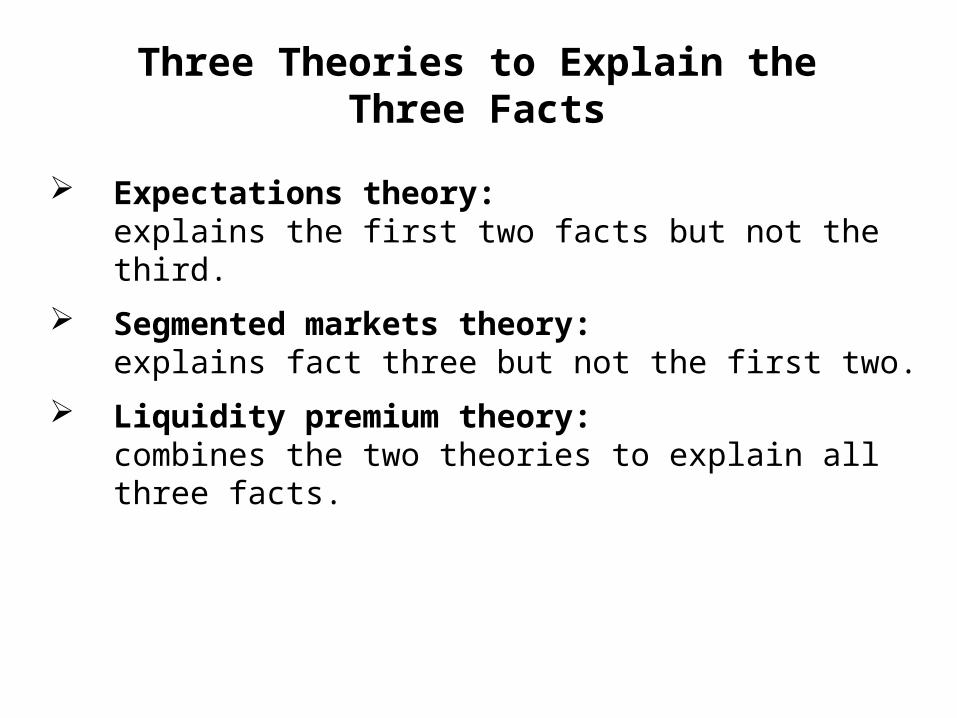
Three Theories to Explain the Three Facts
Expectations theory: explains the first two facts but not the third.
Segmented markets theory:explains fact three but not the first two.
Liquidity premium theory: combines the two theories to explain all three facts.
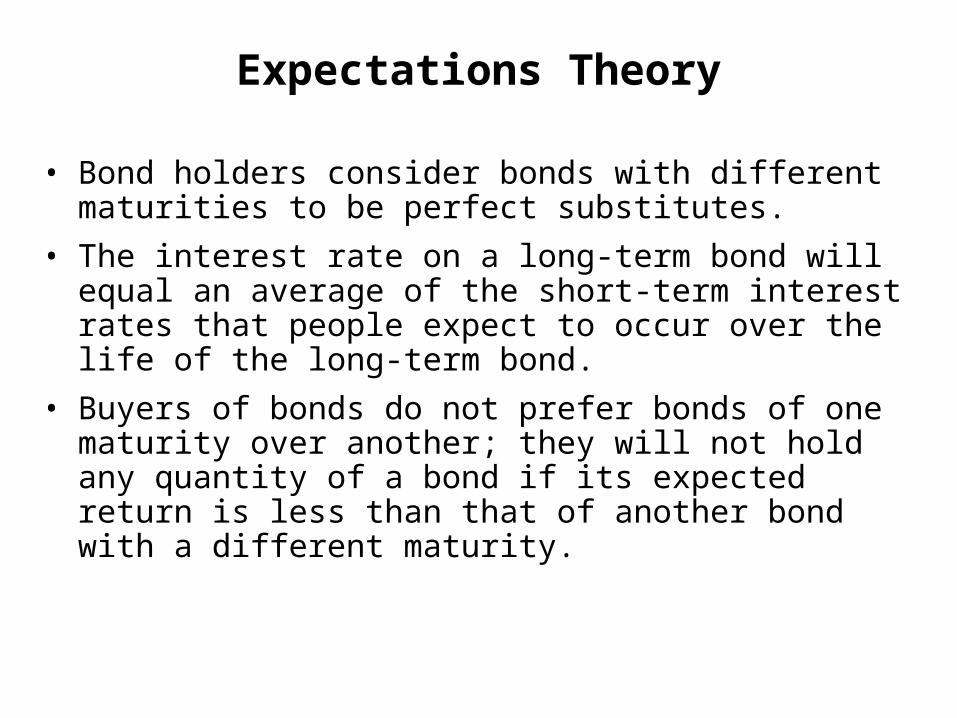
Expectations Theory
• Bond holders consider bonds with different maturities to be perfect substitutes.
• The interest rate on a long-term bond will equal an average of the short-term interest rates that people expect to occur over the life of the long-term bond.
• Buyers of bonds do not prefer bonds of one maturity over another; they will not hold any quantity of a bond if its expected return is less than that of another bond with a different maturity.
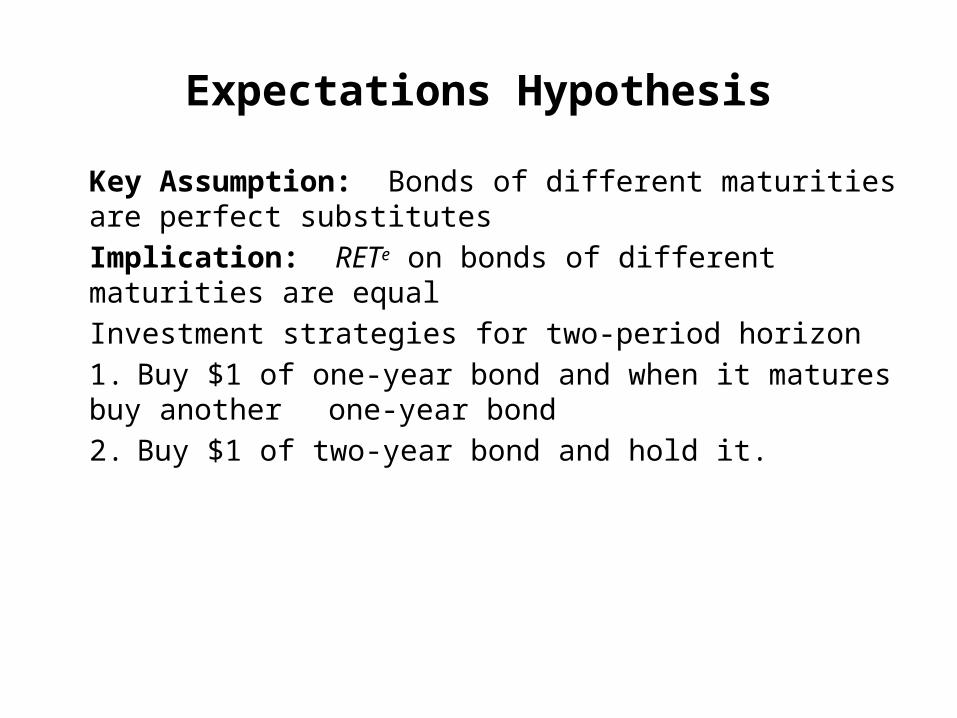
Expectations Hypothesis
Key Assumption: Bonds of different maturities are perfect substitutesImplication: RETe on bonds of different maturities are equalInvestment strategies for two-period horizon1. Buy $1 of one-year bond and when it matures buy another
one-year bond2. Buy $1 of two-year bond and hold it.
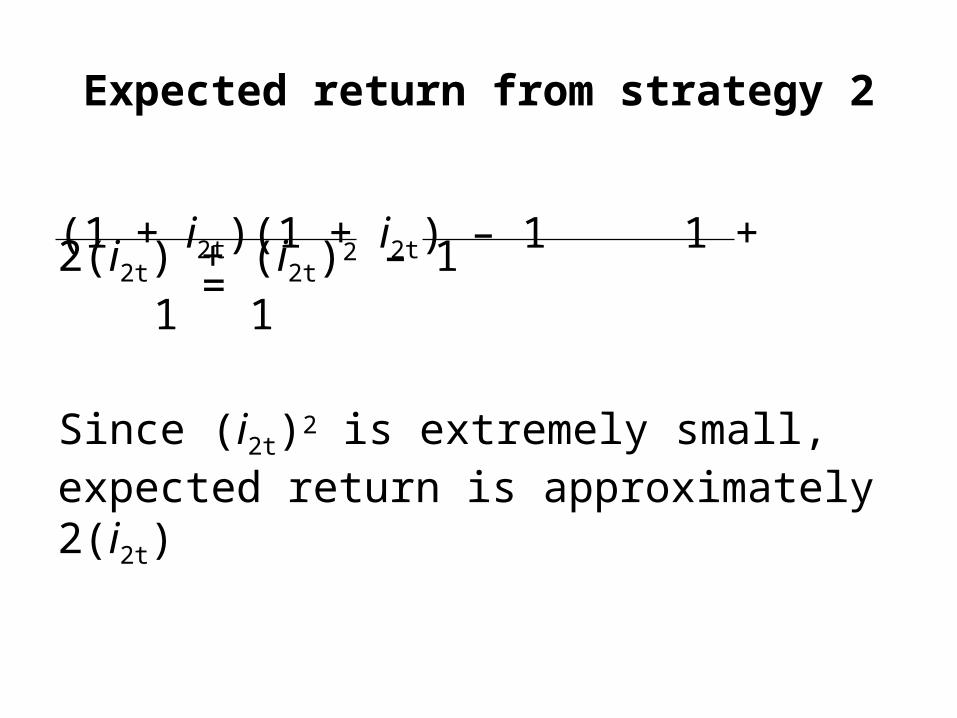
Expected return from strategy 2
(1 + i2t)(1 + i2t) – 1 1 + 2(i2t) + (i2t)2 – 1=
1 1
Since (i2t)2 is extremely small, expected return is approximately 2(i2t)
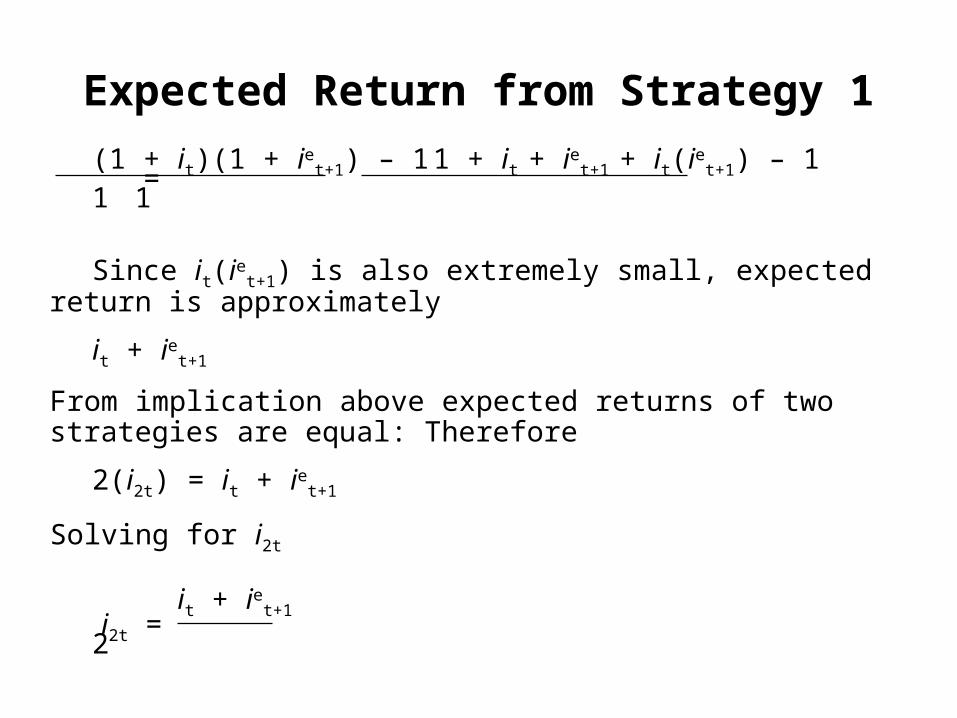
Expected Return from Strategy 1(1 + it)(1 + ie
t+1) – 1 1 + it + iet+1 + it(ie
t+1) – 1 =
1 1
Since it(iet+1) is also extremely small, expected return is
approximately
it + iet+1
From implication above expected returns of two strategies are equal: Therefore
2(i2t) = it + iet+1
Solving for i2t
it + iet+1
i2t = 2
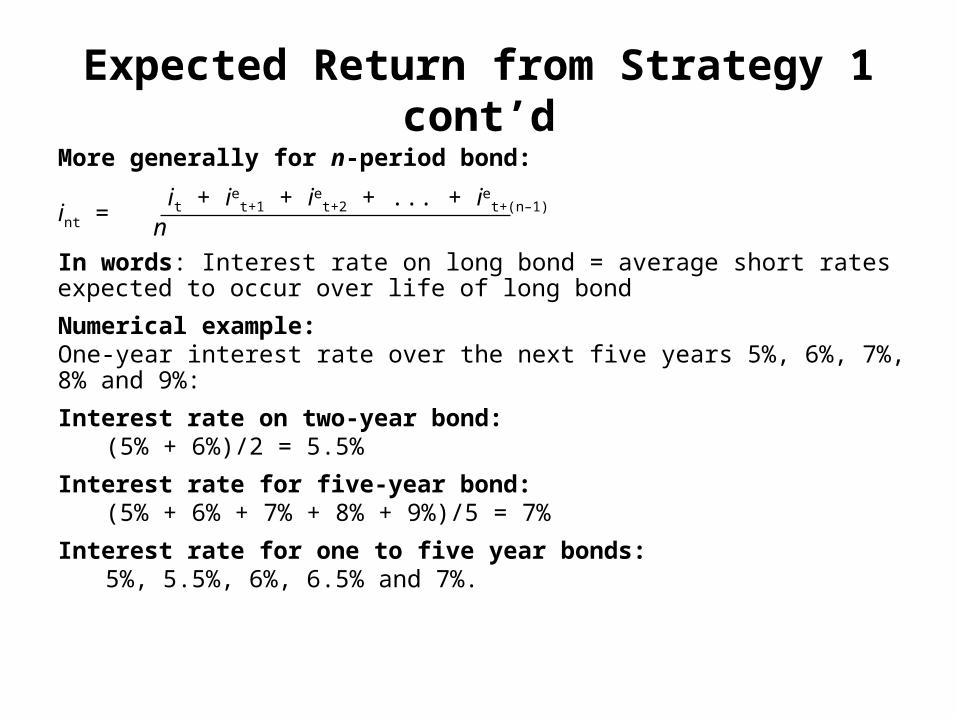
Expected Return from Strategy 1 cont’dMore generally for n-period bond:
it + iet+1 + ie
t+2 + ... + iet+(n–1)int = n
In words: Interest rate on long bond = average short rates expected to occur over life of long bond
Numerical example:One-year interest rate over the next five years 5%, 6%, 7%, 8% and 9%:
Interest rate on two-year bond:(5% + 6%)/2 = 5.5%
Interest rate for five-year bond:(5% + 6% + 7% + 8% + 9%)/5 = 7%
Interest rate for one to five year bonds:5%, 5.5%, 6%, 6.5% and 7%.
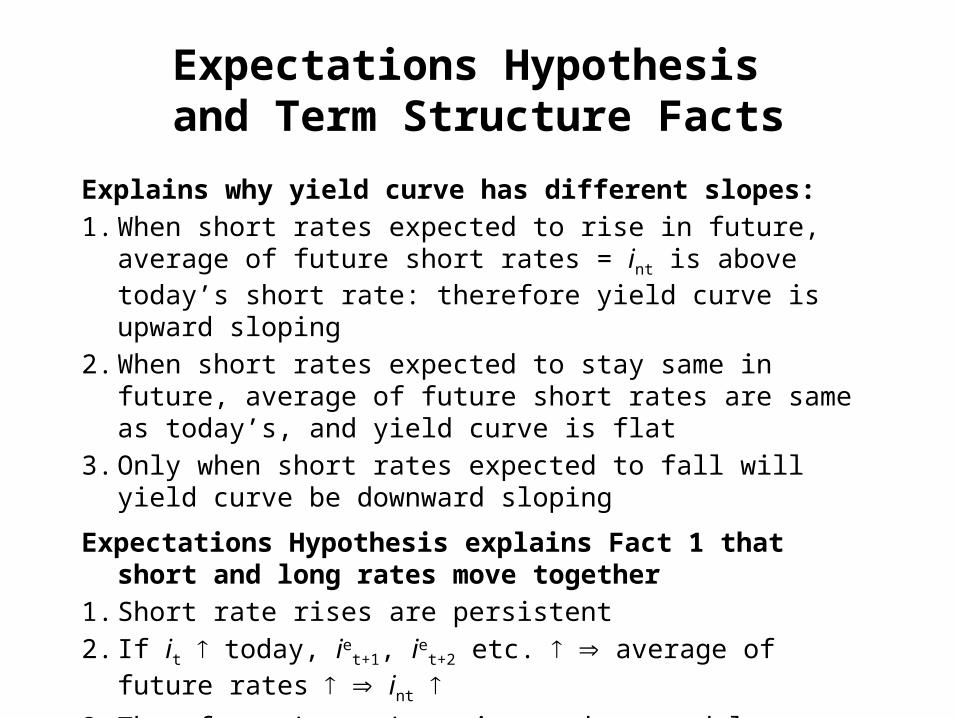
Expectations Hypothesis and Term Structure Facts
Explains why yield curve has different slopes:1. When short rates expected to rise in future, average of future short
rates = int is above today’s short rate: therefore yield curve is upward sloping
2. When short rates expected to stay same in future, average of future short rates are same as today’s, and yield curve is flat
3. Only when short rates expected to fall will yield curve be downward sloping
Expectations Hypothesis explains Fact 1 that short and long rates move together
1. Short rate rises are persistent2. If it today, ie
t+1, iet+2 etc. average of future rates int
3. Therefore: it int , i.e., short and long rates move together
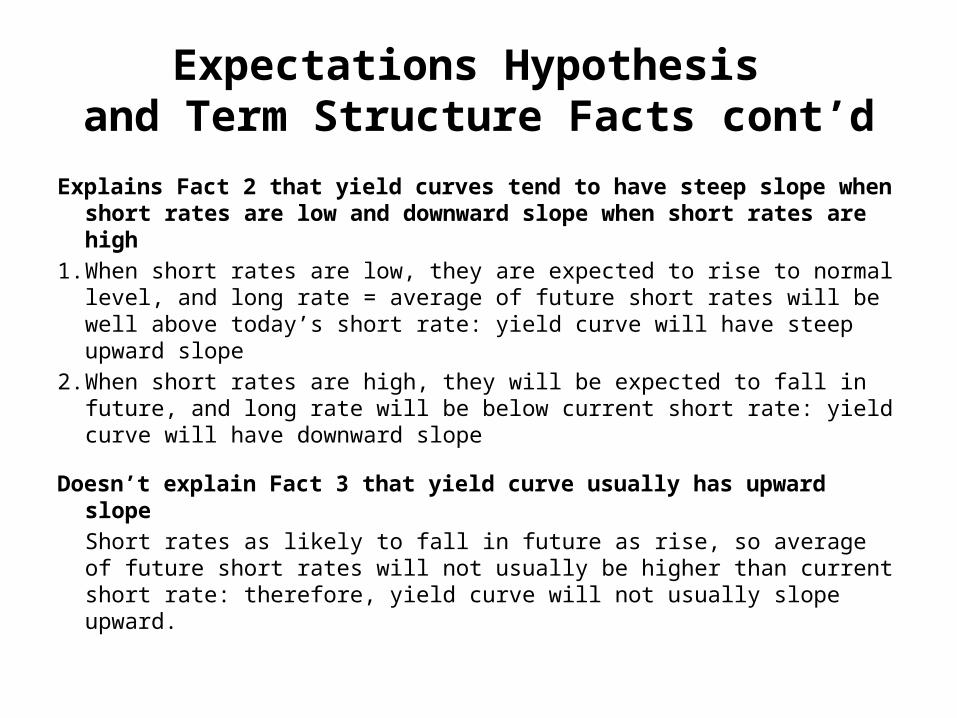
Explains Fact 2 that yield curves tend to have steep slope when short rates are low and downward slope when short rates are high
1. When short rates are low, they are expected to rise to normal level, and long rate = average of future short rates will be well above today’s short rate: yield curve will have steep upward slope
2. When short rates are high, they will be expected to fall in future, and long rate will be below current short rate: yield curve will have downward slope
Doesn’t explain Fact 3 that yield curve usually has upward slopeShort rates as likely to fall in future as rise, so average of future short rates will not usually be higher than current short rate: therefore, yield curve will not usually slope upward.
Expectations Hypothesis and Term Structure Facts cont’d
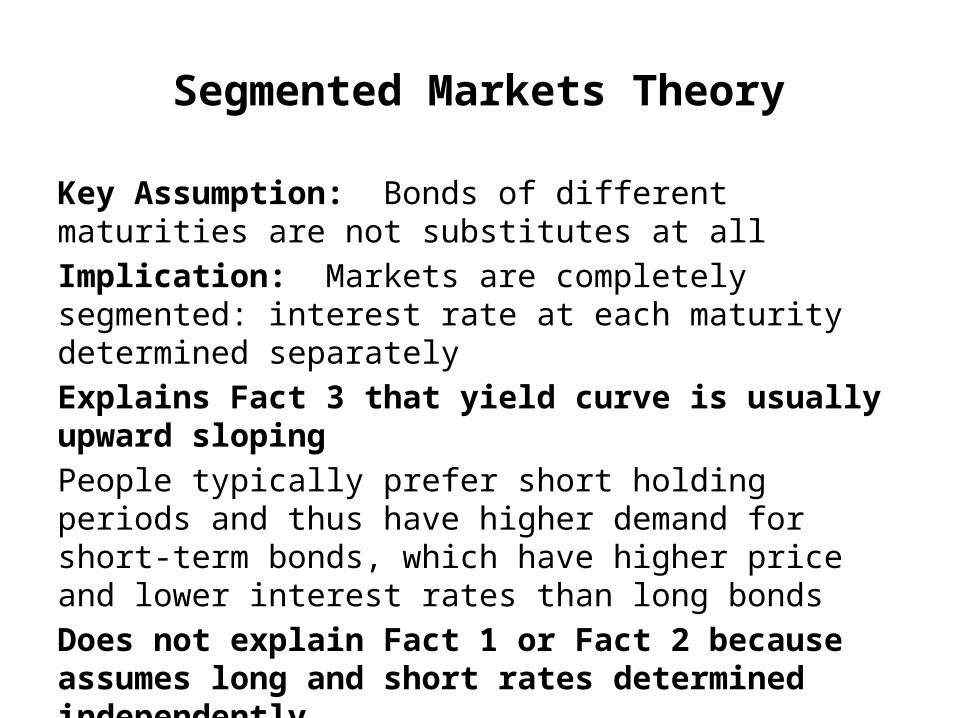
Segmented Markets Theory
Key Assumption: Bonds of different maturities are not substitutes at allImplication: Markets are completely segmented: interest rate at each maturity determined separatelyExplains Fact 3 that yield curve is usually upward slopingPeople typically prefer short holding periods and thus have higher demand for short-term bonds, which have higher price and lower interest rates than long bondsDoes not explain Fact 1 or Fact 2 because assumes long and short rates determined independently
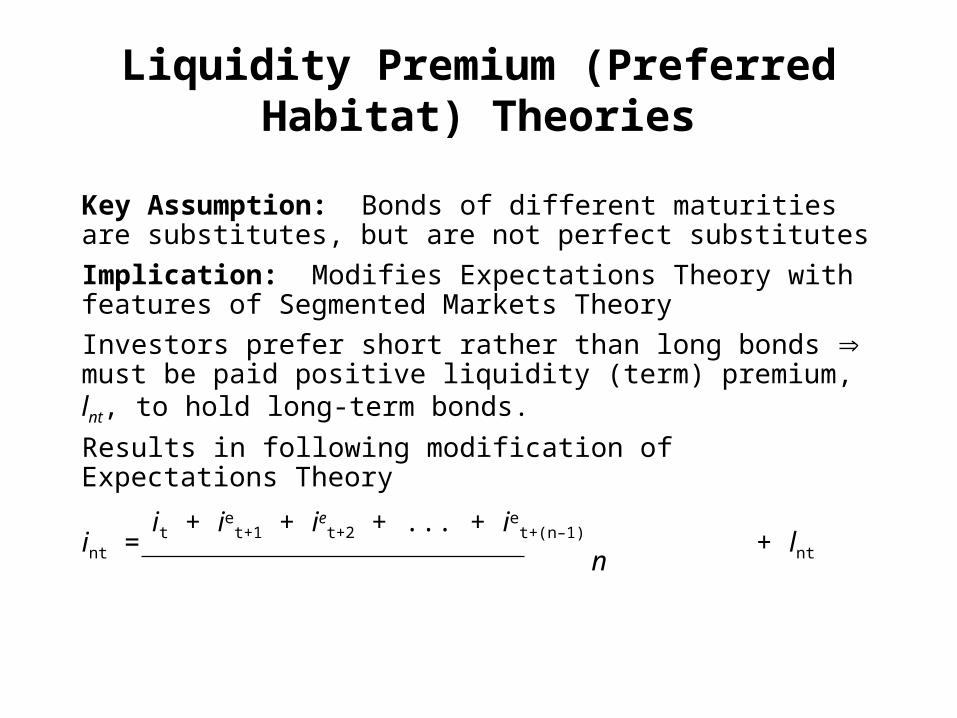
Liquidity Premium (Preferred Habitat) Theories
Key Assumption: Bonds of different maturities are substitutes, but are not perfect substitutesImplication: Modifies Expectations Theory with features of Segmented Markets TheoryInvestors prefer short rather than long bonds must be paid positive liquidity (term) premium, lnt, to hold long-term bonds.Results in following modification of Expectations Theory
it + iet+1 + ie
t+2 + ... + iet+(n–1)int = + lnt n
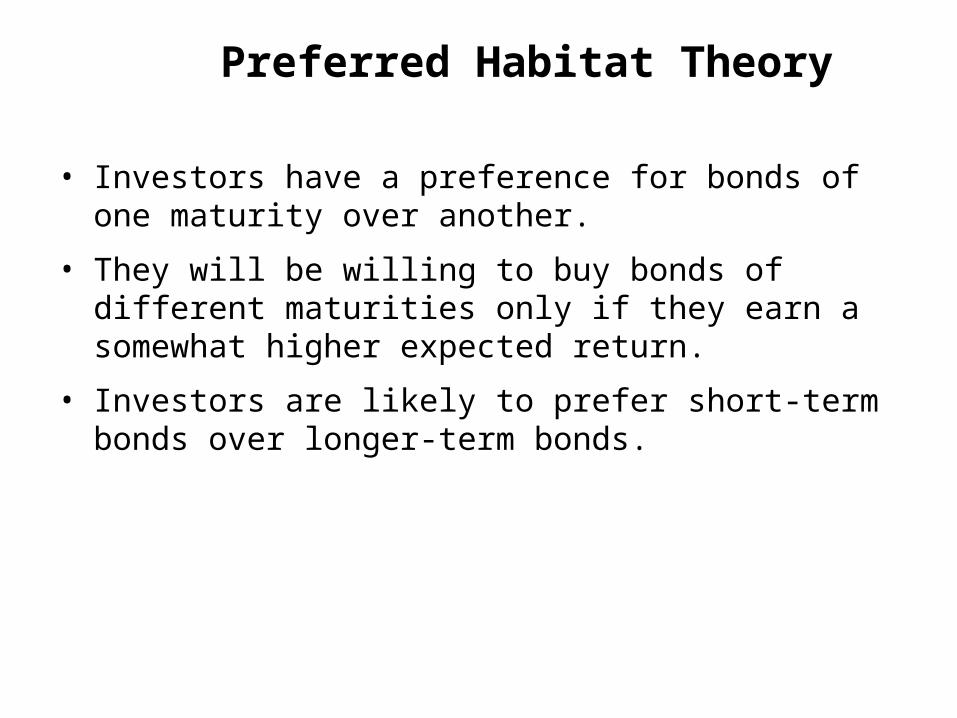
Preferred Habitat Theory
• Investors have a preference for bonds of one maturity over another.
• They will be willing to buy bonds of different maturities only if they earn a somewhat higher expected return.
• Investors are likely to prefer short-term bonds over longer-term bonds.
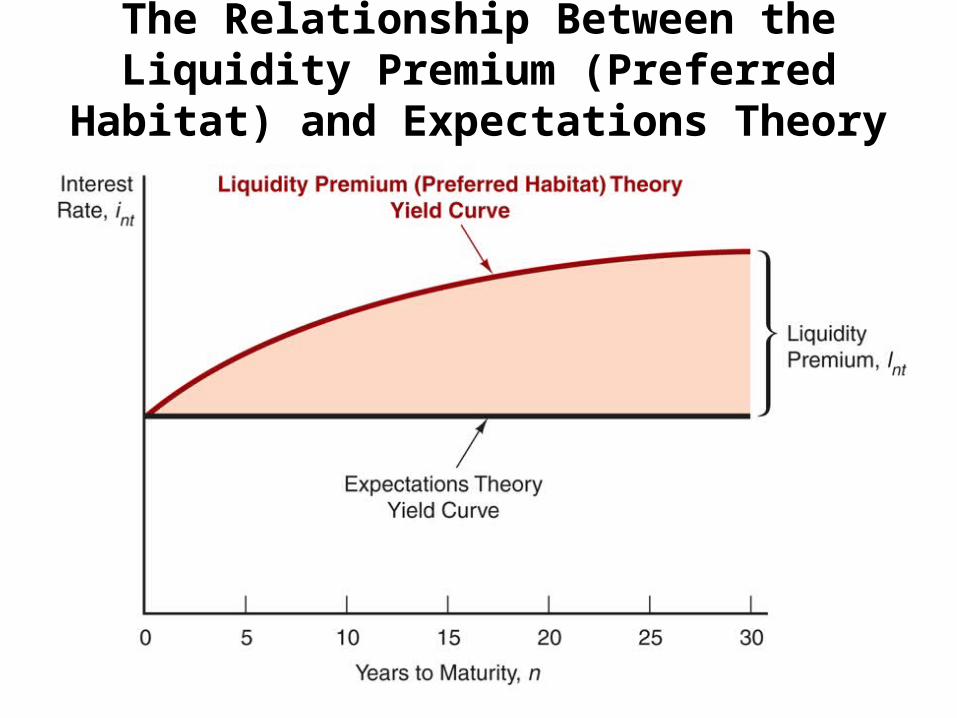
The Relationship Between the Liquidity Premium (Preferred Habitat) and Expectations Theory
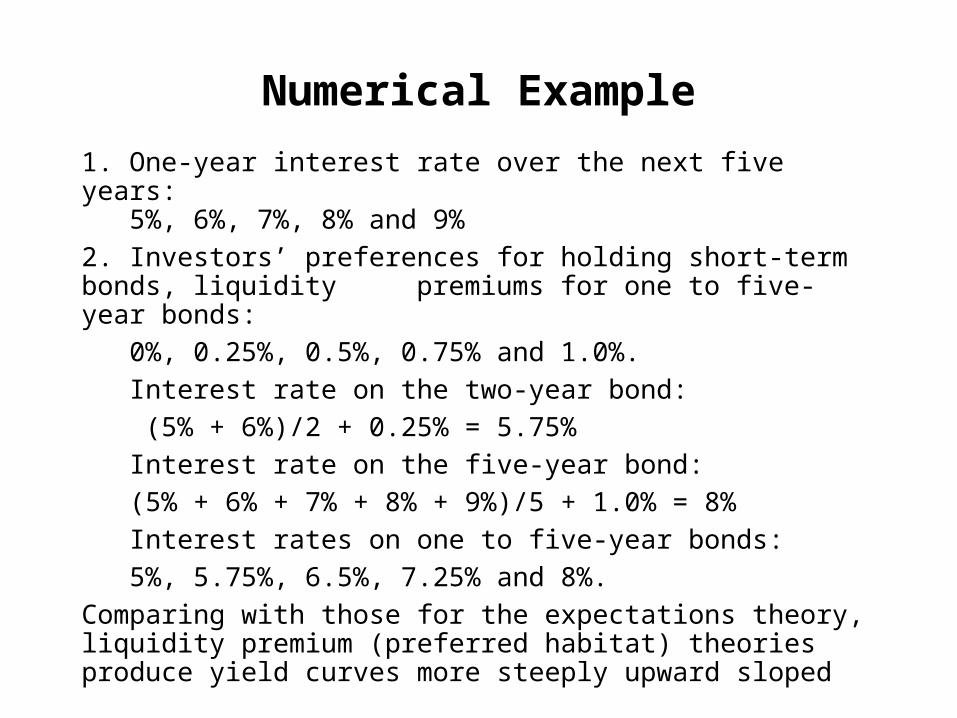
Numerical Example
1. One-year interest rate over the next five years:5%, 6%, 7%, 8% and 9%
2. Investors’ preferences for holding short-term bonds, liquidity premiums for one to five-year bonds:0%, 0.25%, 0.5%, 0.75% and 1.0%.Interest rate on the two-year bond: (5% + 6%)/2 + 0.25% = 5.75%Interest rate on the five-year bond:(5% + 6% + 7% + 8% + 9%)/5 + 1.0% = 8%Interest rates on one to five-year bonds:5%, 5.75%, 6.5%, 7.25% and 8%.
Comparing with those for the expectations theory, liquidity premium (preferred habitat) theories produce yield curves more steeply upward sloped
Liquidity Premium and Preferred Habitat Theories (cont’d)
• Interest rates on different maturity bonds move together over time, as explained by the first term in the equation.
• Yield curves tend to slope upward when short-term rates are low and to be inverted when short-term rates are high, as explained by the liquidity premium term in the first case and by a low expected average in the second case.
• Yield curves typically slope upward, as explained by a larger liquidity premium as the term to maturity lengthens.
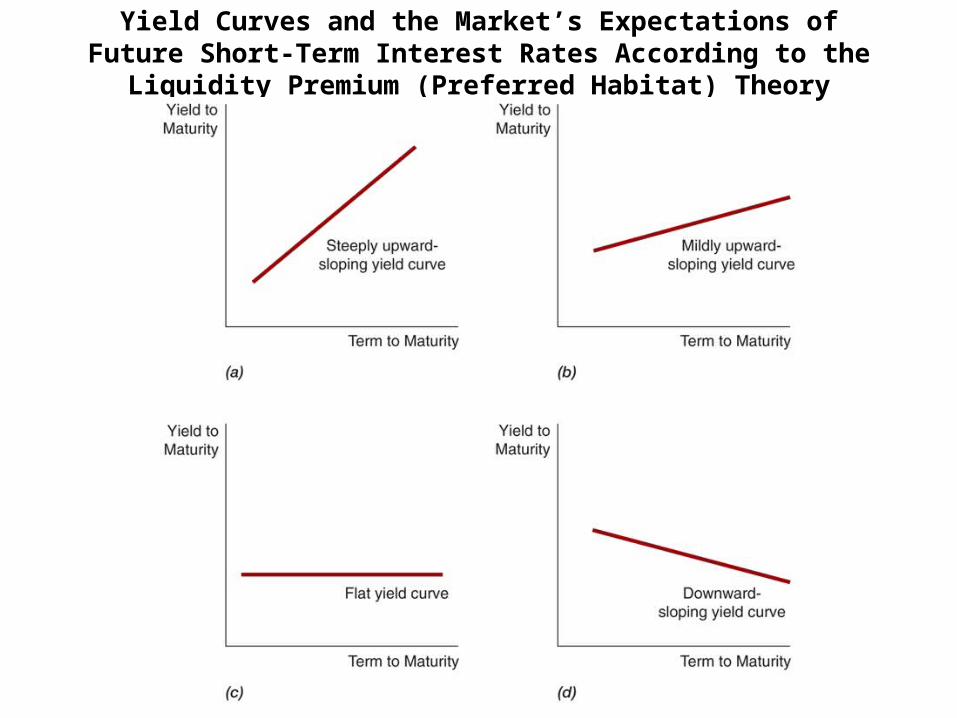
Yield Curves and the Market’s Expectations of Future Short-Term Interest Rates According to the Liquidity Premium (Preferred Habitat) Theory