Embed Size (px)
Citation preview


Publication 9285.7-01DJanuary 1998
Risk Assessment Guidancefor Superfund:
Volume IHuman Health Evaluation Manual
(Part D, Standardized Planning,Reporting, and Review of Superfund
Risk Assessments)
Interim
Office of Emergency and Remedial ResponseU.S. Environmental Protection Agency
Washington, DC 20460

Revision No. 0 ii January 1998
NOTICE
This document provides guidance to EPA staff. The guidance is designed to communicate Nationalpolicy on the planning, reporting and review of Superfund risk assessments. The document does not, however,substitute for EPA’s statutes or regulations, nor is it a regulation itself. Thus, it cannot impose legally-bindingrequirements on EPA, States, or the regulated community, and may not apply to a particular situation based uponthe circumstances. EPA may change this guidance in the future, as appropriate.
This guidance is based on the National Oil and Hazardous Substances Pollution Contingency Plan(NCP), which was published on March 8, 1990 (55 Federal Register 8666). The NCP should be considered theauthoritative source.

Revision No. 0 iii January 1998
CONTENTS
Page
NOTICE . . . . . . . . . . . . . . . . . . . . . . . . . . . . . . . . . . . . . . . . . . . . . . . . . . . . . . . . . . . . . . . . . . . . . . . . . . . . . . . ii
EXHIBITS . . . . . . . . . . . . . . . . . . . . . . . . . . . . . . . . . . . . . . . . . . . . . . . . . . . . . . . . . . . . . . . . . . . . . . . . . . . . vi
DEFINITIONS . . . . . . . . . . . . . . . . . . . . . . . . . . . . . . . . . . . . . . . . . . . . . . . . . . . . . . . . . . . . . . . . . . . . . . . . . vii
ACRONYMS/ABBREVIATIONS . . . . . . . . . . . . . . . . . . . . . . . . . . . . . . . . . . . . . . . . . . . . . . . . . . . . . . . . . xii
ACKNOWLEDGMENTS . . . . . . . . . . . . . . . . . . . . . . . . . . . . . . . . . . . . . . . . . . . . . . . . . . . . . . . . . . . . . . . xiv
PREFACE . . . . . . . . . . . . . . . . . . . . . . . . . . . . . . . . . . . . . . . . . . . . . . . . . . . . . . . . . . . . . . . . . . . . . . . . . . . . xv
1.0 INTRODUCTION . . . . . . . . . . . . . . . . . . . . . . . . . . . . . . . . . . . . . . . . . . . . . . . . . . . . . . . . . . . . . . 1-1
1.1 OVERVIEW OF PART D . . . . . . . . . . . . . . . . . . . . . . . . . . . . . . . . . . . . . . . . . . . . . . . . . . 1-1
1.1.1 Background. . . . . . . . . . . . . . . . . . . . . . . . . . . . . . . . . . . . . . . . . . . . . . . . . . . . . . . . 1-11.1.2 Elements of Part D Approach. . . . . . . . . . . . . . . . . . . . . . . . . . . . . . . . . . . . . . . . . . 1-1
1.2 APPLICABILITY OF PART D APPROACH. . . . . . . . . . . . . . . . . . . . . . . . . . . . . . . . . . . 1-4
1.3 PROCESS IMPROVEMENTS RESULTING FROM PART D APPROACH. . . . . . . . . . . . . . . . . . . . . . . . . . . . . . . . . . . . . . . . . . . . . . . . . . . . . . 1-4
1.4 ORGANIZATION OF DOCUMENT . . . . . . . . . . . . . . . . . . . . . . . . . . . . . . . . . . . . . . . . . . 1-4
1.5 ADDITIONAL INFORMATION . . . . . . . . . . . . . . . . . . . . . . . . . . . . . . . . . . . . . . . . . . . . . 1-7
2.0 RISK CONSIDERATIONS DURING PROJECT SCOPING . . . . . . . . . . . . . . . . . . . . . . . . . . . 2-1
2.1 PLANNING . . . . . . . . . . . . . . . . . . . . . . . . . . . . . . . . . . . . . . . . . . . . . . . . . . . . . . . . . . . . . . 2-1
2.2 WORKPLAN DEVELOPMENT . . . . . . . . . . . . . . . . . . . . . . . . . . . . . . . . . . . . . . . . . . . . . 2-2
2.2.1 RI/FS Workplan/Baseline Risk Assessment Workplan. . . . . . . . . . . . . . . . . . . . . . 2-22.2.2 SAP and QAPP . . . . . . . . . . . . . . . . . . . . . . . . . . . . . . . . . . . . . . . . . . . . . . . . . . . . . 2-3
3.0 RISK ASSESSMENT DATA NEEDS AND TASKS DURING THE REMEDIAL INVESTIGATION . . . . . . . . . . . . . . . . . . . . . . . . . . . . . . . . . . . . . . . . . . . . . . 3-1
3.1 INTERIM DELIVERABLES . . . . . . . . . . . . . . . . . . . . . . . . . . . . . . . . . . . . . . . . . . . . . . . . 3-1

CONTENTS (Continued)
Revision No. 0 iv January 1998
Page
3.1.1 Standard Tables, Worksheets, and Supporting Information. . . . . . . . . . . . . . . . . . 3-23.1.2 Assessment of Confidence and Uncertainty . . . . . . . . . . . . . . . . . . . . . . . . . . . . . 3-103.1.3 Probabilistic Analysis Information . . . . . . . . . . . . . . . . . . . . . . . . . . . . . . . . . . . . 3-10
3.2 DRAFT BASELINE RISK ASSESSMENT REPORT . . . . . . . . . . . . . . . . . . . . . . . . . . . 3-11
3.3 FINAL BASELINE RISK ASSESSMENT REPORT . . . . . . . . . . . . . . . . . . . . . . . . . . . . 3-11
3.4 DATA TRANSFER TO CERCLIS 3 . . . . . . . . . . . . . . . . . . . . . . . . . . . . . . . . . . . . . . . . . 3-11 4.0 RISK EVALUATIONS DURING THE FEASIBILITY STUDY . . . . . . . . . . . . . . . . . . . . . . . . . 4-1
4.1 INTRODUCTION . . . . . . . . . . . . . . . . . . . . . . . . . . . . . . . . . . . . . . . . . . . . . . . . . . . . . . . . . 4-1
4.1.1 Remedial Action Objectives. . . . . . . . . . . . . . . . . . . . . . . . . . . . . . . . . . . . . . . . . . . 4-14.1.2 Remediation Goals. . . . . . . . . . . . . . . . . . . . . . . . . . . . . . . . . . . . . . . . . . . . . . . . . . 4-14.1.3 Preliminary Remediation Goals. . . . . . . . . . . . . . . . . . . . . . . . . . . . . . . . . . . . . . . . 4-3
4.2 DEVELOP REMEDIAL ACTION OBJECTIVES. . . . . . . . . . . . . . . . . . . . . . . . . . . . . . . 4-3
4.3 DEVELOP REMEDIATION GOALS. . . . . . . . . . . . . . . . . . . . . . . . . . . . . . . . . . . . . . . . . 4-3
4.3.1 Identify Values Considered as Preliminary Remediation Goals. . . . . . . . . . . . . . . 4-34.3.2 Select Preliminary Remediation Goals. . . . . . . . . . . . . . . . . . . . . . . . . . . . . . . . . . 4-4
4.4 SUMMARIZE RISKS AND HAZARDS ASSOCIATED WITH PRELIMINARY REMEDIATION GOALS . . . . . . . . . . . . . . . . . . . . . . . . . . . . . . 4-4
4.5 EVALUATE REMEDIAL TECHNOLOGIES ANDALTERNATIVES FOR RISK CONSIDERATIONS . . . . . . . . . . . . . . . . . . . . . . . . . . . . . 4-4
4.5.1 Identification and Screening of Technologies and Alternatives . . . . . . . . . . . . . . . . . . . . . . . . . . . . . . . . . . . . . . . . . . . . . . . . . . . . 4-4
4.5.2 Detailed Analysis of Alternatives . . . . . . . . . . . . . . . . . . . . . . . . . . . . . . . . . . . . . . 4-5
5.0 RISK EVALUATIONS AFTER THE FEASIBILITY STUDY. . . . . . . . . . . . . . . . . . . . . . . . . . 5-1
5.1 RISK EVALUATION FOR THE PROPOSED PLAN. . . . . . . . . . . . . . . . . . . . . . . . . . . . 5-1
5.2 DOCUMENTATION OF RISKS IN THE RECORD OF DECISION . . . . . . . . . . . . . . . . . . . . . . . . . . . . . . . . . . . . . . . . . . . . . . . . . . . . . . . . . . . . 5-1
5.3 RISK EVALUATION DURING REMEDIAL DESIGN AND REMEDIAL ACTION . . . . . . . . . . . . . . . . . . . . . . . . . . . . . . . . . . . . . . . . . . . . . . . . . . . . . 5-2

CONTENTS (Continued)
Revision No. 0 v January 1998
Page
5.4 RISK EVALUATION ASSOCIATED WITH EXPLANATIONS OF SIGNIFICANT DIFFERENCES
(ESDs) AND AMENDED RODs. . . . . . . . . . . . . . . . . . . . . . . . . . . . . . . . . . . . . . . . . . . . . 5-2
5.5 RISK EVALUATION DURINGFIVE-YEAR REVIEWS . . . . . . . . . . . . . . . . . . . . . . . . . . . . . . . . . . . . . . . . . . . . . . . . . . . . 5-2
REFERENCES . . . . . . . . . . . . . . . . . . . . . . . . . . . . . . . . . . . . . . . . . . . . . . . . . . . . . . . . . . . . . . . . . . . . . . . R-1
APPENDIX A STANDARD TABLES
APPENDIX B INSTRUCTIONS FOR COMPLETION OF THE STANDARD TABLES
APPENDIX C DATA USEABILITY WORKSHEET
ELECTRONIC MEDIA

Revision No. 0 vi January 1998
EXHIBITS
Exhibit Page
1-1 RELATIONSHIP OF THE HUMAN HEALTH EVALUATION TO THE CERCLA PROCESS . . . . . . . . . . . . . . . . . . . . . . . . . . . . . . . . . . . . . . . . . . . . . . . . . . . . 1-2
1-2 GUIDELINES FOR PART D APPLICABILITY. . . . . . . . . . . . . . . . . . . . . . . . . . . . . . . . . . . . . . 1-5
1-3 PROCESS IMPROVEMENTS EXPECTED WITH PART D APPROACH. . . . . . . . . . . . . . . . 1-6
1-4 ROLE OF RISK ASSESSOR IN THE CERCLA REMEDIAL PROCESS . . . . . . . . . . . . . . . . . 1-8
3-1 INTERIM DELIVERABLES FOR EACH SITE. . . . . . . . . . . . . . . . . . . . . . . . . . . . . . . . . . . . . 3-12
3-2 STANDARDIZED RISK ASSESSMENT REPORTING . . . . . . . . . . . . . . . . . . . . . . . . . . . . . . 3-14
3-3 DATA USEABILITY WORKSHEET . . . . . . . . . . . . . . . . . . . . . . . . . . . . . . . . . . . . . . . . . . . . . 3-15
4-1 EXAMPLE TABLES TO STANDARDIZE REPORTING OFFS RISK EVALUATIONS . . . . . . . . . . . . . . . . . . . . . . . . . . . . . . . . . . . . . . . . . . . . . . . . . . . . . . . 4-6

Revision No. 0 vii January 1998
DEFINITIONS_____________________________________________________________
Term Definition____________________________________________________________________________________
Applicable or Relevant and Appropriate “Applicable” requirements are those clean-up standards ofRequirements (ARARs) control, and other substantive environmental protection
requirements, criteria, or limitations promulgated under federal orstate law that specifically address a hazardous substance,pollutant, contaminant, remedial action, location, or othercircumstance at a Comprehensive Environmental Response,Compensation, and Liability Act (CERCLA) site. “Relevant andappropriate” requirements are those clean-up standards which,while not “applicable” at a CERCLA site, address problems orsituations sufficiently similar to those encountered at theCERCLA site that their use is well-suited to the particular site.ARARs can be action-specific, location-specific, or chemical-specific.
CERCLIS 3 The newest version of the Comprehensive EnvironmentalResponse, Compensation, and Liability Information System,EPA’s primary Superfund database. CERCLIS 3 enablesSuperfund staff nationwide to share comprehensive and reliabledata across EPA and eventually with other federal partners andthe public.
Conceptual Site Model A “model” of a site developed at scoping using readily availableinformation. Used to identify all potential or suspected sourcesof contamination, types and concentrations of contaminantsdetected at the site, potentially contaminated media, and potentialexposure pathways, including receptors. This model is alsoknown as “conceptual evaluation model.”
Deterministic Analysis Calculation and expression of health risks as single numericalvalues or “single point” estimates of risk. In risk assessments, theuncertainty and variability are discussed in a qualitative manner.
EPA Risk Assessor The risk assessor responsible for reviewing the risk assessmenton behalf of EPA. The individual may be an EPA employee orcontractor, a State employee, or some other party, as appropriatefor an individual site.

DEFINITIONS (Continued)
_____________________________________________________________
Term Definition____________________________________________________________________________________
Revision No. 0 viii January 1998
Exposure Medium The contaminated environmental medium to which an individualis exposed. Includes the transfer of contaminants from onemedium to another.
Exposure Pathway The course a chemical takes from the source to the exposedindividual. An exposure pathway analysis links the sources,locations, and types of environmental releases with populationlocations and activity patterns to determine the significantpathways of human exposure.
Exposure Point An exact location of potential contact between a person and achemical within an exposure medium.
Exposure Point Concentration The value that represents a conservative estimate of the chemicalconcentration available from a particular medium or route ofexposure. See definitions for Medium EPC and Route EPC,which follow.
Exposure Route The way a chemical comes in contact with a person (e.g., byingestion, inhalation, dermal contact).
Interim Deliverables A series of Standard Tables, Worksheets, and SupportingInformation, identified in the Workplan for each site, that shouldbe developed by the risk assessment author, and evaluated by theEPA risk assessor, prior to development of the Draft BaselineRisk Assessment Report. After review and revision, as necessary,these documents should be included in the Baseline RiskAssessment Report. The Standard Tables should be prepared foreach site to achieve standardization in risk assessment reporting.The Worksheets and Supporting Information should also beprepared to further improve transparency, clarity, consistency,and reasonableness of risk assessments.
Medium The environmental substance (e.g, air, water, soil) originallycontaminated.
Medium EPC The EPC, based on either a statistical derivation of measured dataor modeled data. The Medium EPC differs from the Route EPCin that the Medium EPC does not consider the transfer ofcontaminants from one medium to another.

DEFINITIONS (Continued)
_____________________________________________________________
Term Definition____________________________________________________________________________________
Revision No. 0 ix January 1998
Preliminary Remediation Goals Initial clean-up goals that (1) are protective of human health and(PRGs) the environment and (2) comply with ARARs. They are
developed early in the remedy selection process based on readilyavailable information and are modified to reflect results of thebaseline risk assessment. They also are used during analysis ofremedial alternatives in the remedial investigation/feasibilitystudy (RI/FS).
Probabilistic Analysis Calculation and expression of health risks using multiple riskdescriptors to provide the likelihood of various risk levels.Probabilistic risk results approximate a full range of possibleoutcomes and the likelihood of each, which often is presented asa frequency distribution graph, thus allowing uncertainty orvariability to be expressed quantitatively.
Risk Assessment Author The risk assessor responsible for preparing the risk assessment.This individual may be an EPA employee or contractor, a Stateemployee, a PRP employee or contractor, or some other party, asappropriate for an individual site.
Receptor Age The description of the exposed individual as defined by the EPAregion or dictated by the site.
Receptor Population The exposed individual relative to the exposure pathwayconsidered.
Route EPC The EPC, based on either a statistical derivation of measured dataor based on modeled data, that was selected to represent theroute-specific concentration for the exposure calculations. TheRoute EPC differs from the Medium EPC in that the Route EPCmay consider the transfer of contaminants from one medium toanother, where applicable for a particular exposure route.
Scenario Timeframe The time period (current and/or future) being considered for theexposure pathway.

DEFINITIONS (Continued)
_____________________________________________________________
Term Definition____________________________________________________________________________________
Revision No. 0 x January 1998
Standard Tables One of the Standard Tools under the RAGS Part D approach. TheStandard Tables have been developed to clearly and consistentlydocument important parameters, data, calculations, andconclusions from all stages of human health risk assessmentdevelopment. Electronic templates for the Standard Tables havebeen developed in LOTUS® and EXCEL® for ease of use by riskassessors. For each site-specific risk assessment, the StandardTables, related Worksheets, and Supporting Information shouldfirst be prepared as Interim Deliverables for EPA risk assessorreview, and should later be included in the Draft and FinalBaseline Risk Assessment Reports. The Standard Tables may befound in Appendix A and on the electronic media provided withthis guidance document. Use of the Standard Tables willstandardize the reporting of human health risk assessments. TheStandard Table formats can not be altered (i.e., columns can notbe added, deleted, or changed); however, rows and footnotes canbe added as appropriate. Standardization of the Tables is neededto achieve Superfund program-wide reporting consistency and toaccomplish electronic data transfer to the Superfund database.
Standard Tools A basic element of the RAGS Part D approach. The StandardTools have been developed to standardize the planning, reporting,and review of Superfund risk assessments. The three StandardTools contained in the Part D approach include the TechnicalApproach for Risk Assessment (TARA), the Standard Tables,and Instructions for the Standard Tables.
Supporting Information Information submissions that substantiate or summarize detaileddata analysis, calculations, or modeling and associated parametersand assumptions. Examples of recommended SupportingInformation include: derivations of background values, exposurepoint concentrations, modeled intakes, and chemical-specificparameters. Supporting Information should be provided asInterim Deliverables for EPA risk assessor review prior to thedevelopment of the Draft Baseline Risk Assessment Report.

DEFINITIONS (Continued)
_____________________________________________________________
Term Definition____________________________________________________________________________________
Revision No. 0 xi January 1998
Technical Approach One of the Standard Tools under the RAGS Part D approach. Thefor Risk Assessment TARA is a road map for incorporating continuous involvement of(TARA) the EPA risk assessor throughout the CERCLA remedial process.
Risk-related activities, beginning with scoping and problemformulation, extending through collection and analysis of risk-related data, and supporting risk management decision makingand remedial design/remedial action issues are addressed. TheTARA should be customized for each site and the requirementsidentified should be included in project workplans so that riskassessment requirements and approaches are clearly defined.Chapters 2 through 5 of Part D present the TARA.
Worksheets Formats for documenting assumptions, input parameters, andconclusions regarding complex risk assessment issues. The DataUseability Worksheet (found in Exhibit 3-3) should be an InterimDeliverable for all sites. Worksheets addressing Lead andRadionuclides are under development and will be provided in arevision to RAGS Part D.

Revision No. 0 xii January 1998
ACRONYMS/ABBREVIATIONS______________________________________________________________________________
Acronym/Abbreviation Definition______________________________________________________________________________
ARARs Applicable or Relevant and Appropriate RequirementsBRAC Base Realignment and ClosureCERCLA Comprehensive Environmental Response Compensation and
Liability ActCERCLIS 3 Version 3 of Comprehensive Environmental Response
Compensation and Liability Information System (CERCLIS)
COPCs Chemicals of Potential ConcernCSF Cancer Slope Factor CT Central TendencyCWA Clean Water Act DQOs Data Quality ObjectivesEPA U.S. Environmental Protection AgencyEPC Exposure Point Concentration ESD Explanation of Significant DifferencesFS Feasibility StudyFY Fiscal YearGAO General Accounting OfficeHEAST Health Effects Assessment Summary TablesHI Hazard Index HQ Hazard QuotientIEUBK Integrated Exposure Uptake Biokinetic ModelIRIS Integrated Risk Information SystemMCLs Maximum Contaminant Levels NCEA National Center for Environmental AssessmentNCP National Contingency PlanNPL National Priority Listnon-TCL non-Target Compound ListOSWER Office of Solid Waste and Emergency ResponsePAHs Polynuclear Aromatic HydrocarbonsPCBs Polychlorinated BiphenylsPQLs Procedure Quantitation LimitsPRGs Preliminary Remediation GoalsPRP Potentially Responsible PartyQA/QC Quality Assurance/Quality ControlQAPP Quality Assurance Project PlanRAGS Risk Assessment Guidance for Superfund RAGS/HHEM Risk Assessment Guidance for Superfund: Volume I --
Human Health Evaluation ManualRAOs Remedial Action ObjectivesRfC Reference ConcentrationRfD Reference Dose RI/FS Remedial Investigation/Feasibility Study

Revision No. 0 xiii January 1998
ACRONYMS/ABBREVIATIONS (Continued)
______________________________________________________________________________
Acronym/Abbreviation Definition______________________________________________________________________________
RI Remedial Investigation RME Reasonable Maximum ExposureROD Record of DecisionRPM Remedial Project ManagerSAP Sampling and Analysis PlanSDWA Safe Drinking Water ActTARA Technical Approach for Risk AssessmentUCL Upper Confidence LevelUTL Upper Tolerance Limit

Revision No. 0 xiv January 1998
ACKNOWLEDGMENTS
This manual was developed by EPA’s Office of Emergency and Remedial Response. A large numberof EPA regional technical staff (see below) participated in the Workgroup that developed the RAGS Part Dapproach presented in this manual.
CDM Federal Programs Corporation provided technical assistance to EPA in the development of thismanual, under contract No. 68-W9-0056.
RAGS PART D WORKGROUP
EPA HEADQUARTERS
Office of Emergency and Remedial Response: James KonzDavid Bennett
EPA REGIONAL OFFICES
Region 1: Ann-Marie BurkeRegion 2: Marian OlsenRegion 3: Jennifer HubbardRegion 4: Glenn AdamsRegion 5: Andrew PodowskiRegion 6: Ghassan KhouryRegion 7: David CrawfordRegion 8: Chris WeisRegion 9: Stan SmuckerRegion 10: Dana Davoli

Revision No. 0 xv January 1998
PREFACE
Risk Assessment Guidance for Superfund: Volume I -- Human Health Evaluation Manual(RAGS/HHEM) Part D is the fourth part in the series of guidance manuals on Superfund human health riskassessment. Part A addresses the baseline risk assessment; Part B addresses the development of risk-basedpreliminary remediation goals; and Part C addresses the human health risk evaluations of remedial alternatives.Part D provides guidance on standardized risk assessment planning, reporting, and review throughout theCERCLA remedial process, from scoping through remedy selection and completion and periodic review of theremedial action. Thus, Part D strives for effective and efficient implementation of Superfund risk assessmentpractice described in Parts A, B, and C, and in supplemental Office of Solid Waste and Emergency Response(OSWER) directives. The potential users of Part D are persons involved in the risk evaluation, remedy selection,and implementation process, including risk assessors, risk assessment reviewers, remedial project managers, andother decision-makers.
This guidance does not discuss the standardization of ecological risk assessments, nor does it discussthe risk management decisions that are necessary at a CERCLA site (e.g., selection of final remediation goals).
This manual is being distributed as an interim document to allow for a period of field testing andevaluation. In addition, EPA is developing standardized approaches to plan, report and review:
• lead risks;• radionuclide risks; and• probabilistic analyses.
These will be issued as future revisions of RAGS Part D. In addition, EPA will provide standard tables forecological evaluation.
RAGS/HHEM will be revised in the future, and new documents in appropriate print and electronic formatwill be issued.
Comments addressing usefulness, changes, and additional areas where guidance is needed should beaddressed to the RAGS Part D website at http://www.epa.gov/superfund/oerr/techres/ragsd/ragsd.html, or to:
Senior Process Manager for Risk RAGS Part D U.S. Environmental Protection AgencyOffice of Emergency and Remedial Response (5202G)401 M Street, SWWashington, DC 20460

Revision No. 0 xvi January 1998

Revision No. 0 1-1 January 1998
CHAPTER 1
INTRODUCTION
This guidance has been developed by the U.S. • discusses process improvements expected as aEnvironmental Protection Agency (EPA) to assist result of Part D;remedial project managers (RPMs), risk assessors, • presents the organization of the remainder ofsite engineers, and others in standardizing risk this document; andassessment planning, reporting, and review at • describes where to find additional informationComprehensive Environmental Response regarding Part D.Compensation and Liability Act (CERCLA) sites.This guidance could also be a useful tool forquantitative risk assessment for non-NPL, BRAC,and Brownfields sites.
This guidance is the fourth part (Part D) in theseries Risk Assessment Guidance for Superfund:Volume I -- Human Health Evaluation Manual(RAGS/HHEM). Part A of this guidance describeshow to conduct a site-specific baseline riskassessment: the information in Part A is necessarybackground for Part D. Part B provides guidancefor calculating risk-based concentrations that maybe used, along with applicable or relevant andappropriate requirements (ARARs) and otherinformation, to develop preliminary remediationgoals (PRGs) during project scoping. PRGs (andfinal remediation levels set in the Record ofDecision [ROD]) can be used throughout theanalyses in Part C to assist in evaluating the humanhealth risks of remedial alternatives. Part Dcomplements the guidance provided in Parts A, B,and C and presents approaches to standardize riskassessment planning, reporting, and review. Part Dguidance spans the CERCLA remedial process fromproject scoping to periodic review of theimplemented remedial action. Exhibit 1-1 illustratesthe major correspondence of RAGS/HHEMactivities with the steps in the CERCLA remedialprocess.
The remainder of this chapter:
• presents an overview of Part D, including thebackground and elements of the Part Dapproach;
• describes the applicability of Part D;
1.1 OVERVIEW OF PART D
1.1.1 BACKGROUND
The March 21, 1995, memorandum on RiskCharacterization Policy and Guidance from EPAAdministrator Browner directed improvement in thetransparency, clarity, consistency, andreasonableness of risk assessments at EPA. EPA,over the years, has identified opportunities forimprovement in presentation of Superfund riskassessments. Furthermore, the General AccountingOffice (GAO), members of Congress, and othershave called for betterment of Superfund riskassessments. The October 1995 SuperfundAdministrative Reform #6A directed EPA to:Establish National Criteria to Plan, Report, andReview Superfund Risk Assessments. EPA hasdeveloped an approach to respond to thesechallenges, which is presented in RAGS Part D.
1.1.2 ELEMENTS OF PART D APPROACH
The Risk Assessment Guidance for Superfund(RAGS) Part D approach consists of three basicelements: Use of Standard Tools, ContinuousInvolvement of EPA Risk Assessors, and ElectronicData Transfer to a National Superfund Database.Brief descriptions of the three components follow:
• Use of Standard Tools - The Standard Toolsdeveloped by the EPA RAGS Part DWorkgroup and refined through regional reviewinclude a Technical Approach for RiskAssessment or TARA, Standard Tables, andInstructions for the Standard Tables.


Revision No. 0 1-3 January 1998
-- The Technical Approach for Risk -- Instructions for the Standard Tables haveAssessment (TARA) is a road map for been prepared corresponding to each rowincorporating continuous involvement of and column on each Standard Table.the EPA risk assessor throughout the Definitions of each field are supplied in theCERCLA remedial process for a particular Glossary and example data or selections forsite. Risk-related activities, beginning with individual data fields are provided. Thescoping and problem formulation, Instructions should be used to completeextending through collection and analysis and/or review Standard Tables for eachof risk-related data, and supporting risk site-specific human health risk assessment.management decision making and remedial The Instructions may be found in Appendixdesign/remedial action issues are B and on electronic media provided withaddressed. this document.
Chapters 2 through 5 of this guidancedocument present the TARA in the fourCERCLA remedial process phases: DuringScoping, During the RemedialInvestigation, During the Feasibility Study,and After the Feasibility Study. It isrecommended that the requirementsidentified in the TARA in Chapters 2through 5 be customized for each site-specific human health risk assessment, asappropriate. These requirements should beincluded in project workplans so that riskassessment requirements are clearly definedand standardized planning will occur.
-- The Standard Tables have been developedto clearly and consistently documentimportant parameters, data, calculations,and conclusions from all stages of humanhealth risk assessment development. Electronic templates for the StandardTables have been developed in LOTUS®and EXCEL® for ease of use by riskassessors. For each site-specific riskassessment, the Standard Tables, relatedWorksheets, and Supporting Informationshould first be prepared as InterimDeliverables for EPA risk assessor review,and should later be included in the Draftand Final Baseline Risk AssessmentReports. The Standard Tables may befound in Appendix A and on electronicmedia provided with this guidancedocument. Use of the Standard Tables willstandardize the reporting of human healthrisk assessments.
• Continuous Involvement of EPA RiskAssessors - The EPA risk assessor is a criticalparticipant in the CERCLA remedial processfor any site, from scoping through completionand periodic review of the remedial action.EPA risk assessors support reasonable andconsistent risk analysis and risk-based decisionmaking. Early and continuous involvement bythe EPA risk assessors should include scoping,workplan review, and customization of theTARA for each site to identify all risk-relatedrequirements. The EPA risk assessors willreview Interim Deliverables and identifycorrections needed prior to preparation of theDraft and Final Baseline Risk AssessmentReports. Participation of the EPA risk assessorsin all other phases of the CERCLA remedialprocess will ensure human health risk issues areappropriately incorporated in the remedyselection and implementation processes.
• Electronic Data Transfer to a NationalSuperfund Database - Summary-level site-specific risk information will be stored in aNational Superfund database (i.e., CERCLIS 3)to provide data access and data managementcapabilities to all EPA staff. The CERCLIS 3risk-related summary data represent a subset ofthe data presented in the Standard Tables. Theelectronic versions of the Standard Tables(LOTUS® and EXCEL®) are structured to becompatible with CERCLIS 3. Translationsoftware is under development to transfer datafrom the Standard Tables to CERCLIS 3, andno additional data entry should be required inthe regions to fulfill the CERCLIS 3 risk datarequirements.

Revision No. 0 1-4 January 1998
1.2 APPLICABILITY OF PART DAPPROACH
The approach contained in RAGS Part D isrecommended for all risk assessments commencingafter the issuance of Part D. The use of Part D isalso encouraged in on-going risk assessments to theextent it can efficiently be incorporated into the riskassessment process. Part D is not applicable tocompleted risk assessments.
Exhibit 1-2 provides guidelines regardingRAGS Part D applicability as a function of site leadand site type, so that site-specific applicability maybe defined by each region.
1.3 PROCESS IMPROVEMENTS RESULTING FROM PART D
APPROACH
The RAGS Part D approach provides numerousadvantages over current practices in the Superfundprogram at both the site level and the overallSuperfund program level. Several of theseadvantages are discussed in Exhibit 1-3.
A brief discussion of the process improvementsassociated with each RAGS Part D element follows:
• Use of Standard Tools - Standard Tools willfacilitate planning with TARA, reporting withStandard Table formats, and reviewing withInterim Deliverables. The Standard Tools willprovide consistent content and clarity of data,parameters, and assumptions. Transparency forthe public and others to understand the riskassessment will be improved by the StandardTables, and review will be facilitated becausethe basis for conclusions will be clear. BecauseInterim Deliverables are integral parts of thebaseline risk assessment, their early review andresolution by EPA risk assessors will minimizerework and may reduce project schedules andbudgets, while improving consistency.
• Continuous Involvement of EPA RiskAssessor - Involvement of the EPA riskassessor throughout the CERCLA remedialprocess will result in holistic consideration ofrisk issues during scoping and will ensure thatappropriate and adequate data are collected.Planning for special evaluations can also beconducted efficiently at project inception ratherthan at a later point with associated scheduledelays and additional costs. Ongoing review ofInterim Deliverables by the EPA risk assessorwill provide direction regarding reasonableassumptions and eliminate reworkrequirements, particularly for those deliverablesthat build on previous analyses (e.g., theBaseline Risk Assessment Report).
At later stages of the project (e.g., after thefeasibility study), continuous involvement ofthe EPA risk assessor will promotereasonableness and consistency in riskmanagement decision-making by clearlyproviding risk managers with the informationthey need.
• Electronic Data Transfer to NationalSuperfund Database - Through submission ofelectronic Standard Tables, CERCLIS 3 riskdata reporting requirements will be metelectronically. Additional data entry should notbe required by EPA or contractor risk assessors.Submission of the risk data to CERCLIS 3 willalso fulfill the review objectives of SuperfundAdministrative Reform #6A by providing riskdata access to EPA and the public. Use of thedata by EPA risk assessors will improveconsistency in future risk assessments.
1.4 ORGANIZATION OFDOCUMENT
The remainder of this guidance is organized intofour additional chapters and three appendices asfollows:
• Chapter 2: Risk Considerations During ProjectScoping;

EXHIBIT 1- 2 GUIDELINES FOR PART D APPLICABILITY
SITE LEAD PART D APPLICABLE
Fund Lead T
Federal Facility Lead T
PRP Lead T
State Lead T
SITE TYPE1
Remedial: Scoping, RI/FS, Risk Assessment, Proposed Plan, ROD, RD/RA, Presumptive Remedy
T
Post-Remedial: ESD, Amended ROD, Five-Year Review
T
Removal: Non-time Critical, Time-Critical, Streamlined
--2
SACM3 T
RCRA Corrective Action4 --2
Notes: 1 The RAGS Part D Workgroup also suggests that RAGS Part D could be a useful tool for quantitative risk assessment for non-NPL, BRAC, and
Brownfields sites and encourages its use. 2 RAGS Part D use is encouraged as appropriate. 3 Superfund Accelerated Cleanup Model. 4 As described in the September 1996 EPA memorandum on Coordination Between Resource Conservation and Recovery Act (RCRA)
Corrective Action and Closure and CERCLA Site Activities, EPA is “...committed to the principle of parity between the RCRA corrective action and CERCLA programs...”.
1-5 December 2001


Revision No. 0 1-7 January 1998
• Chapter 3: Risk Assessment Data Needs and the document has been specifically designed toTasks During the Remedial Investigation; conveniently accommodate revisions.
• Chapter 4 Risk Evaluations During the Feasibility Study; A RAGS Part D mailing list will be compiled
• Chapter 5: Risk Evaluations After the for all interested users. Please complete and mailFeasibility Study; the card at the back of the Part D package to register
• Appendix A: Standard Tables for the Part D mailing list for automatic notification• Appendix B: Instructions for Completion of of availability of future updates.
Standard Tables• Appendix C: Data Useability Worksheet. In addition to the guidance document, the Part
In addition, other useful information has been accessed electronically on the RAGS Part Dpresented in highlight boxes placed throughout the website, at http://www.epa.gov/superfund/oerr/document. techres/ragsd/ragsd.html. Updates to Part D will
Exhibit 1-4 depicts the continuous involvement the current version of each Chapter or Appendix.of the EPA risk assessor during scoping, during theremedial investigation, and during and after the Questions or comments regarding Part D usagefeasibility study. The various activities the risk should be directed to your EPA regional riskassessor conducts are listed, as well as the Part D assessor or to the EPA RAGS Part D Workgroupchapter that addresses that phase. through the RAGS Part D website. Questions or
1.5 ADDITIONAL INFORMATION
This guidance will be updated periodically inresponse to user comments and suggestions and toaddress new human health risk assessment guidanceas appropriate. The loose-leaf format of
D guidance and corresponding information may be
also appear on the website along with an index of
comments received through the website will beconsidered by the Workgroup and a response will bedeveloped and forwarded via telephone or email asappropriate. Frequently asked questions will beassembled and displayed on the website withcorresponding responses to provide Part D usersupport.


Revision No. 0 2-1 January 1998
WHEN PREPARING THE SITE CONCEPTUALMODEL, CONSIDER THE FOLLOWING:
- sensitive populations, including but not limitedto the elderly, pregnant or nursing women,infants and children, and people suffering fromchronic illnesses
- people exposed to particularly high levels ofcontaminants
- circumstances where a disadvantaged populationis exposed to hazardous materials (i.e.,Environmental Justice situations)
- significant contamination sources
- potential contaminant release mechanisms (e.g.,volatilization, fugitive dust emission, surfacerunoff/overland flow, leaching to groundwater,tracking by humans/animals, soil gas generation,biodegradation and radioactive decay)
- contaminant transport pathways such as directair transport downwind, diffusion in surfacewater, surface water flow, groundwater flow, soilgas migration, and biomagnification in the foodchain
- cross media transfer effects, such asvolatilization to air, wet deposition, drydeposition, groundwater discharge to surfacewater, groundwater recharge from surface water,and bioaccumulation by aquatic species.
CHAPTER 2
RISK CONSIDERATIONS DURING PROJECT SCOPING
The project scoping stage of the remedialinvestigation (RI) and baseline risk assessment iscritical to the success of a Superfund project. TheEPA risk assessor should be involved in the projectscoping discussions and meetings to ensure that theplanning and workplan development tasksincorporate risk assessment data needs and achievestandardization in risk assessment planning.
2.1 PLANNING
The following planning activities should beperformed at the beginning of the project. Theseactivities should involve the EPA remedial projectmanager and EPA risk assessor, as decision-makers,and the risk assessment author and other resourcestasked with preparing the Remedial InvestigationReport, to support planning. Pertinent informationshould be incorporated, as appropriate, into theRemedial Investigation Report or SiteCharacterization Report and the Baseline RiskAssessment Report:
• Provide site background information, site maps,sample location map; discuss historical siteactivity and chronology of land use.
• Discuss historical data and data useability,previous studies and actions, and an overviewof the nature and extent of contamination.
• Discuss the purpose of the investigation.
• Prepare the preliminary site conceptual modelwhich clearly identifies all potential sources ofcontamination (soil, groundwater, surfacewater, leachate, air, etc.), release mechanisms,and receptor routes and identifies all potentialpathways (including secondary pathways) andthe media and receptors associated with each.
• Discuss PRGs and ARARs for the site.
• Involve the risk assessor in discussions with thestakeholders concerning land use, groundwateruse, and exposure pathways and variables. Ifpossible, the risk assessor should also visit thesite.
• Identify deliverables (Interim, Draft, and Final)for the risk assessment. Interim Deliverables

Revision No. 0 2-2 January 1998
should include: Standard Tables 1 through 10;Worksheets on Data Useability, Lead, andRadionuclides (as applicable); SupportingInformation as described in Chapter 3.1.1, the The RI/FS Workplan summarizes siteAssessment of Confidence and Uncertainty, and background, the current and potential problemsProbabilistic Analysis information. Draft and posed by site contaminants, and the objectives andFinal Deliverables include the Draft and Final scope of the RI/FS. It also includes a description ofBaseline Risk Assessment Reports, which also the tasks to be performed and the information andincorporate the Interim Deliverables. work products that will be produced from each task.
• Prepare a preliminary version of Standard Table and deliverables for the baseline risk assessment1. may be included as a part of the RI/FS Workplan or
• During project scoping the EPA remedialproject manager and EPA risk assessor should Within these Workplans, it should be clear thatalso meet to discuss the potential need for risk assessment needs are being considered in theincluding a Probabilistic Analysis in the RI. RI/FS objectives. The site-specific objectives andConsider the following: extent of siteremediation, potential costs of remediation, the Workplan. This includes information needed todegree of uncertainty associated with the complete the baseline risk assessment in the RI asexposure information available for each portion well as information needed for the FS, such as thatof the site conceptual model, value added in the needed to develop risk-based remedial goals (e.g.,decision-making process, etc. This preliminary PRGs), and to assess risks from remediation (e.g.,discussion is necessary to determine whether incineration).funds should be allocated to carry out aProbabilistic Analysis. This decision should be These Workplans should also reference therevisited throughout Workplan developmentand the risk assessment process.
2.2 WORKPLAN DEVELOPMENT
Tasks to be conducted during the remedialinvestigation/feasibility study (RI/FS) are identifiedand documented in several workplans. Theseusually include the RI/FS Workplan, a Samplingand Analysis Plan (SAP), and a Quality AssuranceProject Plan (QAPP). Tasks related to developmentof the baseline risk assessment are sometimespresented in a separate Risk Assessment Workplanor incorporated into the RI/FS Workplan.
Risk assessment needs should be considered notonly in tasks related to development of the baselinerisk assessment but also in tasks related to samplingand analysis (i.e., those in the SAP and
the QAPP) in the RI and tasks needing riskassessment input in the feasibility study (FS) (e.g.,development of remedial goals and estimates ofpotential risk from remediation options).
2.2.1 RI/FS WORKPLAN/BASELINE RISK ASSESSMENT WORKPLAN
Deliverables for specific tasks are included. Tasks
in a separate Risk Assessment Workplan.
scope of the risk assessment should be included in
methods (e.g., National guidance such asRAGS/HHEM), that will be used to prepare theInterim, Draft, and Final risk assessmentdeliverables and define the schedule for submission.These deliverables are described in more detail inChapter 3. Deliverables related to development ofrisk-based remedial goals and assessment of riskfrom remediation should also be included in theWorkplan (see Chapter 4).
The EPA risk assessor and EPA remedialproject manager should revisit the question of thepotential value added by using ProbabilisticAnalyses in the risk assessment. If these analysesare to be used, the issues concerning the time,expense, and possible benefit associated with thecollection of additional exposure information orsampling data should be considered to identify
those exposure parameters with the greatestuncertainty where collection of additional dataand/or information may be warranted.
2.2.2 SAP AND QAPP

Revision No. 0 2-3 January 1998
WHEN DEVELOPING THE SAP, CONSIDERTHE FOLLOWING:
• How will data from multiple groundwater wellscollected over time be used to calculateexposure?
• At what depths will soil samples be taken andhow will they be combined to describe exposuresfor different scenarios (e.g., industrial versusresidential) or to characterize hotspots?
• What type of sampling design (e.g., randomversus purposive) will be used?
• Are SAPs adequate to distinguish sitecontamination from background contaminationfor each medium and for organic and inorganicparameters?
Sampling and analysis activities undertaken values of the risk-based PRGs calculated duringduring the RI should provide adequate data to scoping, detection limits may need to be lower thanevaluate all appropriate exposure pathways. those obtained by the standard Superfund methods.Therefore, risk assessors should be involved in the The adequacy of detection limits for conducting thedevelopment of the data quality objectives (DQOs) baseline risk assessment and for comparing to PRGsfor sampling and analysis and in selecting the types should be evaluated in the Workplan (QAPP). Forof sampling and analyses that will be done. The example, a table listing expected contaminants andDQOs should address the qualitative and comparing the method detection limit orquantitative nature of the sampling data in terms of quantitation limit for each compound with therelative quality and intent for use, to ensure that the appropriate risk-based goal for that chemical coulddata collected will be appropriate for the intended be presented. This information along with issues ofobjectives. cost and other data uses should affect the methods
Sampling. The SAP should discuss how thetypes, numbers, and locations of samples to becollected will be adequate to evaluate each exposurepathway (both current and future) and medium. TheSAP should be accompanied by detailed samplingmaps showing the location and type of samples(e.g., grab, composite, or duplicate). It is importantto consider how sample results will be used toestimate exposure point concentrations.Background samples should be collected fromappropriate areas (e.g., areas proximate to the site,free of potential contamination by site chemicalsand similar to the site in topography, geology,meteorology, and other characteristics).
If models will be used to evaluate exposurepathways and estimate exposure pointconcentrations, these models should be identified inthe Workplan. Site-specific data collection neededfor these models should also be discussed.
Analysis. Development of the DQOs foranalysis should not be limited to concern for theprecision, accuracy, representativeness,completeness, and comparability of the data. DQOsthat are important for risk assessment shouldconsider: types of laboratory analyses used,sensitivity of detection limits of the analyticaltechniques (especially for non-Target CompoundList [non-TCL] chemicals and non-standardmatrices), resulting data quality, and theemployment of adequate quality assurance/qualitycontrol (QA/QC) measures.
In some cases, risk assessment data needs maybe best supported by additional chemicals, differentanalytical methods, and/or lower detection limitsthan are being used for the RI. Based upon the
and detection limits finally selected.
Analytical data should be evaluated andreviewed in accordance with the criteria to evaluatedata (i.e., the National Functional Guidelines). Alsorefer to your regional office for guidance on datavalidation and/or chemical-specific guidance, asapplicable.
The Workplan should also discuss how splitsamples, duplicates, blanks (trip, field, andlaboratory), and qualified and rejected data will beused in assessing site risks. The Workplan shoulddescribe the analysis for each medium and how thetypes of analyses were selected based on sitehistory.

Revision No. 0 2-4 January 1998

Revision No. 0 3-1 January 1998
CHAPTER 3
RISK ASSESSMENT DATA NEEDS AND TASKS
DURING THE REMEDIAL INVESTIGATION
Project Management Guidelines. Remedialproject managers will establish the schedule ofsubmission for the deliverables for the RI Reports andBaseline Risk Assessment Reports. The schedulemay vary from site to site, as appropriate. Interested Risk Assessment Guidelines. The riskparties (States, Commonwealths, tribes and other assessment should be conducted in accordance withstakeholders) may be involved in the scheduling and all appropriate guidance and policies. Consult withreview process, as appropriate. Refer to your your EPA regional risk assessor regarding the mostregional office for guidance regarding the order of the appropriate guidance.deliverables. These deliverables should also bedefined in the Workplan. Interim Deliverables should be prepared as
General RI Guidelines. RI guidance should befollowed in performing the remedial investigation.The following items are of particular importance torisk assessments. If the risk assessment is beingprepared as a stand-alone document, the followingitems should be included. If, instead, the riskassessment is a section of the RI Report, the itemswhich follow should be addressed in the RI Reportand clearly referenced in the Baseline RiskAssessment Report.
• Present a general map of the site depictingboundaries and surface topography, whichillustrates site features, such as fences, ponds,structures, as well as geographical relationshipsbetween potential receptors and the site.
• Discuss historical site activity. 3.1 INTERIM DELIVERABLES• Discuss chronology of land use (specify
agriculture, industry, recreation, wastedeposition, and residential development at thesite).
• Present an overview of the nature and extent ofcontamination, including when samples werecollected and the kinds of contaminants andmedia potentially contaminated.
• Describe the analytical and data validationmethods used.
• If modeling was used to estimate exposure pointconcentrations, document the parameters related
to soil/sediment, hydrogeology, hydrology, andmeteorology either in the risk assessment or theRI Report.
described in Chapter 3.1.1 and should ultimately beincorporated into the Baseline Risk AssessmentReport. The Interim Deliverables prepared by therisk assessment author should be reviewed by theEPA risk assessor prior to submission of the BaselineRisk Assessment Report. Hazard identification andexposure parameters, among others, may requirediscussion, refinement, and revision. Review andmodification of Interim Deliverables will greatlyreduce the Baseline Risk Assessment Reportpreparation and review time. Discussions of the threecategories of risk assessment deliverables (InterimDeliverables, Draft Baseline Risk AssessmentReport, and Final Baseline Risk Assessment Report)follow. Transfer of risk assessment data to theCERCLIS 3 database is also addressed.
This section presents an outline of the StandardTables, Worksheets, and Supporting Information thatshould be prepared as Interim Deliverables for eachsite. The Workplan discussed in Chapter 2.2.1 shouldalso describe the Standard Tables, Worksheets, andSupporting Information for a particular site. Exhibit 3-1 presents a list of the InterimDeliverables. Use of these deliverables for each siteshould improve standardization in risk assessmentreporting by improving the transparency, clarity,consistency, and reasonableness of risk assessments.

Revision No. 0 3-2 January 1998
3.1.1 STANDARD TABLES,WORKSHEETS, AND SUPPORTINGINFORMATION
Standardized reporting of Superfund human reasonableness.health risk assessments will be achieved through thepreparation of Standard Tables, Worksheets, and The Standard Tables and Worksheets documentSupporting Information. These documents should be the majority of the data and assumptions used toprepared as Interim Deliverables and reviewed by the evaluate risk, as well as the risks and hazardsEPA risk assessor prior to preparation of the Baseline calculated. In most cases, other data and rationale areRisk Assessment Report. After review and revision, used to support the information presented in theas necessary, these documents should be included in Standard Tables. This additional Supportingthe Baseline Risk Assessment Report. Information should also be provided to the EPA risk
This section describes the ten Standard Table incorporated in the Baseline Risk Assessment Report.formats for use in all future risk assessments. TheStandard Table formats can not be altered (i.e., Descriptions of the Standard Tables, Worksheets,columns can not be added, deleted, or changed); and Supporting Information follow:however, rows and footnotes can be added asappropriate. Standardization of the Tables is neededto achieve Superfund program-wide reportingconsistency and to accomplish electronic data transferto the Superfund database. Note that multipleversions of some Standard Tables may be needed toaddress different Media, different ExposurePathways, or different Exposures (i.e., reasonablemaximum exposure [RME] versus central tendency[CT]). Exhibit 3-2 summarizes the relationshipbetween five traditional risk assessment activities andthe corresponding Standard Tables that standardizerisk assessment reporting. The five risk assessmentactivities follow:
• Data collection• Data evaluation• Exposure assessment• Toxicity assessment• Risk characterization.
Copies of the blank Standard Tables areprovided in both LOTUS® and Excel® spreadsheetformats on the electronic media enclosed with Part Dguidance. Blank Standard Table templates andcompleted examples of typical Standard Tables are provided in Appendix A.Detailed Instructions for the completion of theStandard Tables are provided in Appendix B.
In addition to the Standard Tables, a DataUseability Worksheet is provided in Exhibit 3-3 inthis chapter, as well as in Appendix C and on the
electronic media. Worksheets to document Lead andRadionuclide risk calculations are under developmentand will be provided in a future update to Part D. Use of the Worksheets is strongly encouraged toimprove transparency, clarity, consistency, and
assessor as an Interim Deliverable and later
STANDARD TABLE 1: Selection ofExposure Pathways. The purposes of StandardTable 1 are:
• To assist in project planning• To accompany the site conceptual model• To present possible Receptors, Exposure Routes,
and Exposure Pathways • To present the rationale for selection or exclusion
of each Exposure Pathway• To communicate risk information to interested
parties outside EPA.
The information documented in Standard Table1 includes:
• Exposure Pathways that were examined andexcluded from analysis
• Exposure Pathways that will be evaluatedqualitatively or quantitatively in the riskassessment.
The data elements presented in Standard Table1 are listed in the Standard Table 1 highlight box.
Perform the following steps associated with thepreparation of Standard Table 1:
1. Refine site conceptual model which identifies allpotential sources of contamination, all potentialExposure Pathways, the Medium associated with

Revision No. 0 3-3 January 1998
DATA ELEMENTS IN STANDARD TABLE 1
Provide the following information: ScenarioTimeframe, Medium, Exposure Medium, ExposurePoint, Receptor Population, Receptor Age, ExposureRoute, On-site/Off-site, Type of Analysis, Rationalefor Selection or Exclusion of Exposure Pathway.
DATA ELEMENTS IN STANDARD TABLE 2
For each unique combination of Scenario Timeframe,Medium, Exposure Medium, and Exposure Point,provide the following information: CAS Number,Chemical, Minimum Concentration, MinimumQualifier, Maximum Concentration, MaximumQualifier, Units, Location of MaximumConcentration, Detection Frequency, Range ofDetection Limits, Concentration Used for Screening,Background Value, Screening Toxicity Value,Potential ARAR/TBC Value, Potential ARAR/TBCSource, COPC Flag, Rationale for ContaminantDeletion or Selection.
each, and the potentially exposed populations(Receptors).
2. Select realistic Exposure Pathways for detailedanalyses.
3. Include rationale for exclusion of potentialExposure Pathways.
4. Modify Standard Table 1, if necessary.
5. Standard Table 1 should later be incorporatedin the Baseline Risk Assessment Report.
DATA USEABILITY WORKSHEET. Dataquality is an important component of the riskassessment and the evaluation of data quality shouldbe documented. The Data Useability Worksheet isincluded to address this need.
The EPA risk assessor and the EPA documentGuidance for Data Useability in Risk Assessment(Part A, EPA 1990a), should be consulted beforecompleting the Data Useability Worksheet. ThisWorksheet should be prepared as soon as all datavalidation reports have been completed for eachmedium. A media-specific Data UseabilityWorksheet should be completed only after the projectteam (i.e., lead chemist, lead hydrogeologist, riskassessor, etc.) has collectively discussed the datauseability criteria. The Worksheet should be used torecord and identify the impact of data quality issuesas they relate to data useability. For example,deviations from approved site Workplans whichoccurred during sample collection, laboratoryanalysis, or data review should be assessed. Alsorefer to your regional office for guidance on datavalidation when preparing the Worksheet.
• Complete the Data Useability Worksheet foreach Medium prior to screening of chemicals ofpotential concern (COPCs).
• The Data Useability Worksheet should later beincorporated in the Baseline Risk AssessmentReport.
STANDARD TABLE 2: Occurrence,Distribution, and Selection of COPCs. Thepurposes of Standard Table 2 are:
• To provide information useful for data evaluationof chemicals detected
• To provide adequate information so theuser/reviewer gets a sense of the chemicalsdetected at the site and the potential magnitude ofthe potential problems at the site
• To provide chemical screening data and rationalefor selection of COPCs.
The information documented in Standard Table2 includes:
• Statistical information about chemicals detectedin each Medium
• The detection limits of chemicals analyzed • The toxicity screening values for COPC selection• The chemicals selected and deleted as COPCs.
The data elements presented in Standard Table2 are listed in the Standard Table 2 highlight box.
Perform the following steps associated with thepreparation of Standard Table 2. Refer to theregional office for guidance when performing thesesteps.
1. Discuss selection criteria for COPCs; includingtoxicity screening values, frequency of

Revision No. 0 3-4 January 1998
DATA ELEMENTS IN STANDARD TABLE 3
For each unique combination of Scenario Timeframe,Medium, Exposure Medium, and Exposure Point,provide the following information: Chemical ofPotential Concern, Units, Arithmetic Mean, 95%upper confidence level (UCL) of Normal Data,Maximum Detected Concentration, MaximumQualifier, EPC Units, Reasonable MaximumExposure (Medium EPC Value, Medium EPCStatistic, and Medium EPC Rationale), and CentralTendency (Medium EPC Value, Medium EPCStatistic, and Medium EPC Rationale).
detection, and background comparison. detected in each medium
2. Perform screening; select COPCs that will be EPC selectedcarried into the risk assessment (include • The statistics which were used to make thecomparison to regulatory standards and criteria determinations as well as the rationale for thewhere appropriate). selection of the statistics for each chemical (i.e.,
3. Use background information to determine or approach for modeled data). COPCs, as appropriate.
4. Submit Supporting Information tosubstantiate the available Background valueshown for each chemical in Standard Table2 and to enable verification of those values byEPA. The format of the summary will bedetermined by each region. The SupportingInformation should provide relevantinformation for each chemical used to determinethe background concentration, including (butnot limited to) average, maximum, hypothesistesting of equality of the mean, upper tolerancelimit (UTL) derivation, and other informationthat may be required to fully describe thebackground selection process.
5. The Background Supporting Information shouldlater be incorporated in the Baseline RiskAssessment Report.
6. Complete Standard Table 2 for each preparation of Standard Table 3.combination of Scenario Timeframe, Medium,Exposure Medium, and Exposure Point. 1. Discuss how samples will be grouped (e.g., how
7. Standard Table 2 should later be incorporatedin the Baseline Risk Assessment Report.
STANDARD TABLE 3: Medium-SpecificExposure Point Concentration (EPC) Summary.The purposes of Standard Table 3 are: • To provide the reasonable maximum and
central tendency medium-specific EPCs formeasured and modeled values
• To provide statistical information on thederivation of the EPCs.
The information documented in StandardTable 3 includes:
• Statistical information which was used tocalculate the Medium EPCs for chemicals
• The RME Medium EPC and the CT Medium
discuss statistical derivation of measured data
The data elements presented in Standard Table3 are listed in the Standard Table 3 highlight box.
Perform the following steps associated with the
hot spots in soil will be considered; howgroundwater data will be combined; howtemporal and chemical phases will beaddressed; how upgradient, downgradient, andcross gradient samples will be addressed).
2. Discuss approach to determine how data arenormally or log-normally distributed.
3. Discuss evaluation of lead, total chromium andany other special chemicals.
4. Submit Supporting Information to documentthe EPC summary presented in StandardTable 3 and to enable verification of thosevalues by EPA. The format of the summarywill be determined by each region. TheSupporting Information should discuss media-specific EPCs statistically derived from

Revision No. 0 3-5 January 1998
DATA ELEMENTS IN STANDARD TABLE 4
For each unique combination of Scenario Timeframe,Medium, Exposure Medium, Exposure Point,Receptor Population, and Receptor Age, provide thefollowing information: Exposure Route, ParameterCode, Parameter Definition, Units, RME Value,RME Rationale/Reference, CT Value, CTRationale/Reference, and Intake Equation/ModelName.
measured data, including identification of thesamples used in each calculation, results ofdistribution testing (Wilk-Shapiro,D’Agostino), mean (transformed ifappropriate), maximum (transformed ifappropriate), standard deviation (transformed ifappropriate), t- or H-statistic, 95% UCL(including non-parametric methods, whereapplicable), and other protocols as required.The Supporting Information should also presentinformation for route-specific EPCs, includingderivation of modeled values, assumptions andvalues used, statistical derivation of measuredvalues and associated calculations, and otherprotocols as required. These route-specificEPCs should be presented in Standard Table 7.
5. The EPC Supporting Information shouldlater be incorporated in the Baseline RiskAssessment Report.
6. Complete Standard Table 3 for eachcombination of Scenario Timeframe, Medium,Exposure Medium, and Exposure Point.
7. Standard Table 3 should later be incorporatedin the Baseline Risk Assessment Report.
STANDARD TABLE 4: Values Used for variability and complexity associated withDaily Intake Calculations. The purposes of different models. Standard Table 4 are:
• To provide the exposure parameters used for should later be incorporated in the BaselineRME and CT intake calculations for each Risk Assessment Report.Exposure Pathway (Scenario Timeframe, Medium, Exposure Medium, Exposure Point,Receptor Population, Receptor Age, andExposure Route)
• To provide the intake equations or models usedfor each Exposure Route/Pathway.
The information documented in StandardTable 4 includes: hazards, but are not included on Standard
• Values used for each intake equation for each determined by each region. The values andExposure Pathway and the reference/rationale constants that are used to calculate risk andfor each hazards, including molecular weight, vapor
• Intake equation or model used to calculate the pressure, K , K , dermal permeability con-intake for each Exposure Pathway. stant, Henry’s Law constant, and other
The data elements presented in Standard Table
4 are listed in the Standard Table 4 highlight box.
Perform the following steps associated with thepreparation of Standard Table 4. 1. Provide references for all exposure parameters.
2. Submit Supporting Information tosummarize the Modeled Intake Methodologyand Parameters used to calculate modeledintake values and to enable verification ofthose values by EPA. The SupportingInformation should be limited to summary levelinformation. The format of the summaryshould be structured to accommodate the
3. The Modeled Intake Supporting Information
4. Submit Supporting Information onChemical-Specific Parameters, which applyto all Standard Tables to be completed for therisk assessment and to enable verification ofthose values by EPA. The summary shouldidentify and display chemical parameters andconstants that are used to calculate risks and
Tables. The format of the summary will be
oc ow
information that the reader would find usefulfor understanding the risk assessment

Revision No. 0 3-6 January 1998
DATA ELEMENTS INSTANDARD TABLE 5.1
Provide the following information: Chemical ofPotential Concern, Chronic/Subchronic, OralRfD Value, Oral RfD Units, Oral to DermalAdjustment Factor, Adjusted Dermal RfD, Units,Primary Target Organ, CombinedUncertainty/Modifying Factors, Sources ofRfD:Target Organ, and Dates of RfD:Target Organ.
DATA ELEMENTS IN STANDARD TABLE 5.2
Provide the following information: Chemical ofPotential Concern, Chronic/Subchronic, ValueInhalation RfC, Units, Adjusted Inhalation RfD,Units, Primary Target Organ, CombinedUncertainty/Modifying Factors, Sources ofRfC:RfD:Target Organ, and Dates.
DATA ELEMENTS IN STANDARD TABLE 5.3
Provide the following information: Chemical ofPotential Concern, Chronic/Subchronic, Value, Units,Primary Target Organ, CombinedUncertainty/Modifying Factors, Sources ofToxicity:Primary Target Organ, and Date.
discussion should be included.
5. The Chemical-Specific ParameterSupporting Information summary should laterbe incorporated into the Baseline RiskAssessment Report.
6. Complete Standard Table 4 for eachcombination of Scenario Timeframe, Medium,Exposure Medium, Exposure Point, ReceptorPopulation, and Receptor Age.
7. Standard Table 4 should later be incorporatedinto the Baseline Risk Assessment Report.
STANDARD TABLES 5 AND 6: Non-Cancer and Cancer Toxicity Data. The purposesof Standard Tables 5.1, 5.2, and 5.3 are:
• To provide information on reference doses(RfDs) target organs, and adjustment factorsfor chemicals
• To provide oral to dermal adjustment factors • To verify references for non-cancer toxicity data• To provide non-cancer toxicity information for
“special-case” chemicals.
The information documented in StandardTables 5.1, 5.2, and 5.3 includes:
• The RfDs for each of the COPCs, as well asmodifying factors and reference concentration(RfC) to RfD adjustments
• The organ effects of each of the COPCs• References for RfCs and organ effects.
The data elements presented in StandardTables 5.1, 5.2, and 5.3 are listed in the StandardTables 5.1, 5.2, and 5.3 highlight box.
The purposes of Standard Tables 6.1, 6.2, and 6.3are:
• To provide the oral, dermal, and inhalationcancer toxicity information (values and sourcesof information) for chemicals of potentialconcern
• To provide the methodology and adjustmentfactors used to convert oral cancer toxicityvalues to dermal toxicity values and to convert
inhalation unit risks to inhalation cancer slopefactors
• To provide weight of evidence/cancer guidelinedescriptions for each chemical of potentialconcern
• To provide cancer toxicity information for“special case” chemicals.
The information documented in StandardTables 6.1, 6.2, and 6.3 includes:
• Oral, dermal, and inhalation toxicity values forchemicals of potential concern
• Weight of evidence/cancer guidelinesdescriptions for chemicals of potential concern
• The source/reference for each toxicity value.
The data elements presented in StandardTables 6.1, 6.2, and 6.3 are listed in the StandardTables 6.1, 6.2, and 6.3 highlight box.

Revision No. 0 3-7 January 1998
DATA ELEMENTS IN STANDARD TABLE 6.1
Provide the following information: Chemical ofPotential Concern, Oral Cancer Slope Factor, Oral toDermal Adjustment Factor, Adjusted Dermal CancerSlope Factor, Units, Weight of Evidence/CancerGuideline Description, Source, and Date.
DATA ELEMENTS IN STANDARD TABLE 6.2
Provide the following information: Chemical ofPotential Concern, Unit Risk, Units, Adjustment,Inhalation Cancer Slope Factor, Units, Weight ofEvidence/Cancer Guideline Description, Source, andDate.
DATA ELEMENTS IN STANDARD TABLE 6.3
Provide the following information: Chemical ofPotential Concern, Value, Units, Source, and Dates.
Perform the following steps associated with thepreparation of Standard Tables 5 and 6.
1. Ensure that chronic and subchronic toxicity instructions for lead and radionuclides.values are applied correctly based on theduration of exposure. Provide rationale forselection of surrogate toxicity values not inIRIS or HEAST, or provided by NCEA.
2. Submit Supporting Information regardingToxicity Data for Special Case Chemicals(i.e., those chemicals with cancer risks and non-cancer hazards calculated using methods ortoxicity parameters different from thosepresented on Standard Tables 5.1, 5.2, 6.1, or6.2). The Supporting Information will be usedto enable verification of those values by EPA.Examples include selection of potency factorsfor polychlorinated biphenyls (PCBs), use ofrelative potencies for polynuclear aromatichydrocarbons (PAHs) and chlorinated dioxinsand furans, and valence species assumptions formetals.
3. The Special Case Chemicals Supporting
Information should later be incorporated in theBaseline Risk Assessment Report.
4. Refer to the end of Chapter 3.1.1 for
5. Complete Standard Tables 5 and 6 for theexposure routes and chemicals underevaluation.
Standard Table 5.1: Non-Cancer Toxicity Data - Oral/DermalStandard Table 5.2: Non-Cancer ToxicityData - InhalationStandard Table 5.3: Non-Cancer ToxicityData - Special Case Chemicals
Standard Table 6.1: Cancer Toxicity Data- Oral/DermalStandard Table 6.2: Cancer Toxicity Data- InhalationStandard Table 6.3: Cancer Toxicity Data- Special Case Chemicals.
6. Standard Tables 5 and 6 should later beincorporated in the Baseline Risk AssessmentReport.
STANDARD TABLES 7 AND 8: Calculationof Non-Cancer Hazards and Cancer Risks. Thepurposes of Standard Tables 7 and 8 are:
• To provide a summary of the variables used tocalculate non-cancer hazards and cancer risks
• To show the EPC (medium-specific or route-specific) and intake used in the non-cancerhazard and cancer risk calculations
• To present the result of the calculation for eachExposure Route/Pathway for each COPC
• To provide the total hazard index and cancerrisks for all Exposure Routes/Pathways for theScenario Timeframe, Exposure Medium, andReceptor presented in this table.
The information documented in StandardTables 7 and 8 includes:
• The non-cancer hazard quotient (HQ) andcancer risk value for each COPC for eachExposure Route/ Pathway
• The values used for EPC, non-cancer intake,cancer intake, reference doses and

Revision No. 0 3-8 January 1998
DATA ELEMENTS IN STANDARD TABLE 7
For each unique combination of Scenario Timeframe,Medium, Exposure Medium, Exposure Point,Receptor Population, and Receptor Age, provide thefollowing information: Exposure Route, Chemical ofPotential Concern, Medium EPC Value, MediumEPC Units, Route EPC Value, Route EPC Units,EPC Selected for Hazard Calculation, Intake (Non-Cancer), Intake (Non-Cancer) Units, Reference Dose,Reference Dose Units, Reference Concentration,Reference Concentration Units, and Hazard Quotient.
DATA ELEMENTS IN STANDARD TABLE 8
For each unique combination of Scenario Timeframe,Medium, Exposure Medium, Exposure Point,Receptor Population, and Receptor Age, provide thefollowing information: Exposure Route, Chemical ofPotential Concern, Medium EPC Value, MediumEPC Units, Route EPC Value, Route EPC Units,EPC Selected for Risk Calculation, Intake (Cancer),Intake (Cancer) Units, Cancer Slope Factor, CancerSlope Factor Units, and Cancer Risk.
concentrations, and cancer slope factor for eachCOPC for each Exposure Route.
The data elements presented in StandardTables 7 and 8 are listed in the Standard Tables 7and 8 highlight boxes.
Perform the following steps associated with thepreparation of Standard Tables 7 and 8.
1. Address non-cancer hazards and cancer risksincluding the calculations and supportinginformation by Exposure Route.
2. Include RME and CT results. Ensure that risksand hazards from multiple chemicals arecombined appropriately across Pathways thataffect the same individual or populationsubgroup, for all site-related chemicals.
3. Definitions of Standard TablesStandard Table 7.n.RME: Calculation ofNon-Cancer Hazards (RME)
Standard Table 7.n.CT: Calculation of Medium, Exposure Route, and Exposure Point,Non-Cancer Hazards (CT) of cancer risks and non-cancer hazards. Standard Table 8.n.RME: Calculation ofCancer Risks (RME) The purpose of Standard Table 10 is:Standard Table 8.n.CT: Calculation ofCancer Risks (CT)
4. Submit Supporting Information thatsummarizes the approach used to performSpecial Chemical Risk and HazardCalculations and to enable verification of thosevalues by EPA. This summary should address
the calculation of non-cancer hazards andcancer risks for chemicals that do not use RfDor cancer slope factor (CSF) values,respectively. The format of the summary willbe determined by each region.
5. The Special Chemical Risk and HazardCalculations Supporting Information shouldlater be incorporated in the Baseline RiskAssessment Report.
6. Complete Standard Tables 7 and 8 for eachcombination of Scenario Timeframe, Medium,Exposure Medium, Exposure Point, ReceptorPopulation, and Receptor Age.
7. Standard Tables 7 and 8 should later beincorporated in the Baseline Risk AssessmentReport.
STANDARD TABLES 9 AND 10: Risks andHazards. The purpose of Standard Table 9 is:
• To provide a summary for each Receptor, by
• To provide a summary for each Receptor, byMedium, Exposure Route, and Exposure Point,of cancer risks and non-cancer hazards that maytrigger the need for remedial action.
The information documented in StandardTables 9 and 10 includes:

Revision No. 0 3-9 January 1998
DATA ELEMENTS IN STANDARD TABLE 9
For each unique combination of Scenario Timeframe,Receptor Population, and Receptor Age, provide thefollowing information: Medium, Exposure Medium,Exposure Point, Chemical, Carcinogenic Risk(Ingestion, Inhalation, Dermal, and Exposure RoutesTotal), Chemical, and Non-Carcinogenic HazardQuotient (Primary Target Organ, Ingestion,Inhalation, Dermal, and Exposure Routes Total).
DATA ELEMENTS IN STANDARD TABLE 10
For each unique combination of Scenario Timeframe,Receptor Population, and Receptor Age, provide thefollowing information: Medium, Exposure Medium,Exposure Point, Chemical, Carcinogenic Risk(Ingestion, Inhalation, Dermal, and Exposure RoutesTotal), Chemical, and Non-Carcinogenic HazardQuotient (Primary Target Organ, Ingestion,Inhalation, Dermal, and Exposure Routes Total).
• The cancer risk and non-cancer hazard to each 2. Include RME and CT results. Ensure that risksReceptor for each COPC by Exposure Route and hazards from multiple chemicals are and Exposure Point combined appropriately across Pathways that
• The total cancer risk and non-cancer hazard for affect the same individual or populationeach Exposure Pathway subgroup, for all site-related chemicals.
• The total cancer risk and non-cancer hazard foreach Medium across all Exposure Routes 3. Definitions of Standard Tables
• The primary target organs for non-carcinogenichazard effects.
The data elements presented in StandardTables 9 and 10 are listed in the Standard Tables 9 Receptor Risks and Hazards for COPCsand 10 highlight boxes. (CT)
Perform the following steps associated with thepreparation of Standard Tables 9 and 10.
1. Address non-cancer hazards and cancer risksincluding the calculations and supportinginformation by Exposure Route.
Standard Table 9.n.RME: Summary ofReceptor Risks and Hazards for COPCs(RME)Standard Table 9.n.CT: Summary of
Standard Table 10.n.RME: RiskAssessment Summary (RME)Standard Table 10.n.CT: RiskAssessment Summary (CT)
4. Complete Standard Tables 9 and 10 for eachcombination of Scenario Timeframe, ReceptorPopulation, and Receptor Age.
5. Standard Tables 9 and 10 should later beincorporated in the Baseline Risk AssessmentReport.
LEAD AND RADIONUCLIDES WORK-SHEETS. Perform the following steps associatedwith the preparation of Lead and RadionuclidesWorksheets: 1. For lead, complete the Lead Worksheets for
Screening Analysis, Child, and Adult (to bedeveloped). Also attach the appropriate graphsand results from the Integrated ExposureUptake Biokinetic Model (IEUBK) model to theChild Worksheet.
2. For radionuclides, complete the RadionuclideWorksheet (to be developed).
3. The Lead and Radionuclide Worksheetsshould later be incorporated in the BaselineRisk Assessment Report.
3.1.2 ASSESSMENT OF CONFIDENCE AND UNCERTAINTY
Uncertainty assessment is important in riskassessment. Although the risk assessment shouldindicate sources of variability and uncertainty

Revision No. 0 3-10 January 1998
throughout the process, it will generally be including graphic displays, the CT and RMEappropriate to include a separate section of the values, and a qualitative discussion of theBaseline Risk Assessment Report that also focuses results of the analysis and theon the uncertainties associated with data evaluation, representativeness of distribution data for thetoxicity assessment, exposure assessment, and risk population of concern.characterization, as well as overall uncertainty of thefinal risk numbers. The region may choose to defer • The uncertainty associated with the CT andpresentation of this specific section to the Draft RME values, population risks, if appropriate,Baseline Risk Assessment Report. and the uncertainty associated with the
Summarize the Assessment of Confidenceand Uncertainty. The Assessment of Confidenceand Uncertainty should later be incorporated in theBaseline Risk Assessment Report. •Summarize the Probabilistic Analysis (if
3.1.3 PROBABILISTIC ANALYSISINFORMATION • The Probabilistic Analysis summary should
Based upon the results from a deterministic riskcharacterization calculation (Standard Tables 7 and8), a decision should be made if a ProbabilisticAnalysis will be performed to calculate cancer risksand non-cancer hazards in accordance with Agency policy. If Probabilistic Analysis is performed, the information whichfollows should be addressed:
• The results from the initial evaluations(deterministic and sensitivity analyses) shouldbe evaluated along with any additional exposureinformation to determine whether aProbabilistic Analysis is feasible.
• For those parameters determined in the initialevaluations to have the most uncertainty(described in Chapter 3.1.2) proceed to theProbabilistic Analysis. For this analysis,provide the exposure parameter distributions,their source and rationale for selection, andindicate which parameters are correlated.Indicate pertinent information such as the modelto be used for the analysis, type of software,exposure equations, number of iterations, etc.The results of the Probabilistic Analysis shouldbe presented as either a chapter in the BaselineRisk Assessment Report or as an appendix inaccordance with regional preferences.
• As part of the Risk Characterization portion ofthe Baseline Risk Assessment Report, presenta summary of the Probabilistic Analysis results
Probabilistic Analysis should be summarized inthe Risk Characterization section of theBaseline Risk Assessment Report.
performed).
will later be incorporated in the Baseline RiskAssessment Report.
3.2 DRAFT BASELINE RISKASSESSMENT REPORT
Submit the Draft Baseline Risk AssessmentReport after the completion and acceptance of theInterim Deliverables described above. EPAguidance should be consulted in preparing the DraftBaseline Risk Assessment Report. EPA anticipatesthat this report preparation will be greatly expedited,since it should incorporate the following InterimDeliverables:
• Standard Tables 1 through 10• Worksheets on Data Useability, Lead and
Radionuclides, as applicable • Supporting Information • The Assessment of Confidence and Uncertainty• Probabilistic Analysis information.
However, the report should not consist exclusivelyof the Interim Deliverables, since additional narrative will be necessary for a clear andcomprehensible Baseline Risk Assessment Report.For example, information such as definition ofhazard indices and cancer slope factors,Toxicological Profiles for COPCs, and otherinformation indicated by risk assessment guidanceshould be incorporated.
Risk assessments submitted to the Agency or

Revision No. 0 3-11 January 1998
performed by the Agency should incorporate anycurrent Agency guidance applicable on RiskCharacterization.
3.3 FINAL BASELINE RISKASSESSMENT REPORT
Submit the Final Baseline Risk AssessmentReport as a revision of the draft, incorporatingreview comments as necessary and appropriate.
3.4 DATA TRANSFER TOCERCLIS 3
Upon the completion of the Final Baseline RiskAssessment Report, use the LOTUS® or EXCEL®version of the Standard Tables to transfersummary level risk data to the CERCLIS 3database.

EXHIBIT 3-1
INTERIM DELIVERABLES FOR EACH SITE
Interim Deliverable Scope of Deliverable
INTERIM DELIVERABLES ASSOCIATED WITH PLANNING TABLE 0
TARA Schedule Worksheet One Worksheet for each Risk Assessment.
Planning Table 0 - Site Risk Assessment Identification Information
One Planning Table for each Risk Assessment.
INTERIM DELIVERABLES ASSOCIATED WITH PLANNING TABLE 1
Planning Table 1 - Selection of Exposure Pathways One Planning Table for each Risk Assessment.
INTERIM DELIVERABLES ASSOCIATED WITH PLANNING TABLE 2
Data Useability Worksheet One Worksheet for each Medium.
Supporting Information on Background Values Information for all Chemicals listed in Planning Table 2.
Planning Table 2 - Occurrence, Distribution, and Selection of Chemicals of Potential Concern (COPCs)
One Planning Table for each unique combination of Scenario Timeframe, Medium, and Exposure Medium.
INTERIM DELIVERABLES ASSOCIATED WITH PLANNING TABLE 3
Supporting Information on EPCs Information for all EPCs presented in Planning Table 3.
Planning Table 3 - Exposure Point Concentration (EPC) Summary
One Planning Table for each unique combination of Scenario Timeframe, Medium, and Exposure Medium.
INTERIM DELIVERABLES ASSOCIATED WITH PLANNING TABLE 4
Supporting Information on Modeled Intake Methodology and Parameters
Information for all Modeled Intake calculations that are not presented in Planning Table 4.
Supporting Information on Chemical-Specific Parameters
Information for all Chemical-Specific Parameters used.
Dermal Worksheet Information for calculation of DA(event).
Planning Table 4 - Values Used for Daily Intake Calculations
One Planning Table for each unique combination of Scenario Timeframe, Medium, and Exposure Medium.
INTERIM DELIVERABLES ASSOCIATED WITH PLANNING TABLES 5 AND 6
Supporting Information on Toxicity Data for Special Case Chemicals
Information for each Special Case Chemical.
Planning Table 5 - Non-Cancer Toxicity Data Three Planning Tables - 5.1 for Oral/Dermal, 5.2 for Inhalation, and 5.3 for Special Case Chemicals.
3-16 December 2001

EXHIBIT 3-1
INTERIM DELIVERABLES FOR EACH SITE (continued)
Interim Deliverable Scope of Deliverable
Planning Table 6 - Cancer Toxicity Data Four Planning Tables - 6.1 for Oral/Dermal, 6.2 for Inhalation, 6.3 for Special Case Chemicals, and 6.4 for External (Radiation).
INTERIM DELIVERABLES ASSOCIATED WITH PLANNING TABLES 7 AND 8
Supporting Information on Special Chemical Risk and Hazard Calculations
Information for each Special Case Chemical.
Planning Table 7 - Calculation of Chemical Cancer Risks and Non-Cancer Hazards
One Planning Table for each unique combination of Scenario Timeframe, Receptor Population, and Receptor Age, for RME and for CT.
Radiation Dose Assessment Worksheet One Worksheet for each unique combination of Scenario Timeframe, Receptor Population, and Receptor Age (as appropriate).
Planning Table 8 - Calculation of Radiation Cancer Risks
One Planning Table for each unique combination of Scenario Timeframe, Receptor Population and Receptor Age.
INTERIM DELIVERABLES ASSOCIATED WITH PLANNING TABLES 9 AND 10
Planning Table 9 - Summary of Receptor Risks and Hazards for COPCs
One Planning Table for each unique combination of Scenario Timeframe, Receptor Population, and Receptor Age, for RME and CT.
Planning Table 10 - Risk Summary One Planning Table for each unique combination of Scenario Timeframe, Receptor Population, and Receptor Age, for RME and CT.
INTERIM DELIVERABLES ASSOCIATED WITH LEAD
Lead Worksheets (if applicable) Separate Worksheets for Residential and Non-Residential Scenarios for each unique combination of Scenario Timeframe, Receptor Population, and Receptor Age.
INTERIM DELIVERABLES ASSOCIATED WITH UNCERTAINTY ASSESSMENT
Assessment of Confidence and Uncertainty One Assessment for each Risk Assessment.
INTERIM DELIVERABLES ASSOCIATED WITH PROBABILISTIC ANALYSIS
Summary of Probabilistic Analysis (if applicable) One Summary for each Risk Assessment.
3-17 December 2001

EXHIBIT 3-1
INTERIM DELIVERABLES FOR EACH SITE (continued)
Interim Deliverable Scope of Deliverable
INTERIM DELIVERABLES ASSOCIATED WITH THE ROD
ROD Risk Worksheets As appropriate to document (in draft form) the need for remedial action.
Notes: 1. Each Interim Deliverable should be reviewed and verified by EPA prior to submission of the Draft Baseline Risk Assessment Report. 2. Each Interim Deliverable should later be incorporated in the Draft and Final Baseline Risk Assessment Reports. 3. The Interim Deliverables are needed for each risk assessment to achieve standardization in risk assessment reporting.
3-18 December 2001

EXHIBIT 3-2
STANDARDIZED RISK ASSESSMENT REPORTING
Risk Assessment Activity Corresponding Planning Table/Worksheet
Data Collection
Provide identification information for the risk assessment
Planning Table 0 - Site Risk Assessment Identification Information
Plan the risk assessment review process TARA Schedule Worksheet
Develop a conceptual site model Planning Table 1 - Selection of Exposure Pathways
Gather and report appropriate data Planning Table 2 - Occurrence, Distribution, and Selection of Chemicals of Potential Concern
Data Evaluation
Evaluate detection frequency, background data, and site data
Data Useability Worksheet
Planning Table 2 - Occurrence, Distribution, and Selection of Chemicals of Potential Concern
Identify chemicals of potential concern and provide rationale for selection and deletion
Planning Table 2 - Occurrence, Distribution, and Selection of Chemicals of Potential Concern
Exposure Assessment
Characterize physical setting, identify potential pathways and exposed population
Planning Table 1 - Selection of Exposure Pathways
Identify exposure assumptions Planning Table 4 - Values Used for Daily Intake Calculations
Dermal Worksheet
Estimate exposure point concentrations Planning Table 3 - Exposure Point Concentration Summary
Estimate exposure intakes Planning Table 7 - Calculation of Chemical Cancer Risks and Non-Cancer Hazards
Planning Table 8 - Calculation of Radiation Cancer Risks
Toxicity Assessment
Determine toxicity values for carcinogenic and non-carcinogenic effects and provide source information
Planning Table 5 - Non-Cancer Toxicity Data
Planning Table 6 - Cancer Toxicity Data
3-19 December 2001

EXHIBIT 3-2
STANDARDIZED RISK ASSESSMENT REPORTING (continued)
Risk Assessment Activity Corresponding Planning Table/Worksheet
Risk Characterization
Quantify cancer and non-cancer risk by pathway Planning Table 7 - Calculation of Chemical Cancer Risks and Non-Cancer Hazards
Planning Table 8 - Calculation of Radiation Cancer Risks
Radiation Dose Assessment Worksheet
Combine risks by media for different receptors Planning Table 9 - Summary of Receptor Risks and Hazards for COPCs
Summarize risk drivers for different receptors Planning Table 10 - Risk Summary
Prepare draft risk documentation for ROD ROD Risk Worksheets
3-20 December 2001

EXHIBIT 3-3
SUMMARY OF RAGS PART D REVISION 1 CHANGES
PLANNING TABLE/WORKSHEET REVISION 1 CHANGES
Planning Table 0 This is a new Planning Table.
TARA Schedule Worksheet This is a new Worksheet.
Planning Table 1 Revision 1 does not include the On-Site/Off-Site field from Revision 0.
Data Useability Worksheet The Revision 1 Worksheet is the same as the Revision 0 Worksheet.
Planning Table 2 Exposure Point was moved from the last row of the Summary Box (Revision 0) to the first column of the table (Revision 1). This may reduce the number of versions of Planning Table 2 needed for some sites. The Qualifier information for Minimum and Maximum Concentrations has been moved to the corresponding Concentration fields.
Planning Table 3 In Revision 1, separate versions of this table should be prepared for RME and CT. Exposure Point was moved from the last row of the Summary Box (Revision 0) to the first column of the table (Revision 1). This may reduce the number of versions of Planning Table 3 needed for some sites. The Qualifier information has been moved to the corresponding Maximum Concentration field.
Planning Table 4 In Revision 1, separate versions of this table should be prepared for RME and CT. Receptor Population, Receptor Age, and Exposure Point were moved from the Summary Box (Revision 0) to columns in Revision 1. This may reduce the number of versions of Planning Table 4 needed for some sites.
Planning Tables 5.1, 5.2, and 5.3 The Revision 1 Planning Tables are essentially the same as Revision 0. Some column headings have been slightly reworded, but the data needs are the same.
Planning Table 6.1, 6.2, 6.3, and 6.4 The Revision 1 Planning Tables 6.1, 6.2, and 6.3 are essentially the same as Revision 0. Some column headings have been slightly reworded, but the data needs are the same. Revision 1 Planning Table 6.4 for radionuclides was not included in Revision 0.
3-21 December 2001

EXHIBIT 3-3
SUMMARY OF RAGS PART D REVISION 1 CHANGES (continued)
PLANNING TABLE/WORKSHEET REVISION 1 CHANGES
Planning Table 7 Medium, Exposure Medium, and Exposure Point were moved from the Summary Box (Revision 0) to columns in the table (Revision 1). This may reduce the number of versions of Planning Table 7 needed for some sites. Planning Table 7, which previously contained only non-cancer information (Revision 0), now presents cancer and non-cancer information for chemicals.
Planning Table 8 Planning Table 8 (Revision 1) focuses exclusively on the calculation of radiation cancer risks. Planning Table 8 (Revision 0) focused on cancer risk calculations for all chemicals. Medium, Exposure Medium, and Exposure Point were moved from the Summary Box (Revision 0) to columns in the table (Revision 1). This may reduce the number of versions of Planning Table 8 needed for some sites. Medium EPC and Route EPC information (Revision 0) was replaced by EPC information (Revision 1).
Radiation Dose Assessment Worksheet This is a new Worksheet.
Planning Tables 9 and 10 A column for Exposure Route External (Radiation) has been added to the cancer calculations in Revision 1. The second COPC (Planning Table 9) or Chemical (Planning Table 10) column from Revision 0 has been deleted in Revision 1.
Accommodations have been made for summing risks and hazards at the Exposure Point, Exposure Medium, Medium, and Receptor Levels.
Lead Worksheets These are new Worksheets.
ROD Risk Worksheets (ROD Risk Highlights)
These are new Worksheets that copy the ROD Guidance (U.S. EPA, 1999a) Risk Highlights.
3-22 December 2001

Revision No. 0 4-1 January 1998
CHAPTER 4
RISK EVALUATIONS DURING THE FEASIBILITY STUDY
4.1 INTRODUCTION
The following are FS activities, which duringdevelopment, should involve EPA risk assessorinput. Continuous involvement of the EPA riskassessor during the FS has the benefit of: 1)supporting the development of remedial actionobjectives (RAOs) and PRGs, and 2) supportingcomparison of risks associated with variousremedial alternatives. For these reasons, EPA riskassessor involvement in FS preparation and reviewis strongly encouraged.
The purpose of the FS is to evaluate wastemanagement remedial alternatives. The NationalOil and Hazardous Substance PollutionContingency Plan (NCP) (EPA 1990c) specifiesthat a detailed analysis be performed that involvesnine criteria. The NCP specifies that for screeningof remedial alternatives, the long-term and short-term aspects of three criteria - effectiveness,implementability, and cost - should be used to guidethe development and screening of remedialalternatives. Consideration of effectivenessinvolves evaluating the long-term and short-termhuman health risks. Long-term risks associatedwith a remedial alternative are those risks that willremain after the remedy is complete; short-termrisks associated with a remedial alternative are thoserisks that occur during implementation of theremedial alternative.
Evaluating long-term risks ideally includes anassessment of the risks associated with treatment ofresiduals and untreated wastes for a treatment-basedremedy, or an evaluation of the remedy’s ability toprovide protectiveness over time for a containment-based remedy. For short-term human health risksassociated with a remedial alternative, a riskassessor may need to evaluate the risks that occurduring implementation of the remedial alternative(e.g., risks associated with emissions from an onsite
air stripper). Because some remedies may takemany years to complete, some “short-term” risksmay actually occur over a period of many years.Populations that may be exposed to chemicalsduring remedy implementation include people wholive and work in the vicinity of the site.
The NCP also requires that RAOs andremediation goals be developed. These serve asobjectives and goals that can be used to identify andassess remedial alternatives at Superfund sites. Theremainder of this chapter defines and discussesRAOs and remediation goals.
4.1.1 REMEDIAL ACTION OBJECTIVES
As discussed in the NCP, RAOs describe, ingeneral terms, what any remedial action needs toaccomplish in order to be protective of human healthand the environment. They are typically narrativestatements that specify the contaminants andenvironmental media of concern, the potentialexposure pathways to be addressed by remedialactions, the exposed populations and environmentalreceptors to be protected, and the acceptablecontaminant concentrations or concentration ranges(remediation goals) in each environmental medium.
4.1.2 REMEDIATION GOALS
Remediation goals are a subset of the RAOs.They provide the acceptable contaminantconcentrations in each medium for remedial actionsto meet.
EPA explained in the preamble to the final NCPthat remediation goals are based on ARARs unlessARARs are not available or are not protective.ARARs do not always exist for all chemicals and allenvironmental media.

Revision No. 0 4-2 January 1998
SELECTION OF REMEDIATION GOALS
The NCP [EPA 1990c; Section 300.430(e)(2)(I)] states that the selection of remediation goalsshould consider the following:
“...remediation goals shall establish acceptableexposure levels that are protective of humanhealth and the environment and shall bedeveloped considering the following...
ARARs under Federal environmental or Stateenvironmental or facility siting laws, if available,and the following factors:
1. For systemic toxicants, acceptable exposurelevels shall represent concentration levels towhich the human population, includingsensitive subgroups, may be exposedwithout adverse effect during a lifetime orpart of a lifetime, incorporating an adequatemargin of safety;
2. For known or suspected carcinogens,acceptable exposure levels are generallyconcentration levels that represent an excessupper bound lifetime cancer risk to anindividual of between 10 and 10 using-4 -6
information on the relationship betweendose and response. The 10 risk level shall-6
be used as the point of departure fordetermining remediation goals foralternatives when ARARs are not availableor are not sufficiently protective because ofthe presence of multiple contaminants at asite or multiple pathways of exposure;
3. Factors related to technical limitations suchas detection/quantification limits forcontaminants;
4. Factors related to uncertainty; and
5. Other pertinent information.”
Therefore, according to the NCP, there are twomajor sources for the acceptable exposure levelsused for remediation goals: a) concentrations foundin Federal and State ARARs and, if these are notavailable or not protective, (b) risk-basedconcentrations that are determined to be protectiveof human health and the environment. These risk-
based concentrations are calculated using, at aminimum, the criteria sited in numbers 1 and 2 inthe Remediation Goals highlight box. Other factorsmentioned in the highlight box [i.e., limits ofdetection (number 3), uncertainty (number 4), andbackground concentration levels (number 5)] arealso considered.
Risk-based concentrations may need to bedeveloped for all chemicals even if ARARs areavailable to ensure that these ARARs are protectiveof human health and the environment.
ARAR-Based Remediation Goals. Potentialchemical-specific ARARs include concentrationlimits set by Federal environmental regulations suchas Maximum Contaminant Levels (MCLs)established under the Safe Drinking Water Act(SDWA), ambient water quality criteria establishedunder the Clean Water Act (CWA), and Stateregulations (e.g., State drinking water laws).Action-specific and location-specific ARARs mustalso be complied with according to the NCP.
Risk-Based Remediation Goals. In general,remediation goals based on risk-based calculationsare determined using cancer or non-cancer toxicityvalues with specific exposure assumptions. Forchemicals with carcinogenic effects, the NCP hasdescribed the development of remediation goals, asa practical matter, as a two-step process [EPA1990c, Section 300.430(e)(2)(I)(D)]. A concen-tration equivalent to a lifetime cancer risk of 1x10⁻⁶
is first established as a point of departure. Then,other factors are taken into account to determinewhere within the acceptable range the remediationgoals for a given contaminant at a specific site willbe established.
The NCP discusses a generally acceptable riskrange of 1x10 to 1x10 . EPA has further clar--4 -6
ified the extent of the acceptable risk range bystating that the upper boundary is not a discrete lineat 1x10 . Risks slightly greater than 1x10 may-4 -4
be considered to be acceptable (i.e., protective) ifjustified based on site-specific conditions, includingany uncertainties about the nature and extent ofcontamination and associated risks. [See Role of theBaseline Risk Assessment in Superfund RemedySelection Decisions (EPA 1991d)]

Revision No. 0 4-3 January 1998
For non-cancer effects, the NCP states that an CERCLA (EPA 1988). RAGS Part B (EPA 1991a)acceptable exposure level must be defined (using also presents guidance for the role of riskreliable toxicity information such as EPA’s RfD). assessment in the FS. The EPA RPM should followAccording to EPA guidance, (RAGS Part A, EPA appropriate National and regional guidance.1989c), generally, if the Hazard Index (HI)(Intake/RfD) is above 1 (i.e., the site exposure isestimated to be above the RfD) there may be aconcern for potential non-cancer effects [see Role ofthe Baseline Risk Assessment in Superfund RemedySelection Decisions (EPA 1991d]. Therefore, incalculating remediation goals at a site to protect fornon-cancer effects, remediation goals are generallyset a at a Hazard Index at or below 1.
4.1.3 PRELIMINARY REMEDIATIONGOALS
As discussed in the NCP, final remediationgoals are not determined until a final remedy for thesite is selected in the ROD. However, PRGs for asite are established as early in the RI/FS process aspossible during project scoping (see Chapter 2).These initial PRGs can then be modified asnecessary during the FS, based on site-specificinformation from the baseline risk assessment. ThePRGs will then be used to establish the goals to bemet by the remedial alternatives in the FS. ThePRGs also guide the development of the ProposedPlan for remedial action and the selection ofremediation levels in the Record of Decision.
Risk-based PRGs (non-ARARs) may bemodified within the acceptable risk range during theremedy selection process based on a balancing ofthe major trade-offs among the alternatives as wellas the public and Agency comments on the ProposedPlan (RAGS Part B). Such balancing amongalternatives and consideration of community andState acceptance will establish the specific level ofprotection the remedy will achieve (i.e., the finalremediation levels).
The dialogue begun during Scoping between theEPA risk assessor and the EPA RPM shouldcontinue during the FS and beyond to ensure thatrisk assessment information is used appropriately inthe risk management decision process.
The primary guidance on development of the FSis available in “Guidance for Conducting RemedialInvestigations and Feasibility Studies Under
4.2 DEVELOP REMEDIALACTION OBJECTIVES
The risk assessor should be involved in thepreparation or review of the following:
• A narrative description of the Medium,Exposure Point and Exposure Routes, andchemicals exceeding the risk range
• A narrative identifying the remedial actionobjectives for prevention of exposure andrestoration of each contaminated Medium (e.g.,restoring groundwater to a potable watersource)
• A format such as Example Table 1 in Exhibit 4-1 may be a useful approach to present thesedata for each Medium.
4.3 DEVELOP REMEDIATIONGOALS
The risk assessor should be involved in thepreparation or review of a short narrative or tableswhich provide the goals of the remediation. First,all values considered as PRGs should be identified.Then the PRGs selected for each chemical to beused in the FS should be presented.
4.3.1 IDENTIFY VALUES CONSIDEREDAS PRELIMINARY REMEDIATIONGOALS
• Identify ARAR-based PRGs and associatedrisks/hazards.
• If ARAR-based PRGs are not protective,calculate risk-based PRGs using EPA methods.
• Identify other values to consider as PRGs [e.g.,background, detection limits, ProcedureQuantitation Limits (PQLs)].
• A format such as Example Table 2 in Exhibit 4-

Revision No. 0 4-4 January 1998
1 may be a useful approach to present thesevalues, for each Medium and ReceptorPopulation combination.
4.3.2 SELECT PRELIMINARYREMEDIATION GOALS
• Select PRG(s) for each chemical from amongthe values considered (e.g., risk-based forcancer and non-cancer, ARAR-based, other),modifying values as appropriate. Note that thePRG should be ARAR-based unless there is noARAR available or the ARAR is not protective.
• Provide the rationale for the selected PRG.Include the source of the value.
• A format such as Example Table 3 in Exhibit 4-1 may be a useful approach to present thesevalues for each Medium and ReceptorPopulation combination.
4.4 SUMMARIZE RISKS ANDHAZARDS ASSOCIATEDWITH PRELIMINARY
REMEDIATION GOALS
The risk assessor should be involved in thepreparation or review of a short narrative or tableswhich summarize the risks and hazards associatedwith the PRGs.
• Identify the chemical of concern, maximumconcentration, PRG, basis of PRG, andcalculated risks and hazards associated with thePRG for each Medium and ReceptorPopulation.
• Summarize the total risk and total hazardamong all chemicals for each Medium andReceptor Population combination.
• A format such as Example Table 3 in Exhibit 4-1 may be a useful approach to present thesevalues for each Medium and ReceptorPopulation combination.
4.5 EVALUATE REMEDIALTECHNOLOGIES ANDALTERNATIVES FOR RISK
CONSIDERATIONS
The risk assessor may provide input in theprocess of evaluating remedial technologies andalternatives for risk considerations beginning in thedevelopment and screening stage of the FS andextending into the detailed analysis stage. Themajor goal for the risk evaluation during these stepsis to provide the FS team and the EPA RPM withspecific long-term and short-term human health riskinformation to consider when identifying andscreening technologies and alternatives andperforming detailed analysis of alternatives.
The long-term human health risks associatedwith a remedial technology or alternative are thoserisks that will remain after the remedy is complete(i.e., residual risks). The risk issues to beconsidered may include an assessment of the risksassociated with treatment residuals, untreatedwastes, or contained wastes.
The short-term human health risks associatedwith a remedial technology or alternative are thoserisks that occur during implementation of thetechnology or alternative, which may occur over aperiod of years. Populations to be consideredinclude people who live and work in the vicinity ofthe site and workers involved in site remediation.
4.5.1 IDENTIFICATION ANDSCREENING OF TECHNOLOGIESAND ALTERNATIVES
The risk assessor may contribute to theidentification and screening of technologies andalternatives and focus on evaluating associatedshort-term and long-term human health risks toensure that they meet RAOs and PRGs. The goal ofthe risk assessor is to assist in identifying, andeliminating from further consideration, technologiesand/or alternatives with clearly unacceptable risks.This evaluation is typically
qualitative, based on simplifying assumptions andprofessional judgement rather than detailed analysis.The risk assessor’s evaluation is associated with theconsideration of effectiveness, one of three criteriaspecified by the NCP. (Implementability and costare the other two criteria evaluated at this screeningstage, but they do not typically involve risk assessor

Revision No. 0 4-5 January 1998
participation.)
4.5.2 DETAILED ANALYSIS OFALTERNATIVES
The overall objective of the risk assessor’s rolein the detailed analysis of alternatives is to supportthe preparation and evaluation of the riskinformation needed for RPMs to select a remedialalternative for a site. The risk assessor contributesto the analysis of three of the nine criteria specifiedby the NCP:
• Overall Protection of Human Health and theEnvironment
• Long-term Effectiveness and Permanence• Short-term Effectiveness.
The detailed analysis of short-term and long-term risks may be qualitative or quantitativedepending on the “perceived risk” associated withthe alternative based on both professionaljudgement and community concerns. The riskanalysis follows the same general steps as thebaseline risk assessment; however, the steps willtypically not be conducted in the same level of detailfor the FS.
The detailed analysis of short-term risksincludes the following components for eachalternative:
• Evaluate short-term exposure.• Evaluate short-term toxicity.• Characterize short-term risks to the community
(including people who live or work on or nearthe site).
• Characterize short-term risks to remediationworkers (a qualitative assessment may beappropriate if the risks to remediation workersare addressed adequately in the site-specificHealth and Safety Plan).
The detailed analysis of long-term risks includesthe following components for each alternative.
• Evaluate residual risk.• Evaluate protectiveness over time.

EXHIBIT 4-1EXAMPLE TABLES TO STANDARDIZE
REPORTING OF FS RISK EVALUATIONS
Example Table 1 REMEDIAL ACTION OBJECTIVES
Medium:
Exposure Point Chemical Exposure Route Receptor Population Remedial Action Objectives
Example Table 2 VALUES CONSIDERED AS PRGs
Medium:Receptor Population:
Chemical Most Restrictive
ARAR
Most Restrictive
ARAR Source
Risk/Hazard at ARAR
Risk-Based PRG
Cancer*
Risk-Based PRG
Non-Cancer*
Other Value**
Other Value** Source
*Provide the associated risk and hazard levels in the footnotes. **(e.g., detection limits, background)
Example Table 3 RISKS AND HAZARDS ASSOCIATED WITH PRGs
Medium:Receptor Population:
Chemical Site Concentration
PRG Basis for PRG*
Risk at PRG: Cancer
Hazard at PRG: Non-Cancer
Target Endpoint
Totals
*TBC (Federal ARARs, State ARARs), Risk-based. Background Concentrations, method detection limits
4-6 December 2001

Revision No. 0 5-1 January 1998
CHAPTER 5
RISK EVALUATIONS AFTER THE FEASIBILITY STUDY
EPA risk assessor involvement in risk on those exposure pathways and chemicals ofevaluations, after completion of the FS, should be concern found to pose actual or potential threats toconducted as necessary to support the EPA RPM in human health or the environment. Chemicalsensuring that the remedy is protective. While these included in the risk assessment but determined notrisk evaluations may not always require a significant to contribute significantly to an unacceptable risklevel of quantitation, continuous involvement of need not be included in the Risk AssessmentEPA risk assessors is essential to ensure consistency Summary in the ROD (e.g., chemicals with riskin risk evaluation and risk communication. Post-FS levels less than 1x10 or HQ less than 0.1) unlessactivities benefitting from EPA risk assessor they are needed to justify a No Action ROD. involvement typically include the Proposed Plan, theRecord of Decision (ROD), the Remedial The Risk Assessment Summary prepared forDesign/Remedial Action, and Five-Year Reviews. the ROD should include, at a minimum, a summary
5.1 RISK EVALUATION FOR THEPROPOSED PLAN
The Proposed Plan should include sufficient riskassessment information to support the basis for theproposed remedial action. EPA risk assessorsupport is recommended during the preparation ofthe Proposed Plan to ensure the consistency of riskinformation with the Baseline Risk AssessmentReport and the FS Report. The level of detail in theProposed Plan should be appropriate to the needs ofthe community. Additional EPA risk assessorsupport required at this time may be qualitative orquantitative, typically focusing on refinement ofprevious analyses, based on newly developedinformation.
5.2 DOCUMENTATION OF RISKSIN THE RECORD OFDECISION
To support the preparation of the Record ofDecision, the EPA risk assessor should prepare orreview a summary of the Baseline Risk AssessmentReport which supports the basis for the remedialaction. The primary focus should be
-6
table completed for those exposure scenarios andchemicals that trigger the need for cleanup. Otherrisk information may also be included in the RODdepending upon the level of detail preferred.Information related to values used for intakecalculations and non-cancer and cancer toxicity dataand exposure point concentrations are summarizedon Standard Tables 4, 5, 6, 7, and 8, which could beplaced in appendices to the ROD. In addition, therisk assessor should prepare/review the followinginformation related to the selected alternative:
• Document short-term risks that may occurduring remedy implementation.
• Document risks that may remain aftercompletion of the remedy (including residualrisk from untreated waste remaining at the site).
• Determine the need for five-year reviews.
Refer to Interim Final Guidance on PreparingSuperfund Decision Documents (EPA 1989b) fora recommended format for summarizing humanhealth risk assessment information in the ROD. Also refer to the upcoming Guidance on PreparingSuperfund Decision Documents, which will beavailable by the end of fiscal year 1998.

Revision No. 0 5-2 January 1998
5.3 RISK EVALUATION DURINGREMEDIAL DESIGN AND REMEDIAL ACTION
The EPA risk assessor’s role during remedialdesign and remedial action may be qualitative orquantitative depending on the site and phase of theproject. During the remedial design, short-term andlong-term risks may be assessed through refinementof previous analyses and identification of the needfor engineering controls or other measures tomitigate risk.
During the remedial action, the EPA riskassessor is more likely to provide quantitative riskevaluation support. Short-term risk evaluation mayaddress impacts to remediation workers andneighboring communities. Long-term riskevaluations typically focus on the following:
• Whether remediation levels specified in theROD have been attained
• Whether residual risk after completion of theremedy ensures protectiveness.
5.4 RISK EVALUATIONASSOCIATED WITH
EXPLANATIONS OFSIGNIFICANT DIFFERENCES(ESDs) AND AMENDED RODs
When conditions relevant to a site changefollowing the signing of a ROD, it is sometimesnecessary to prepare an ESD or amended ROD.Examples of conditions causing this situation mayinclude, but are not limited to, the following:
& Toxicity values change.
& Additional technology performance informationbecomes available.
& ARARs change (e.g., Land DisposalRestrictions).
EPA risk assessor involvement with RPMevaluations of ESDs and Amended RODs focuseson evaluating whether clean-up standards are stillprotective when considering new ARARs, newparameters for risk and hazard calculations, newtechnology information, and other new information.Any new information and revised risk evaluationsshould be thoroughly documented.
5.5 RISK EVALUATION DURINGFIVE-YEAR REVIEWS
CERCLA provides for reviews of certainremedies at least every five years to assure thathuman health and the environment are beingprotected by the remedial alternative implemented.EPA risk assessor involvement with RPMevaluations during Five-Year Reviews are generallyquantitative and focus on the following two goals:
• Confirm that the remedy remains protective(including any engineering or institutionalcontrols).
• Evaluate whether clean-up standards are stillprotective by considering new ARARs, newparameters for risk and hazard calculations, andother new information.

Review Draft – For Public Comment
Revision No. 1 September 2001R-1
REFERENCES
Aberg, B., Ekman, L., Falk, R., Greitx, U., Persson, G., and Snihs, J. (1969) Metabolism of Methyl Mercury(203Hg) Compounds in Man. Arch Environ. Health 19:453-484.
Albro, P.W. and Fishbein, L. (1972) Intestinal Absorption of Polychlorinated Biphenyls in Rats. Bull. Environ.Contam. Toxicology 8:26-31.
Agency for Toxic Substances and Disease Registry (1994a) Toxicological Profile for Chlorodibenzofurans. U.S.Department of Health & Human Services, Public Health Service.
Agency for Toxic Substances and Disease Registry (1994b) Toxicological Profile for Zinc. U.S. Department ofHealth & Human Services, Public Health Service.
Agency for Toxic Substances and Disease Registry (1999) Toxicological Profile for Mercury. U.S. Departmentof Health & Human Services, Public Health Service.
Andelman, J.B. (1988) Total Exposure to Volatile Organic Compounds in Potable Water. In: Ram, N.; Christmen,R., Cantor, K., eds. Significance and Treatment of Volatile Organic Compounds in Water Supplies. Chelsea, MI:Lewis Publishers, Inc.
Bettley, F.R. and O'Shea, J.A. (1975) The Absorption of Arsenic and its Relation to Carcinoma. Brit. J.Dermatol. 92:563-568.
Bunge, A.L. and Cleek, R.L. (1995) A New Method for Estimating Dermal Absorption from Chemical Exposure: 2. Effect of Molecular Weight and Octanol-water Partitioning. Pharm. Res. 12:88-95.
Bunge, A. L. and McDougal, J. N. (1998) Dermal Uptake. “Exposure to Contaminants in Drinking Water.” Estimating Uptake through the Skin and by Inhalation. S. Olin, ed. Boca Raton, FL, CRC Press.
Chang, L.H. (1943) The Fecal Excretion of Polycyclic Hydrocarbons Following Their Administration to the Rat.J. Biochemistry 151:93-99.
Cleek, R.L. and Bunge, A.L. (1993) A New Method for Estimating Dermal Absorption from Chemical Exposure. 1. General Approach. Pharm. Res. 10: 497-506.
Conklin, A.W., Skinner, S.C., Felten, T.L., and Sanders, C.L. (1982) Clearance and Distribution of IntratracheallyInstilled Vanadium Compounds in the Rat. Toxicol. Lett. 11:199-203.
Cuddihy, R.G. and Griffith, W.C. (1972) A Biological Model Describing Tissue Distribution and Whole-bodyRetention of Barium and Lanthanum in Beagle Dogs after Inhalation and Gavage. Health Phys. 23:621-633.
Davidsson, L., Cederblad, A., Lonnerdal, B. and Sandstrom, B. (1989) Manganese Retention in Man: a Methodfor Estimating Manganese Absorption in Man. Am. J. Clin. Nutr. 49: 170-179.
Donaldson, R.M. and Barreras, R.F. (1996) Intestinal Absorption of Trace Quantities of Chromium. J. Lab. Clin.Med. 68:484-493.

Review Draft – For Public Comment
Revision No. 1 September 2001R-2

REFERENCES (continued)
Review Draft – For Public Comment
Revision No. 1 September 2001R-3
Dowdy, D., McKone, T.E., and Hsieh, D.P.H. (1996) The Use of the Molecular Connectivity Index forEstimating Biotransfer Factors. Environmental Science and Technology 30, 984-989.
Draper, N. R.; Smith, H. (1998) Applied Regression Analysis, 3rd edition. John Wiley & Sons. New York.
Duff, R.M. and Kissel, J.C. (1996) Effect of Soil Loading on Dermal Absorption Efficiency from ContaminatedSoils. J. Tox. and Environ. Health 48:93-106.
Elakhovskaya, N.P. (1972) The Metabolism of Nickel Entering the Organism with Water. (Russian translation)Gig Sanit 6:20-22.
Ewing, A.D., Kadry, A.M., and Dorough, H.W. (1985) Comparative Disposition and Elimination of Chlordane inRats and Mice. Toxicol. Lett. 26:233-239.
Farooqui, M.Y.H and Ahmed, A.E. (1982) Molecular Interaction of Acrylonitrile and Potassium Cyanide with RatBlood. Chem. Biol. Interact. 38:145-159.
Flynn, G. L. (1990) Physicochemical Determinates of Skin Absorption. In T. R. Gerrity and C. J. Henry, eds.Principles of Route-to-Route Extrapolation for Risk Assessment, Elsevier, New York p. 93-127.
Fries, G.S. and Marrow, G.F. (1975) Retention and Excretion of 2,3,7,8 Tetrachlorodibenzo-p- Dioxin by Rats. J.Agric. Food Chem. 23:265-269.
Furchner, J.E., Richmond, C.R., and Drake, G.A. (1968) Comparative Metabolism of Radionuclides inMammals-IV. Retention of Silver-110m in the Mouse, Rat, Monkey, and Dog. Health Phys. 6:505-14.
Gerity, T.R. and Henry, C.J. (1990) Principles of Route-to-Route Extrapolation for Risk Assessment.Amsterdam: Elsevier Publishing.
Hecht, S.S., Grabowski, W., and Groth, K. (1979) Analysis of Faeces for Benzo[a]pyrene after Consumption ofCharcoal-broiled Beef by Rats and Humans. Cosmet. Toxicology 17:223-227.
Holmes, K.K. Jr., Shirai, J.H., Richter, K.Y., and Kissel, J. C. (1999) Field Measurement of Dermal Soil Loadingsin Occupational and Recreational Activities. Environmental Research 80:148-157.
Hostynek, J.J., Hinz, R.S, Lorence, C.R, and Guy, R.H. (1998) “Human Skin Penetration by Metal Compounds.” In M.S. Roberts and K.A. Walters, eds. Dermal Absorption and Toxicity Assessment, Marcel Dekker, Inc., NewYork.
IRIS-Integrated Risk Information System. (2000) U.S. EPA.
Jo, W.K., Weisel, C.P., and Lioy, P.J. (1990) Chloroform Exposure and Body Burden from Showering withChlorinated Tap Water. Risk Analysis 10, 575-580.
Kasting, G.B., Smith, R.L., and Cooper, F.R. (1987) “Effect of Lipid Solubility and Molecular Size onPercutaneous Absorption.” Pharmacol Skin 1:138-153.

REFERENCES (continued)
Review Draft – For Public Comment
Revision No. 1 September 2001R-4

REFERENCES (continued)
Review Draft – For Public Comment
Revision No. 1 September 2001R-5
Kasting, G.B. and Robinson, P.J. (1993) Can We Assign an Upper Limit to Skin Permeability? Pharm. Res 10:930-93.
Keim, K.S., Holloway, C.L., and Hebsted, M. (1987) Absorption of Chromium as Affected by Wheat Bran.Cereal Chem. 64: 352-355.
Keller, W. and Yeary, R. (1980) A Comparison of the Effects of Mineral Oil, Vegetable Oil, and Sodium Sulfateon the Intestinal Absorption of DDT in Rodents. Clin. Toxicol. 16:223-231.
Kissel, J., Richter, K.Y., and Fenske, R.A. (1996) Field Measurement of Dermal Soil Loading Attributed toVarious Activities: Implications for Exposure Assessment. Risk Analysis 16:115-125.
Kissel, J., Shirai, J.H., Richter, K.Y., and Fenske, R.A. (1998) Investigation of Dermal Contact with Soil inControlled Trials. J. Soil Contamination 7:737-752.
Knopp, D. and Schiller, F. (1992) Oral and Dermal Application of 2,4-Dichlorophenoxyacetic Acid Sodium andDimethylamine Salts to Male Rats: Investigations on Absorption and Excretion as Well as Induction of HepaticMixed-function Oxidase Activities. Arch Toxicol. 66:170-174.
Korte, F. (1978) Ecotoxicologic Profile Analysis. Chemisphere 1:79-102.
Leahy, D. E. (1990) Use of QSAR’s to Predict Percutaneous Absorption. Prediction of PercutaneousPenetration, R.C. Scott, R.H. Guy and J. Hadgraft (eds.), IBC Technical Services Ltd, London, p.242-251.
Lepow, M.L., Bruckman, L., Gillette, M., Markowitz, S., Robino, R., and Kapish, J. (1975) Investigations intoSources of Lead in the Environment of Urban Children. Environ. Res. 10:415-426.
Lie, R., Thomas, R.G., and Scot, J.K. (1960) The Distribution and Excretion of Thallium204 in the Rat SuggestedMPCs and a Bioassay Procedure. Health Phys. 2: 334-340.
Mackenzie, R.D., Anwar, R.A., Byerrum, R.U., and Hoppert, C.A. (1959) Absorption and Distribution of Cr51 inthe Albino Rat. Arch. Biochem. Biophys. 79:200-205.
Maddy, K.T., Wang, R.G., and Winter, C.K. (1983) Dermal Exposure Monitoring of Mixers, Loaders andApplicators of Pesticides in California. Workers Health and Safety Unit, Report HS-1069. CaliforniaDepartment of Food and Agriculture, Sacramento, California.
Mandel, J. (1982) Use of the Singular Value Decomposition in Regression Analysis. The American Statistician,36:15-24.
Mandel, J. (1985) The Regression Analysis of Collinear Data. Journal of Research of the National Bureauof Standards, 90(6):465-478.
McKone, T.E. and Howd, R.A. (1992) Estimating Dermal Uptake of Nonionic Organic Chemicals from Waterand Soil: Part 1, Unified Fugacity-Based Models for Risk Assessments. Risk Analysis, 12, 543- 557.

REFERENCES (continued)
Review Draft – For Public Comment
Revision No. 1 September 2001R-6
McKone, T.E. (1993) Linking a PBPK Model for Chloroform with Measured Breath Concentrations in Showers:Implications for Dermal Exposure Models. Journal of Exposure Analysis and Environmental Epidemiology 3,339-365.
Meerman J.H., Sterenborg, H.M., and Mulder G.J. (1983) Use of Pentachlorophenol as Long-term Inhibitor ofSulfation of Phenols and Hydroaximic Acids in the Rat In-vivo. Biochem. Pharmacol. 32:1587-1593.
Muhlebach, S. (1981) Pharmacokinetics in rats of 2,4,5,2,4,5 Hexachlorobiphenyl and Unmetabolizable LipophilicModel Compounds. Xenobiotica 11:249-257.
Ohno, Y., Kawanishi, T., and Takahashi, A. (1986) Comparisons of the Toxicokinetic Parameters in RatsDetermined for Low and High Dose gamma-Chlordane. J. Toxicol. Sci. 11:111-124.
Pelletier, O., Ritter, L., and Somers, C.J. (1989) Disposition of 2,4-Dichlorophenoxyacetic Acid Dimethylamine byFischer 344 Rats Dosed Orally and Dermally. J Toxicol Environ Health 28: 221-234.
Piper, W.N. (1973) Excretion and Tissue Distribution of 2,3,7,8 Tetrachlorodibenzo -p-dioxin in the Rat. Environ.Health Perspect. 5:241-244.
Pirot, F., Kalia, Y.N., Stinchcomb, A.L., Keating, G., Bunge, A., Guy, R.H. (1997) Characterization of thePermeability Barrier of Human Skin In-vivo. Proc. Natl. Acad. Sci.,USA 94:1562-1567.
Potts, R.O. and Guy, R.H. (1992) Predicting Skin Permeability. Pharm. Res. 9:663-669.
Reddy, M.B., Guy, R.H., Bunge, A.L. (2000) Does Epidermal Turnover Reduce Percutaneous Penetration? Pharm. Res. 17:1414-1419.
Reeves, A.L. (1965) The Absorption of Beryllium from the Gastrointestinal Tract. Arch Environ. Health 11:209-214.
Roels, H.A., Buchet, J.P., Lauwerys, R.R., Bruaux, P., Claeys-Thoreau, F., Lafontaine, A., and Verduyn, G. (1980) Exposure to Lead by the Oral and the Pulmonary Routes of Children Living in the Vicinity of a PrimaryLead Smelter. Environ. Res. 22:81-94.
Rose, J.Q., Ramsey, J.C., Wentzler, T.H., Hummel, R.A., and Gehring, P.J. (1976) The Fate of 2,3,7,8Tetrachlorodibenzo-p-dioxin Following Single and Repeated Oral Doses to the Rat. Toxicol. Appl. Pharmacol.36:209-226.
Ruoff, W. (1995) Relative Bioavailability of Manganese Ingested in Food or Water. Proceedings Workshop onthe Bioavailability and Oral Toxicity of Manganese. U.S. EPA-ECAO, Cincinnati, OH.
Sayato, Y., Nakamuro, K., Matsui, S., and Ando, M. (1980) Metabolic Fate of Chromium Compounds. I.Comparative Behavior of Chromium in Rat Administered with Na2
51CrO4 and 51CrCl3. J. Pharm. Dyn. 3: 17-23.
Tanabe, S. (1981) Absorption Efficiencies and Biological Half-life of Individuals Chlorobiphenyls in Rats Treated

REFERENCES (continued)
Review Draft – For Public Comment
Revision No. 1 September 2001R-7
with Kanechlor Products. Agric. Biol. Chem. 45:717-726.

REFERENCES (continued)
Review Draft – For Public Comment
Revision No. 1 September 2001R-8
Taylor, D.M., Bligh, P.H., and Duggan, M.H. (1962) The Absorption of Calcium, Strontium, Barium, and Radiumfrom the Gastrointestinal Tract of the Rat. Biochem. J. 83:25-29.
U.S. EPA. (1989) Risk Assessment Guidance for Superfund, Volume I, Human Health Evaluation Manual
(Part A). Interim Final EPA/540/1-89/002. Washington, DC.
U.S. EPA. (1992a) Dermal Exposure Assessment: Principles and Applications. Office of Health andEnvironmental Assessment. EPA/600/6-88/005Cc.
U.S. EPA. (1992b) Memorandum: Guidance on Risk Characterization for Risk Managers and RiskAssessors. From F. Henry Habicht II, Deputy Administrator, U.S. EPA, Washington, DC.
U.S. EPA. (1995a) Policy for Risk Characterization. From Carol Browner, Administrator, U.S. EPA,Washington, DC.
U.S. EPA. (1995b) Groundwater Sampling Workshop - A Workshop Summary, Dallas, TX, November 30-December 2, 1993. EPA/600/R-94/205, NTIS PB 95-193249, 126pp.
U.S. EPA. (1996a) Low-Flow (Minimal Drawdown) Ground-Water Sampling Procedures. Office of Researchand Development and Office of Solid Waste and Emergency Response. EPA/540/S-95/504.
U.S. EPA. (1996b) Soil Screening Guidance: Technical Background Document. EPA/540/R-95/128. U.S. EPA. (1997a) Exposure Factors Handbook. EPA/600/P-95/002F.
U.S. EPA. (1997b) Policy for Use of Probabilistic Analysis in Risk Assessment. From Fred Hansen, DeputyAdministrator, Washington, DC.
Vecchia, B.E. (1997) “Estimating the Dermally Absorbed Dose From Chemical Exposure: Data Analysis,Parameter Estimation, and Sensitivity to Parameter Uncertainties”. M.S. Thesis, Colorado School of Mines,Golden, Colorado.
Waitz, J.A., Ober, R.E., Meisenhelder, J.E., and Thompson, P.E. (1965) Physiological Disposition of Antimonyafter Administration of 124Sb-labeled Tartar Emetic to Rats, Mice and Monkeys, and the Effects of tris(p-aminophenyl) Carbonium Pamoate on this Distribution. Bull. World Health Organization 33:537-546.
Wester, R.C., Maibach, H.I., Bucks, D.A.W., Sedik, L., Melendres, J., Laio, C.L., and DeZio, S. (1990)Percutaneous Absorption of [14C]DDT and [14C]Benzo(a)pyrene from Soil. Fund. Appl. Toxicol. 15:510-516.
Wester, R.C., Maibach, H.I., Sedik, L., Melendres, J., DeZio, S., and Wade, M. (1992a) In-vitro PercutaneousAbsorption of Cadmium from Water and Soil into Human Skin. Fund. Appl. Toxicol. 19:1-5.
Wester, R.C., Maibach, H.I., Sedik, L., Melendres, J., Laio, C.L., and DeZio, S. (1992b) PercutaneousAbsorption of [14C]Chlordane from Soil. J. Toxicol. Environ. Health 35:269-277.
Wester, R.C., Maibach, H.I., Sedik, L., Melendres, J., and Wade, M. (1993a) In-vivo and In-vitro Percutaneous

REFERENCES (continued)
Review Draft – For Public Comment
Revision No. 1 September 2001R-9
Absorption and Skin Decontamination of Arsenic from Water and Soil. Fund. Appl. Toxicol. 20:336-340.
Wester, R.C., Maibach, H.I., Sedik, L., Melendres, J., and Wade, M. (1993b) Percutaneous Absorption of PCBsfrom Soil: In-vivo Rhesus Monkey, In-vitro Human Skin, and Binding to Powered Human Stratum Corneum. J.Toxicol. Environ. Health 39:375-382.
Wester, R.C., Maibach, H.I., Sedik, L., Melendres, J., Wade, M, and DeZio, S. (1993c) PercutaneousAbsorption of Pentachlorophenol from Soil. Fund. Appl. Toxicology 20: 68-71.
Wester, R.C., Melendres, J., Logan, F., Hui, X. , and Maibach, H.I. (1996) Percutaneous Absorption of 2,4-Dichlorophenoxyacetic Acid from Soil with Respect to the Soil Load and Skin Contact Time: In-vivo Absorption inRhesus Monkey and in Vitro Absorption in Human Skin. J. Toxicol. Environ. Health 47:335-344.
Wilschut, A., ten Berge, W.F., Robinson, P.J. , and McKone, T.E. (1995) Estimating Skin Permeation—TheValidation of Five Mathematical Skin Permeation Models. Chemosphere 30, 1275-1296.
Yang, J.J., Roy, T.A., Krueger, A.J., Neil, W., and Mackerer, C.R. (1989) In-vitro and In-vivo PercutaneousAbsorption of Benzo[a]pyrene from Petroleum Crude-Fortified Soil in the Rat. Bull. Environ. Toxicol. 43:207-214.
Young, V.R., Nahapetian, A., and Janghorbani, M. (1982) Selenium Bioavailability with Reference to HumanNutrition. Am. J. Clin. Nutr. 35: 1076-1088.

Revision No. 0 January 1998
APPENDIX A
STANDARD TABLES
-Blank Standard Tables-Example Standard Tables

Revision No. 0 January 1998

Revision No. 0 January 1998
Blank Standard Tables
The Standard Table formats can not be altered (i.e., columnscan not be added, deleted, or changed); however, rows andfootnotes can be added as appropriate.

Revision No. 0 January 1998

TABLE 0SITE RISK ASSESSMENT IDENTIFICATION INFORMATION
Site Name
Site Name/OU:
Region:
EPA ID Number:
State:
Status:
Federal Facility (Y/N):
EPA Project Manager:
EPA Risk Assessor:Prepared by (Organization):Prepared for (Organization):
Document Title:
Document Date:Probabilistic Risk Assessment (Y/N):
Comments:
Page 1 of 1

TABLE 1
SELECTION OF EXPOSURE PATHWAYS
Site Name
Scenario Medium Exposure Exposure Receptor Receptor Exposure Type of Rationale for Selection or ExclusionTimeframe Medium Point Population Age Route Analysis of Exposure Pathway
Page 1 of 1

TABLE 2.1
OCCURRENCE, DISTRIBUTION, AND SELECTION OF CHEMICALS OF POTENTIAL CONCERN
Site Name
Scenario Timeframe: Medium: Exposure Medium:
Exposure CAS Chemical Minimum Maximum Units Location Detection Range of Concentration Background Screening Potential Potential COPC Rationale for
Point Number Concentration Concentration of Maximum Frequency Detection Used for Value Toxicity Value ARAR/TBC ARAR/TBC Flag Selection or
(Qualifier) (Qualifier) Concentration Limits Screening (N/C) Value Source (Y/N) Deletion
(1) (1) (2) (3) (4) (5)
Footnote Instructions:
(1) Define the "(Qualifier)" codes used for the "Minimum Concentration" and "Maximum Concentration".
(2) Specify source(s) for the "Concentration Used for Screening".
(3) Specify source(s) for the "Background Value".
(4) Specify source(s) for the "Screening Toxicity Value".
(5) Define the codes used for the "Rationale for Selection or Deletion".
Page 1 of 1

TABLE 3.1.CT
EXPOSURE POINT CONCENTRATION SUMMARY
CENTRAL TENDENCY
Site Name
Scenario Timeframe:
Medium:
Exposure Medium:
Maximum
Exposure Point Chemical of Units Arithmetic 95% UCL Concentration Exposure Point Concentration
Potential Concern Mean (Distribution) (Qualifier) Value Units Statistic Rationale
(1) (2)
Footnote Instructions:-Specify any assumptions made in calculating the "95% UCL" term.
(1) Define the codes describing the type of distribution for the "95% UCL" term.(2) Define the codes used for the "EPC Statistic".
Page 1 of 1

TABLE 3.1.RME
EXPOSURE POINT CONCENTRATION SUMMARY
REASONABLE MAXIMUM EXPOSURE
Site Name
Scenario Timeframe:
Medium:
Exposure Medium:
Maximum
Exposure Point Chemical of Units Arithmetic 95% UCL Concentration Exposure Point Concentration
Potential Concern Mean (Distribution) (Qualifier) Value Units Statistic Rationale
(1) (2)
Footnote Instructions:-Specify any assumptions made in calculating the "95% UCL" term.
(1) Define the codes describing the type of distribution for the "95% UCL" term.(2) Define the codes used for the "EPC Statistic".
Page 1 of 1

TABLE 4.1.CT
VALUES USED FOR DAILY INTAKE CALCULATIONS
CENTRAL TENDENCY
Site Name
Scenario Timeframe:
Medium:
Exposure Medium:
Exposure Route Receptor Population Receptor Age Exposure Point Parameter Parameter Definition Value Units Rationale/ Intake Equation/Code Reference Model Name
(1)
Footnote Instructions:
(1) Reference the section of the risk assessment text where information regarding modeled intake development can be found.
Page 1 of 1

TABLE 4.1.RME
VALUES USED FOR DAILY INTAKE CALCULATIONS
REASONABLE MAXIMUM EXPOSURE
Site Name
Scenario Timeframe:
Medium:
Exposure Medium:
Exposure Route Receptor Population Receptor Age Exposure Point Parameter Parameter Definition Value Units Rationale/ Intake Equation/Code Reference Model Name
(1)
Footnote Instructions:
(1) Reference the section of the risk assessment text where information regarding modeled intake development can be found.
Page 1 of 1

TABLE 5.1
NON-CANCER TOXICITY DATA -- ORAL/DERMAL
Site Name
Chemical Chronic/ Oral RfD Oral Absorption Absorbed RfD for Dermal Primary Combined RfD:Target Organ(s)
of Potential Subchronic Efficiency for Dermal Target Uncertainty/ModifyingConcern Value Units Value Units Organ(s) Factors Source(s) Date(s)
(1) (MM/DD/YYYY)
Footnote Instructions:
(1) Specify the source of the "Oral Absorption Efficiency for Dermal" in footnote.
-Specify the section of the risk assessment text where the derivation of the "Oral Absorption Efficiency for Dermal" can be found.
Page 1 of 1

TABLE 5.2
NON-CANCER TOXICITY DATA -- INHALATION
Site Name
Chemical Chronic/ Inhalation RfC Extrapolated RfD Primary Combined RfC : Target Organ(s)
of Potential Subchronic Target Uncertainty/ModifyingConcern Value Units Value Units Organ(s) Factors Source(s) Date(s)
(MM/DD/YYYY)
Footnote Instructions:
-Specify the section of the risk assessment text where the derivation of the "Extrapolated RfD" can be found.
Page 1 of 1

TABLE 5.3
NON-CANCER TOXICITY DATA -- SPECIAL CASE CHEMICALS
Site Name
Chemical Chronic/ Parameter Primary Target Combined Parameter:Target Organ(s)
of Potential Subchronic Organ(s) Uncertainty/ModifyingConcern Name Value Units Factors Source(s) Date(s)
(MM/DD/YYYY)
Page 1 of 1

TABLE 6.1
CANCER TOXICITY DATA -- ORAL/DERMAL
Site Name
Chemical Oral Cancer Slope Factor Oral Absorption Absorbed Cancer Slope Factor Weight of Evidence/ Oral CSF
of Potential Efficiency for Dermal for Dermal Cancer Guideline Concern Value Units Value Units Description Source(s) Date(s)
(1) (MM/DD/YYYY)
Footnote Instructions:
-Specify the section of the risk assessment text where the derivation of the "Absorbed Cancer Slope Factor for Dermal" can be found.
(1) Specify the source of "Oral Absorption Efficiency for Dermal" in footnote.
Page 1 of 1

TABLE 6.2
CANCER TOXICITY DATA -- INHALATION
Site Name
Chemical Unit Risk Inhalation Cancer Slope Factor Weight of Evidence/ Unit Risk : Inhalation CSF
of Potential Cancer Guideline Concern Value Units Value Units Description Source(s) Date(s)
(MM/DD/YYYY)
Page 1 of 1

TABLE 6.3
CANCER TOXICITY DATA -- SPECIAL CASE CHEMICALS
Site Name
Chemical Parameters Source(s) Date(s)
of Potential (MM/DD/YYYY)
Concern Name Value Units
Page 1 of 1

TABLE 6.4
CANCER TOXICITY DATA -- EXTERNAL (RADIATION)
Site Name
Chemical Cancer Slope Factor Source(s) Date(s)
of Potential (MM/DD/YYYY)
Concern Value Units
Page 1 of 1

TABLE 7.1.CT
CALCULATION OF CHEMICAL CANCER RISKS AND NON-CANCER HAZARDS
CENTRAL TENDENCY
Site Name
Scenario Timeframe:
Receptor Population:
Receptor Age:
Medium Exposure Medium Exposure Point Exposure Route Chemical of EPC Cancer Risk Calculations Non-Cancer Hazard CalculationsPotential Concern Value Units Intake/Exposure Concentration CSF/Unit Risk Cancer Risk Intake/Exposure Concentration RfD/RfC Hazard Quotient
Value Units Value Units Value Units Value Units
Exp. Route Total
Exp. Route Total
Exposure Point Total
Exposure Medium Total
Exp. Route Total
Exposure Point Total
Exposure Medium Total
Medium Total
Exp. Route Total
Exposure Point Total
Exp. Route Total
Exp. Route Total
Exposure Point Total
Exposure Medium Total
Medium Total
Total of Receptor Risks Across All Media Total of Receptor Hazards Across All Media
Page 1 of 1

TABLE 7a.1.CT
CALCULATION OF CHEMICAL CANCER RISKS
CENTRAL TENDENCY
Site Name
Scenario Timeframe:
Receptor Population:
Receptor Age:
Medium Exposure Medium Exposure Point Exposure Route Chemical of EPC Cancer Risk CalculationsPotential Concern Value Units Intake/Exposure Concentration CSF/Unit Risk Cancer Risk
Value Units Value Units
Exp. Route Total
Exp. Route Total
Exposure Point Total
Exposure Medium Total
Exp. Route Total
Exposure Point Total
Exposure Medium Total
Medium Total
Exp. Route Total
Exposure Point Total
Exp. Route Total
Exp. Route Total
Exposure Medium Total Exposure Point Total
Medium Total
Total of Receptor Risks Across All Media
Page 1 of 1

TABLE 7b.1.CT
CALCULATION OF CHEMICAL NON-CANCER HAZARDS
CENTRAL TENDENCY
Site Name
Scenario Timeframe:
Receptor Population:
Receptor Age:
Medium Exposure Medium Exposure Point Exposure Route Chemical of EPC Non-Cancer Hazard CalculationsPotential Concern Value Units Intake/Exposure Concentration RfD/RfC Hazard Quotient
Value Units Value Units
Exp. Route Total
Exp. Route Total
Exposure Point Total
Exposure Medium Total
Exp. Route Total
Exposure Point Total
Exposure Medium Total
Medium Total
Exp. Route Total
Exposure Point Total
Exp. Route Total
Exp. Route Total
Exposure Point Total
Exposure Medium Total
Medium Total
Total of Receptor Hazards Across All Media
Page 1 of 1

TABLE 7.1.RME
CALCULATION OF CHEMICAL CANCER RISKS AND NON-CANCER HAZARDS
REASONABLE MAXIMUM EXPOSURE
Site Name
Scenario Timeframe:
Receptor Population:
Receptor Age:
Medium Exposure Medium Exposure Point Exposure Route Chemical of EPC Cancer Risk Calculations Non-Cancer Hazard CalculationsPotential Concern Value Units Intake/Exposure Concentration CSF/Unit Risk Cancer Risk Intake/Exposure Concentration RfD/RfC Hazard Quotient
Value Units Value Units Value Units Value Units
Exp. Route Total
Exp. Route Total
Exposure Point Total
Exposure Medium Total
Exp. Route Total
Exposure Point Total
Exposure Medium Total
Medium Total
Exp. Route Total
Exposure Point Total
Exp. Route Total
Exp. Route Total
Exposure Point Total
Exposure Medium Total
Medium Total
Total of Receptor Risks Across All Media Total of Receptor Hazards Across All Media
Page 1 of 1

TABLE 7a.1.RME
CALCULATION OF CHEMICAL CANCER RISKS
REASONABLE MAXIMUM EXPOSURE
Site Name
Scenario Timeframe:
Receptor Population:
Receptor Age:
Medium Exposure Medium Exposure Point Exposure Route Chemical of EPC Cancer Risk CalculationsPotential Concern Value Units Intake/Exposure Concentration CSF/Unit Risk Cancer Risk
Value Units Value Units
Exp. Route Total
Exp. Route Total
Exposure Point Total
Exposure Medium Total
Exp. Route Total
Exposure Point Total
Exposure Medium Total
Medium Total
Exp. Route Total
Exposure Point Total
Exp. Route Total
Exp. Route Total
Exposure Point Total
Exposure Medium Total
Medium Total
Total of Receptor Risks Across All Media
Page 1 of 1

TABLE 7b.1.RME
CALCULATION OF CHEMICAL NON-CANCER HAZARDS
REASONABLE MAXIMUM EXPOSURE
Site Name
Scenario Timeframe:
Receptor Population:
Receptor Age:
Medium Exposure Medium Exposure Point Exposure Route Chemical of EPC Non-Cancer Hazard CalculationsPotential Concern Value Units Intake/Exposure Concentration RfD/RfC Hazard Quotient
Value Units Value Units
Exp. Route Total
Exp. Route Total
Exposure Point Total
Exposure Medium Total
Exp. Route Total
Exposure Point Total
Exposure Medium Total
Medium Total
Exp. Route Total
Exposure Point Total
Exp. Route Total
Exp. Route Total
Exposure Point Total
Exposure Medium Total
Medium Total
Total of Receptor Hazards Across All Media
Page 1 of 1

TABLE 8.1.CT
CALCULATION OF RADIATION CANCER RISKS
Central Tendency
Site Name
Scenario Timeframe:
Receptor Population:
Receptor Age:
Medium Exposure Medium Exposure Point Exposure Route Radionuclide of Potential Concern EPC Risk Calculation Cancer Risk Calculations
Value Units Approach Intake/Activity CSF Cancer Risk
Value Units Value Units
Exp. Route Total
Exp. Route Total
Exposure Point Total
Exposure Medium Total
Exp. Route Total
Exposure Point Total
Exposure Medium Total
Medium Total
Exp. Route Total
Exp. Route Total
Exposure Point Total
Exposure Medium Total
Medium Total
Total of Receptor Risks Across All Media
Page 1 of 1

TABLE 8.1.RME
CALCULATION OF RADIATION CANCER RISKS
Reasonable Maximum Exposure
Site Name
Scenario Timeframe:
Receptor Population:
Receptor Age:
Medium Exposure Medium Exposure Point Exposure Route Radionuclide of Potential Concern EPC Risk Calculation Cancer Risk Calculations
Value Units Approach Intake/Activity CSF Cancer Risk
Value Units Value Units
Exp. Route Total
Exp. Route Total
Exposure Point Total
Exposure Medium Total
Exp. Route Total
Exposure Point Total
Exposure Medium Total
Medium Total
Exp. Route Total
Exp. Route Total
Exposure Point Total
Exposure Medium Total
Medium Total
Total of Receptor Risks Across All Media
Page 1 of 1

TABLE 9.1.RME
SUMMARY OF RECEPTOR RISKS AND HAZARDS FOR COPCs
CENTRAL TENDENCY
Site Name
Scenario Timeframe:
Receptor Population:
Receptor Age:
Medium Exposure Exposure Chemical Carcinogenic Risk Non-Carcinogenic Hazard Quotient
Medium Point of Potential
Concern Ingestion Inhalation Dermal External Exposure Primary Ingestion Inhalation Dermal Exposure
(Radiation) Routes Total Target Organ(s) Routes Total
Chemical Total
Exposure Point Total
Exposure Medium Total
Chemical Total
Exposure Point Total
Exposure Medium Total
Medium Total
Chemical Total
Radionuclide Total
Exposure Point Total
Chemical Total
Radionuclide Total
Exposure Point Total
Exposure Medium Total
Medium Total
Receptor Total Receptor Risk Total Receptor HI Total
Total Organ 1 HI Across All Media =
Total Organ 2 HI Across All Media =
Page 1 of 1

TABLE 9.1.RME
SUMMARY OF RECEPTOR RISKS AND HAZARDS FOR COPCs
REASONABLE MAXIMUM EXPOSURE
Site Name
Scenario Timeframe:
Receptor Population:
Receptor Age:
Medium Exposure Exposure Chemical Carcinogenic Risk Non-Carcinogenic Hazard Quotient
Medium Point of Potential
Concern Ingestion Inhalation Dermal External Exposure Primary Ingestion Inhalation Dermal Exposure
(Radiation) Routes Total Target Organ(s) Routes Total
Chemical Total
Exposure Point Total
Exposure Medium Total
Chemical Total
Exposure Point Total
Exposure Medium Total
Medium Total
Chemical Total
Radionuclide Total
Exposure Point Total
Chemical Total
Radionuclide Total
Exposure Point Total
Exposure Medium Total
Medium Total
Receptor Total Receptor Risk Total Receptor HI Total
Total Organ 1 HI Across All Media =
Total Organ 2 HI Across All Media =
Page 1 of 1

TABLE 10.1.CT
RISK SUMMARY
CENTRAL TENDENCY
Site Name
Scenario Timeframe:
Receptor Population:
Receptor Age:
Medium Exposure Exposure Chemical Carcinogenic Risk Non-Carcinogenic Hazard Quotient
Medium Point
Ingestion Inhalation Dermal External Exposure Primary Ingestion Inhalation Dermal Exposure
(Radiation) Routes Total Target Organ(s) Routes Total
Chemical Total
Exposure Point Total
Exposure Medium Total
Chemical Total
Exposure Point Total
Exposure Medium Total
Medium Total
Chemical Total
Radionuclide Total
Exposure Point Total
Chemical Total
Radionuclide Total
Exposure Point Total
Exposure Medium Total
Medium Total
Receptor Total Receptor Risk Total Receptor HI Total
Total Organ 1 HI Across All Media =
Total Organ 2 HI Across All Media =
Page 1 of 1

TABLE 10.1.RME
RISK SUMMARY
REASONABLE MAXIMUM EXPOSURE
Site Name
Scenario Timeframe:
Receptor Population:
Receptor Age:
Medium Exposure Exposure Chemical Carcinogenic Risk Non-Carcinogenic Hazard Quotient
Medium Point
Ingestion Inhalation Dermal External Exposure Primary Ingestion Inhalation Dermal Exposure
(Radiation) Routes Total Target Organ(s) Routes Total
Chemical Total
Exposure Point Total
Exposure Medium Total
Chemical Total
Exposure Point Total
Exposure Medium Total
Medium Total
Chemical Total
Radionuclide Total
Exposure Point Total
Chemical Total
Radionuclide Total
Exposure Point Total
Exposure Medium Total
Medium Total
Receptor Total Receptor Risk Total Receptor HI Total
Total Organ 1 HI Across All Media =
Total Organ 2 HI Across All Media =
Page 1 of 1

Revision No. 0 January 1998
Example Standard Tables

Revision No. 0 January 1998

Page 1 of 1
TABLE 0
SITE RISK ASSESSMENT IDENTIFICATION INFORMATION
The Dean Company
Site Name/OU: The Dean Company
Region: III
EPA ID Number: PAD123456789
State: PA
Status: Fund Lead Remedial Investigation
Federal Facility (Y/N): N
EPA Project Manager: John Smith
EPA Risk Assessor: Jane Doe
Prepared by (Organization): Eris Consulting Engineers
Prepared for (Organization): EPA
Document Title: Human Health Risk Assessment for the Dean Company Site
Document Date: August 8, 2001
Probabilistic Risk Assessment (Y/N): N
Comments: This site is contaminated with volatile organic compounds, pesticides, and metals. Lead evaluation was conducted.

Page 1 of 1
TABLE 1
SELECTION OF EXPOSURE PATHWAYS
Site Name
Scenario Medium Exposure Exposure Receptor Receptor Exposure Type of Rationale for Selection or ExclusionTimeframe Medium Point Population Age Route Analysis of Exposure Pathway

Page 1 of 1
TABLE 2.1
OCCURRENCE, DISTRIBUTION, AND SELECTION OF CHEMICALS OF POTENTIAL CONCERN
The Dean Company
Scenario Timeframe: Future
Medium: Groundwater
Exposure Medium: Groundwater
Exposure CAS Chemical Minimum Maximum Units Location Detection Range of Concentration Background Screening Potential Potential COPC Rationale for
Point Number Concentration Concentration of Maximum Frequency Detection Used for Value (2) Toxicity Value (3) ARAR/TBC ARAR/TBC Flag Selection or
(Qualifier) (Qualifier) Concentration Limits Screening (1) (N/C) Value Source (Y/N) Deletion (4)
Aquifer 1 - Tap Water 117817 Bis(2-ethylhexyl)phthalate 2 J 5 J ug/l GW3D 4 / 12 3 - 4 5 NA 4.8 C 6 MCL Y ASL
67663 Chloroform 0.6 J 9 ug/l GW3D 3 / 12 1 - 1 9 NA 0.063 C 100 MCL Y ASL
75150 Carbon Disulfide 0.3 J 4.5 ug/l GW3D 3 / 12 1 - 1 4.5 NA 100 N NA NA N BSL
76448 Heptachlor 2 J 33 J ug/l GW4D 6 / 12 0.01 - 0.01 33 NA 0.015 C 0.4 MCL Y ASL
108883 Toluene 0.1 J 0.2 J ug/l GW3D 3 / 12 1 - 1 0.2 NA 75 N 1000 MCL N BSL
7429905 Aluminum 134 J 1340 ug/l GW3D 2 / 12 29 - 38.2 1340 NA 3700 N 50 - 200 SMCL N BSL
7440393 Barium 65 J 489 ug/l GW1D 6 / 12 0.2 - 1 489 NA 260 N 2000 MCL Y ASL
7440417 Beryllium 0.2 K 1.5 K ug/l GW2D 3 / 12 0.1 - 1 1.5 NA 7.3 N 4 MCL N BSL
7439921 Lead 6 J 35 J ug/l GW3D 4 / 12 0.1 - 1 35 NA 15 15 MCL Y ASL
7439965 Manganese 1900 12500 ug/l GW1D 6 / 12 0.3 - 1 12500 NA 73 N 50 SMCL Y ASL
7440020 Nickel 0.9 J 1.5 J ug/l GW4D 3 / 12 0.9 - 7 1.5 NA 73 N NA NA N BSL
(1) Maximum concentration used for screening. Definitions: NA = Not Applicable(2) To date, no background study has been completed. MCL = Maximum Contaminant Level
(3) All compounds were screened against the Risk-Based Concentration (RBC) Table, U.S. EPA Region III, SMCL = Secondary Maximum Contaminant Level May 8, 2001 for tap water (cancer benchmark = 1E-06; HQ = 0.1). Lead was screened against the J = Estimated Value
action level of 15 ug/l. K = Estimated Value - Biased High
(4) Rationale Codes: C = Carcinogen Selection Reason: Above Screening Level (ASL) N = Noncarcinogen
Deletion Reason: Below Screening Level (BSL)

Page 1 of 1
TABLE 2.2
OCCURRENCE, DISTRIBUTION, AND SELECTION OF CHEMICALS OF POTENTIAL CONCERN
The Dean Company
Scenario Timeframe: Future
Medium: Groundwater
Exposure Medium: Air
Exposure CAS Chemical Minimum Maximum Units Location Detection Range of Concentration Background Screening Potential Potential COPC Rationale for
Point Number Concentration Concentration of Maximum Frequency Detection Used for Value (2) Toxicity Value (3) ARAR/TBC ARAR/TBC Flag Selection or
(Qualifier) (Qualifier) Concentration Limits Screening (1) (N/C) Value Source (Y/N) Deletion (4)
Water Vapors fromShowerhead 117817 Bis(2-ethylhexyl)phthalate 2 J 5 J ug/l GW3D 4 / 12 3 - 4 5 NA 4.8 C 6 MCL Y ASL
67663 Chloroform 0.6 J 9 ug/l GW3D 3 / 12 1 - 1 9 NA 0.063 C 100 MCL Y ASL
75150 Carbon Disulfide 0.3 J 4.5 ug/l GW3D 3 / 12 1 - 1 4.5 NA 100 N NA NA N BSL
76448 Heptachlor 2 J 33 J ug/l GW4D 6 / 12 0.01 - 0.01 33 NA 0.015 C 0.4 MCL Y ASL
108883 Toluene 0.1 J 0.2 J ug/l GW3D 3 / 12 1 - 1 0.2 NA 75 N 1000 MCL N BSL
7429905 Aluminum 134 J 1340 ug/l GW3D 2 / 12 29 - 38.2 1340 NA 3700 N 50 - 200 SMCL N BSL
7440393 Barium 65 J 489 ug/l GW1D 6 / 12 0.2 - 1 489 NA 260 N 2000 MCL Y ASL
7440417 Beryllium 0.2 K 1.5 K ug/l GW2D 3 / 12 0.1 - 1 1.5 NA 7.3 N 4 MCL N BSL
7439921 Lead 6 J 35 J ug/l GW3D 4 / 12 0.1 - 1 35 NA 15 15 MCL Y ASL
7439965 Manganese 1900 12500 ug/l GW1D 6 / 12 0.3 - 1 12500 NA 73 N 50 SMCL Y ASL
7440020 Nickel 0.9 J 1.5 J ug/l GW4D 3 / 12 0.9 - 7 1.5 NA 73 N NA NA N BSL
(1) Maximum concentration used for screening. Definitions: NA = Not Applicable
(2) To date, no background study has been completed. MCL = Maximum Contaminant Level
(3) All compounds were screened against the Risk-Based Concentration (RBC) Table, U.S. EPA Region III, SMCL = Secondary Maximum Contaminant Level
May 8, 2001 for tap water (cancer benchmark = 1E-06; HQ = 0.1). Lead was screened against the J = Estimated Value
action level of 15 ug/l. K = Estimated Value - Biased High(4) Rationale Codes: C = Carcinogen
Selection Reason: Above Screening Level (ASL) N = Noncarcinogen
Deletion Reason: Below Screening Level (BSL)

Page 1 of 1
TABLE 2.3
OCCURRENCE, DISTRIBUTION, AND SELECTION OF CHEMICALS OF POTENTIAL CONCERN
The Dean Company
Scenario Timeframe: Future
Medium: Soil
Exposure Medium: Soil
Exposure CAS Chemical Minimum Maximum Units Location Detection Range of Concentration Background Screening Potential Potential COPC Rationale for
Point Number Concentration Concentration of Maximum Frequency Detection Used for Value (2) Toxicity Value (3) ARAR/TBC ARAR/TBC Flag Selection or
(Qualifier) (Qualifier) Concentration Limits Screening (1) (N/C) Value Source (Y/N) Deletion (4)
Soil at Site 1 11096825 Aroclor-1260 15 J 110 J ug/kg SS03 6 / 29 33 - 300 110 NA 320 C NA NA N BSL
56553 Benzo(a)anthracene 120 J 230 J ug/kg SS03 16 / 29 330 - 700 230 NA 870 C NA NA N BSL
50328 Benzo(a)pyrene 48 J 70 J ug/kg SS03 17 / 29 30 - 70 70 NA 87 C NA NA N BSL
75150 Carbon Disulfide 2 J 33 ug/kg SB07 4 / 29 10 - 16 33 NA 780000 N NA NA N BSL
72548 4,4'-DDD 1 J 4200 ug/kg SS09 22 / 29 3.3 - 1900 4200 NA 2700 C NA NA Y ASL
72559 4,4'-DDE 0.44 J 7200 J ug/kg SS09 28 / 29 2.2 - 700 7200 NA 1900 C NA NA Y ASL
50293 4,4'-DDT 0.69 J 290000 J ug/kg SB08 29 / 29 3.3 - 700 290000 NA 1900 C NA NA Y ASL
108883 Toluene 1 J 2 J ug/kg SS08 2 / 29 10 - 16 2 NA 1600000 N NA NA N BSL
7429905 Aluminum 1960 21700 mg/kg SB07 29 / 29 6.3 - 11 21700 NA 7800 N NA NA Y ASL
7440417 Beryllium 0.1 J 13.4 mg/kg SS06 23 / 29 0.02 - 0.21 13.4 NA 16 N NA NA N BSL
7439921 Lead 56 J 750 J mg/kg SS03 16 / 29 10 - 16 750 NA 400 NA NA Y ASL
7439965 Manganese 5.9 688 mg/kg SS03 29 / 29 0.05 - 0.5 688 NA 160 N NA NA Y ASL
7782492 Selenium 0.53 J 1 mg/kg SS02 9 / 29 0.43 - 0.75 1 NA 39 N NA NA N BSL
Soil at Site 2 67641 Acetone 9 J 170 ug/kg SB01 16 / 40 10 - 22 170 NA 780000 N NA NA N BSL
56553 Benzo(a)anthracene 48 J 100 J ug/kg SS26 31 / 40 340 - 700 100 NA 870 C NA NA N BSL
50328 Benzo(a)pyrene 47 J 60 J ug/kg SS26 29 / 40 34 - 70 60 NA 87 C NA NA N BSL
75150 Carbon Disulfide 2 J 17 J ug/kg SB07 13 / 40 10 - 22 17 NA 780000 N NA NA N BSL
72559 4,4'-DDE 0.14 J 4700 J ug/kg SS35 28 / 40 3.3 - 600 4700 NA 1900 C NA NA Y ASL
50293 4,4'-DDT 0.11 J 3100 J ug/kg SS32 27 / 40 3.3 - 600 3100 NA 1900 C NA NA Y ASL
84662 Diethylphthalate 30 J 170 J ug/kg SS12 10 / 40 340 - 3400 170 NA 6300000 N NA NA N BSL
7440417 Beryllium 0.08 J 1.5 J mg/kg SB07 34 / 40 0.02 - 0.36 1.5 NA 16 N NA NA N BSL
7440484 Cobalt 0.31 J 36 mg/kg SB02 28 / 40 0.08 - 2.9 36 NA 160 N NA NA N BSL
7440508 Copper 0.9 J 6470 mg/kg SS01 26 / 40 0.17 - 2.2 6470 NA 310 N NA NA Y ASL
7439896 Iron 371 120000 mg/kg SS01 24 / 40 2.7 - 13.5 120000 NA 2300 N NA NA Y ASL
7782492 Selenium 0.49 J 1.6 J mg/kg SS23 12 / 40 0.4 - 1.1 1.6 NA 39 N NA NA N BSL
(1) Maximum concentration used for screening. Definitions: NA = Not Applicable(2) To date, no background study has been completed. J = Estimated Value
(3) All compounds were screened against the Risk-Based Concentration (RBC) Table, U.S. EPA Region III, C = Carcinogen May 8, 2001 for residential soil (cancer benchmark = 1E-06; HQ = 0.1). Lead was screened against the N = Noncarcinogen U.S. EPA screening value of 400 mg/kg.(4) Rationale Codes:
Selection Reason: Above Screening Level (ASL) Deletion Reason: Below Screening Level (BSL)

Page 1 of 1
TABLE 3.1.RME
EXPOSURE POINT CONCENTRATION SUMMARY
REASONABLE MAXIMUM EXPOSURE
The Dean Company
Scenario Timeframe: Future
Medium: Groundwater
Exposure Medium: Groundwater
Maximum
Exposure Point Chemical of Units Arithmetic 95% UCL ConcentrationExposure Point Concentration
Potential Concern Mean (Distribution) (Qualifier) Value Units Statistic Rationale
Aquifer 1 - Tap Water Bis(2-ethylhexyl)phthalate ug/l 4 5.5 (T) 5 J 5 ug/l Max W-Test (1)
Chloroform ug/l 1.9 14.9 (T) 9 9 ug/l Max W-Test (1)
Heptachlor ug/l 27 30 (T) 33 J 30 ug/l 95% UCL - T W - Test (2)
Barium ug/l 224 2835 (T) 489 489 ug/l Max W-Test (1)
Lead ug/l 21 32 (T) 35 J 32 ug/l 95% UCL - T W - Test (2)
Manganese ug/l 6052 33449 (T) 12500 12500 ug/l Max W-Test (1)
Statistics: Maximum Detected Value (Max); 95% UCL of Transformed Data (95% UCL - T) T = Transformed
(1) 95% UCL exceeds maximum detected concentration. Therefore, maximum concentration used for EPC. J = Estimated Value
(2) Shapiro-Wilk W Test indicates data are log-normally distributed.

Page 1 of 1
TABLE 3.2.RME
EXPOSURE POINT CONCENTRATION SUMMARY
REASONABLE MAXIMUM EXPOSURE
The Dean Company
Scenario Timeframe: Future
Medium: Groundwater
Exposure Medium: Air
Maximum
Exposure Point Chemical of Units Arithmetic 95% UCL ConcentrationExposure Point Concentration
Potential Concern Mean (Distribution) (Qualifier) Value Units Statistic Rationale
Water Vapors from Bis(2-ethylhexyl)phthalate ug/l 4 5.5 (T) 5 J 5 ug/l Max W-Test (1)
Showerhead Chloroform ug/l 1.9 14.9 (T) 9 9 ug/l Max W-Test (1)
Heptachlor ug/l 27 30 (T) 33 J 30 ug/l 95% UCL - T W - Test (2)
Statistics: Maximum Detected Value (Max); 95% UCL of Transformed Data (95% UCL - T) T = Transformed
(1) 95% UCL exceeds maximum detected concentration. Therefore, maximum concentration used for EPC. J = Estimated Value
(2) Shapiro-Wilk W Test indicates data are log-normally distributed.

Page 1 of 1
TABLE 3.3.RME
EXPOSURE POINT CONCENTRATION SUMMARY
REASONABLE MAXIMUM EXPOSURE
The Dean Company
Scenario Timeframe: Future
Medium: Soil
Exposure Medium: Soil
Maximum
Exposure Point Chemical of Units Arithmetic 95% UCL ConcentrationExposure Point Concentration
Potential Concern Mean (Distribution) (Qualifier) Value Units Statistic Rationale
Soil at Site 1 4,4'-DDD ug/kg 239 452 (T) 4200 452 ug/kg 95 % UCL -T W - Test (2)
4,4'-DDE ug/kg 596 6793 (T) 7200 J 6793 ug/kg 95% UCL - T W - Test (2)
4,4'-DDT ug/kg 11007 28619 (N) 290000 J 28619 ug/kg 95% UCL - N W - Test (1)
Aluminum mg/kg 7450 9964 (T) 21700 9964 mg/kg 95% UCL - T W - Test (2)
Lead mg/kg 210 345 (T) 750 J 345 mg/kg 95% UCL - T W - Test (2)
Manganese mg/kg 116 201 (T) 688 201 mg/kg 95% UCL - T W - Test (2)
Soil at Site 2 4,4'-DDE ug/kg 230 496 4700 J 496 ug/kg 95 % UCL - T W - Test (2)
4,4'-DDT ug/kg 183 322 (T) 3100 J 322 ug/kg 95% UCL - T W - Test (2)
Copper mg/kg 173 245 (T) 6470 245 mg/kg 95% UCL - T W - Test (2)
Iron mg/kg 19518 32230 (T) 120000 32230 mg/kg 95% UCL - T W - Test (2)
Statistics: 95% UCL of Normal Data (95% UCL - N); 95% UCL of Transformed Data (95% UCL - T) N = Normal
(1) Shapiro-Wilk W Test indicates data are normally distributed. T = Transformed
(2) Shapiro-Wilk W Test indicates data are log-normally distributed. J = Estimated Value

Page 1 of 2
TABLE 4.1.RME
VALUES USED FOR DAILY INTAKE CALCULATIONS
REASONABLE MAXIMUM EXPOSURE
The Dean Company
Scenario Timeframe: Future
Medium: Groundwater
Exposure Medium: Groundwater
Exposure Route Receptor Population Receptor Age Exposure Point Parameter Parameter Definition Value Units Rationale/ Intake Equation/
Code Reference Model Name
Ingestion Resident Adult Aquifer 1 - Tap Water CW Chemical Concentration in Water See Table 3.1 mg/l See Table 3.1 Chronic Daily Intake (CDI) (mg/kg/day) =
IR-W Ingestion Rate of Water 2 l/day EPA, 1991 CW x IR-W x EF x ED x 1/BW x 1/AT
EF Exposure frequency 350 days/year EPA, 1991
ED Exposure Duration 24 years EPA, 1991
BW Body Weight 70 kg EPA, 1991
AT-C Averaging Time - Cancer 25,550 days EPA, 1989a
AT-N Averaging Time - Non-Cancer 8,760 days EPA, 1989a
Child Aquifer 1 - Tap Water CW Chemical Concentration in Water See Table 3.1 mg/l See Table 3.1 CDI (mg/kg/day) =
IR-W Ingestion Rate of Water 1 l/day EPA, 1989b CW x IR-W x EF x ED x 1/BW x 1/AT
EF Exposure frequency 350 days/year EPA, 1991
ED Exposure Duration 6 years EPA, 1991
BW Body Weight 15 kg EPA, 1991
AT-C Averaging Time - Cancer 25,550 days EPA, 1989a
AT-N Averaging Time - Non-Cancer 2,190 days EPA, 1989a
Dermal Resident Adult Aquifer 1 - Tap Water CW Chemical Concentration in Water See Table 3.1 mg/l See Table 3.1 Dermally Absorbed Dose (DAD) (mg/kg-day) =
FA Fraction Absorbed Water Chemical Specific - - EPA, 2001 DA-event x EV x ED x EF x SA x 1/BW x 1/AT
Kp Permeability Constant Chemical Specific cm/hr EPA, 2001 where for organic compounds,
SA Skin Surface Area 18,000 cm2 EPA, 2001 Absorbed Dose per Event (DA-event) (mg/cm2-event) =
tau-event Lag time per event Chemical Specific hours/event EPA, 2001 2 FA x Kp x CW x CF x SQRT{(6 x tau-event x t-event)/pi}
t-event Event Duration 0.58 hours/event EPA, 2001 or
B Ratio of permeability coefficient of a Chemical Specific - - EPA, 2001 DA-event = FA x Kp x CW x {(t-event/(1 + B)) +
compound through the stratum 2 x tau-event x ( (1 + (3 x B) + (3 x B x B))/(1 + B)2)}
corneum relative to its permeability and where for inorganic compounds,
coefficient across the viable DA-event = Kp x CW x CF x t-event
epidermis
EV Event Frequency 1 events/day EPA, 2001
EF Exposure Frequency 350 days/year EPA, 2001
ED Exposure Duration 24 years EPA, 1991

Page 2 of 2
TABLE 4.1.RME
VALUES USED FOR DAILY INTAKE CALCULATIONS
REASONABLE MAXIMUM EXPOSURE
The Dean Company
Scenario Timeframe: Future
Medium: Groundwater
Exposure Medium: Groundwater
Exposure Route Receptor Population Receptor Age Exposure Point Parameter Parameter Definition Value Units Rationale/ Intake Equation/
Code Reference Model Name
Dermal (contimued) Resident (continued Adult (continued) Aquifer 1 - Tap Water CF Volumetric Conversion Factor for Water 0.001 l/cm3 - -
BW Body Weight 70 kg EPA, 2001
AT-C Averaging Time - Cancer 25,550 days EPA, 2001
AT-N Averaging Time - Non-Cancer 8,760 days EPA, 2001
Child Aquifer 1 - Tap Water CW Chemical Concentration in Water See Table 3.1 mg/l See Table 3.1 DAD (mg/kg-day) =
FA Fraction Absorbed Water Chemical Specific - - EPA, 2001 DA-event x EV x ED x EF x SA x 1/BW x 1/AT
Kp Permeability Constant Chemical Specific cm/hr EPA, 2001 where for organic compounds,
SA Skin Surface Area 6,600 cm2 EPA, 2001 DA-event (mg/cm2-event) =
tau-event Lag time per event Chemical Specific hours/event EPA, 2001 2 FA x Kp x CW x CF x SQRT{(6 x tau-event x t-event)/pi}
t-event Event Duration 1 hours/event EPA, 2001 orB Ratio of permeability coefficient of a Chemical Specific - - EPA, 2001 DA-event = FA x Kp x CW x {(t-event/(1 + B)) +
compound through the stratum 2 x tau-event x ( (1 + (3 x B) + (3 x B x B))/(1 + B)2)}
corneum relative to its permeability and where for inorganic compounds,
coefficient across the viable DA-event = Kp x CW x CF x t-event
epidermis
EV Event Frequency 1 events/day EPA, 2001
EF Exposure Frequency 350 days/year EPA, 2001
ED Exposure Duration 6 years EPA, 2001
CF Volumetric Conversion Factor for Water 0.001 l/cm3 - -
BW Body Weight 15 kg EPA, 2001
AT-C Averaging Time - Cancer 25,550 days EPA, 2001
AT-N Averaging Time - Non-Cancer 2,190 days EPA, 2001
EPA 1989a: Risk Assessment Guidance for Superfund. Volume 1: Human Health Evaluation Manual, Part A. OERR EPA/540/1-89/002.
EPA 1989b: Exposure Factors Handbook, July 1989, EPA/600/8-89/043.
EPA 1991: Risk Assessment Guidance for Superfund. Volume 1: Human Health Evaluation Manual - Supplemental Guidance, Standard Default Exposure Factors. Interim Final. OSWER 9285.6-03.
EPA 1992: Dermal Exposure Assessment: Principles and Applications. EPA/600/8-91/011B.
EPA 1997: Exposure Factors Handbook, Volume 1. EPA/600/P-95/002Fa.
EPA 2001: Risk Assessment Guidance for Superfund. Volume 1: Human Health Evaluation Manual (Part E, Supplemental Guidance for Dermal Risk Assessment) Interim.

Page 1 of 1
TABLE 4.2.RME
VALUES USED FOR DAILY INTAKE CALCULATIONS
REASONABLE MAXIMUM EXPOSURE
The Dean Company
Scenario Timeframe: Future
Medium: Groundwater
Exposure Medium: Air
Exposure Route Receptor Population Receptor Age Exposure Point Parameter Parameter Definition Value Units Rationale/ Intake Equation/
Code Reference Model Name
Inhalation (1) Resident Adult Water Vapors from (1) (1) (1) (1) (1) Foster and Chrostowski Model
Showerhead
(1) Refer to the Risk Assessment text for details on the modeled intake methodology and parameters used to calculate modeled intake values for the Foster and Chrostowski Shower Model.

Page 1 of 4
TABLE 4.3.RME
VALUES USED FOR DAILY INTAKE CALCULATIONS
REASONABLE MAXIMUM EXPOSURE
The Dean Company
Scenario Timeframe: Future
Medium: Soil
Exposure Medium: Soil
Exposure Route Receptor Population Receptor Age Exposure Point Parameter Parameter Definition Value Units Rationale/ Intake Equation/
Code Reference Model Name
Ingestion Resident Adult Soil at Site 1 CS Chemical Concentration in Soil See Table 3.3 mg/kg See Table 3.3 Chronic Daily Intake (CDI) (mg/kg-day) =
IR-S Ingestion Rate of Soil 100 mg/day EPA, 1991 CS x IR x FI x EF x ED x CF1 x 1/BW x 1/AT
FI Fraction Ingested 1 - - Professional Judgment
EF Exposure Frequency 350 days/year EPA, 1991
ED Exposure Duration 24 years EPA, 1991
CF1 Conversion Factor 1E-06 kg/mg - -
BW Body Weight 70 kg EPA, 1991
AT-C Averaging Time - Cancer 25,550 days EPA, 1989
AT-N Averaging Time - Non-Cancer 8,760 days EPA, 1989
Soil at Site 2 CS Chemical Concentration in Soil See Table 3.3 mg/kg See Table 3.3 CDI (mg/kg-day) =
IR-S Ingestion Rate of Soil 100 mg/day EPA, 1991 CS x IR x FI x EF x ED x CF1 x 1/BW x 1/AT
FI Fraction Ingested 1 - - Professional Judgment
EF Exposure Frequency 350 days/year EPA, 1991
ED Exposure Duration 24 years EPA, 1991
CF1 Conversion Factor 1E-06 kg/mg - -
BW Body Weight 70 kg EPA, 1991
AT-C Averaging Time - Cancer 25,550 days EPA, 1989
AT-N Averaging Time - Non-Cancer 8,760 days EPA, 1989
Child Soil at Site 1 CS Chemical Concentration in Soil See Table 3.3 mg/kg See Table 3.3 CDI (mg/kg-day) =
IR-S Ingestion Rate of Soil 200 mg/day EPA, 1991 CS x IR x FI x EF x ED x CF1 x 1/BW x 1/AT
FI Fraction Ingested 1 - - Professional Judgment
EF Exposure Frequency 350 days/year EPA, 1991
ED Exposure Duration 6 years EPA, 1991
CF1 Conversion Factor 1E-06 kg/mg - -
BW Body Weight 15 kg EPA, 1991
AT-C Averaging Time - Cancer 25,550 days EPA, 1989
AT-N Averaging Time - Non-Cancer 2,190 days EPA, 1989

Page 2 of 4
TABLE 4.3.RME
VALUES USED FOR DAILY INTAKE CALCULATIONS
REASONABLE MAXIMUM EXPOSURE
The Dean Company
Scenario Timeframe: Future
Medium: Soil
Exposure Medium: Soil
Exposure Route Receptor Population Receptor Age Exposure Point Parameter Parameter Definition Value Units Rationale/ Intake Equation/
Code Reference Model Name
Ingestion (continued) Resident (continued) Child (continued) Soil at Site 2 CS Chemical Concentration in Soil See Table 3.3 mg/kg See Table 3.3 CDI (mg/kg-day) =
IR-S Ingestion Rate of Soil 200 mg/day EPA, 1991 CS x IR x FI x EF x ED x CF1 x 1/BW x 1/AT
FI Fraction Ingested 1 - - Professional Judgment
EF Exposure Frequency 350 days/year EPA, 1991
ED Exposure Duration 6 years EPA, 1991
CF1 Conversion Factor 1E-06 kg/mg - -
BW Body Weight 15 kg EPA, 1991
AT-C Averaging Time - Cancer 25,550 days EPA, 1989
AT-N Averaging Time - Non-Cancer 2,190 days EPA, 1989
Dermal Resident Adult Soil at Site 1 CS Chemical Concentration in Soil See Table 3.3 mg/kg See Table 3.3 Dermal Absorbed Dose (DAD) (mg/kg-day) =
CF Conversion Factor 1E-06 kg/mg - - DA-event x EF x ED x EV x SA X 1/BW x 1/AT
SA Skin Surface Area Available for Contact 5,700 cm2 EPA, 2001 where
AF Soil to Skin Adherence Factor 0.07 mg/cm2-event EPA, 2001 Absorbed Dose per Event (DA-event) (mg/cm2-event) =
ABS-d Dermal Absorption Factor chemical-specific unitless EPA, 2001 CS x CF x AF x ABS-d
EV Event Frequency 1 events/day EPA, 2001
EF Exposure Frequency 350 days/year EPA, 2001
ED Exposure Duration 24 years EPA, 1991
BW Body Weight 70 kg EPA, 2001
AT-C Averaging Time - Cancer 25,550 days EPA, 2001
AT-N Averaging Time - Non-Cancer 8,760 days EPA, 2001

Page 3 of 4
TABLE 4.3.RME
VALUES USED FOR DAILY INTAKE CALCULATIONS
REASONABLE MAXIMUM EXPOSURE
The Dean Company
Scenario Timeframe: Future
Medium: Soil
Exposure Medium: Soil
Exposure Route Receptor Population Receptor Age Exposure Point Parameter Parameter Definition Value Units Rationale/ Intake Equation/
Code Reference Model Name
Dermal (continued) Resident (continued) Adult (continued) Soil at Site 2 CS Chemical Concentration in Soil See Table 3.3 mg/kg See Table 3.3 DAD (mg/kg-day) =
CF Conversion Factor 1E-06 kg/mg - - DA-event x EF x ED x EV x SA X 1/BW x 1/AT
SA Skin Surface Area Available for Contact 5,700 cm2 EPA, 2001 where
AF Soil to Skin Adherence Factor 0.07 mg/cm2-event EPA, 2001 DA-event (mg/cm2-event) =
ABS-d Dermal Absorption Factor chemical-specific unitless EPA, 2001 CS x CF x AF x ABS-d
EV Event Frequency 1 events/day EPA, 2001
EF Exposure Frequency 350 days/year EPA, 2001
ED Exposure Duration 24 years EPA, 1991
BW Body Weight 70 kg EPA, 2001
AT-C Averaging Time - Cancer 25,550 days EPA, 2001
AT-N Averaging Time - Non-Cancer 8,760 days EPA, 2001
Child Soil at Site 1 CS Chemical Concentration in Soil See Table 3.3 mg/kg See Table 3.3 DAD (mg/kg-day) =
CF Conversion Factor 1E-06 kg/mg - - DA-event x EF x ED x EV x SA X 1/BW x 1/AT
SA Skin Surface Area Available for Contact 2,800 cm2 EPA, 2001 where
AF Soil to Skin Adherence Factor 0.2 mg/cm2-event EPA, 2001 DA-event (mg/cm2-event) =
ABS-d Dermal Absorption Factor chemical-specific unitless EPA, 2001 CS x CF x AF x ABS-d
EV Event Frequency 1 events/day EPA, 2001
EF Exposure Frequency 350 days/year EPA, 2001
ED Exposure Duration 6 years EPA, 2001
BW Body Weight 15 kg EPA, 2001
AT-C Averaging Time - Cancer 25,550 days EPA, 2001
AT-N Averaging Time - Non-Cancer 2,190 days EPA, 2001

Page 4 of 4
TABLE 4.3.RME
VALUES USED FOR DAILY INTAKE CALCULATIONS
REASONABLE MAXIMUM EXPOSURE
The Dean Company
Scenario Timeframe: Future
Medium: Soil
Exposure Medium: Soil
Exposure Route Receptor Population Receptor Age Exposure Point Parameter Parameter Definition Value Units Rationale/ Intake Equation/
Code Reference Model Name
Dermal (continued) Resident (continued) Child (continued) Soil at Site 2 CS Chemical Concentration in Soil See Table 3.3 mg/kg See Table 3.3 DAD (mg/kg-day) =
CF Conversion Factor 1E-06 kg/mg - - DA-event x EF x ED x EV x SA X 1/BW x 1/AT
SA Skin Surface Area Available for Contact 2,800 cm2 EPA, 2001 where
AF Soil to Skin Adherence Factor 0.2 mg/cm2-event EPA, 2001 DA-event (mg/cm2-event) =
ABS-d Dermal Absorption Factor chemical-specific unitless EPA, 2001 CS x CF x AF x ABS-d
EV Event Frequency 1 events/day EPA, 2001
EF Exposure Frequency 350 days/year EPA, 2001
ED Exposure Duration 6 years EPA, 2001
BW Body Weight 15 kg EPA, 2001
AT-C Averaging Time - Cancer 25,550 days EPA, 2001
AT-N Averaging Time - Non-Cancer 2,190 days EPA, 2001
EPA 1989: Risk Assessment Guidance for Superfund. Volume 1: Human Health Evaluation Manual, Part A. OERR EPA/540/1-89/002.
EPA 1991: Risk Assessment Guidance for Superfund. Volume 1: Human Health Evaluation Manual - Supplemental Guidance, Standard Default Exposure Factors. Interim Final. OSWER 9285.6-03.
EPA 1995: Assessing Dermal Exposure from Soil, Technical Guidance Manual, Region III, EPA/903-K-95-003.
EPA 1997: Exposure Factors Handbook, Volume 1. EPA/600/P-95/002Fa.
EPA 2001: Risk Assessment Guidance for Superfund. Volume 1: Human Health Evaluation Manual (Part E, Supplemental Guidance for Dermal Risk Assessment) Interim.

Page 1 of 1
TABLE 5.1
NON-CANCER TOXICITY DATA -- ORAL/DERMAL
The Dean Company
Chemical Chronic/ Oral RfD Oral Absoprtion Absorbed RfD for Dermal (2) Primary Combined RfD:Target Organ(s)
of Potential Subchronic Efficiency for Dermal (1) Target Uncertainty/Modifying
Concern Value Units Value Units Organ(s) Factors Source(s) Date(s)
(MM/DD/YYYY)
4,4'-DDD NA NA NA 1 NA NA NA NA NA NA
4,4'-DDE NA NA NA 1 NA NA NA NA NA NA
4,4'-DDT Chronic 5.0E-004 mg/kg/day 1 5.0E-004 mg/kg/day Liver 100 IRIS 06/21/2001
4,4'-DDT Subchronic 5.0E-004 mg/kg/day 1 5.0E-004 mg/kg/day Liver 100 HEAST 07/01/1997
Bis(2-ethylhexyl)phthalate Chronic 2.0E-02 mg/kg/day 1 2.0E-02 mg/kg/day Liver 1000 IRIS 06/21/2001
Bis(2-ethylhexyl)phthalate Subchronic 2.0E-02 mg/kg/day 1 2.0E-02 mg/kg/day Liver 1000 HEAST 07/01/1997
Chloroform Chronic 1.0E-02 mg/kg/day 1 1.0E-02 mg/kg/day Liver 1000 IRIS 06/21/2001
Chloroform Subchronic 1.0E-02 mg/kg/day 1 1.0E-02 mg/kg/day Liver 1000 HEAST 07/01/1997
Heptachlor Chronic 5.0E-04 mg/kg/day 1 5.0E-04 mg/kg/day Liver 300 IRIS 06/21/2001
Heptachlor Subchronic 5.0E-04 mg/kg/day 1 5.0E-04 mg/kg/day Liver 300 HEAST 07/01/1997
Aluminum Chronic 1.0E+00 mg/kg/day 1 1.0E+00 mg/kg/day Central Nervous System 100 NCEA 06/21/2001
Barium Chronic 7.0E-02 mg/kg/day 0.07 4.9E-03 mg/kg/day Heart 3 IRIS 02/02/2001
Barium Subchronic 7.0E-02 mg/kg/day 0.07 4.9E-03 mg/kg/day Heart 3 HEAST 07/01/1997
Copper Chronic 3.7E-02 mg/kg/day 1 3.7E-02 mg/kg/day Gastrointestinal NA HEAST 07/01/1997
Copper Subchronic 3.7E-02 mg/kg/day 1 3.7E-02 mg/kg/day Gastrointestinal NA HEAST 07/01/1997
Iron Chronic 3.0E-01 mg/kg/day 1 3.0E-01 mg/kg/day Gastrointestinal 1 NCEA 06/21/2001
Lead NA NA NA NA NA NA NA NA NA NA
Manganese (nonfood) Chronic 2.0E-02 mg/kg/day 0.04 8.0E-04 mg/kg/day Central Nervous System 1 IRIS 06/21/2001
(1) Source: Risk Assessment Guidance for Superfund. Volume 1: Human Health Definitions: NA = Not Available
Evaluation Manual (Part E, Supplemental Guidance for Dermal Risk Assessment) Interim. IRIS = Integrated Risk Information System
Section 4.2 and Exhibit 4-1. HEAST = Health Effects Assessment Summary Table, July 1997
(2) See Risk Assessment text for the derivation of the "Absorbed RfD for Dermal". NCEA = National Center for Environmental Assessment

Page 1 of 1
TABLE 5.2
NON-CANCER TOXICITY DATA -- INHALATION
The Dean Company
Chemical Chronic/ Inhalation RfC Extrapolated RfD (1) Primary Combined RfC : Target Organ(s)
of Potential Subchronic Target Uncertainty/Modifying
Concern Value Units Value Units Organ(s) Factors Source(s) Date(s)
(MM/DD/YYYY)
4,4'-DDD NA NA NA NA NA NA NA NA NA
4,4'-DDE NA NA NA NA NA NA NA NA NA
4,4'-DDT NA NA NA NA NA NA NA NA NA
Bis(2-ethylhexyl)phthalate NA NA NA NA NA NA NA NA NA
Chloroform Chronic 3.0E-04 mg/m3 8.6E-05 mg/kg/day Nasal 1000 NCEA 06/21/2001
Chloroform Subchronic 3.0E-03 mg/m3 8.6E-4 mg/kg/day Nasal 100 NCEA 06/21/2001
Heptachlor NA NA NA NA NA NA NA NA NA
Aluminum Chronic 5.0E-03 mg/m3 1.4E-03 mg/kg/day Central Nervous System 300 NCEA 06/21/2001
Barium Chronic 5.0E-04 mg/m3 1.4E-04 mg/kg/day Fetus 1000 HEAST 07/01/1997
Barium Subchronic 5.0E-03 mg/m3 1.4E-03 mg/kg/day Fetus 100 HEAST 07/01/1997
Copper NA NA NA NA NA NA NA NA NA
Iron NA NA NA NA NA NA NA NA NA
Lead NA NA NA NA NA NA NA NA NA
Manganese (nonfood) Chronic 5.0E-05 mg/m3 1.4E-05 mg/kg/day Central Nervous System 1000 IRIS 06/21/2001
(1) See Risk Assessment text for the derivation of the "Extrapolated RfD". Definitions: NA = Not Available
IRIS = Integrated Risk Information System
HEAST = Health Effects Assessment Summary Table, July 1997
NCEA = National Center for Environmental Assessment

Page 1 of 1
TABLE 5.3
NON-CANCER TOXICITY DATA -- SPECIAL CASE CHEMICALS
The Dean Company
Chemical Chronic/ Parameter Primary Target Combined Parameter:Target Organ(s)
of Potential Subchronic Organ(s) Uncertainty/Modifying
Concern Name Value Units Factors Source(s) Date(s)
(MM/DD/YYYY)
Not Applicable
There are no special case chemicals in this risk assessment. As a result, the table is blank.

Page 1 of 1
TABLE 6.1
CANCER TOXICITY DATA -- ORAL/DERMAL
The Dean Company
Chemical Oral Cancer Slope Factor Oral Absorption Absorbed Cancer Slope Factor Weight of Evidence/ Oral CSF
of Potential Efficiency for Dermal (1) for Dermal (2) Cancer Guideline
Concern Value Units Value Units Description Source(s) Date(s)
(MM/DD/YYYY)
4,4'-DDD 2.4E-01 1/mg/kg/day 1 2.4E-01 1/mg/kg/day B2 IRIS 06/21/2001
4,4'-DDE 3.4E-01 1/mg/kg/day 1 3.4E-01 1/mg/kg/day B2 IRIS 06/21/2001
4,4'-DDT 3.4E-001 1/mg/kg/day 1 3.4E-001 1/mg/kg/day B2 IRIS 06/21/2001
Bis(2-ethylhexyl)phthalate 1.4E-02 1/mg/kg/day 1 1.4E-02 1/mg/kg/day B2 IRIS 06/21/2001
Chloroform 6.1E-03 1/mg/kg/day 1 6.1E-03 1/mg/kg/day B2 IRIS 06/21/2001
Heptachlor 4.5E+00 1/mg/kg/day 1 4.5E+00 1/mg/kg/day B2 IRIS 06/21/2001
Aluminum NA NA 1 NA NA NA NA NA
Barium NA NA 0.07 NA NA NA NA NA
Copper NA NA 1 NA NA NA NA NA
Iron NA NA 1 NA NA NA NA NA
Lead NA NA NA NA NA NA NA NA
Manganese (nonfood) NA NA 0.04 NA NA NA NA NA
(1) Source: Risk Assessment Guidance for Superfund. Volume 1: Human Health Definitions: NA = Not Available
Evaluation Manual (Part E, Supplemental Guidance for Dermal Risk Assessment) Interim. IRIS = Integrated Risk Information System
Section 4.2 and Exhibit 4-1. B2 = Probable Human Carcinogen - indicates sufficient evidence
(2) See Risk Assessment text for the derivation of the "Absorbed Cancer Slope Factor for Dermal". in animals and inadequate or no evidence in humans

Page 1 of 1
TABLE 6.2
CANCER TOXICITY DATA -- INHALATION
The Dean Company
Chemical Unit Risk Inhalation Cancer Slope Factor Weight of Evidence/ Unit Risk : Inhalation CSF
of Potential Cancer Guideline
Concern Value Units Value Units Description Source(s) Date(s)
(MM/DD/YYYY)
4,4'-DDD NA NA NA NA NA NA NA
4,4-DDE NA NA NA NA NA NA NA
4,4'-DDT 9.7E-005 1/ug/m3 3.4E-001 1/mg/kg/day B2 IRIS 06/21/2001
Bis(2-ethylhexyl)phthalate NA NA NA NA NA NA NA
Chloroform 2.3E-05 1/ug/m3 8.1E-02 1/mg/kg/day B2 IRIS 06/21/2001
Heptachlor 1.3E-03 1/ug/m3 4.5E+00 1/mg/kg/day B2 IRIS 06/21/2001
Aluminum NA NA NA NA NA NA NA
Barium NA NA NA NA NA NA NA
Copper NA NA NA NA NA NA NA
Iron NA NA NA NA NA NA NA
Lead NA NA NA NA NA NA NA
Manganese (nonfood) NA NA NA NA NA NA NA
Thallium NA NA NA NA NA NA NA
Definitions: NA = Not Available
IRIS = Integrated Risk Information System
B2 = Probable Human Carcinogen - indicates sufficient evidence
in animals and inadequate or no evidence in humans

Page 1 of 1
TABLE 6.3
CANCER TOXICITY DATA -- SPECIAL CASE CHEMICALS
The Dean Company
Chemical Parameters Source(s) Date(s)
of Potential (MM/DD/YYYY)
Concern Name Value Units
Not Applicable
There are no special case chemicals in this risk assessment. As a result, this table is blank.

Page 1 of 1
TABLE 6.4
CANCER TOXICITY DATA -- EXTERNAL (RADIATION)
The Dean Company
Chemical Cancer Slope Factor Source(s) Date(s)
of Potential (MM/DD/YYYY)
Concern Value Units
Not Applicable
There are no radionuclides in this risk assessment. As a result, this table is blank.

Page 1 of 2
TABLE 7.1.RME
CALCULATION OF CHEMICAL CANCER RISKS AND NON-CANCER HAZARDS
REASONABLE MAXIMUM EXPOSURE
The Dean Company
Scenario Timeframe: Future
Receptor Population: Resident
Receptor Age: Adult
Medium Exposure Medium Exposure Point Exposure Route Chemical of EPC Cancer Risk Calculations Non-Cancer Hazard CalculationsPotential Concern Value Units Intake/Exposure Concentration CSF/Unit Risk Cancer Risk Intake/Exposure Concentration RfD/RfC Hazard Quotient
Value Units Value Units Value Units Value Units
Groundwater Groundwater Aquifer 1 - Tap Water Ingestion Bis(2-ethylhexyl)phthalate 0.005 mg/l 4.7E-05 mg/kg/day 1.4E-02 1/mg/kg/day 7E-07 1.4E-04 mg/kg/day 2.0E-02 mg/kg/day 0.007
Chloroform 0.009 mg/l 8.5E-05 mg/kg/day 6.1E-03 1/mg/kg/day 5E-07 2.5E-04 mg/kg/day 1.0E-02 mg/kg/day 0.03
Heptachlor 0.03 mg/l 2.8E-04 mg/kg/day 4.5E-00 1/mg/kg/day 1E-03 8.1E-04 mg/kg/day 5.0E-04 mg/kg/day 2
Barium 0.489 mg/l 4.6E-03 mg/kg/day NA NA NA 1.3E-02 mg/kg/day 7.0E-02 mg/kg/day 0.2
Lead (1) - - - - - - - - - - - - - - - - - - - - - - - -
Manganese 12.5 mg/l 1.2E-01 mg/kg/day NA NA NA 3.4E-01 mg/kg/day 2.0E-02 mg/kg/day 17
Exp. Route Total 1E-03 19
Dermal Bis(2-ethylhexyl)phthalate 0.005 mg/l 7.2E-05 mg/kg/day 1.4E-02 1/mg/kg/day 1E-06 2.1E-04 mg/kg/day 2.2E-02 mg/kg/day 0.01
Chloroform 0.009 mg/l 1.7E-04 mg/kg/day 6.1E-03 1/mg/kg/day 1E-06 4.9E-04 mg/kg/day 1.0E-02 mg/kg/day 0.05
Heptachlor 0.03 mg/l 1.3E-04 mg/kg/day 4.5E-00 1/mg/kg/day 6E-04 3.9E-04 mg/kg/day 5.0E-04 mg/kg/day 0.8
Barium 0.489 mg/l NA NA NA NA NA NA NA NA NA NA
Lead (1) - - - - - - - - - - - - - - - - - - - - - - - -
Manganese 12.5 mg/l NA NA NA NA NA NA NA NA NA NA
Exp. Route Total 6E-04 0.9
Exposure Point Total 2E-03 20
Exposure Medium Total 2E-03 20
Air Water Vapors from Inhalation Bis(2-ethylhexyl)phthalate 0.005 mg/l 2.3E-06 mg/kg/day NA NA NA 3.6E-06 mg/kg/day NA NA NA
Showerhead Chloroform 0.009 mg/l 1.3E-04 mg/kg/day 8.1E-02 1/mg/kg/day 1E-05 3.9E-04 mg/kg/day 8.6E-05 mg/kg/day 5
Heptachlor 0.03 mg/l 2.6E-04 mg/kg/day 4.5E-00 1/mg/kg/day 1E-03 7.7E-04 mg/kg/day NA NA NA
Exp. Route Total 1E-03 5
Exposure Point Total 1E-03 5
Exposure Medium Total 1E-03 5
Groundwater Total 3E-03 25
Soil Soil Soil at Site 1 Ingestion 4,4'-DDD 0.452 mg/kg 2.1E-07 mg/kg/day 2.4E-01 1/mg/kg/day 5E-08 6.2E-07 mg/kg/day NA NA NA
4,4'-DDE 6.8 mg/kg 3.2E-06 mg/kg/day 3.4E-01 1/mg/kg/day 1E-06 9.3E-06 mg/kg/day NA NA NA
4,4'-DDT 28.6 mg/kg 1.3E-05 mg/kg/day 3.4E-01 1/mg/kg/day 5E-06 3.9E-05 mg/kg/day 5.0E-04 mg/kg/day 0.08
Aluminum 9964 mg/kg 4.7E-03 mg/kg/day NA NA NA 1.4E-02 mg/kg/day 1.0E+00 mg/kg/day 0.01
Lead (1) - - - - - - - - - - - - - - - - - - - - - - - -
Manganese 201 mg/kg 9.5E-05 mg/kg/day NA NA NA 2.8E-04 mg/kg/day 1.4E-01 mg/kg/day 0.002
Exp. Route Total 6E-06 0.09
Dermal 4,4'-DDD 0.452 mg/kg NA NA NA NA NA NA NA NA NA NA
4,4'-DDE 6.8 mg/kg NA NA NA NA NA NA NA NA NA NA
4,4'-DDT 28.6 mg/kg 1.6E-06 mg/kg/day 3.4E-01 1/mg/kg/day 5E-07 4.7E-06 mg/kg/day 5.0E-04 mg/kg/day 0.009
Aluminum 9964 mg/kg NA NA NA NA NA NA NA NA NA NA
Lead (1) - - - - - - - - - - - - - - - - - - - - - - - -
Manganese 201 mg/kg NA NA NA NA NA NA NA NA NA NA
Exp. Route Total 5E-07 0.009
Exposure Point Total 7E-06 0.1

Page 2 of 2
TABLE 7.1.RME
CALCULATION OF CHEMICAL CANCER RISKS AND NON-CANCER HAZARDS
REASONABLE MAXIMUM EXPOSURE
The Dean Company
Scenario Timeframe: Future
Receptor Population: Resident
Receptor Age: Adult
Medium Exposure Medium Exposure Point Exposure Route Chemical of EPC Cancer Risk Calculations Non-Cancer Hazard CalculationsPotential Concern Value Units Intake/Exposure Concentration CSF/Unit Risk Cancer Risk Intake/Exposure Concentration RfD/RfC Hazard Quotient
Value Units Value Units Value Units Value Units
Soil (continued) Soil (continued) Soil at Site 2 Ingestion 4,4'-DDE 0.496 mg/kg 2.3E-07 mg/kg/day 3.4E-01 1/mg/kg/day 8E-08 6.8E-07 mg/kg/day NA NA NA
4,4'-DDT 0.322 mg/kg 1.5E-07 mg/kg/day 3.4E-01 1/mg/kg/day 5E-08 4.4E-07 mg/kg/day 5.0E-04 mg/kg/day 0.0009
Copper 245 mg/kg 1.2E-04 mg/kg/day NA NA NA 3.4E-04 mg/kg/day 3.7E-02 mg/kg/day 0.009
Iron 32230 mg/kg 1.5E-02 mg/kg/day NA NA NA 4.4E-02 mg/kg/day 3.0E-01 mg/kg/day 0.1
Exp. Route Total 1E-07 0.1
Dermal 4,4'-DDE 0.496 mg/kg NA NA NA NA NA NA NA NA NA NA
4,4'-DDT 0.322 mg/kg 1.8E-08 mg/kg/day 3.4E-01 1/mg/kg/day 6E-09 5.3E-08 mg/kg/day 5.0E-04 mg/kg/day 0.0001
Copper 245 mg/kg NA NA NA NA NA NA NA NA NA NA
Iron 32230 mg/kg NA NA NA NA NA NA NA NA NA NA
Exp. Route Total 6E-09 0.0001
Exposure Point Total 1E-07 0.1
Exposure Medium Total 7E-06 0.2
Soil Total 7E-06 0.2
Total of Receptor Risks Across All Media 3E-03 Total of Receptor Hazards Across All Media 25
(1) Lead is evaluated for the resident using the IEUBK model. See Risk Assessment text for discussion of results and appendix for the lead modeling run results.

Page 1 of 2
TABLE 7.2.RME
CALCULATION OF CHEMICAL CANCER RISKS AND NON-CANCER HAZARDS
REASONABLE MAXIMUM EXPOSURE
The Dean Company
Scenario Timeframe: Future
Receptor Population: Resident
Receptor Age: Child
Medium Exposure Medium Exposure Point Exposure Route Chemical of EPC Cancer Risk Calculations Non-Cancer Hazard CalculationsPotential Concern Value Units Intake/Exposure Concentration CSF/Unit Risk Cancer Risk Intake/Exposure Concentration RfD/RfC Hazard Quotient
Value Units Value Units Value Units Value UnitsGroundwater Groundwater Aquifer 1 - Tap Water Ingestion Bis(2-ethylhexyl)phthalate 0.005 mg/l 2.7E-05 mg/kg/day 1.4E-02 1/mg/kg/day 4E-07 3.2E-04 mg/kg/day 2.0E-02 mg/kg/day 0.02
Chloroform 0.009 mg/l 4.9E-05 mg/kg/day 6.1E-03 1/mg/kg/day 3E-07 5.8E-04 mg/kg/day 1.0E-02 mg/kg/day 0.06
Heptachlor 0.03 mg/l 1.6E-04 mg/kg/day 4.5E-00 1/mg/kg/day 7E-04 1.9E-03 mg/kg/day 5.0E-04 mg/kg/day 4
Barium 0.489 mg/l 2.7E-03 mg/kg/day NA NA NA 3.1E-02 mg/kg/day 7.0E-02 mg/kg/day 0.4
Lead (1) - - - - - - - - - - - - - - - - - - - - - - - -
Manganese 12.5 mg/l 6.8E-02 mg/kg/day NA NA NA 8.0E-01 mg/kg/day 2.0E-02 mg/kg/day 40
Exp. Route Total 7E-04 44
Dermal Bis(2-ethylhexyl)phthalate 0.005 mg/l 3.1E-05 mg/kg/day 1.4E-02 1/mg/kg/day 4E-07 3.6E-04 mg/kg/day 2.2E-02 mg/kg/day 0.02
Chloroform 0.009 mg/l 7.2E-05 mg/kg/day 6.1E-03 1/mg/kg/day 4E-07 8.4E-04 mg/kg/day 1.0E-02 mg/kg/day 0.08
Heptachlor 0.03 mg/l 5.7E-05 mg/kg/day 4.5E-00 1/mg/kg/day 3E-04 6.7E-04 mg/kg/day 5.0E-04 mg/kg/day 1
Barium 0.489 mg/l NA NA NA NA NA NA NA NA NA NA
Lead (1) - - - - - - - - - - - - - - - - - - - - - - - -
Manganese 12.5 mg/l NA NA NA NA NA NA NA NA NA NA
Exp. Route Total 3E-04 1
Exposure Point Total 1E-03 45
Exposure Medium Total 1E-03 45
Groundwater Total 1E-03 45
Soil Soil Soil at Site 1 Ingestion 4,4'-DDD 0.452 mg/kg 5.0E-07 mg/kg/day 2.4E-01 1/mg/kg/day 1E-07 5.8E-06 mg/kg/day NA NA NA
4,4'-DDE 6.8 mg/kg 7.4E-06 mg/kg/day 3.4E-01 1/mg/kg/day 3E-06 8.7E-05 mg/kg/day NA NA NA
4,4'-DDT 28.6 mg/kg 3.1E-05 mg/kg/day 3.4E-01 1/mg/kg/day 1E-05 3.7E-04 mg/kg/day 5.0E-04 mg/kg/day 0.7
Aluminum 9964 mg/kg 1.1E-02 mg/kg/day NA NA NA 1.3E-01 mg/kg/day 1.0E-00 mg/kg/day 0.1
Lead (1) - - - - - - - - - - - - - - - - - - - - - - - -
Manganese 201 mg/kg 2.2E-04 mg/kg/day NA NA NA 2.6E-03 mg/kg/day 1.4E-01 mg/kg/day 0.02
Exp. Route Total 1E-05 0.8
Dermal 4,4'-DDD 0.452 mg/kg NA NA NA NA NA NA NA NA NA NA
4,4'-DDE 6.8 mg/kg NA NA NA NA NA NA NA NA NA NA
4,4'-DDT 28.6 mg/kg 2.6E-06 mg/kg/day 3.4E-01 1/mg/kg/day 9E-07 3.1E-05 mg/kg/day 5.0E-04 mg/kg/day 0.06
Aluminum 9964 mg/kg NA NA NA NA NA NA NA NA NA NA
Lead (1) - - - - - - - - - - - - - - - - - - - - - - - -
Manganese 201 mg/kg NA NA NA NA NA NA NA MA NA NA
Exp. Route Total 9E-07 0.06
Exposure Point Total 1E-05 0.9

Page 2 of 2
TABLE 7.2.RME
CALCULATION OF CHEMICAL CANCER RISKS AND NON-CANCER HAZARDS
REASONABLE MAXIMUM EXPOSURE
The Dean Company
Scenario Timeframe: Future
Receptor Population: Resident
Receptor Age: Child
Medium Exposure Medium Exposure Point Exposure Route Chemical of EPC Cancer Risk Calculations Non-Cancer Hazard CalculationsPotential Concern Value Units Intake/Exposure Concentration CSF/Unit Risk Cancer Risk Intake/Exposure Concentration RfD/RfC Hazard Quotient
Value Units Value Units Value Units Value UnitsSoil (continued) Soil (continued) Soil at Site 2 Ingestion 4,4'-DDE 0.496 mg/kg 5.4E-07 mg/kg/day 3.4E-01 1/mg/kg/day 2E-07 6.3E-06 mg/kg/day NA NA NA
4,4'-DDT 0.322 mg/kg 3.5E-07 mg/kg/day 3.4E-01 1/mg/kg/day 1E-07 4.1E-06 mg/kg/day 5.0E-04 mg/kg/day 0.008
Copper 245 mg/kg 2.7E-04 mg/kg/day NA NA NA 3.1E-03 mg/kg/day 3.7E-02 mg/kg/day 0.08
Iron 32230 mg/kg 3.5E-02 mg/kg/day NA NA NA 4.1E-01 mg/kg/day 3.0E-01 mg/kg/day 1
Exp. Route Total 3E-07 1
Dermal 4,4'-DDE 0.496 mg/kg NA NA NA NA NA NA NA NA NA NA
4,4'-DDT 0.322 mg/kg 3.0E-08 mg/kg/day 3.4E-04 1/mg/kg/day 1E-08 3.5E-007 mg/kg/day 5.0E-004 mg/kg/day 0.0007
Copper 245 mg/kg NA NA NA NA NA NA NA NA NA NA
Iron 32230 mg/kg NA NA NA NA NA NA NA NA NA NA
Exp. Route Total 1E-08 0.0007
Exposure Point Total 3E-07 1Exposure Medium Total 1E-05 2
Soil Total 1E-05 2
Total of Receptor Risks Across All Media 1E-03 Total of Receptor Hazards Across All Media 47
(1) Lead is evaluated for the resident using the IEUBK model. See Risk Assessment text for discussion of results and appendix for the lead modeling run results.

Page 1 of 1
TABLE 8.1.RME
CALCULATION OF RADIATION CANCER RISKS
The Dean Company
Scenario Timeframe:
Receptor Population:
Receptor Age:
Medium Exposure Medium Exposure Point Exposure Route Radionuclide of Potential Concern EPC Risk Calculation Cancer Risk Calculations
Value Units Approach Intake/Activity CSF Cancer Risk
Value Units Value Units
Exp. Route Total
Exp. Route Total
Exposure Point Total
Not Applicable
Exp. Route Total
Exposure Point Total
Exp. Route Total
Exp. Route Total
Exposure Point Total
Total of Receptor Risks Across All Media
There are no radionuclides in this risk assessment. As a result, this table is blank.

Page 1 of 3
TABLE 9.1.RME
SUMMARY OF RECEPTOR RISKS AND HAZARDS FOR COPCs
REASONABLE MAXIMUM EXPOSURE
The Dean Company
Scenario Timeframe: Future
Receptor Population: Resident
Receptor Age: Adult
Medium Exposure Exposure Chemical Carcinogenic Risk Non-Carcinogenic Hazard Quotient
Medium Point of Potential
Concern Ingestion Inhalation Dermal External Exposure Primary Ingestion Inhalation Dermal Exposure
(Radiation) Routes Total Target Organ(s) Routes Total
Groundwater Groundwater Aquifer 1 - Tap Water Bis(2-ethylhexyl)phthalate 7E-07 - - 1E-06 - - 2E-06 Liver 0.007 - - 0.01 0.02
Chloroform 5E-07 - - 1E-06 - - 2E-06 Liver 0.03 - - 0.05 0.08
Heptachlor 1E-03 - - 6E-04 - - 2E-03 Liver 2 - - 0.8 3
Barium - - - - - - - - - - Heart 0.2 - - - - 0.2
Lead (1) - - - - - - - - - - - - - - - - - - - -
Manganese - - - - - - - - - - Central Nervous System 17 - - - - 17
Chemical Total 1E-03 - - 6E-04 - - 2E-03 19 - - 0.9 20
Radionuclide Total
Exposure Point Total 2E-03 20
Exposure Medium Total 2E-03 20
Air Water Vapors from Bis(2-ethylhexyl)phthalate - - - - - - - - - - - - - - - - - - - -
Showerhead Chloroform - - 1E-05 - - - - 1E-05 Liver - - 5 - - 5
Heptachlor - - 1E-03 - - - - 1E-03 - - - - - - - - - -
Barium - - - - - - - - - - - - - - - - - - - -
Lead (1) - - - - - - - - - - - - - - - - - - - -
Manganese - - - - - - - - - - - - - - - - - - - -
Chemical Total - - 1E-03 - - - - 1E-03 - - 5 - - 5
Radionuclide Total
Exposure Point Total 1E-03 5
Exposure Medium Total 1E-03 5
Groundwater Total 3E-03 25

Page 2 of 3
TABLE 9.1.RME
SUMMARY OF RECEPTOR RISKS AND HAZARDS FOR COPCs
REASONABLE MAXIMUM EXPOSURE
The Dean Company
Scenario Timeframe: Future
Receptor Population: Resident
Receptor Age: Adult
Medium Exposure Exposure Chemical Carcinogenic Risk Non-Carcinogenic Hazard Quotient
Medium Point of Potential
Concern Ingestion Inhalation Dermal External Exposure Primary Ingestion Inhalation Dermal Exposure
(Radiation) Routes Total Target Organ(s) Routes Total
Soil Soil Soil at Site 1 4,4'-DDD 5E-08 - - - - - - 5E-08 - - - - - - - - - -
4,4'-DDE 1E-06 - - - - - - 1E-06 - - - - - - - - - -
4,4'-DDT 5E-06 - - 5E-07 - - 6E-06 Liver 0.08 - - 0.009 0.09
Aluminum - - - - - - - - - - Central Nervous System 0.01 - - - - 0.01
Lead (1) - - - - - - - - - - - - - - - - - - - -
Manganese - - - - - - - - - - Central Nervous System 0.002 - - - - 0.002
Chemical Total 6E-06 - - 5E-07 - - 7E-06 0.09 - - 0.009 0.1
Radionuclide Total
Exposure Point Total 7E-06 0.1
Soil at Site 2 4,4'-DDE 8E-08 - - - - - - 8E-08 - - - - - - - - - -
4,4'-DDT 5E-08 - - 6E-09 - - 6E-08 Liver 0.0009 - - 0.0001 0.001
Copper - - - - - - - - - - Gastrointestinal 0.009 - - - - 0.009
Iron - - - - - - - - - - Gastrointestinal 0.1 - - - - 0.1
Chemical Total 1E-07 - - 6E-09 - - 1E-07 0.1 - - 0.0001 0.1
Radionuclide Total
Exposure Point Total 1E-07 0.1
Exposure Medium Total 7E-06 0.2
Soil Total 7E-06 0.2
Receptor Total 3E-03 26
Total Risk Across All Media = 3E-03 Total Hazard Across All Media 26
Total Liver HI Across All Media = 8

Page 3 of 3
TABLE 9.1.RME
SUMMARY OF RECEPTOR RISKS AND HAZARDS FOR COPCs
REASONABLE MAXIMUM EXPOSURE
The Dean Company
Scenario Timeframe: Future
Receptor Population: Resident
Receptor Age: Adult
Medium Exposure Exposure Chemical Carcinogenic Risk Non-Carcinogenic Hazard Quotient
Medium Point of Potential
Concern Ingestion Inhalation Dermal External Exposure Primary Ingestion Inhalation Dermal Exposure
(Radiation) Routes Total Target Organ(s) Routes Total
(1) Lead is evaluated for the resident using the IEUBK model. See Risk Assessment text for discussion of results and appendix for the lead modleing run results. Total Central Nervous System HI Across All Media = 17

Page 1 of 2
TABLE 9.2.RME
SUMMARY OF RECEPTOR RISKS AND HAZARDS FOR COPCs
REASONABLE MAXIMUM EXPOSURE
The Dean Company
Scenario Timeframe: Future
Receptor Population: Resident
Receptor Age: Child
Medium Exposure Exposure Chemical Carcinogenic Risk Non-Carcinogenic Hazard Quotient
Medium Point of Potential
Concern Ingestion Inhalation Dermal External Exposure Primary Ingestion Inhalation Dermal Exposure
(Radiation) Routes Total Target Organ(s) Routes Total
Groundwater Groundwater Aquifer 1 - Tap Water Bis(2-ethylhexyl)phthalate 4E-07 - - 4E-07 - - 8E-07 Liver 0.02 - - 0.02 0.04
Chloroform 3E-07 - - 4E-07 - - 7E-07 Liver 0.06 - - 0.08 0.1
Heptachlor 7E-04 - - 3E-04 - - 1E-03 Liver 4 - - 1 5
Barium - - - - - - - - - - Heart 0.4 - - - - 0.4
Lead (1) - - - - - - - - - - - - - - - - - - - -
Manganese - - - - - - - - - - Central Nervous System 40 - - - - 40
Chemical Total 7E-04 - - 3E-04 - - 1E-03 44 - - 1 45
Radionuclide Total
Exposure Point Total 1E-03 45
Exposure Medium Total 1E-03 45
Groundwater Total 1E-03 45
Soil Soil Soil at Site 1 4,4'-DDD 1E-07 - - - - - - 1E-07 - - - - - - - - - -
4,4'-DDE 3E-06 - - - - - - 3E-06 - - - - - - - - - -
4,4'-DDT 1E-05 - - 9E-07 - - 1E-05 Liver 0.7 - - 0.06 0.8
Aluminum - - - - - - - - - - Central Nervous System 0.1 - - - - 0.1
Lead (1) - - - - - - - - - - - - - - - - - - - -
Manganese - - - - - - - - - - Central Nervous System 0.02 - - - - 0.02
Chemical Total 1E-05 - - 9E-07 - - 1E-05 0.8 - - 0.06 0.9
Radionuclide Total
Exposure Point Total 1E-05 0.9

Page 2 of 2
TABLE 9.2.RME
SUMMARY OF RECEPTOR RISKS AND HAZARDS FOR COPCs
REASONABLE MAXIMUM EXPOSURE
The Dean Company
Scenario Timeframe: Future
Receptor Population: Resident
Receptor Age: Child
Medium Exposure Exposure Chemical Carcinogenic Risk Non-Carcinogenic Hazard Quotient
Medium Point of Potential
Concern Ingestion Inhalation Dermal External Exposure Primary Ingestion Inhalation Dermal Exposure
(Radiation) Routes Total Target Organ(s) Routes Total
Soil (continued) Soil (continued) Soil at Site 2 4,4'-DDE 2E-07 - - - - - - 2E-07 - - - - - - - - - -
4,4'-DDT 1E-07 - - 1E-08 - - 1E-07 Liver 0.008 - - 0.0007 0.008
Copper - - - - - - - - - - Gastrointestinal 0.08 - - - - 0.08
Iron - - - - - - - - - - Gastrointestinal 1 - - - - 1
Chemical Total 3E-07 - - 1E-08 - - 3E-07 1 - - 0.0007 1
Radionuclide Total
Exposure Point Total 3E-07 1
Exposure Medium Total 1E-05 2
Soil Total 1E-05 2
Receptor Total 1E-03 47
Total Risk Across All Media = 1E-03 Total Hazard Across All Media 47
Total Liver HI Across All Media = 6
Total Central Nervous System HI Across All Media = 40
Total Gastrointestinal HI Across All Media = 1

Page 1 of 1
TABLE 10.1.RMERISK SUMMARY
REASONABLE MAXIMUM EXPOSURE
The Dean Company
Scenario Timeframe: Future
Receptor Population: Resident
Receptor Age: Adult
Medium Exposure Exposure Chemical Carcinogenic Risk Non-Carcinogenic Hazard Quotient
Medium Point
Ingestion Inhalation Dermal External Exposure Primary Ingestion Inhalation Dermal Exposure
(Radiation) Routes Total Target Organ(s) Routes Total
Groundwater Groundwater Aquifer 1 - Tap Water Bis(2-ethylhexyl)phthalate 7E-07 - - 1E-06 - - 2E-06 Liver 0.007 - - 0.01 0.02
Chloroform 5E-07 - - 1E-06 - - 2E-06 Liver 0.03 - - 0.05 0.08
Heptachlor 1E-03 - - 6E-04 - - 2E-03 Liver 2 - - 0.8 3
Manganese - - - - - - - - - - Central Nervous System 17 - - - - 17
Chemical Total 1E-03 - - 6E-04 - - 2E-03 19 - - 0.8 20
Exposure Point Total 2E-03 20
Exposure Medium Total 2E-03 20
Air Water Vapors from Chloroform - - 1E-05 - - - - 1E-05 Liver - - 5 - - 5
Showerhead Heptachlor - - 1E-03 - - - - 1E-03 - - - - - - - - - -
Chemical Total - - 1E-03 - - - - 1E-03 - - 5 - - 5
Exposure Point Total 1E-03 5
Exposure Medium Total 1E-03 5
Groundwater Total 3E-03 25
Soil Soil Soil at Site 1 4,4'-DDE 1E-06 - - - - - - 1E-06 - - - - - - - - - -
4,4'-DDT 5E-06 - - 5E-07 - - 6E-06 - - - - - - - - - -
Chemical Total 6E-06 - - 5E-07 - - 7E-06 - - - - - - - -
Exposure Point Total 7E-06 - -
Exposure Medium Total 7E-06 - -
Soil Total 7E-06 - -
Receptor Total 3E-03 25
Total Risk Across All Media 3E-03 Total Hazard Across All Media 25
The information in this example table is for illustration only. The site screening threshold was determined by the RPM. Total Liver HI Across All Media = 8
Total Central Nervous System HI Across All Media = 17

Page 1 of 1
TABLE 10.2.RME
RISK SUMMARY
REASONABLE MAXIMUM EXPOSURE
The Dean Company
Scenario Timeframe: Future
Receptor Population: Resident
Receptor Age: Child
Medium Exposure Exposure Chemical Carcinogenic Risk Non-Carcinogenic Hazard Quotient
Medium Point
Ingestion Inhalation Dermal External Exposure Primary Ingestion Inhalation Dermal Exposure
(Radiation) Routes Total Target Organ(s) Routes Total
Groundwater Groundwater Aquifer 1 - Tap Water Heptachlor 7E-04 - - 3E-04 - - 1E-03 Liver 4 - - 1 5
Manganese - - - - - - - - - - Central Nervous System 40 - - - - 40
Chemical Total 7E-04 - - 3E-04 - - 1E-03 44 - - 1 45
Exposure Point Total 1E-03 45
Exposure Medium Total 1E-03 45
Groundwater Total 1E-03 45
Soil Soil Soil at Site 1 4,4'-DDE 3E-06 - - - - - - 3E-06 - - - - - - - - - -
4,4'-DDT 1E-05 - - 9E-07 - - 1E-05 - - - - - - - - - -
Chemical Total 1E-05 - - 9E-07 - - 1E-05 - - - - - - - -
Exposure Point Total 1E-05
Soil at Site 2 Iron - - - - - - - - - - Gastrointestinal 1 - - - - 1
Chemical Total - - - - - - - - - - 1 - - - - 1
Exposure Point Total - - 1
Exposure Medium Total 1E-05 1
Soil Total 1E-05 1
Receptor Total 1E-03 46
Total Risk Across All Media 1E-03 Total Hazard Across All Media 46
Total Liver HI Across All Media = 5
The information in this example table is for illustration only. The site screening threshold was determined by the RPM. Total Central Nervous System HI Across All Media = 40
Total Gastrointestinal HI Across All Media = 1

Revision No. 0 January 1998
APPENDIX B
INSTRUCTIONS FOR COMPLETION OF THE STANDARD TABLES

Revision No. 0 January 1998
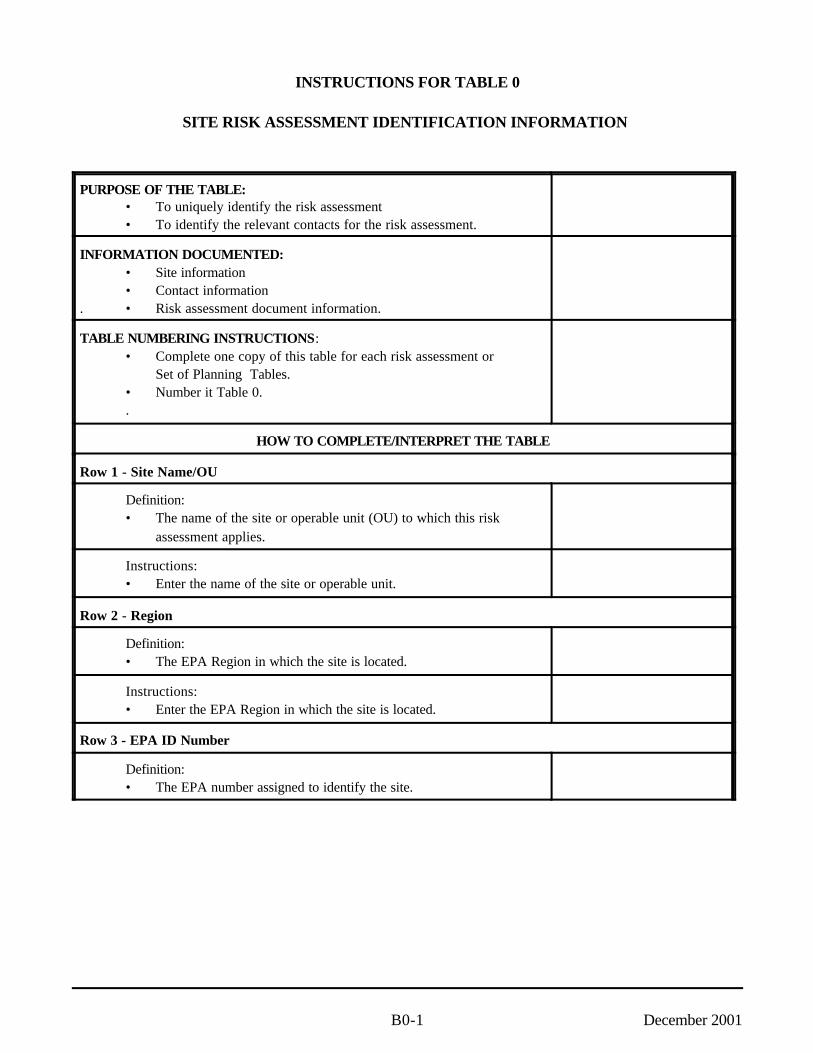
December 2001B0-1
INSTRUCTIONS FOR TABLE 0
SITE RISK ASSESSMENT IDENTIFICATION INFORMATION
PURPOSE OF THE TABLE:• To uniquely identify the risk assessment
• To identify the relevant contacts for the risk assessment.
INFORMATION DOCUMENTED:• Site information
• Contact information. • Risk assessment document information.
TABLE NUMBERING INSTRUCTIONS:• Complete one copy of this table for each risk assessment or
Set of Planning Tables. • Number it Table 0..
HOW TO COMPLETE/INTERPRET THE TABLE
Row 1 - Site Name/OU
Definition:• The name of the site or operable unit (OU) to which this risk
assessment applies.
Instructions:• Enter the name of the site or operable unit.
Row 2 - Region
Definition:• The EPA Region in which the site is located.
Instructions:• Enter the EPA Region in which the site is located.
Row 3 - EPA ID Number
Definition:• The EPA number assigned to identify the site.

December 2001B0-2
Instructions:• Enter the EPA ID Number. The ID can be found either in the
site files or in the CERCLIS database.

INSTRUCTIONS FOR TABLE 0
SITE RISK ASSESSMENT IDENTIFICATION INFORMATION (continued)
December 2001B0-3
Row 4 - State
Definition:• The state in which the site is located.
Instructions:• Enter the state or commonwealth in which the site is located.
Row 5 - Status
Definition:• The current status of the site.
Instructions:• Enter the site status.
Row 6 - Federal Facility (Y/N):
Definition:• A flag indicating whether or not the site is a Federal Facility.
Instructions:• Enter ‘Y’ if the site is a Federal Facility; enter ‘N’ otherwise.
YN
Row 7 - EPA Project Manager
Definition:• The EPA manager responsible for all activity concerning the site.
Instructions:• Enter the EPA manager responsible for the site.
Row 8 - EPA Risk Assessor
Definition:• The risk assessor at EPA responsible for this risk assessment.
Instructions:• Enter the name of the EPA risk assessor responsible for this risk
assessment.
Row 9 - Prepared by (Organization):
Definition:• The name of the organization that prepared this risk assessment.
Instructions:• Enter the name of the organization that prepared this risk
assessment.

INSTRUCTIONS FOR TABLE 0
SITE RISK ASSESSMENT IDENTIFICATION INFORMATION (continued)
December 2001B0-4
Row 10 - Prepared for (Organization):
Definition:• The name of the organization for whom this risk assessment was
prepared.
Instructions:• Enter the name of the organization for whom this risk assessment
was prepared
Row 11 - Document Title
Definition:• The title of this risk assessment document.
Instructions:• Enter the title of this risk assessment document.
Row 12 - Document Date
Definition:• The date this risk assessment document was completed or
approved.
Instructions:• Record the date the document was completed or approved in the
MM/DD/YYYY format.
Row 13 - Probabilistic Risk Assessment (Y/N):
Definition:• A flag indicating whether or not a probabilistic risk assessment
was done for this risk assessment.
Instructions:• Enter ‘Y’ if a probabilistic risk assessment was done; enter ‘N’
otherwise.
YN
Row 14 - Comments
Definition:• Any additional information provided about the risk assessment.
Instructions:• Enter any additional information about the risk assessment.

December 2001B1-1
INSTRUCTIONS FOR TABLE 1
SELECTION OF EXPOSURE PATHWAYS
PURPOSE OF THE TABLE:• To assist in project planning
• To accompany the site conceptual model• To present possible Receptors, Exposure Routes, and Exposure
Pathways • To present the rationale for selection or exclusion of each
Exposure Pathway• To communicate risk information to interested parties outside
EPA• To establish a framework for the generation of subsequent
Planning Tables. All subsequent tables should be built from theinformation contained in Table 1.
INFORMATION DOCUMENTED:• Exposure Pathways that were examined and excluded from
analysis • Exposure Pathways that will be qualitatively and quantitatively
evaluated in the risk assessment.
TABLE NUMBERING INSTRUCTIONS• Complete one copy of this table for each risk assessment.
Consult the EPA risk assessor to determine if the risk assessmentapplies to an entire site, a single operable unit, or some otherdivision of the site.
• Number it Table 1.• The table should show each Exposure Pathway considered.
In the Planning Tables, an Exposure
Pathway is defined as each unique
combination of Scenario Timeframe,
Medium, Exposure Medium,
Exposure Point, Receptor
Population, Receptor Age, and
Exposure Route.
HOW TO COMPLETE/INTERPRET THE TABLE
Column 1 - Scenario Timeframe
Definition:• The time period (current and/or future) being considered for the
Exposure Pathway.
Instructions:• Choose from the picklist to the right. If two Exposure Pathways
are identical, Current/Future can be used to describe a future anda current pathway.
Current
Future
Current/Future
Not Documented
Column 2 - Medium
Definition:• The substance (e.g., air, water, soil) that is a potential source of
contaminants in the Exposure Medium. (The Medium willsometimes = the Exposure Medium.) Usually, the Medium is thattargeted for possible remediation.

INSTRUCTIONS FOR TABLE 1
SELECTION OF EXPOSURE PATHWAYS (continued)
December 2001B1-2
Instructions:• Choose from the picklist to the right.
Groundwater
Leachate
Sediment
Sludge
Soil
Surface Water
Debris
Liquid Waste
Solid Waste
Air
Surface Soil
Subsurface Soil
Other
Column 3 - Exposure Medium
Definition:• The contaminated environmental medium to which an individual
may be exposed. This includes the transfer of contaminants fromone Medium to another.
For example:
1) Contaminants in Groundwater (the Medium) remain in
Groundwater (the Exposure Medium) and are available for
exposure to receptors.
2) Contaminants in Groundwater (the Medium) may be transferred to
Air (the Exposure Medium) and are available for exposure to
receptors.
3) Contaminants in Sediment (the Medium) may be transferred to Fish
Tissue (the Exposure Medium) and are available for exposure to
receptors.
Instructions:• Choose from the picklist to the right.
Note: In the case of two media transferring contamination to the same Exposure
Medium, two separate Exposure Pathways should be included in Table 1. See
Example Scenario No. 5.
GroundwaterLeachateSedimentSludgeSoilSurface WaterDebrisLiquid WasteSolid WasteAir Plant TissueAnimal TissueFish TissueSpring WaterSurface SoilSubsurface SoilParticulatesVaporsOther

INSTRUCTIONS FOR TABLE 1
SELECTION OF EXPOSURE PATHWAYS (continued)
December 2001B1-3
Column 4 - Exposure Point
Definition:• An exact location of potential contact between a person and a
chemical or radionuclide within an Exposure Medium.
For example:
1) Contaminants are in Groundwater (the Medium and the Exposure
Medium) and exposure to Aquifer 1 - Tap Water (the
Exposure Point) is evaluated.
2 Contaminants in Groundwater (the Medium) may be transferred to Air (the
Exposure Medium) and exposure to Aquifer 1 - Water Vapors at
Showerhead (the Exposure Point) is evaluated.
3) Contaminants in Sediment (the Medium) may be transferred to Fish
Tissue (the Exposure Medium) and Trout from Dean’s Creek (the
Exposure Point) is evaluated.
Instructions:• Describe the Exposure Point as text in the table. Multiple
Exposure Points may be recorded in the same cell/row if all otheraspects of their Exposure Pathways (Scenario Timeframe,Medium, Exposure Medium, Receptor Population, Receptor Age,and Exposure Route) are the same. See Example Scenario No. 1.
Column 5 - Receptor Population
Definition:• The exposed individual relative to the Exposure Pathway
considered.
For example, a resident (ReceptorPopulation) who drinks contaminatedgroundwater.
Instructions:• Choose from the picklist to the right.
Note: If there are multiple Trespassers/Visitors of different ages, the use Receptor Age (seeColumn 6) to distinguish between the different receptors. For example, useTrespasser/Visitor with Adolescent (or Child) to indicate youthful trespassers, andTrespasser/Visitor with Adult for adult visitors.
ResidentIndustrial WorkerCommercial WorkerConstruction WorkerOther WorkerGolferJoggerFisherHunterFisher/HunterSwimmerOther Recreational PersonChild at School/Daycare/ PlaygroundTrespasser/VisitorFarmerGardenerGathererOther

INSTRUCTIONS FOR TABLE 1
SELECTION OF EXPOSURE PATHWAYS (continued)
December 2001B1-4
Column 6 - Receptor Age
Definition:• The description of the exposed individual as defined by the EPA
Region or dictated by the site.
For example, an adult (Receptor Age) resident (Receptor Population) who drinkscontaminated groundwater.
Instructions:• Choose from the picklist to the right.
ChildAdultAdolescents (teens)Pre-AdolescentsNot DocumentedChild/AdultGeriatricSensitiveOtherInfantToddlerPregnant
Column 7 - Exposure Route
Definition:• The way a chemical or radionuclide comes in contact with a
person (e.g., by ingestion, inhalation, dermal contact).
Instructions:• Choose from the picklist to the right.
InhalationIngestionCombined (Inhalation and Ingestion)Dermal Not DocumentedExternal (Radiation)
Column 8 - Type of Analysis
Definition:• The level of evaluation (quantitative or qualitative) to be
performed for the Exposure Pathway based on site-specificanalysis.
Instructions:• Choose from the picklist to the right.
Note: Present pathways that were not further analyzed (Type of Analysis = None)
along with the rationale for their exclusion to document that the pathway was
considered.
Quant (Quantitative)Qual (Qualitative)None

INSTRUCTIONS FOR TABLE 1
SELECTION OF EXPOSURE PATHWAYS (continued)
December 2001B1-5
Column 9 - Rationale for Selection or Exclusion of Exposure Pathway
Definition:• The reason the Exposure Pathway was selected or not selected
for quantitative or qualitative analysis.
Instructions:• Document the reason for selecting or excluding an Exposure
Pathway for analysis. Provide a narrative rationale for eachExposure Pathway.
Consult the EPA risk assessor for the
rationale codes.

December 2001B2-1
INSTRUCTIONS FOR TABLE 2
OCCURRENCE, DISTRIBUTION AND SELECTION OF CHEMICALS OF POTENTIAL CONCERN
PURPOSE OF THE TABLE:• To provide information useful for data evaluation of chemicals
and radionuclides detected • To provide adequate information so the user/reviewer gets a
sense of the chemicals and radionuclides detected at the site andthe potential magnitude of the potential problems at the site
• To provide chemical screening data and rationale for selection ofCOPCs.
INFORMATION DOCUMENTED:• Statistical information about chemicals and radionuclides detected
in each Medium • The detection limits of chemicals and radionuclides analyzed
• The screening toxicity values for COPC selection• The chemicals and radionuclides selected or deleted as COPCs.
TABLE NUMBERING AND SUMMARY BOX INSTRUCTIONS:• Complete one copy of Table 2 for each unique combination of the
following three fields that will be quantitatively evaluated in therisk assessment: Scenario Timeframe, Medium, and ExposureMedium.
• Enter each combination of these three fields in the Summary Boxin the upper left corner of the table.
• Number each table uniquely, beginning with 2.1 and ending with2.n, where “n” represents the total number of combinations of thethree key fields.
It is possible that some Planning
Tables may contain the same data
associated with different descriptions
in the Summary Box in the upper left
corner.
Separate tables may be necessary to
ensure transparency in data
presentation for each Exposure
Pathway. Replication of information
is readily accomplished using
spreadsheet software.
Consult the EPA risk assessor for
alternatives (e.g., footnotes) to
preparing multiple tables with the
same data.
HOW TO COMPLETE/INTERPRET THE TABLE
SUMMARY BOX IN UPPER LEFT CORNER
Row 1 - Scenario Timeframe
Definition:• The time period (current and/or future) being considered for the
exposure pathway.
Instructions:• Choose from the picklist to the right.
Current
Future
Current/Future
Not Documented

INSTRUCTIONS FOR TABLE 2
OCCURRENCE, DISTRIBUTION AND SELECTION OF CHEMICALS OF POTENTIAL CONCERN (continued)
December 2001B2-2
Row 2 - Medium
Definition:• The substance (e.g., air, water, soil) that is a potential source of
contaminants in the Exposure Medium. (The Medium willsometimes = the Exposure Medium.) Usually, the Medium is thattargeted for possible remediation.
Instructions:• Choose from the picklist to the right.
Groundwater
Leachate
Sediment
Sludge
Soil
Surface Water
Debris
Liquid Waste
Solid Waste
Air
Surface Soil
Subsurface Soil
Other
Row 3 - Exposure Medium
Definition:• The contaminated environmental medium to which an individual
may be exposed. Includes the transfer of contaminants from onemedium to another.
For example:
1) Contaminants in Groundwater (the Medium) remain in
Groundwater (the Exposure Medium) and are available for
exposure to receptors.
2) Contaminants in Groundwater (the Medium) may be transferred to
Air (the Exposure Medium) and are available for exposure to
receptors.
3) Contaminants in Sediment (the Medium) may be transferred to Fish
Tissue (the Exposure Medium) and are available for exposure to
receptors.

INSTRUCTIONS FOR TABLE 2
OCCURRENCE, DISTRIBUTION AND SELECTION OF CHEMICALS OF POTENTIAL CONCERN (continued)
December 2001B2-3
Instructions:• Choose from the picklist to the right.
Groundwater
Leachate
Sediment
Sludge
Soil
Surface Water
Debris
Liquid Waste
Solid Waste
Air
Plant Tissue
Animal Tissue
Fish Tissue
Spring Water
Surface Soil
Subsurface Soil
Particulates
Vapors
Other
BODY OF THE TABLE
Column 1 - Exposure Point
Definition:• An exact location of potential contact between a person and a
chemical or radionuclide within an exposure medium.
For example:
1) Contaminants are in Groundwater (the Medium and the Exposure
Medium) and exposure to Aquifer 1 - Tap Water (the Exposure
Point) is evaluated.
2) Contaminants in Groundwater (the Medium) may be transferred to
Air (the Exposure Medium) and exposure to Aquifer 1 - Water
Vapors at Showerhead (the Exposure Point) is evaluated.
3) Contaminants in Sediment (the Medium) may be transferred to Fish
Tissue (the Exposure Medium) and Trout from Dean’s Creek (the
Exposure Point) is evaluated.
Instructions:• Provide the information as text in the table.
Exposure Points should be defined
the same way as was done in
Planning Table 1.
Column 2 - CAS Number
Definition:• The Chemical Abstract Registry Number, a unique standardized
number which is assigned to chemicals and radionuclides.

INSTRUCTIONS FOR TABLE 2
OCCURRENCE, DISTRIBUTION AND SELECTION OF CHEMICALS OF POTENTIAL CONCERN (continued)
December 2001B2-4
Instructions:• Provide the CAS Number for each chemical detected in the
samples for the Medium.
Note: If the CAS number is not available, be sure to enter the Chemical Name in
Column 3 and consult the EPA risk assessor.
Include dashes in the CAS number.
CAS numbers can be arranged in the
order that the risk assessor prefers.
Column 3 - Chemical
Definition:• The name of the compound detected in samples for the Medium.
Instructions:• Provide the names of the chemicals which were detected in the
sample for the Medium.
Chemicals can be grouped in the
order that the risk assessor prefers.
Class descriptions (e.g., PAHs, VOCs,
inorganics) can be included as a row
before a group of chemicals.
Column 4 - Minimum Concentration (Qualifier)
Definition:• Minimum Concentration - The lowest detected concentration of
the chemical or radionuclide in the medium. • Qualifier - The alpha-numeric code assigned to the concentration
value by the analytical chemist during data validation for theMinimum Concentration value.
Instructions:• Enter the minimum detected concentration for the medium. If
there is a detected minimum, enter that as the MinimumConcentration. If the concentration is not detected, enter ‘ND’as the Minimum and Maximum Concentrations and record thedetection limits in the Range of Detection Limits column.
• Enter the qualifier associated with the minimum concentration foreach chemical or radionuclide in parentheses () after theMinimum Concentration value. Multiple qualifiers should beseparated by commas.
• Provide the definition of each qualifier in the table footnotes.
Column 5 - Maximum Concentration (Qualifier)

INSTRUCTIONS FOR TABLE 2
OCCURRENCE, DISTRIBUTION AND SELECTION OF CHEMICALS OF POTENTIAL CONCERN (continued)
December 2001B2-5
Definition:• Maximum Concentration - The highest detected concentration of
the chemical or radionuclide in the Medium at the currentExposure Point which is above the sample quantitation limit.
• Qualifier - The alpha-numeric code assigned to the concentrationvalue by the analytical chemist during data validation for theMaximum Concentration value.
Instructions:• Enter the maximum detected concentration for the medium. • Enter the qualifier associated with the Maximum Concentration
for each chemical or radionuclide.• Provide the definition of each qualifier in the table footnotes.

INSTRUCTIONS FOR TABLE 2
OCCURRENCE, DISTRIBUTION AND SELECTION OF CHEMICALS OF POTENTIAL CONCERN (continued)
December 2001B2-6
Column 6 - Units
Definition:• The concentration units for each chemical or radionuclide
detected.
Instructions:• Enter the concentration units for each chemical or radionuclide.
Units may vary among matrices/media.
Consult with the EPA risk assessor to
determine if there is a preference
regarding the units used for different
matrices (e.g., mg/kg for soil, ::g/L
for groundwater). Choices include:
mg/l ::g/l ng/l
pg/l % ppm
ppb ppt g/kg
mg/kg ::g/kg ng/kg
::g/g mg/m3 ::g/m3
fibers/l fibers/m3 fibers/kg
lbs/day ::g/100cm2 mg/cm2
::Rem/hr Rem/yr pCi/g
pCi/kg pCi/m3 pCi/l
pCi/m2/sec Other
Not Documented
Column 7 - Location of Maximum Concentration
Definition:• The sample number that identifies the location where the
highest concentration sample was taken.
Instructions: • Enter the sample identifier which corresponds to the location
where the sample was taken.
Column 8 - Detection Frequency
Definition:• The number of times the chemical or radionuclide was
detected versus the number of times it was analyzed,expressed as the “fraction” X/Y.
For example, 5/9 indicates that a
chemical was detected in 5 out of 9
samples.
Instructions:• Indicate the number of times the chemical or radionuclide
was detected versus the number of times it was analyzed asthe “fraction” X/Y.
Consult the EPA risk assessor for an
explanation of how Detection
Frequency should be interpreted and
applied.
Column 9 - Range of Detection Limits

INSTRUCTIONS FOR TABLE 2
OCCURRENCE, DISTRIBUTION AND SELECTION OF CHEMICALS OF POTENTIAL CONCERN (continued)
December 2001B2-7
Definition:• The lowest and highest detection limits.
Consult the EPA risk assessor for
definitions of detection limits.
Instructions:• Enter the lowest and highest detection limit for the chemical
or radionuclide in the medium separated by a dash (-). Consult with the EPA risk assessor if detection limits are notreported
Column 10 - Concentration Used for Screening
Definition:• The detected concentration which was used to compare to
the screening value.
Instructions:• Enter a concentration for each chemical being evaluated for
the Medium.• Use a footnote to specify the source(s) of the Concentration
Used for Screening.
Consult the EPA risk assessor when
determining this value. For example,
maximum or average.
Column 11 - Background Value
Definition:• The background value for the chemical or radionuclide in that
Medium as defined by guidance.
If a "t-test" or other test which requires backup information is required, this
supporting information is should be provided separately.
Instructions:• Enter the numerical value in the column.• Specify the source(s)/derivation of the Background Value in
table footnotes. For example, literature value, data from anearby site, statistical tool.
Consult the EPA risk assessor for how
background values are determined
and whether and how background
values are considered for COPC
screening.
Column 12 - Screening Toxicity Value (N/C)
Definition:• The screening level used to compare detected concentrations
of chemicals and radionuclides. Screening Toxicity Valuesare usually risk-based media concentrations (e.g., RBCs,SSLs, PRGs).

INSTRUCTIONS FOR TABLE 2
OCCURRENCE, DISTRIBUTION AND SELECTION OF CHEMICALS OF POTENTIAL CONCERN (continued)
December 2001B2-8
Instructions:• Enter the Screening Toxicity Value.• Also indicate, with (N) or (C) whether the value is based on
non-cancer or cancer effects, respectively. • To enter both the cancer and non-cancer screening toxicity
values, either (1) record both in the same cell separated by a “/” (e.g., 15C/3.8N), or record one value in Column 12 andone in Column 13.
• Use a footnote to provide a reference/explanation for thesource of the screening values used.
Consult the EPA risk assessor for the
source of the screening value and for
guidance on comparing the screening
value to detected concentrations.
Column 13 - Potential ARAR/TBC Value
Definition: • Potential applicable or relevant and appropriate requirements
(ARAR) and to be considered (TBC) values.
For example, MCL values, soil
cleanup level values, or other values
to be considered.
Instructions: • If multiple values exist, then enter the most conservative
ARAR or TBC value.
Consult the EPA risk assessor
regarding the requirements for this
column.
Column 14 - Potential ARAR/TBC Source
Definition: • The type or source of the ARAR/TBC value entered into the
previous column.
For example, MCL or SMCL.
Instructions:• Enter the type or source of ARAR/TBC value which
corresponds to the value in the previous column.
Column 15 - COPC Flag (Y/N)
Definition:• A code which identifies whether the chemical or radionuclide
has been selected as a chemical of potential concern.
Instructions:• Enter “Y” or “N” to indicate whether the chemical has been
retained as a COPC.
Y
N

INSTRUCTIONS FOR TABLE 2
OCCURRENCE, DISTRIBUTION AND SELECTION OF CHEMICALS OF POTENTIAL CONCERN (continued)
December 2001B2-9
Column 16 - Rationale for Selection or Deletion
Definition:• The reason that the chemical or radionuclide was selected or
not selected for quantitative or qualitative analysis.
Consult the EPA risk assessor for the
rationale codes.
Instructions:• Enter the rationale codes for selection/deletion of chemicals
of potential concern. Separate multiple codes with commas.• Define the codes for the “Rationale for Selection or Deletion”
column in a footnote on this table.
The example data table provides
rationale codes for example purposes
only.

December 2001B3-1
INSTRUCTIONS FOR TABLE 3
EXPOSURE POINT CONCENTRATION SUMMARY
PURPOSE OF THE TABLE:• To provide the Exposure Point Concentrations (EPCs) for
measured and modeled values• To provide statistical information on the derivation of the EPCs.
INFORMATION DOCUMENTED:• Statistical information which was used to calculate the EPCs for
chemicals and radionuclides detected in each Medium• Exposure Point Concentrations (RME and/or CT)• The statistics which were used to make the determinations as
well as the rationale for the selection of the statistics for eachchemical or radionuclide (i.e., discuss statistical derivation ofmeasured data or approach for modeled data).
TABLE NUMBERING AND SUMMARY BOX INSTRUCTIONS:• Follow the instructions below to create separate sets of Table 3
for RME and CT when appropriate.• Complete one copy of Table 3 for each unique combination of the
following three fields that will be quantitatively evaluated: Scenario Timeframe, Medium, and Exposure Medium.
• Enter each combination of these three fields in the Summary Boxin the upper left corner of the table.
• Number each table uniquely, beginning with 3.1 and ending with3.n, where “n” represents the total number of combinations of thethree key fields. Add the extension .RME or .CT to the tablenumber to indicate reasonable maximum exposure or centraltendency.
• Add the line “Reasonable Maximum Exposure” or “CentralTendency” to the table title.
It is possible that some tables may
contain the same data associated
with different descriptions in the
Summary Box in the upper left
corner.
Separate tables may be necessary to
ensure transparency in data
presentation for each Exposure
Pathway. Replication of
information is readily accomplished
using spreadsheet software.
Consult the EPA risk assessor for
alternatives (e.g., footnotes) to
preparing multiple tables with the
same data.

INSTRUCTIONS FOR TABLE 3
EXPOSURE POINT CONCENTRATION SUMMARY (continued)
December 2001B3-2
GENERAL NOTES/INSTRUCTIONS FOR THIS TABLE:• Attach supporting documentation regarding how the EPC was
calculated.• Attach an example calculation so the methodology used to
develop EPCs is clear to a reviewer.• Attach supporting information regarding how the concentration
term was selected.• Consult the EPA risk assessor concerning use of decimals or
scientific notation for data.• For certain media, all columns will not be completed.
This information should be of
sufficient detail that a reviewer can
check and verify the calculations
which were performed and obtain
the same results as listed in this
table.
It is possible that the 95% UCL may
not need to be calculated, for
example, if only one data point is
being considered.
As another example, in some
regions, the arithmetic average of
concentrations measured from the
center of the plume is used as the
RME. In this case, the 95% UCL
column does not need to be
completed.

INSTRUCTIONS FOR TABLE 3
EXPOSURE POINT CONCENTRATION SUMMARY (continued)
December 2001B3-3
HOW TO COMPLETE/INTERPRET THE TABLE
SUMMARY BOX IN UPPER LEFT CORNER
Row 1 - Scenario Timeframe
Definition:• The time period (current and/or future) being considered for the
exposure pathway.
Instructions:• Choose from the picklist to the right.
Current
Future
Current/Future
Not Documented
Row 2 - Medium
Definition:• The substance (e.g., air, water, soil) that is a potential source of
contaminants in the Exposure Medium. (The Medium willsometimes = the Exposure Medium.) Usually, the Medium is thattargeted for possible remediation.
Instructions:• Choose from the picklist to the right.
Groundwater
Leachate
Sediment
Sludge
Soil
Surface Water
Debris
Other
Liquid Waste
Solid Waste
Air
Surface Soil
Subsurface Soil

INSTRUCTIONS FOR TABLE 3
EXPOSURE POINT CONCENTRATION SUMMARY (continued)
December 2001B3-4
Row 3 - Exposure Medium
Definition:• The contaminated environmental medium to which an individual
may be exposed. Includes the transfer of contaminants from onemedium to another .
For example:
1) Contaminants in Groundwater (the Medium) remain in Groundwater (the
Exposure Medium) and are available for exposure to receptors.
2) Contaminants in Groundwater (the Medium) may be transferred to Air (the
Exposure Medium) and are available for exposure to receptors.
3) Contaminants in Sediment (the Medium) may be transferred to Fish Tissue
(the Exposure Medium) and are available for exposure to receptors.
Instructions:• Choose from the picklist to the right.
Groundwater
Leachate
Sediment
Sludge
Soil
Surface Water
Debris
Other
Liquid Waste
Solid Waste
Air
Plant Tissue
Animal Tissue
Fish Tissue
Spring Water
Surface Soil
Subsurface Soil
Particulates
Vapors

INSTRUCTIONS FOR TABLE 3
EXPOSURE POINT CONCENTRATION SUMMARY (continued)
December 2001B3-5
BODY OF THE TABLE
Column 1 - Exposure Point
Definition:• An exact location of potential contact between a person and a
chemical or radionuclide within an Exposure Medium.
For example:
1) Contaminants are in Groundwater (the Medium and the Exposure Medium)
and exposure to Aquifer 1 - Tap Water (the Exposure Point) is evaluated.
2) Contaminants in Groundwater (the Medium) may be transferred to Air (the
Exposure Medium) and exposure to Aquifer 1 - Water Vapors at Showerhead
(the Exposure Point) is evaluated.
3) Contaminants in Sediment (the Medium) may be transferred to Fish Tissue
(the Exposure Medium) and Trout from Dean’s Creek (the Exposure Point) is
evaluated.
Instructions:• Provide the information as text in the table.
Exposure Point should be defined
the same way as was done in
Planning Table 1.
Column 2 - Chemical of Potential Concern
Definition:• A chemical or radionuclide that is potentially site-related, with
data of sufficient quality, that has been retained for quantitativeanalysis as a result of the screening documented in Table 2.
Instructions: • Enter the names of the chemicals which were selected as
COPCs from Table 2.
Chemicals can be grouped in the
order that the risk assessor prefers.
Class descriptions (e.g., PAHs,
VOCs, inorganics) can be included
as a row before a group of
chemicals.
Column 3 - Units
Definition:• The concentration units for each chemical and radionuclide
detected.

INSTRUCTIONS FOR TABLE 3
EXPOSURE POINT CONCENTRATION SUMMARY (continued)
December 2001B3-6
Instructions: • Enter units for each chemical and radionuclide. Units may vary
among matrices/media.
Consult with the EPA risk assessor
to determine if there is a preference
regarding the units used for different
matrices (e.g., mg/kg for soil, ::g/L
for groundwater). Choices include:
mg/l ::g/l ng/l
pg/l % ppm
ppb ppt g/kg
mg/kg ::g/kg ng/kg
::g/g mg/m3 ::g/m3
fibers/l fibers/m3 fibers/kg
lbs/day ::g/100cm2 mg/cm2
::Rem/hr Rem/yr pCi/g
pCi/kg pCi/m3 pCi/l
pCi/m2/sec Other
Not Documented
Column 4 - Arithmetic Mean
Definition: • The arithmetic average of detected concentrations. This is
the sum of the data divided by the number of data points.
Instructions: • Enter the arithmetic average of detected concentrations .
For duplicate samples, multiple
rounds of sampling, and other data
evaluation questions, consult the
EPA risk assessor.
Column 5 - 95% UCL (Distribution)
Definition:• The statistic for the 95% Upper Confidence Limit on the
arithmetic mean, and the type of distribution.
Consult National guidance
(Supplemental Guidance to RAGS:
Calculating the Concentration
Term, OSWER Directive: 9285.7-
08l, May 1992 or most recent
updates) and the EPA risk assessor
for calculating this term.
Instructions:• Enter the 95% UCL for each COPC.• Indicate the distribution of the 95% UCL with (N) or (T)
after the value as follows: N is Normal, T is Transformed(lognormal), NP is Nonparametric, O is Other. Define thecodes describing the type of distribution in a footnote.
• Specify any assumptions made in calculating the term infootnotes on this table.
• Supporting information should be provided in the riskassessment.
For example, for non-detects, ½ the
sample quantitation limit is
sometimes used as a proxy
concentration. For duplicate sample
results, the average value is
sometimes used in the calculation.

INSTRUCTIONS FOR TABLE 3
EXPOSURE POINT CONCENTRATION SUMMARY (continued)
December 2001B3-7
Column 6 - Maximum Concentration (Qualifier)
Definition:• Maximum Concentration - The highest detected
concentration of the chemical or radionuclide in theMedium at the current Exposure Point which is above thesample quantitation limit.
• Maximum Qualifier - The alpha-numeric code assigned tothe concentration value by the analytical chemist duringdata validation for the maximum concentration value.
Instructions:• Enter the maximum concentration value.• Enter the qualifier associated with the maximum
concentration.
Provide the definitions of each
qualifier in the table footnotes or in
supporting information.
Column 7 - Exposure Point Concentration Value
Definition:• The EPC, based on either a statistical derivation of
measured data or modeled data, that represents an estimateof the chemical or radionuclide concentration availablefrom a particular Medium or route of exposure. This EPCvalue will be used to quantify potential cancer risks andnon-cancer hazards.
For example,
the EPC value may be statistically derived by calculating the 95% UCL of
measured groundwater contaminant concentrations from multiple
residential wells. Alternatively, the EPC value may be selected as a single
measured value, if one data point is used to calculate the risk for each
residential well individually. In some cases, the EPC value may be a
modeled value (e.g., if upgradient groundwater contaminant concentrations
are used to model groundwater concentrations, a downgradient exposure
point, or if sediment concentrations are used to model fish tissue
concentrations)
The EPC Value may be calculated,
measured, or modeled.
Instructions:• Enter the value in the column.• When using modeled data, enter the Exposure Point,
COPC, EPC Value, and EPC Rationale, and include areference to the location of backup information that showhow the data were modeled in the risk assessmentdocument.
Consult the EPA risk assessor
concerning how to determine this
value.
Column 8 - Exposure Point Concentration Units

INSTRUCTIONS FOR TABLE 3
EXPOSURE POINT CONCENTRATION SUMMARY (continued)
December 2001B3-8
Definition:• The units of the data being used to calculate the EPC.
Instructions: • Enter the units for the data being used to calculate the
EPC.
Consult the EPA risk assessor for
preferences for different media (e.g.,
ug/L for groundwater; mg/kg for
soil).
Column 9 - Exposure Point Concentration Statistic
Definition:• The statistic selected to represent the EPC Value based on
the distribution of the data, number of data points, etc., andconsultation with the EPA risk assessor.
Often, this is 95% UCL of the log-
transformed data.
Instructions:• Enter the statistic used by choosing from the picklist to the
right. • Define the codes used for the EPC Statistic column in table
footnotes. If the statistic used is not on the picklist, enteran abbreviation in Column 9 and provide a description ofthe statistic in the footnotes of the table.
Max (Maximum)
95% UCL - N (95% UCL of
Normal Data)
95% UCL- T (95% UCL of
Log-transformed Data)
95% UCL - NP (Mean of
Nonparametric Data)
Mean - N (Mean of Normal Data)
Mean - T (Mean of Log-
transformed Data)
Mean - NP (Mean of
Nonparametric Data)
Column 10 - Exposure Point Concentration Rationale
Definition:• The reason the cited statistic was used to represent the
EPC.
Instructions:• Enter the rationale for the selection. Footnotes can be
used.

December 2001B4-1
INSTRUCTIONS FOR TABLE 4
VALUES USED FOR DAILY INTAKE CALCULATIONS
PURPOSE OF THE TABLE:• To provide the exposure parameters used for intake calculations
for each Exposure Pathway (Scenario Timeframe, Medium,Exposure Medium, Exposure Point, Receptor Population,Receptor Age, and Exposure Route)
• To provide the intake equations or models used for eachExposure Route/Pathway.
INFORMATION DOCUMENTED:• Values used for each intake equation for each Exposure Pathway
and the reference/rationale for each• Intake equation or model used to calculate the intake for each
Exposure Pathway.
TABLE NUMBERING AND SUMMARY BOX INSTRUCTIONS:• Follow the instructions below to create separate sets of Table 4
for RME and CT where appropriate.• Complete one copy of Table 4 for each unique combination of the
following three fields that will be quantitatively evaluated: Scenario Timeframe, Medium, and Exposure Medium.
• Enter each combination of these three fields in the Summary Boxin the upper left corner of the table.
• Number each table uniquely, beginning with 4.1 and ending with4.n, where “n” represents the total number of combinations of thethree key fields.
• Add the line “Reasonable Maximum Exposure” or “CentralTendency” to the table title. Add the extension .RME or .CT tothe table number to the line indicate reasonable maximumexposure or central tendency.
Information regarding intake
calculations is specific to an
Exposure Pathway. Thus, the
Summary Box contains the first
three identifiers used to specify an
exposure pathway: Scenario
Timeframe, Medium, and Exposure
Medium.
It is possible that some tables may
contain the same data associated
with different descriptions in the
Summary Box in the upper left
corner.
Separate tables may be necessary to
ensure transparency in data
presentation for each Exposure
Pathway. Replication of
information is readily accomplished
using spreadsheet software.
Consult the EPA risk assessor for
alternatives (e.g., footnotes) to
preparing multiple tables with the
same data.
HOW TO COMPLETE/INTERPRET THE TABLE
SUMMARY BOX IN UPPER LEFT CORNER
Row 1 - Scenario Timeframe
Definition:• The time period (current and/or future) being considered for the
Exposure Pathway.

INSTRUCTIONS FOR TABLE 4
VALUES USED FOR DAILY INTAKE CALCULATIONS (continued)
December 2001B4-2
Instructions:• Choose from the picklist to the right.
Current
Future
Current/Future
Not Documented

INSTRUCTIONS FOR TABLE 4
VALUES USED FOR DAILY INTAKE CALCULATIONS (continued)
December 2001B4-3
Row 2 - Medium
Definition:• The substance (e.g., air, water, soil) that is a potential source of
contaminants in the Exposure Medium. (The Medium willsometimes = the Exposure Medium.) Usually, the Medium is thattargeted for possible remediation. .
Instructions:• Choose from the picklist to the right.
Groundwater
Leachate
Sediment
Sludge
Soil
Surface Water
Debris
Other
Liquid Waste
Solid Waste
Air
Surface Soil
Subsurface Soil
Row 3 - Exposure Medium
Definition:• The contaminated environmental medium to which an individual
may be exposed. Includes the transfer of contaminants from oneMedium to another.
For example:
1) Contaminants in Groundwater (the Medium) remain in Groundwater (the
Exposure Medium) and are available for exposure to receptors.2) Contaminants in Groundwater (the Medium) may be transferred to Air (the
Exposure Medium) and are available for exposure to receptors.
3) Contaminants in Sediment (the Medium) may be transferred to Fish Tissue
(the Exposure Medium) and are available for exposure to receptors.

INSTRUCTIONS FOR TABLE 4
VALUES USED FOR DAILY INTAKE CALCULATIONS (continued)
December 2001B4-4
Instructions:• Choose from the picklist to the right.
Groundwater
Leachate
Sediment
Sludge
Soil
Surface Water
Debris
Other
Liquid Waste
Solid Waste
Air
Plant Tissue
Animal Tissue
Fish Tissue
Spring Water
Surface Soil
Subsurface Soil
Particulates
Vapors

INSTRUCTIONS FOR TABLE 4
VALUES USED FOR DAILY INTAKE CALCULATIONS (continued)
December 2001B4-5
BODY OF THE TABLE
Column 1 - Exposure Route
Definition:• The way a chemical or radionuclide comes in contact with a
person (e.g., by ingestion, inhalation, dermal contact).
Instructions:• Choose from the picklist to the right.
Inhalation
Ingestion
Combined (i.e., Inhalation andIngestion)
Dermal
Not Documented
External (Radiation)
Column 2 - Receptor Population
Definition:• The exposed individual relative to the Exposure Pathway
considered.
For example, a resident (Receptor
Population) who drinks
contaminated groundwater.
Instructions:• Choose from the picklist to the right.
Resident
Industrial Worker
Commercial Worker
Construction Worker
Other Worker
Golfer
Jogger
Fisher
Hunter
Fisher/Hunter
Swimmer
Other Recreational Person
Child at School/Daycare/
Playground
Trespasser/Visitor
Farmer
Gardener
Gatherer
Other
Column 3 - Receptor Age
Definition:• The description of the exposed individual as defined by the EPA
Region or dictated by the site.
For example, a resident (Receptor
Population) who drinks
contaminated groundwater.

INSTRUCTIONS FOR TABLE 4
VALUES USED FOR DAILY INTAKE CALCULATIONS (continued)
December 2001B4-6
Instructions:• Choose from the picklist to the right.
Child
Adult
Adolescents (teens)
Pre-Adolescents
Not Documented
Child/Adult
Geriatric
Sensitive
Other
Infant
Toddler
Pregnant
Column 4 - Exposure Point
Definition:• An exact location of potential contact between a person and a
chemical or radionuclide within an Exposure Medium.
For example:
1) Contaminants are in Groundwater (the Medium and the Exposure
Medium) and exposure to Aquifer 1 - Tap Water (the Exposure Point) is
evaluated.
2) Contaminants in Groundwater (the Medium) may be transferred to Air (the
Exposure Medium) and exposure to Aquifer 1 - Water Vapors at
Showerhead (the Exposure Point) is evaluated.
3) Contaminants in Sediment (the Medium) may be transferred to Fish Tissue
(the Exposure Medium) and Trout in Dean’s Creek (the Exposure Point) is
evaluated.
Instructions:• Provide the information as text in the table. Multiple Exposure
Points may be recorded in the same cell/row in this table if allother aspects of their Exposure Pathways (Scenario Timeframe,Medium, Exposure Medium, Exposure Route, ReceptorPopulation and Receptor Age) are the same.
Exposure Points should be defined
the same way ad was done in
Planning Table 1.
Column 5 - Parameter Code
Definition:• The code used for parameters (exposure factors) in the intake
equation.

INSTRUCTIONS FOR TABLE 4
VALUES USED FOR DAILY INTAKE CALCULATIONS (continued)
December 2001B4-7
Instructions:• Enter the appropriate code for the intake parameter from the
picklist below. • Develop additional intake parameter codes as necessary; be sure
that additional codes are unique and defined in this table.
Parameter
Code Parameter Definition Units
CS Chemical Concentration in Soil mg/kg
CW Chemical Concentration in Water ug/l
IR-W Ingestion Rate of Water liters/day
EF Exposure Frequency days/year
ED Exposure Duration years
CF1 Conversion Factor 1 mg/ug
BW Body Weight kg
AT-C Averaging Time (Cancer) days
AT-N Averaging Time (Non-Cancer) days
KP Permeability Constant (Dermal for Liquids) cm/hr
ET Exposure Time hr/day
CF2 Conversion Factor 2 l/cm3
SA Skin Surface Area Available for Contact cm2
IN Inhalation Rate m3/hr
IR-SM Ingestion Rate (Swimming) l/hr
IR-S Ingestion Rate of Soil mg/day
DABS Dermal Absorption Factor (Solid) --
SSAF Soil to Skin Adherence Factor mg/cm2/event
IR-F Ingestion Rate of Food kg/meal
EF-F Exposure Frequency (Food) meals/year
Do not provide detailed information
regarding parameter modeled
intakes in this table. This
information should be provided
separately. Column 10 of this table
should list the name of the model or
the equation used with a footnote
referencing supporting information
regarding modeled intake
development.
Column 6 - Parameter Definition
Definition:• The name of the exposure factor (e.g., ingestion rate, body
weight) used in the intake equation corresponding to theparameter entered in Column 5..
Instructions:• Enter the parameter definition, consistent with the picklist defined
under the Parameter Code column.• Develop additional intake parameter definitions as necessary.
Do not provide detailed parameter
information regarding modeled
intakes in this table. This
information should be provided
separately. (See instructions for
Column 5).
Column 7 - Value
Definition:• The numeric value of the parameter recorded in Column 6 used
for the intake calculation.

INSTRUCTIONS FOR TABLE 4
VALUES USED FOR DAILY INTAKE CALCULATIONS (continued)
December 2001B4-8
Instructions:• Enter the values used for intake calculations.• For the CS and CW (chemical concentrations in soil and water,
respectively) parameters, refer to Table 3.n or supportingdocumentation, as appropriate.
Consult the EPA risk assessor for
intake parameter values
appropriate for each Exposure
Pathway.

INSTRUCTIONS FOR TABLE 4
VALUES USED FOR DAILY INTAKE CALCULATIONS (CONTINUED)
December 2001B4-9
Column 8 - Units
Definition:• The units for the parameter code used in the intake equation.
Instructions:• Enter the units for each parameter code consistent with the
picklist defined under Column 5.• Develop additional intake parameter units as necessary.
Consult with the EPA risk assessor
to determine if there is a preference
regarding the units used for different
matrices (e.g., mg/kg for soil, ::g/L
for groundwater). Choices include:
mg/l ::g/l ng/l
pg/l % ppm
ppb ppt g/kg
mg/kg ::g/kg ng/kg
::g/g mg/m3 ::g/m3
fibers/l fibers/m3 fibers/kg
lbs/day ::g/100cm2 mg/cm2
::Rem/hr Rem/yr pCi/g
pCi/kg pCi/m3 pCi/l
pCi/m2/sec Other
Not Documented
Column 9 - Rationale/Reference
Definition:• The reason and reference for the parameter value used.
This rationale may be based upon
guidance or consultation with the
EPA risk assessor.
Instructions:• Enter the rationale and reference for the value.• If the value used is inconsistent with guidance values,
provide a detailed explanation of the rationale and acomplete reference for the value used.
Provide sufficient detail that the
reviewer can easily substantiate the
value.
Column 10 - Intake Equation/Model Name
Definition:• The calculation, equation, or model used for intake
estimates for each Exposure Route.
Instructions:• Enter the intake calculation, equation, and/or model name.• Include a footnote providing a reference to the section of
the risk assessment where information regarding modeledintake development is presented.
For modeled intakes, the table
should list the name of the model or
the equation used.

December 2001B5.1-1
INSTRUCTIONS FOR TABLE 5.1
NON-CANCER TOXICITY DATA - ORAL/DERMAL
PURPOSE OF THE TABLE:• To provide information on RfDs, target organs, and adjustment
factors for chemicals • To provide oral to dermal adjustment factors • To verify references for non-cancer toxicity data.
INFORMATION DOCUMENTED:• The RfDs for each of the COPCs, as well as modifying factors
and oral to dermal adjustments• The organ effects of each of the COPCs• References for RfDs and organ effects.
Surrogate toxicity values can also be
entered in this table and indicated in
the Source(s) column or with a
footnote.
TABLE NUMBERING INSTRUCTIONS: • Complete one copy of this table only.• Number it Table 5.1.• The table should contain a row for each COPC considered.
If chronic and subchronic effects are
listed for the same COPC, two rows
will be required.
GENERAL NOTES/INSTRUCTIONS FOR THIS TABLE:• Table 5.1 does not replace the toxicological profiles for the
individual chemicals that will be presented in the risk assessment.
It may be necessary to refer to RAGS,
the risk assessment technical
approach, and the EPA risk assessor
to complete the table.
HOW TO COMPLETE/INTERPRET THE TABLE
Column 1 - Chemical of Potential Concern
Definition:• Chemicals that are potentially site-related, with data of sufficient
quality, that have been retained for quantitative analysis as aresult of the screening documented in Table 2.
Instructions:• Enter the names of the chemicals that were selected as COPCs
from Table 2.
Chemicals can be grouped in the
order that the risk assessor prefers. Class descriptions (e.g., PAHs, VOCs,
inorganics) can be included as a row
before a group of chemicals.
Column 2 - Chronic/Subchronic
Definition:• Identifies whether the RfD for a particular chemical is for chronic
(long-term) and/or subchronic (short-term) exposure.

INSTRUCTIONS FOR TABLE 5.1
NON-CANCER TOXICITY DATA - ORAL/DERMAL (continued)
December 2001B5.1-2
Instructions:• Enter either “Chronic” or “Subchronic” in the field. Both values
may be available for an individual COPC.• Subchronic values may not be available or necessary for an
individual COPC. If that is the case, enter only “Chronic” inColumn 2.
Chronic
Subchronic
Column 3 - Oral RfD Value
Definition:• The oral RfD value for each of the COPCs.
Instructions:• Enter the value for the chronic and/or subchronic oral RfD (as
appropriate).
Column 4 - Oral RfD Units
Definition:• The oral RfD units for each COPC.
Instructions:• Enter units for each oral RfD value as necessary.
Consult the EPA risk assessor to
determine if there is a preference
regarding the units to be used.
Column 5 - Oral Absorption Efficiency Value for Dermal
Definition:• The adjustment factor used to convert oral RfD values to dermal
RfD values. This value is an oral absorption factor.
Instructions:• Enter the adjustment factor in this column.• Use a footnote to indicate the source of the Oral Absorption
Efficiency for Dermal. Also, specify the section of the riskassessment text where the derivation of the Oral AbsorptionEfficiency for Dermal can be found.
Column 6 - Absorbed RfD for Dermal Value
Definition:• The adjusted RfD for each COPC detected that is derived from
the oral RfD.

INSTRUCTIONS FOR TABLE 5.1
NON-CANCER TOXICITY DATA - ORAL/DERMAL (continued)
December 2001B5.1-3
Instructions:• Enter the value that was derived from the adjustment factor in
Column 5.• In a footnote on this table, reference the section of the risk
assessment text where the derivation of the Absorbed RfDs forDermal can be found.
Derivations of the Absorbed RfD for
Dermal should be performed in as
directed by the EPA risk assessor.
Column 7 - Absorbed RfD for Dermal Units
Definition:• The units associated with the Absorbed RfD for Dermal value for
each COPC.
Instructions:• Enter units for each Absorbed RfD for Dermal value as
necessary.
Consult the EPA risk assessor to
determine if there is a preference
regarding the units to be used.
Column 8 - Primary Target Organ(s)
Definition:• The organ(s) most affected (i.e., experiences critical effects) by
chronic or subchronic exposure to the specific COPC, and uponwhich the RfD is based.
Instructions:• Enter the name of the most affected organ or organ system in the
column. If the critical effect (the one on which the RfD is based)involves multiple target organs, they should be shown, separatedby a ‘/.’ Target organs that are affected at higher doses shouldnot be shown.
Column 9 - Combined Uncertainty/Modifying Factors
Definition:• The factors applied to the critical effect level to account for areas
of uncertainty inherent in extrapolation from available data.
Refer to IRIS, HEAST, or other
source for these values. Examples of
uncertainty to be addressed include:
- variations in the general population
- interspecies variability between
humans and animals
- use of subchronic data for chronic
evaluation
- extrapolation from LOAELs to
NOAELs.
Instructions:• Enter number obtained from IRIS, HEAST, or other source.
Refer to IRIS, HEAST, or other
source for these values.

INSTRUCTIONS FOR TABLE 5.1
NON-CANCER TOXICITY DATA - ORAL/DERMAL (continued)
December 2001B5.1-4
Column 10 - RfD: Target Organ(s) Source(s)
Definition:• The source of the RfD and target organ information.
Instructions:• Enter the source of the RfD and target organ information. Use a
colon to delineate multiple sources if the sources of informationare different for RfD and target organ.
IRIS
HEAST
NCEA
OTHER
Column 11 - RfD: Target Organ(s) Dates (MM/DD/YYYY)
Definition:• The date of the source that was consulted for the RfD and target
organ information in MM/DD/YYYY format.
The MM/DD/YYYY format refers to
month/day/year.
Instructions:• Enter the date, in MM/DD/YYYY format, for both RfD and
target organ information. Use a colon to delineate multiple datesif the dates of information are different for RfD and target organ.
• For IRIS references, provide the date IRIS was searched.
• For HEAST references, provide the date of the HEAST reference.
• For NCEA references, provide the date of the information provided by
NCEA.
For example, the MM/DD/YYYY
version of the date March 30, 1995 is
03/30/1995.

December 2001B5.2-1
INSTRUCTIONS FOR TABLE 5.2
NON-CANCER TOXICITY DATA - INHALATION
PURPOSE OF THE TABLE:• To provide information on RfCs, RfDs, target organs, and
adjustment factors for chemicals • To provide RfC to RfD adjustment factors • To verify references for non-cancer toxicity data.
INFORMATION DOCUMENTED:• The RfDs for each of the COPCs, as well as modifying factors
and RfC to RfD adjustments• The primary target organ effects of each of the COPCs• References for RfCs and organ effects.
Surrogate toxicity values can also
be entered in this table and
indicated in the Source(s) column
or with a footnote.
TABLE NUMBERING INSTRUCTIONS:• Complete one copy of this table only.• Number it Table 5.2.• The table should contain a row for each COPC considered.
If chronic and subchronic effects are
listed for the same COPC, two rows
will be required.
GENERAL NOTES/INSTRUCTIONS FOR THIS TABLE:• Table 5.2 does not replace the toxicological profiles for the
individual chemicals that will be presented in the risk assessment.
It may be necessary to refer to
RAGS, the risk assessment technical
approach, and EPA Regional
guidance to complete the table.
HOW TO COMPLETE/INTERPRET THE TABLE:
Column 1 - Chemical of Potential Concern
Definition:• Chemicals that are potentially site-related, with data of sufficient
quality, that have been retained for quantitative analysis as aresult of the screening documented in Table 2.
Instructions:• Enter the names of the chemicals that were selected as COPCs
from Table 2.
Chemicals can be grouped in the
order that the risk assessor prefers.
Class descriptions can be included
as a row before a group of
chemicals.
Column 2 - Chronic/Subchronic
Definition:• Identifies whether the RfC or RfD for a particular chemical is for
chronic (long-term) and/or subchronic (short-term) exposure.
Instructions:• Enter either “Chronic” or “Subchronic” in the field. Both values
may be available for an individual chemical.• “Subchronic” values may not be available or necessary for an
individual COPC. If that is the case, enter “Chronic” in Column2.
Chronic
Subchronic

INSTRUCTIONS FOR TABLE 5.2
NON-CANCER TOXICITY DATA - INHALATION (continued)
December 2001B5.2-2
Column 3 - Inhalation RfC Value
Definition:• The RfC value for each of the COPCs.
Instructions:• Enter the value for the chronic and/or subchronic oral RfC (as
appropriate).
Column 4 - Inhalation RfC Units
Definition:• The RfC units for each chemical detected.
Instructions:• Enter units for each RfC as necessary.
Consult the EPA risk assessor to
determine if there is a preference
regarding the units to be used.
Column 5 - Extrapolated RfD Value
Definition:• The inhalation RfD for each COPC that is derived from the RfC
value if an RfD is used to calculate risk instead of the RfC.
The derivation of the RfD from an
RfC should be performed as directed
by the EPA risk assessor.
Instructions:• Enter the derived RfD factor in this column.• In a footnote on this table, reference the section of the risk
assessment text where the derivation of the adjusted RfDs can befound.
The equation to derive the RfD from
the RfC is to be included as a
footnote in the table.
Column 6 - Extrapolated RfD Units
Definition:• The Extrapolated RfD units for each COPC.
Instructions:• Enter units for each Extrapolated RfD value as necessary.
Consult the EPA risk assessor to
determine if there is a preference
regarding the units to be used.
Column 7 - Primary Target Organ(s)
Definition:• The organ that is most affected (i.e., experiences critical effects)
by chronic or subchronic exposure to the specific COPC, andupon which the RfD/RfC is based.

INSTRUCTIONS FOR TABLE 5.2
NON-CANCER TOXICITY DATA - INHALATION (continued)
December 2001B5.2-3
Instructions:• Enter the name of the most affected organ or organ system in the
column. • If the critical effect (the one on which the RfD/RfC is based)
involves multiple target organs, they should all be shown,separated by ‘/.’ Target organs affected at higher doses shouldnot be shown.
Column 8 - Combined Uncertainty/Modifying Factors
Definition:• The factors applied to the critical effect level to account for areas
of uncertainty inherent in extrapolation from available data.
Refer to IRIS, HEAST, or other
source for these values. Examples
of uncertainty to be addressed
include:
- variations in the general
population
- interspecies variability between
humans and animals
- use of subchronic data for chronic
evaluation
- extrapolation from LOAELs to
NOAELs.
Instructions:• Enter number obtained from IRIS, HEAST, or other source.
Refer to IRIS, HEAST, or other
source for these values.
Column 9 - RfC: Target Organ(s) Source(s)
Definition:• The sources of the RfC and target organ information.
Instructions:• Enter the sources of the RfC and target organ information. Use
a colon to delineate between multiple information sources if thesources of information are different for RfC and target organ.
IRIS
HEAST
NCEA
OTHER
Column 10 - RfC: Target Organ(s) Date(s) (MM/DD/YYYY)
Definition:• The dates of the documents that were consulted for the RfC and
target organ information in MM/DD/YYYY format.
The MM/DD/YYYY format refers to
month/day/year.

December 2001B5.2-4
Instructions:• Enter the dates, in MM/DD/YYYY format, for RfC and target
organ information. Use a colon to delineate between multipledates if the dates of information are different for RfC and targetorgan.
• For IRIS references, provide the date IRIS was searched.
• For HEAST references, provide the date of the HEAST reference.
• For NCEA references, provide the date of the information provided by NCEA.
For example, the MM/DD/YYYY
version of the date March 30, 1995
is 03/30/1995.

December 2001B5.3-1
INSTRUCTIONS FOR TABLE 5.3
NON-CANCER TOXICITY DATA - SPECIAL CASE CHEMICALS
PURPOSE OF THE TABLE:• To provide information on toxicity values, target organs, and
adjustment factors for unusual chemicals or circumstances orsurrogate chemicals that are not covered by Tables 5.1 or 5.2. Table 5.3 is not required if there are not such chemicals orcircumstances.
• To verify references for non-cancer toxicity data.
For example, a toxicity factor
derived specifically for an individual
risk assessment should be
documented in Table 5.3.
INFORMATION DOCUMENTED:• The toxicity values for each of the COPCs, as well as modifying
factors• The organ effects of each of the COPCs• References for toxicity values and organ effects.
TABLE NUMBERING INSTRUCTIONS:• Complete one copy of this table only.• Number it Table 5.3.• The table should contain a row for each COPC considered.
If chronic and subchronic effects are
listed for the same COPC, two rows
will be required.
GENERAL NOTES/INSTRUCTIONS FOR THIS TABLE:• Table 5.3 does not replace the toxicological profiles for the
individual chemicals that will be presented in the risk assessment.
Refer to RAGS, the risk assessment
technical approach, and the EPA
risk assessor to complete the table.
HOW TO COMPLETE/INTERPRET THE TABLE
Column 1 - Chemical of Potential Concern
Definition:• Chemicals that are potentially site-related, with data of sufficient
quality, that have been retained for quantitative analysis as aresult of the screening documented in Table 2.
Instructions:• Enter the names of the chemicals that were selected as COPCs
from Table 2.
Chemicals can be grouped in the
order that the risk assessor prefers.
Class descriptions (e.g., PAHs,
VOCs, inorganics) can be included
as a row before a group of
chemicals.
Column 2 - Chronic/Subchronic
Definition:• Identifies whether the toxicity value for a particular chemical is
for chronic (long-term) and/or subchronic (short-term) exposure.

INSTRUCTIONS FOR TABLE 5.3
NON-CANCER TOXICITY DATA -SPECIAL CASE CHEMICALS (continued)
December 2001B5.3-2
Instructions:• Enter either “Chronic” or “Subchronic” in the field. Both values
may be available for an individual COPC.• “Subchronic” values may not be available or necessary for an
individual chemical. If that is the case, enter only “Chronic” inthe column.
Chronic
Subchronic
Column 3 - Parameter Name
Definition:• The name of parameter/toxicity factor being recorded for each
COPC.
Toxicity factors derived specifically
for an individual risk assessment
should be recorded here.
Instructions:• Enter the name of parameter/toxicity factor.
Column 4 - Parameter Value
Definition:• The toxicity parameter value for each COPC.
Instructions:• Enter the value for the chronic and/or subchronic toxicity values
(as appropriate).
Column 5 - Parameter Units
Definition:• The units associated with the toxicity value for each COPC.
Instructions:• Enter units for each reference as necessary.
Consult the EPA risk assessor to
determine if there is a preference
regarding the units to be used.
Column 6 - Primary Target Organ(s)
Definition:• The organ(s) most affected (i.e., experiences critical effects) by
chronic or subchronic exposure to the specific COPC, and uponwhich the RfD is based.
Instructions:• Enter the name of the most affected organ or organ system in the
column. If the critical effect (the one that the RfD is based on)involves multiple target organs, they should all be shown,separated by a ‘/.’ Target organs affected at higher doses shouldnot be shown.

INSTRUCTIONS FOR TABLE 5.3
NON-CANCER TOXICITY DATA -SPECIAL CASE CHEMICALS (continued)
December 2001B5.3-3
Column 7 - Combined Uncertainty/Modifying Factors
Definition:• The factors applied to the critical effect level to account for areas
of uncertainty inherent in extrapolation from available data.
Refer to IRIS, HEAST, or other
source for these values. Examples
of uncertainty to be addressed
include:
- variations in the general
population
- interspecies variability between
humans and animals
- use of subchronic data for chronic
evaluation
- extrapolation from LOAELs to
NOAELs.
Instructions:• Enter number obtained from IRIS, HEAST, or other source.
Refer to IRIS, HEAST, or other
source for these values.
Column 8 - Parameter: Target Organ(s) Sources
Definition:• The sources of the toxicity and target organ information.
Instructions:• Enter the sources of the toxicity and target organ information.
Use a colon to delineate multiple sources if the sources ofinformation for toxicity and target organ are different.
IRIS
HEAST
NCEA
OTHER
Column 9 - Parameter: Target Organ(s) Date(s) (MM/DD/YYYY)
Definition:• The dates of the sources that were consulted for the toxicity
information and the target organ information in MM/DD/YYYYformat.
The MM/DD/YYYY format refers to
month/day/year.
Instructions:• Enter the dates, in MM/DD/YYYY format, for the toxicity and
target organ information. Use a colon to delineate betweenmultiple dates if the sources of information are different fortoxicity and target organ.
• For IRIS references, provide the date IRIS was searched.
• For HEAST references, provide the date of the HEAST reference.
• For NCEA references, provide the date of the information provided by NCEA.
For example, the MM/DD/YYYY
version of the date March 30, 1995
is 03/30/1995.

December 2001B6.1-1
INSTRUCTIONS FOR TABLE 6.1
CANCER TOXICITY DATA - ORAL/DERMAL
PURPOSE OF THE TABLE:• To provide the oral and dermal cancer toxicity information
(values and sources of information) for chemicals of potentialconcern
• To provide the methodology and adjustment factors used toconvert oral cancer toxicity values to dermal toxicity values
• To provide weight of evidence/cancer guideline descriptions foreach chemical of potential concern.
INFORMATION DOCUMENTED:• Oral and dermal toxicity values for chemicals of potential concern• Weight of evidence/cancer guidelines descriptions for chemicals
of potential concern• The source/reference for each toxicity value.
Surrogate toxicity values can also
be entered in this table and
indicated in the ‘Source(s)’ column
or with a footnote.
GENERAL NOTES/INSTRUCTIONS FOR THIS TABLE:• Table 6.1 does not replace toxicological profiles for the individual
chemicals that will be presented in the risk assessment.
It may be necessary to refer to
RAGS, the risk assessment technical
approach, and the EPA risk
assessor to complete the table.
HOW TO COMPLETE/INTERPRET THE TABLE
Column 1 - Chemical of Potential Concern
Definition:• Chemicals that are potentially site-related, with data of sufficient
quality, that have been retained for quantitative analysis as aresult of the screening documented in Table 2.
Instructions:• Enter the names of the chemicals that were selected as COPCs
from Table 2.
Chemicals may be grouped in the
order that the risk assessor chooses.
Class descriptions can be included
as a row before a group of
chemicals.
Column 2 - Oral Cancer Slope Factor Value
Definition:• Cancer slope factor for ingestion.
Instructions:• Enter the oral cancer slope factor value for each of the COPCs.
Refer to IRIS and HEAST. If
toxicity information is not available,
contact EPA’s National Center for
Environmental Assessment (NCEA)
office.

INSTRUCTIONS FOR TABLE 6.1
CANCER TOXICITY DATA - ORAL/DERMAL (continued)
December 2001B6.1-2
Column 3 - Oral Cancer Slope Factor Units
Definition:• Units for the cancer slope factor for ingestion.
Instructions:• Enter units for each oral cancer slope factor.
Consult the EPA risk assessor to
determine if there is a preference
regarding the units to be used.
Column 4 - Oral Absorption Efficiency for Dermal
Definition:• The absorbed factor used to convert the oral RfD values to
dermal RfD values.
Instructions:• Enter the oral to dermal adjustment factor.• Use a footnote to indicate the source of the Oral Absorption
Efficiency for dermal.
.
Column 5 - Absorbed Cancer Slope Factor for Dermal Value
Definition:• The absorbed dermal cancer slope factor for each chemical of
potential concern which typically is derived from the oral cancerslope factor.
Derivation of the dermal cancer
slope factor should be performed in
consultation with the EPA risk
assessor.
Instructions:• Enter the derived dermal cancer slope factor.• Use a footnote to specify the section of the risk assessment text
where the derivation of the Absorbed Cancer Slope Factor forDermal can be found.
Column 6 - Absorbed Cancer Slope Factor for Dermal Units
Definition:• The units associated with each Absorbed Cancer Slope Factor
for Dermal.
Instructions:• Enter the units for the Absorbed Cancer Slope Factors for
Dermal.
Typically (mg/kg-day)-1. Consult
with the EPA risk assessor to
determine if there is a preference
regarding the units to be used.
Column 7 - Weight of Evidence/Cancer Guideline Description

INSTRUCTIONS FOR TABLE 6.1
CANCER TOXICITY DATA - ORAL/DERMAL (continued)
December 20016.1-3
Definition:• An EPA classification system for characterizing the extent to
which the available data indicate that an agent is a humancarcinogen.
Instructions:• Provide the weight of evidence or cancer guideline description.• Choose from the categories to the right.
Weight of Evidence:
A - Human carcinogen
B1 - Probable human carcinogen -
indicates that limited human data
are available.
B2 - Probable human carcinogen -
indicates sufficient evidence in
animals and inadequate or no
evidence in humans.
C - Possible human carcinogen
D - Not classifiable as a human
carcinogen
E - Evidence of noncarcinogenicity
Cancer Guideline Description:
Known/Likely
Cannot be Determined
Not Likely
Column 8 - Oral CSF Source(s)
Definition:• A reference for the oral cancer slope factor.
Instructions:• Enter the reference for the toxicity information.
For example:
IRIS
HEAST
NCEA
Column 9 -Oral CSF Date(s) (MM/DD/YYYY)
Definition:• The date of the document that was consulted for the cancer
toxicity data in MM/DD/YYYY format.
The MM/DD/YYYY format refers to
month/day/year.
Instructions:• Enter the date in MM/DD/YYYY format.
• For IRIS references, provide the date IRIS was searched.
• For HEAST references, provide the date of the HEAST reference.
• For NCEA references, provide the date of the information provided by
NCEA.
For example, the MM/DD/YYYY
version of the date March 30, 1995
is 03/30/1995.

December 2001B6.2-1
INSTRUCTIONS FOR TABLE 6.2
CANCER TOXICITY DATA - INHALATION
PURPOSE OF THE TABLE:• To provide the inhalation cancer toxicity information (values and
sources of information) for chemicals of potential concern• To provide the methodology and adjustment factors used to
convert inhalation unit risks to inhalation cancer slope factors• To provide weight of evidence/cancer guideline descriptions for
each chemical of potential concern.
INFORMATION DOCUMENTED:• Inhalation toxicity values for chemicals of potential concern• Weight of evidence/cancer guidelines descriptions for chemicals
of potential concern• The source/reference for each toxicity value.
Surrogate toxicity values can also
be entered in this table and
indicated in the ‘Source(s)’ column
or with a footnote.
GENERAL NOTES/INSTRUCTIONS FOR THIS TABLE:• Table 6.2 does not replace toxicological profiles for the individual
chemicals that will be presented in the risk assessment.
It may be necessary to refer to
RAGS, the risk assessment technical
approach, and the EPA risk
assessor to complete the table.
HOW TO COMPLETE/INTERPRET THE TABLE
Column 1 - Chemical of Potential Concern
Definition:• Chemicals that are potentially site-related, with data of sufficient
quality, that have been retained for quantitative analysis as aresult of the screening documented in Table 2.
Instructions:• Enter the names of the chemicals that were selected as COPCs
from Table 2.
Chemicals may be grouped in the
order that the risk assessor chooses.
Class descriptions (e.g., PAHs,
VOCs, inorganics) can be included
as a row before a group of
chemicals.
Column 2 - Unit Risk Value
Definition:• Toxicity values for carcinogenic effects expressed in terms of
risk per unit concentration of the substance in the medium wherehuman contact occurs. Cancer slope factors can be calculatedfrom unit risk values.
Instructions:• Enter the inhalation unit risk value
Refer to IRIS and HEAST; if
toxicity information is not available,
contact EPA’s National Center for
Environmental Assessment (NCEA)
office.

INSTRUCTIONS FOR TABLE 6.2
CANCER TOXICITY DATA - INHALATION (continued)
December 2001B6.2-2
Column 3 - Unit Risk Units
Definition:• The units used for the unit risk for each chemical detected.
Instructions:• Enter the units for the unit risk values.
Consult the EPA risk assessor to
determine if there is a preference
regarding the units to be used.
Column 4 - Inhalation Cancer Slope Factor Value
Definition:• A plausible upper-bound estimate of the probability of a response
per unit intake of a chemical over a lifetime.
Usually the cancer slope factor is
the upper 95th % confidence limit
of the dose-response curve for
inhalation.
Instructions:• Enter the Inhalation Cancer Slope Factor if Cancer Slope Factors
were used to calculate risk instead of Inhalation Unit Risks.
Column 5 - Inhalation Cancer Slope Factor Units
Definition:• The units used for the Inhalation Cancer Slope Factor for each
chemical detected.
Instructions:• Enter the units for the Inhalation Cancer Slope Factors.
Consult EPA risk assessor to
determine if there is a preference
regarding the units to be used.
Column 6 - Weight of Evidence/Cancer Guideline Description
Definition:• An EPA classification system for characterizing the extent to
which the available data indicate that an agent is a humancarcinogen.

INSTRUCTIONS FOR TABLE 6.2
CANCER TOXICITY DATA - INHALATION (continued)
December 2001B6.2-3
Instructions:• Provide the weight of evidence or cancer guideline description.• Choose from the categories to the right.
Weight of Evidence:
A - Human carcinogen
B1 - Probable human carcinogen -
indicates that limited human data
are available.
B2 - Probable human carcinogen -
indicates sufficient evidence in
animals and inadequate or no
evidence in humans.
C - Possible human carcinogen
D - Not classifiable as a human
carcinogen
E - Evidence of noncarcinogenicity
Cancer Guideline Description:
Known/Likely
Cannot be Determined
Not Likely

INSTRUCTIONS FOR TABLE 6.2
CANCER TOXICITY DATA - INHALATION (continued)
December 2001B6.2-4
Column 7 - Unit Risk: Inhalation Cancer Slope Factor Source(s)
Definition:• A reference for the Unit Risk and Inhalation Cancer Slope Factor
values.
Instructions:• Enter the reference(s) for Unit Risk and Inhalation Cancer Slope
Factor values. Use a colon to delineate multiple sources.
IRIS
HEAST
NCEA
Column 8 - Unit Risk: Inhalation Cancer Slope Factor Date(s) (MM/DD/YYYY)
Definition:• The date of the document that was consulted for the cancer
toxicity data in MM/DD/YYYY format.
The MM/DD/YYYY format refers to
month/day/year.
Instructions:• Enter the date in MM/DD/YYYY format. Use a colon to
delineate between multiple dates, if multiple sources ofinformation were used.
• For IRIS references, provide the date IRIS was searched.
• For HEAST references, provide the date of the HEAST reference.
• For NCEA references, provide the date of the information provided by NCEA.
For example, the MM/DD/YYYY
version of the date March 30, 1995
is 03/30/1995.

December 2001B6.3-1
INSTRUCTIONS FOR TABLE 6.3
CANCER TOXICITY DATA - SPECIAL CASE CHEMICALS
PURPOSE OF THE TABLE:• To provide cancer toxicity information for unusual chemicals,
surrogate chemicals or circumstances that are not covered byTables 6.1 or 6.2. Table 6.3 (or non-standard tables) can also beused to accommodate threshold carcinogens, if applicable. Table6.3 is not required if there are no such chemicals orcircumstances.
For example, a toxicity factor
derived specifically for an
individual risk assessment should
be documented in Table 6.3.
INFORMATION DOCUMENTED:• Cancer toxicity information (values and units) for special case
chemicals• The date and source of the toxicity information.
TABLE NUMBERING INSTRUCTIONS: • Complete one copy of this table only.• Number it 6.3.• The table should contain a row for each COPC considered.
GENERAL NOTES/INSTRUCTIONS FOR THIS TABLE:• Table 6.3 does not replace toxicological profiles for the individual
chemicals that will be presented in the risk assessment.
It may be necessary to refer to
RAGS, the risk assessment
technical approach, and consult
the EPA risk assessor to complete
the table.
HOW TO COMPLETE/INTERPRET THE TABLE
Column 1 - Chemical of Potential Concern
Definition:• Chemicals that are potentially site-related, with data of sufficient
quality, that have been retained for quantitative analysis as aresult of the screening documented in Table 2.
Instructions:• Enter the names of the chemicals that were selected as COPCs
from Table 2.
Chemicals may be grouped in the
order that the risk assessor
chooses. Class descriptions can be
included as a row before a group
of chemicals.
Column 2 - Parameter Name
Definition:• The name of the toxicity parameter being recorded.
Instructions:• Enter the names of the toxicity parameter being recorded.

INSTRUCTIONS FOR TABLE 6.3
CANCER TOXICITY DATA - SPECIAL CASE CHEMICALS (continued)
December 2001B6.3-2
Column 3 - Parameter Value
Definition:• The toxicity value for each listed parameter for each chemical of
potential concern.
Instructions:• Enter the toxicity value for each chemical of potential concern.
Refer to IRIS, HEAST, or other
source for these valued.
Column 4 - Parameter Units
Definition:• The units associated with the toxicity value.
Instructions:• Enter the toxicity units.
Typically (mg/kg-day)-1
Consult the EPA risk assessor to
determine if there is a preference
regarding the units to be used.
Column 5 -Source(s)
Definition:• A reference for the cancer toxicity information.
Instructions:• Enter the reference for toxicity information. Use a colon to
delineate multiple sources.
IRIS
HEAST
NCEA
OTHER
Column 6 - Date(s) (MM/DD/YYYY)
Definition:• The date of the document that was consulted for the cancer
toxicity data in the MM/DD/YYYY format.
The MM/DD/YYYY format refers
to month/day/year.
Instructions:• Enter the date in MM/DD/YYYY format. Use a comma to
delineate between multiple dates, if multiple sources ofinformation were used.
• For IRIS references, provide the date IRIS was searched.
• For HEAST references, provide the date of the HEAST reference.
• For NCEA references, provide the date of the information provided by NCEA.
For example, the MM/DD/YYYY
version of the date March 30,
1995 is 03/30/1995.

December 2001B6.4-1
INSTRUCTIONS FOR TABLE 6.4
CANCER TOXICITY DATA - EXTERNAL (RADIATION)
PURPOSE OF THE TABLE:• To provide cancer toxicity information for radionuclides.
INFORMATION DOCUMENTED:• Cancer toxicity information (values and units) for radionuclides.• The source and date of the toxicity information.
GENERAL NOTES/INSTRUCTIONS FOR THIS TABLE:• Table 6.4 does not replace toxicological profiles for the individual
radionuclides that will be presented in the risk assessment.
It may be necessary to refer to
RAGS, the risk assessment technical
approach, and the EPA risk
assessor to complete the table.
HOW TO COMPLETE/INTERPRET THE TABLE
Column 1 - Chemical of Potential Concern
Definition:• Radionuclides that are potentially site-related, with data of
sufficient quality, that have been retained for quantitative analysisas a result of the screening documented in Table 2.
Instructions:• Enter the names of the radionuclides that were selected as
COPCs from Table 2.
Radionuclides may be grouped in
the order that the risk assessor
chooses.
Column 2 - Cancer Slope Factor Value
Definition:• A Cancer Slope Factor is an age-averaged lifetime excess cancer
incidence rate per unit intake (or unit exposure for externalexposure pathways) and is used to convert the intake to a cancerrisk. Ingestion and inhalation slope factors are central estimatesin a linear model of the age-averaged, lifetime attributableradiation cancer incidence (fatal and nonfatal cancer) risk perunity of activity inhaled or ingested, expressed as risk/picocurie(pCi). External exposure slope factors are central estimates ofthe lifetime attributable radiation cancer incidence risk for eachyear of exposure to external radiation from photon-emittingradionuclides distributed uniformly in a thick layer of soil, and areexpressed as risk/yr per pCi/gram of soil.
Instructions:• Enter the value of the cancer slope factor for each COPC.
Column 3 - Cancer Slope Factor Units
Definition:• The units associated with the Cancer Slope Factor value.

INSTRUCTIONS FOR TABLE 6.4
CANCER TOXICITY DATA - EXTERNAL (RADIATION) (continued)
December 2001B6.4-2
Instructions:• Enter the units for the Cancer Slope Factor value.
Consult the EPA risk assessor to
determine if there is a preference
regarding the units to be used.
Column 4 -Source(s)
Definition:• A reference for the cancer slope or conversion factor value.
Instructions:• Enter the reference(s) for the cancer slope or conversion factor
value. Use a colon to delineate multiple sources.
For example:
IRIS
HEAST
NCEA
OTHER
Column 5 - Date(s) (MM/DD/YYYY)
Definition:• The date of the document that was consulted for the cancer slope
or conversion factor value in the MM/DD/YYYY format.
The MM/DD/YYYY format refers to
month/day/year.
Instructions:• Enter the date in MM/DD/YYYY format. Use a colon to
delineate between multiple dates, if multiple sources ofinformation were used.
For IRIS references, provide the date IRIS was searched.
For HEAST references, provide the date of the HEAST reference.
For NCEA references, provide the date of the information provided by NCEA.
For example, the MM/DD/YYYY
version of the date March 30, 1995
is 03/30/1995.

December 2001B7-1
INSTRUCTIONS FOR TABLE 7
CALCULATION OF CHEMICAL CANCER RISKS AND NON-CANCER HAZARDS
PURPOSE OF THE TABLE:• To provide a summary of the variables used to calculate chemical
cancer risks and non-cancer hazards• To show the EPC and intake used in the non-cancer hazard and
cancer risk calculations• To present the result of the calculation for each Exposure
Route/Pathway for each COPC• To provide the total hazard index and cancer risk for all Exposure
Routes/Pathways for the Scenario Timeframe and Receptorpresented in this table.
INFORMATION DOCUMENTED:• The non-cancer hazard quotient and unit risk for each COPC for
each Exposure Route/Pathway• The values used for EPC, cancer and non-cancer intakes,
reference doses, and reference concentrations.
An alternate presentation is also
available with cancer information
shown on Table 7a and non-cancer
information shown on Table 7b.
TABLE NUMBERING AND SUMMARY BOX INSTRUCTIONS:• Complete one copy of Table 7 for each unique combination of the
following three fields that will be quantitatively evaluated(Scenario Timeframe, Receptor Population, and Receptor Age).
• Enter each combination of these three fields in the Summary Boxin the upper left corner of the table.
Note: Each combination of the three key fields and the first four columns should be
found as a row in Table 1.
• Number each table uniquely, beginning with 7.1 and ending with7.n where “n” represents the total number of combinations of thesix key fields.
• Different tables should be prepared to address RME and CT non-cancer hazard calculations when appropriate.
• Tables 7.1.RME through 7.n.RME should be completed for RMEnon-cancer and cancer hazard calculations when appropriate.
• Tables 7.1.CT through 7.n.CT should be completed for CT non-cancer and cancer hazard calculations.
It is possible that some tables may
contain some of the same data
associated with different descriptions
in the Summary Box in the upper
left corner.
Separate tables may be necessary to
ensure transparency in data
presentation for each Exposure
Pathway. Replication of
information is readily accomplished
using spreadsheet software.
Consult the EPA rise assessor for
alternatives (e.g., footnotes) to
preparing multiple tables with the
same data.

INSTRUCTIONS FOR TABLE 7
CALCULATION OF CHEMICAL CANCER RISKS AND NON-CANCER HAZARDS (continued)
December 2001B7-2
TABLE NUMBERING AND SUMMARY BOX INSTRUCTIONS(continued):
• An optional approach is to report cancer and non-cancer valueson separate tables as follows:- Number non-cancer tables 7.1A.RME - 7.nA.RME or
7.1A.CT - 7.nA.CT, where “n” represents the total numberof combinations of the three key fields.
- Number cancer tables 7.1B.RME-7.nB RME or 7.1B.CT-7.nB.CT, where “n” represents the total number ofcombinations of the three key fields.
- The first seven columns remain the same for both non-cancer or cancer tables. Columns 8-12 contain either theCancer Risk Calculations data or the Non-Cancer HazardCalculations data.
- See the blank Planning Tables for an illustration of howTable 7 data can be separated as described above.
When reporting cancer and non-
cancer values on separate tables,
use the column names to identify
instructions for completing each
column, as the column number will
differ after Column 7.
GENERAL NOTES/INSTRUCTIONS FOR THIS TABLE:
• All table entries, with the exception of Intake, Non-CancerHazard and Cancer Risk are presented on tables preceding Table7.
• With the exception of modeled intakes, the intake value is theresult of calculations performed using parameters and equationspresented in Table 4 and concentrations presented in Table 3.
• The Total Non-Cancer Hazard is to be summed for eachExposure Route and Exposure Point in the Exposure Route Totaland Exposure Point Total rows. The total Non-Cancer Hazardfor all Exposure Pathways for a given Receptor is to bepresented as the Total of Receptor Hazards Across All Media atthe bottom of the table. This value represents the non-cancerhazard of the various exposure routes/pathways combined.
• The total Cancer Risk is to be summed for each Exposure Routeand Exposure Point in the Exposure Route Total and ExposurePoint Total rows. The Total Cancer Risk for all ExposurePathways for a given Receptor is to be presented as the Total ofReceptor Risks Across All Media at the end of the table. Thisvalue represents the cancer risk of the various ExposureRoutes/Pathways combined to a given receptor.

INSTRUCTIONS FOR TABLE 7
CALCULATION OF CHEMICAL CANCER RISKS AND NON-CANCER HAZARDS (continued)
December 2001B7-3
HOW TO COMPLETE/INTERPRET THE TABLE
SUMMARY BOX IN UPPER LEFT CORNER
Row 1 - Scenario Timeframe
Definition:• The time period (current and/or future) being considered for the
Exposure Pathway.
Instructions:• Choose from the picklist to the right.
Current
Future
Current/Future
Not Documented
Row 2 - Receptor Population
Definition:• The exposed individual relative to the Exposure Pathway
considered.
For example, a resident (Receptor
Population) who drinks
contaminated groundwater.
Instructions:• Choose from the picklist to the right.
Resident
Industrial Worker
Commercial Worker
Construction Worker
Other Worker
Golfer
Jogger
Fisher
Hunter
Fisher/Hunter
Swimmer
Other Recreational Person
Child at School/Daycare/
Playground
Trespasser/Visitor
Farmer
Gardener
Gatherer
Other
Row 3 - Receptor Age
Definition:• The description of the exposed individual, as defined by the EPA
Region or dictated by the site.
For example, an adult (Receptor
Age) resident (Receptor Population)
who drinks contaminated
groundwater.

INSTRUCTIONS FOR TABLE 7
CALCULATION OF CHEMICAL CANCER RISKS AND NON-CANCER HAZARDS (continued)
December 2001B7-4
Instructions:• Choose from the picklist to the right.
Child
Adult
Adolescents (teens)
Pre-Adolescents
Not Documented
Child/Adult
Geriatric
Sensitive
Other
Infant
Toddler
Pregnant
BODY OF THE TABLE
Column 1 - Medium
Definition:• The substance (e.g., air, water, soil) that is a potential source of
contaminants in the Exposure Medium. (The Medium willsometimes equal the Exposure Medium.) Usually, the Medium isthat targeted for possible remediation.
Instructions:• Choose from the picklist to the right.
Groundwater
Leachate
Sediment
Sludge
Soil
Surface Water
Debris
Liquid Waste
Solid Waste
Air
Surface Soil
Subsurface Soil
Other
Column 2 - Exposure Medium
Definition:• The contaminated environmental medium to which an individual
may be exposed. Includes the transfer of contaminants from onemedium to another.
For example:
1) Contaminants in Groundwater (the Medium) remain in Groundwater (the
Exposure Medium) and are available for exposure to receptors.
2) Contaminants in Groundwater (the Medium) may be transferred to Air (the
Exposure Medium) and are available for exposure to receptors.
3) Contaminants in Sediment (the Medium) may be transferred to Fish Tissue
(the Exposure Medium) and are available for exposure to receptors.

INSTRUCTIONS FOR TABLE 7
CALCULATION OF CHEMICAL CANCER RISKS AND NON-CANCER HAZARDS (continued)
December 2001B7-5
Instructions:• Choose from the picklist to the right.
Groundwater
Leachate
Sediment
Sludge
Soil
Surface Water
Debris
Liquid Waste
Solid Waste
Air
Plant Tissue
Animal Tissue
Fish Tissue
Spring Water
Surface Soil
Subsurface Soil
Particulates
Vapors
Other
Column 3 - Exposure Point
Definition:• An exact location of potential contact between a person and a
chemical or radionuclide within an Exposure Medium.
For example:
1) Contaminants are in Groundwater (the Medium and the Exposure
Medium) and exposure to Aquifer 1 - Tap Water (the Exposure Point) is
evaluated.
2) Contaminants in Groundwater (the Medium) may be transferred to Air (the
Exposure Medium) and exposure to Aquifer 1 - Water Vapors at
Showerhead (the Exposure Point) is evaluated.
3) Contaminants in Sediment (the Medium) may be transferred to Fish Tissue
(the Exposure Medium) and Trout from Dean’s Creek (the Exposure
Point) is evaluated.
Instructions:• Provide the information as text in the Table.
Exposure Point should be defined in
the same way as was done in
Planning Table 1.
Column 4 - Exposure Route
Definition:• The way a chemical or radionuclide comes in contact with a
person (e.g., by ingestion, inhalation, dermal contact).

INSTRUCTIONS FOR TABLE 7
CALCULATION OF CHEMICAL CANCER RISKS AND NON-CANCER HAZARDS (continued)
December 2001B7-6
Instructions:• Enter the Exposure Route considered from the picklist to the
right.
Inhalation
Ingestion
Combined (i.e., Inhalation andIngestion)Dermal
Not Documented
External (Radiation)

INSTRUCTIONS FOR TABLE 7
CALCULATION OF CHEMICAL CANCER RISKS AND NON-CANCER HAZARDS (continued)
December 2001B7-7
Column 5 - Chemical of Potential Concern
Definition:• Chemicals that are potentially site-related, with data of sufficient
quality, that have been retained for quantitative analysis as aresult of the screening documented in Table 2.
Instructions:• Enter the COPCs selected from the COPC screening.
Table 2 documents COPC
screening.
Column 6 - EPC Value
Definition:• The EPC, based on either a statistical derivation of measured
data or modeled data, that represents an estimate of the chemicalor radionuclide concentration.
The EPC value may be statistically derived by calculating the 95% UCL of
measured groundwater contaminant concentrations from multiple residential wells.
Alternatively, the EPC value may be selected as a single measured value, if one
data point is used to calculate the risk for each residential well individually. In
some cases, the EPC value may be a modeled value (e.g., if upgradient
groundwater contaminant concentrations are used to model groundwater
concentration at a downgradient exposure point, or if sediment concentrations are
used to model fish tissue concentrations).
The EPC Value may be calculated,
measured, or modeled.
Instructions:• Enter the EPC value for each COPC. This value should be in
Table 3.• If an EPC other than the one found in Table 3 is used, indicate it
with a footnote and include a reference to supporting informationthat will show how the data were modeled in the risk assessment.
Table 3 documents EPC
calculations for RME and CT.
Column 7 - EPC Units
Definition:• The units associated with the EPC value.
Instructions:• Enter the units for EPC values.
Consult the EPA risk assessor for
unit preferences.
Column 8 - Cancer Risk Calculations - Intake/Exposure Concentration Value (Also Column 8 on Table7a)

INSTRUCTIONS FOR TABLE 7
CALCULATION OF CHEMICAL CANCER RISKS AND NON-CANCER HAZARDS (continued)
December 2001B7-8
Definition:• Intake is a measure of exposure expressed as the mass of a
substance in contact with the exchange boundary per unit bodyweight per unit time (e.g. mg chemical/kg body weight/day).
Refers to the intake/exposure
concentration results using the
parameters and equations,
calculations and/or models
presented in Table 4.
Instructions:• Enter the result of the intake calculations/modeling or the
exposure concentration performed for each COPC and ExposureRoute.
The intake equations, calculations,
and/or models are documented in
Table 4.
Column 9 - Cancer Risk Calculations - Intake/Exposure Concentration Units (Also Column 9 on Table7a)
Definition:• The units for intake or exposure concentration for each COPC
and Exposure Route.
Instructions:• Enter the units from the intake calculation or exposure
concentration for each COPC which corresponds to eachExposure Route.
Column 10 - Cancer Risk Calculations - CSF/Unit Risk Value (Also Column 10 on Table 7a)
Definition:• The slope factor is used to estimate an upper-bound probability of
an individual developing cancer as a result of a lifetime ofexposure to a particular level of potential carcinogen.
• Unit Risk is a toxicity value for carcinogenic effects expressed interms of risk per unit concentration of the substance in themedium where human contact occurs. These measures can becalculated from cancer slope factors.
Instructions:• Enter the cancer slope factor or unit risk for each COPC which
corresponds to each exposure route.
The slope factors and unit risk
values for each COPC are presented
in Tables 6.1, 6.2, and 6.3.
Column 11 - Cancer Risk Calculations - CSF/Unit Risk Units (Also Column 11 on Table 7a)
Definition:• The units for the cancer slope factor or unit risk.
Instructions:• Enter the cancer slope factor or unit risk units for each COPC for
each Exposure Route.
Column 12 - Cancer Risk Calculations - Cancer Risk (Also Column 12 on Table 7a)

INSTRUCTIONS FOR TABLE 7
CALCULATION OF CHEMICAL CANCER RISKS AND NON-CANCER HAZARDS (continued)
December 2001B7-9
Definition:• The result of the cancer risk calculation for each COPC for each
Exposure Route and Exposure Pathway.
Instructions:• Enter the cancer risk calculation for each COPC.• Sum the cancer risk results for each Exposure Route in the
Exposure Route Total row. • Sum the cancer risk calculation results for each Exposure Point in
the Exposure Route Total row. • Sum the total cancer risk results for all Exposure Pathways in the
Total of Receptor Risks Across all Media row.
The sum of all Exposure Routes
represents the total cancer risk for
all Exposure Routes/ Pathways.
Column 13 - Non-Cancer Hazard Calculations - Intake/Exposure Concentration Value (Also Column 8on Table 7b)
Definition:• Intake is a measure of exposure expressed as the mass of a
substance in contact with the exchange boundary per unit bodyweight per unit time.
Refers to the intake/exposure
concentration results using the
parameters and
equations/calculations and/or
models presented in Table 4.
Instructions:• Enter the result of the intake calculations/modeling performed for
each COPC and Exposure Route.
The intake equations, calculations,
and/or models are documented in
Table 4.
Column 14 - Non-Cancer Hazard Calculations - Intake/Exposure Concentration Units (Also Column 9on Table 7b)
Definition:• The units for intake for each COPC and Exposure Route.
Instructions:• Enter the units from the intake calculation for each COPC which
corresponds to each Exposure Route.
Column 15 - Non-Cancer Hazard Calculations - RfD/RfC Value (Also Column 10 on Table 7b)
Definition:• RfD is the toxicity value for evaluating non-cancer effects
resulting from exposures.• RfC is the toxicity value for inhalation.

INSTRUCTIONS FOR TABLE 7
CALCULATION OF CHEMICAL CANCER RISKS AND NON-CANCER HAZARDS (continued)
December 2001B7-10
Instructions:• Enter the RfD or RfC value. • For RfD, enter the reference dose for each COPC which
corresponds to each exposure route.• Enter Oral RfD values for ingestion.• Enter Adjusted Dermal RfD values for dermal.• Enter Adjusted Inhalation RfD/RfC values for inhalation.
The reference doses (RfD/RfC) for
each COPC are presented in Table
5.

INSTRUCTIONS FOR TABLE 7
CALCULATION OF CHEMICAL CANCER RISKS AND NON-CANCER HAZARDS (continued)
December 2001B7-11
Column 16 - Non-Cancer Hazard Calculations - RfD/RfC Units (Also Column 11 on Table 7b)
Definition:• The units associated with the reference dose or reference
concentration.
RfDs are typically reported in
mg/kg-day, a dose term, RfCs in
mg/m3.
Instructions:• Enter the units for reference dose or reference concentration for
each COPC for each exposure route.• RfC is typically reported as a concentration in air (mg/m3) which
can be converted to an inhaled dose (mg/kg-day).
Column 17 - Non-Cancer Hazard Calculations - Hazard Quotient (Also Column 12 on Table 7b)
Definition:• The ratio of a single substance exposure level, over a specified
time period, to a reference dose for that substance, derived froma similar exposure period.
Instructions:• Enter the result of the hazard quotient calculation for each
COPC.• Sum the hazard quotient for each Exposure Route in the
Exposure Route Total row. • Sum the hazard quotient for each Exposure Point in the Exposure
Route Total row. • Sum the hazard quotients for all Exposure Pathways in the Total
of Receptor Hazards across all Media row.
The Hazard Index represents the
total non-cancer hazard for all
exposure routes/pathways presented
in this table.

December 2001B8-1
INSTRUCTIONS FOR TABLE 8
CALCULATION OF RADIATION CANCER RISKS
PURPOSE OF THE TABLE:• To provide a summary of the variables and approaches used to
calculate radiation cancer risks• To show the EPC used in the radiation cancer risk calculations• To document the radiation risk calculation approach used to
calculate radiation cancer risks• To show, based on the documented risk calculation approach, the
intake and cancer slope factors• To present the result of the calculation for each Exposure
Route/Pathway for each COPC• To provide the total radiation cancer risks for each Exposure
Route/Pathway for the Scenario Timeframe, and Receptorpresented in this table
• To provide the total radiation cancer risks for each ExposurePoint for the Scenario Timeframe and Receptor in this table
• To provide the total radiation cancer risks across all media for theScenario Timeframe and Receptor in this table
Radiation can be evaluated two
ways: 1) Calculate cancer risks.
The evaluation method used needs
to be documented in the Planning
Tables 2) Compare radiation
doses to standards (i.e., EPA
NESHAPS or MCLs or DOE/NRC
cleanup standards).
Table 8 is used to show the
variables and results when using the
first method. The Dose Assessment
Worksheet can be used to calculate
doses which can be compared to
radiological dose standards.
INFORMATION DOCUMENTED:• The approach for calculating the radiation cancer risk for each
COPC for each Exposure Route/Pathway• The values used for EPC, intake and cancer slope factor for each
COPC for each Exposure Route• The cancer risk value for each COPC for each Exposure
Route/Pathway• Total cancer risk values by Exposure Route, Exposure Point, and
across all media for the Scenario Timeframe and Receptorpresented in this table
TABLE NUMBERING AND SUMMARY BOX INSTRUCTIONS:• Complete one copy of Table 8 for each unique combination of the
following three fields that will be quantitatively evaluated(Scenario Timeframe, Receptor Population, and Receptor Age).
• Enter each combination of these three fields in the Summary Boxin the upper left corner of the table.
• Number each table uniquely, beginning with 8.1 and ending with8.n where “n” represents the total number of combinations of thethree key fields.
• Table 8.1.RME through 8.n.RME should be completed for RMEcancer risk calculations.
It is possible that some tables may
contain the same data associated
with different descriptions in the
Summary Box in the upper left
corner.
Separate tables may be necessary to
ensure transparency in data
presentation. Replication of
information is readily accomplished
using spreadsheet software.
Consult the EPA risk assessor for
alternatives (e.g., footnotes) to
preparing multiple tables with the
same data.

INSTRUCTIONS FOR TABLE 8
CALCULATION OF RADIATION CANCER RISKS (continued)
December 2001B8-2
GENERAL NOTES/INSTRUCTIONS FOR THIS TABLE:• All table entries, with the exception of risk calculation approach,
intake, and cancer risk are presented on tables preceding Table 8.• With the exception of modeled intakes, the intake value is the
result of calculations performed using parameters and equationspresented in Table 4 and concentrations presented in Table 3.
• The total cancer risk for each Exposure Route is to be summedand indicated in the Exposure Route Total row. This valuerepresents the cancer risk of the various Exposure Routes acrosseach Exposure Pathway designated in the table.
• The total cancer risk for Each Exposure Point is to be summedand presented in the row labeled Exposure Point Total.
• The total cancer risk for all media is to be summed and presentedin the box labeled “Total of Receptor Risks Across All Media”. This value represents the total radiation cancer risk to thereceptor for the timeframe designated in the table.
HOW TO COMPLETE/INTERPRET THE TABLE
SUMMARY BOX IN UPPER LEFT CORNER
Row 1 - Scenario Timeframe
Definition:• The time period (current and/or future) being considered for the
exposure pathway.
Instructions:• Choose from the picklist to the right.
Current
Future
Current/Future
Not Documented
Row 2 - Receptor Population
Definition:• The exposed individual relative to the Exposure Pathway
considered.
For example, a resident (receptor
population) who drinks
contaminated groundwater.

INSTRUCTIONS FOR TABLE 8
CALCULATION OF RADIATION CANCER RISKS (continued)
December 2001B8-3
Instructions:• Choose from the picklist to the right.
Resident
Industrial Worker
Commercial Worker
Construction Worker
Other Worker
Golfer
Jogger
Fisher
Hunter
Fisher/Hunter
Swimmer
Other Recreational Person
Child at School/Daycare/
Playground
Trespasser/Visitor
Farmer
Gardener
Gatherer
Other
Row 3 - Receptor Age
Definition:• The description of the exposed individual, as defined by the EPA
Region or dictated by the site.
For example, an adult (Receptor
Age) resident (Receptor Population)
who drinks contaminated
groundwater.
Instructions:• Choose from the picklist to the right.
Child
Adult
Adolescents (teens)
Pre-Adolescents
Not Documented
Child/Adult
Geriatric
Sensitive
Infant
Toddler
Pregnant
Other
BODY OF THE TABLE
Column 1 - Medium
Definition:• The substance (e.g., air, water, soil) that is a potential source of
contaminants in the Exposure Medium. (The Medium willsometimes equal the Exposure Medium.) Usually, the Medium isthat targeted for possible remediation.

INSTRUCTIONS FOR TABLE 8
CALCULATION OF RADIATION CANCER RISKS (continued)
December 2001B8-4
Instructions:• Choose from the picklist to the right.
Groundwater
Leachate
Sediment
Sludge
Soil
Surface Water
Debris
Liquid Waste
Solid Waste
Air
Surface Soil
Subsurface Soil
Other
Column 2 - Exposure Medium
Definition:• The contaminated environmental medium to which an individual
may be exposed. Includes the transfer of contaminants from oneMedium to another.
For example:
1) Contaminants in Groundwater (the Medium) remain in Groundwater (the
Exposure Medium) and are available for exposure to receptors.
2) Contaminants in Groundwater (the Medium) may be transferred to Air (the
Exposure Medium) and are available for exposure to receptors.
3) Contaminants in Sediment (the Medium) may be transferred to Fish Tissue
(the Exposure Medium) and are available for exposure to receptors.
Instructions:• Choose from the picklist to the right.
Groundwater
Leachate
Sediment
Sludge
Soil
Surface Water
Debris
Liquid Waste
Solid Waste
Air
Plant Tissue
Animal Tissue
Fish Tissue
Spring Water
Surface Soil
Subsurface Soil
Particulates
Vapors
Other

INSTRUCTIONS FOR TABLE 8
CALCULATION OF RADIATION CANCER RISKS (continued)
December 2001B8-5
Column 3 - Exposure Point
Definition:• An exact location of potential contact between a person and a
chemical or radionuclide within an Exposure Medium.
For example:
1) Contaminants are in Groundwater (the Medium and the Exposure
Medium) and exposure to Aquifer 1 - Tap Water (the Exposure Point) is
evaluated.
2) Contaminants in Groundwater (the Medium) may be transferred to Air (the
Exposure Medium) and exposure to Aquifer 1 - Water Vapors at
Showerhead (the Exposure Point) is evaluated.
3) Contaminants in Sediment (the Medium) may be transferred to Fish Tissue
(the Exposure Medium) and Trout from Dean’s Creek (the Exposure
Point) is evaluated.
Instructions:• Provide the information as text in the Table.
Exposure Point should be defined in
the same way as was done in
Planning Table 1.
Column 4 - Exposure Route
Definition: • The way a chemical or radionuclide comes in contact with a
person (e.g., by ingestion, inhalation, dermal contact).
Instructions:• Enter the Exposure Route considered from the picklist to the
right.
Inhalation
Ingestion
Combined (i.e., Inhalation and
Ingestion)
Dermal
Not Documented
External (Radiation)
Column 5 - Radionuclide of Potential Concern
Definition: • Radionuclides that are potentially site-related, with data of
sufficient quality, that have been retained for quantitative analysisas a result of the screening documented in Table 2.
Instructions:• Enter the radionuclides of potential concern selected from the
COPC screening.
Table 2 documents COPC
screening.
Column 6 - EPC Value

INSTRUCTIONS FOR TABLE 8
CALCULATION OF RADIATION CANCER RISKS (continued)
December 2001B8-6
Definition:• The EPC, based on either a statistical derivation of measured
data or modeled data, that represents an estimate of the chemicalor radionuclide concentration available from a particular Mediumor route of exposure.
The EPC value may be developed
from a statistical derivation of
measured data or from modeled
data. Typically, the EPC units are
expressed as activity per mass such
as pCi/gram.
Instructions:• Enter the EPC value for each COPC.• If an EPC other than from Table 3 is used, indicate it with a
footnote that includes a reference to supporting information thatwill show how the data were modeled in the risk assessment.
Table 3 documents EPC
calculations.
Column 7 - EPC Units
Definition:• The units associated with the EPC value.
Instructions:• Enter the units for the EPC values.
The units may vary depending on
the medium.
Column 8 - Risk Calculation Approach
Definition:• The approach used for calculating radiation cancer risks.
Consult the EPA risk assessor or
National guidance for the
appropriate risk calculation
approach. US EPA RAGS Part A
and RESRAD are examples of risk
calculation approaches.
Instructions:• Enter the radiation risk calculation approach used for each
COPC.
Column 9 - Cancer Risk Calculations - Intake/Activity Value
Definition:• Intake is a measure of exposure expressed in units of activity
such as pCi.
Refers to the intake using the
parameters and
equations/calculations, and/or
models presented in Table 4.
Instructions:• Enter the result of the intake calculations/modeling performed.
The intake calculations and/or
models are documented in Table 4.
Column 10 - Cancer Risk Calculations - Intake/Activity Units
Definition:• The units for intake/activity for each COPC and Exposure Route.

INSTRUCTIONS FOR TABLE 8
CALCULATION OF RADIATION CANCER RISKS (continued)
December 2001B8-7
Instructions:• Enter the units for the intake/activity for each COPC which
corresponds to each Exposure Route.

INSTRUCTIONS FOR TABLE 8
CALCULATION OF RADIATION CANCER RISKS (continued)
December 2001B8-8
Column 11 - Cancer Risk Calculations - CSF Value
Definitions:• A cancer slope factor (CSF) is an age-averaged lifetime excess
cancer incidence rate per unit intake (or unit exposure forexternal exposure pathways). Ingestion and inhalation slopefactors are central estimates in a linear model of the age-averaged, lifetime attributable radiation cancer incidence (fataland nonfatal cancer) risk per unity of activity inhaled or ingested,expressed as risk/picocurie (pCi). External exposure slopefactors are central estimates of the lifetime attributable radiationcancer incidence risk for each year of exposure to externalradiation from photon-emitting radio nuclides distributed uniformlyin a thick layer of soil, and are expressed as risk/yr per pCi/gramof soil.
Slope factors presented in Table 6.4
for each radionuclide are the same
as those presented here.
Instructions:• Enter the CSF for each COPC which corresponds to each
Exposure Route.
The cancer slope factors for each
COPC are presented in Table 6.4.
Column 12 - Cancer Risk Calculations - CSF Units
Definition:• The units associated with the cancer slope factor value.
Instructions:• Enter the cancer slope factor units for each COPC for each
Exposure Route.
Consult the EPA risk assessor to
determine if there is a preference
regarding the units to be used.
Column 13 - Cancer Risk Calculations - Cancer Risk
Definition:• The result of the cancer risk calculation for each COPC for each
exposure route and pathway. Cancer risk is the incrementalprobability of an individual’s developing cancer over a lifetime asa result of exposure to a potential carcinogen.
Instructions:• Enter the cancer risk calculation for each COPC.• Sum the cancer risk results for each Exposure Route in the
Exposure Route Total row.• Sum the cancer risk results for each Exposure Point in the
Exposure Point Total row.• Sum the total radiation cancer risk results for all media in the
bottom right-hand corner box labeled “Total of Receptor RisksAcross All Media”.
The sum of all Exposure Routes
represents the total cancer risk for
an Exposure Pathway.
The sum of all Exposure Pathways
represent the total cancer risk for a
medium.
The sum of all media represents the
“Total of Receptor Risks Across All
Media”.

December 2001B9-1
INSTRUCTIONS FOR TABLE 9
SUMMARY OF RECEPTOR RISKS AND HAZARDS FOR COPCs
PURPOSE OF THE TABLE:• To provide a summary of cancer risks and non-cancer hazards
for each Receptor by Medium, Exposure Medium, ExposureRoute, and Exposure Point
Table 9 presents cancer risk and
non-cancer hazard information for
all COPCs and media/exposure
points quantitatively evaluated.
INFORMATION DOCUMENTED:• The cancer risk and non-cancer hazard to each Receptor for
each COPC by Exposure Route and Exposure Point • The total cancer risk and non-cancer hazard for each Exposure
Point, Exposure Medium, and Medium • The total cancer risks and non-cancer hazards for a Receptor
across all media• The primary target organs for non-carcinogenic hazard effects.
TABLE NUMBERING AND SUMMARY BOX INSTRUCTIONS:• Complete one copy of Table 9 for each unique combination of the
following three fields that will be quantitatively evaluated(Scenario Timeframe, Receptor Population, and Receptor Age).
• Enter each combination of these three fields in the Summary Boxin the upper left corner of the table.
• Number each table uniquely beginning with 9.1 and ending with9.n where “n” represents the total number of combinations of thethree key fields.
• Different tables should be prepared to address RME and CT Riskand Hazard summaries.
• Tables 9.1. RME through 9.n. RME should be completed forRME Risk and Hazard summaries.
• Table 9.1.CT through 9.n.CT should be completed for CT Riskand Hazard Summaries.
It is possible that some tables may
contain the same data associated
with different descriptions in the
Summary Box in the upper left
corner.
Separate tables may be necessary to
ensure transparency in data
presentation. Replication of
information is readily accomplished
using spreadsheet software.
Consult the EPA risk assessor for
alternatives (e.g., footnotes) to
preparing multiple tables with the
same data.
GENERAL NOTES/INSTRUCTIONS FOR THIS TABLE:
• Cancer risk and non-cancer hazard information for all COPCsand media/Exposure Points quantitatively evaluated is to bepresented in Table 9.
• All table entries are presented on Tables preceding Table 9.• Documentation of the non-cancer hazard and carcinogenic risk
values for chemicals was presented on Table 7.• Documentation of the carcinogenic risk values for radionuclides
was presented on Table 8.• Total cancer risks and non-cancer hazards associated with each
Receptor are to be presented for each Exposure Point, ExposureMedium, and Medium and across all media and all ExposureRoutes.

INSTRUCTIONS FOR TABLE 9
SUMMARY OF RECEPTOR RISKS AND HAZARDS FOR COPCs (continued)
December 2001B9-2
HOW TO COMPLETE/INTERPRET THE TABLE
SUMMARY BOX IN UPPER LEFT CORNER
Row 1 - Scenario Timeframe
Definition:• The time period (current and/or future) being considered for the
exposure pathway.
Instructions:• Choose from the picklist to the right.
Current
Future
Current/Future
Not Documented
Row 2 - Receptor Population
Definition:• The exposed individual relative to the Exposure Pathway
considered.
For example, a resident (receptor
population) who drinks
contaminated groundwater.
Instructions:• Choose from the picklist to the right.
Resident
Industrial Worker
Commercial Worker
Construction Worker
Other Worker
Golfer
Jogger
Fisher
Hunter
Fisher/Hunter
Swimmer
Other Recreational Person
Child at School/Daycare/
Playground
Trespasser/Visitor
Gatherer
Farmer Gardener
Other
Row 3 - Receptor Age
Definition:• The description of the exposed individual, as defined by the
Region or dictated by the site.
For example, an adult (Receptor
Age) resident (Receptor Population)
who
drinks contaminated groundwater.

INSTRUCTIONS FOR TABLE 9
SUMMARY OF RECEPTOR RISKS AND HAZARDS FOR COPCs (continued)
December 2001B9-3
Instructions:• Choose from the picklist to the right.
Child
Adult
Adolescents (teens)
Pre-Adolescents
Not Documented
Child/Adult
Geriatric
Sensitive
Other
Infant
Toddler
Pregnant
BODY OF THE TABLE
Column 1 - Medium
Definition:• The substance (e.g., air, water, soil) that is a potential source of
contaminants in the Exposure Medium. (The Medium willsometimes equal the Exposure Medium.) Usually, the Medium isthat targeted for possible remediation.
Instructions:• Choose from the picklist to the right.
For each Medium,• The last entry in this column should be “Medium Total.” In this
row, the total risk/HI from each Medium (for all chemicals,Exposure Routes, Exposure Points, and Exposure Media) for thecurrent Receptor is entered in the Exposure Routes TotalColumn.
Groundwater
Leachate
Sediment
Sludge
Soil
Surface Water
Debris
Other
Liquid Waste
Solid Waste
Air
Surface Soil
Subsurface Soil
Column 2 - Exposure Medium
Definition:• The contaminated environmental medium to which an
individual may be exposed. Includes the transfer ofcontaminants from one medium to another.
For example:
1) Contaminants in Groundwater (the Medium) remain in Groundwater (the
Exposure Medium) and are available for exposure to receptors.
2) Contaminants in Groundwater (the Medium) may be transferred to Air (the
Exposure Medium) and are available for exposure to receptors.
3) Contaminants in Sediment (the Medium) may be transferred to Fish Tissue
(the Exposure Medium) and are available for exposure to receptors.

INSTRUCTIONS FOR TABLE 9
SUMMARY OF RECEPTOR RISKS AND HAZARDS FOR COPCs (continued)
December 2001B9-4
Instructions:• Choose from the picklist to the right.• For each Exposure Medium, the last entry in this column should
be “Exposure Medium Total.” This refers to the total risk/HIfrom each Exposure Medium (for all chemicals, Exposure Routesand Exposure Points) for the current Receptor. These totals arerecorded in the Carcinogenic and Non-Carcinogenic ExposureRoutes Total Columns.
Groundwater
Leachate
Sediment
Sludge
Soil
Surface Water
Debris
Other
Liquid Waste
Solid Waste
Air
Plant Tissue
Animal Tissue
Fish Tissue
Spring Water
Surface Soil
Subsurface Soil
Particulates
Vapors

INSTRUCTIONS FOR TABLE 9
SUMMARY OF RECEPTOR RISKS AND HAZARDS FOR COPCs (continued)
December 2001B9-5
Column 3 - Exposure Point
Definition:• An exact location of potential contact between a person and a
chemical within an Exposure Medium.
For example:
1) Contaminants are in Groundwater (the Medium and the Exposure
Medium) and exposure to Aquifer 1 - Tap Water (the Exposure Point) is
evaluated.
2) Contaminants in Groundwater (the Medium) may be transferred to Air (the
Exposure Medium) and exposure to Aquifer 1 - Water Vapors at
Showerhead (the Exposure Point) is evaluated.
3) Contaminants in Sediment (the Medium) may be transferred to Fish Tissue
(the Exposure Medium) and Trout from Dean’s Creek (the Exposure
Point) is evaluated.
Instructions:• Provide the information as text in the Table.• For each Exposure Point, the last entry in this column should be
“Exposure Point Total.” This refers to the total risk/HI (for allchemicals and Exposure Routes) for the current Receptor. These totals are recorded in the Carcinogenic and Non-Carcinogenic Exposure Routes Total columns.
Exposure Point should be defined in
the same way as was done in
Planning Table 1.
Column 4 - Chemical of Potential Concern
Definition:• The COPCs quantitatively considered in the risk characterization.
Instructions:• Enter the COPCs from previous tables.• Enter the term "Chemical Total" at the end of the list of chemicals
for each Exposure Point. Use this row to record total risk/HIvalues from all chemicals at each Exposure Point.
• Enter the term "Radionuclide Total" at the end of the list ofradionuclides for each Exposure Point. Use this row to recordtotal risk/HI values from all radionucides for each ExposurePoint.
Columns 5, 6, 7, and 8 - Carcinogenic Risk - Ingestion, Inhalation, Dermal and External (Radiation)
Definition:• The cancer risk value calculated by Receptor for each COPC for
each Exposure Route for each Exposure Point.
The value at the bottom of each
column presents the total cancer
risk by Exposure Route for each
Exposure Point.

INSTRUCTIONS FOR TABLE 9
SUMMARY OF RECEPTOR RISKS AND HAZARDS FOR COPCs (continued)
December 2001B9-6
Instructions:• Enter the cancer risk value calculated by Receptor for each
Exposure Route for each Exposure Point.• Enter the cancer risk totals for each Exposure Route in the rows
labeled “Chemical Total” and “Radionuclide Total.”
Column 9 - Carcinogenic Risk - Exposure Routes Total
Definition:• The total cancer risk for each COPC across all Exposure Routes
at each Exposure Point.
Instructions:• Enter the sum of the cancer risks across Exposure Routes for
each COPC.• Enter the sum of the cancer risks in this column for each
Exposure Point in the “Exposure Point Total” row.• Enter the total cancer risk for each Exposure Medium and
individual Medium in the “Exposure Medium Total”and “MediumTotal” rows.
• For each Receptor, enter the total cancer risks across all Mediaand all Exposure Routes as “Receptor Risk Total.”
Consult the EPA risk assessor to
determine the appropriate summing
of risks.
Column 10 - Non-Carcinogenic Hazard Quotient - Primary Target Organ
Definition:• The primary effect reported as a primary target organ effect in
IRIS, HEAST, or other source.
Instructions:• Enter the primary target organ effect as reported in IRIS,
HEAST, or other source.
Consult the EPA risk assessor to
determine if multiple effects should
be provided.
Columns 11, 12, and 13 - Non-Carcinogenic Hazard Quotient - Ingestion, Inhalation, Dermal
Definition:• The non-cancer hazard calculated by Receptor for each COPC
for each Exposure Route for each Exposure Point.
The value at the bottom of each
column presents the non-cancer
hazard by exposure route for each
exposure point, for all effects
considered together.
Instructions:• Enter the non-cancer hazard value calculated by Receptor for
each COPC for each Exposure Route for each Exposure Point.• Enter the non-cancer hazard totals for each Exposure Route in
the rows labeled “Chemical Total” and “Radionuclide Total.”
Consult the EPA risk assessor for
summing hazard quotients.

INSTRUCTIONS FOR TABLE 9
SUMMARY OF RECEPTOR RISKS AND HAZARDS FOR COPCs (continued)
December 2001B9-7
Column 14 - Non-Carcinogenic Hazard Quotient - Exposure Routes Total
Definition:• The total non-cancer hazard calculated for each COPC across
all Exposure Routes at each Exposure Point.
The Totals in each column present
the total non-cancer hazards by
Exposure Routes for each Exposure
Point. The values beneath the table
under this column present hazard
quotients for target organs.
Instructions:• Enter the sum of non-cancer hazards across the three Exposure
Routes in each Exposure Route column.• Enter the sum of the non-cancer hazards across Exposure Routes
for each COPC and primary target organ. • Enter the sum of the non-cancer hazards in this column for each
Exposure Point in the “Exposure Point Total” row.• Enter the total hazard index for each Exposure Medium and
Medium in the “Exposure Medium Total” and “Medium Total”rows.
• Enter the total hazard index across all media and all ExposureRoutes as “Receptor HI Total.”
• Enter the total hazard index for primary target organs. • Sum the hazard quotient target organ effects by target organ and
enter into the appropriate boxes.
Consult the EPA risk assessor for
specific instructions in summing
hazard quotients.

December 2001B10-1
INSTRUCTIONS FOR TABLE 10
RISK SUMMARY
PURPOSE OF THE TABLE:• To provide a summary for each Receptor by Medium, Exposure
Route, and Exposure Point of cancer risks and non-cancerhazards that trigger the need for remedial action.
• The Risk Assessor may consult the Remedial Project Managerand other members of the project team to determine what levelsof risk may be actionable at the site and what should be includedin Table 10. The risks shown on Table 10 should be based uponthe Remedial Project Manager’s recommendation. If all risks arebelow actionable levels, determine with the Remedial ProjectManager which chemicals should be shown to document thesuitability of a No Action decision.
Table 10 presents cancer risk and
non-cancer hazard information for
those COPCs and media/exposure
points that the Remedial Project
Manager determines trigger the need
for remedial action (the risk drivers).
INFORMATION DOCUMENTED:• The cancer risk and non-cancer hazard to each Receptor for
each chemical by Exposure Route and Exposure Point for riskdrivers
• The cancer risk and non-cancer hazard for each Exposure Point,Exposure Medium, and Medium across all Exposure Routes forrisk drivers
• The total cancer risks and non-cancer hazards for a Receptoracross all media for risk drivers
• The primary target organs for non-carcinogenic hazard effectsfor risk drivers.
For the purpose of these instructions,
those COPCs determined to trigger
the need for cleanup are simply
referred to as “Chemicals.”
TABLE NUMBERING AND SUMMARY BOX INSTRUCTIONS:• Complete one copy of Table 10 for each unique combination of
the following three fields that will be quantitatively evaluated(Scenario Timeframe, Receptor Population, and Receptor Age).
• Enter each combination of these three fields in the Summary Boxin the upper left corner of the table.
• Number each table uniquely beginning with 10.1 and ending with10.n where “n” represents the total number of combinations ofthe three key fields.
• Different tables should be prepared to address RME and CT Riskand Hazard summaries.
• Tables 10.1. RME through 10.n. RME should be completed forRME Risk and Hazard summaries.
• Table 10.1 CT through 10.n.CT should be completed for CT Riskand Hazard Summaries.
It is possible that some tables may
contain the same data associated
with different descriptions in the
Summary Box in the upper left
corner.
Separate tables may be necessary to
ensure transparency in data
presentation. Replication of
information is readily accomplished
using spreadsheet software.
Consult the EPA risk assessor for
alternatives (e.g., footnotes) to
preparing multiple tables with the
same information.

INSTRUCTIONS FOR TABLE 10
RISK SUMMARY (continued)
December 2001B10-2
GENERAL NOTES/INSTRUCTIONS FOR THIS TABLE
• Cancer risk and non-cancer hazard information for only thoseCOPCs and media/exposure points that trigger the need forremedial action (the risk drivers) is to be presented in Table 10.
• All table entries are presented on Tables preceding Table 10.• Documentation of the non-cancer hazard and cancer risk values
for chemicals was presented on Table 7.• Documentation of the carcinogenic risk values for radionuclides
was presented on Table 8.• Total cancer risks and non-cancer hazards associated with each
Receptor are to be presented for each Exposure Point, ExposureMedium, Medium across all media and all Exposure Routes.
HOW TO COMPLETE/INTERPRET THE TABLE
SUMMARY BOX IN UPPER LEFT CORNER
Row 1 - Scenario Timeframe
Definition:• The time period (current and/or future) being considered for the
Exposure Pathway.
Instructions:• Choose from the picklist to the right.
Current
Future
Current/Future
Not Documented
Row 2 - Receptor Population
Definition:• The exposed individual relative to the Exposure Pathway
considered.
For example, a resident (receptor
population) who drinks
contaminated groundwater.

INSTRUCTIONS FOR TABLE 10
RISK SUMMARY (continued)
December 2001B10-3
Instructions:• Choose from the picklist to the right.
Resident
Industrial Worker
Commercial Worker
Construction Worker
Other Worker
Golfer
Jogger
Fisher
Hunter
Fisher/Hunter
Swimmer
Other Recreational Person
Child at School/Daycare/Playground
Trespasser/Visitor
Farmer
Gatherer
Gardener
Other

INSTRUCTIONS FOR TABLE 10
RISK SUMMARY (continued)
December 2001B10-4
Row 3 - Receptor Age
Definition:• The description of the exposed individual, as defined by the
Region or dictated by the site.
For example, an adult (Receptor
Age) resident (Receptor Population)
who drinks contaminated
groundwater.
Instructions:• Choose from the picklist to the right.
Child
Adult
Adolescents (teens)
Pre-Adolescents
Not Documented
Child/Adult
Geriatric
Sensitive
Other
Infant
Toddler
Pregnant
BODY OF THE TABLE
Column 1 - Medium
Definition:• The substance (e.g., air, water, soil) that is a potential source of
contaminants in the Exposure Medium. (The Medium willsometimes equal the Exposure Medium.) Usually, the Medium isthat targeted for possible remediation.
Enter only the Media that have risks
or hazards exceeding target levels.
Instructions:• Choose from the picklist to the right.• For each Medium, the last entry in this column should be
“Medium Total.” This refers to the total risk/HI for eachMedium (for all chemicals, Exposure Routes, Exposure Points,and Exposure Media) for the current Receptor. These totals arerecorded in th Carcinogenic and Non-Carcinogenic ExposureRoutes Total columns.
Groundwater
Leachate
Sediment
Sludge
Soil
Surface Water
Debris
Other
Liquid Waste
Solid Waste
Air
Surface Soil
Subsurface Soil
Column 2 - Exposure Medium

INSTRUCTIONS FOR TABLE 10
RISK SUMMARY (continued)
December 2001B10-5
Definition:• The contaminated environmental medium to which an individual
may be exposed. Includes the transfer of contaminants from onemedium to another.For example:
1) Contaminants in Groundwater (the Medium) remain in Groundwater (the
Exposure Medium) and are available for exposure to receptors.2) Contaminants in Groundwater (the Medium) may be transferred to Air (the
Exposure Medium) and are available for exposure to receptors.3) Contaminants in Sediment (the Medium) may be transferred to Fish Tissue
(the Exposure Medium) and are available for exposure to receptors.
Enter only the Exposure Media that
have risks or hazards exceeding
target levels.
Instructions:• Choose from the picklist to the right.• For each Exposure Medium, the last entry in this coluymn should
be “Exposure Medium Total.” This refers to the total risk/HIfrom each Exposure Medium (for all chemicals, Exposure Routes,and Exposure Points) for the current Receptor. These totals arerecorded in the Carcinogenic and Non-Carcinogenic ExposureRoutes Total columns.
Groundwater
Leachate
Sediment
Sludge, Soil
Surface Water
Debris
Other
Liquid Waste
Solid Waste
Air
Vapors
Plant Tissue
Animal Tissue
Fish Tissue
Surface Soil
Subsurface Soil
Particulates
Spring Water
Column 3 - Exposure Point
Definition:• An exact location of potential contact between a person and a
chemical within an Exposure Medium. For example:
1) Contaminants are in Groundwater (the Medium and the Exposure
Medium) and exposure to Aquifer 1 - Tap Water (the Exposure Point) is
evaluated.
2) Contaminants in Groundwater (the Medium) may be transferred to Air (the
Exposure Medium) and exposure to Aquifer 1 - Water Vapors at
Showerhead (the Exposure Point) is evaluated.3) Contaminants in Sediment (the Medium) may be transferred to Fish Tissue
(the Exposure Medium) and Trout in Dean’s Creek (the Exposure Point) is
evaluated.
Enter only the Exposure Points that
have risks or hazards exceeding
target levels.

INSTRUCTIONS FOR TABLE 10
RISK SUMMARY (continued)
December 2001B10-6
Instructions:• Provide the information as text in the Table.• For each Exposure Point, the last entry in this column should be
“Exposure Point Total.” This refers to the total risk/HI fromeach Exposure Point (for all chemicals, Exposure Routes, andExposure Points) for the current Receptor. These totals arerecorded in the Carcinogenic and Non-Carcinogenic ExposureRoutes Total Columns.
Exposure Point should be defined in
the same way as was done in the
Planning Table 1.
Column 4 - Chemical
Definition:• The COPCs quantitatively considered in the risk characterization.
Enter only the chemicals that have
risks exceeding target levels.
Instructions:• Enter the COPCs from previous tables that exceed target levels.• Enter the term "Chemical Total" at the end of the list of chemicals
for each Exposure Point. • Enter the term "Radionuclide Total" at the end of the list of
radionuclides.
Columns 5, 6, 7 and 8 - Carcinogenic Risk - Ingestion, Inhalation, Dermal, and External (Radiation)
Definition:• The cancer risk value calculated by Receptor for each chemical
for each Exposure Route for each Exposure Point.
Enter only the risks that exceed
target levels.
The value at the bottom of each
column presents the cancer risk from
all chemicals by Exposure Route for
each Exposure Point.
Instructions:• Enter the cancer risk value calculated by Receptor for each
chemical for each Exposure Route for each Exposure Point thatexceeds target levels.
• Enter the cancer risk totals for each Exposure Route in the lastrow.
Column 9 - Carcinogenic Risk - Exposure Routes Total
Definition:• The total cancer risk for each chemical across all Exposure
Routes at each Exposure Point.

INSTRUCTIONS FOR TABLE 10
RISK SUMMARY (continued)
December 2001B10-7
Instructions:• Enter the sum of the cancer risks across Exposure Routes for
each chemical.• Enter the sum of the cancer risks in this column for each
Exposure Point in the “Exposure Point Total” row.• Enter the total cancer risk for each Exposure Medium and
Medium in the “Exposure Medium Total” and “Medium Total”rows.
• Enter the total cancer risk across all Media and all ExposureRoutes as “Receptor Risk Total”.
Column 10 - Non-Carcinogenic Hazard Quotient - Primary Target Organ
Definition:• The primary effect reported as a primary target organ effect in
IRIS, HEAST, or other source.
Instructions:• Enter the primary target organ effect as reported in IRIS,
HEAST, or other source. This target organ should also appear inTable 5.
Consult the EPA risk assessor to
determine if multiple effects should
be provided.

INSTRUCTIONS FOR TABLE 10
RISK SUMMARY (continued)
December 2001B10-8
Columns 11, 12, and 13 - Non-Carcinogenic Hazard Quotient - Ingestion, Inhalation, Dermal
Definition:• The non-cancer hazard calculated by Receptor for each
Chemical for each Exposure Route for each Exposure Point.
Enter only the hazards that exceed
target levels.
The value at the bottom of each
column presents the non-cancer
hazard by Exposure Route for each
Exposure Point, for all effects
considered together.
Instructions:• Enter the non-cancer hazard value calculated by Receptor for
each chemical for each Exposure Route for each Exposure Pointthat exceeds target levels.
• Enter the non-cancer hazard totals for each Exposure Route inthe last row, corresponding to the term "Chemical Total" inColumn 9.
Consult the EPA risk assessor for
summing hazard quotients.
Column 14 - Non-Carcinogenic Hazard Quotient - Exposure Routes Total
Definition:• The total non-cancer hazard calculated for each chemical across
all Exposure Routes at each Exposure Point.
The totals in each column present the
total non-cancer hazards across all
Exposure Routes for each Exposure
Point.
The values at the bottom of this
column present hazard quotients for
target organs.
Instructions:• Enter the sum of non-cancer hazards across the three Exposure
Routes in Columns 11, 12, and 13.• Enter the sum of the non-cancer hazards across Exposure Routes
for each chemical and primary target organ. • Enter the sum of the non-cancer hazards in this column for each
Exposure Point, Exposure Medium, and Medium in the “ExposurePoint Total,” “Exposure Medium Total,” and “Medium Total”rows, respectively.
• Enter the total hazard index across all Media and all ExposureRoutes as “Receptor HI Total.”
• Enter the total hazard index for primary target organs. • Sum the hazard quotient target organ effects across all media by
target organ and enter into the appropriate boxes below the table.
Consult the EPA risk assessor for
specific instructions in summing
hazard quotients.

GLOSSARY FOR COMPLETION OF STANDARD TABLES
G-1
TERM (TABLE DEFINITION ADDITIONALLOCATION(S)) INFORMATION
Adjusted DermalRfD (5.1)
The adjusted reference dose(RfD) for each cehmical ofpotential concern detected whichis derived from the oral RfD.
Derivations of the adjusted dermal RfD shouldbe performed in accordance with Regionalguidance.
Adjusted DermalCancer Slope Factor(6.1)
The dermal cancer slope factorfor each chemical of potentialconcern, which typically isderived from the oral cancer slopefactor.
Derivation of the dermal cancer slope factorshould be performed in accordance withRegional guidance.
Adjusted InhalationRfD (5.2)
The inhalation RfD for eachchemical of potential concernwhich is derived from thereference concentration (RfC)value.
The derivation of the RfD from RfC should beperformed in accordance with Regionalguidance.
Adjustment (6.2) The value used to derive theinhalation cancer slope factorfrom the unit risk value.
Toxicity values for carcinogenic effects also canbe expressed in terms of risk per unitconcentration of the substance in the mediumwhere human contact occurs. These measuresare called unit risks and can be calculated fromcancer slope factors.
Arithmetic Mean(3)
The arithmetic average ofdetected concentrations.
Background Value(2)
The background value for thechemical in that medium asdefined by Regional guidance.
Refer to Regional guidance for howbackground values are determined and howbackground values are considered for COPCscreening. If Regional guidance requires a "t-test" or other test which requires backupinformation, this information should bepresented. A footnote should be added to thiscolumn to clarify the Regional method used forbackground. (e.g., literature value, data from anearby site, statistical tool).
Cancer Risk (8) The result of the cancer riskcalculation for each COPC foreach exposure route and pathway.

GLOSSARY FOR COMPLETION OF STANDARD TABLES
TERM (TABLE DEFINITION ADDITIONALLOCATION(S)) INFORMATION
G-2
Cancer Slope Factor(8)
A plausible upper-bound estimateof the probability of a responseper unit intake of a chemical overa lifetime. Usually, the cancerslope factor is the upper 95th %confidence limit of the dose-response curve.
Slope factors presented in Table 6 for eachCOPC are the same as cancer slope factorspresented in Table 8.
Cancer Slope FactorUnits (8)
Usually, the cancer slope factor isthe upper 95th % confidence limitof the dose-response curve and isexpressed as (mg/kg-day) .-1
Carcinogenic Risk(Ingestion,Inhalation, Dermal)(9,10)
The cancer risk value calculatedby receptor for each COPC foreach exposure route for eachexposure point.
The value at the bottom of each columnpresents the cancer risk by exposure route foreach exposure point.
Carcinogenic Risk(Exposure RoutesTotal) (9)
The total cancer risk for eachCOPC across all exposure routesat each exposure point.
CAS Number (2) The Chemical Abstract RegistryNumber, a unique standardizednumber which is assigned tochemicals.
Provide CAS Number for chemicals detected inthe samples for the medium.
Central Tendency(CT) (3)
Risk calculations which resultfrom using less conservativemethodologies, instead ofreasonable maximummethodologies.
Refer to Regional guidance.

GLOSSARY FOR COMPLETION OF STANDARD TABLES
TERM (TABLE DEFINITION ADDITIONALLOCATION(S)) INFORMATION
G-3
CT Rationale/Reference (4)
The reason and reference for theparameter value used. If the parameter used is inconsistentwith guidance values, provide adetailed explanation of therationale and a complete referencefor the value used.
Refer to Regional or National guidance forintake parameter values appropriate for eachexposure pathway.
CT Value (4) The parameter value used for thecentral tendency exposure intakecalculation.
Chemical (2) The name of the compounddetected in samples for themedium.
Chemicals can be arranged in the order that therisk assessor prefers.
Chemicals ofPotential Concern(COPC)(3,5.1,5.2,5.3,6.1,6.2,6.3,7,8)
Chemicals that are potentiallysite-related, with data of sufficientquality, that have been retainedfor quantitative analysis as aresult of the screeningdocumented in Table 2.
Provide the chemical name of the COPC basedon the results of the screening documented inTable 2. Chemicals can be arranged in theorder that the risk assessor prefers.
COPC Flag (2) A code which identifies whether the chemical has been selected asa COPC, based on Regionalscreening guidance.
YesNo
Chronic/Subchronic(5.1,5.2,5.3)
Identifies whether the RfD for aparticular chemical is for chronic(long-term) and/or subchronic(short-term) exposure.
The risk assessor should use professionaljudgement when extrapolating to time-framesshorter or longer than those employed in any crticial study referenced. As a Superfundprogram guide-line, chronic is seven years to alifetime; subchronic is two weeks to seven years(RAGS Part A, Sections 6 and 8).

GLOSSARY FOR COMPLETION OF STANDARD TABLES
TERM (TABLE DEFINITION ADDITIONALLOCATION(S)) INFORMATION
G-4
CombinedUncertainty/Modifying Factors(5.1,5.2,5.3)
The factors applied to the criticaleffect level to account for areas ofuncertainty inherent inextrapolation from available data.
Refer to IRIS/HEAST for these values. Examples of uncertainty to be addressedinclude:- variations in the general population- interspecies variability between humans and animals- use of subchronic data for chronic evaluation- extrapolation from LOAELs to NOAELs.
ConcentrationsUsed For Screening(2)
The detected concentration whichwas used to compare to thescreening value.
Refer to Regional guidance in determining thisvalue. For example, maximum or averagevalues.
Date (MM/DD/YY)(5,6)
The date of the document thatwas consulted for the toxicity andtarget organ information.
The MM/DD/YY format refers tomonth/day/year. For example, the MM/DD/YYversion of the date March 30, 1995 is 03/30/95.
Dermal (9,10) The predicted route of chemicalexposure through the skin.
DetectionFrequency (2)
The number of times the chemicalwas detected versus the numberof times it was analyzed,expressed as the “fraction” X/Y.
Refer to Regional guidance for an explanationof how detection frequency should beinterpreted and applied. For example, 5/9indicates that a chemical was detected in 5 outof 9 samples.
Exposure Medium(1,2,3,4,7,8,9,10)
The contaminated environmentalmedium to which an individual isexposed. Includes the transfer ofcontaminants from one medium toanother.
For example, 1) Contaminants in Groundwater(the Medium) remain in Groundwater (theExposure Medium) and are available forexposure to receptors. 2) Contaminants inGroundwater (the Medium) may be transferred toAir (the Exposure Medium) and are available forexposure to receptors. 3) Contaminants inSediment (the Medium) may be transferred toAnimal Tissue (the Exposure Medium) and areavailable for exposure to receptors.
Choose from the following picklist:
GroundwaterLeachateSedimentSludgeSoilSurface WaterDebrisLiquid WasteSolid WasteAir Plant TissueAnimal TissueSpring WaterSurface SoilSubsurface SoilParticulatesVaporsOther

GLOSSARY FOR COMPLETION OF STANDARD TABLES
TERM (TABLE DEFINITION ADDITIONALLOCATION(S)) INFORMATION
G-5
Exposure Pathway(1)
The course a chemical takes fromthe source to the exposedindividual. An exposure pathwayanalysis links the sources,locations, and types ofenvironmental releases withpopulation locations and activitypatterns to determine thesignificant pathways of humanexposure.
Exposure Point (1,2,3,4,7,8,9,10)
An exact location of potentialcontact between a person and achemical within an exposuremedium.
For example: 1) Contaminants are inGroundwater (the Medium and the ExposureMedium) and exposure to Aquifer 1 - Tap Water(the Exposure Point) is evaluated. 2)Contaminants in Groundwater (the Medium)may be transferred to Air (the ExposureMedium) and exposure to Aquifer 1 - WaterVapors at Showerhead (the Exposure Point) isevaluated. 3) Contaminants in Sediment (the Medium) maybe transferred to Animal Tissue (the ExposureMedium) and Trout from Dean’s Creek (theExposure Point) is evaluated.
Provide the information as text in the table (not to exceed 80 characters).
Exposure PointConcentration(EPC)(1,2,3,4,7,8,9,10)
The value that represents aconservative estimate of thechemical concentration availablefrom a particular medium or routeof exposure.
The EPC may be calculated, measured, ormodeled.
EPC Selected forRisk or HazardCalculation (7,8)
The EPC that will be used toquantify potential cancer risks andnon-cancer hazards.
M (i.e., Medium-Specific EPC)R (i.e., Route-Specific EPC)
Follow Regional guidance for selection of thisvalue.
EPC Units (3) The units of the data being usedto calculate the exposure pointconcentration (EPC).
Units may vary depending on the environmentalmedium.

GLOSSARY FOR COMPLETION OF STANDARD TABLES
TERM (TABLE DEFINITION ADDITIONALLOCATION(S)) INFORMATION
G-6
Exposure Route(1,4,7,8,9,10)
The way a chemical comes incontact with a person (e.g., byingestion, inhalation, dermalcontact).
Choose from the following picklist:
InhalationIngestionCombined (i.e., Inhalation/Ingestion)Dermal AbsorptionNot DocumentedExternal (Radiation)
Exposure RoutesTotal (9,10)
The arithmetic sum of cancer riskand non-cancer hazards for theCOPCs for the exposure point.
For non-cancer totals, follow Regionalguidance.
Hazard Quotient (7) The ratio of a single substanceexposure level, over a specifiedtime period, to a reference dosefor that substance, derived from asimilar exposure period.
Ingestion (9,10) The route of chemical exposurethrough eating (ingestion).
Inhalation (9,10) The route of chemical exposurethrough breathing (inhalation).
Inhalation CancerSlope Factor (6.2)
A plausible upper-bound estimateof the probability of a responseper unit intake of a chemical overa lifetime.
Usually the cancer slope factor is the upper 95th% confidence limit of the dose-response curvefor inhalation.
Inhalation RfCUnits (5.2)
The RfC units for each chemicaldetected.
Inhalation RfCValue (5.2)
The reference concentration valuefor each of the COPCs.
Intake (Cancer) (8) A measure of exposure expressedas the mass of a substance incontact with the exchangeboundary per unit body weightper unit time (e.g., mgchemical/kg body weight/day).
Refers to the intake result using the parametersand equations/calculations and/or modelspresented in Table 4.

GLOSSARY FOR COMPLETION OF STANDARD TABLES
TERM (TABLE DEFINITION ADDITIONALLOCATION(S)) INFORMATION
G-7
Intake (Non-Cancer) (7)
A measure of exposure expressedas the mass of a substance incontact with the exchangeboundary per unit body weightper unit time (e.g., mgchemical/kg body weight/day.
Refers to the intake result using the parametersand equations/calculations and/or modelspresented in Table 4.
Intake (Cancer)Units (8)
The units for intake for eachCOPC and exposure route.
Intake (Non-Cancer) Units (7)
The units for intake for eachCOPC and exposure route.
IntakeEquation/ModelName (4)
The calculation, equation ormodel used for intake estimatesfor each exposure route.
Location ofMaximumConcentration (2)
The sample number whichidentifies the location where thesample was taken.
MaximumConcentration (2)
The highest detectedconcentration of the chemical inthe medium.
Refer to RAGS - Part A (EPA, 1989) page 5-8for guidance on detection/quantification limits.
Maximum DetectedConcentration (3)
The highest detectedconcentration of the chemical inthe medium which is above thesample quantitation limit.
Maximum Qualifier(2)
The alpha-numeric code assignedto the concentration value by theanalytical chemist during datavalidation for the maximumconcentration value.

GLOSSARY FOR COMPLETION OF STANDARD TABLES
TERM (TABLE DEFINITION ADDITIONALLOCATION(S)) INFORMATION
G-8
Medium (1) The environmental substance (e.g,air, water, soil) originallycontaminated.
Choose from the following picklist:
GroundwaterLeachateSedimentSludgeSoilSurface WaterDebrisLiquid WasteSolid WasteAirSurface SoilSubsurface SoilOther
Medium EPCRationale (for RMEor CT) (3)
The reason the cited statistic wasused to represent the EPC forRME or CT.
Medium EPCStatistic (for RMEor CT) (3)
The statistic selected to representthe Medium EPC Value (RME orCT), based on Regional guidance,the distribution of the data,number of data points, etc.
Often, this is the 95% Upper Confidence Level(UCL) of the log-transformed data.
Medium EPC Units(7,8)
The units associated with theMedium EPC Value.
Units may vary depending on the Medium.
Medium EPC Value(for RME) (3,7,8)
The EPC, based on either astatistical derivation of measureddata or modeled data, that wasselected to represent the medium-specific concentration for theRME exposure calculations. TheMedium EPC differs from theRoute EPC in that the MediumEPC does not consider thetransfer of contaminants from onedowngradient exposure point.) Note that none
medium to another.
The Medium EPC Value may be developedfrom a statistical derivation of measured data orfrom modeled data. For example, the MediumEPC value may be statistically derived bycalculating the 95% UCL of measuredgroundwater contaminant concentrations frommultiple residential wells. Alternatively, theMedium EPC value may be selected as a singlemeasured value if one data point is used tocalculate the risk for each residential wellindividually. In some cases, the Medium EPCvalue may be a modeled value (e.g., ifupgradient groundwater contaminantconcentrations are used to model a
of these examples consider the transfer ofcontaminants from one medium to another, asis evaluated by Route EPC.

GLOSSARY FOR COMPLETION OF STANDARD TABLES
TERM (TABLE DEFINITION ADDITIONALLOCATION(S)) INFORMATION
G-9
Medium EPC Value(for CT) (3,7,8)
The EPC, based on either astatistical derivation of measureddata or modeled data, that wasselected to represent the medium-specific concentration for the CTexposure calculations. TheMedium EPC differs from theRoute EPC in that the MediumEPC does not consider thetransfer of contaminants from onedowngradient exposure point.) Note that none
medium to another.
The Medium EPC Value may be developedfrom a statistical derivation of measured data orfrom modeled data. For example, the MediumEPC value may be statistically derived bycalculating the 95% UCL of measuredgroundwater contaminant concentrations frommultiple residential wells. Alternatively, theMedium EPC value may be selected as a singlemeasured value, if one data point is used tocalculate the risk for each residential wellindividually. In some cases, the Medium EPCvalue may be a modeled value (e.g., ifupgradient groundwater contaminantconcentrations are used to model a
of these examples consider the transfer ofcontaminants from one medium to another, asis evaluated by Route EPC.
MinimumConcentration (2)
The lowest detectedconcentration of the chemical inthe medium.
Minimum Qualifier(2)
The alpha-numeric code assignedto the concentration value by theanalytical chemist during datavalidation for the minimumconcentration value.
Non-CarcinogenicHazard Quotient(Primary TargetOrgan) (9,10)
The primary effect reported as aprimary target organ effect inIRIS and HEAST.
Non-CarcinogenicHazard Quotient(Ingestion,Inhalation, Dermal)(9,10)
The non-cancer hazard calculatedby receptor for each COPC foreach exposure route for eachexposure point.
The value at the bottom of each columnpresents the non-cancer hazard by exposureroute for each exposure point, for all effectsconsidered together.
Non-CarcinogenicHazard Quotient(Exposure RoutesTotal) (9,10)
The total non-cancer hazardcalculated for each COPC acrossall exposure routes at eachexposure point.
The totals in each column present the total non-cancer hazards across all exposure routes foreach exposure point. The values at the bottomof this column present hazard quotients forspecific target organs.

GLOSSARY FOR COMPLETION OF STANDARD TABLES
TERM (TABLE DEFINITION ADDITIONALLOCATION(S)) INFORMATION
G-10
Not Documented(picklist term)
The CERCLIS 3 picklist termused when no information isavailable.
On-Site/Off-Site (1) The location of potential contactbetween a person and a chemical(contaminant) as it relates to thesite boundary.
Choose from the following picklist:On-site Off-siteOn-site/Off-siteNot Documented
Oral Cancer SlopeFactor (6.1)
Cancer slope factor for ingestion.
Oral Reference Dose(RfD) Units (5.1)
The oral reference dose (RfD)units for each COPC.
Oral RfD Value(5.1)
The oral RfD value for each ofthe COPCs.
Oral to DermalAdjustment Factor(5.1,6.1)
The adjustment factor used toconvert the oral RfD values todermal RfD values.
Parameter Code (4) The code used for parameters inthe intake equation.
See the instructions for standard codes. Othercodes may be added if appropriate.
ParameterDefinition (4)
The parameters used in the intakeequation.
Potential Applicableor Relevant andAppropriateRequirements andTo Be Considered (ARAR/TBC)Source (2)
The type or source ofARAR/TBC value entered intothe adjacent column.
For example, MCLSMCL
PotentialARAR/TBC Value(2)
ARAR/TBC values. They could be MCL values, soil cleanup levelvalues, or other values to be considered. Referto Regional guidance regarding therequirements for this column.

GLOSSARY FOR COMPLETION OF STANDARD TABLES
TERM (TABLE DEFINITION ADDITIONALLOCATION(S)) INFORMATION
G-11
Primary TargetOrgan(5.1,5.2,5.3,9,10)
The organ that is affected most(i.e., experiences critical effects)by chronic or subchronicexposure to the specific COPC,and upon which the RfD is based.
Range of DetectionLimits (2)
The lowest and highest detectionlimits.
Refer to Regional or National guidance fordefinitions of detection limits.
Rationale forContaminantDeletion/Selection(2)
The reason the chemical wasselected or not selected forquantitative or qualitativeanalysis.
Follow Regional guidance for the rationalecodes.
Rationale forSelection orExclusion ofExposure Pathway(1)
The reason the exposure pathwaywas selected or not selected forquantitative or qualitativeanalysis.
Follow Regional guidance for the rationalecodes. The narrative in the Table can notexceed 200 characters.
ReasonableMaximum Exposure(RME) (3)
The highest exposure that isreasonably expected to occur.
RMERationale/Reference(4)
The reason and reference for theparameter value used. Thisrationale may be Regional orNational guidance.
If the parameter used is inconsistent withguidance values, provide a detailed explanationof rationale and a complete reference for thevalue.
RME Value (4) The parameter value used for theRME intake calculation.

GLOSSARY FOR COMPLETION OF STANDARD TABLES
TERM (TABLE DEFINITION ADDITIONALLOCATION(S)) INFORMATION
G-12
Receptor Age (1) The description of the exposedindividual as defined by the EPARegion or dictated by the site.
For example, an adult (Receptor Age) resident(Receptor Population) who drinks contaminatedgroundwater.
Choose from the following picklist:
ChildAdultAdolescents (teens)Pre-AdolescentsNot DocumentedChild/AdultGeriatricSensitiveInfantToddlerPregnantOther
ReceptorPopulation (1)
The exposed individual relative tothe exposure pathway considered.
For example, a resident (Receptor Population)who drinks contaminated groundwater.
Choose from the following picklist:
ResidentIndustrial WorkerCommercial WorkerConstruction WorkerOther WorkerGolferJoggerFisherHunterFisher/HunterSwimmerOther Recreational PersonChild at School/Daycare/PlaygroundTrespasser/VisitorFarmerGardenerOther
ReferenceConcentration (7)
The toxicity value for inhalationtypically reported as aconcentration in air (mg/m )3
which can be converted to aninhaled dose (mg/kg-day).
ReferenceConcentration Units(7)
The units associated with thereference concentration.
Reference Dose(RfD) (7)
The preferred toxicity value forevaluating non-cancer effectsresulting from exposures.

GLOSSARY FOR COMPLETION OF STANDARD TABLES
TERM (TABLE DEFINITION ADDITIONALLOCATION(S)) INFORMATION
G-13
RfD or RfC Units(7,8)
The units associated with the RfDor RfC for each COPC.
Typically reported in mg/kg-day, a dose term.
Route EPC Units(7,8)
The units associated with theRoute EPC Value.
Units may vary depending on the Route ofExposure.
Route EPC Value(7,8)
The EPC, based on either astatistical derivation of measureddata or based on modeled data,that was selected to represent theroute-specific concentration forthe exposure calculations. TheRoute EPC differs from theMedium EPC in that the RouteEPC may consider the transfer ofcontaminants from one medium toanother, where applicable for aparticular exposure route.
The Route EPC may be developed from astatistical derivation of measured data or frommodeled data. The Route EPC may be identicalto the Medium EPC or it may be modeled basedon the Medium EPC. For example, forgroundwater ingestion, the Medium EPC andthe Route EPC will typically be the same value. Alternatively, for groundwater inhalation, theMedium EPC will often be a statisticalderivation if measured concentrations ingroundwater, while the Route EPC will often bea modeled inhalation concentration that isbased on the measured concentrations.
Scenario Timeframe(1)
The time period (current and/orfuture) being considered for theexposure pathway.
Choose from the following picklist:
CurrentFuture Current/FutureNot Documented
Screening ToxicityValue (2)
The screening level used tocompare detected concentrationsof chemicals.
Refer to Regional guidance for the source of thescreening value and for guidance on comparingthe screening value to detected concentrations.
Source (6.1,6.2,6.3) A reference for the weight ofevidence/cancer guidelinedescription entry.
For example:IRISHEASTNCEA
Source ofToxicity/PrimaryTarget Organ (5.3)
The source of the toxicity valueand primary target organinformation.
For example:IRISHEASTNCEA
Source ofRfD/RfC/PrimaryTarget Organ(5.1,5.2,5.3)
The source of the RfD/RfC andtarget organ information.
For example:IRISHEASTNCEA

GLOSSARY FOR COMPLETION OF STANDARD TABLES
TERM (TABLE DEFINITION ADDITIONALLOCATION(S)) INFORMATION
G-14
Subchronic(5.1,5.2,5.3)
A short-term (two weeks to sevenyears) designation.
As a Superfund program guideline, chronic isseven years to a lifetime; subchronic is twoweeks to seven years (RAGS Part A, Sections 6and 8). The risk assessor should useprofessional judgement when extrapolating totimeframes shorter or longer than thoseemployed in any crticial study referenced.
Summary Box(2,3,4,7,8,9,10)
A box in the upper left corner of aTable containing the combinationof parameters that define a uniqueexposure pathway.
The Summary Box typically specifies the uniquecombination of Scenario Timeframe, Medium,Exposure Medium, and Exposure Point. Forselected tables, the Receptor Population andReceptor Age are presented.
Total Hazard Index(9,10)
A summation of non-cancerhazards across media andexposure routes.
Refer to Region-specific guidance on summingtoxic endpoint effects.
Total Risk (9,10) A summation of cancer riskacross media and exposureroutes.
Toxicity Units(5.3,6.3)
The units associated with thetoxicity value.
Type of Analysis (1) The level of evaluation(quantitative or qualitative) to beperformed for the exposurepathway based on site-specificanalysis.
Choose from the following picklist:
Quant (i.e., Quantitative)Qual (i.e., Qualitative)None
Units (2,3) The concentration units for eachchemical detected.
Refer to Regional guidance to determine if thereis a preference regarding the units used fordifferent matrices (e.g., mg/kg for soil, ug/L forgroundwater). Choices include:
mg/l µg/l ng/lpg/l % ppmppb ppt g/kgmg/kg µg/kg ng/kgµg/g mg/m µg/mfibers/l fibers/m fibers/kglbs/day µg/100cm mg/cmµRem/hr Rem/yr pCi/gpCi/kg pCi/m pCi/l pCi/m /sec Other Not2
3
3
2
3
3
2
Documented
Units (forparameter codes)(4)
The units for the parameter codeused in the intake equation.

GLOSSARY FOR COMPLETION OF STANDARD TABLES
TERM (TABLE DEFINITION ADDITIONALLOCATION(S)) INFORMATION
G-15
Unit Risk (6.2) Toxicity values for carcinogeniceffects expressed in terms of riskper unit concentration of thesubstance in the medium wherehuman contact occurs. Thesemeasures can be calculated fromcancer slope factors.
Toxicity Value(5.3,6.3)
The toxicity value for each of theCOPCs.
Weight ofEvidence/CancerGuidelineDescription (6.1,6.2)
An EPA classification system forcharacterizing the extent to whichthe available data indicate that anagent is a human carcinogen.
EPA Group:A - Human carcinogenB1 - Probable human carcinogen - indicatesthat limited human data are available.B2 - Probable human carcinogen - indicatessufficient evidence in animals and inadequateor no evidence in humans.C - Possible human carcinogenD - Not classifiable as a human carcinogenE - Evidence of noncarcinogenicity
Weight of Evidence:Known/LikelyCannot be DeterminedNot Likely
95% UCL ofNormal Data (3)
The statistic for the 95% UpperConfidence Limit (UCL) on thearithmetic mean of measureddata.
Refer to National guidance (SupplementalGuidance to RAGS: Calculating theConcentration Term, OSWER Directive:9285.7-08l, May 1992) and Regional guidancefor calculating this term.Supplemental information should be providedin the risk assessment.

Revision No. 0 January 1998
APPENDIX C
DATA USEABILITY WORKSHEET

Revision No. 0 January 1998

December 20011
DATA USEABILITY WORKSHEETSite:
Medium:
Activity Comment
Field Sampling
Discuss sampling problems and field conditions thataffect data useability.
Are samples representative of receptor exposure forthis medium (e.g. sample depth, grab vs composite,filtered vs unfiltered, low flow, etc.)?
Assess the effect of field QC results on data useability.
Summarize the effect of field sampling issues on therisk assessment, if applicable.
Analytical Techniques
Were the analytical methods appropriate forquantitative risk assessment?
Were detection limits adequate?
Summarize the effect of analytical technique issues onthe risk assessment, if applicable.
Data Quality Objectives
Precision - How were duplicates handled?

DATA USEABILITY WORKSHEET (continued)Site:
Medium:
Activity Comment
December 20012
Data Quality Objectives (continued)
Accuracy - How were split samples handled?
Representativeness - Indicate any problems associatedwith data representativeness (e.g., trip blank or rinsateblank contamination, chain of custody problems, etc.).
Completeness - Indicate any problems associated withdata completeness (e.g., incorrect sample analysis,incomplete sample records, problems with fieldprocedures, etc.).
Comparability - Indicate any problems associated withdata comparability.
Were the DQOs specified in the QAPP satisfied?
Summarize the effect of DQO issues on the riskassessment, if applicable.
Data Validation and Interpretation
What are the data validation requirements?
What method or guidance was used to validate thedata?

DATA USEABILITY WORKSHEET (continued)Site:
Medium:
Activity Comment
December 20013
Data Validation and Interpretation (continued)
Was the data validation method consistent withguidance? Discuss any discrepancies.
Were all data qualifiers defined? Discuss those whichwere not.
Which qualifiers represent useable data?
Which qualifiers represent unuseable data?
How are tentatively identified compounds handled?
Summarize the effect of data validation andinterpretation issues on the risk assessment, ifapplicable.
Additional notes:
Note: The purpose of this Worksheet is to succinctly summarize the data useability analysis and conclusions. Reference specific pages in the Remedial Investigation and/or the Risk Assessment text to further expandon the information presented here.

TECHNICAL APPROACH TO RISK ASSESSMENT (TARA) SCHEDULE WORKSHEET
_____ SITE
Notes:1Add other activities as appropriate for the site.2Use this column to identify the applicability, schedule, and responsibility for each activity. Activities that are not required fora particular site can be noted as NA (not applicable). It is recommended that the responsibility and schedule for both thepreparation and review of each activity be noted.
December 20011
Activity - RAGS Part D Reference(1) Comments(2)
PROJECT SCOPING
Preliminary site conceptual model - Section 2.1
Site visit - Sec 2.1
Scoping meeting - Sec 2.1
PRGs and ARARs (initial discussion) - Sec 2.1
Identification of deliverables - Sec 2.1
Planning Table 1 (preliminary version) - Sec 2.1
Probabilistic Analysis (preliminary consideration) - Sec 2.1
RI/FS Workplan (consideration of risk assessment objectives) - Sec 2.2
Baseline Risk Assessment Workplan (consideration of risk assessmentobjectives) - Sec 2.2
Probabilistic Analysis (additional consideration and Workplan as appropriate)- Sec 2.2.1
REMEDIAL INVESTIGATION
Planning Table 0 - Sec. 3.1.1
TARA Schedule Worksheet - Sec. 3.1.1 and Appendix C
Planning Table 1 - Sec 3.1.1
Data Useability Worksheet - Sec 3.1.1 and Appendix C
Supporting information for background value for Planning Table 2 - Sec3.1.1
Planning Table 2 - Sec 3.1.1
Supporting information for EPC for Planning Table 3 - Sec 3.1.1
Planning Table 3 -Sec 3.1.1
REMEDIAL INVESTIGATION (continued)

TECHNICAL APPROACH TO RISK ASSESSMENT (TARA) SCHEDULE WORKSHEET
_____ SITE
Activity - RAGS Part D Reference(1) Comments(2)
Notes:1Add other activities as appropriate for the site.2Use this column to identify the applicability, schedule, and responsibility for each activity. Activities that are not required fora particular site can be noted as NA (not applicable). It is recommended that the responsibility and schedule for both thepreparation and review of each activity be noted.
December 20012
Supporting information on modeled intake methodology and parameters forPlanning Table 4 - Sec 3.1.1
Supporting information on chemical-specific parameters for Planning Table4 - Sec 3.1.1
Dermal Worksheet - Sec 3.1.1 and Appendix C
Planning Table 4 - Sec 3.1.1
Supporting information on toxicity data for special case chemicals onPlanning Tables 5/6 - Sec 3.1.1
Planning Table 5 - Sec 3.1.1
Planning Table 6 - Sec 3.1.1
Supporting information on special chemical risk and hazard calculations forPlanning Tables 7/8 - Sec 3.1.1
Planning Table 7 - Sec 3.1.1
Planning Table 8 - Sec. 3.1.1
Radiation Dose Assessment Worksheet - Sec 3.1.1 and Appendix C
Planning Table 9 - Sec 3.1.1
Planning Table 10 - Sec 3.1.1
Lead Worksheets - Sec 3.1.1 and Appendix C
Assessment of Confidence and Uncertainty - Sec 3.1.2
Summary of Probabilistic Analysis - Sec 3.1.3
Draft Baseline Risk Assessment - Sec 3.2
REMEDIAL INVESTIGATION (continued)
Final Baseline Risk Assessment - Sec 3.3
Draft ROD Risk Worksheets - Sec 3.3 and Appendix C
FEASIBILITY STUDY

TECHNICAL APPROACH TO RISK ASSESSMENT (TARA) SCHEDULE WORKSHEET
_____ SITE
Activity - RAGS Part D Reference(1) Comments(2)
Notes:1Add other activities as appropriate for the site.2Use this column to identify the applicability, schedule, and responsibility for each activity. Activities that are not required fora particular site can be noted as NA (not applicable). It is recommended that the responsibility and schedule for both thepreparation and review of each activity be noted.
December 20013
Remedial Action Objectives - Sec 4.2
Remediation Goals - Sec 4.2
Risks and hazards associated with PRGs - Sec 4.4
Risk considerations of remedial technologies and alternatives - Sec 4.5
AFTER THE FEASIBILITY STUDY
Risk evaluation for the Proposed Plan - Sec 5.1
Documentation of risks in the Record of Decision - Sec 5.2
Revise ROD Risk Worksheets - Sec 5.2 and Appendix C
Risk evaluation during remedial design and remedial action - Sec 5.3
Risk evaluation associated with explanations of significant differences - Sec5.4
Risk evaluations during five-year review - Sec 5.5
Public meeting participation

Dermal WorksheetIntermediate Variables for Calculating DA(event)
Chemical of Media Dermal Absorption FA Kp T(event) Tau T* B
Potential Concern Fraction (soil) Value Value Units Value Units Value Units Value Units Value
FA = Fraction Absorbed Water T(event) = Event Duration T* = Time to Reach Steady-StateKp = Dermal Permeability Coefficient of Tau = Lag Time B = Dimensionless Ratio of the Permeability Coefficient of a Compound Through theCompound in Water Stratum Corneum Relative to its Permeability Coefficient Across the Viable Epidermis
Page 1 of 1 December 2001

RADIATION DOSE ASSESSMENT WORKSHEET
Site Name
Scenario Timeframe:
Receptor Population:
Receptor Age:
Medium Exposure Medium Exposure Point Exposure Route Radionuclide of EPC Dose Internal/External Dose Standard for Conversion Factor Risk
Potential Concern Value Units Approach Value Units Comparison(1) Value Units Source
Exp. Route Total
Exp. Route Total
Exposure Point Total
Exp. Route Total
Exposure Point Total
Exp. Route Total
Exp. Route Total
Exposure Point Total
Total of Receptor Dose Across All Media Total of Receptor Risks Across All Media
Page 1 of 1 December 2001

December 2001
1. Attach the IEUBK text output file and graph upon which the PRG was based as an appendix. For additionalinformation, see www.epa.gov/superfund/programs/lead
TABLE X (RAGS D IEUBK LEAD WORKSHEET)Site Name: <SITE and OU>
Receptor: <Receptor> (Age <X> Months) Exposure to Media as Described
1. Lead Screening Questions
Medium
Lead ConcentrationUsed in Model Run
Basis for LeadConcentration UsedFor Model Run
Lead ScreeningConcentration Basis for Lead Screening Level
Value Units Value Units
Soil <X> mg/kg Average Detected Value 400 mg/kg Recommended Soil ScreeningLevel
Water <X> ug/L Average Detected Value 15 ug/L Recommended Drinking WaterAction Level
2. Lead Model QuestionsQuestion Response for Residential Lead Model
What lead model (version and date) was used? <model> <version and date>
Where are the input values located in the risk assessmentreport?
Located in Appendix <X> <IEUBKwin OUTPUT>
What range of media concentrations were used for themodel?
<Refer to sampling data table>
What statistics were used to represent the exposureconcentration terms and where are the data onconcentrations in the risk assessment that support use ofthese statistics?
<Statistic used> Data are Located in Appendix <X>
Was soil sample taken from top 2 cm? If not, why? <Yes/No>
Was soil sample sieved? What size screen was used? Ifnot sieved, provide rationale.
<Yes/No> Mesh size <X> um
What was the point of exposure/location? <describe>
Where are the output values located in the riskassessment report? Located in Appendix X <IEUBKwin OUTPUT>
Was the model run using default values only? <Yes/No>
Was the default soil bioavailability used? <Yes/No> Default is 30%
Was the default soil ingestion rate used?<Yes/No> Default values for 7 age groups are 85, 135, 135,100, 090, and 85 mg/day
If non-default values were used, where are the rationalefor the values located in the risk assessment report? Located in Appendix X <IEUBKwin OUTPUT>
3. Final Result
Medium Result Comment/PRG 1
<MEDIUM> Input value of <X> (units) in <MEDIUM> results in YYY% of<receptor> above a blood lead level of 10 ug/dL. Geometric meanblood lead = ZZZ ug/dL. This exceeds the blood lead goal asdescribed in the 1994 OSWER Directive of no more than 5% ofchildren exceeding 10 ug/dL blood lead.
Based on site conditions, a PRGof X (units) is indicated for<MEDIUM>.

1. Attach the ALM spreadsheet output file upon which the Risk Based Remediation Goal (RBRG) was based and description of rationalefor parameters used. For additional information, see www.epa.gov/superfund/programs/lead
December 2001
TABLE Y (RAGS D ADULT LEAD WORKSHEET)Site Name: <SITE and OU>
Receptor: Adult Non-Resident, Exposure to Media as Described
1. Lead Screening Questions
Medium
Lead Concentrationused in Model Run
Basis for LeadConcentration UsedFor Model Run
Lead ScreeningConcentration Basis for Lead Screening Level
Value Units Value UnitsSoil <X> mg/kg Average Detected Value 750 mg/kg Recommended Soil Screening Level
2. Lead Model QuestionsQuestion Response
What lead model was used? Provide reference and version
If the EPA Adult Lead Model (ALM) was not used provide rationale formodel selected.
Where are the input values located in the risk assessment report? Located in Appendix <Y>What statistics were used to represent the exposure concentration termsand where are the data on concentrations in the risk assessment thatsupport use of these statistics?
<Statistic used> Data are Located in Appendix <X>
What was the point of exposure and location?
Where are the output values located in the risk assessment report? Located in Appendix <Y>
What GSD value was used? If this is outside the recommended range of1.8-2.1), provide rationale in Appendix <Y>.
What baseline blood lead concentration (PbB0) value was used? If this isoutside the default range of 1.7 to 2.2 provide rationale in Appendix <Y>
Was the default exposure frequency (EF; 219 days/year) used? <Yes/No>
Was the default BKSF used (0.4 ug/dL per ug/day) used? <Yes/No>
Was the default absorption fraction (AF; 0.12) used? <Yes/No>
Was the default soil ingestion rate (IR; 50 mg/day) used? <Yes/No>
If non-default values were used for any of the parameters listed above, where are the rationale for the values located in the risk assessment report? Located in Appendix <Y>
3. Final ResultMedium Result Comment/RBRG 1
Soil
Input value of XXX ppm in soil results in YYY% of receptors above ablood lead level of ZZ ug/d and geometric mean blood lead = ZZZ ug/dL.This exceeds the blood lead goal as described in the 1994 OSWERDirective of no more than 5% of children (fetuses of exposed women)exceeding 10 ug/dL blood lead.
<RBRG>

ROD RISK WORKSHEET
Highlight 6-15: Example Table Format
Summary of Chemical of Concern and Medium-Specific Exposure Point Concentration
Scenario Timeframe:Medium:Exposure Medium:
Exposure Point Chemical of Concern Concentration Detected Units Frequency of
DetectionExposure Point Concentration
Exposure Point Concentration
Units
Statistical Measure
Minimum Maximum
Key
Example Language Describing Summary of Chemicals of Concern and Medium-Specific Exposure Point Concentratons
Source: A Guide to Preparing Superfund Proposed Plans, Records of Decision, and Other Remedy Selection Decision Documents (U.S. EPA, 1999)
Page 1 of 1 December 2001

ROD RISK WORKSHEET
Highlight 6-16A: Example Table Format
Sample Cancer Toxicity Data Summary
Pathway: Ingestion, DermalChemical of Oral Cancer Dermal Cancer Slope Factor Weight of Date
Concern Slope Factor Slope Factor Units Evidence/Cancer Source (MM/DD/YYYY)Guideline Description
Pathway: InhalationChemical of Inhalation Weight of Date
Concern Unit Risk Units Cancer Slope Evidence/Cancer Source (MM/DD/YYYY)Factor Guideline Description
Pathway: External (Radiation)Chemical of Cancer Slope or Weight of Date
Concern Conversion Factor Exposure Route Units Evidence/Cancer Source (MM/DD/YYYY)Guideline Description
Key
Example Language Describing Summary of Toxicity Assessment
Source: A Guide to Preparing Superfund Proposed Plans, Records of Decision, and Other Remedy Selection Decision Documents (U.S. EPA, 1999)
Page 1 of 1 December 2001

ROD RISK WORKSHEET
Highlight 6-16B: Example Table Format
Sample Non-Cancer Toxicity Data Summary
Pathway: Ingestion, Dermal
Chemical of Concern
Chronic/ Subchronic Oral RfD Value Oral RfD Units Dermal RfD Dermal RfD
UnitsPrimary Target
Organ
Combined Uncertainty/ Modifying Factors
Sources of RfD: Target Organ
Dates of Rfd: Target Organ
(MM/DD/YYYY)
Pathway: Inhalation
Chemical of Concern
Chronic/ Subchronic Inhalation RfC Inhalation RfC
Units Inhalation RfD Inhalation RfD Units
Primary Target Organ
Combined Uncertainty/ Modifying Factors
Sources of RfC: RfD: Target
Organ
Dates (MM/DD/YYYY)
Key
Example Language Describing Summary of Toxicity Assessment
Source: A Guide to Preparing Superfund Proposed Plans, Records of Decision, and Other Remedy Selection Decision Documents (U.S. EPA, 1999)
Page 1 of 1 December 2001

ROD RISK WORKSHEET
Highlight 6-18A: Example Table Format
Risk Characterization Summary - Carcinogens
Scenario Timeframe:Receptor Population:Receptor Age:
Medium Exposure Medium Exposure Point Chemical of
ConcernCarcinogenic Risk
Ingestion Inhalation Dermal External (Radiation)
Exposure Routes Total
Soil Risk Total =
Groundwater risk total =Total Risk =
Key
Example Language Describing Risk Characterization
Source: A Guide to Preparing Superfund Proposed Plans, Records of Decision, and Other Remedy Selection Decision Documents (U.S. EPA, 1999)
Page 1 of 1 December 2001

ROD RISK WORKSHEET
Highlight 6-18B: Example Table Format
Risk Characterization Summary - Non-Carcinogens
Scenario Timeframe:Receptor Population:Receptor Age:Medium Exposure
MediumExposure Point Chemical of
ConcernPrimary Target
OrganNon-Carcinogenic Hazard Quotient
Ingestion Inhalation Dermal Exposure Routes Total
Soil Hazard Index Total =
Groundwater Hazard Index Total =
Receptor Hazard Index =Organ Hazard Index =
Key
Example Language Describing Risk Characterization
Source: A Guide to Preparing Superfund Proposed Plans, Records of Decision, and Other Remedy Selection Decision Documents (U.S. EPA, 1999)
Page 1 of 1 December 2001

Revision No. 0 January 1998
Example Worksheets

December 20011 of 4
DATA USEABILITY WORKSHEETThe Dean Company
Medium: Groundwater
Activity Comment
Field Sampling
Discuss sampling problems and field conditions thataffect data useability.
Groundwater samples were collected from 12monitoring wells located onsite. There were noapparent problems reported from the field collectionprogram that could affect data useability.
Are samples representative of receptor exposure forthis medium (e.g. sample depth, grab vs composite,filtered vs unfiltered, low flow, etc.)?
Groundwater samples submitted for organic andinorganic analyses were non-filtered samples collectedusing low flow purging and sampling techniques. These samples are representative of receptor exposure.
Assess the effect of field QC results on data useability. A few of the metals in the samples were qualified “B”due to the presence of the metals in blank samples.
Summarize the effect of field sampling issues on therisk assessment, if applicable.
There are no field sampling issues that should affectthe risk assessment.
Analytical Techniques
Were the analytical methods appropriate forquantitative risk assessment?
Yes. Groundwater samples were analyzed for organiccompounds according to Contract Laboratory Program(CLP) Statement of Work (SOW) for Organic Analysis,Multi-Media, Multi-Concentration, OLM04.2. Inorganic groundwater samples were analyzedaccording to CLP SOW for Inorganic Analysis, Multi-Media, Multi-Concentration, ILM04.1.
Were detection limits adequate? Yes. The method detection and quantitation limit wereless than the associated risk-based concentration(RBC) values, except for chloroform and thallium. Forthese two compounds, no available methods canachieve the RBC as a quantitation limit. For all non-detected chemicals in groundwater, the methoddetection and quantitation limits were less than theassociated RBC values. Recommend no changes tothe data set.
Summarize the effect of analytical technique issues onthe risk assessment, if applicable.
There are no analytical technique issues that shouldaffect the risk assessment.

DATA USEABILITY WORKSHEET (cont.)The Dean Company
Medium: Groundwater
Activity Comment
December 20012 of 4
Data Quality Objectives
Precision - How were duplicates handled? Relative percent differences (RPDs) were calculated forone pair of duplicate samples. The RPDs were lessthan the EPA-approved RPD of 20%. The highestconcentration of a compound detected in the sampleswas used in the risk assessment.
Accuracy - How were split samples handled? Split samples were not collected.
Representativeness - Indicate any problems associatedwith data representativeness (e.g., trip blank or rinsateblank contamination, chain of custody problems, etc.).
Analytes qualified with a “B” due to blankcontamination will be considered as non-detectsduring the risk assessment.
Completeness - Indicate any problems associated withdata completeness (e.g., incorrect sample analysis,incomplete sample records, problems with fieldprocedures, etc.).
No problems were associated with data completeness.
Comparability - Indicate any problems associated withdata comparability.
No problems have been associated with datacomparability.
Were the DQOs specified in the QAPP satisfied? Yes, the DQOs identified in the Sampling and AnalysisPlan were satisfied.
Summarize the effect of DQO issues on the riskassessment, if applicable.
There are no DQO issues that should affect the riskassessment.

DATA USEABILITY WORKSHEET (cont.)The Dean Company
Medium: Groundwater
Activity Comment
December 20013 of 4
Data Validation and Interpretation
What are the data validation requirements? For organic samples, validators were required to checkthe following items: holding times, instrumentperformance checks, initial and continuing calibrations,blanks, system monitoring compounds, matrixspike/matrix spike duplicates, regional QA/QC, internalstandards, target compound identification, contractrequired quantitation limits, tentatively identifiedcompounds, system performance, and overallassessment of data. For inorganic samples, validatorswere required to check holding times, calibration,blanks, interference checks, laboratory controlsamples, duplicate samples, matrix spike samples,furnace atomic absorption QC, ICP Serial Dilution,sample result verification, field duplicates, and performan overall assessment of the data.
What method or guidance was used to validate thedata?
Region III modifications to “Laboratory DataValidation Functional Guidelines for Validating Organic(and Inorganic) Analyses”, USEPA 9/94 (and 4/93).
Was the data validation method consistent withguidance? Discuss any discrepancies.
Yes. The data validation method was consistent withregional guidance.
Were all data qualifiers defined? Discuss those whichwere not.
Yes. All data qualifiers were defined.
Which qualifiers represent useable data? B, J, L, U, UJ, and UL
Which qualifiers represent unuseable data? R
How are tentatively identified compounds handled? Only TICs that were determined not to be laboratory orfield artifacts were reported. All TICs were reportedwith an “N” and/or a “J” qualifier. “N” qualified dataindicates that the analyte is tentatively identified. “J”qualified data indicates that the analyte is present butreported value is estimated. TICs will be evaluatedqualitatively in the risk assessment.

DATA USEABILITY WORKSHEET (cont.)The Dean Company
Medium: Groundwater
Activity Comment
December 20014 of 4
Summarize the effect of data validation andinterpretation issues on the risk assessment, ifapplicable.
Unusable data qualified with an “R” will not be used inthe risk assessment. All other data, both qualified andunqualified, will be used in the risk assessment.
Additional notes: None.

December 20011 of 4
DATA USEABILITY WORKSHEETThe Dean Company
Medium: Soil
Activity Comment
Field Sampling
Discuss sampling problems and field conditions thataffect data useability.
There were no apparent problems that could affect datauseability.
Are samples representative of receptor exposure forthis medium (e.g. sample depth, grab vs composite,filtered vs unfiltered, low flow, etc.)?
Yes. Soil samples are representative of receptorexposure for this medium.
Assess the effect of field QC results on data useability. Overall, the trip, field, and rinsate blanks were generallynon-detect for VOCs and SVOCs with the exception oflow levels of commonly reported laboratorycontaminants. Several of the metals in the sampleswere qualified “B” due to the presence of the metals inblank samples.
Summarize the effect of field sampling issues on therisk assessment, if applicable.
There are no field sampling issues that should affectthe risk assessment.
Analytical Techniques
Were the analytical methods appropriate forquantitative risk assessment?
Yes. Samples were analyzed for organic compoundsaccording to Contract Laboratory Program (CLP)Statement of Work (SOW) for Organic Analysis, Multi-Media, Multi-Concentration, OLM04.2. Inorganic soilsamples were analyzed according to CLP SOW forInorganic Analysis, Multi-Media, Multi-Concentration,ILM04.1.
Were detection limits adequate? Yes. The method detection and quantitation limit wereless than the associated risk-based concentration(RBC) values.
Summarize the effect of analytical technique issues onthe risk assessment, if applicable.
There are no analytical technique issues that shouldaffect the risk assessment.

DATA USEABILITY WORKSHEET (cont.)The Dean Company
Medium: Soil
Activity Comment
December 20012 of 4
Data Quality Objectives
Precision - How were duplicates handled? Relative percent differences (RPDs) were calculated forone pair of duplicate samples. The RPDs were lessthan the EPA-approved RPD of 35%. The highestconcentration of a compound detected in the sampleswas used in the risk assessment.
Accuracy - How were split samples handled? Split samples were not collected.
Representativeness - Indicate any problems associatedwith data representativeness (e.g., trip blank or rinsateblank contamination, chain of custody problems, etc.).
Analytes qualified with a “B” due to blankcontamination will be considered as non-detectsduring the risk assessment.
Completeness - Indicate any problems associated withdata completeness (e.g., incorrect sample analysis,incomplete sample records, problems with fieldprocedures, etc.).
No problems were associated with data completeness.
Comparability - Indicate any problems associated withdata comparability.
No problems have been associated with datacomparability.
Were the DQOs specified in the QAPP satisfied? Yes, the DQOs identified in the Sampling and AnalysisPlan were satisfied.
Summarize the effect of DQO issues on the riskassessment, if applicable.
There are no DQO issues that should affect the riskassessment.

DATA USEABILITY WORKSHEET (cont.)The Dean Company
Medium: Soil
Activity Comment
December 20013 of 4
Data Validation and Interpretation
What are the data validation requirements? For organic samples, validators were required to checkthe following items: holding times, instrumentperformance checks, initial and continuing calibrations,blanks, system monitoring compounds, matrixspike/matrix spike duplicates, regional QA/QC, internalstandards, target compound identification, contractrequired quantitation limits, tentatively identifiedcompounds, system performance, and overallassessment of data. For inorganic samples, validatorswere required to check holding times, calibration,blanks, interference checks, laboratory controlsamples, duplicate samples, matrix spike samples,furnace atomic absorption QC, ICP serial dilution,sample result verification, field duplicates, and performan overall assessment of the data.
What method or guidance was used to validate thedata?
Region III modifications to “Laboratory DataValidation Functional Guidelines for Validating Organic(and Inorganic) Analyses”, USEPA 9/94 (and 4/93).
Was the data validation method consistent withguidance? Discuss any discrepancies.
Yes. The data validation method was consistent withregional guidance.
Were all data qualifiers defined? Discuss those whichwere not.
Yes. All data qualifiers were defined.
Which qualifiers represent useable data? B, J, K, L, U, UJ, and UL
Which qualifiers represent unuseable data? R
How are tentatively identified compounds handled? Only TICs that were determined not to be laboratory orfield artifacts were reported. All TICs were reportedwith an “N” and/or a “J” qualifier. “N” qualified dataindicates that the analyte is tentatively identified. “J”qualified data indicates that the analyte is present butthe reported value is estimated. TICs will be evaluatedqualitatively in the risk assessment.

DATA USEABILITY WORKSHEET (cont.)The Dean Company
Medium: Soil
Activity Comment
December 20014 of 4
Summarize the effect of data validation andinterpretation issues on the risk assessment, ifapplicable.
Unusable data qualified with an “R” will not be used inthe risk assessment. All other data, both qualified andunqualified, will be used in the risk assessment.
Additional notes: None.

EXAMPLE TECHNICAL APPROACH TO RISK ASSESSMENT (TARA) SCHEDULE WORKSHEET
The Dean Company
Notes:1Add other activities as appropriate for the site.2Use this column to identify the applicability, schedule, and responsibility for each activity. Activities that are notrequired for a particular site can be noted as NA (not applicable). It is recommended that the responsibility and schedulefor both the preparation and review of each activity be noted.
December 20011 of 3
Activity - RAGS Part D Reference(1) Comments(2)
PROJECT SCOPING
Preliminary site conceptual model - Section 2.1 November 30, 2000
Site visit - Sec 2.1 November 4, 2000
Scoping meeting - Sec 2.1 November 2, 2000
PRGs and ARARs (initial discussion) - Sec 2.1 November 2, 2000
Identification of deliverables - Sec 2.1 November 30, 2000
Planning Table 1 (preliminary version) - Sec 2.1 November 30, 2000
Probabilistic Analysis (preliminary consideration) - Sec 2.1 November 30, 2000
RI/FS Workplan (consideration of risk assessment objectives) - Sec 2.2 November 30, 2000
Baseline Risk Assessment Workplan (consideration of risk assessmentobjectives) - Sec 2.2
November 30, 2000
Probabilistic Analysis (additional consideration and Workplan as appropriate)- Sec 2.2.1
November 30, 2000
REMEDIAL INVESTIGATION
Planning Table 0 - Sec. 3.1.1 August 30, 2001
TARA Schedule Worksheet - Sec. 3.1.1 and Appendix C August 30, 2001
Planning Table 1 - Sec 3.1.1 August 30, 2001
Data Useability Worksheet - Sec 3.1.1 and Appendix C August 30, 2001
Supporting information for background value for Planning Table 2 - Sec 3.1.1 August 30, 2001
Planning Table 2 - Sec 3.1.1 August 30, 2001
Supporting information for EPC for Planning Table 3 - Sec 3.1.1 August 30, 2001
Planning Table 3 -Sec 3.1.1 August 30, 2001

EXAMPLE TECHNICAL APPROACH TO RISK ASSESSMENT (TARA) SCHEDULE WORKSHEET
The Dean Company
Activity - RAGS Part D Reference(1) Comments(2)
Notes:1Add other activities as appropriate for the site.2Use this column to identify the applicability, schedule, and responsibility for each activity. Activities that are notrequired for a particular site can be noted as NA (not applicable). It is recommended that the responsibility and schedulefor both the preparation and review of each activity be noted.
December 20012 of 3
REMEDIAL INVESTIGATION (continued)
Supporting information on modeled intake methodology and parameters forPlanning Table 4 - Sec 3.1.1
August 30, 2001
Supporting information on chemical-specific parameters for Planning Table 4 -Sec 3.1.1
August 30, 2001
Dermal Worksheet - Sec 3.1.1 and Appendix C August 30, 2001
Planning Table 4 - Sec 3.1.1 August 30, 2001
Supporting information on toxicity data for special case chemicals on Planning Tables 5/6 - Sec 3.1.1
August 30, 2001
Planning Table 5 - Sec 3.1.1 August 30, 2001
Planning Table 6 - Sec 3.1.1 August 30, 2001
Supporting information on special chemical risk and hazard calculations forPlanning Tables 7/8 - Sec 3.1.1
October 21, 2001
Planning Table 7 - Sec 3.1.1 October 21, 2001
Planning Table 8 - Sec. 3.1.1 October 21, 2001
Radiation Dose Assessment Worksheet - Sec 3.1.1 and Appendix C October 21, 2001
Planning Table 9 - Sec 3.1.1 October 21, 2001
Planning Table 10 - Sec 3.1.1 October 21, 2001
Lead Worksheets - Sec 3.1.1 and Appendix C October 21, 2001
Assessment of Confidence and Uncertainty - Sec 3.1.2 October 21, 2001
Summary of Probabilistic Analysis - Sec 3.1.3 October 21, 2001
Draft Baseline Risk Assessment - Sec 3.2 October 21, 2001
Final Baseline Risk Assessment - Sec 3.3 January 15, 2001

EXAMPLE TECHNICAL APPROACH TO RISK ASSESSMENT (TARA) SCHEDULE WORKSHEET
The Dean Company
Activity - RAGS Part D Reference(1) Comments(2)
Notes:1Add other activities as appropriate for the site.2Use this column to identify the applicability, schedule, and responsibility for each activity. Activities that are notrequired for a particular site can be noted as NA (not applicable). It is recommended that the responsibility and schedulefor both the preparation and review of each activity be noted.
December 20013 of 3
REMEDIAL INVESTIGATION (continued)
Draft ROD Risk Worksheets - Sec 3.3 and Appendix C January 15, 2001
FEASIBILITY STUDY
Remedial Action Objectives - Sec 4.2 January 15, 2001
Remediation Goals - Sec 4.2 January 15, 2001
Risks and hazards associated with PRGs - Sec 4.4 January 15, 2001
Risk considerations of remedial technologies and alternatives - Sec 4.5 January 15, 2001
AFTER THE FEASIBILITY STUDY
Risk evaluation for the Proposed Plan - Sec 5.1 To be determined
Documentation of risks in the Record of Decision - Sec 5.2 To be determined
Revise ROD Risk Worksheets - Sec 5.2 and Appendix C To be determined
Risk evaluation during remedial design and remedial action - Sec 5.3 To be determined
Risk evaluation associated with explanations of significant differences - Sec5.4
To be determined
Risk evaluations during five-year review - Sec 5.5 To be determined
Public meeting participation To be determined

Page 1 of 1 December 2001
Dermal Worksheet
Intermediate Variables for Calculating DA(event)
The Dean Company
Chemical of Medium Dermal Absorption FA Kp T(event) Tau T* B
Potential Concern Fraction (soil) Value Value Units Value Units Value Units Value Units Valuephthalate Groundwater - - 0.8 2.50E-002 cm/hour 0.58 hour/event 16.27 hour 39.05 hour 0.2Chloroform Groundwater - - 1 1.50E-001 cm/hour 0.58 hour/event 0.49 hour 1.18 hour 0Heptachlor Groundwater - - 0.8 8.70E-003 cm/hour 0.58 hour/event 12.99 hour 31.16 hour 0.1Barium * Groundwater - - - - - - - - - - - - - - - - - - - - - -Manganese * Groundwater - - - - - - - - - - - - - - - - - - - - - -Thallium * Groundwater - - - - - - - - - - - - - - - - - - - -4,4'-DDD * Soil - - - - - - - - - - - - - - - - - - - - - -4,4'-DDE * Soil - - - - - - - - - - - - - - - - - - - - - -4,4-DDT Soil 0.03 No data No data No data No data No data No data No data No data No data No dataAluminum * Soil - - - - - - - - - - - - - - - - - - - - - -Copper * Soil - - - - - - - - - - - - - - - - - - - - - -Iron * Soil - - - - - - - - - - - - - - - - - - - - - -Manganese * Soil - - - - - - - - - - - - - - - - - - - - - -Thallium * Soil - - - - - - - - - - - - - - - - - - - - - -
FA = Fraction Absorbed Water T(event) = Event Duration T* = Time to Reach Steady-State
Kp = Dermal Permeability Coefficient of Tau = Lag Time B = Dimensionless Ratio of the Permeability Coefficient of a Compound ThroughCompound in Water the Stratum Corneum Relative to its Permeability Coefficient Across the Viable
Epidermis* = Dermal assessment not recommended based on RAGS Part E, Appendix B-3 screening table.

December 2001
1. Attach the IEUBK text output file and graph upon which the PRG was based as an appendix. For additionalinformation, see www.epa.gov/superfund/programs/lead
TABLE X (RAGS D IEUBK LEAD WORKSHEET)Site Name: <SITE and OU>
Receptor: <Receptor> (Age <X> Months) Exposure to Media as Described
1. Lead Screening Questions
MediumLead ConcentrationUsed in Model Run
Basis for LeadConcentration UsedFor Model Run
Lead ScreeningConcentration Basis for Lead Screening
LevelValue Units Value Units
Soil <X> mg/kg Average Detected Value 400 mg/kg Recommended Soil ScreeningLevel
Water <X> ug/L Average Detected Value 15 ug/L Recommended Drinking WaterAction Level
2. Lead Model Questions
Question Response for Residential Lead Model
What lead model (version and date) was used? <model> <version and date>
Where are the input values located in the riskassessment report?
Located in Appendix <X> <IEUBKwin OUTPUT>
What range of media concentrations were used for themodel?
<Refer to sampling data table>
What statistics were used to represent the exposureconcentration terms and where are the data onconcentrations in the risk assessment that support use ofthese statistics?
<Statistic used> Data are Located in Appendix <X>
Was soil sample taken from top 2 cm? If not, why?<Yes/No>
Was soil sample sieved? What size screen was used? Ifnot sieved, provide rationale.
<Yes/No> Mesh size <X> um
What was the point of exposure/location?<describe>
Where are the output values located in the riskassessment report? Located in Appendix X <IEUBKwin OUTPUT>
Was the model run using default values only? <Yes/No>
Was the default soil bioavailability used? <Yes/No> Default is 30%
Was the default soil ingestion rate used?<Yes/No> Default values for 7 age groups are 85, 135, 135,100, 090, and 85 mg/day
If non-default values were used, where are the rationalefor the values located in the risk assessment report? Located in Appendix X <IEUBKwin OUTPUT>
3. Final Result
Medium Result Comment/PRG 1
<MEDIUM> Input value of <X> (units) in <MEDIUM> results in YYY% of<receptor> above a blood lead level of 10 ug/dL. Geometric meanblood lead = ZZZ ug/dL. This exceeds the blood lead goal asdescribed in the 1994 OSWER Directive of no more than 5% ofchildren exceeding 10 ug/dL blood lead.
Based on site conditions, a PRGof X (units) is indicated for<MEDIUM>.

1. Attach the ALM spreadsheet output file upon which the Risk Based Remediation Goal (RBRG) was based and descriptionof rationale for parameters used. For additional information, see www.epa.gov/superfund/programs/lead
December 2001
TABLE Y (RAGS D ADULT LEAD WORKSHEET)Site Name: Example Site, Slag Pile 2
Receptor: Adult Worker, Exposure to Media as Described
1. Lead Screening Questions
MediumLead Concentrationused in Model Run
Basis for LeadConcentration UsedFor Model Run
Lead ScreeningConcentration Basis for Lead Screening Level
Value Units Value Units
Soil 2000 mg/kg Average DetectedValue 750 mg/kg Recommended Soil Screening Level
2. Lead Model QuestionsQuestion Response
What lead model was used? Provide reference and version EPA Interim Adult Lead Model (1996)
If the EPA Adult Lead Model (ALM) was not used provide rationale formodel selected.
n/a
Where are the input values located in the risk assessment report? Located in Appendix 5
What statistics were used to represent the exposure concentration termsand where are the data on concentrations in the risk assessment thatsupport use of these statistics?
Mean soil concentration. Data are Located inAppendix 2
What was the point of exposure and location?OU 3 Slag pile area
Where are the output values located in the risk assessment report? Located in Appendix 5
What GSD value was used? If this is outside the recommended range of1.8-2.1, provide rationale in Appendix <Y>. 1.8
What baseline blood lead concentration (PbB0) value was used? If this isoutside the default range of 1.7 to 2.2 provide rationale in Appendix <Y>. 2.0
Was the default exposure frequency (EF; 219 days/year) used?Yes
Was the default BKSF used (0.4 ug/dL per ug/day) used?Yes
Was the default absorption fraction (AF; 0.12) used?Yes
Was the default soil ingestion rate (IR; 50 mg/day) used? Yes
If non-default values were used for any of the parameters listed above, where are the rationale for the values located in the risk assessment report? Located in Appendix 5
3. Final ResultMedium Result Comment/RBRG 1
Soil
2000 ppm lead in soil results in >5% of receptors above a blood lead levelof 10 ug/d and geometric mean blood lead = 11.6 ug/dL. This exceeds theblood lead goal as described in the 1994 OSWER Directive of no morethan 5% of children (fetuses of exposed women) exceeding 10 ug/dLblood lead.
1500 ppm

December 2001
APPENDIX D
EXAMPLE SCENARIOS
1. Duplicate Exposure Information for Different Exposure Points2. Modeled Inhalation from Showering3. Measured Data and Subsequent Ingestion4. Modeled Data and Subsequent Ingestion5. Modeled Data6. Multiple Source Exposures 7. Possible Summing Options on Planning Tables 9 and 108. Child/Adult Lifetime Cancer Risk9. Transfer of Contaminants Through Multiple Media10. Lead Data Example11. Radiation Data Example

December 2001 Page 1 - 1
Example Scenario No. 1Duplicate Exposure Information for Different Exposure Points
(with Planning Tables 1 and 4)
Scenario Description: Data are available for several exposure points that are to be evaluated separatelyin the risk assessment. In this risk assessment, data will be evaluated separately for ingestion anddermal contact from three different slag piles (Slag Piles 1, 2, and 3) for the same scenario timeframe,medium, and exposure medium.
Planning Table Issues Associated with this Scenario:
The primary issue with this scenario is whether or how to show the exposure points on Planning Tables1 and 4. Note that the exposure parameter values used for daily intake calculations are identical foreach individual pathway, i.e. the values presented on Planning Table 4 are the same for all exposurepoints for each type of exposure route.
1. How will Planning Table 1 show the three separate exposure points?Planning Table 1 will need to show the three separate exposure points since each dataset will be evaluated separately in the risk assessment. Planning Table 1 needs to show:
Medium: Solid WasteExposure Medium: Solid WasteExposure Point: Slag Pile 1
Medium: Solid WasteExposure Medium: Solid WasteExposure Point: Slag Pile 2
Medium: Solid WasteExposure Medium: Solid WasteExposure Point: Slag Pile 3
2. Do the values used for daily intake calculations need to be shown three separate times on Planning Table 4 for each exposure point even though the values and intake equations are identical?
There are two options that can be followed:
Option 1: Complete Planning Table 4 according to the RAGS Part D instructions. Forthis example, Planning Table 4 would have three sets of identical values and intakeequations, one for each exposure point.
Option 2: Complete Planning Table 4 using only one set of values and intake equationsand indicate on the table that these values are identical for all three different exposurepoints. This can be accomplished by including “Slag Piles 1, 2, and 3" in the Exposure

December 2001 Page 1 - 2
Example Scenario No. 1 (continued)Duplicate Exposure Information for Different Exposure Points
(with Planning Tables 1 and 4)
Point column and footnoting that these values and intake equations are the same for allthree exposure points.
Option 1 is provided in the Example Tables in Appendix A. Option 2, consisting of a revisedexample Planning Table 4, is illustrated in the accompanying table.

Page 1 of 1 December 2001
EXAMPLE SCENARIO 11
TABLE 10.2.RME
RISK ASSESSMENT SUMMARY
REASONABLE MAXIMUM EXPOSURE
The Dean Company
Scenario Timeframe: Future
Receptor Population: Resident
Receptor Age: Child
Medium Exposure Exposure Chemical Carcinogenic Risk Non-Carcinogenic Hazard Quotient
Medium Point of Potential
Concern Ingestion Inhalation Dermal External Exposure Primary Ingestion Inhalation Dermal Exposure
(Radiation) Routes Total Target Organ(s) Routes Total
Groundwater Groundwater Aquifer 1 - Tap Water Heptachlor 7E-04 - - 3E-04 - - 1E-03 Liver 4 - - 1 5
Manganese - - - - - - - - - - Central Nervous System 40 - - - - 40
Uranium - - - - - - - - - - Kidney 8 - - - - 8
Chemical Total 7E-04 - - 3E-04 - - 1E-03 52 - - 1 53
Uranium 238 1E-06 - - - - - - 1E-06
Radium 226 3E-06 - - - - - - 3E-06
Radionuclide Total 4E-06 - - - - - - 4E-06
Exposure Point Total 1E-03 53
Exposure Medium Total 1E-03 53
Groundwater Total 1E-03 53
Soil Soil Soil at Site 1 4,4'-DDE 3E-006 - - - - - - 3E-06 - - - - - - - - - -
4,4'-DDT 1E-05 - - 9E-07 - - 1E-05 - - - - - - - - - -
Uranium - - - - - - - - - - Kidney 3 - - - - 3
Chemical Total 1E-05 - - 9E-07 - - 1E-05 3 - - - - 3
Radium 226 5E-07 - - - - 9E-05 9E-05
Radionuclide Total 6E-07 - - - - 9E-05 9E-05
Exposure Point Total 1E-04 3
Exposure Medium Total 1E-04 3
Soil Total 1E-04 3
Receptor Total 1E-03 56
Total Risk Across All Media 1E-03 Total Hazard Across All Media 56
Total Liver HI Across All Media = 5
Total Kidney HI Across All Media = 11
Cancer risks presented are those greater than 1E-06; Non-cancer risks presented are those greater than 1. Total Central Nervous System HI Across All Media = 40

Page 1 of 1 December 2001
EXAMPLE SCENARIO 1
TABLE 1
SELECTION OF EXPOSURE PATHWAYS
The Dean Company
Scenario Medium Exposure Exposure Receptor Receptor Exposure Type of Rationale for Selection or Exclusion
Timeframe Medium Point Population Age Route Analysis of Exposure Pathway
Future Solid Waste Solid Waste Slag Pile 1 Receptor Population Age 1 Ingestion Quant Rationale
Dermal Quant Rationale
Slag Pile 2 Receptor Population Age 1 Ingestion Quant Rationale
Dermal Quant Rationale
Slag Pile 3 Receptor Population Age 1 Ingestion Quant Rationale
Dermal Quant Rationale

Page 1 of 1 December 2001
EXAMPLE SCENARIO 1
Option 2
TABLE 4.1.RME
VALUES USED FOR DAILY INTAKE CALCULATIONS
REASONABLE MAXIMUM EXPOSURE
The Dean Company
Scenario Timeframe: Future
Medium: Solid Waste
Exposure Medium: Solid Waste
Exposure Route Receptor Population Receptor Age Exposure Point Parameter Parameter Definition Value Units Rationale/ Intake Equation/
Code Reference Model Name
Ingestion Receptor Population Age 1 Slag Piles 1, 2, 3 (1) CS Chemical Concentration in Slag See Table 3.1 mg/kg See Table 3.1 Chronic Daily Intake (CDI) (mg/kg-day) =
IR Ingestion Rate of Slag 100 mg/day EPA, 1991 CS x IR x FI x EF x ED x CF1 x 1/BW x 1/AT
FI Fraction Ingested 1 - - Professional Judgment
EF Exposure Frequency 350 days/year EPA, 1991
ED Exposure Duration 24 years EPA, 1991
CF1 Conversion Factor 1E-06 kg/mg - -
BW Body Weight 70 kg EPA, 1991
AT-C Averaging Time - Cancer 25,550 days EPA, 1989
AT-N Averaging Time - Non-Cancer 8,760 days EPA, 1989
Dermal Receptor Population Age 1 Slag Piles 1, 2, 3 (1) CS Chemical Concentration in Slag See Table 3.1 mg/kg See Table 3.1 Dermal Absorbed Dose (DAD) (mg/kg-day) =
CF1 Conversion Factor 1E-06 kg/mg - - DA-event x EF x ED x EV x SA X 1/BW x 1/AT
SA Skin Surface Area Available for Contact 5,700 cm2 EPA, 2001 where
AF Soil to Skin Adherence Factor 0.19 mg/cm2-event EPA, 2001 Absorbed Dose per Event (DA-event) (mg/cm2-event) =
ABS-d Absorption Factor chemical-specific unitless EPA, 2001 CS x CF1 x AF x ABS-d
EV Event Frequency 1 events/day EPA, 2001
EF Exposure Frequency 350 days/year EPA, 2001
ED Exposure Duration 24 years EPA, 1991
BW Body Weight 70 kg EPA, 2001
AT-C Averaging Time - Cancer 25,550 days EPA, 2001
AT-N Averaging Time - Non-Cancer 8,760 days EPA, 2001
(1) Parameters for Slag Piles 2 and 3 are identical to Slag Pile 1, and are therefore not repeated.
EPA 1989: Risk Assessment Guidance for Superfund. Volume 1: Human Health Evaluation Manual, Part A. OERR EPA/540/1-89/002.
EPA 1991: Risk Assessment Guidance for Superfund. Volume 1: Human Health Evaluation Manual - Supplemental Guidance, Standard Default Exposure Factors. Interim Final. OSWER 9285.6-03.
EPA 1995: Assessing Dermal Exposure from Soil, Technical Guidance Manual, Region III, EPA/903-K-95-003.
EPA 1997: Exposure Factors Handbook, Volume 1. EPA/600/P-95/002Fa.
EPA 2001: Risk Assessment Guidance for Superfund. Volume 1: Human Health Evaluation Manual (Part E, Supplemental Guidance for Dermal Risk Assessment) Interim.
NA = Not Available

December 2001 Page 2 - 1
Example Scenario No. 2Modeled Inhalation from Showering (with Planning Tables 1, 2, 3, 4, and 7)
Scenario Description: Individuals may be exposed to chemicals of potential concern in air by inhalationof chemicals through showering. The inhalation pathway is modeled using an EPA-accepted inhalationmodel. For this example scenario, a model accepted by EPA regions, such as the Foster andChrostowski Shower Model, is used to evaluate future adult resident inhalation exposure togroundwater. See Example Scenario 4 for illustrations of how to present modeled data.
Planning Table Issues Associated with this Scenario:
1. How will use of an inhalation model affect Planning Table 1?Planning Table 1 can accommodate this easily. Planning Table 1 can be completed toinclude an exposure medium (e.g., Water Vapors at Showerhead) and include theinhalation exposure route for all applicable scenarios. For this scenario example,Planning Table 1 would include a row that would describe this inhalation exposurepathway.
2. What data will be included in Planning Table 2 -- modeled air concentrations or measuredgroundwater concentrations?
In this example, Planning Table 2 will show measured groundwater concentrations. Thedata will be screened against tap water screening values.
3. What data will be included in Planning Table 3?In this example, Planning Table 3 will show measured groundwater statistics.
4. How will the inhalation model parameters be shown on Planning Table 4?For this example, the upper left hand corner Summary Box and the exposure route,receptor population, receptor age, and exposure point fields should be completed. However, exposure parameters and intake equations do not need to be entered into thetable if there are space limitations. In the exposure route column, enter “Inhalation”with a footnote. Include the footnote explanation beneath the table that describes themodel to be used and the section of the risk assessment text where information regardingmodeled intake development can be found. Supporting information that summarizes themodeled intake methodology and parameters used to calculate modeled intake valuesshould be included in the Baseline Risk Assessment Report as an attachment. Non-standard tables may also be used to display modeled information. Refer to the RiskAssessment text for details on the modeled intake methodology, the parameters used tocalculate modeled intake values, and the modeled air concentrations predicted by themodel.

December 2001 Page 2 - 2
Example Scenario No. 2Modeled Inhalation from Showering (with Planning Tables 1, 2, 3, 4, and 7)
5. How are the modeled results displayed on Planning Table 7?For this example, EPC values are calculated using measured groundwater data. Theycan be found on Planning Table 3. Intake/Exposure concentration values are valuesthat are generated using the inhalation model. These values need to be included on thistable. The risks and hazards will be calculated using the “Intake / Exposureconcentration values” based on modeling and appropriate toxicity information.

Page 1 of 1 December 2001
EXAMPLE SCENARIO 2
TABLE 1
SELECTION OF EXPOSURE PATHWAYS
The Dean Company
Scenario Medium Exposure Exposure Receptor Receptor Exposure Type of Rationale for Selection or Exclusion
Timeframe Medium Point Population Age Route Analysis of Exposure Pathway
Future Groundwater Groundwater Aquifer 1 - Tap Water Resident Adult Dermal Quant Future onsite residents may rely on domestic wells drawing from Aquifer 1.
Ingestion Quant Future onsite residents may rely on domestic wells drawing from Aquifer 1.
Child Dermal Quant Future onsite residents may rely on domestic wells drawing from Aquifer 1.
Ingestion Quant Future onsite residents may rely on domestic wells drawing from Aquifer 1.
Air Water Vapors at Resident Adult Inhalation Quant Future onsite residents may rely on domestic wells drawing from Aquifer 1.
Showerhead Child Inhalation None Children are assumed not to shower.

Page 1 of 1 December 2001
EXAMPLE SCENARIO 2
TABLE 2.2
OCCURRENCE, DISTRIBUTION, AND SELECTION OF CHEMICALS OF POTENTIAL CONCERN
The Dean Company
Scenario Timeframe: Future
Medium: Groundwater
Exposure Medium: Air
Exposure CAS Chemical Minimum (1) Maximum (1) Units Location Detection Range of Concentration Background Screening Potential Potential COPC Rationale for
Point Number Concentration Concentration of Maximum Frequency Detection Used for Value (3) Toxicity Value (4) ARAR/TBC ARAR/TBC Flag Selection or
(Qualifier) (Qualifier) Concentration Limits Screening (2) (N/C) Value Source (Y/N) Deletion (5)
Water Vapors 117817 Bis(2-ethylhexyl)phthalate 2 J 5 J ug/l GW3D 4 / 12 7 - 11 5 NA 4.8 C 6 MCL Y ASL
at 67663 Chloroform 0.6 J 9 ug/l GW3D 3 / 12 1 - 1 9 NA 0.063 C 100 MCL Y ASL
Showerhead 75150 Carbon Disulfide 0.3 J 4.5 ug/l GW3D 3 / 12 1 - 1 4.5 NA 100 N NA NA N BSL
76448 Heptachlor 2 J 33 J ug/l GW4D 6 / 12 0.05 - 0.05 33 NA 0.015 C 0.4 MCL Y ASL
108883 Toluene 0.1 J 0.2 J ug/l GW3D 3 / 12 1 - 1 0.2 NA 75 N 1000 MCL N BSL
(1) Measured groundwater concentrations.
(2) Maximum concentration used for screening. Definitions: NA = Not Applicable
(3) To date, no background study has been completed. COPC = Chemical of Potential Concern
(4) All compounds are screened against the Risk-Based Concentration (RBC) Table, U.S. EPA Region III, ARAR/TBC = Applicable or Relevant and Appropriate Requirement/To Be Considered
October 5, 2000 for tap water (cancer benchmark = 1E-06; HQ = 0.1). MCL = Maximum Contaminant Level
(5) Rationale Codes: J = Estimated Value
Selection Reason: Above Screening Level (ASL) C = Carcinogen
Deletion Reason: Below Screening Level (BSL) N = Noncarcinogen

Page 1 of 1 December 2001
EXAMPLE SCENARIO 2
TABLE 3.2.RME
EXPOSURE POINT CONCENTRATION SUMMARY
REASONABLE MAXIMUM EXPOSURE
The Dean Company
Scenario Timeframe: Future
Medium: Groundwater
Exposure Medium: Air
Maximum
Exposure Point Chemical of Units Arithmetic 95% UCL ConcentrationExposure Point Concentration
Potential Concern Mean (N/T) (Qualifier) Value Units Statistic Rationale
Water Vapors at Bis(2-ethylhexyl)phthalate ug/l 4 5.5 T 5 J 5 ug/l Max W-Test (1)
Showerhead Chloroform ug/l 1.9 14.9 T 9 9 ug/l Max W-Test (1)
Heptachlor ug/l 27 30 T 33 J 30 ug/l 95% UCL - T W - Test (2)
Note: Measured groundwater concentrations used to calculate EPC values. N = Normal
Statistics: Maximum Detected Value (Max); 95% UCL of Transformed Data (95% UCL - T) T = Transformed
(1) 95% UCL exceeds maximum detected concentration. Therefore, maximum concentration used for EPC. J = Estimated Value
(2) Shapiro-Wilk W Test indicates data are lognormally transformed.

Page 1 of 1 December 2001
EXAMPLE SCENARIO 2
TABLE 4.2.RME
VALUES USED FOR DAILY INTAKE CALCULATIONS
REASONABLE MAXIMUM EXPOSURE
The Dean Company
Scenario Timeframe: Future
Medium: Groundwater
Exposure Medium: Air
Exposure Route Receptor Population Receptor Age Exposure Point Parameter Parameter Definition Value Units Rationale/ Intake Equation/
Code Reference Model Name
Inhalation (1) Resident Adult Water Vapors at (1) (1) (1) (1) (1) Foster and Chrostowski Model
Showerhead
(1) Refer to the Risk Assessment text for details on the modeled intake methodology, the parameters used to calculate modeled intake values, and the modeled air concentrations predicted by the
Foster and Chrostowski Shower Model.

Page 1 of 1 December 2001
EXAMPLE SCENARIO 2
TABLE 7.1.RME
CALCULATION OF CHEMICAL CANCER RISKS AND NON-CANCER HAZARDS
REASONABLE MAXIMUM EXPOSURE
The Dean Company
Scenario Timeframe: Future
Receptor Population: Resident
Receptor Age: Adult
Medium Exposure Medium Exposure Point Exposure Route Chemical of EPC Cancer Risk Calculations Non-Cancer Hazard CalculationsPotential Concern Value Units Intake/Exposure Concentration CSF/Unit Risk Cancer Risk Intake/Exposure Concentration RfD/RfC Hazard Quotient
Value Units Value Units Value Units Value Units
Groundwater Groundwater Aquifer 1 - Tap Water Ingestion Bis(2-ethylhexyl)phthalate 0.005 mg/l 4.7E-005 mg/kg/day 1.4E-002 1/mg/kg/day 7E-007 1.4E-004 mg/kg/day 2.0E-002 mg/kg/day 0.007
Chloroform 0.009 mg/l 8.5E-005 mg/kg/day 6.1E-003 1/mg/kg/day 5E-007 2.5E-004 mg/kg/day 1.0E-002 mg/kg/day 0.03
Heptachlor 0.03 mg/l 2.8E-004 mg/kg/day 4.5E+000 1/mg/kg/day 1E-003 8.1E-004 mg/kg/day 5.0E-004 mg/kg/day 2
Exp. Route Total 1E-003 2
Dermal Bis(2-ethylhexyl)phthalate 0.005 mg/l 3.9E-006 mg/kg/day 2.5E-002 1/mg/kg/day 1E-007 1.1E-005 mg/kg/day 1.1E-002 mg/kg/day 0.001
Chloroform 0.009 mg/l 1.9E-006 mg/kg/day 6.1E-003 1/mg/kg/day 1E-008 5.5E-006 mg/kg/day 1.0E-002 mg/kg/day 0.0006
Heptachlor 0.03 mg/l 7.6E-006 mg/kg/day 9.0E+000 1/mg/kg/day 7E-005 2.2E-005 mg/kg/day 2.5E-004 mg/kg/day 0.09
Exp. Route Total 7E-005 0.09
Exposure Point Total 1E-003 2
Air Water Vapors at Inhalation Bis(2-ethylhexyl)phthalate 0.005 mg/l (1) 2.3E-006 mg/kg/day NA NA NA 3.6E-006 mg/kg/day NA NA NA
Showerhead Chloroform 0.009 mg/l (1) 1.3E-004 mg/kg/day 8.1E-002 1/mg/kg/day 1E-005 3.9E-004 mg/kg/day 8.6E-005 mg/kg/day 5
Heptachlor 0.03 mg/l (1) 2.6E-004 mg/kg/day 4.5E+000 1/mg/kg/day 1E-003 7.7E-004 mg/kg/day NA NA NA
Exp. Route Total 1E-003 5
Exposure Point Total 1E-003 5
Total of Receptor Risks Across All Media 2E-003 Total of Receptor Hazards Across All Media 7
(1) EPC values are shown as measured groundwater values and are found on Table 3.2.RME.

December 2001 Page 3 - 1
Example Scenario No. 3Measured Data and Subsequent Ingestion (Planning Tables 1, 2 and 3)
Scenario Description: Measured fish tissue data are available for evaluation in the risk assessment. Thedata are available for a specific species: trout. The measured data will be used in the risk assessment todetermine the potential for adverse effects from ingestion of fish. This scenario is based upon fish tissueto show how to include measured data in the tables, but it can be applied to other exposure media.
Planning Table Issues Associated with this Scenario:
1. How will Planning Table 1 show fish tissue exposure?In this situation, it is assumed that the source of exposure for the fish was the sediment,Planning Table 1 will need to show a specific exposure point for the trout as follows:
Medium: SedimentExposure Medium: Fish TissueExposure Point: Trout
2. What data will be included in Planning Table 2 - measured fish tissue data or sediment data?Planning Table 2 will show measured trout analytical data. The data will be screenedagainst fish tissue screening values.
3. What data will be included in Planning Table 3?Planning Table 3 will show measured fish tissue statistics for the trout.

Page 1 of 1 December 2001
EXAMPLE SCENARIO 3
TABLE 1
SELECTION OF EXPOSURE PATHWAYS
The Dean Company
Scenario Medium Exposure Exposure Receptor Receptor Exposure Type of Rationale for Selection or Exclusion
Timeframe Medium Point Population Age Route Analysis of Exposure Pathway
Future Sediment Sediment Pond 1 Receptor Population Age 1 Route 1 Quant Rationale
Route 2 Quant Rationale
Age 2 Route 1 Quant Rationale
Route 2 Quant Rationale
Fish Tissue Trout Receptor Population Age 1 Route 1 Quant Rationale
Age 2 Route 1 Quant Rationale

Page 1 of 1 December 2001
EXAMPLE SCENARIO 3
TABLE 2.1
OCCURRENCE, DISTRIBUTION, AND SELECTION OF CHEMICALS OF POTENTIAL CONCERN
The Dean Company
Scenario Timeframe: Future
Medium: Sediment
Exposure Medium: Fish Tissue
Exposure CAS Chemical Minimum (1) Maximum (1) Units Location Detection Range of Concentration Background Screening Potential Potential COPC Rationale for
Point Number Concentration Concentration of Maximum Frequency Detection Used for Value (2) Toxicity Value (3) ARAR/TBC ARAR/TBC Flag Selection or
(Qualifier) (Qualifier) Concentration Limits Screening (1) (N/C) Value Source (Y/N) Deletion (4)
Trout 11096825 Arochlor 1260 0.0002 J 0.005 J mg/kg Trout - 1 3 / 10 0.0001 - 0.0001 0.005 NA 0.0016 C NA NA Y ASL
7439921 Lead 0.004 J 0.007 J mg/kg Trout - 3 5 / 10 0.001 - 0.001 0.007 NA NA NA NA Y NTX
1746016 2,3,7,8-Tetrachlorodibenzodioxin 0.00000001 J 0.00000005 J mg/kg Trout - 1 4 / 10 0.00000001 - 0.00000001 0.00000005 NA 0.000000021 C NA NA Y ASL
(1) Measured fish tissue concentrations. Maximum measured fish tissue concentrations used for screening. Definitions: NA = Not Applicable
(2) Background values are not available. COPC = Chemical of Potential Concern
(3) All compounds were screened against the Risk-Based Concentration (RBC) Table, U.S. EPA Region III, ARAR/TBC = Applicable or Relevant and Appropriate Requirement/To Be Considered
May 8, 2001 for fish tissue (cancer benchmark = 1E-06; HQ = 0.1). J = Estimated Value
(4) Rationale Codes: C = Carcinogen
Selection Reason: Above Screening Level (ASL) N = Noncarcinogen
No Toxicity Infomation (NTX)

Page 1 of 1 December 2001
EXAMPLE SCENARIO 3
TABLE 3.1.RME
EXPOSURE POINT CONCENTRATION SUMMARY
REASONABLE MAXIMUM EXPOSURE
The Dean Company
Scenario Timeframe: Future
Medium: Sediment
Exposure Medium: Fish Tissue
Maximum
Exposure Point Chemical of Units Arithmetic 95% UCL ConcentrationExposure Point Concentration
Potential Concern Mean (N/T) (Qualifier) Value Units Statistic Rationale
Trout Arochlor 1260 mg/kg 0.003 0.0035 (T) 0.005 J 0.0035 mg/kg 95% UCL - T W - Test (1)
Lead mg/kg 0.005 0.0063 (T) 0.007 J 0.0063 mg/kg 95% UCL - T W - Test (1)
2,3,7,8-Tetrachlorodibenzodioxin mg/kg 0.00000002 0.000000047 (T) 0.00000005 J 0.000000047 mg/kg 95% UCL -T W - Test (1)
Statistics: 95% UCL of Transformed Data (95% UCL - T) N = Normal
(1) Shapiro-Wilk W Test indicates data are log-normally distributed. T = Transformed
Note: Measured fish tissue concentrations used to calculate EPC values. J = Estimated Value

December 2001 Page 4 - 1
Example Scenario No. 4Modeled Data and Subsequent Ingestion (Planning Tables 1 and 2)
Scenario Description: Modeled fish tissue data are available for evaluation in the risk assessment basedon concentrations of contaminants in the sediment. The modeled data will be used in the riskassessment to determine the potential for adverse effects from ingestion of the fish. This scenario isbased upon fish tissue to show how to include modeled data in the tables, but it can be applied to otherexposure media.
Planning Table Issues Associated with this Scenario:
The primary issue with this scenario is what data to show on Planning Table 2 and subsequent tables(modeled fish tissue or measured sediment data). There are two options for data presentation.
Option 1 (Modeled Fish Tissue Concentrations): The modeled fish tissue concentrations couldappear on Planning Table 2 in the Concentration Used for Screening column. These modeledconcentrations would be screened against fish tissue screening values. The methodology usedto develop the modeled concentrations should be referenced on the tables. This option shouldbe used when screening on fish tissue concentrations.
Option 2 (Measured Sediment Concentrations): Measured sediment concentrations could bepresented on Planning Table 2. The measured concentrations are the values used as input inthe model to determine predicted fish tissue concentrations. The modeling methodology couldbe discussed in the text and referenced on Planning Table 4. The model results would be usedfor intake calculations in Planning Table 7. This option should be used when screening onsediment concentrations.
1. How will Planning Table 1 show fish tissue exposure?Assuming the source of exposure for the fish is sediment, Planning Table 1 will need toshow a specific exposure point for the fish as follows:
Medium: SedimentExposure Medium: Fish TissueExposure Point: Trout
2. What data will be included in Planning Table 2 - measured sediment data or modeled fish tissuedata?See discussion of options, above, and footnotes on Planning Table 2.

Page 1 of 1 December 2001
EXAMPLE SCENARIO 4
TABLE 1
SELECTION OF EXPOSURE PATHWAYS
The Dean Company
Scenario Medium Exposure Exposure Receptor Receptor Exposure Type of Rationale for Selection or Exclusion
Timeframe Medium Point Population Age Route Analysis of Exposure Pathway
Timeframe Sediment Fish Tissue Trout Population 1 Age 1 Route 1 Quant Rationale
Age 2 Route 1 Quant Rationale
Population 2 Age 1 Route 1 Quant Rationale
Age 2 Route 1 Quant Rationale

Page 1 of 1 December 2001
EXAMPLE SCENARIO 4Option 1
TABLE 2.1
OCCURRENCE, DISTRIBUTION, AND SELECTION OF CHEMICALS OF POTENTIAL CONCERN
The Dean Company
Scenario Timeframe: Future
Medium: Sediment
Exposure Medium: Fish Tissue
Exposure CAS Chemical Minimum Maximum Units Location Detection Range of Concentration Background Screening Potential Potential COPC Rationale for
Point Number Concentration (1) Concentration (1) of Maximum Frequency Detection Used for Value (3) Toxicity Value (4) ARAR/TBC ARAR/TBC Flag Selection or
(Qualifier) (Qualifier) Concentration Limits Screening (2) (N/C) Value Source (Y/N) Deletion (5)
Trout 11096825 Arochlor 1260 0.6 J 5.5 J mg/kg SD01 3 / 10 0.1 - 0.2 0.005 NA 0.0016 (C) NA NA Y ASL
7439921 Lead 210 J 500 J mg/kg SD03 5 / 10 10 - 16 0.007 NA NA NA NA Y NTX
1746016 2,3,7,8-Tetrachlorodibenzodioxin 0.000001 J 0.00005 J mg/kg SD01 4 / 10 0.000001 - 0.000001 0.00000005 NA 0.000000021 (C) NA NA Y ASL
(1) Measured sediment concentrations.
(2) Concentrations used for screening are fish tissue values derived from the X model. Refer to the risk assessment text for details on the model methodology.
(3) To date, no background study has been completed.
(4) All compounds were screened against the Risk-Based Concentration (RBC) Table, U.S. EPA Region III,
May 8, 2001 for fish tissue (cancer benchmark = 1E-06; HQ = 0.1).
(5) Rationale Codes:
Selection Reason: Above Screening Level (ASL)
No Toxicity Infomation (NTX)
EXAMPLE SCENARIO 4
Option 2
TABLE 2.1
OCCURRENCE, DISTRIBUTION, AND SELECTION OF CHEMICALS OF POTENTIAL CONCERN
The Dean Company
Scenario Timeframe: Future
Medium: Sediment
Exposure Medium: Fish Tissue
Exposure CAS Chemical Minimum Maximum Units Location Detection Range of Concentration Background Screening Potential Potential COPC Rationale for
Point Number Concentration (1) Concentration (1) of Maximum Frequency Detection Used for Value (2) Toxicity Value (3) ARAR/TBC ARAR/TBC Flag Selection or
(Qualifier) (Qualifier) Concentration Limits Screening (1) (N/C) Value Source (Y/N) Deletion (4)
Trout 11096825 Arochlor 1260 0.6 J 5.5 J mg/kg SD01 3 / 10 0.1 - 0.2 5.5 NA 3.2 (C) NA NA Y ASL
7439921 Lead 210 J 500 J mg/kg SD03 5 / 10 10 - 16 500 NA 400 NA NA Y ASL
1746016 2,3,7,8-Tetrachlorodibenzodioxin 0.000001 J 0.00005 J mg/kg SD01 4 / 10 0.000001 - 0.000001 0.00005 NA 0.000043 (C) NA NA Y ASL
(1) Measured sediment concentrations are shown and maximum concentrations are used for screening. These data will be used as input in Definitions: NA = Not Applicable
the X model to predict fish tissue concentrations. Refer to the risk assessment text for details on the model methodology. COPC = Chemical of Potential Concern
(2) To date, no background study has been completed. ARAR/TBC = Applicable or Relevant and Appropriate Requirement/To Be Considered
(3) All compounds were screened against the Risk-Based Concentration (RBC) Table, U.S. EPA Region III, J = Estimated Value
May 8, 2001 for 10 times the residential soil value (cancer benchmark = 10 x 1E-06; HQ = 10 x 0.1). Lead was screened against the C = Carcinogen
U.S. EPA screening value of 400 mg/kg. N = Noncarcinogen
(4) Rationale Codes:
Selection Reason: Above Screening Level (ASL)

Page 5 - 1
Example Scenario No. 5Modeled Data (Planning Table 1)
Scenario Description: The risk assessment uses data that have been modeled to evaluate potential risks. The modeling results are for spatial changes, temporal changes, and transfer between media.
Planning Table Issues Associated with this Scenario:
The issue associated with this scenario is how to identify and evaluate each different modeled data set. In this temporal change example, groundwater data have been modeled to represent concentrations infuture years (1 year, 2 years, and 5 years in the future). This evaluation can be accommodated byassigning a separate exposure point to each future year.
1. How will Planning Table 1 be completed?Planning Table 1 could show temporal changes using the exposure point column, asshown on the accompanying table.

Page 1 of 1 December 2001
EXAMPLE SCENARIO 5
TABLE 1
SELECTION OF EXPOSURE PATHWAYS
Site Name
Scenario Medium Exposure Exposure Receptor Receptor Exposure Type of Rationale for Selection or Exclusion
Timeframe Medium Point Population Age Route Analysis of Exposure Pathway
Future Groundwater GroundwaterGroundwater - Modeled 1 year into the future
Resident Adult Ingestion Quant Rationale
Dermal Quant Rationale
Groundwater - Modeled 2 Years into the Future Resident
Adult Ingestion Quant Rationale
Dermal Quant Rationale
Groundwater - Modeled 5 Years into the Future Resident
Adult Ingestion Quant Rationale
Dermal Quant Rationale

December 2001 Page 6 - 1
Example Scenario No. 6Multiple Source Exposures (Planning Table 1)
Scenario Description: The risk assessment is evaluating the ingestion of fish tissue affected by bothcontaminated surface water and sediment.
Planning Table Issues Associated with this Scenario:
1. How will the medium, exposure medium, and exposure point be represented in Planning Table 1 forfish tissue?
The exposure point for fish tissue ingestion can be presented in two different ways, asdescribed in the options below:
Option 1Medium: Surface Water/SedimentExposure Medium: Fish TissueExposure Point: Trout - contaminant uptake from surface water and sediment
This option should be used if screening will be performed against measured or modeledfish tissue data.
Option 2Medium: Surface WaterExposure Medium: Fish TissueExposure Point: Trout - contaminant uptake from surface water
AND
Medium: SedimentExposure Medium: Fish TissueExposure Point: Trout - contaminant uptake from sediment
This option should be used if screening will be performed against measured surface wateror sediment data.

Page 1 of 1 December 2001
EXAMPLE SCENARIO 6OPTION 1
TABLE 1
SELECTION OF EXPOSURE PATHWAYS
The Dean Company
Scenario Medium Exposure Exposure Receptor Receptor Exposure Type of Rationale for Selection or Exclusion
Timeframe Medium Point Population Age Route Analysis of Exposure Pathway
Future Surface Water/Sediment Fish TissueTrout--Contaminant Uptake
from Surface Water andSediment
Receptor Population Age 1 Ingestion Quant Rationale
Age 2 Ingestion Quant Rationale
EXAMPLE SCENARIO 6
OPTION 2
TABLE 1
SELECTION OF EXPOSURE PATHWAYS
The Dean Company
Scenario Medium Exposure Exposure Receptor Receptor Exposure Type of Rationale for Selection or Exclusion
Timeframe Medium Point Population Age Route Analysis of Exposure Pathway
Future Surface Water Fish TissueTrout--Contaminant Uptake
from Surface WaterReceptor Population Age 1 Ingestion Quant Rationale
Age 2 Ingestion Quant Rationale
Sediment Fish TissueTrout--Contaminant Uptake
from SedimentReceptor Population Age 1 Ingestion Quant Rationale
Age 2 Ingestion Quant Rationale

December 2001 Page 7 - 1
Example Scenario No. 7Possible Summing Options (Planning Tables 9 and 10)
Scenario Description: The risk assessment is evaluating several different exposure points for a particularset of media and exposure media. The EPA risk assessor for the site may allow the risk assessor to useabridged versions of Planning Tables 9 and 10 which do not require the same level of summation as theversion of Planning Tables 9 and 10 shown in Appendix A. Planning Table Issues Associated with this Scenario:
1. How will the risk data be summed on Planning Tables 9 and 10 for medium, exposure medium,exposure point, and receptor (combination of scenario timeframe, receptor population, and receptorage)?
The summing of risk for these exposure pathway elements can be presented in twodifferent ways, as described in the options below. The EPA risk assessor will determinethe type of summing that is appropriate for a particular site.
Option 1Summing will occur in the standard fashion at four levels: medium, exposure medium,exposure point, and receptor.
Option 1 is shown in the accompanying tables and in Appendix A
Option 2Summing will occur at fewer levels only: e.g., for exposure point and receptor only. Consult the EPA risk assessor to determine the appropriate procedure to follow.
Option 2 is shown in the accompanying tables.

Page 1 of 2 December 2001
EXAMPLE SCENARIO 7
Option 1
TABLE 9.1.RME
SUMMARY OF RECEPTOR RISKS AND HAZARDS FOR COPCs
REASONABLE MAXIMUM EXPOSURE
The Dean Company
Scenario Timeframe: Future
Receptor Population: Resident
Receptor Age: Adult
Medium Exposure Exposure Chemical Carcinogenic Risk Non-Carcinogenic Hazard Quotient
Medium Point of Potential
Concern Ingestion Inhalation Dermal External Exposure Primary Ingestion Inhalation Dermal Exposure
(Radiation) Routes Total Target Organ(s) Routes Total
Groundwater Groundwater Aquifer 1 - Tap Water Bis(2-ethylhexyl)phthalate 7E-07 - - 1E-07 - - 8E-07 Liver 0.007 - - 0.001 0.008
Chloroform 5E-07 - - 1E-08 - - 5E-07 Liver 0.03 - - 0.0006 0.03
Chemical Total 1E-06 - - 1E-07 - - 1E-06 0.03 - - 0.002 0.04
Radionuclide Total
Exposure Point Total 1E-06 0.04
Exposure Medium Total 1E-06 0.04
Air Water Vapors from Bis(2-ethylhexyl)phthalate - - 3E-08 - - - - 3E-08 - - - - - - - - - -
Showerhead Chloroform - - 1E-05 - - - - 1E-05 Liver - - 5 - - 5
Chemical Total - - 1E-05 - - - - 1E-05 - - 5 - - 5
Radionuclide Total
Exposure Point Total 1E-05 5
Exposure Medium Total 1E-05 5
Groundwater Total 1E-05 5

Page 2 of 2 December 2001
EXAMPLE SCENARIO 7
Option 1
TABLE 9.1.RME
SUMMARY OF RECEPTOR RISKS AND HAZARDS FOR COPCs
REASONABLE MAXIMUM EXPOSURE
The Dean Company
Scenario Timeframe: Future
Receptor Population: Resident
Receptor Age: Adult
Medium Exposure Exposure Chemical Carcinogenic Risk Non-Carcinogenic Hazard Quotient
Medium Point of Potential
Concern Ingestion Inhalation Dermal External Exposure Primary Ingestion Inhalation Dermal Exposure
(Radiation) Routes Total Target Organ(s) Routes Total
Soil Soil Soil at Site 1 4,4'-DDE 1E-06 - - 1E-06 - - 2E-06 - - - - - - - - - -
4,4'-DDT 5E-06 - - 5E-006 - - 1E-005 Liver 0.08 - - 0.08 0.2
Chemical Total 6E-06 - - 6E-06 - - 1E-05 0.08 0.08 0.2
Radionuclide Total
Exposure Point Total 1E-05 0.2
Soil at Site 2 4,4'-DDE 8E-08 - - 8E-08 - - 2E-07 - - - - - - - - - -
4,4'-DDT 5E-08 - - 5E-08 - - 1E-07 Liver 0.0009 - - 0.0009 0.002
Chemical Total 1E-07 - - 1E-07 - - 3E-07 0.0009 0.0009 0.002
Radionuclide Total
Exposure Point Total 3E-07 0.002
Exposure Medium Total 1E-05 0.002
Soil Total 1E-05 0.002
Receptor Total 2E-05 5
Total Risk Across All Media 2E-05 Total Hazard Across All Media 5
Total Liver HI Across All Media = 5

Page 1 of 1 December 2001
EXAMPLE SCENARIO 7Option 2
TABLE 9.1.RME
SUMMARY OF RECEPTOR RISKS AND HAZARDS FOR COPCs
REASONABLE MAXIMUM EXPOSURE
The Dean Company
Scenario Timeframe: Future
Receptor Population: Resident
Receptor Age: Adult
Medium Exposure Exposure Chemical Carcinogenic Risk Non-Carcinogenic Hazard Quotient
Medium Point of Potential
Concern Ingestion Inhalation Dermal External Exposure Primary Ingestion Inhalation Dermal Exposure
(Radiation) Routes Total Target Organ(s) Routes Total
Groundwater Groundwater Aquifer 1 - Tap Water Bis(2-ethylhexyl)phthalate 7E-07 - - 1E-07 - - 8E-07 Liver 0.007 - - 0.001 0.008
Chloroform 5E-07 - - 1E-08 - - 5E-07 Liver 0.03 - - 0.0006 0.03
Chemical Total 1E-06 - - 1E-07 - - 1E-06 0.03 - - 0.002 0.04
Radionuclide Total
Exposure Point Total 1E-06 0.04
Air Water Vapors from Bis(2-ethylhexyl)phthalate - - 3E-08 - - - - 3E-08 - - - - - - - - - -
Showerhead Chloroform - - 1E-05 - - - - 1E-05 Liver - - 5 - - 5
Chemical Total - - 1E-05 - - - - 1E-05 - - 5 - - 5
Radionuclide Total
Exposure Point Total 1E-05 5
Soil Soil Soil at Site 1 4,4'-DDE 1E-06 - - 1E-06 - - 2E-06 - - - - - - - - - -
4,4'-DDT 5E-06 - - 5E-006 - - 1E-005 Liver 0.08 - - 0.08 0.2
Chemical Total 6E-06 - - 6E-06 - - 1E-05 0.08 0.08 0.2
Radionuclide Total
Exposure Point Total 1E-05 0.2
Soil at Site 2 4,4'-DDE 8E-08 - - 8E-08 - - 2E-07 - - - - - - - - - -
4,4'-DDT 5E-08 - - 5E-08 - - 1E-07 Liver 0.0009 - - 0.0009 0.002
Chemical Total 1E-07 - - 1E-07 - - 3E-07 0.0009 0.0009 0.002
Radionuclide Total
Exposure Point Total 3E-07 0.002
Total Risk Across All Media 2E-05 Total Hazard Across All Media = 5
Total Liver HI Across All Media = 5

Page 1 of 1 December 2001
EXAMPLE SCENARIO 7
Option 1
TABLE 10.1.RME
RISK SUMMARY
REASONABLE MAXIMUM EXPOSURE
The Dean Company
Scenario Timeframe: Future
Receptor Population: Resident
Receptor Age: Adult
Medium Exposure Exposure Chemical Carcinogenic Risk Non-Carcinogenic Hazard Quotient
Medium Point of Potential
Concern Ingestion Inhalation Dermal External Exposure Primary Ingestion Inhalation Dermal Exposure
(Radiation) Routes Total Target Organ(s) Routes Total
Groundwater AirWater Vapors from
ShowerheadChloroform - - 1E-05 - - - - 1E-05 Liver - - 5 - - 5
Chemical Total - - 1E-05 - - - - 1E-05 - - 5 - - 5
Radionuclide Total
Exposure Point Total 1E-05 5
Exposure Medium Total 1E-05 5
Groundwater Total 1E-05 5
Soil Soil Soil at Site 1 4,4'-DDE 1E-06 - - 1E-06 - - 2E-06 - - - - - - - - - -
4,4'-DDT 5E-06 - - 5E-06 - - 1E-05 - - - - - - - - - -
Chemical Total 6E-06 - - 6E-06 - - 1E-05 - - - - - -
Radionuclide Total
Exposure Point Total 1E-05 - -
Exposure Medium Total 1E-05 - -
Soil Total 1E-05 - -
Receptor Total 2E-05 5
Total Risk Across All Media 2E-05 Total Hazard Across All Media 5
Cancer risks presented are those greater than 1E-06; Non-cancer risks presented are those greater than 1.
Total Liver HI Across All Media = 5

Page 1 of 1 December 2001
EXAMPLE SCENARIO 7
Option 2
TABLE 10.1.RME
RISK SUMMARY
REASONABLE MAXIMUM EXPOSURE
The Dean Company
Scenario Timeframe: Future
Receptor Population: Resident
Receptor Age: Adult
Medium Exposure Exposure Chemical Carcinogenic Risk Non-Carcinogenic Hazard Quotient
Medium Point of Potential
Concern Ingestion Inhalation Dermal External Exposure Primary Ingestion Inhalation Dermal Exposure
(Radiation) Routes Total Target Organ(s) Routes Total
Groundwater AirWater Vapors from
ShowerheadChloroform - - 1E-05 - - - - 1E-05 Liver - - 5 - - 5
Chemical Total - - 1E-05 - - - - 1E-05 - - 5 - - 5
Radionuclide Total
Exposure Point Total 1E-05 5
Soil Soil Soil at Site 1 4,4'-DDE 1E-06 - - 1E-06 - - 2E-06 - - - - - - - - - -
4,4'-DDT 5E-06 - - 5E-006 - - 1E-005 - - - - - - - - - -
Chemical Total 6E-06 - - 6E-06 - - 1E-05 - - - - - -
Radionuclide Total
Exposure Point Total 1E-05 - -
Total Risk Across All Media 2E-05 Total Hazard Across All Media = 5
Cancer risks presented are those greater than 1E-06; Non-cancer risks presented are those greater than 1.
Total Liver HI Across All Media = 5

December 2001 Page 8 - 1
Example Scenario No. 8Child/Adult Lifetime Cancer Risk (Planning Tables 1, 4, 7, 9)
Scenario Description: For this risk assessment the lifetime risk will be evaluated. Lifetime risk evaluatesthe combined risk from childhood through adulthood.
Planning Table Issues Associated with this Scenario: In some regions, lifetime cancer risks are calculated by adding child and adult risk estimates together. In other regions, age-adjusted exposure factors are used to calculate lifetime cancer risk.
1. How should lifetime cancer risk be presented on Planning Table 1?For the “receptor age” column, choose from the picklist and enter “Adult”, “Child”,and “Child/Adult”
2. How should the other Planning Tables be completed?Two options are presented:
Option 1–Child/Adult calculated through summing cancer risks for separate Child and AdultreceptorsPlanning Tables 1, 4, and 7 would have separate Child and Adult receptor ages. Planning Table 1 would also show a Child/Adult receptor to indicate that theChild/Adult analyses will be performed. Planning Table 4s would be developed forChild and Adult receptors with appropriate exposure factor values. A Planning Table4 would also be shown for the Child/Adult receptor with no exposure factor valuesprovided. Instead, a note would indicate that Child/Adult cancer risks will becalculated based upon the sum of Child cancer risk and Adult cancer risk.
Planning Table 7s and 9s would then be developed for three receptor ages: Child,Adult, and Child/Adult (a version of Planning Tables 7 and 9 combining the Child andthe Adult cancer risk data into a single Child/Adult table with a note that the data on thetable was derived from summing the Child and Adult data).
Option 2–Child/Adult calculated using age-adjusted exposure factorsAs in Option 1, Planning Tables 1, 4, and 7 in Option 2 would show separate Childand Adult receptor ages as well as the Child/Adult receptor age. For the Option 2Planning Table 4, the Child/Adult receptor age would be shown with age-adjustedexposure factor values. For the Option 2 Planning Tables 7 and 9, the Child/Adultcancer risks would be calculated using age-adjusted exposure factor values.

Page 1 of 1 December 2001
EXAMPLE SCENARIO 8
Option 1
TABLE 1
SELECTION OF EXPOSURE PATHWAYS
The Dean Company
Scenario Medium Exposure Exposure Receptor Receptor Exposure Type of Rationale for Selection or Exclusion
Timeframe Medium Point Population Age Route Analysis of Exposure Pathway
Future Soil Soil Soil at Site 1 Resident Adult Dermal Quant Future onsite residents may come into contact with soil.
Ingestion Quant Future onsite residents may ingest soil.
Child Dermal Quant Future onsite residents may come into contact with soil.
Ingestion Quant Future onsite residents may ingest soil.
Child/Adult Dermal Quant Future onsite residents may come into contact with soil.
Ingestion Quant Future onsite residents may ingest soil.
EXAMPLE SCENARIO 8
Option 2
TABLE 1
SELECTION OF EXPOSURE PATHWAYS
The Dean Company
Scenario Medium Exposure Exposure Receptor Receptor Exposure Type of Rationale for Selection or Exclusion
Timeframe Medium Point Population Age Route Analysis of Exposure Pathway
Future Soil Soil Soil at Site 1 Resident Adult Dermal Quant Future onsite residents may come into contact with soil.
Ingestion Quant Future onsite residents may ingest soil.
Child Dermal Quant Future onsite residents may come into contact with soil.
Ingestion Quant Future onsite residents may ingest soil.
Child/Adult Dermal Quant Future onsite residents may come into contact with soil.
Ingestion Quant Future onsite residents may ingest soil.

Page 1 of 2 December 2001
EXAMPLE SCENARIO 8
Option 1
TABLE 4.1.RME
VALUES USED FOR DAILY INTAKE CALCULATIONS
REASONABLE MAXIMUM EXPOSURE
The Dean Company
Scenario Timeframe: Future
Medium: Soil
Exposure Medium: Soil
Exposure Route Receptor Population Receptor Age Exposure Point Parameter Parameter Definition Value Units Rationale/ Intake Equation/
Code Reference Model Name
Ingestion Resident Adult Soil at Site 1 CS Chemical Concentration in Soil See Table 3.3 mg/kg See Table 3.3 Chronic Daily Intake (CDI) (mg/kg-day) =
IR Ingestion Rate of Soil 100 mg/day EPA, 1991 CS x IR x FI x EF x ED x CF1 x 1/BW x 1/AT
FI Fraction Ingested 1 - - Professional Judgment
EF Exposure Frequency 350 days/year EPA, 1991
ED Exposure Duration 24 years EPA, 1991
CF1 Conversion Factor 1E-06 kg/mg - -
BW Body Weight 70 kg EPA, 1991
AT-C Averaging Time - Cancer 25,550 days EPA, 1989
AT-N Averaging Time - Non-Cancer 8,760 days EPA, 1989
Child Soil at Site 1 CS Chemical Concentration in Soil See Table 3.3 mg/kg See Table 3.3 CDI (mg/kg-day) =
IR Ingestion Rate of Soil 200 mg/day EPA, 1991 CS x IR x FI x EF x ED x CF1 x 1/BW x 1/AT
FI Fraction Ingested 1 - - Professional Judgment
EF Exposure Frequency 350 days/year EPA, 1991
ED Exposure Duration 6 years EPA, 1991
CF1 Conversion Factor 1E-06 kg/mg - -
BW Body Weight 15 kg EPA, 1991
AT-C Averaging Time - Cancer 25,550 days EPA, 1989
AT-N Averaging Time - Non-Cancer 2,190 days EPA, 1989
Child/Adult Soil at Site 1 - - - - - - - - - -Child/Adult cancer risks will be calculated as the sum of
the Child cancer risk and the Adult cancer risk.

Page 2 of 2 December 2001
EXAMPLE SCENARIO 8
Option 1
TABLE 4.1.RME
VALUES USED FOR DAILY INTAKE CALCULATIONS
REASONABLE MAXIMUM EXPOSURE
The Dean Company
Scenario Timeframe: Future
Medium: Soil
Exposure Medium: Soil
Exposure Route Receptor Population Receptor Age Exposure Point Parameter Parameter Definition Value Units Rationale/ Intake Equation/
Code Reference Model Name
Dermal Resident Adult Soil at Site 1 CS Chemical Concentration in Soil See Table 3.3 mg/kg See Table 3.3 CDI (mg/kg-day) =
CF1 Conversion Factor 1E-06 kg/mg - - CS x CF1 x SA x AF x AB x EF x ED x 1/BW x 1/AT
SA Skin Surface Area Available for Contact 5,000 cm2 EPA, 1997
AF Soil to Skin Adherence Factor 0.19 mg/cm2 EPA, 1997
AB Absorption Factor chemical-specific unitless EPA, 1995
EF Exposure Frequency 350 days/year EPA, 1991
ED Exposure Duration 24 years EPA, 1991
BW Body Weight 70 kg EPA, 1991
AT-C Averaging Time - Cancer 25,550 days EPA, 1989
AT-N Averaging Time - Non-Cancer 8,760 days EPA, 1989
Child Soil at Site 1 CS Chemical Concentration in Soil See Table 3.3 mg/kg See Table 3.3 CDI (mg/kg-day) =
CF1 Conversion Factor 1E-06 kg/mg - - CS x CF1 x SA x AF x AB x EF x ED x 1/BW x 1/AT
SA Skin Surface Area Available for Contact 3,600 cm2 EPA, 1997
AF Soil to Skin Adherence Factor 0.11 mg/cm2 EPA, 1997
AB Absorption Factor chemical-specific unitless EPA, 1995
EF Exposure Frequency 350 days/year EPA, 1991
ED Exposure Duration 6 years EPA, 1991
BW Body Weight 15 kg EPA, 1991
AT-C Averaging Time - Cancer 25,550 days EPA, 1989
AT-N Averaging Time - Non-Cancer 2,190 days EPA, 1989
Child/Adult Soil at Site 1 - - - - - - - - - -Child/Adult cancer risks will be calculated as the sum of
the Child cancer risk and the Adult cancer risk.
EPA 1989: Risk Assessment Guidance for Superfund. Volume 1: Human Health Evaluation Manual, Part A. OERR EPA/540/1-89/002.
EPA 1991: Risk Assessment Guidance for Superfund. Volume 1: Human Health Evaluation Manual - Supplemental Guidance, Standard Default Exposure Factors. Interim Final. OSWER 9285.6-03.
EPA 1995: Assessing Dermal Exposure from Soil, Technical Guidance Manual, Region III, EPA/903-K-95-003.
EPA 1997: Exposure Factors Handbook, Volume 1. EPA/600/P-95/002Fa.

Page 1 of 3 December 2001
EXAMPLE SCENARIO 8Option 2
TABLE 4.1.RME
VALUES USED FOR DAILY INTAKE CALCULATIONS
REASONABLE MAXIMUM EXPOSURE
The Dean Company
Scenario Timeframe: Future
Medium: Soil
Exposure Medium: Soil
Exposure Route Receptor Population Receptor Age Exposure Point Parameter Parameter Definition Value Units Rationale/ Intake Equation/
Code Reference Model Name
Ingestion Resident Adult Soil at Site 1 CS Chemical Concentration in Soil See Table 3.3 mg/kg See Table 3.3 Chronic Daily Intake (CDI) (mg/kg-day) =
IR Ingestion Rate of Soil 100 mg/day EPA, 1991 CS x IR x FI x EF x ED x CF1 x 1/BW x 1/AT
FI Fraction Ingested 1 - - Professional Judgment
EF Exposure Frequency 350 days/year EPA, 1991
ED Exposure Duration 24 years EPA, 1991
CF1 Conversion Factor 1.0E-06 kg/mg - -
BW Body Weight 70 kg EPA, 1991
AT-C Averaging Time - Cancer 25,550 days EPA, 1989
AT-N Averaging Time - Non-Cancer 8,760 days EPA, 1989
Child Soil at Site 1 CS Chemical Concentration in Soil See Table 3.3 mg/kg See Table 3.3 CDI (mg/kg-day) =
IR Ingestion Rate of Soil 200 mg/day EPA, 1991 CS x IR x FI x EF x ED x CF1 x 1/BW x 1/AT
FI Fraction Ingested 1 - - Professional Judgment
EF Exposure Frequency 350 days/year EPA, 1991
ED Exposure Duration 6 years EPA, 1991
CF1 Conversion Factor 1.0E-06 kg/mg - -
BW Body Weight 15 kg EPA, 1991
AT-C Averaging Time - Cancer 25,550 days EPA, 1989
AT-N Averaging Time - Non-Cancer 2,190 days EPA, 1989
Child/Adult Soil at Site 1 CS Chemical Concentration in Soil See Table 3.3 mg/kg See Table 3.3 CDI (mg/kg/day) =
IF Ingestion Factor 114 mg-year/kg-day EPA 1991b CS x IF x CF x FI x EF x 1/AT
BW-C Body Weight, Child 15 kg EPA, 1991a where
BW-A Body Weight, Adult 70 kg EPA, 1991a IF = (ED-C x IR-C / BW-C) + (ED-TOT - ED-C) x
IR-C Ingestion Rate, Child 200 mg/day EPA, 1991a (IR-A / BW-A)
IR-A Ingestion Rate, Adult 100 mg/day EPA, 1991a
ED-C Exposure Duration, Child 6 years EPA, 1991a
ED-TOT Exposure Duration, Total 30 years EPA, 1991a
CF Conversion Factor 1.0E-06 kg/mg - -
FI Fraction Ingested 1 unitless Professional Judgment
EF Exposure Frequency 350 days/year EPA, 1991a
AT-C Averaging Time - Cancer 25,550 days EPA, 1989

Page 2 of 3 December 2001
EXAMPLE SCENARIO 8Option 2
TABLE 4.1.RME
VALUES USED FOR DAILY INTAKE CALCULATIONS
REASONABLE MAXIMUM EXPOSURE
The Dean Company
Scenario Timeframe: Future
Medium: Soil
Exposure Medium: Soil
Exposure Route Receptor Population Receptor Age Exposure Point Parameter Parameter Definition Value Units Rationale/ Intake Equation/
Code Reference Model Name
Dermal Resident Adult Soil at Site 1 CS Chemical Concentration in Soil See Table 3.3 mg/kg See Table 3.3 CDI (mg/kg-day) =
CF1 Conversion Factor 1.0E-06 kg/mg - - CS x CF1 x SA x AF x AB x EF x ED x 1/BW x 1/AT
SA Skin Surface Area Available for Contact 5,000 cm2 EPA, 1997
AF Soil to Skin Adherence Factor 0.19 mg/cm2 EPA, 1997
AB Absorption Factor chemical-specific unitless EPA, 1995
EF Exposure Frequency 350 days/year EPA, 1991
ED Exposure Duration 24 years EPA, 1991
BW Body Weight 70 kg EPA, 1991
AT-C Averaging Time - Cancer 25,550 days EPA, 1989
AT-N Averaging Time - Non-Cancer 8,760 days EPA, 1989
Child Soil at Site 1 CS Chemical Concentration in Soil See Table 3.3 mg/kg See Table 3.3 CDI (mg/kg-day) =
CF1 Conversion Factor 1.0E-06 kg/mg - - CS x CF1 x SA x AF x AB x EF x ED x 1/BW x 1/AT
SA Skin Surface Area Available for Contact 3,600 cm2 EPA, 1997
AF Soil to Skin Adherence Factor 0.11 mg/cm2 EPA, 1997
AB Absorption Factor chemical-specific unitless EPA, 1995
EF Exposure Frequency 350 days/year EPA, 1991
ED Exposure Duration 6 years EPA, 1991
BW Body Weight 15 kg EPA, 1991
AT-C Averaging Time - Cancer 25,550 days EPA, 1989
AT-N Averaging Time - Non-Cancer 2,190 days EPA, 1989

Page 3 of 3 December 2001
EXAMPLE SCENARIO 8Option 2
TABLE 4.1.RME
VALUES USED FOR DAILY INTAKE CALCULATIONS
REASONABLE MAXIMUM EXPOSURE
The Dean Company
Scenario Timeframe: Future
Medium: Soil
Exposure Medium: Soil
Exposure Route Receptor Population Receptor Age Exposure Point Parameter Parameter Definition Value Units Rationale/ Intake Equation/
Code Reference Model Name
Dermal (continued) Resident (continued) Child/Adult Soil at Site 1 CS Chemical Concentration in Soil See Table 3.3 mg/kg See Table 3.3 CDI (mg/kg-day) =
DF Dermal Factor 3,154 cm2-year/kg-day EPA 1991b CS x CF1 x DF x AF x AB x EF x 1/AT
BW-C Body Weight, Child 15 kg EPA, 1991a where
BW-A Body Weight, Adult 70 kg EPA, 1991a DF = (ED-C x SA-C / BW-C) + (ED-TOT - ED-C) x
SA-C Surface Area, Child 3,600 cm2 EPA, 1997 (SA-A / BW-A)
SA-A Surface Area, Adult 5,000 cm2 EPA, 1997
ED-C Exposure Duration, Child 6 years EPA, 1991a
ED-TOT Exposure Duration, Total 30 years EPA, 1991a
AF Soil to Skin Adherence Factor 0.15 mg/cm2 Professional Judgment
EF Exposure Frequency 350 days/year EPA 1991a
AB Absorption Factor chemical-specific unitless EPA, 1995
CF1 Conversion Factor 1.0E-06 kg/mg - -
AT-C Averaging Time - Cancer 25,550 days EPA, 1989
EPA 1989: Risk Assessment Guidance for Superfund. Volume 1: Human Health Evaluation Manual, Part A. OERR EPA/540/1-89/002. EPA 1997: Exposure Factors Handbook, Volume 1. EPA/600/P-95/002Fa.
EPA 1991a: Risk Assessment Guidance for Superfund. Volume 1: Human Health Evaluation Manual - Supplemental Guidance, Standard Default Exposure Factors. Interim Final. OSWER 9285.6-03.
EPA 1991b: Human Health Evaluation Manual, Part B: Development of Risk-Based Preliminary Remediation Goals. OSWER Directive 9285.7-01B EPA 1995: Assessing Dermal Exposure from Soil, Technical Guidance Manual, Region III, EPA/903-K-95-003.

Page 1 of 1 December 2001
EXAMPLE SCENARIO 8Option 1
TABLE 7.1.RME
CALCULATION OF CHEMICAL CANCER RISKS AND NON-CANCER HAZARDS
REASONABLE MAXIMUM EXPOSURE
The Dean Company
Scenario Timeframe: Future
Receptor Population: Resident
Receptor Age: Adult
Medium Exposure Medium Exposure Point Exposure Route Chemical of EPC Cancer Risk Calculations Non-Cancer Hazard CalculationsPotential Concern Value Units Intake/Exposure Concentration CSF/Unit Risk Cancer Risk Intake/Exposure Concentration RfD/RfC Hazard Quotient
Value Units Value Units Value Units Value UnitsSoil Soil Soil at Site 1 Ingestion 4,4'-DDD 0.452 mg/kg 2.1E-07 mg/kg/day 2.4E-01 1/mg/kg/day 5E-08 6.2E-07 mg/kg/day NA NA NA
4,4'-DDE 6.8 mg/kg 3.2E-06 mg/kg/day 3.4E-01 1/mg/kg/day 1E-06 9.3E-06 mg/kg/day NA NA NA
4,4'-DDT 28.6 mg/kg 1.3E-005 mg/kg/day 3.4E-01 1/mg/kg/day 5E-06 3.9E-05 mg/kg/day 5.0E-04 mg/kg/day 0.08
Aluminum 9964 mg/kg 4.7E-003 mg/kg/day NA NA NA 1.4E-02 mg/kg/day 1.0E+00 mg/kg/day 0.01
Manganese 201 mg/kg 9.5E-005 mg/kg/day NA NA NA 2.8E-04 mg/kg/day 1.4E-01 mg/kg/day 0.002
Thallium 1.2 mg/kg 5.6E-007 mg/kg/day NA NA NA 1.6E-06 mg/kg/day NA NA NA
Exp. Route Total 6E-06 0.09
Dermal 4,4'-DDD 0.452 mg/kg 2.0E-007 mg/kg/day 2.7E-01 1/mg/kg/day 5E-08 5.9E-07 mg/kg/day NA NA NA
4,4'-DDE 6.8 mg/kg 3.0E-06 mg/kg/day 3.8E-01 1/mg/kg/day 1E-06 8.8E-06 mg/kg/day NA NA NA
4,4'-DDT 28.6 mg/kg 1.3E-005 mg/kg/day 3.8E-01 1/mg/kg/day 5E-06 3.7E-005 mg/kg/day 4.5E-004 mg/kg/day 0.08
Aluminum 9964 mg/kg 4.5E-004 mg/kg/day NA NA NA 1.3E-003 mg/kg/day 2.7E-001 mg/kg/day 0.005
Manganese 201 mg/kg 9.0E-006 mg/kg/day NA NA NA 2.6E-005 mg/kg/day 7.0E-03 mg/kg/day 0.004
Thallium 1.2 mg/kg 5.3E-008 mg/kg/day NA NA NA 1.5E-007 mg/kg/day NA NA NA
Exp. Route Total 6E-06 0.09
Exposure Point Total 1E-05 0.2
Expsoure Medium Total 1E-05 0.2
Soil Total 1E-05 0.2
Total of Receptor Risks Across All Media 1E-05 Total of Receptor Hazards Across All Media 0.2

Page 1 of 1 December 2001
EXAMPLE SCENARIO 8Option 1
TABLE 7.2.RME
CALCULATION OF CHEMICAL CANCER RISKS AND NON-CANCER HAZARDS
REASONABLE MAXIMUM EXPOSURE
The Dean Company
Scenario Timeframe: Future
Receptor Population: Resident
Receptor Age: Child
Medium Exposure Medium Exposure Point Exposure Route Chemical of EPC Cancer Risk Calculations Non-Cancer Hazard CalculationsPotential Concern Value Units Intake/Exposure Concentration CSF/Unit Risk Cancer Risk Intake/Exposure Concentration RfD/RfC Hazard Quotient
Value Units Value Units Value Units Value UnitsSoil Soil Soil at Site 1 Ingestion 4,4'-DDD 0.452 mg/kg 5.0E-07 mg/kg/day 2.4E-01 1/mg/kg/day 1E-07 5.8E-06 mg/kg/day NA NA NA
4,4'-DDE 6.8 mg/kg 7.4E-06 mg/kg/day 3.4E-01 1/mg/kg/day 3E-06 8.7E-05 mg/kg/day NA NA NA
4,4'-DDT 28.6 mg/kg 3.1E-005 mg/kg/day 3.4E-01 1/mg/kg/day 1E-05 3.7E-004 mg/kg/day 5.0E-04 mg/kg/day 0.7
Aluminum 9964 mg/kg 1.1E-002 mg/kg/day NA NA NA 1.3E-001 mg/kg/day 1.0E+00 mg/kg/day 0.1
Manganese 201 mg/kg 2.2E-004 mg/kg/day NA NA NA 2.6E-003 mg/kg/day 1.4E-01 mg/kg/day 0.02
Thallium 1.2 mg/kg 1.3E-006 mg/kg/day NA NA NA 1.5E-005 mg/kg/day NA NA NA
Exp. Route Total 1E-05 0.8
Dermal 4,4'-DDD 0.452 mg/kg 9.8E-08 mg/kg/day 2.7E-01 1/mg/kg/day 3E-08 1.1E-06 mg/kg/day NA NA NA
4,4'-DDE 6.8 mg/kg 1.5E-06 mg/kg/day 3.8E-01 1/mg/kg/day 6E-07 1.7E-05 mg/kg/day NA NA NA
4,4'-DDT 28.6 mg/kg 6.2E-006 mg/kg/day 3.8E-01 1/mg/kg/day 2E-06 7.2E-005 mg/kg/day 4.5E-004 mg/kg/day 0.2
Aluminum 9964 mg/kg 2.2E-004 mg/kg/day NA NA NA 2.5E-003 mg/kg/day 2.7E-001 mg/kg/day 0.009
Manganese 201 mg/kg 4.4E-006 mg/kg/day NA NA NA 5.1E-005 mg/kg/day 7.0E-003 mg/kg/day 0.007
Thallium 1.2 mg/kg 2.6E-008 mg/kg/day NA NA NA 3.0E-007 mg/kg/day NA NA NA
Exp. Route Total 3E-06 0.2
Exposure Point Total 1E-05 1
Exposure Medium Total 1E-05 1
Medium 1E-05 1
Total of Receptor Risks Across All Media 1E-05 Total of Receptor Hazards Across All Media 1

Page 1 of 1 December 2001
EXAMPLE SCENARIO 8Option 1
TABLE 7.3.RME
CALCULATION OF CHEMICAL CANCER RISKS AND NON-CANCER HAZARDS
REASONABLE MAXIMUM EXPOSURE
The Dean Company
Scenario Timeframe: Future
Receptor Population: Resident
Receptor Age: Child/Adult
Medium Exposure Medium Exposure Point Exposure Route Chemical of EPC Cancer Risk Calculations Non-Cancer Hazard CalculationsPotential Concern Value Units Intake/Exposure Concentration CSF/Unit Risk Cancer Risk Intake/Exposure Concentration RfD/RfC Hazard Quotient
Value Units Value Units Value Units Value Units
Soil Soil Soil at Site 1 Ingestion 4,4'-DDD 0.452 mg/kg 7.1E-07 mg/kg/day 2.4E-01 1/mg/kg/day 2E-07 - - - - - - - - - -
4,4'-DDE 6.8 mg/kg 1.1E-05 mg/kg/day 3.4E-01 1/mg/kg/day 4E-06 - - - - - - - - - -
4,4'-DDT 28.6 mg/kg 4.4E-05 mg/kg/day 3.4E-01 1/mg/kg/day 2E-05 - - - - - - - - - -
Aluminum 9964 mg/kg 1.6E-02 mg/kg/day NA NA NA - - - - - - - - - -
Manganese 201 mg/kg 3.2E-05 mg/kg/day NA NA NA - - - - - - - - - -
Thallium 1.2 mg/kg 1.9E-06 mg/kg/day NA NA NA - - - - - - - - - -
Exp. Route Total 2E-05 - -
Dermal 4,4'-DDD 0.452 mg/kg 3.0E-07 mg/kg/day 2.7E-01 1/mg/kg/day 8E-08 - - - - - - - - - -
4,4'-DDE 6.8 mg/kg 4.5E-06 mg/kg/day 3.8E-01 1/mg/kg/day 2E-06 - - - - - - - - - -
4,4'-DDT 28.6 mg/kg 1.9E-05 mg/kg/day 3.8E-01 1/mg/kg/day 7E-06 - - - - - - - - - -
Aluminum 9964 mg/kg 6.7E-04 mg/kg/day NA NA NA - - - - - - - - - -
Manganese 201 mg/kg 1.3E-05 mg/kg/day NA NA NA - - - - - - - - - -
Thallium 1.2 mg/kg 7.9E-08 mg/kg/day NA NA NA - - - - - - - - - -
Exp. Route Total 9E-06 - - - - - - - - - -
Exposure Point Total 3E-05 - -
Exposure Medium Total 3E-05 - -
Medium 3E-05 - -
Total of Receptor Risks Across All Media 3E-05 Total of Receptor Hazards Across All Media - -
Note: Child/Adult cancer risk was calculated as the sum of the Child cancer risk (Table 7.2.RME) and the Adult cancer risk (Table 7.1.RME).

Page 1 of 1 December 2001
EXAMPLE SCENARIO 8Option 2
TABLE 7.1.RME
CALCULATION OF CHEMICAL CANCER RISKS AND NON-CANCER HAZARDS
REASONABLE MAXIMUM EXPOSURE
The Dean Company
Scenario Timeframe: Future
Receptor Population: Resident
Receptor Age: Adult
Medium Exposure Medium Exposure Point Exposure Route Chemical of EPC Cancer Risk Calculations Non-Cancer Hazard CalculationsPotential Concern Value Units Intake/Exposure Concentration CSF/Unit Risk Cancer Risk Intake/Exposure Concentration RfD/RfC Hazard Quotient
Value Units Value Units Value Units Value Units
Soil Soil Soil at Site 1 Ingestion 4,4'-DDD 0.452 mg/kg 2.1E-07 mg/kg/day 2.4E-01 1/mg/kg/day 5E-08 6.2E-07 mg/kg/day NA NA NA
4,4'-DDE 6.8 mg/kg 3.2E-06 mg/kg/day 3.4E-01 1/mg/kg/day 1E-06 9.3E-06 mg/kg/day NA NA NA
4,4'-DDT 28.6 mg/kg 1.3E-005 mg/kg/day 3.4E-01 1/mg/kg/day 5E-06 3.9E-05 mg/kg/day 5.0E-04 mg/kg/day 0.08
Aluminum 9964 mg/kg 4.7E-003 mg/kg/day NA NA NA 1.4E-02 mg/kg/day 1.0E+00 mg/kg/day 0.01
Manganese 201 mg/kg 9.5E-005 mg/kg/day NA NA NA 2.8E-04 mg/kg/day 1.4E-01 mg/kg/day 0.002
Thallium 1.2 mg/kg 5.6E-007 mg/kg/day NA NA NA 1.6E-06 mg/kg/day NA NA NA
Exp. Route Total 6E-06 0.09
Dermal 4,4'-DDD 0.452 mg/kg 2.0E-007 mg/kg/day 2.7E-01 1/mg/kg/day 5E-08 5.9E-07 mg/kg/day NA NA NA
4,4'-DDE 6.8 mg/kg 3.0E-06 mg/kg/day 3.8E-01 1/mg/kg/day 1E-06 8.8E-06 mg/kg/day NA NA NA
4,4'-DDT 28.6 mg/kg 1.3E-005 mg/kg/day 3.8E-01 1/mg/kg/day 5E-06 3.7E-005 mg/kg/day 4.5E-004 mg/kg/day 0.08
Aluminum 9964 mg/kg 4.5E-004 mg/kg/day NA NA NA 1.3E-003 mg/kg/day 2.7E-001 mg/kg/day 0.005
Manganese 201 mg/kg 9.0E-006 mg/kg/day NA NA NA 2.6E-005 mg/kg/day 7.0E-03 mg/kg/day 0.004
Thallium 1.2 mg/kg 5.3E-008 mg/kg/day NA NA NA 1.5E-007 mg/kg/day NA NA NA
Exp. Route Total 6E-06 0.09
Exposure Point Total 1E-05 0.2
Exposure Medium Total 1E-05 0.2
Soil Total 1E-05 0.2
Total of Receptor Risks Across All Media 1E-05 Total of Receptor Hazards Across All Media 0.2

Page 1 of 1 December 2001
EXAMPLE SCENARIO 8Option 2
TABLE 7.2.RME
CALCULATION OF CHEMICAL CANCER RISKS AND NON-CANCER HAZARDS
REASONABLE MAXIMUM EXPOSURE
The Dean Company
Scenario Timeframe: Future
Receptor Population: Resident
Receptor Age: Child
Medium Exposure Medium Exposure Point Exposure Route Chemical of EPC Cancer Risk Calculations Non-Cancer Hazard CalculationsPotential Concern Value Units Intake/Exposure Concentration CSF/Unit Risk Cancer Risk Intake/Exposure Concentration RfD/RfC Hazard Quotient
Value Units Value Units Value Units Value Units
Soil Soil Soil at Site 1 Ingestion 4,4'-DDD 0.452 mg/kg 5.0E-07 mg/kg/day 2.4E-01 1/mg/kg/day 1E-07 5.8E-06 mg/kg/day NA NA NA
4,4'-DDE 6.8 mg/kg 7.4E-06 mg/kg/day 3.4E-01 1/mg/kg/day 3E-06 8.7E-05 mg/kg/day NA NA NA
4,4'-DDT 28.6 mg/kg 3.1E-005 mg/kg/day 3.4E-01 1/mg/kg/day 1E-05 3.7E-004 mg/kg/day 5.0E-04 mg/kg/day 0.7
Aluminum 9964 mg/kg 1.1E-002 mg/kg/day NA NA NA 1.3E-001 mg/kg/day 1.0E+00 mg/kg/day 0.1
Manganese 201 mg/kg 2.2E-004 mg/kg/day NA NA NA 2.6E-003 mg/kg/day 1.4E-01 mg/kg/day 0.02
Thallium 1.2 mg/kg 1.3E-006 mg/kg/day NA NA NA 1.5E-005 mg/kg/day NA NA NA
Exp. Route Total 1E-05 0.8
Dermal 4,4'-DDD 0.452 mg/kg 9.8E-08 mg/kg/day 2.7E-01 1/mg/kg/day 3E-08 1.1E-06 mg/kg/day NA NA NA
4,4'-DDE 6.8 mg/kg 1.5E-06 mg/kg/day 3.8E-01 1/mg/kg/day 6E-07 1.7E-05 mg/kg/day NA NA NA
4,4'-DDT 28.6 mg/kg 6.2E-006 mg/kg/day 3.8E-01 1/mg/kg/day 2E-06 7.2E-005 mg/kg/day 4.5E-004 mg/kg/day 0.2
Aluminum 9964 mg/kg 2.2E-004 mg/kg/day NA NA NA 2.5E-003 mg/kg/day 2.7E-001 mg/kg/day 0.009
Manganese 201 mg/kg 4.4E-006 mg/kg/day NA NA NA 5.1E-005 mg/kg/day 7.0E-003 mg/kg/day 0.007
Thallium 1.2 mg/kg 2.6E-008 mg/kg/day NA NA NA 3.0E-007 mg/kg/day NA NA NA
Exp. Route Total 3E-06 0.2
Exposure Point Total 1E-05 1
Exposure Medium Total 1E-05 1
Soil Total 1E-05 1
Total of Receptor Risks Across All Media 1E-05 Total of Receptor Hazards Across All Media 1

Page 1 of 1 December 2001
EXAMPLE SCENARIO 8Option 2
TABLE 7.3.RME
CALCULATION OF CHEMICAL CANCER RISKS AND NON-CANCER HAZARDS
REASONABLE MAXIMUM EXPOSURE
The Dean Company
Scenario Timeframe: Future
Receptor Population: Resident
Receptor Age: Child/Adult
Medium Exposure Medium Exposure Point Exposure Route Chemical of EPC Cancer Risk Calculations Non-Cancer Hazard CalculationsPotential Concern Value Units Intake/Exposure Concentration CSF/Unit Risk Cancer Risk Intake/Exposure Concentration RfD/RfC Hazard Quotient
Value Units Value Units Value Units Value Units
Soil Soil Soil at Site 1 Ingestion 4,4'-DDD 0.452 mg/kg 7.1E-07 mg/kg/day 2.4E-01 1/mg/kg/day 2E-07 - - - - - - - - - -
4,4'-DDE 6.8 mg/kg 1.1E-05 mg/kg/day 3.4E-01 1/mg/kg/day 4E-06 - - - - - - - - - -
4,4'-DDT 28.6 mg/kg 4.5E-05 mg/kg/day 3.4E-01 1/mg/kg/day 2E-05 - - - - - - - - - -
Aluminum 9964 mg/kg 1.6E-02 mg/kg/day NA NA NA - - - - - - - - - -
Manganese 201 mg/kg 3.1E-04 mg/kg/day NA NA NA - - - - - - - - - -
Thallium 1.2 mg/kg 1.8E-06 mg/kg/day NA NA NA - - - - - - - - - -
Exp. Route Total 2E-05 - -
Dermal 4,4'-DDD 0.452 mg/kg 2.9E-07 mg/kg/day 2.7E-01 1/mg/kg/day 8E-08 - - - - - - - - - -
4,4'-DDE 6.8 mg/kg 4.4E-06 mg/kg/day 3.8E-01 1/mg/kg/day 2E-06 - - - - - - - - - -
4,4'-DDT 28.6 mg/kg 1.9E-05 mg/kg/day 3.8E-01 1/mg/kg/day 7E-06 - - - - - - - - - -
Aluminum 9964 mg/kg 6.5E-04 mg/kg/day NA NA NA - - - - - - - - - -
Manganese 201 mg/kg 1.3E-05 mg/kg/day NA NA NA - - - - - - - - - -
Thallium 1.2 mg/kg 7.8E-08 mg/kg/day NA NA NA - - - - - - - - - -
Exp. Route Total 9E-06 - -
Exposure Point Total 3E-05 - -
Exposure Medium Total 3E-05 - -
Soil Total 3E-05 - -
Total of Receptor Risks Across All Media 3E-05 Total of Receptor Hazards Across All Media - -
Note: Child/Adult cancer risk was calculated using age-adjusted exposure factor values.

Page 1 of 1 December 2001
EXAMPLE SCENARIO 8
Option 1
TABLE 9.1.RME
SUMMARY OF RECEPTOR RISKS AND HAZARDS FOR COPCs
REASONABLE MAXIMUM EXPOSURE
The Dean Company
Scenario Timeframe: Future
Receptor Population: Resident
Receptor Age: Adult
Medium Exposure Exposure Chemical Carcinogenic Risk Non-Carcinogenic Hazard Quotient
Medium Point of Potential
Concern Ingestion Inhalation Dermal External Exposure Primary Ingestion Inhalation Dermal Exposure
(Radiation) Routes Total Target Organ(s) Routes Total
Soil Soil Soil at Site 1 4,4'-DDD 5E-08 - - 5E-08 - - 1E-07 - - - - - - - - - -
4,4'-DDE 1E-06 - - 1E-06 - - 2E-06 - - - - - - - - - -
4,4'-DDT 5E-06 - - 5E-06 - - 1E-05 Liver 0.08 - - 0.08 0.2
Aluminum - - - - - - - - - - Central Nervous System 0.01 - - 0.005 0.02
Manganese - - - - - - - - - - Central Nervous System 0.002 - - 0.004 0.006
Thallium - - - - - - - - - - - - - - - - - - - -
Chemical Total 6E-06 - - 6E-06 - - 1E-05 0.09 - - 0.09 0.2
Radionuclide Total
Exposure Point Total 1E-05 0.2
Exposure Medium Total 1E-05 0.2
Soil Total 1E-05 0.2
Receptor Total 1E-05 0.2
Total Risk Across All Media 1E-05 Total Hazard Across All Media 0.2

Page 1 of 1 December 2001
EXAMPLE SCENARIO 8
Option 2
TABLE 9.1.RME
SUMMARY OF RECEPTOR RISKS AND HAZARDS FOR COPCs
REASONABLE MAXIMUM EXPOSURE
The Dean Company
Scenario Timeframe: Future
Receptor Population: Resident
Receptor Age: Adult
Medium Exposure Exposure Chemical Carcinogenic Risk Non-Carcinogenic Hazard Quotient
Medium Point of Potential
Concern Ingestion Inhalation Dermal External Exposure Primary Ingestion Inhalation Dermal Exposure
(Radiation) Routes Total Target Organ(s) Routes Total
Soil Soil Soil at Site 1 4,4'-DDD 5E-08 - - 5E-08 - - 1E-07 - - - - - - - - - -
4,4'-DDE 1E-06 - - 1E-06 - - 2E-06 - - - - - - - - - -
4,4'-DDT 5E-06 - - 5E-06 - - 1E-05 Liver 0.08 - - 0.08 0.2
Aluminum - - - - - - - - - - Central Nervous System 0.01 - - 0.005 0.02
Manganese - - - - - - - - - - Central Nervous System 0.002 - - 0.004 0.006
Thallium - - - - - - - - - - - - - - - - - - - -
Chemical Total 6E-06 - - 6E-06 - - 1E-05 0.09 - - 0.09 0.2
Radionuclide Total
Exposure Point Total 1E-05 0.2
Exposure Medium Total 1E-05 0.2
Soil Total 1E-05 0.2
Receptor Total 1E-05 0.2
Total Risk Across All Media 1E-05 Total Hazard Across All Media 0.2

Page 1 of 1 December 2001
EXAMPLE SCENARIO 8
Option 1
TABLE 9.2.RME
SUMMARY OF RECEPTOR RISKS AND HAZARDS FOR COPCs
REASONABLE MAXIMUM EXPOSURE
The Dean Company
Scenario Timeframe: Future
Receptor Population: Resident
Receptor Age: Child
Medium Exposure Exposure Chemical Carcinogenic Risk Non-Carcinogenic Hazard Quotient
Medium Point of Potential
Concern Ingestion Inhalation Dermal External Exposure Primary Ingestion Inhalation Dermal Exposure
(Radiation) Routes Total Target Organ(s) Routes Total
Soil Soil Soil at Site 1 4,4'-DDD 1E-07 - - 3E-08 - - 1E-07 - - - - - - - - - -
4,4'-DDE 3E-06 - - 6E-07 - - 3E-06 - - - - - - - - - -
4,4'-DDT 1E-05 - - 2E-06 - - 1E-05 Liver 0.7 - - 0.2 0.9
Aluminum - - - - - - - - - - Central Nervous System 0.1 - - 0.009 0.1
Manganese - - - - - - - - - - Central Nervous System 0.02 - - 0.007 0.03
Thallium - - - - - - - - - - - - - - - - - - - -
Chemical Total 1E-05 - - 3E-06 - - 1E-05 0.8 - - 0.2 1
Radionuclide Total
Exposure Point Total 1E-05 1
Exposure Medium Total 1E-05 1
Soil Total 1E-05 1
Receptor Total 1E-05 1
Total Risk Across All Media 1E-05 Total Hazard Across All Media 1

Page 1 of 1 December 2001
EXAMPLE SCENARIO 8
Option 2
TABLE 9.2.RME
SUMMARY OF RECEPTOR RISKS AND HAZARDS FOR COPCs
REASONABLE MAXIMUM EXPOSURE
The Dean Company
Scenario Timeframe: Future
Receptor Population: Resident
Receptor Age: Child
Medium Exposure Exposure Chemical Carcinogenic Risk Non-Carcinogenic Hazard Quotient
Medium Point of Potential
Concern Ingestion Inhalation Dermal External Exposure Primary Ingestion Inhalation Dermal Exposure
(Radiation) Routes Total Target Organ(s) Routes Total
Soil Soil Soil at Site 1 4,4'-DDD 1E-07 - - 3E-08 - - 1E-07 - - - - - - - - - -
4,4'-DDE 3E-06 - - 6E-07 - - 3E-06 - - - - - - - - - -
4,4'-DDT 1E-05 - - 2E-06 - - 1E-05 Liver 0.7 - - 0.2 0.9
Aluminum - - - - - - - - - - Central Nervous System 0.1 - - 0.009 0.1
Manganese - - - - - - - - - - Central Nervous System 0.02 - - 0.007 0.03
Thallium - - - - - - - - - - - - - - - - - - - -
Chemical Total 1E-05 - - 3E-06 - - 1E-05 0.8 - - 0.2 1
Radionuclide Total
Exposure Point Total 1E-05 1
Exposure Medium Total 1E-05 1
Soil Total 1E-05 1
Receptor Total 1E-05 1
Total Risk Across All Media 1E-05 Total Hazard Across All Media 1

Page 1 of 1 December 2001
EXAMPLE SCENARIO 8
Option 1
TABLE 9.3.RME
SUMMARY OF RECEPTOR RISKS AND HAZARDS FOR COPCs
REASONABLE MAXIMUM EXPOSURE
The Dean Company
Scenario Timeframe: Future
Receptor Population: Resident
Receptor Age: Child/Adult
Medium Exposure Exposure Chemical Carcinogenic Risk Non-Carcinogenic Hazard Quotient
Medium Point of Potential
Concern Ingestion Inhalation Dermal External Exposure Primary Ingestion Inhalation Dermal Exposure
(Radiation) Routes Total Target Organ(s) Routes Total
Soil Soil Soil at Site 1 4,4'-DDD 2E-07 - - 8E-08 - - 3E-07 - - - - - - - - - -
4,4'-DDE 4E-06 - - 2E-06 - - 6E-06 - - - - - - - - - -
4,4'-DDT 2E-05 - - 7E-06 - - 3E-05 - - - - - - - - - -
Aluminum - - - - - - - - - - - - - - - - - - - -
Manganese - - - - - - - - - - - - - - - - - - - -
Thallium - - - - - - - - - - - - - - - - - - - -
Chemical Total 2E-05 - - 9E-06 - - 3E-05 - - - - - - - -
Radionuclide Total
Exposure Point Total 3E-05 - -
Exposure Medium Total 3E-05 - -
Soil Total 3E-05 - -
Receptor Total 3E-05 - -
Total Risk Across All Media 3E-05 Total Hazard Across All Media - -
Note: This table represents the residential lifetime cancer risk and was derived by combining the adult residential risks and the child residential risks.

Page 1 of 1 December 2001
EXAMPLE SCENARIO 8
Option 2
TABLE 9.3.RME
SUMMARY OF RECEPTOR RISKS AND HAZARDS FOR COPCs
REASONABLE MAXIMUM EXPOSURE
The Dean Company
Scenario Timeframe: Future
Receptor Population: Resident
Receptor Age: Child/Adult
Medium Exposure Exposure Chemical Carcinogenic Risk Non-Carcinogenic Hazard Quotient
Medium Point of Potential
Concern Ingestion Inhalation Dermal External Exposure Primary Ingestion Inhalation Dermal Exposure
(Radiation) Routes Total Target Organ(s) Routes Total
Soil Soil Soil at Site 1 4,4'-DDD 2E-07 - - 8E-08 - - 3E-07 - - - - - - - - - -
4,4'-DDE 4E-06 - - 2E-06 - - 6E-06 - - - - - - - - - -
4,4'-DDT 2E-05 - - 7E-06 - - 3E-05 - - - - - - - - - -
Aluminum - - - - - - - - - - - - - - - - - - - -
Manganese - - - - - - - - - - - - - - - - - - - -
Thallium - - - - - - - - - - - - - - - - - - - -
Chemical Total 2E-05 - - 9E-06 - - 3E-05 - - - - - - - -
Radionuclide Total
Exposure Point Total 3E-05 - -
Exposure Medium Total 3E-05 - -
Soil Total 3E-05 - -
Receptor Total 3E-05 - -
Total Risk Across All Media 3E-05 Total Hazard Across All Media - -
Note: Child/Adult cancer risk was calculated using age-adjusted exposure factor values.

Page 9 - 1
Example Scenario No. 9Transfer of Contaminants Through Multiple Media (Planning Table 1)
Scenario Description: The risk assessment evaluates the potential adverse effects from contaminants insoil that is taken up by plants and then taken up by an animal that is then ingested by human receptors.
Planning Table Issues Associated with this Scenario:
1. How can Planning Table 1 accommodate this three-way transfer?Planning Table 1 can accommodate this scenario as follows:
Medium: SoilExposure Medium: Animal TissueExposure Point: Beef from cattle grazing in field
This example scenario assumes that only the first and last media are of interest and noevaluation is needed for intermediate media. Consult with the EPA Risk Assessor to determine ifscreening is to be conducted on intermediate media (e.g., in an exposure scenario in which acontaminant moves from soil to plant tissue to animal tissue, whether an evaluation should beconducted for the intermediate plant tissue step).

Page 1 of 1 December 2001
EXAMPLE SCENARIO 9
TABLE 1
SELECTION OF EXPOSURE PATHWAYS
The Dean Company
Scenario Medium Exposure Exposure Receptor Receptor Exposure Type of Rationale for Selection or Exclusion
Timeframe Medium Point Population Age Route Analysis of Exposure Pathway
Timeframe Soil Animal Tissue (1) Beef from cattle grazing infield Population 1 Age 1 Route 1 Quant Rationale
Age 2 Route 1 Quant Rationale
Population 2 Age 1 Route 1 Quant Rationale
Age 2 Route 1 Quant Rationale
(1) Modeled via plant uptake from soil and beef cattle ingestion of plants. See Appendix x for full details of modeling.

December 2001 Page 10 - 1
Example Scenario No. 10Lead Data Example (Lead Worksheets)
Scenario Description: Lead is present in site soil and the child and adult lead models were used toevaluate blood lead levels. The standard tables do not accommodate lead model results.
Planning Table Issues Associated with this Scenario:
1. Since there are no standard tables that accommodate lead, how should lead results be presented?The Lead Worksheets should be completed to demonstrate the evaluation performed andthe results of analysis.
Examples of completed Lead Worksheets follow.

1. Attach the ALM spreadsheet output file upon which the Risk Based Remediation Goal (RBRG) was based and descriptionof rationale for parameters used. For additional information, see www.epa.gov/superfund/programs/lead
December 2001
TABLE Y (RAGS D ADULT LEAD WORKSHEET)Site Name: Example Site, Slag Pile 2
Receptor: Adult Worker, Exposure to Media as Described
1. Lead Screening Questions
MediumLead Concentrationused in Model Run
Basis for LeadConcentration UsedFor Model Run
Lead ScreeningConcentration Basis for Lead Screening Level
Value Units Value Units
Soil 2000 mg/kg Average DetectedValue 750 mg/kg Recommended Soil Screening Level
2. Lead Model QuestionsQuestion Response
What lead model was used? Provide reference and version EPA Interim Adult Lead Model (1996)
If the EPA Adult Lead Model (ALM) was not used provide rationale formodel selected.
n/a
Where are the input values located in the risk assessment report? Located in Appendix 5
What statistics were used to represent the exposure concentration termsand where are the data on concentrations in the risk assessment thatsupport use of these statistics?
Mean soil concentration. Data are Located inAppendix 2
What was the point of exposure and location?OU 3 Slag pile area
Where are the output values located in the risk assessment report? Located in Appendix 5
What GSD value was used? If this is outside the recommended range of1.8-2.1, provide rationale in Appendix <Y>. 1.8
What baseline blood lead concentration (PbB0) value was used? If this isoutside the default range of 1.7 to 2.2 provide rationale in Appendix <Y>. 2.0
Was the default exposure frequency (EF; 219 days/year) used?Yes
Was the default BKSF used (0.4 ug/dL per ug/day) used?Yes
Was the default absorption fraction (AF; 0.12) used?Yes
Was the default soil ingestion rate (IR; 50 mg/day) used? Yes
If non-default values were used for any of the parameters listed above, where are the rationale for the values located in the risk assessment report? Located in Appendix 5
3. Final ResultMedium Result Comment/RBRG 1
Soil
2000 ppm lead in soil results in >5% of receptors above a blood lead levelof 10 ug/d and geometric mean blood lead = 11.6 ug/dL. This exceeds theblood lead goal as described in the 1994 OSWER Directive of no morethan 5% of children (fetuses of exposed women) exceeding 10 ug/dLblood lead.
1500 ppm

1. Attach the IEUBK text output file and graph upon which the PRG was based as an appendix. For additionalinformation, see www.epa.gov/superfund/programs/lead
December 2001
TABLE X (RAGS D IEUBK LEAD WORKSHEET)Site Name: Example Site, Neighborhood 2
Receptor: Future Residential Child (Age 0 to 84 Months) Exposure to Media as Described
1. Lead Screening Questions
MediumLead Concentration used inModel Run
Basis for LeadConcentration Usedfor Model Run
Lead ScreeningConcentration Basis for Lead Screening Level
Value Units Value Units
Soil 1000 mg/kg Average DetectedValue 400 mg/kg Recommended Soil Screening Level
Water 4 ug/L Average DetectedValue 15 ug/L Recommended Drinking Water
Action Level
2. Lead Model Questions
Question Response for Residential Lead Model
What lead model (version and date) was used? IEUBK version 0.99d, 1994
Where are the input values located in the risk assessment report? Located in Appendix 3
What range of media concentrations were used for the model?Refer to sampling data table 2
What statistics were used to represent the exposure concentrationterms and where are the data on concentrations in the riskassessment that support use of these statistics?
Mean value of backyard and side yard. Data presented inAppendix 3.
Was soil sample taken from top 2 cm? If not, why?Yes
Was soil sample sieved? What size screen was used? If notsieved, provide rationale.
Yes, 250 um
What was the point of exposure/location?Residential yard in Neighborhood 2: back yard and side yardcomposite.
Where are the output values located in the risk assessmentreport? Located in Appendix 3
Was the model run using default values only? Yes, except for soil and dust concentration data.
Was the default soil bioavailability used? Yes. Default is 30%
Was the default soil ingestion rate used?Yes. Default values for 7 age groups are 85, 135, 135, 100, 090,and 85 mg/day
If non-default values were used, where are the rationale for thevalues located in the risk assessment report? Located in Appendix 3
3. Final Result
Medium Result Comment/PRG 1
Soil Input value of 1000 ppm in soil (and MSA derived dust of710 ppm) results in 42.7% of children 0-84 months above ablood lead level of 10 ug/dL. Geometric mean blood lead =9.5 ug/dL. This exceeds the blood lead goal as described inthe 1994 OSWER Directive of no more than 5% of childrenexceeding 10 ug/dL blood lead.
Based on site conditions, a PRG of 354ppm in soil is indicated. This PRG istypically rounded to 400 ppm.

December 2001 Page 11 - 1
Example Scenario No. 11Radiation Data Example
Scenario Description: The site has radiological and chemical waste associated with it and radiologicaland chemical analyses were performed as part of the investigation. Potential adverse health effects willbe evaluated in the risk assessment.
Planning Table Issues Associated with this Scenario:
Since radiological risk assessment uses different methodologies and terminologies than chemical riskassessment, how can the radiological risk assessment data be shown in the Planning Tables?
Planning Table 6.4 (Cancer Toxicity Data - External (Radiation)) and Planning Table 8(Calculation of Radiation Cancer Risks) were developed by the Workgroup. Thecarcinogenic risk sections of Planning Tables 9 and 10 were expanded to include anExternal (Radiation) column. The following radiological risk example includes thesePlanning Tables.
Note: Many of the Example Planning Tables (i.e., those Example Planning Tables that do notspecifically address radionuclides) provided for this Example Scenario are identical to those fromAppendix A.

Page 1 of 1 December 2001
EXAMPLE SCENARIO 11
TABLE 0
SITE RISK ASSESSMENT IDENTIFICATION INFORMATION
The Dean Company
Site Name/OU: The Dean Company
Region: III
EPA ID Number: PAD999999999
State: PA
Status: Fund Lead Remedial Investigation
Federal Facility (Y/N): N
EPA Project Manager: John Smith
EPA Risk Assessor: Jane Doe
Document Author: Mary Smith-Johnson
Document Title: Human Health Risk Assessment for the Dean Company Site
Document Date: August 8, 2001
Comments: This site is contaminated with both chemical and radioactive compounds.

Page 1 of 1 December 2001
EXAMPLE SCENARIO 11
TABLE 1
SELECTION OF EXPOSURE PATHWAYS
The Dean Company
Scenario Medium Exposure Exposure Receptor Receptor Exposure Type of Rationale for Selection or Exclusion
Timeframe Medium Point Population Age Route Analysis of Exposure Pathway
Future Groundwater Groundwater Aquifer 1--Tap Water Resident Adult Dermal Quant Future onsite residents may rely on domestic wells drawing from Aquifer 1.
Ingestion Quant Future onsite residents may rely on domestic wells drawing from Aquifer 1.
Child Dermal Quant Future onsite residents may rely on domestic wells drawing from Aquifer 1.
Ingestion Quant Future onsite residents may rely on domestic wells drawing from Aquifer 1.
Air Water Vapors from Resident Adult Inhalation Quant Future onsite residents may rely on domestic wells drawing from Aquifer 1.
Showerhead Child Inhalation None Children are assumed not to shower.
Soil Soil Soil at Site 1 Resident Adult Dermal Quant Future onsite residents may come into contact with soil.
Ingestion Quant Future onsite residents may ingest soil.
External (Radiation) Quant Future onsite residents may come into contact with soil.
Child Dermal Quant Future onsite residents may come into contact with soil.
Ingestion Quant Future onsite residents may ingest soil.
External (Radiation) Quant Future onsite residents may come into contact with soil.

Page 1 of 1 December 2001
EXAMPLE SCENARIO 11
TABLE 2.1
OCCURRENCE, DISTRIBUTION, AND SELECTION OF CHEMICALS OF POTENTIAL CONCERN
The Dean Company
Scenario Timeframe: Future
Medium: Groundwater
Exposure Medium: Groundwater
Exposure CAS Chemical Minimum Maximum Units Location Detection Range of Concentration Background Screening Potential Potential COPC Rationale for
Point Number Concentration Concentration of Maximum Frequency Detection Used for Value (2) Toxicity Value (3) ARAR/TBC ARAR/TBC Flag Selection or
(Qualifier) (Qualifier) Concentration Limits Screening (1) (N/C) Value Source (Y/N) Deletion (4)
Aquifer 1 - 117817 Bis(2-ethylhexyl)phthalate 2 J 5 J ug/l GW3D 4 / 12 3 - 4 5 NA 4.8 C 6 MCL Y ASL
Tap Water 67663 Chloroform 0.6 J 9 ug/l GW3D 3 / 12 1 - 1 9 NA 0.063 C 100 MCL Y ASL
75150 Carbon Disulfide 0.3 J 4.5 ug/l GW3D 3 / 12 1 - 1 4.5 NA 100 N NA NA N BSL
76448 Heptachlor 2 J 33 J ug/l GW4D 6 / 12 0.01 - 0.01 33 NA 0.015 C 0.4 MCL Y ASL
108883 Toluene 0.1 J 0.2 J ug/l GW3D 3 / 12 1 - 1 0.2 NA 75 N 1000 MCL N BSL
7429905 Aluminum 134 J 1340 ug/l GW3D 2 / 12 29 - 38.2 1340 NA 3700 N 50 - 200 SMCL N BSL
7440393 Barium 65 J 489 ug/l GW1D 6 / 12 0.2 - 1 489 NA 260 N 2000 MCL Y ASL
7440417 Beryllium 0.2 K 1.5 K ug/l GW2D 3 / 12 0.1 - 1 1.5 NA 7.3 N 4 MCL N BSL
7439921 Lead 6 J 35 J ug/l GW3D 4 / 12 0.1 - 1 35 NA 15 15 MCL Y ASL
7439965 Manganese 1900 12500 ug/l GW1D 6 / 12 0.3 - 1 12500 NA 73 N 50 SMCL Y ASL
7440020 Nickel 0.9 J 1.5 J ug/l GW4D 3 / 12 0.9 - 7 1.5 NA 73 N NA NA N BSL
7440611 Uranium 50 500 ug/l GW1D 12 / 12 1 - 2 500 NA 11 N NA NA Y ASL
7440611 Uranium 238 0.23 80 pCi/l GW1D 12 / 12 NA NA NA NA NA NA Y DET
13982-63-3 Radium 226 0.2 11 pCi/l GW1D 12 / 12 NA NA NA NA 5 MCL Y DET
(1) Maximum concentration used for screening chemicals. No screening was conducted for radionuclides; Definitions: NA = Not Applicable
all radionuclides detected are selected as COPCs. MCL = Maximum Contaminant Level
(2) To date, no background study has been completed. SMCL = Secondary Maximum Contaminant Level
(3) All compounds were screened against the Risk-Based Concentration (RBC) Table, U.S. EPA Region III, J = Estimated Value
May 8, 2001 for tap water (cancer benchmark = 1E-06; HQ = 0.1). Lead was screened against the K = Estimated Value - Biased High
action level of 15 ug/l. C = Carcinogen
(4) Rationale Codes: N = Noncarcinogen
Selection Reason: Above Screening Level (ASL)
Detected at Site (DET)
Deletion Reason: Below Screening Level (BSL)

Page 1 of 1 December 2001
EXAMPLE SCENARIO 11
TABLE 2.2
OCCURRENCE, DISTRIBUTION, AND SELECTION OF CHEMICALS OF POTENTIAL CONCERN
The Dean Company
Scenario Timeframe: Future
Medium: Groundwater
Exposure Medium: Air
Exposure CAS Chemical Minimum Maximum Units Location Detection Range of Concentration Background Screening Potential Potential COPC Rationale for
Point Number Concentration Concentration of Maximum Frequency Detection Used for Value (2) Toxicity Value (3) ARAR/TBC ARAR/TBC Flag Selection or
(Qualifier) (Qualifier) Concentration Limits Screening (1) (N/C) Value Source (Y/N) Deletion (4)
Water Vapors 117817 Bis(2-ethylhexyl)phthalate 2 J 5 J ug/l GW3D 4 / 12 3 - 4 5 NA 4.8 C 6 MCL Y ASL
from SHowerhead 67663 Chloroform 0.6 J 9 ug/l GW3D 3 / 12 1 - 1 9 NA 0.063 C 100 MCL Y ASL
75150 Carbon Disulfide 0.3 J 4.5 ug/l GW3D 3 / 12 1 - 1 4.5 NA 100 N NA NA N BSL
76448 Heptachlor 2 J 33 J ug/l GW4D 6 / 12 0.01 - 0.01 33 NA 0.015 C 0.4 MCL Y ASL
108883 Toluene 0.1 J 0.2 J ug/l GW3D 3 / 12 1 - 1 0.2 NA 75 N 1000 MCL N BSL
7429905 Aluminum 134 J 1340 ug/l GW3D 2 / 12 29 - 38.2 1340 NA 3700 N 50 - 200 SMCL N BSL
7440393 Barium 65 J 489 ug/l GW1D 6 / 12 0.2 - 1 489 NA 260 N 2000 MCL Y ASL
7440417 Beryllium 0.2 K 1.5 K ug/l GW2D 3 / 12 0.1 - 1 1.5 NA 7.3 N 4 MCL N BSL
7439921 Lead 6 J 35 J ug/l GW3D 4 / 12 0.1 - 1 35 NA 15 15 MCL Y ASL
7439965 Manganese 1900 12500 ug/l GW1D 6 / 12 0.3 - 1 12500 NA 73 N 50 SMCL Y ASL
7440020 Nickel 0.9 J 1.5 J ug/l GW4D 3 / 12 0.9 - 7 1.5 NA 73 N NA NA N BSL
7440611 Uranium 50 500 ug/l GW1D 12 / 12 1 - 2 500 NA 11 N NA NA Y ASL
7440611 Uranium 238 0.23 80 pCi/l GW1D 12 / 12 NA NA NA NA NA NA Y DET
13982-63-3 Radium 226 0.2 11 pCi/l GW1D 12 / 12 NA NA NA NA 5 MCL Y DET
(1) Maximum concentration used for screening chemicals. No screening was conducted for radionuclides; Definitions: NA = Not Applicable
all radionuclides detected are selected as COPCs. MCL = Maximum Contaminant Level
(2) To date, no background study has been completed. SMCL = Secondary Maximum Contaminant Level
(3) All compounds were screened against the Risk-Based Concentration (RBC) Table, U.S. EPA Region III, J = Estimated Value
May 8, 2001 for tap water (cancer benchmark = 1E-06; HQ = 0.1). Lead was screened against the K = Estimated Value - Biased High
action level of 15 ug/l. C = Carcinogen
(4) Rationale Codes: N = Noncarcinogen
Selection Reason: Above Screening Level (ASL)
Detected at Site (DET)
Deletion Reason: Below Screening Level (BSL)

Page 1 of 1 December 2001
EXAMPLE SCENARIO 11
TABLE 2.3
OCCURRENCE, DISTRIBUTION, AND SELECTION OF CHEMICALS OF POTENTIAL CONCERN
The Dean Company
Scenario Timeframe: Future
Medium: Soil
Exposure Medium: Soil
Exposure CAS Chemical Minimum Maximum Units Location Detection Range of Concentration Background Screening Potential Potential COPC Rationale for
Point Number Concentration Concentration of Maximum Frequency Detection Used for Value (2) Toxicity Value (3) ARAR/TBC ARAR/TBC Flag Selection or
(Qualifier) (Qualifier) Concentration Limits Screening (1) (N/C) Value Source (Y/N) Deletion (4)
Soil at Site 1 11096825 Aroclor-1260 15 J 110 J ug/kg SS03 6 / 29 33 - 300 110 NA 320 C NA NA N BSL
56553 Benzo(a)anthracene 120 J 230 J ug/kg SS03 16 / 29 330 - 700 230 NA 870 C NA NA N BSL
50328 Benzo(a)pyrene 48 J 70 J ug/kg SS03 17 / 29 30 - 70 70 NA 87 C NA NA N BSL
75150 Carbon Disulfide 2 J 33 ug/kg SB07 4 / 29 10 - 16 33 NA 780000 N NA NA N BSL
72548 4,4'-DDD 1 J 4200 ug/kg SS09 22 / 29 3.3 - 1900 4200 NA 2700 C NA NA Y ASL
72559 4,4'-DDE 0.44 J 7200 J ug/kg SS09 28 / 29 2.2 - 700 7200 NA 1900 C NA NA Y ASL
50293 4,4'-DDT 0.69 J 290000 J ug/kg SB08 29 / 29 3.3 - 700 290000 NA 1900 C NA NA Y ASL
108883 Toluene 1 J 2 J ug/kg SS08 2 / 29 10 - 16 2 NA 1600000 N NA NA N BSL
7429905 Aluminum 1960 21700 mg/kg SB07 29 / 29 6.3 - 11 21700 NA 7800 N NA NA Y ASL
7440417 Beryllium 0.1 J 13.4 mg/kg SS06 23 / 29 0.02 - 0.21 13.4 NA 16 N NA NA N BSL
7439921 Lead 56 J 750 J mg/kg SS03 16 / 29 10 - 16 750 NA 400 NA NA Y ASL
7439965 Manganese 5.9 688 mg/kg SS03 29 / 29 0.05 - 0.5 688 NA 160 N NA NA Y ASL
7782492 Selenium 0.53 J 1 mg/kg SS02 9 / 29 0.43 - 0.75 1 NA 39 N NA NA N BSL
7440611 Uranium 50 700 mg/kg SS03 17 / 29 1 - 2 700 NA 610 N NA NA Y ASL
7440611 Uranium 238 0.3 110 pCi/g SS03 29 / 29 0.2 - 0.3 NA NA NA NA NA Y DET
13982-63-3 Radium 226 0.36 41 pCi/g SS02 29 / 29 0.2 - 0.3 NA NA NA NA NA Y DET
(1) Maximum concentration used for screening chemicals. No screening was conducted for radionuclides; Definitions: NA = Not Applicable
all radionuclides detected are selected as COPCs. J = Estimated Value
(2) To date, no background study has been completed. C = Carcinogen
(3) All compounds were screened against the Risk-Based Concentration (RBC) Table, U.S. EPA Region III, N = Noncarcinogen
May 8, 2001 for residential soil (cancer benchmark = 1E-06; HQ = 0.1). Lead was screened against the
U.S. EPA screening value of 400 mg/kg.
(4) Rationale Codes:
Selection Reason: Above Screening Level (ASL)
Detected at Site (DET)
Deletion Reason: Below Screening Level (BSL)

Page 1 of 1 December 2001
EXAMPLE SCENARIO 11
TABLE 3.1.RME
EXPOSURE POINT CONCENTRATION SUMMARY
REASONABLE MAXIMUM EXPOSURE
The Dean Company
Scenario Timeframe: Future
Medium: Groundwater
Exposure Medium: Groundwater
Maximum
Exposure Point Chemical of Units Arithmetic 95% UCL Concentration Exposure Point Concentration
Potential Concern Mean (N/T) (Qualifier) Value Units Statistic Rationale
Aquifer 1 - Tap Water Bis(2-ethylhexyl)phthalate ug/l 4 5.5 (T) 5 J 5 ug/l Max W-Test (1)
Chloroform ug/l 1.9 14.9 (T) 9 9 ug/l Max W-Test (1)
Heptachlor ug/l 27 30 (T) 33 J 30 ug/l 95% UCL - T W - Test (2)
Barium ug/l 224 2835 (T) 489 489 ug/l Max W-Test (1)
Lead ug/l 21 32 (T) 35 J 32 ug/l 95% UCL - T W - Test (2)
Manganese ug/l 6052 33449 (T) 12500 12500 ug/l Max W-Test (1)
Uranium ug/l 62 375 (T) 500 375 ug/l 95% UCL - T W - Test (2)
Uranium 238 pCi/l 3.2 8.3 (T) 80 8.3 pCi/l 95% UCL - T W - Test (2)
Radium 226 pCi/l 3.5 4 (T) 11 4 pCi/l 95% UCL - T W - Test (2)
Statistics: Maximum Detected Value (Max); 95% UCL of Transformed Data (95% UCL - T) T = Transformed
(1) 95% UCL exceeds maximum detected concentration. Therefore, maximum concentration used for EPC. J = Estimated Value
(2) Shapiro-Wilk W Test indicates data are lognormally transformed.

Page 1 of 1 December 2001
EXAMPLE SCENARIO 11
TABLE 3.2.RME
EXPOSURE POINT CONCENTRATION SUMMARY
REASONABLE MAXIMUM EXPOSURE
The Dean Company
Scenario Timeframe: Future
Medium: Groundwater
Exposure Medium: Air
Maximum
Exposure Point Chemical of Units Arithmetic 95% UCL ConcentrationExposure Point Concentration
Potential Concern Mean (Distribution) (Qualifier) Value Units Statistic Rationale
Water Vapors from Bis(2-ethylhexyl)phthalate ug/l 4 5.5 (T) 5 J 5 ug/l Max W-Test (1)
Showerhead Chloroform ug/l 1.9 14.9 (T) 9 9 ug/l Max W-Test (1)
Heptachlor ug/l 27 30 (T) 33 J 30 ug/l 95% UCL - T W - Test (2)
Statistics: Maximum Detected Value (Max); 95% UCL of Transformed Data (95% UCL - T) T = Transformed
(1) 95% UCL exceeds maximum detected concentration. Therefore, maximum concentration used for EPC. J = Estimated Value
(2) Shapiro-Wilk W Test indicates data are log-normally distributed.

Page 1 of 1 December 2001
EXAMPLE SCENARIO 11
TABLE 3.3.RME
EXPOSURE POINT CONCENTRATION SUMMARY
REASONABLE MAXIMUM EXPOSURE
The Dean Company
Scenario Timeframe: Future
Medium: Soil
Exposure Medium: Soil
Maximum
Exposure Point Chemical of Units Arithmetic 95% UCL ConcentrationExposure Point Concentration
Potential Concern Mean (N/T) (Qualifier) Value Units Statistic Rationale
Soil at Site 1 4,4'-DDD ug/kg 239 452 (T) 4200 452 ug/kg 95 % UCL -T W - Test (2)
4,4'-DDE ug/kg 596 6793 (T) 7200 J 6793 ug/kg 95% UCL - T W - Test (2)
4,4'-DDT ug/kg 11007 28619 (N) 290000 J 28619 ug/kg 95% UCL - N W - Test (1)
Aluminum mg/kg 7450 9964 (T) 21700 9964 mg/kg 95% UCL - T W - Test (2)
Lead mg/kg 210 345 (T) 750 J 345 mg/kg 95% UCL - T W - Test (2)
Manganese mg/kg 116 201 (T) 688 201 mg/kg 95% UCL - T W - Test (2)
Uranium mg/kg 125 675 (T) 700 675 mg/kg 95% UCL - T W - Test (2)
Uranium 238 pCi/g 2.5 3.4 (T) 110 3.4 pCi/g 95% UCL - T W - Test (2)
Radium 226 pCi/g 3.1 3.9 (T) 41 3.9 pCi/g 95 % UCL - T W- Test (2)
Statistics: 95% UCL of Normal Data (95% UCL - N); 95% UCL of Transformed Data (95% UCL - T) N = Normal
(1) Shapiro-Wilk W Test indicates data are normally distributed. T = Transformed
(2) Shapiro-Wilk W Test indicates data are lognormally transformed. J = Estimated Value

Page 1 of 3 December 2001
EXAMPLE SCENARIO 11
TABLE 4.1.RME
VALUES USED FOR DAILY INTAKE CALCULATIONS
REASONABLE MAXIMUM EXPOSURE
The Dean Company
Scenario Timeframe: Future
Medium: Groundwater
Exposure Medium: Groundwater
Exposure Route Receptor Population Receptor Age Exposure Point Parameter Parameter Definition Value Units Rationale/ Intake Equation/
Code Reference Model Name
Ingestion Resident Adult Aquifer 1 - Tap Water CW Chemical Concentration in Water See Table 3.1 mg/l See Table 3.1 Chronic Daily Intake (CDI) (mg/kg/day) =
IR-W Ingestion Rate of Water 2 l/day EPA, 1991 CW x IR-W x EF x ED x 1/BW x 1/AT
EF Exposure frequency 350 days/year EPA, 1991
ED Exposure Duration 24 years EPA, 1991
BW Body Weight 70 kg EPA, 1991
AT-C Averaging Time - Cancer 25,550 days EPA, 1989a
AT-N Averaging Time - Non-Cancer 8,760 days EPA, 1989a
CWR Radionuclide Concentration in Water See Table 3.1 pCi/l See Table 3.1 Intake (pCi) = CWR x IR x EF x ED
IR-W Ingestion Rate of Water 2 l/day EPA, 1991
EF Exposure Frequency 350 days/year EPA, 1991
ED Exposure Duration 24 years EPA, 1991
Child Aquifer 1 - Tap Water CW Chemical Concentration in Water See Table 3.1 mg/l See Table 3.1 CDI (mg/kg/day) =
IR-W Ingestion Rate of Water 1 l/day EPA, 1989b CW x IR-W x EF x ED x 1/BW x 1/AT
EF Exposure frequency 350 days/year EPA, 1991
ED Exposure Duration 6 years EPA, 1991
BW Body Weight 15 kg EPA, 1991
AT-C Averaging Time - Cancer 25,550 days EPA, 1989a
AT-N Averaging Time - Non-Cancer 2,190 days EPA, 1989a
CWR Radionuclide Concentration in Water See Table 3.1 pCi/l See Table 3.1 Intake (pCi) = CWR x IR x EF x ED
IR-W Ingestion Rate of Water 1 l/day EPA, 1991
EF Exposure Frequency 350 days/year EPA, 1991
ED Exposure Duration 6 years EPA, 1991

Page 2 of 3 December 2001
EXAMPLE SCENARIO 11
TABLE 4.1.RME
VALUES USED FOR DAILY INTAKE CALCULATIONS
REASONABLE MAXIMUM EXPOSURE
The Dean Company
Scenario Timeframe: Future
Medium: Groundwater
Exposure Medium: Groundwater
Exposure Route Receptor Population Receptor Age Exposure Point Parameter Parameter Definition Value Units Rationale/ Intake Equation/
Code Reference Model Name
Dermal Resident Adult Aquifer 1 - Tap Water CW Chemical Concentration in Water See Table 3.1 mg/l See Table 3.1 Dermally Absorbed Dose (DAD) (mg/kg-day) =
FA Fraction Absorbed Water Chemical Specific - - EPA, 2001 DA-event x EV x ED x EF x SA x 1/BW x 1/AT
Kp Permeability Constant Chemical Specific cm/hr EPA, 2001 where for organic compounds,
SA Skin Surface Area 18,000 cm2 EPA, 2001 Absorbed Dose per Event (DA-event) (mg/cm2-event) =
tau-event Lag time per event Chemical Specific hours/event EPA, 2001 2 FA x Kp x CW x CF x SQRT{(6 x tau-event x t-event)/pi}
t-event Event Duration 0.58 hours/event EPA, 2001 or
B Ratio of permeability coefficient of a Chemical Specific - - EPA, 2001 DA-event = FA x Kp x CW x {(t-event/(1 + B)) +
compound through the stratum 2 x tau-event x ( (1 + (3 x B) + (3 x B x B))/(1 + B)2)}
corneum relative to its permeability and where for inorganic compounds,
coefficient across the viable DA-event = Kp x CW x CF x t-event
epidermis
EV Event Frequency 1 events/day EPA, 2001
EF Exposure Frequency 350 days/year EPA, 2001
ED Exposure Duration 24 years EPA, 1991
CF Volumetric Conversion Factor for Water 0.001 l/cm3 - -
BW Body Weight 70 kg EPA, 2001
AT-C Averaging Time - Cancer 25,550 days EPA, 2001
AT-N Averaging Time - Non-Cancer 8,760 days EPA, 2001

Page 3 of 3 December 2001
EXAMPLE SCENARIO 11
TABLE 4.1.RME
VALUES USED FOR DAILY INTAKE CALCULATIONS
REASONABLE MAXIMUM EXPOSURE
The Dean Company
Scenario Timeframe: Future
Medium: Groundwater
Exposure Medium: Groundwater
Exposure Route Receptor Population Receptor Age Exposure Point Parameter Parameter Definition Value Units Rationale/ Intake Equation/
Code Reference Model Name
Dermal (continued) Resident (continued) Child Aquifer 1 - Tap Water CW Chemical Concentration in Water See Table 3.1 mg/l See Table 3.1 DAD (mg/kg-day) =
FA Fraction Absorbed Water Chemical Specific - - EPA, 2001 DA-event x EV x ED x EF x SA x 1/BW x 1/AT
Kp Permeability Constant Chemical Specific cm/hr EPA, 2001 where for organic compounds,
SA Skin Surface Area 6,600 cm2 EPA, 2001 DA-event (mg/cm2-event) =
tau-event Lag time per event Chemical Specific hours/event EPA, 2001 2 FA x Kp x CW x CF x SQRT{(6 x tau-event x t-event)/pi}
t-event Event Duration 1 hours/event EPA, 2001 orB Ratio of permeability coefficient of a Chemical Specific - - EPA, 2001 DA-event = FA x Kp x CW x {(t-event/(1 + B)) +
compound through the stratum 2 x tau-event x ( (1 + (3 x B) + (3 x B x B))/(1 + B)2)}
corneum relative to its permeability and where for inorganic compounds,
coefficient across the viable DA-event = Kp x CW x CF x t-event
epidermis
EV Event Frequency 1 events/day EPA, 2001
EF Exposure Frequency 350 days/year EPA, 2001
ED Exposure Duration 6 years EPA, 2001
CF Volumetric Conversion Factor for Water 0.001 l/cm3 - -
BW Body Weight 15 kg EPA, 2001
AT-C Averaging Time - Cancer 25,550 days EPA, 2001
AT-N Averaging Time - Non-Cancer 2,190 days EPA, 2001
EPA 1989a: Risk Assessment Guidance for Superfund. Volume 1: Human Health Evaluation Manual, Part A. OERR EPA/540/1-89/002.
EPA 1989b: Exposure Factors Handbook, July 1989, EPA/600/8-89/043.
EPA 1991: Risk Assessment Guidance for Superfund. Volume 1: Human Health Evaluation Manual - Supplemental Guidance, Standard Default Exposure Factors. Interim Final. OSWER 9285.6-03.
EPA 1992: Dermal Exposure Assessment: Principles and Applications. EPA/600/8-91/011B.
EPA 1997: Exposure Factors Handbook, Volume 1. EPA/600/P-95/002Fa.
EPA 2001: Risk Assessment Guidance for Superfund. Volume 1: Human Health Evaluation Manual (Part E, Supplemental Guidance for Dermal Risk Assessment) Interim.

Page 1 of 1 December 2001
EXAMPLE SCENARIO 11
TABLE 4.2.RME
VALUES USED FOR DAILY INTAKE CALCULATIONS
REASONABLE MAXIMUM EXPOSURE
The Dean Company
Scenario Timeframe: Future
Medium: Groundwater
Exposure Medium: Air
Exposure Route Receptor Population Receptor Age Exposure Point Parameter Parameter Definition Value Units Rationale/ Intake Equation/
Code Reference Model Name
Inhalation (1) Resident Adult Water Vapors from (1) (1) (1) (1) (1) Foster and Chrostowski Model
Showerhead
(1) Refer to the Risk Assessment text for details on the modeled intake methodology and parameters used to calculate modeled intake values for the Foster and Chrostowski Shower Model.

Page 1 of 3 December 2001
EXAMPLE SCENARIO 11
TABLE 4.3.RME
VALUES USED FOR DAILY INTAKE CALCULATIONS
REASONABLE MAXIMUM EXPOSURE
The Dean Company
Scenario Timeframe: Future
Medium: Soil
Exposure Medium: Soil
Exposure Route Receptor Population Receptor Age Exposure Point Parameter Parameter Definition Value Units Rationale/ Intake Equation/
Code Reference Model Name
Ingestion Resident Adult Soil at Site 1 CS Chemical Concentration in Soil See Table 3.3 mg/kg See Table 3.3 Chronic Daily Intake (CDI) (mg/kg-day) =
IR-S Ingestion Rate of Soil 100 mg/day EPA, 1991 CS x IR x FI x EF x ED x CF1 x 1/BW x 1/AT
FI Fraction Ingested 1 - - Professional Judgment
EF Exposure Frequency 350 days/year EPA, 1991
ED Exposure Duration 24 years EPA, 1991
CF1 Conversion Factor 1E-06 kg/mg - -
BW Body Weight 70 kg EPA, 1991
AT-C Averaging Time - Cancer 25,550 days EPA, 1989
AT-N Averaging Time - Non-Cancer 8,760 days EPA, 1989
CSR Radionuclide Concentration in Soil See Table 3.3 pCi/g See Table 3.3 Intake (pCi) = CSR x IR x CF x EF X ED
IR-S Ingestion Rate of Soil 100 mg/day EPA, 1991
EF Exposure Frequency 350 days/year EPA, 1991
ED Exposure Duration 24 years EPA, 1991
CF1 Conversion Factor 1.00E-03 g/mg - -
Child Soil at Site 1 CS Chemical Concentration in Soil See Table 3.3 mg/kg See Table 3.3 CDI (mg/kg-day) =
IR-S Ingestion Rate of Soil 200 mg/day EPA, 1991 CS x IR x FI x EF x ED x CF1 x 1/BW x 1/AT
FI Fraction Ingested 1 - - Professional Judgment
EF Exposure Frequency 350 days/year EPA, 1991
ED Exposure Duration 6 years EPA, 1991
CF1 Conversion Factor 1E-06 kg/mg - -
BW Body Weight 15 kg EPA, 1991
AT-C Averaging Time - Cancer 25,550 days EPA, 1989
AT-N Averaging Time - Non-Cancer 2,190 days EPA, 1989

Page 2 of 3 December 2001
EXAMPLE SCENARIO 11
TABLE 4.3.RME
VALUES USED FOR DAILY INTAKE CALCULATIONS
REASONABLE MAXIMUM EXPOSURE
The Dean Company
Scenario Timeframe: Future
Medium: Soil
Exposure Medium: Soil
Exposure Route Receptor Population Receptor Age Exposure Point Parameter Parameter Definition Value Units Rationale/ Intake Equation/
Code Reference Model Name
Ingestion (continued) Resident (continued) Child (continued) Soil at Site 1 (continued) CSR Radionuclide Concentration in Soil See Table 3.3 pCi/g See Table 3.3 Intake (pCi) = CSR x IR x CF x EF X ED
IR-S Ingestion Rate of Soil 200 mg/day EPA, 1991
EF Exposure Frequency 350 days/year EPA, 1991
ED Exposure Duration 6 years EPA, 1991
CF1 Conversion Factor 1.00E-03 g/mg - -
Dermal Resident Adult Soil at Site 1 CS Chemical Concentration in Soil See Table 3.3 mg/kg See Table 3.3 Dermal Absorbed Dose (DAD) (mg/kg-day) =
CF Conversion Factor 1E-06 kg/mg - - DA-event x EF x ED x EV x SA X 1/BW x 1/AT
SA Skin Surface Area Available for Contact 5,700 cm2 EPA, 2001 where
AF Soil to Skin Adherence Factor 0.07 mg/cm2-event EPA, 2001 Absorbed Dose per Event (DA-event) (mg/cm2-event) =
ABS-d Dermal Absorption Factor chemical-specific unitless EPA, 2001 CS x CF x AF x ABS-d
EV Event Frequency 1 events/day EPA, 2001
EF Exposure Frequency 350 days/year EPA, 2001
ED Exposure Duration 24 years EPA, 1991
BW Body Weight 70 kg EPA, 2001
AT-C Averaging Time - Cancer 25,550 days EPA, 2001
AT-N Averaging Time - Non-Cancer 8,760 days EPA, 2001
Child Soil at Site 1 CS Chemical Concentration in Soil See Table 3.3 mg/kg See Table 3.3 DAD (mg/kg-day) =
CF Conversion Factor 1E-06 kg/mg - - DA-event x EF x ED x EV x SA X 1/BW x 1/AT
SA Skin Surface Area Available for Contact 2,800 cm2 EPA, 2001 where
AF Soil to Skin Adherence Factor 0.2 mg/cm2-event EPA, 2001 DA-event (mg/cm2-event) =
ABS-d Dermal Absorption Factor chemical-specific unitless EPA, 2001 CS x CF x AF x ABS-d
EV Event Frequency 1 events/day EPA, 2001
EF Exposure Frequency 350 days/year EPA, 2001
ED Exposure Duration 6 years EPA, 2001
BW Body Weight 15 kg EPA, 2001
AT-C Averaging Time - Cancer 25,550 days EPA, 2001
AT-N Averaging Time - Non-Cancer 2,190 days EPA, 2001

Page 3 of 3 December 2001
EXAMPLE SCENARIO 11
TABLE 4.3.RME
VALUES USED FOR DAILY INTAKE CALCULATIONS
REASONABLE MAXIMUM EXPOSURE
The Dean Company
Scenario Timeframe: Future
Medium: Soil
Exposure Medium: Soil
Exposure Route Receptor Population Receptor Age Exposure Point Parameter Parameter Definition Value Units Rationale/ Intake Equation/
Code Reference Model Name
External (Radiation) Resident Adult Soil at Site 1 CSR Radionuclide Concentration in Soil See Table 3.3 pCi/g See Table 3.3 External Exposure (pCi-year/g) =
ET Exposure Time 17 hrs/day CSR x ET x EF x {(Fi x GSFi) + (Fo x GSFo)] x ED x CF
EF Exposure Frequency 350 days/year EPA, 1991
Fi Time Fraction Indoors 0.75 - -
Fo Time Fraction Outdoors 0.25 - -
GSFi Gamma Shielding Factor Indoors 0.8 - -
GSFo Gamma Shielding Factor Outdoors 1 - -
ED Exposure Duration 24 years EPA, 1991
CF Conversion Factor 0.000114 years/hr - -
Child Soil at Site 1 CSR Radionuclide Concentration in Soil See Table 3.3 pCi/g See Table 3.3 External Exposure (pCi-year/g) =
ET Exposure Time 17 hrs/day CSR x ET x EF x {(Fi x GSFi) + (Fo x GSFo)] x ED x CF
EF Exposure Frequency 350 days/year EPA, 1991
Fi Time Fraction Indoors 0.875 - -
Fo Time Fraction Outdoors 0.125 - -
GSFi Gamma Shielding Factor Indoors 0.8 - -
GSFo Gamma Shielding Factor Outdoors 1 - -
ED Exposure Duration 6 years EPA, 1991
CF Conversion Factor 0.000114 years/hr - -
EPA 1989: Risk Assessment Guidance for Superfund. Volume 1: Human Health Evaluation Manual, Part A. OERR EPA/540/1-89/002.
EPA 1991: Risk Assessment Guidance for Superfund. Volume 1: Human Health Evaluation Manual - Supplemental Guidance, Standard Default Exposure Factors. Interim Final. OSWER 9285.6-03.
EPA 1995: Assessing Dermal Exposure from Soil, Technical Guidance Manual, Region III, EPA/903-K-95-003.
EPA 1997: Exposure Factors Handbook, Volume 1. EPA/600/P-95/002Fa.
EPA 2001: Risk Assessment Guidance for Superfund. Volume 1: Human Health Evaluation Manual (Part E, Supplemental Guidance for Dermal Risk Assessment) Interim.
NA = Not Available

Page 1 of 1 December 2001
EXAMPLE SCENARIO 11
TABLE 5.1
NON-CANCER TOXICITY DATA -- ORAL/DERMAL
The Dean Company
Chemical Chronic/ Oral RfD Oral Absoprtion Absorbed RfD for Dermal (2) Primary Combined RfD:Target Organ(s)
of Potential Subchronic Efficiency for Dermal (1) Target Uncertainty/Modifying
Concern Value Units Value Units Organ(s) Factors Source(s) Date(s)
(MM/DD/YYYY)
4,4'-DDD NA NA NA 1 NA NA NA NA NA NA
4,4'-DDE NA NA NA 1 NA NA NA NA NA NA
4,4'-DDT Chronic 5.0E-004 mg/kg/day 1 5.0E-004 mg/kg/day Liver 100 IRIS 06/21/2001
4,4'-DDT Subchronic 5.0E-004 mg/kg/day 1 5.0E-004 mg/kg/day Liver 100 HEAST 07/01/1997
Bis(2-ethylhexyl)phthalate Chronic 2.0E-02 mg/kg/day 1 2.0E-02 mg/kg/day Liver 1000 IRIS 06/21/2001
Bis(2-ethylhexyl)phthalate Subchronic 2.0E-02 mg/kg/day 1 2.0E-02 mg/kg/day Liver 1000 HEAST 07/01/1997
Chloroform Chronic 1.0E-02 mg/kg/day 1 1.0E-02 mg/kg/day Liver 1000 IRIS 06/21/2001
Chloroform Subchronic 1.0E-02 mg/kg/day 1 1.0E-02 mg/kg/day Liver 1000 HEAST 07/01/1997
Heptachlor Chronic 5.0E-04 mg/kg/day 1 5.0E-04 mg/kg/day Liver 300 IRIS 06/21/2001
Heptachlor Subchronic 5.0E-04 mg/kg/day 1 5.0E-04 mg/kg/day Liver 300 HEAST 07/01/1997
Aluminum Chronic 1.0E+00 mg/kg/day 1 1.0E+00 mg/kg/day Central Nervous System 100 NCEA 06/21/2001
Barium Chronic 7.0E-02 mg/kg/day 0.07 4.9E-03 mg/kg/day Heart 3 IRIS 02/02/2001
Barium Subchronic 7.0E-02 mg/kg/day 0.07 4.9E-03 mg/kg/day Heart 3 HEAST 07/01/1997
Copper Chronic 3.7E-02 mg/kg/day 1 3.7E-02 mg/kg/day Gastrointestinal NA HEAST 07/01/1997
Copper Subchronic 3.7E-02 mg/kg/day 1 3.7E-02 mg/kg/day Gastrointestinal NA HEAST 07/01/1997
Iron Chronic 3.0E-01 mg/kg/day 1 3.0E-01 mg/kg/day Gastrointestinal 1 NCEA 06/21/2001
Lead NA NA NA NA NA NA NA NA NA NA
Manganese (nonfood) Chronic 2.0E-02 mg/kg/day 0.04 8.0E-04 mg/kg/day Central Nervous System 1 IRIS 06/21/2001
Uranium Chronic 3.0E-03 mg/kg/day 1 3E-003 mg/kg/day Kidney 1000 IRIS 06/21/2001
(1) Source: Risk Assessment Guidance for Superfund. Volume 1: Human Health Definitions: NA = Not Available
Evaluation Manual (Part E, Supplemental Guidance for Dermal Risk Assessment) Interim. IRIS = Integrated Risk Information System
Section 4.2 and Exhibit 4-1. HEAST = Health Effects Assessment Summary Table, July 1997
(2) See Risk Assessment text for the derivation of the "Absorbed RfD for Dermal". NCEA = National Center for Environmental Assessment

Page 1 of 1 December 2001
EXAMPLE SCENARIO 11
TABLE 5.2
NON-CANCER TOXICITY DATA -- INHALATION
The Dean Company
Chemical Chronic/ Inhalation RfC Extrapolated RfD (1) Primary Combined RfC : Target Organ
of Potential Subchronic Target Uncertainty/Modifying
Concern Value Units Value Units Organ(s) Factors Source(s) Date(s)
(MM/DD/YYYY)
4,4'-DDD NA NA NA NA NA NA NA NA NA
4,4'-DDE NA NA NA NA NA NA NA NA NA
4,4'-DDT NA NA NA NA NA NA NA NA NA
Bis(2-ethylhexyl)phthalate NA NA NA NA NA NA NA NA NA
Chloroform Chronic 3.0E-04 mg/m3 8.6E-05 mg/kg/day Nasal 1000 NCEA 06/21/2001
Chloroform Subchronic 3.0E-03 mg/m3 8.6E-4 mg/kg/day Nasal 100 NCEA 06/21/2001
Heptachlor NA NA NA NA NA NA NA NA NA
Aluminum Chronic 5.0E-03 mg/m3 1.4E-03 mg/kg/day Central Nervous System 300 NCEA 06/21/2001
Barium Chronic 5.0E-04 mg/m3 1.4E-04 mg/kg/day Fetus 1000 HEAST 07/01/1997
Barium Subchronic 5.0E-03 mg/m3 1.4E-03 mg/kg/day Fetus 100 HEAST 07/01/1997
Copper NA NA NA NA NA NA NA NA NA
Iron NA NA NA NA NA NA NA NA NA
Lead NA NA NA NA NA NA NA NA NA
Manganese (nonfood) Chronic 5.0E-05 mg/m3 1.4E-05 mg/kg/day Central Nervous System 1000 IRIS 06/21/2001
Uranium NA NA NA NA NA NA NA NA NA
(1) See Risk Assessment text for the derivation of the "Extrapolated RfD". Definitions: NA = Not Available
IRIS = Integrated Risk Information System
HEAST = Health Effects Assessment Summary Table, July 1997
NCEA = National Center for Environmental Assessment

Page 1 of 1 December 2001
EXAMPLE SCENARIO 11
TABLE 5.3
NON-CANCER TOXICITY DATA -- SPECIAL CASE CHEMICALS
The Dean Company
Chemical Chronic/ Parameter Primary Target Combined Parameter:Target Organ(s)
of Potential Subchronic Organ(s) Uncertainty/Modifying
Concern Name Value Units Factors Source(s) Date(s)
(MM/DD/YYYY)
Not Applicable
There are no special case chemicals in this risk assessment. As a result, the table is blank.

Page 1 of 1 December 2001
EXAMPLE SCENARIO 11
TABLE 6.1
CANCER TOXICITY DATA -- ORAL/DERMAL
The Dean Company
Chemical Oral Cancer Slope Factor Oral Absorption Absorbed Cancer Slope Factor Weight of Evidence/ Oral CSF
of Potential Efficiency for Dermal (1) for Dermal (2) Cancer Guideline
Concern Value Units Value Units Description Source(s) Date(s)
(MM/DD/YYYY)
4,4'-DDD 2.4E-01 1/mg/kg/day 1 2.4E-01 1/mg/kg/day B2 IRIS 06/21/2001
4,4'-DDE 3.4E-01 1/mg/kg/day 1 3.4E-01 1/mg/kg/day B2 IRIS 06/21/2001
4,4'-DDT 3.4E-001 1/mg/kg/day 1 3.4E-001 1/mg/kg/day B2 IRIS 06/21/2001
Bis(2-ethylhexyl)phthalate 1.4E-02 1/mg/kg/day 1 1.4E-02 1/mg/kg/day B2 IRIS 06/21/2001
Chloroform 6.1E-03 1/mg/kg/day 1 6.1E-03 1/mg/kg/day B2 IRIS 06/21/2001
Heptachlor 4.5E+00 1/mg/kg/day 1 4.5E+00 1/mg/kg/day B2 IRIS 06/21/2001
Aluminum NA NA 1 NA NA NA NA NA
Barium NA NA 0.07 NA NA NA NA NA
Copper NA NA 1 NA NA NA NA NA
Iron NA NA 1 NA NA NA NA NA
Lead NA NA NA NA NA NA NA NA
Manganese (nonfood) NA NA 0.04 NA NA NA NA NA
Uranium NA NA NA NA NA NA NA NA
(1) Source: Risk Assessment Guidance for Superfund. Volume 1: Human Health Definitions: NA = Not Available
Evaluation Manual (Part E, Supplemental Guidance for Dermal Risk Assessment) Interim. IRIS = Integrated Risk Information System
Section 4.2 and Exhibit 4-1. B2 = Probable Human Carcinogen - indicates sufficient evidence
(2) See Risk Assessment text for the derivation of the "Absorbed Cancer Slope Factor for Dermal". in animals and inadequate or no evidence in humans

Page 1 of 1 December 2001
EXAMPLE SCENARIO 11
TABLE 6.2
CANCER TOXICITY DATA -- INHALATION
The Dean Company
Chemical Unit Risk Inhalation Cancer Slope Factor Weight of Evidence/ Unit Risk : Inhalation CSF
of Potential Cancer Guideline
Concern Value Units Value Units Description Source(s) Date(s)
(MM/DD/YYYY)
4,4'-DDD NA NA NA NA NA NA NA
4,4-DDE NA NA NA NA NA NA NA
4,4'-DDT 9.7E-005 1/ug/m3 3.4E-001 1/mg/kg/day B2 IRIS 06/21/2001
Bis(2-ethylhexyl)phthalate NA NA NA NA NA NA NA
Chloroform 2.3E-05 1/ug/m3 8.1E-02 1/mg/kg/day B2 IRIS 06/21/2001
Heptachlor 1.3E-03 1/ug/m3 4.5E+00 1/mg/kg/day B2 IRIS 06/21/2001
Aluminum NA NA NA NA NA NA NA
Barium NA NA NA NA NA NA NA
Copper NA NA NA NA NA NA NA
Iron NA NA NA NA NA NA NA
Lead NA NA NA NA NA NA NA
Manganese (nonfood) NA NA NA NA NA NA NA
Uranium NA NA NA NA NA NA NA
Definitions: NA = Not Available
IRIS = Integrated Risk Information System
B2 = Probable Human Carcinogen - indicates sufficient evidence
in animals and inadequate or no evidence in humans

Page 1 of 1 December 2001
EXAMPLE SCENARIO 11
TABLE 6.3
CANCER TOXICITY DATA -- SPECIAL CASE CHEMICALS
The Dean Company
Chemical Parameters Source(s) Date(s)
of Potential (MM/DD/YYYY)
Concern Name Value Units
Not Applicable
There are no special case chemicals in this risk assessment. As a result, this table is blank.

Page 1 of 1 December 2001
EXAMPLE SCENARIO 11
TABLE 6.4
CANCER TOXICITY DATA -- EXTERNAL (RADIATION)
The Dean Company
Chemical Cancer Slope Factor Source(s) Date(s)
of Potential (MM/DD/YYYY)
Concern Value Units
Uranium 238 6.2E-011 Risk/pCi HEAST 07/01/1997
5.3E-008 Risk/year per pCi/g soil HEAST 07/01/1997
Radium 226 3.0E-010 Risk/pCi HEAST 07/01/1997
6.7E-006 Risk/year per pCi/g soil HEAST 07/01/1997
HEAST = Health Effects Assessment Summary Table, July 1997

Page 1 of 2 December 2001
EXAMPLE SCENARIO 11
TABLE 7.1.RME
CALCULATION OF CHEMICAL CANCER RISKS AND NON-CANCER HAZARDS
REASONABLE MAXIMUM EXPOSURE
The Dean Company
Scenario Timeframe: Future
Receptor Population: Resident
Receptor Age: Adult
Medium Exposure Medium Exposure Point Exposure Route Chemical of EPC Cancer Risk Calculations Non-Cancer Hazard CalculationsPotential Concern Value Units Intake/Exposure Concentration CSF/Unit Risk Cancer Risk Intake/Exposure Concentration RfD/RfC Hazard Quotient
Value Units Value Units Value Units Value Units
Groundwater Groundwater Aquifer 1 - Tap Water Ingestion Bis(2-ethylhexyl)phthalate 0.005 mg/l 4.7E-005 mg/kg/day 1.4E-002 1/mg/kg/day 7E-007 1.4E-004 mg/kg/day 2.0E-002 mg/kg/day 0.007
Chloroform 0.009 mg/l 8.5E-005 mg/kg/day 6.1E-003 1/mg/kg/day 5E-007 2.5E-004 mg/kg/day 1.0E-002 mg/kg/day 0.03
Heptachlor 0.03 mg/l 2.8E-004 mg/kg/day 4.5E+000 1/mg/kg/day 1E-003 8.1E-004 mg/kg/day 5.0E-004 mg/kg/day 2
Barium 0.489 mg/l 4.6E-003 mg/kg/day NA NA NA 1.3E-002 mg/kg/day 7.0E-002 mg/kg/day 0.2
Lead (1) - - - - - - - - - - - - - - - - - - - - - - - -
Manganese 12.5 mg/l 1.2E-001 mg/kg/day NA NA NA 3.4E-001 mg/kg/day 2.0E-002 mg/kg/day 17
Uranium 0.375 mg/l 3.8E-05 mg/kg/day NA NA NA 1.0E-02 mg/kg/day 3.0E-03 mg/kg/day 3
Exp. Route Total 1E-003 22
Dermal Bis(2-ethylhexyl)phthalate 0.005 mg/l 7.2E-005 mg/kg/day 1.4E-002 1/mg/kg/day 1E-006 2.1E-004 mg/kg/day 2.2E-002 mg/kg/day 0.01
Chloroform 0.009 mg/l 1.7E-004 mg/kg/day 6.1E-003 1/mg/kg/day 1E-006 4.9E-004 mg/kg/day 1.0E-002 mg/kg/day 0.05
Heptachlor 0.03 mg/l 1.3E-004 mg/kg/day 4.5E+000 1/mg/kg/day 6E-004 3.9E-004 mg/kg/day 5.0E-004 mg/kg/day 0.8
Barium 0.489 mg/l NA NA NA NA NA NA NA NA NA NA
Lead (1) - - - - - - - - - - - - - - - - - - - - - - - -
Manganese 12.5 mg/l NA NA NA NA NA NA NA NA NA NA
Uranium 0.375 mg/l NA NA NA NA NA NA NA NA NA NA
Exp. Route Total 6E-004 0.9
Exposure Point Total 2E-003 23
Exposure Medium Total 2E-003 23
Air Water Vapors from Inhalation Bis(2-ethylhexyl)phthalate 0.005 mg/l 2.3E-006 mg/kg/day NA NA NA 3.6E-006 mg/kg/day NA NA NA
Showerhead Chloroform 0.009 mg/l 1.3E-004 mg/kg/day 8.1E-002 1/mg/kg/day 1E-005 3.9E-004 mg/kg/day 8.6E-005 mg/kg/day 5
Heptachlor 0.03 mg/l 2.6E-004 mg/kg/day 4.5E+000 1/mg/kg/day 1E-003 7.7E-004 mg/kg/day NA NA NA
Exp. Route Total 1E-003 5
Exposure Point Total 1E-003 5
Exposure Medium Total 1E-003 5
Groundwater Total 3E-003 28

Page 2 of 2 December 2001
EXAMPLE SCENARIO 11
TABLE 7.1.RME
CALCULATION OF CHEMICAL CANCER RISKS AND NON-CANCER HAZARDS
REASONABLE MAXIMUM EXPOSURE
The Dean Company
Scenario Timeframe: Future
Receptor Population: Resident
Receptor Age: Adult
Medium Exposure Medium Exposure Point Exposure Route Chemical of EPC Cancer Risk Calculations Non-Cancer Hazard CalculationsPotential Concern Value Units Intake/Exposure Concentration CSF/Unit Risk Cancer Risk Intake/Exposure Concentration RfD/RfC Hazard Quotient
Value Units Value Units Value Units Value Units
Soil Soil Soil at Site 1 Ingestion 4,4'-DDD 0.452 mg/kg 2.1E-07 mg/kg/day 2.4E-01 1/mg/kg/day 5E-08 6.2E-07 mg/kg/day NA NA NA
4,4'-DDE 6.8 mg/kg 3.2E-06 mg/kg/day 3.4E-001 1/mg/kg/day 1E-06 9.3E-06 mg/kg/day NA NA NA
4,4'-DDT 28.6 mg/kg 1.3E-005 mg/kg/day 3.4E-001 1/mg/kg/day 5E-06 3.9E-05 mg/kg/day 5.0E-04 mg/kg/day 0.08
Aluminum 9964 mg/kg 4.7E-003 mg/kg/day NA NA NA 1.4E-02 mg/kg/day 1.0E+00 mg/kg/day 0.01
Lead (1) - - - - - - - - - - - - - - - - - - - - - - - -
Manganese 201 mg/kg 9.5E-005 mg/kg/day NA NA NA 2.8E-04 mg/kg/day 1.4E-01 mg/kg/day 0.002
Uranium 675 mg/kg 3.2E-004 mg/kg/day NA NA NA 9.2E-04 mg/kg/day 3.0E-03 mg/kg/day 0.3
Exp. Route Total 6E-06 0.4
Dermal 4,4'-DDD 0.452 mg/kg NA NA NA NA NA NA NA NA NA NA
4,4'-DDE 6.8 mg/kg NA NA NA NA NA NA NA NA NA NA
4,4'-DDT 28.6 mg/kg 1.6E-006 mg/kg/day 3.4E-001 1/mg/kg/day 5E-007 4.7E-06 mg/kg/day 5.0E-04 mg/kg/day 0.009
Aluminum 9964 mg/kg NA NA NA NA NA NA NA NA NA NA
Lead (1) - - - - - - - - - - - - - - - - - - - - - - - -
Manganese 201 mg/kg NA NA NA NA NA NA NA NA NA NA
Uranium 675 mg/kg NA NA NA NA NA NA NA NA NA NA
Exp. Route Total 5E-07 0.009
Exposure Point Total 7E-006 0.4
Exposure Medium Total 7E-006 0.4
Soil Total 7E-006 0.4
Total of Receptor Risks Across All Media 3E-003 Total of Receptor Hazards Across All Media 28
(1) Lead is evaluated for the resident using the IEUBK model. See Risk Assessment text for discussion of results and appendix for the lead modeling run results.

Page 1 of 2 December 2001
EXAMPLE SCENARIO 11
TABLE 7.2.RME
CALCULATION OF CHEMICAL CANCER RISKS AND NON-CANCER HAZARDS
REASONABLE MAXIMUM EXPOSURE
The Dean Company
Scenario Timeframe: Future
Receptor Population: Resident
Receptor Age: Child
Medium Exposure Medium Exposure Point Exposure Route Chemical of EPC Cancer Risk Calculations Non-Cancer Hazard CalculationsPotential Concern Value Units Intake/Exposure Concentration CSF/Unit Risk Cancer Risk Intake/Exposure Concentration RfD/RfC Hazard Quotient
Value Units Value Units Value Units Value UnitsGroundwater Groundwater Aquifer 1 - Tap Water Ingestion Bis(2-ethylhexyl)phthalate 0.005 mg/l 2.7E-005 mg/kg/day 1.4E-002 1/mg/kg/day 4E-007 3.2E-004 mg/kg/day 2.0E-002 mg/kg/day 0.02
Chloroform 0.009 mg/l 4.9E-005 mg/kg/day 6.1E-003 1/mg/kg/day 3E-007 5.8E-004 mg/kg/day 1.0E-002 mg/kg/day 0.06
Heptachlor 0.03 mg/l 1.6E-004 mg/kg/day 4.5E+000 1/mg/kg/day 7E-004 1.9E-003 mg/kg/day 5.0E-004 mg/kg/day 4
Barium 0.489 mg/l 2.7E-003 mg/kg/day NA NA NA 3.1E-002 mg/kg/day 7.0E-002 mg/kg/day 0.4
Lead (1) - - - - - - - - - - - - - - - - - - - - - - - -
Manganese 12.5 mg/l 6.8E-002 mg/kg/day NA NA NA 8.0E-001 mg/kg/day 2.0E-002 mg/kg/day 40
Uranium mg/l 2.1E-003 mg/kg/day NA NA NA 2.4E-002 mg/kg/day 3.0E-003 mg/kg/day 8
Exp. Route Total 7E-004 52
Dermal Bis(2-ethylhexyl)phthalate 0.005 mg/l 3.1E-005 mg/kg/day 1.4E-002 1/mg/kg/day 4E-007 3.6E-004 mg/kg/day 2.2E-002 mg/kg/day 0.02
Chloroform 0.009 mg/l 7.2E-005 mg/kg/day 6.1E-003 1/mg/kg/day 4E-007 8.4E-004 mg/kg/day 1.0E-002 mg/kg/day 0.08
Heptachlor 0.03 mg/l 5.7E-005 mg/kg/day 4.5E+000 1/mg/kg/day 3E-004 6.7E-004 mg/kg/day 5.0E-004 mg/kg/day 1
Barium 0.489 mg/l NA NA NA NA NA NA NA NA NA NA
Lead (1) - - - - - - - - - - - - - - - - - - - - - - - -
Manganese 12.5 mg/l NA NA NA NA NA NA NA NA NA NA
Uranium mg/l NA NA NA NA NA NA NA NA NA NA
Exp. Route Total 3E-004 1
Exposure Point Total 1E-003 1
Exposure Medium Total 1E-003 53
Groundwater Total 1E-003 53
Soil Soil Soil at Site 1 Ingestion 4,4'-DDD 0.452 mg/kg 5.0E-07 mg/kg/day 2.4E-01 1/mg/kg/day 1E-07 5.8E-06 mg/kg/day NA NA NA
4,4'-DDE 6.8 mg/kg 7.4E-06 mg/kg/day 3.4E-001 1/mg/kg/day 3E-06 8.7E-05 mg/kg/day NA NA NA
4,4'-DDT 28.6 mg/kg 3.1E-005 mg/kg/day 3.4E-001 1/mg/kg/day 1E-005 3.7E-004 mg/kg/day 5.0E-04 mg/kg/day 0.7
Aluminum 9964 mg/kg 1.1E-002 mg/kg/day NA NA NA 1.3E-001 mg/kg/day 1.0E+00 mg/kg/day 0.1
Lead (1) - - - - - - - - - - - - - - - - - - - - - - - -
Manganese 201 mg/kg 2.2E-004 mg/kg/day NA NA NA 2.6E-003 mg/kg/day 1.4E-01 mg/kg/day 0.02
Uranium mg/kg 7.4E-004 mg/kg/day NA NA NA 8.6E-003 mg/kg/day 3.0E-003 mg/kg/day 3
Exp. Route Total 1E-005 4

Page 2 of 2 December 2001
EXAMPLE SCENARIO 11
TABLE 7.2.RME
CALCULATION OF CHEMICAL CANCER RISKS AND NON-CANCER HAZARDS
REASONABLE MAXIMUM EXPOSURE
The Dean Company
Scenario Timeframe: Future
Receptor Population: Resident
Receptor Age: Child
Medium Exposure Medium Exposure Point Exposure Route Chemical of EPC Cancer Risk Calculations Non-Cancer Hazard CalculationsPotential Concern Value Units Intake/Exposure Concentration CSF/Unit Risk Cancer Risk Intake/Exposure Concentration RfD/RfC Hazard Quotient
Soil (continued) Soil (continued) Soil at Site 1 (continued) Dermal 4,4'-DDD 0.452 mg/kg NA NA NA NA NA NA NA NA NA NA
4,4'-DDE 6.8 mg/kg NA NA NA NA NA NA NA NA NA NA
4,4'-DDT 28.6 mg/kg 2.6E-006 mg/kg/day 3.4E-001 1/mg/kg/day 9E-007 3.1E-005 mg/kg/day 5.0E-004 mg/kg/day 0.06
Aluminum 9964 mg/kg NA NA NA NA NA NA NA NA NA NA
Lead (1) - - - - - - - - - - - - - - - - - - - - - - - -
Manganese 201 mg/kg NA NA NA NA NA NA NA MA NA NA
Uranium mg/kg NA NA NA NA NA NA NA NA NA NA
Exp. Route Total 9E-07 0.06
Exposure Point Total 1E-005 4Exposure Medium Total 1E-005 4
Soil Total 1E-005 4
Total of Receptor Risks Across All Media 1E-03 Total of Receptor Hazards Across All Media 57
(1) Lead is evaluated for the resident using the IEUBK model. See Risk Assessment text for discussion of results and appendix for the lead modeling run results.

Page 1 of 1 December 2001
EXAMPLE SCENARIO 11
TABLE 8.2
CALCULATION OF RADIATION CANCER RISKS
The Smith Company
Scenario Timeframe: Future
Receptor Population: Resident
Receptor Age: Child
Medium Exposure Medium Exposure Point Exposure Route Radionuclide of Potential Concern EPC Risk Calculation Cancer Risk Calculations
Value Units Approach Intake/External Dose CSF/Conversion Factor Cancer Risk
Value Units Value Units
Groundwater Groundwater Aquifer 1 - Tap Water Ingestion Uranium 238 8.3E+000 pCi/l USEPA RAGS 1.7E+004 pCi 6.2E-011 Risk/pCi 1E-006
Radium 226 4.0E+000 pCi/l USEPA RAGS 8.4E+003 pCi 3.0E-010 Risk/pCi 3E-006
Exp. Route Total 4E-006
Exposure Point Total 4E-006
Exposure Medium Total 4E-006
Groundwater Total 4E-006
Soil Soil Soil at Site 1 Ingestion Uranium 238 3.4E+000 pCi/g USEPA RAGS 1.4E+003 pCi 6.2E-011 Risk/pCi 9E-008
Radium 226 3.9E+000 pCi/g USEPA RAGS 1.6E+003 pCi 3.0E-010 Risk/pCi 5E-007
Exp. Route Total 6E-007
External (Radiation) Uranium 238 3.4E+000 pCi/g USEPA RAGS 1.1E+001 pCi-yr/g 5.3E-008 Risk/yr per pCi/g soil 6E-007
Radium 226 3.9E+000 pCi/g USEPA RAGS 1.3E+001 pCi-yr/g 6.7E-006 Risk/yr per pCi/g soil 9E-005
Exp. Route Total 9E-005
Exposure Point Total 9E-005
Exposure Medium Total 9E-005
Soil Total 9E-005
Total of Receptor Risks Across All Media = 9E-005

Page 1 December 2001
EXAMPLE SCENARIO 11
RADIATION DOSE ASSESSMENT WORKSHEET
The Dean Company
Scenario Timeframe: Future
Receptor Population: Resident
Receptor Age: Adult
Medium Exposure Medium Exposure Point Exposure Route Radionuclide of EPC Dose Internal/External Dose Standard for Conversion Factor Risk
Potential Concern Value Units Approach Value Units Comparison(1) Value Units Source
Groundwater Groundwater Aquifer 1 -- Tap Water Ingestion Uranium 238 8.3E+000 pCi/l NA NA NA NA NA NA NA NA
Radium 226 4.0E+000 pCi/l NA NA NA NA NA NA NA NA
Exp. Route Total NA NA NA
Exposure Point Total NA NA NA
Soil Soil Soil at Site 1 Ingestion Uranium 238 3.4E+000 pCi/g NA NA NA NA NA NA NA NA
Radium 226 3.9E+000 pCi/g NA NA NA NA NA NA NA NA
Exp. Route Total
External (Radiation) Uranium 238 3.4E+000 pCi/g NA NA NA NA NA NA NA NA
Radium 226 3.9E+000 pCi/g NA NA NA NA NA NA NA NA
Exp. Route Total NA NA NA
Exposure Point Total NA NA NA
NA = Not Applicable Total of Receptor Dose Across All Media NA NA Total of Receptor Risks Across All Media NA

Page 1 of 3 December 2001
EXAMPLE SCENARIO 11
TABLE 9.1.RME
SUMMARY OF RECEPTOR RISKS AND HAZARDS FOR COPCs
REASONABLE MAXIMUM EXPOSURE
The Dean Company
Scenario Timeframe: Future
Receptor Population: Resident
Receptor Age: Adult
Medium Exposure Exposure Chemical Carcinogenic Risk Non-Carcinogenic Hazard Quotient
Medium Point of Potential
Concern Ingestion Inhalation Dermal External Exposure Primary Ingestion Inhalation Dermal Exposure
(Radiation) Routes Total Target Organ(s) Routes Total
Groundwater Groundwater Aquifer 1 - Tap Water Bis(2-ethylhexyl)phthalate 7E-07 - - 1E-06 - - 2E-06 Liver 0.007 - - 0.01 0.02
Chloroform 5E-07 - - 1E-06 - - 2E-06 Liver 0.03 - - 0.05 0.08
Heptachlor 1E-03 - - 6E-04 - - 2E-03 Liver 2 - - 0.8 3
Barium - - - - - - - - - - Heart 0.2 - - - - 0.2
Lead (1) - - - - - - - - - - - - - - - - - - - -
Manganese - - - - - - - - - - Central Nervous System 17 - - - - 17
Uranium - - - - - - - - - - Kidneys 3 - - - - 3
Chemical Total 1E-03 - - 6E-04 - - 2E-03 22 - - 0.9 23
Uranium 238 9E-06 - - - - - - 9E-06
Radium 226 2E-05 - - - - - - 2E-05
Radionuclide Total 3E-05 - - - - - - 3E-05
Exposure Point Total 2E-03 23
Exposure Medium Total 2E-03 23
Air Water Vapors from Bis(2-ethylhexyl)phthalate - - - - - - - - - - - - - - - - - - - -
Showerhead Chloroform - - 1E-05 - - - - 1E-05 Liver - - 5 - - 5
Heptachlor - - 1E-03 - - - - 1E-03 - - - - - - - - - -
Barium - - - - - - - - - - - - - - - - - - - -
Lead (1) - - - - - - - - - - - - - - - - - - - -
Manganese - - - - - - - - - - - - - - - - - - - -
Uranium - - - - - - - - - - - - - - - - - - - -
Chemical Total - - 1E-03 - - - - 1E-03 - - 5 - - 5
Radionuclide Total
Exposure Point Total 1E-03 5
Exposure Medium Total 1E-03 5

Page 2 of 3 December 2001
EXAMPLE SCENARIO 11
TABLE 9.1.RME
SUMMARY OF RECEPTOR RISKS AND HAZARDS FOR COPCs
REASONABLE MAXIMUM EXPOSURE
The Dean Company
Scenario Timeframe: Future
Receptor Population: Resident
Receptor Age: Adult
Medium Exposure Exposure Chemical Carcinogenic Risk Non-Carcinogenic Hazard Quotient
Medium Point of Potential
Concern Ingestion Inhalation Dermal External Exposure Primary Ingestion Inhalation Dermal Exposure
(Radiation) Routes Total Target Organ(s) Routes Total
Groundwater Total 3E-03 28

Page 3 of 3 December 2001
EXAMPLE SCENARIO 11
TABLE 9.1.RME
SUMMARY OF RECEPTOR RISKS AND HAZARDS FOR COPCs
REASONABLE MAXIMUM EXPOSURE
The Dean Company
Scenario Timeframe: Future
Receptor Population: Resident
Receptor Age: Adult
Medium Exposure Exposure Chemical Carcinogenic Risk Non-Carcinogenic Hazard Quotient
Medium Point of Potential
Concern Ingestion Inhalation Dermal External Exposure Primary Ingestion Inhalation Dermal Exposure
(Radiation) Routes Total Target Organ(s) Routes Total
Soil Soil Soil at Site 1 4,4'-DDD 5E-08 - - - - - - 5E-08 - - - - - - - - - -
4,4'-DDE 1E-06 - - - - - - 1E-06 - - - - - - - - - -
4,4'-DDT 5E-06 - - 5E-07 - - 6E-06 Liver 0.08 - - 0.009 0.09
Aluminum - - - - - - - - - - Central Nervous System 0.01 - - - - 0.01
Lead (1) - - - - - - - - - - - - - - - - - - - -
Manganese - - - - - - - - - - Central Nervous System 0.002 - - - - 0.002
Uranium - - - - - - - - - - Kidney 0.3 - - - - 0.3
Chemical Total 6E-06 - - 5E-07 - - 7E-06 0.4 - - 0.009 0.4
Uranium 238 2E-07 - - - - 2E-06 2E-06
Radium 226 1E-006 - - - - 4E-04 4E-04
Radionuclide Total 1E-06 4E-04 4E-04
Exposure Point Total 4E-04 0.4
Exposure Medium Total 4E-04 0.4
Soil Total 4E-04 0.4
Receptor Total 3E-03 28
Total Risk Across All Media 3E-03 Total Hazard Across All Media 28
(1) Lead is evaluated for the resident using the IEUBK model. See Risk Assessment text for discussion of results Total Liver HI Across All Media = 8
and appendix for the lead modeling run results. Total Kidney HI Across All Media = 3
Total Central Nervous System HI Across All Media = 17

Page 1 of 2 December 2001
EXAMPLE SCENARIO 11
TABLE 9.2.RME
SUMMARY OF RECEPTOR RISKS AND HAZARDS FOR COPCs
REASONABLE MAXIMUM EXPOSURE
The Dean Company
Scenario Timeframe: Future
Receptor Population: Resident
Receptor Age: Child
Medium Exposure Exposure Chemical Carcinogenic Risk Non-Carcinogenic Hazard Quotient
Medium Point of Potential
Concern Ingestion Inhalation Dermal External Exposure Primary Ingestion Inhalation Dermal Exposure
(Radiation) Routes Total Target Organ(s) Routes Total
Groundwater Groundwater Aquifer 1 - Tap Water Bis(2-ethylhexyl)phthalate 4E-07 - - 4E-07 - - 8E-07 Liver 0.02 - - 0.02 0.04
Chloroform 3E-07 - - 4E-07 - - 7E-07 Liver 0.06 - - 0.08 0.1
Heptachlor 7E-04 - - 3E-04 - - 1E-03 Liver 4 - - 1 5
Barium - - - - - - - - - - Heart 0.4 - - - - 0.4
Lead (1) - - - - - - - - - - - - - - - - - - - -
Manganese - - - - - - - - - - Central Nervous System 40 - - - - 40
Uranium - - - - - - - - - - Kidney 8 - - - - 8
Chemical Total 7E-04 - - 3E-04 - - 1E-03 52 - - 1 53
Uranium 238 1E-06 - - - - - - 1E-06
Radium 226 3E-06 - - - - - - 3E-06
Radionuclide Total 4E-06 - - - - - - 4E-06
Exposure Point Total 1E-03 53
Exposure Medium Total 1E-03 53
Groundwater Total 1E-03 53

Page 2 of 2 December 2001
EXAMPLE SCENARIO 11
TABLE 9.2.RME
SUMMARY OF RECEPTOR RISKS AND HAZARDS FOR COPCs
REASONABLE MAXIMUM EXPOSURE
The Dean Company
Scenario Timeframe: Future
Receptor Population: Resident
Receptor Age: Child
Medium Exposure Exposure Chemical Carcinogenic Risk Non-Carcinogenic Hazard Quotient
Medium Point of Potential
Concern Ingestion Inhalation Dermal External Exposure Primary Ingestion Inhalation Dermal Exposure
(Radiation) Routes Total Target Organ(s) Routes Total
Soil Soil Soil at Site 1 4,4'-DDD 1E-07 - - - - - - 1E-07 - - - - - - - - - -
4,4'-DDE 3E-06 - - - - - - 3E-06 - - - - - - - - - -
4,4'-DDT 1E-05 - - 9E-07 - - 1E-05 Liver 0.7 - - 0.06 0.8
Aluminum - - - - - - - - - - Central Nervous System 0.1 - - - - 0.1
Lead (1) - - - - - - - - - - - - - - - - - - - -
Manganese - - - - - - - - - - Central Nervous System 0.02 - - - - 0.02
Uranium - - - - - - - - - - Kidney 3 - - - - 3
Chemical Total 1E-05 - - 9E-07 - - 1E-05 4 - - 0.06 4
Uranium 238 9E-08 - - - - 6E-07 7E-07
Radium 226 5E-07 - - - - 9E-05 9E-05
Radionuclide Total 6E-07 - - - - 9E-05 9E-05
Exposure Point Total 1E-04 4
Exposure Medium Total 1E-04 4
Soil Total 1E-04 4
Receptor Total 1E-03 57
Total Risk Across All Media 1E-03 Total Hazard Across All Media 57
(1) Lead is evaluated for the resident using the IEUBK model. See Risk Assessment text for discussion of results Total Liver HI Across All Media = 6
and appendix for the lead modeling run results. Total Kidney HI Across All Media = 11
Total Central Nervous System HI Across All Media = 40

Page 1 of 2 December 2001
EXAMPLE SCENARIO 11
TABLE 10.1.RME
RISK ASSESSMENT SUMMARY
REASONABLE MAXIMUM EXPOSURE
The Dean Company
Scenario Timeframe: Future
Receptor Population: Resident
Receptor Age: Adult
Medium Exposure Exposure Chemical Carcinogenic Risk Non-Carcinogenic Hazard Quotient
Medium Point of Potential
Concern Ingestion Inhalation Dermal External Exposure Primary Ingestion Inhalation Dermal Exposure
(Radiation) Routes Total Target Organ(s) Routes Total
Groundwater Groundwater Aquifer 1 - Tap Water Bis(2-ethylhexyl)phthalate 7E-07 - - 1E-06 - - 2E-06 - - - - - - - - - -
Chloroform 5E-07 - - 1E-06 - - 2E-06 - - - - - - - - - -
Heptachlor 1E-03 - - 6E-04 - - 2E-03 Liver 2 - - 0.8 3
Manganese - - - - - - - - - - Central Nervous System 17 - - - - 17
Uranium - - - - - - - - - - Kidney 3 - - - - 3
Chemical Total 1E-03 - - 6E-04 - - 2E-03 22 - - 0.8 23
Uranium 238 9E-06 - - - - - - 9E-06 - - - - - - - - - -
Radium 226 2E-05 - - - - - - 2E-05 - - - - - - - - - -
Radionuclide Total 3E-05 - - - - - - 3E-05
Exposure Point Total 2E-03 23
Exposure Medium Total 2E-03 23
AirWater Vapors from
ShowerheadChloroform - - 1E-05 - - - - 1E-05 Liver - - 5 - - 5
Heptachlor - - 1E-03 - - - - 1E-03 - - - - - - - - - -
Chemical Total - - 1E-03 - - - - 1E-03 - - 5 - - 5
Radionuclide Total
Exposure Point Total 1E-03 5
Exposure Medium Total 1E-03 5
Groundwater Total 3E-03 28

Page 2 of 2 December 2001
EXAMPLE SCENARIO 11
TABLE 10.1.RME
RISK ASSESSMENT SUMMARY
REASONABLE MAXIMUM EXPOSURE
The Dean Company
Scenario Timeframe: Future
Receptor Population: Resident
Receptor Age: Adult
Medium Exposure Exposure Chemical Carcinogenic Risk Non-Carcinogenic Hazard Quotient
Medium Point of Potential
Concern Ingestion Inhalation Dermal External Exposure Primary Ingestion Inhalation Dermal Exposure
Soil Soil Soil at Site 1 4,4'-DDE 1E-06 - - '- - - - 1E-06 - - - - - - - - - -
4,4'-DDT 5E-06 - - 5E-007 - - 6E-06 - - - - - - - - - -
Chemical Total 6E-06 - - 5E-07 - - 7E-06 - - - - - - - -
Uranium 238 2E-07 - - - - 2E-06 2E-06 - - - - - - - - - -
Radium 226 1E-006 - - - - 4E-04 4E-04 - - - - - - - - - -
Radionuclide Total 1E-06 4E-04 4E-04
Exposure Point Total 4E-04 - -
Exposure Medium Total 4E-04 - -
Soil Total 4E-04 - -
Receptor Total 3E-03 28
Total Risk Across All Media 3E-03 Total Hazard Across All Media 28
Total Liver HI Across All Media = 8
Total Kidney HI Across All Media = 3
Cancer risks presented are those greater than 1E-06; Non-cancer risks presented are those greater than 1. Total Central Nervous System HI Across All Media = 17

Revision No. 0 January 1998

EPA
United States Office of Publication 9285.7-01DFS Environmental Protection Solid Waste and EPA/540/F-97/036 Agency Emergency Response PB97-963311
January 1998
Frequently Asked Questions:RAGS Part D
Office of Emergency and Remedial Response Quick Reference Fact Sheet
This fact sheet summarizes frequently asked questions regarding the U.S. Environmental Protection Agency’s (EPA) RiskAssessment Guidance for Superfund Volume I - Human Health Evaluation Manual (Part D, Standardized Planning,Reporting, and Review of Superfund Risk Assessments) Interim (RAGS Part D). The March 21, 1995 memorandum onRisk Characterization Policy and Guidance from EPA Administrator Browner directed improvement in the transparency,clarity, consistency, and reasonableness of risk assessments at EPA. EPA, over the years, has identified opportunities forimprovement in presentation of Superfund risk assessments. Furthermore, the General Accounting Office, members ofCongress, and others have called for the betterment of Superfund risk assessments. The October 1995 SuperfundAdministrative Reform #6A directed EPA to: Establish National Criteria to Plan, Report, and Review Superfund RiskAssessments. EPA has developed an approach to respond to these challenges, which is presented in RAGS Part D.
RAGS Part D was developed by a Workgroup of EPA Headquarters and regional risk assessors (the RAGS Part DWorkgroup) in concert with the CERCLIS 3 database development team to help standardize and improve the risk assessmentprocess. The following frequently asked questions have been developed to clarify how and when RAGS Part D should beapplied to a risk assessment.
APPLICABILITY1. To what sites will RAGS Part D apply?
RAGS Part D will apply to all Superfund risk assess-ments starting after January 1, 1998. In addition, theuse of RAGS Part D is encouraged to the extent it can beefficiently incorporated into ongoing risk assessmentsstarted before that time. RAGS Part D is applicable toRemedial, Post-Remedial and SACM sites. The use ofRAGS Part D is also encouraged for Removal andRCRA Corrective Action sites. The RAGS Part DWorkgroup suggests that RAGS Part D could also be auseful tool for quantitative risk assessment at non-NPL,BRAC, and Brownfields sites, and encourages its use.
2. At what phase of investigation should the StandardTables be used at sites?RAGS Part D describes the value that Interim Deliver-ables, which include the Standard Tables, add to theCERCLA remedial process, beginning with scoping andextending through the completion of the Baseline RiskAssessment.
3. Has DOD accepted RAGS Part D? Who will beresponsible for ensuring that all of the servicesreceive and use the Standard Tables?We are working with DOD Headquarters as well as ourEPA Federal Facilities office to introduce the elements
of RAGS Part D. So far, we have received positivefeedback from the management at DOD. The individualservices will be responsible for implementation ofRAGS Part D. We are briefing various levels of FederalFacilities (DOD and others) about RAGS Part D and arehighlighting the advantages of using it.
Some Federal department staff were involved in thedevelopment of RAGS Part D. The Air Force, Navy,and Army were asked to comment on the draft StandardTable package and many of their comments were incor-porated into RAGS Part D.
4. Should every EPA region use RAGS Part D?Yes
5. Does this guidance apply to non-NPL sites?While the guidance is specifically targeted for NPL sites,the use of RAGS Part D is also encouraged for Removaland RCRA Corrective Action risk assessments. Theprinciples of continuous involvement of the EPA riskassessor and the use of Standard Tools to plan, report,and review risk assessments would be helpful at any site.
6. Is RAGS Part D applicable to state agencies?RAGS Part D is applicable to Superfund risk assess-ments performed under state oversight. The use of

RAGS Part D is also encouraged for Removal and ing to supplement the staff in the regions to meet thoseRCRA Corrective Action sites. demands. In addition, the standard reporting formats
7. Have state agencies been involved in the developmentof RAGS Part D? Several regions have shared drafts of RAGS Part D withstates in their region, and the Workgroup considered thestate comments when preparing RAGS Part D.
IMPLEMENTATION already have their own standard formats for risk8. Rather than save time and money, it seems that the assessments. Why are we reinventing the wheel?
use of RAGS Part D will slow down the process. How How can we estimate the initial increase in cost ofwill use of the Standard Tables save time and money? this guidance for our contractors?Adding another major review of Interim Deliverableswill cause major delays in projects.Initially, implementation may take longer than tradi-tional risk assessments; there is a learning curve associ-ated with any new guidance. The road map for continu-ous involvement of the EPA risk assessor, presented inChapters 2 through 5 of RAGS Part D, and the StandardTables, are standard tools to perform a risk assessmentthat should ultimately make the process more efficient.Specifically, review of Interim Deliverables will increasethe likelihood that deliverables will be right the firsttime and will reduce rework because EPA's expectationsfor the risk assessment are clear at project initiation toboth PRP and EPA contractors.
Preparation, review, and approval time will be shortened Why not “nest” information within columns?when each risk assessment presents information in a The Standard Table format promotes transparency inconsistent manner using the Standard Table format. data presentation and facilitates subsequent electronicConsistency of presentation between risk assessments data transfer to CERCLIS 3. The electronic format willshould also lead to better quality risk assessments. enable risk assessors to copy columns rather than retype
Eliminating manual data entry into CERCLIS 3 will some. In addition, because of the eventual link betweengreatly reduce time and resources spent on reporting risk the Standard Tables and CERCLIS 3, it is necessary toinformation. On the regional level, eliminating manual segregate distinct pieces of information in order to makedata entry will save the regions from having to provide electronic transfer possible.hard copies of risk assessments to EPA Headquarters. Inaddition, EPA should be able to respond more easily toinformation requests, such as Congressional inquiries,by accessing electronic databases.
Regarding Interim Deliverables, another review is notbeing added; instead existing reviews are being phasedto occur at the most critical times. Early and continuousinvolvement of the EPA risk assessor will lead to fewerdata gaps and less rework associated with the DraftBaseline Risk Assessment.
9. The risk assessors in our region are so busy now, howcan they possibly be involved in every step of the RI,FS, and other parts of the process? We are going toneed more risk assessors if this is the case.EPA Headquarters has canvassed the regions andrequested resource requirements to implement theelements of RAGS Part D. EPA Headquarters is attempt-
(Standard Tables) provided in this guidance will makeit easier for RPMs to identify risk assessment datarequirements if a regional risk assessor is not availableto review a risk assessment.
10. It seems that implementation of RAGS Part D willcost more money, since most PRPs and contractors
Initially, PRPs and contractors may have to amend theirspreadsheets to provide appropriate data for the StandardTables. Regional risk assessors should be able toestimate the initial cost for amending spreadsheets.After this initial effort, the cost should actually decreasebecause of the standardization of requirements. EPA isimplementing RAGS Part D in response to concerns byCongress (and the public) regarding the problems withtransparency, clarity, consistency, and reasonableness ofrisk assessments. Without Standard Table formats, riskassessment information would continue to vary incompleteness and clarity, and the data would have to beentered into CERCLIS 3 manually.
11. Why are the Standard Tables so long and redundant?
information, so any repetition should not be burden-
12. How will implementation of RAGS Part D add toconsistency in risk assessments when we say that riskassessors should refer to regional guidance?RAGS Part D adds to consistency of reporting of riskinformation. Where there is not overarching Nationalguidance, regional differences exist. The risk assessorshould refer to the regional office for appropriate guid-ance on topics such as variations in fish consumptionrates, models used for showering scenarios, and selec-tion of default exposure parameters.
TRANSITION13. If I am asking my contractors to implement the use of
Standard Tables, I will have to amend statements ofwork for all my sites. This will be a lot of work.Sites with risk assessments already underway will behandled on a case-by-case basis and may not needamended SOWs. EPA Headquarters has offered assis-

tance to regions in amending SOWs for EPA contractors the guidance. In addition, there will be updates to theseperforming risk assessments. For PRP lead sites, regions tables periodically and a website and Helpline will bewill be responsible for amending consent decrees as available for guidance on changes.needed.
14. Will RPMs, contractors, etc. be trained in the use of This term refers to the risk assessor responsible forRAGS Part D?There will be training in each region in FY 98 forFederal and state risk assessors, RPMs, and contractorsregarding the elements of RAGS Part D.
15. How will the format of the Standard Tables change inyears ahead as new guidance is released?The format of the Standard Tables is the result of anextensive development effort, and we do not expectmajor changes to the Standard Tables except for addi-tions resulting from new guidance (e.g., lead guidance,Monte Carlo/Probabilistic Analysis, and ecologicalguidance).
16. If I have questions on how to complete one of theStandard Tables, who do I contact?The Instructions for the Standard Tables offer detailedguidance for completion of these Tables. EPA is alsodeveloping a website and telephone Helpline to assistusers in implementing RAGS Part D and as a source ofupdate information. In addition, the RAGS Part DWorkgroup member from your region (listed at the end 23.Can the Standard Tables be altered?of this Fact Sheet) should be able to assist you and No. The Standard Table formats can not be altered (i.e.,answer questions about the Standard Tables. columns can not be added, deleted, or changed); how-
PROCEDURES/APPLICATION17. Are there comparable tables for ecological risk
assessment?Standard Tables for ecological risk assessment are on adifferent track than the human health Standard Tables.EPA Headquarters representatives are working withregional risk assessors on Standard Tables for ecologicalrisk assessment.
18. If ecological concerns are driving the site cleanup,what Standard Tables should be used?The Standard Tables for human health risk assessmentshould be completed if a human health risk assessmentis being prepared. Ecological Standard Tables, oncefinalized, should be used to present ecological riskassessment information. Standard Tables for ecological 26.What happens if a chemical is not originally includedrisk assessment are being developed under anotherinitiative.
19. EPA just released Monte Carlo guidance. How willthis be reflected in the Standard Tables? decision. If necessary, the Standard Tables may requireThe current version of the Standard Tables in RAGS modification to reflect new data. The use of electronicPart D does not address Monte Carlo Analysis; however, spreadsheets makes this an easy task.Chapters 2 and 3 discuss probabilistic analysis. Oncethe Superfund program completes guidance in theseareas, Standard Tables will be developed to implement
20. What is the definition of EPA risk assessor?
reviewing the risk assessment on behalf of EPA. Ingeneral, the EPA risk assessor is employed by EPA.Many EPA regions may also receive contractor, inter-agency, or state support in performing the role of theEPA risk assessor. The designation is a region-specificmatter.
21. How is lead exposure addressed by the StandardTables?A separate Standard Table documenting lead exposure,based on the IEUBK model, is under development.When completed, it will be made available through thewebsite (http://www.epa.gov/superfund/oerr/techres/ragsd/ragsd.html) and through the RAGS Part D Work-group member from your EPA region.
22. Will Interim Deliverables be subject to enforceableschedules?Enforceable schedules of Interim Deliverables will behandled on a site-specific basis in each region.
ever, rows and footnotes can be added as appropriate.Standardization of the Standard Tables is needed toachieve Superfund program-wide reporting consistencyand to accomplish electronic data transfer to CERCLIS3.
24. When, in the risk assessment process, are InterimDeliverables due?The schedule for Interim Deliverables will be deter-mined on region-specific and site-specific bases.
25. Does RAGS Part D contradict the format outlined inRAGS Part A?No. RAGS Part D supplements RAGS Parts A, B, andC.
as a Chemical of Potential Concern, but is laterdetected?The Standard Tables should reflect the information usedin the Baseline Risk Assessment to make the remedy
CERCLIS 327. How will information be entered into CERCLIS 3?

The Standard Tables prepared in Lotus and/or Excel Region VII: Dave Crawford® ®
formats will be electronically transferred to CERCLIS 3using an upload function that is under development.
28. Who will enter information into CERCLIS 3?Responsibility for entry of CERCLIS 3 risk data duringFY 98 has not yet been determined. Use of StandardTables by the risk assessor will minimize the burden ofmanual entry of risk data into CERCLIS 3.
29. Who will have access to the risk data in CERCLIS 3(e.g., public, DOD, EPA Program Managers, RPMs,risk assessors)?The CERCLIS 3 database managers will determine dataaccessibility. It has been recommended that entitiescontributing data to CERCLIS 3 be given access to it.At the moment, it is planned for the public to haveaccess to non enforcement-sensitive data. The EPAregional Information Management Coordinators willhave information on CERCLIS 3 data accessibility.
FOR FURTHER INFORMATION
The technical details (e.g., equations and assumptions)necessary to complete a risk assessment are available inRAGS. Additional information and guidance can be foundin the various OSWER directives that have been released onrisk assessment. For additional copies of this FrequentlyAsked Questions Fact Sheet, or any of the aforementionedrisk assessment guidance documents, call the NationalTechnical Information Service (NTIS) at (703) 487-4650 or1-800-553-NTIS (6847). Alternately, you can access infor-mation on RAGS Part D via the Internet at the followinglocation:
http://www.epa.gov/superfund/oerr/techres/ragsd/ragsd.html
The following members of the EPA RAGS Part D Workgroupmay also be contacted:
EPA Headquarters: Jim Konz([email protected])
Region I: Ann-Marie Burke([email protected])
Region II: Marian Olsen ([email protected])
Region III: Jennifer Hubbard([email protected])
Region IV: Glenn Adams ([email protected])
Region V: Andrew Podowski([email protected])
Region VI: Ghassan Khoury ([email protected])
([email protected])Region VIII: Chris Weis
([email protected])Region IX: Stan Smucker
([email protected])Region X: Dana Davoli
REFERENCES
U.S. EPA. 1989. Risk Assessment Guidance for Superfund(RAGS): Volume I: Human Health Evaluation Manual(HHEM), Part A, Interim Final. Office of Emergency andRemedial Response, Washington, DC. EPA/540/1-89/002.NTIS PB90-155581.
U.S. EPA. 1991a. Risk Assessment Guidance for Super-fund (RAGS): Volume I: Human Health Evaluation Manual(HHEM), Part B, Development of Risk-Based PreliminaryRemediation Goals. Office of Emergency and RemedialResponse, Washington, DC. EPA/540/R-92/003 Publication9285.7-01B. NTIS PB92-963333.
U.S. EPA. 1991b. Risk Assessment Guidance for Superfund(RAGS): Volume I: Human Health Evaluation Manual(HHEM), Part C, Risk Evaluation of Remedial Alternatives,Interim. Office of Emergency and Remedial Response,Washington, DC. EPA/540/R-92/004. Publication 9285.7-01C. NTIS PB92-963334.
U.S. EPA. 1998. Risk Assessment Guidance for Superfund(RAGS): Volume I: Human Health Evaluation Manual(HHEM), Part D, Standardized Planning, Reporting, andReview of Superfund Risk Assessments. Office of Emergencyand Remedial Response, Washington, DC. EPA/540/R-97/033. Publication 9285.7-01D. NTIS PB97-963305.