Embed Size (px)
Citation preview

RISK ASSESSMENT
OF
13-DICHLOROPROPENE
DEPARTMENT OF PESTICIDE REGULATION CALIFORNIA ENVIRONMENTAL PROTECTION AGENCY
JANUARY 10 1997
I BACKGROUND
A Commercial reentry of Telone II soil fumigant into California has been proposed by DowElanco Permits for its use in California were suspended by the California Department of Food and Agriculture in 1990 because of the high ambient air concentrations of 13-dichloropropene (13-D) detected in Merced county during a routine air monitoring This monitoring was part of DPR implementation of Assembly Bill 1807 of 1983 (sometimes called the Toxic Air Contaminant Act of 1983) The primary toxicological concern was the potential for risk of cancer 13-D is listed by US EPA as a B2 carcinogen a Probable Human Carcinogen (IRIS 1994) It is also listed as a chemical known to the state of California to cause cancer under Proposition 65 the Safe Drinking Water and Toxic Enforcement Act of 1986
Since the suspension in 1990 DowElanco has conducted various field trials of Telone II applications in which the airborne concentration of 13-D was monitored Air dispersion models were used to simulate air concentrations associated with specific application scenarios Estimates of risk for each separate application of Telone II permit conditions have been conducted by DPR to address the specific individual applications
This risk assessment evaluates the potential risks of acute subchronicseasonal and chronic exposures to 13-D associated with the proposed use of Telone II for 1994-95
II PROPOSED USE OF TELONE FOR 1994-95
The proposed application conditions were specific for the following counties Fresno Imperial Kern Kings Madera Merced Monterey Riverside Santa Barbara San Joaquin San Luis Obispo Stanislaus and Tulare The county that has the highest proposed acreage of use is Kern county with a maximum of 8000 acres Ninety percent of this Kern county acreage are for carrots (DowElanco 1994) The proposed maximum acreage of application per day per section is 80 acres The proposed maximum application rate is 12 gallons per acre Applicators must have a valid certificate from DowElanco indicating completion of the Stewardship and Safety Training Program and Application Rig Specification Training
III RISK ASSESSMENT
The scope of this risk assessment is limited to addressing the proposed use of Telone II during 1994-95 This assessment may not be applicable to conditions beyond the extent of use specified in this permit condition
IIIA Hazard Identification and Dose-Response Assessment
Under the Birth Defect Prevention Act of 1984 (SB 950) toxicological data from a battery of studies are required to be submitted to DPR in support of the registration of a pesticide in California These studies are reviewed by DPR toxicologists for the determination of the acceptability to fill the data requirements and for the identification of adverse effects of the pesticide A summary of the
1
submitted toxicological studies for 13-D is included in Appendix A To date data requirements for all types of toxicity studies are filled Unless otherwise indicated the studies submitted to DPR and described in this section are the ones that met the guidelines under Federal Insecticide Fungicide and Rodenticide Act (FIFRA) They were accepted for fulfilling the SB 950 data requirements
The database in the open literature was searched up to June 1994 Pertinent information from the published literature was also included in this section
Inhalation is the primary route of 13-D exposure both for occupational activities and for the general population from the use of Telone II Dietary exposures are not of concern because no tolerances have been set for 13-D in foods The following information focuses on data critical to addressing the potential inhalation exposure scenarios associated with the currently proposed use of Telone II
IIIA1 Acute Inhalation Toxicity
Studies in rats
One acute inhalation toxicity study is on file at DPR In this study by Streeter et al (1987) groups of 5 Fischer 344 rats per sex were exposed to 775 855 or 1035 ppm Telone II (975 cistrans 13-D) for 4 hours The rats were kept for a 2-week post-exposure observation period before terminal sacrifice The estimated 4-hour LC50 was 855 to 1035 ppm for male rats and 904 ppm for female rats Throughout the experimental period all rats at 775 ppm had some of the following signs of toxicity salivation lacrimation lethargy and urine and fecal stains One of the 5 females at 855 ppm and all the rats at 1035 ppm died Rats that died had hemorrhages in multiple lung lobes A NOEL could not be established from this study Based on the clinical signs the 775 ppm was determined to be the LOEL Using the default assumption that a NOEL could be 10-fold lower than the LOEL the NOEL for 4 hours of exposure was estimated as 775 ppm The potential dose of an inhalation exposure can be estimated by the equation
DosePotential = ppm x purity x 453 (mgm3)ppm x BR m3kgday x Fday x Fweek Eq 1
where 453 (mgm3)ppm is the conversion factor from concentration in ppm (by volume) to mgm3
(by weight) BR is the breathing rate Fday is the fraction of a day that the exposure occurs (ie hours of exposure24 hours) and Fweek is the fraction of a week that the repeated exposures occurs (ie days7 days)
Using Eq 1 chemical purity of 975 and the default breathing rate of 096 m3kgday for rats the calculated potential dose at the estimated 4-hour NOEL was 548 mgday
(775 x 0975 x 453) mgm3 x 096 m3kgday x (424) day = 548 mgkg
The estimated NOEL of 548 mgkg was used in characterizing the risk of acute inhalation exposures to 13-D
2
Observations in humans
The immediate effects of acute exposures to 13-D in humans were noted in a publication by Markovitz and Crosby (1984) Observations were made of 9 firemen involved in a clean-up of a tank truck spill of 13-D in 1973 The initial signs of toxicity included headache neck pain nausea and breathing difficulty Information on acute toxicity in humans can also be found in the DPR illness report database Between 1982 and 1990 prior to the suspension of Telone II use there were 55 cases of accidental exposures related to 13-D Most were from workers receiving splash or spray due to accident and equipment failure or repair The signs of toxicity included burning eyes and sinuses skin irritation and rash eye irritation and conjunctivitis bitter taste in mouth nausea vomiting stomach ache headache cough chest pains and loss of consciousness
IIIA2 Subchronic Inhalation Toxicity
Two subchronic (90-day or 13-week) inhalation studies on Telone II in rats and mice (Coate 1979 Stott et al 1984) were submitted to DPR (see Appendix A) The strain of rats used in both studies was Fischer 344 While CD-1 mice were used by Coate (1979) B6C3F1 mice were used by Stott et al (1984) Groups of 10 animals per sex were exposed to 0 10 30 or 90 ppm Telone II (909 13-D used in Stott et al 1984) 6 hoursday and 5 daysweek for 13 weeks An additional dose level of 150 ppm was also included in the study by Stott et al (1984) In both studies no effects were observed at 10 ppm Changes in the nasal epithelium were reported at the next higher exposure level of 30 ppm The nasal epithelial effects noted by Coate (1979) in 9 of 10 female rats included loss of cytoplasm disorganization of the nuclei and occasional necrotic cells Hyperplasia of the respiratory epithelium was additionally observed in two of the 10 males in the study by Stott et al (1984) The severity of nasal effects and the number of endpoints increased at higher exposure levels The effects in rats and mice at 90 and 150 ppm included olfactory epithelial degeneration and lesions nasal turbinate epithelial metaplasia and lower terminal body weight (by approximately 20 in rats and 11 in mice at 150 ppm) In addition Stott et al (1984) reported hyperplasia of the urinary bladder transitional epithelium in female mice 7 of 10 mice at 90 ppm and 6 of 10 mice at 150 ppm
Based on the nasal effects reported in rats a subchronic NOEL of 10 ppm (6 hoursday 5 daysweek) was established Using Eq1 the chemical purity of 909 and the default breathing rate of 096 m3kgday for rats the calculated potential dose at the NOEL (6 hrday 5 daysweek) was 71 mgkgday
(10 x 0909 x 453) mgm3 x 096 m3kgday x (624) x (57) = 71 mgkgday
The estimated NOEL of 71 mgkgday is used in this risk assessment to characterize the risk of subchronicseasonal exposures to 13-D A comparable NOEL based on different toxicity endpoints was also established in an inhalation study of D-D published by Parker et al (1982) D-D contained both 13-dichloropropene (54) and 12-dichloropropane (29) Groups of 28 animals per sex were exposed to 0 15 or 50 ppm D-D 6 hoursday and 5 daysweek for 12 weeks Histopathological examination of the nasal tissue was not performed No effects were observed at 15 ppm At 50 ppm increases in the relative weight (organ to body weight ratio) of liver (approximately 9 in male rats) and kidney (approximately 11 in female rats) and hepatocytic
3
enlargement (male mice) were reported Using Eq 1 the chemical purity of 54 and the default breathing rates of 096 m3kgday for rats and 18 m3kgday for mice the calculated potential dose at the NOEL of 15 ppm D-D (6 hoursday 5 daysweek) was 63 mgkgday for rats and 118 mgkgday for mice
(15 x 054 x 453) mgm3 x 096 m3kgday x (624) x (57) = 63 mgkgday
(15 x 054 x 453) mgm3 x 18 m3kgday x (624) x (57) = 118 mgkgday
A brief discussion on the toxicity of epichlorohydrin (ECH) is helpful in understanding the toxicity of 13-D The earlier Telone II formulation used in the toxicity studies contained a small amount of ECH (approximately 1) ECH has been shown to be nasal irritant in rats and rabbits after inhalation exposures The lowest exposure for these effects was 9 to 16 ppm after 20 days of exposure (NAS 1980) However these levels were much higher than the amount of ECH present in the 13-D toxicity studies using Telone II For example the Telone II used by Stott et al (1984) contained 12 ECH The ECH concentration at the NOEL of 10 ppm Telone II would be 012 ppm Therefore unless potentiation by 13-D occurred it is not likely that ECH would contribute significantly to the toxicity observed with Telone II
IIIA3 Reproductive Toxicity
A two-generation inhalation study by Breslin et al (1987) was submitted for the evaluation of reproductive toxicity potential of 13-D Groups of 30 Fischer 344 rats per sex were exposed to 0 5 20 or 60 ppm Telone II (92 cistrans 13-D) for 7 days initially The exposure levels were subsequently raised to 0 10 30 90 ppm for a total of 10 to 12 weeks before mating The rats were exposed for 6 hoursday and 5 daysweek Reproductive toxicity and effects on neonatal growth and survival were examined and no effects were observed Paternal toxicities were present only at the highest exposure level of 90 ppm They included changes in the nasal epithelium (degeneration of the olfactory epithelium hyperplasia of the respiratory epithelium) and lower body weight (3-7 in the males) The paternal NOEL of 30 ppm is higher than the NOEL determined from the subchronic studies
IIIA4 Teratogenicity
One inhalation study in Fischer 344 rats (John et al 1983a) and one in New Zealand rabbits (John et al 1983b) were submitted for the evaluation of developmental toxicity of 13-D Groups of 30 pregnant rats and rabbits were exposed to 0 20 60 or 120 ppm Telone II (901 cistrans 13-D) for 6 hours per day Rats were exposed from day 6 to 15 of gestation Rabbits were exposed from day 6 to 18 of gestation Developmental endpoints were examined but no developmental effects were observed
In rats maternal toxicity was evident in lower food consumption and weight gain during the exposure period The total maternal weight gain during the exposure period was lowered by 6 13 and 25 grams at 20 60 and 120 ppm respectively The 6 grams was approximately 3 of the rat body weight at 20 ppm At the higher doses the maternal weight gain returned to levels comparable to the controls as soon as the exposures ceased Because the effect at the lowest level
4
of 20 ppm was marginal (plt005 Dunnetts test) and the effects were transient the relevance of this endpoint in addressing subchronic exposures was not clear Maternal weight gain reduction was also observed in rabbits at 60 and 120 ppm but the effects were not consistently observed throughout the study
IIIA5 Genotoxicity
Many studies on gene mutation chromosomal effects and other types of DNA damage were submitted for filling data requirements under SB 950 The results were summarized in Appendix A In addition several studies reported in the open literature were also reviewed for the purpose of risk assessment
The overall database showed genotoxic potential of 13-D in multiple tests with multiple endpoints Although impurities and the stabilizer ECH in 13-D formulations may have contributed to the positive results in some studies in the absence of additional studies for clarification it was concluded that 13-D is mutagenic in both prokaryotes and eukaryotes (Appendix A)
IIIA6 Chronic Inhalation Toxicity
Chronic toxicity and oncogenicity of 13-D have been studied through oral inhalation and dermal routes of exposures (Appendix A) In the inhalation studies with Fischer 344 rats by Lomax et al (1987) and with B6C3F1 mice by Stott et al (1987) groups of 70 animals per sex were exposed to 0 5 20 or 60 ppm Telone II (921 cistrans 13-D) 6 hoursday and 5 daysweek for 2 years Ten animals per group were sacrificed at 6 and 12 months of exposure The Telone II formulation used in these studies contained epoxidized soybean oil instead of ECH as a stabilizer
No clinical signs of toxicity or significant effect on survival were observed in rats or mice Chronic effects in rats included changes in nasal epithelium (decreased thickness and erosion of the olfactory epithelium submucosal fibrosis) and decreased body weight gain observed at the highest exposure level of 60 ppm
Chronic effects observed in mice at the highest exposure level of 60 ppm included degeneration hyperplasia and hypertrophy of the nasal epithelial cells lower body weight (2-11) cytological changes in kidney and liver cells (decreased vacuolization of the proximal tubular epithelium and hepatocytes) and hyperplasia of the urinary bladder mucosa The increase in the incidence of hyperplasia and hypertrophy of the respiratory epithelium (2850) and hyperplasia of urinary bladder mucosa (1948) were also statistically significant (plt001) at 20 ppm in female mice Based on these effects in the nasal epithelium and urinary bladder the NOEL was established at 5 ppm
US EPA established the Reference Concentration (RfC) of 002 mgm3 based on the NOEL of 5 ppm The RfC is the daily inhalation exposure of the human population (including sensitive subgroups) that is likely to be without an appreciable risk of deleterious effects during a lifetime (IRIS 1994) It is established for the protection of non-oncogenic effects US EPA calculated the RfC by multiplying the NOEL with an inter-species dosimetric adjustment factor (Regional Gas Dose Ratio RGDR) and dividing the adjusted NOEL by an overall uncertainty factor (UF) of 30 (10 for
5
inter-individual variation 3 for interspecies variation)
RfC = (NOEL Dosepotential x RGDR) UF
RfC = (5 x 092 x 453) mgm3 x (624) x (57) x 01831 x 130 = 002 mgm3
IIIA7 Oncogenicity
The oncogenicity of 13-D through inhalation exposures was investigated in the aforementioned two chronic inhalation studies No evidence of oncogenicity was indicated in rats (Lomax et al 1987) Conversely evidence of oncogenicity was shown in mice (Stott et al 1987) There was a positive trend of increase with dose (plt001 Cochran-Armitage trend test) in bronchioloalveolar adenomas in male mice The incidences based on the number of animal at risk were 949 (18) 650 (12) 1349 (27) and 2250 (44) respectively at 0 5 20 and 60 ppm The increase in tumor incidence was statistically significant (plt001 Fisher Exact test) at the high dose The biological significance of benign lung adenomas in the absence of carcinomas may be debatable However according to the NTP guidelines for evaluation of rodent carcinogenesis studies (McConnell et al 1986) it is appropriate to combine the incidence of lung adenoma and carcinoma for consideration because of the progressive nature of alveologenic lesions in mice Moreover not just adenomas but also malignant alveolarbronchiolar carcinomas were observed in male mice exposed to Telone II by oral gavage (NTP 1985)
IIIA7a Weight of Evidence for Oncogenicity in Humans
In a publication Markovits and Crosby (1984) reported 2 of the 9 firemen who were involved in a clean-up of a tank truck spill of 13-D developed histiocytic lymphoma within 7 years after the acute exposure episode that required immediate medical attention The authors also reported a case of leukemia in an applicator who had prolonged (30 days initially) and extensive (impregnated clothes from leaky hose) exposure to 13-D The available oncogenicity data in humans are inadequate for a determination of the oncogenicity in humans
Given the evidence of tumors in male mice from the inhalation exposure study additional weight of evidence for the oncogenic potential of 13-D is noted by (i) multiple tumors observed in oral and dermal exposure studies in rodents (ii) positive genotoxic potential and (iii) the structural similarity to known oncogens Based on the same weight-of-evidence consideration USEPA classified 13-D as a B2 carcinogen a probable human carcinogen (IRIS 1994)
Oral and dermal oncogenicity studies
The following studies are scientifically valid and contained supporting data although they were not acceptable for filling the chroniconcogenicity data requirements in rodents because of deviation from the FIFRA guidelines The SB 950 data requirements were filled by the chronic inhalation studies
6
In the oral study conducted by National Toxicology Program (NTP 1985) male and female F344N rats and B6C3F1 mice were administered Telone II by oral gavage (corn oil vehicle) 3 times a week for 104 weeks The treatments resulted in statistically significant increase in multiple tumors both at and away from the site of initial contact with Telone II (Table 1) Although the Telone II formulation contained ECH (10) it is unlikely that ECH alone could account for the tumors observed in the rats unless 13-D remarkably potentiates the oncogenic effect of ECH This is supported by the following comparison The dose of ECH in the high dose group (50 mgkg 3 daysweek) was 021 mgkgday (50 x 001 x 37) On the other hand the ECH dose for eliciting similar level of tumor response in the forestomach was much higher In an oncogenicity study of ECH by Konishi et al (1980) Wistar rats that received drinking water containing 750 ppm ECH for 81 weeks had 10 incidence of papilloma and 10 incidence of carcinoma of the forestomach The potential ECH dose was estimated to be 64 mgkgday (16 mgday) Thus the ECH dose in the NTP study (1985) with Telone II was approximately 300-fold lower (02164) than the ECH in the study by Konishi et al (1980) Therefore the oncogenicity of 13-D as observed in the NTP study (1985) cannot be dismissed
In the dermal study by Van Duuren et al (1979) female HaICR Swiss mice were administered Telone II for 77 weeks either by topical application (3 times per week) or by subcutaneous injection (once a week) Topical treatments resulted in tumors not only at the site of initial contact (skin papilloma) but also at a site away from Telone II administration (lung papilloma) The increase in lung papilloma (30100 1930 1730 at 0 41 and 122 mg per mouse) was statistically significant (plt001 Fisher Exact test) at both treatment groups Subcutaneous injection also resulted in increased fibrosarcoma (030 and 630 at 0 and 3 mg per mouse) at the site of injection
Genotoxic Potential
The overall weight of evidence indicated that 13-D is mutagenic in both prokaryotes and eukaryotes (see Section IIIA6 - Genotoxicity)
Structural similarity to known oncogens
13-D is structurally related to other short-chain halogenated hydrocarbons that are known oncogens such as vinyl chloride and ethylene dibromide
IIIA7b Quantitative Estimate of Oncogenic Potency
The oncogenic potency was estimated using the default assumption that a threshold dose does not exist for an oncogenic effect The dose-response relationship from the dose range used in the animal studies was extrapolated to the low dose range generally experienced by humans using a linearized multistage (LMS) mathematical model The dose-response relationship is described by an exponential polynomial equation and the coefficients are estimated using the statistical technique of a maximum likelihood The
7
Table 1 Tumor incidencesa in F344N rats and B6C3F1 mice exposed (3 timesweek) to Telone II for 2 years through oral gavage dosing (NTP 1985)
Tumor incidence Tumor SiteType SpeciesSex 0 mgkg 25 mgkg 50 mgkg
Forestomach squamous cell Rats M 159 (2)++ 158 (2) 1761 (28)
papillomacarcinoma Rats F 058 (0)++ 259 (3) 862 (13)
Liver Rats M 159 (2)+ 658 (10) 961 (15)
neoplastic nodulecarcinoma
Thyroid follicular cell Rats F 050 (0)+ 249 (4) 452 (8) adenomacarcinoma
Mammary fibroadenoma Rats F 1450 (28)+ 2049 (41) 2452 (48)
0 mgkg 50 mgkg 100 mgkg
Forestomach squamous cell Mice M 037 (0) 247 (4) 350 (6) papillomacarcinoma Mice F 050 (0)+
150 (2) 447 (9)
Urinary bladder Mice M 037 (0) 047 (0) 250 (4) transitional cell carcinoma Mice F 050 (0)++ 850 (16) 2147 (45)
Lung alveolarbronchiolar Mice M 137 (3)++ 1347 (28) 1250 (24)
adenomacarcinoma Mice F 250 (4)+ 450 (8) 847 (17)
a The incidences are adjusted for number of animals at risk (excluding animals that died before week 52 or the time tumors were first detected) Only tumors with statistically significant increase in the treatment groups were presented
Symbols for levels of statistical significance - Cochran-Armitage trend test (given at the control group) + for plt005 ++ for plt001 - Fisher Exact test (given at each dose group) for plt005 for plt001
8
model is constrained to linearity in the low-dose region The potency is defined as the maximum likelihood estimate (MLE Q1) of the linear term in the model equation andor its upper 95 confidence limit (UCL Q1
) The potency estimated from animal data is extrapolated to humans The current DPR default approach in interspecies dose scaling is to assume dose equivalence between animals and humans based on 34 power of the body weight (BWt) Therefore potency in the unit of (mgkgday)-1 derived from animal data is extrapolated to humans by a factor of (BWthumanBWtanimal)
14 The current default extrapolation factor from mice to humans is (70 kg003 kg)14 or 695 Risk is then calculated as the potency multiplied by the exposure or dose It is an estimate of the excess cumulative probability of tumor occurrence in a lifetime (70 years for humans)
Tumor incidence data from broncheoloalveolar adenomas observed in male mice in the inhalation study by Stott et al (1987) were used for the extrapolation using the Global 86 program The potential doses for the inhalation exposures of 5 20 and 60 ppm (6 hrday 5 dayswk) were calculated using Eq 1 the chemical purity of 92 and the default breathing rate of 18 m3kgday for mice An example calculation for the dose at 5 ppm (6 hrsday 5 daysweek) is
(5 x 092 x 453) mgm3 x (624) x (57) x 18 m3kgday = 67 mgkgday
Based on the animal data the Q1 (MLE) and Q1 (UCL) of the mathematical equation were 00035
and 00079 (mgkgday)-1 respectively The MLE and UCL potency for humans using the extrapolation factor of 695 were 0025 and 0055 (mgkgday)-1 respectively These potency values were slightly higher than the UCL potency of 0045 (mgkgday)-1 used in estimating the risk based on air monitoring data of Merced county in 1990 which resulted in the suspension of Telone II use The difference was due to the adjustment of chemical purity of Telone II used for the inhalation study and the update of DPRs default values of body weight for humans (70 kg) and mice (003 kg) The use of current default body weights resulted in a change of the default potency extrapolation factor for mice-to-humans from 606 to 695
The current potency value used by the US EPA for calculating the oncogenic risk of inhalation exposures is 00966 (mgkgday)-1 (Engler 1994) This is the UCL of potency estimated from the LMS model and assumed the equivalence of dose between species based on 23 power instead of 34 power of body weight For mice-to-humans extrapolation the different interspecies dose scaling approaches would result in approximately 19-fold difference in potency values
One of the concerns regarding the approach to oncogenicity risk estimation has been the use of annual or lifetime average exposure to estimate the risk of repeated episodically high exposures For some chemicals oncogenic risks at a given level of lifetime average exposure could be much greater when exposures occurred at higher levels for shorter durations This was demonstrated in a study of 13-butadiene by the National Toxicology Program (NTP 1993) However current knowledge on the impact of short-term high level of exposures on oncogenicity is not sufficient for a quantitative extrapolation of dose-respone relationship from a long-term continuous lifetime studies other than to assume that the oncogenic potential is proportional to the lifetime annual average exposures
9
IIIB Exposure Assessment
The use of Telone II as a field fumigant will result in the presence of 13-D in the air The exposures of two groups of populations were assessed One group was the workers who in addition to exposures to 13-D present in the ambient air also received exposures in occupational settings The other group was the general population who received exposures as a result of 13-D off-gassing from the fields The exposures of the general population were characterized both by a township in Kern county that has the highest anticipated Telone II use and the locations near the application fields
During the past 4 years many air monitoring studies have been conducted by DowElanco and CalEPA (Air Resources Board and DPR) The monitoring data were useful not only for characterizing the flux pattern of 13-D from application fields under various use and weather conditions but also for validating air dispersion models that were used in estimating the air concentrations of 13-D
IIIB1 Occupational Exposures
An exposure assessment for loaders and applicators has been conducted Details of the assessment are provided in Appendix B The exposures were estimated based on biomonitoring data from an interim report of a study conducted in Washington by DowElanco (Houtman 1993) Urinary samples were collected for 3 days post exposure from groups of 5 workers performing loading or application The exposure period was approximately 4 hours during which time 250 gallons of Telone II were loaded and applied at the rate of 25 gallonacre The Absorbed Daily Dosage (ADD) was estimated based on the recovery of urinary metabolite N-acetyl-S-(3-chloroprop-2-enyl)cysteine (3C-NAC) The correlation between the 3C-NAC and the absorbed dose of 13-D was based on a recent pharmacokinetic study in which 6 humans were exposed to 1 ppm 13-D for 6 hours (Waechter et al 1992) The biomonitoring data of Houtman (1993) were adjusted downward proportionally for the California application rates (12 gallonacre) and the Personal Protection Equipment (PPE) specified in the California permit conditions The respective protection factors for a half-face and a full-face respirator were assumed to be 90 and 95
The seasonal ADD (SADD) annual ADD (AADD) and lifetime ADD (LADD) were calculated based on the geometric mean ADD of the 5 workers For a loader the duration and frequency for occupational exposures were assumed to be approximately 24 minutes in an 8-hour day 40 days per year and 270 days per career or lifetime For an applicator the duration and frequency of occupational exposures were assumed to be 68 hours per day 36 days per year and 270 days per career or lifetime These exposure parameters were based on a recent survey conducted by DowElanco in California in response to a Data Call-In (DCI) by the US EPA (Houtman 1992) It was believed that a worker would not be performing both loading and application of Telone II The ADD SADD AADD and LADD estimated in Appendix B are provided in Table 2
10
Table 2 Occupational Exposures of 13-Da
Absorbed Dose (ugkgday) Work Tasks ADDb SADDc AADDd LADDe
high mean
Loaders 248 073 016 008 0007
Applicators 212 113 023 011 0012
a Data taken from Appendix B b The high value was estimated based on the highest biomonitoring data of 5 workers The mean is the geometric mean of these 5 workers The ADD for applicators was calculated assuming 68 hours of work per day c The SADD was calculated from the geometric mean ADD assuming 20 and 18 days of work per 90 days for the loaders and applicators respectively d The AADD was calculated from the geometric mean ADD assuming 40 and 36 days of work for loader and applicators respectively e The LADD was calculated from the geometric mean ADD assuming 270 days of work per 70 years lifetime
IIIB2 Ambient Air Exposures for the general population
The estimation of potential acute subchronicseasonal and chroniclifetime exposures of the general population consisted of two steps (1) the simulation of air concentrations and (2) the Monte Carlo simulation of the potential exposures
IIIB2a Simulation of Air Concentrations - Area-wide
A distribution of annual average ambient air concentration was simulated using a modified ISCST model (Industrial Source Complex dispersion model - Short Term) and conducted for 9 townships in Kern county that are expected to have the highest density of Telone II use based on the historical data for the location of carrot fields In addition air concentration simulation was also performed for one township that has the highest anticipated use The size for each field was set at 80 acres In the simulation no field was assumed to be treated more than once in a three year period The DowElanco report by Calhoun et al (1994) has a detailed description of the simulation conditions and approach The section-centered simulation from DowElanco was modified to yield a distribution for a finer grid (36 receptors per section) The detailed description regarding the derivation of the final distribution was provided in the report of Johnson (1994a) The area-wide distribution of air concentration at the highest use township was used in a Monte Carlo simulation for subchronic and
11
lifetime exposures of the general population living in townships and counties in which Telone II will be used according to the current proposal The simulated distribution of air concentrations for use in the assessment of subchronic and lifetime exposures was the time-weighted average daily air concentration for the specific period of exposure (ie average over 62 days for a subchronic exposure and 3 years for an annual average exposure)
To characterize the risk of acute exposures the off-site distribution simulated by Johnson (1994b) was used to find the highest air concentrations at 100 meters from fields These were 054 mgm3
for a 4-hour period and 019 mgm3 for a 24-hour period (Barry 1994) Conservative assumptions and methodology that resulted in high estimates of air concentration were used in this simulation Some of these assumptions were application to 11 fields in one township and the highest flux rates The highest air concentration reflected the least favorable meteorological conditions over the 15-day simulation period Therefore these values could be considered as the highest bound of air concentrations that have very low likelihood of occurrence
IIIB2b Simulation of Exposures
Acute Exposures
At a given concentration of a chemical in the air children will generally receive higher exposures per unit body weight than adults because of the higher breathing rate per unit body weight Therefore the potential dose for the highest acute exposure was calculated for both a child and an adult Using Eq 1 and the default breathing rate of 046 m3kgday for a child and 026 m3kgday for an adult the calculated potential dose at the highest 24-hour air concentration of 019 mgm3 at 100 meters from fields is 0087 mgkgday for a child and 0049 mgkgday for an adult
019 mgm3 x 046 m3kgday = 0087 mgkgday
019 mgm3 x 026 m3kgday = 0049 mgkgday
Subchronic and Lifetime Exposures
Monte Carlo simulations of the average daily dose for subchronic and lifetime exposures were conducted using the simulated distributions of average air concentrations under the area-wide scenarios The subchronic period was set at 62 days representing one of the two 2-month windows of use in accordance with the current proposed use The lifetime average daily dose was assumed to result from 30 or 70 years of exposure The current default exposure duration to a pesticide in a lifetime is 70 years The scenario of a 30 years of 13-D exposure was included for the purpose of comparison with the Monte Carlo analysis conducted by DowElanco (Calhoun et al 1994) which assumed a distribution of residence time at one location between 30 and 70 years and equated this to the potential duration for 13-D exposures in a lifetime It has not been demonstrated however that a change of residence would assure no further potential for exposure to 13-D
12
Distributions of exposure parameters applied to the Monte Carlo analyses included daily geographic mobility and age-specific body weight and breathing rates at various activity levels For the subchronic exposures simulations were performed for male and female age groups including infants and children For the lifetime exposures the residence time factor that defined the expected years of exposure to 13-D were set at 30 and 70 years A detailed description and the rationale for the choice of parameters are presented in Appendix B The results are summarized in Table 3 for subchronic exposures and Table 4 for lifetime exposures Simulations were performed for males and females separately Because of the overall similarity of the results for the two genders only the results of the males are presented in these tables
IIIB3 Combined occupational and ambient air exposures for workers
In the biomonitoring study by Houtman (1993) that formed the basis for the estimation of occupational exposures no information was available regarding the ambient air exposure for workers outside of the occupational settings The exposure of a worker who may live in an area with 13-D in the ambient air may be estimated
The scenario for a high end of exposure range could be modeled by using an applicator living 100 meters from an application field The total acute exposure would be the sum of the ADD for occupational exposure (212 ugkgday for 68 hours) and the ambient air exposure at 100 meter from the application fields (49 ugkgday see section IIIB2b) for the remainder of a day (172 hours) Because the exposure under the occupational setting is lower than the ambient air exposures the total exposure would be expected to be lower than the ambient air exposure for 24 hours This would also apply to subchronic seasonal and lifetime exposure scenarios The estimated occupational LADD of 0007-0012 ugkgday is 2-3 of the estimated 95th percentile of the 70-year average exposure distribution for a lifetime Therefore the ambient air exposures can be used to address the risk of 13-D exposures in California
13
Table 3 Monte Carlo simulation of the potential subchronic average daily exposures to 13-D in the ambient aira
Percentile of Exposure Distribution
Area-wide Expb
(ugkgday)
childc adultd
5 10 25 50 75 90 95 99
0470 0558 0770 1207 2052 3126 3750 4711
0188 0228 0314 0459 0676 0930 1103 1468
Mean sd
1551 1042
05297 02904
a Data taken from Appendix B Exposures of males and females were similar Data for males are presented b The simulation of exposures utilized the distribution of 62-day average air concentrations in a high-Telone-use township within a 9 townships area where Telone II is proposed to be applied to a total of 25 80-acre fields per year C Children 1-2 years old which represented the highest exposure age group from infants to 12 years old
d The 18-25 years old age group which represented the highest exposure age group from 18 to 70 years old
14
Table 4 Monte Carlo simulation of the potential lifetime average daily exposures to 13-D in the ambient aira
Percentile of Area-wide Expb
Exposure (ugkgday) Distribution
30 yrs 70 yrs
5 0027 0053 10 0032 0063 25 0044 0087 50 0066 0129 75 0103 0193 90 0150 0277 95 0179 0326 99 0230 0425
Mean 0080 0151 sd 0048 0087
a Data taken from Appendix B Exposures of males and females were similar Data for males were presented Lifetime exposure periods of 30 and 70 years were assumed b The simulation of exposures utilized the distribution of 3-year average exposures in a high-Telone- use township within a 9 townships area where Telone II is proposed to be applied to a total of 25 80-acre fields per year
15
IIIC Risk Characterization
The risk of acute and subchronicseasonal exposures were based on non-oncogenic adverse endpoints that were assumed to have a threshold level of exposure below which no deleterious effects are expected The risk of a non-oncogenic effect was characterized by the margin-of-safety (MOS) The MOSs for 13-D exposures were calculated as the ratio of the NOEL to the ADD or SADD Oncogenicity is the most sensitive endpoint for chroniclifetime exposures and is assumed to have no biological threshold The risk for lifetime exposures was calculated as the product of the LADD and the potency using both the MLE and UCL of the potency estimates
IIIC1 Acute MOS
The potential dose at the estimated acute NOEL was 548 mgkg based on the clinical signs of toxicity observed at the dose 10-fold higher This NOEL is used in the MOS calculation
Occupational exposures for workers
The occupational ADDs for loaders and applicators were taken from data in Table 2 The MOSs are calculated using the high ADD of 248 ugkgday for a loader and 212 ugkgday for an applicator These values were estimated from the highest urinary biomonitoring data of 5 workers loading or applying Telone II for 4 hours The MOSs are
Acute MOSloader 548(248 x 10-3) = 22000
Acute MOSapplicator 548(212 x 10-3) = 2600
Ambient Air Exposures for general population
The dose at the highest simulated 24-hour ambient air concentration of 019 mgm3 at 100 meters from fields was calculated as 0087 mgkgday for a child (see Section IIIB2b) The MOS for the acute exposure at 100 meters from the fields is
Acute MOS100 m 5480087 = 630
IIIC2 Subchronic MOS
The potential dose at the subchronic NOEL was 71 mgkgday based on the effects on the nasal epithelium in rats at a dose that was 3-fold higher
16
Occupational exposures for workers
The SADDs for loaders and applicators were taken from data in Table 2 The MOSs are calculated from the SADD of 016 ugkgday for a loader and 023 ugkgday for an applicator The MOSs for a loader and an applicator are
Subchronic MOSloader 71(016 x 10-3) = 44000
Subchronic MOSapplicator 71(023 x 10-3) = 31000
Ambient Air Exposures for general population
Data in Table 3 showed that the high range of the average daily exposure was 4711 ugkgday for a child (1-2 years old) This was the highest simulated potential exposure The MOS is
Subchronic MOS 71(4711 x 10-3) = 1500
IIIC3 Lifetime oncogenic risk
The MLE and UCL potency values extrapolated from the dose-response relationship of lung tumors in male mice were 0025 and 0055 (mgkgday)-1 respectively
Occupational exposures for workers
The LADDs for loaders and applicators were taken from data in Table 2 The potential oncogenic risk in a lifetime are calculated from the LADD of 0007 ugkgday for a loader and 0012 ugkgday for an applicator using both MLE and UCL of potency values The risks are
MLE Riskloader 0025 (mgkgday)-1 x (0007 x 10-3) (mgkgday) = 18 x 10-7
UCL Riskloader 0055 (mgkgday)-1 x (0007 x 10-3) (mgkgday) = 39 x 10-7
MLE Riskappl 0025 (mgkgday)-1 x (0012 x 10-3) (mgkgday) = 30 x 10-7
UCL Riskappl 0055 (mgkgday)-1 x (0012 x 10-3) (mgkgday) = 66 x 10-7
Ambient air exposures for general population
The potential oncogenic risks at the 50th and 95th percentile of the simulated distribution of average daily exposure for area-wide scenarios (Table 4) are presented in Table 5 Risks were calculated using both the MLE and UCL of potency estimates
17
Table 5 The potential lifetime oncogenic risk from 30 and 70 years of exposures to 13-D in the ambient aira
50th percentile 95th percentile Geographic locations
MLE UCL MLE UCL
30 years
Area-wideb 17 x 10-6 36 x 10-6 45 x 10-6 98 x 10-6
70 years
Area-wideb 32 x 10-6 71 x 10-6 82 x 10-6 18 x 10-5
a Risk was calculated as the exposure multiplied by the potency The exposures data were taken from Table 4 The MLE and UCL potency values extrapolated from the dose- response relationship of lung tumors in male mice were 0025 and 0055 (mgkgday)-1 respectively b The simulation of exposures utilized the distribution of 3-year average exposures in a high-Telone-use township within a 9 townships area where Telone II is proposed to be applied to a total of 25 80-acre fields per year
18
IV CONCLUSION
The potential risk from the proposed use of Telone II in California for 1994-95 has been assessed The occupational exposure appeared to be minimal compared to the potential ambient air exposures for the general public The MOSs for the estimated high values of acute and subchronicseasonal exposures for the general public were at least 630 The MOS exceeded the MOS of 100 which is generally considered as sufficient for protection against non-oncogenic effects when the NOEL used to calculate the MOS was established in laboratory animals
The potential lifetime oncogenic risk was calculated based on the DPR potency values and the exposure distributions generated from Monte Carlo simulations The calculated risk is approximately 2-fold lower using DPR potency when compared to the risk using US EPA potency The exposure used in risk calculation was the average exposure over a lifetime Although the risk may be higher for the potential episodically high exposures the current toxicity data are not sufficient for a quantitative assessment other than to assume that the risk is proportional to the lifetime annual average exposures The simulations of exposures utilized distributions of annual average ambient air concentrations simulated from a modified ISCST dispersion model and with the assumption that a field is treated with Telone II once every three years Air concentrations were simulated for characterizing the air concentrations of a township in Kern county that has the highest anticipated use of Telone II Using the distributions of air concentrations the subsequent Monte Carlo simulation of lifetime average exposures incorporated parameters of exposure such as daily geographic mobility and age-related breathing rates and body weights The lifetime average exposures were simulated both for a 30- and a 70-year exposure The current DPR default duration for a lifetime exposures to a pesticide is 70 years The simulated lifetime exposures represent the exposures for areas with proposed Telone II use The exposure for a 30-year duration was simulated for the purpose of comparison to the risk assessment submitted by DowElanco (Calhoun 1994)
At the 95th percentile of the area-wide exposure scenario the MLE and UCL of risk for a 30-year exposure were 45 x 10-6 and 98 x 10-6 They were approximately 50-67 higher than the risks estimated by Calhoun et al (1994) using different input parameters for the Monte Carlo simulation
19
REFERENCES
Barry T 1994 Memo from Terri Barry to Ruby Reed and Bruce Johnson on June 22 1994 regarding Simulated Telone acute exposure concentrations
Breslin W J H D Kirk C M Streeter J F Quast and J R Szabo 1987 Telone II soil fumigant Two-generation inhalation reproduction study in Fischer 344 rats Dow Chemical Company Laboratory Project Study M-003993-015 CPR Vol 50046-030 60676 (This study is also published as Breslin et al 1988 in Fund Appl Toxicol 12129-143)
Calhoun LL D D Fontaine B L Stuart and B D Landenberger 1994 13- Dichloropropene (13-D) An assessment of implied exposure and risk for the proposed commercial reentry of TELONE soil fumigant into California DowElanco
Coate W B 1979 Final report 90-day inhalation toxicity study in rats an mice Telone II Hazleton Laboratories America Inc DPR Vol 50046-010 36551
DowElanco 1994 Memo from Craig Blewett to Rich Bireley January 28 1994 regarding Revised permit conditions for Telone II and meeting presentation materials
Engler R 1994 An April 1 1994 memo from Engler Health Effects DivisionOPP on List of Chemicals Evaluated for Carcinogenic Potential
Houtman B A 1992 Managing worker exposure of 13-D in California
Houtman B A 1993 An evaluation of 13-dichloropropene worker exposure associated with Telone II soil fumigant loading application and reentry phase I DowElanco ECL92095 (Interim report)
IRIS (Integrated Risk Information System) 1994 US EPA
John J A P M Kloes L L Calhoun and J T Young 1983a Telone II Inhalation teratology study in Fischer 344 rats Dow Chemical Company DPR Vol 50046-010 36561
John J A P M Kloes L L Calhoun and J T Young 1983b Telone II Inhalation teratology study in New Zealand white rabbits Dow Chemical Company DPR Vol 50046-010 36562
Johnson B 1994a Memo from Bruce Johnson to Kean Goh on May 11 1994 regarding Potential impact of finer receptor grid on DowElanco evaluation of average air concentrations of 13-D in Kern County
Johnson B 1994b Memo from Bruce Johnson to John Sanders on July 19 1994 regarding Bufferzone calculations for 13-D in Kern
20
Konishi Y A Kawabata A Denda T Ikeda H Katada H Maruyama and R Higashiguchi 1980 Forestomach tumors induced by orally administered epichlorohydrin in male Wistar rats GANN 71(6) 922-923
Lomax L G L L Calhoun W T Stott and L E Frauson 1987 Telone II soil fumigant 2-year inhalation chronic toxicity - oncogenicity study in rats Dow Chemical Company Laboratory Project Study ID M-003993-009R DPR Vol 50046-031 60677
Markovitz A and W H Crosby 1984 Chemical carcinogenesis A soil fumigant 13- dichloropropene as possible cause of hematologic malignancies Arch Intern Med 1441409-1411
McConnell E E H A Solleveld J A Swenberg and G A Boorman 1986 guidelines for combining neoplasms for evaluation of rodent carcinogenesis studies JNCI 76283-289
NAS (National Academy of Sciences) 1980 Chapter 4 Toxicity of Selected Drinking Water Contaminants in Drinking Water and Health Volume 3 Washington DC
NTP (National Toxicology Program) 1985 Toxicology and carcinogenesis studies of Telone II in F344N rats and B6C3F1 mice NTP Technical Report Series No 269 US Department of health and Human Services Public Health Service National Institutes of Health NIH Publication No 85-2525
Parker C M W B Coate and R W Voelker 1982 Subchronic inhalation toxicity of 13-dichloropropene12-dichloropropane (D-D) in mice and rats Jour Toxicol Environ Health 9899-910
Stott W T J T Young L L Calhoun and J E Battjes 1984 Telone II soil fumigant a 13-week inhalation study in rats and mice Dow Chemical Company DPR Vol 50046- 038 71713
Stott W T K A Johnson L L Calhoun S K Weiss and L E Frauson 1987 Telone II soil fumigant 2-year inhalation chronic toxicity - oncogenicity study in mice Dow Chemical Company Laboratory Project Study ID M-003993-009R DPR Vol 50046-029 60675
Streeter C M J E Battjes and L G Lomax 1987 Telone II soil fumigant An acute vapor inhalation study in Fischer 344 rats Dow Chemical Company HETM-003993-018 DPR Vol 50046-032 62070
US EPA 1989 Exposure factors handbook Office of Health and Environmental Assessment US EPA Report No EPA6008-89043 WashingtonDC
Van Duuren B L B M Goldschmidt G Loewengart A C Smith S Melchionne I Seidman and D Roth 1979 Carcinogenicity of halogenated olefinic and aliphatic hydrocarbons in mice JNCI 631433-1439
21
Waechter J M Waechter K A Brzak L P McCarty M A LaPack and P J Brownson 1992 13-Dichloropropene (Telone II soil fumigant) Inhalation pharmacokinetics and metabolism in human volunteers DowElanco
22
Appendix A
SUMMARY OF TOXICOLOGY DATA
TELONE II (13-dichloropropene)
________________________________________________________________________
CALIFORNIA ENVIRONMENTAL PROTECTION AGENCY DEPARTMENT OF PESTICIDE REGULATION
MEDICAL TOXICOLOGY BRANCH
SUMMARY OF TOXICOLOGY DATA
TELONE II (13-dichloropropene)
Chemical Code 000573 Tolerance 50046 SB 950 137
August 18 1986 Revised 41687 71888 52389 42790 6190 61594 81094
I DATA GAP STATUS
Combined (onco + chronic) rat No data gap possible adverse chronic effects
Chronic dog No data gap possible adverse effect
Onco mouse No data gap possible adverse effects
Repro rat No data gap no adverse effects
Terato rat No data gap no adverse effects
Terato rabbit No data gap no adverse effects
Gene mutation No data gap possible adverse effect
Chromosome No data gap no adverse effect
DNA damage No data gap possible adverse effect
Neurotox Not required at this time
Note Toxicology one-liners are attached All record numbers through 117410 in 061 were examined indicates an acceptable study Bold face indicates a possible adverse effect Original Summary prepared by F Martz revised April 16 1987 July 18 1988 May 23 1989 April 27 1990 June 1 1990 June 15 1994 and August 10 1994 by J Gee Filename T940810 See also Guidance for the Reregistration of Pesticide Products (Reregistration Standard) Containing 13-Dichloropropene (Telone II) as the Active Ingredient US EPA 91886 CDFA Record 050620 The position of EPA (1986) was that if significant residues were found oral studies would be required in addition to the inhalation studies Gee 52389
DPR MEDICAL TOXICOLOGY TELONE II (13-DICHLOROPROPENE) TOX SUMMARY T940810 Page 2
II TOXICOLOGY ONE-LINERS AND CONCLUSIONS
These pages contain summaries only Individual worksheets may contain additional effects
ONCOGENICITYCARCINOGENICITY COMBINED RAT
010 036552 Toxicology and Carcinogenesis Studies of Telone II in F344N Rats and B6C3F1 Mice (NTP Frederick Cancer Research Center 585) Rats F344 strain Telone II (13-dichloropropene 875 pure) with epichlorohydrin as stabilizer 50 25 or 0 mgkg by oral gavage 3 times a week 52sexgroup with an additional 28sexgroup (3 as substitutes) in satellite groups with sacrifices at 9 16 21 24 and 27 months of 5sexgroup Study scientifically valid but UNACCEPTABLE and not upgradeable due to guideline deviations ONCO effects with NO NOEL forestomach cancer at 50 mgkg liver cancer in males at 25 and 50 mgkg trend for thyroid cancer in females mammary cancer in females at 50 mgkg with trend at 25 mgkg stomach epithelial hyperplasia at 25 and 50 mgkg (Reviewed 11686 by Martz)
031 005 060677 036218 Telone II Soil Fumigant 2-Year Inhalation 0hronic Toxicity-Oncogenicity Study in Rats (Dow Chemical Midland MI 71387 M-003993-009R) 13-Dichloropropene 921 (cis 495 and trans 426) 12-dichloropropane 07 13-dichloropropane 18 1-chlorohexane 11 with remaining 43 a mixture of isomers of chlorohexane chlorohexene and trichloropropene stabilized with soybean oil 70sexgroup exposed by inhalation 6 hoursday 5 daysweek for 2 years - whole body exposure - at 0 5 20 or 60 ppm nominal 10sexgroup sacrificed at 6 and at 12 months (interim report 036218) NOEL = 20 ppm (decreased weight gain changes in nasal tissues in males and females) no evidence of an oncogenic effect reported ACCEPTABLE with a possible adverse chronic effect (Gee 71188)
005 036218 Dow 985 (1 year interim report - see above) F344 strain exposure conditions identical to those of mouse study listed below (36219) UNREMARKABLE at 1 year nasal changes noted in mice not reproduced in rats no effects except slight weight-gain inhibition in high dose group (Martz 11386)
010 36551 90-day Inhalation Toxicity Study in Rats and Mice Telone II (Hazleton Laboratories 51579 Project No 174-127) Fischer 344 rats 10sexdose were exposed to 0 10 30 or 90 ppm nominal (actual - 0 1198 3214 and 9302 ppm) 6 hours per day 5 daywk for 13 weeks terminal body weights were significantly reduced (8-11) in the high dose male and female rats dose-related alterations of the nasal epithelium were observed in high dose of both sexes (1010 and 1010)and in mid-dose females (910) as reported in the Addendum to the Final Report dated 7979 giving a NOEL = 10 ppm in female rats and 30 ppm in males UNACCEPTABLE (deficiencies include no hematology no serum chemistry performed not all required tissues were examined histologically in control and high dose groups) not upgradeable Initially reviewed by Martz 42986 re-reviewed by C Lewis 7689 and updated by J Gee 61594 No worksheets
038 071713 Telone II Soil Fumigant A 13-Week Inhalation Study in Rats and Mice (Dow 113084) Telone II 909 lot WP-82-1111-56 given by inhalation 6 hrday 5 dayweek 10 Fischer 344 rats per sex exposed
DPR MEDICAL TOXICOLOGY TELONE II (13-DICHLOROPROPENE) TOX SUMMARY T940810 Page 3
to 0 10 30 90 or 150 ppm nominal 13-week exposure only findings were degeneration in the olfactory epithelium and hyperplasia of the respiratory epithelium in both sexes especially at 90 and 150 ppm body weight gains were significantly lower at 90 and 150 ppm NOEL = 10 ppm based on hyperplasia in 210 males at 30 ppm Supplementary data (Gee 52289)
CHRONIC DOG
50046-061 117410 Stott WT Stebbins KE Haut KT Quast JF and Shabrang SN TeloneII soil fumigant One-year dietary toxicity study in beagle dogs The Dow Chemical Co Midland Study ID M-003993-024 72292 Dogs were fed diets containing microencapsulated TeloneII at 0 05 25 or 15 mgkgday for 1 year NOEL = 25 mgkgday [hematology profile typical of hypochromic microcytic anemia related to increased hematopoiesis in bone marrow and extramedullary hematopoiesis in spleen in both sexes] Clinical signs in 2 high dose males of pale skinmucous membranes apparently reflected the anemia Body weights were depressed and relative liver weights were increased in both sexes at 15 mgkgday The relatively low NOEL for signs of anemia constitutes a possible adverse effect Acceptable Aldous 111593
046 075537 Telone II 13-Week Dietary Toxicity Study in Beagle Dogs Quast J F Dow Chemical Company August 1 1989 The 3-page letter was submitted as an adverse effects disclosure for microcytic hypochromic anemia in the 13-week study in beagle dogs Doses were 0 130 380 or 1000 ppm with Telone II incorporated in a starch sucrose matrix and administered in the dog chow The letter contains no data but states the anemia was dose-related Some dogs were being maintained after dosing for further study The final report has not yet been received by CDFA (Gee 42790)
Document 50046-043 contains a protocol (dated 41289) for a 13-week study with beagle dogs Title Telone II 13-Week Dietary Toxicity Study in Beagle Dogs Record 073875 The purpose was to evaluate the affects of dietary exposure of non-rodents to doses of 0 130 380 or 1000 ppm in the diet prepared with 13-dichloropropene formulated by microencapsulation in a starchsucrose matrix The document summarized several studies on dosing of dogs by several routes A cover letter dated April 27 1989 from the registrant still questioned the need for a chronic study (Gee 52389)
025 050620 The EPA Registration Standard dated September 18 1986 indicates that the requirement for a chronic feeding study in nonrodent species namely dog is dependent on the outcome of residue tests If residues are found in foodfeed commodities chronic feeding studies in rat and dog may be required Residue data for crop field trials are due in March 1989 Requirements for residues in foodfeed etc are reserved (Gee 41687) See 061 117410 for the full study (Gee 61594)
ONCOGENICITY MOUSE
007 28361 28362 and 28363 Parts of published report on three different exposure scenarios See 010 036554 for complete copy of the publication in J National Cancer Institute 63 (6) 1433-1439 (1979)
010 036553 Toxicology and Carcinogenesis Studies of Telone II in F344N Rats and B6C3F1 Mice (NTP Frederick Cancer Research Center 585) Mice B6C3F1 strain Telone II (875 13-dichloropropene) 100 50 or 0 mgkgday
DPR MEDICAL TOXICOLOGY TELONE II (13-DICHLOROPROPENE) TOX SUMMARY T940810 Page 4
by oral gavage 3 times a week 50sexgroup UNACCEPTABLE and not upgradeable due to guideline deviations but scientifically valid for female data ONCO effects with NO NOEL in females cancer of urinary bladder at 100 and 50 mgkg forestomach and lung at 100 mgkg results in males inconclusive due to inadequate randomization and poor control group survival (Martz 11786)
010 036554 Carcinogenicity of Halogenated Olefinic and Aliphatic hydrocarbons in Mice (Van Duuren B L et al NYU Med Ctr JNCI 63 1433-1439 1979) HaICR Swiss strain cis-13-dichloropropene (Chemical Samples Co Columbus OH) 122 mgmouse or 41 mgmouse by dermal application 3week for about 77 weeks initially reviewed as having caused no local or distant tumors UNACCEPTABLE and not upgradeable Reviewed 6385 by AAspostolou peer review 220 and 81886 by Martz Re-review as part of the risk assessment process noted that the incidence of lung tumors in both groups of treated mice was statistically significant by Fishers Exact Test although not so noted in the publication table The incidences were 30100 for controls and 1930 and 1730 at low and high doses respectively Remains UNACCEPTABLE but with a possible adverse effect (Gee 53190)
010 036554 Carcinogenicity of Halogenated Olefinic and Aliphatic Hydrocarbons in Mice (NYU Med Ctr JNCI 63 1433-1439 1979) HaICR Swiss strain cis-13-dichloropropene (Chemical Samples Co Columbus OH) 3 mgmouse once weekly x 77 weeks by subcutaneous injection examined injection site and liver only fibrosarcoma at injection site 630 vs 030 vehicle control probably due to irritation by physical-chemical properties of AI Otherwise insufficient for assessment UNACCEPTABLE and not upgradeable (AA 6385 Martz 220 and 81886)
010 036554 Carcinogenicity of Halogenated Olefinic and Aliphatic Hydrocarbons in Mice (NYU Med Ctr JNCI 63 1433-1439 1979) HaICR Swiss strain cis-13-dichloropropene (Chemical Samples Co Columbus OH) 122 mgmouse by dermal application once followed by promotion with 5 mg phorbol myristate acetate dermally 3week for about 77 weeks no tumors UNACCEPTABLE and not upgradeable (Reviewed 6385 by AA peer review 220 and 81886 by Martz)
029 006 060675 036219 Telone II Soil Fumigant 2-Year Inhalation Chronic Toxicity-Oncogenicity Study in Mice (Dow 71387 M-003993-009)
13-Dichloropropene 921 (cis 495 and trans 426) plus 12-dichloropropane 07 13-dichloropropane 18 1-chlorohexane 11 and the remainder a mixture of isomers of chlorohexane chlorohexene and trichloropropene lot TB831213-4 given by inhalation at 0 5 20 or 60 ppm nominal uncorrected for 92 purity 6 hoursday 5 daysweek for 2 years 70sexgroup with intermediate sacrifices of 10sexgroup at 6 months and at 12 months (interim report 036219 in 006) daily analytical data for 13-dichloropropene concentration Hyperplasia of the urinary bladder mucosa was found in females at 20 and 60 ppm and in males at 60 ppm with a trend at 20 ppm Increase in benign lung bronchioloalveolar adenomas in males at 60 ppm Degeneration of the olfactory epithelium and hyperplasia of the respiratory epithelium bilateral at 60 ppm in both sexes Decreased liver vacuolation in females at 60 ppm NOEL = 5 ppm ACCEPTABLE with possible adverse effects (Gee 71288)
DPR MEDICAL TOXICOLOGY TELONE II (13-DICHLOROPROPENE) TOX SUMMARY T940810 Page 5
006 036219 Dow 985 (1 year interim report B6C3F1 strain Telone II (lot TB831213-4) 60 20 5 or 0 ppm 6 hoursday x 5 daysweek x 6 or 12 months NO TUMORS slight focal hyperplasia and hypertrophy of epithelium of nasal turbinates at 20 ppm in males and at 60 ppm and in both sexes liver glycogen and kidney lipid decrease in males at 60 ppm (decreased organ weights and vacuolation) urinary bladder hyperplasia of transitional epithelium in females at 60 ppm possible adverse effects NOEL = 5 ppm (Martz 11486)
SUBCHRONIC
10 036551 90-Day Inhalation toxicity Study in Rats and Mice (Hazleton (VA) 579) CD-1 strain Telone II purity unspecified 90 30 10 or 0 ppm 6 hoursday x 5 daysweek x 13 weeks (65 exposures) Unacceptable and not upgradeable - was intended as range finder for future study EFFECTS In 90 ppm females - epithelium of dorsal nasal septum and turbinates - decreased cytoplasm and single cell necrosis slight weight gain reduction 90 ppm NOEL = 30 ppm (Martz 42986) In addition alterations in nasal epithelium were noted in high-dose female mice but not in male mice NOEL = 30 ppm in females and 90 ppm in males Revised by Gee 61594
038 071713 Telone II Soil Fumigant A 13-Week Inhalation Study in Rats and Mice (Dow 113084) Telone II 909 lot WP-82-1111-56 given by inhalation 6 hrday 5 dayweek 10 B6C3F1 mice per sex exposed to 0 10 30 90 or 150 ppm nominal 13-week exposure findings were degeneration in the olfactory epithelium and hyperplasia of the respiratory epithelium in both sexes especially at 90 and 150 ppm body weight gains were significantly lower at 90 and 150 ppm females in 90 and 150 ppm showed effects in the epithelial cells of the urinary bladder NOEL = 30 ppm Supplementary data (Gee 52289)
REPRODUCTION AND FERTILITY
010 036555 D-D A 10 Week Inhalation Study of Mating Behavior in Male and Female Rats (Shell (UK) 480) Wistar strain technical D-D (epi-chlorohydrin free) 537 13-dichloropropene remaining constituents mainly chlorinated isomersanalogs 96 32 14 or 0 ppm for 6 hoursday x 5 daysweek treated males mated with naive females after 2 4 7 and 10 weeks exposure treated females mated with naive males after 10 weeks exposure hematology serum chemistry urinalysis and histopathology on satellite animals 30 males and 24 females per group with 20 and 15 respectively for reproduction performance and the remainder for hematology etc UNACCEPTABLE and not upgradeable only 1 generation and inadequate group sizes Otherwise appears to be a well conducted and documented study with scientifically valid results NO reproductive effects Liver and kidney weight elevation at 96 ppm reversible upon withdrawal except female kidney values (Martz 2086)
030 060676 Telone II Soil Fumigant Two-Generation Inhalation Reproduction Study in Fischer 344 Rats (Dow Chemical 71387 M-003993-015) 13-Dichloropropene 912 lot TB831213-4 exposures of 0 5 20 or 60 ppm for 7 days increased to 0 10 30 or 90 ppm on day 8 6 hoursday 5 daysweek two generations two litters each 30sexgroup maternal animals removed from chamber after gestation day 20 until day 4 postpartum when separated from pups for the 6 hours exposure parental NOEL =
DPR MEDICAL TOXICOLOGY TELONE II (13-DICHLOROPROPENE) TOX SUMMARY T940810 Page 6
30 (decreased weight gain nasal tissue changes at 90 ppm) reproduction NOEL gt 90 ppm (no adverse effect on reproduction parameters) ACCEPTABLE (Gee 71388)
TERATOLOGY RAT
010 036561 Telone II Inhalation Teratology Study in Fischer 344 Rats and New Zealand White Rabbits (Dow 1083) F344 strain Telone II (13-dichloropropene 901 pure) 120 60 20 or 0 ppm via inhalation 30group Study and report ACCEPTABLE NO developmental effects (NOEL = 120 ppm for malformationsdevelopmental effects) maternal NOEL lt 20 ppm (reduced maternal weight gain at all 3 treatment levels) (Martz 22186)
TERATOLOGY RABBIT
010 036562 Telone II Inhalation Teratology Study in Fischer 344 Rats and New Zealand White Rabbits (Dow 1083) New Zealand White Telone II (13-dichloropropene 901 pure) 120 60 20 or 0 ppm via inhalation 17 - 24 pregnant rabbits per group Study OK but report incomplete reviewed as upgradeable with submission of historical control data 22186 The historical control data are in 50619 Document 50046-025 The study has been rereviewed as ACCEPTABLE 32687 NO developmental effects (NOEL = 120 ppm for malformations) NOEL = 20 ppm for reduced maternal weight gain (Martz 22186 and 32687)
GENETIC TOXICOLOGY
GENE MUTATION
016 004282 amp 004293 Mutagenicity of 13-Dichloropropene using Ames Testing (Schering AG summary report 982) Formulated mixtures containing 13-dichloropropene in addition to various other constituents were tested for mutagenic activity in the Ames Salmonella Test Results were conflicting and insufficient for independent assessment UNACCEPTABLE but upgradeable upon submission of complete report(s) Summary contains statement that positive effects were seen with TA1535 and TA100 but no data Report contains a statement that the methyl isothiocyanate in the sample tested caused cytotoxicity before the mutagenic effect was detectable No data (Reviewed 6385 BY AA peer review 81886 by Martz and 71888 by Gee)
010 036556 Mutagenicity of 13-Dichloropropene in Bacteria Test System (Nomura Sogo Res Inst 1278) E coli strain Br Wp 2 Try- 498-cis and 463-trans 13-dichloropropene 5000 2500 1000 500 250 100 25 or 0 microgplate +S9 Unacceptable and not upgradeable due to design deficiencies No mutagenic effects reported (Gee 22486)
010 036558 Mutagenicity of 13-Dichloropropene in Bacteria Test System (Nomura Sogo Res Inst 1278) Five Salmonella strains for plate assay 498-cis and 463-trans 13-dichloropropene 0-5000 microgplate + S9 G46 for host-mediated assay in ICR mice at 30 or 60 mgkg x 3 times3 hours UNACCEPTABLE and not upgradeable single plates Significant Positive response in several strains indicative of base-pair substitution negative in host-mediated assay (Gee 22486)
DPR MEDICAL TOXICOLOGY TELONE II (13-DICHLOROPROPENE) TOX SUMMARY T940810 Page 7
019 042945 The Evaluation of Telone II Soil Fumigant in the CHO CellHGPRT Forward Mutation Assay (Dow 22786) CHOHGPRT assay Telone II (489 cis and 432 trans 13-dichloropropene) 250 200 150 100 50 or 0 mM without S9 (3 trials) and 200 150 125 100 50 or 0 microM with S9 (1 trial) Report complete and study ACCEPTABLE NO evidence of mutagenicity (Gee 72486)
No record number Chemical Mutagenesis Testing in Drosophila III Results of 48 Coded Compounds Tested for the National Toxicology Program (Valencia R et al Environmental Mutagenesis 7 325 - 348 (1985)) 13-Dichloropropene technical 955 was tested with male Canton-S wild-type stock by feeding at 5570 ppm for 72 hours from soaked filter paper The males were mated to Basc females for 3 2 and 2 days No more than 40 females per parental male were mated from each brood A total of 6584 tests were performed The percent lethals were 012 for control broods and 030 for treated broods - considered positive by the authors The translocation test was negative No worksheet [Review done in connection with the risk assessment] (Gee 53190)
Summary Although the test in mammalian cells was negative there appear to be several studies with Salmonella giving positive results although none of those on file are acceptable The positive effect reported in 036558 was quite significant The possible adverse effect for gene mutation therefore stands at this time One problem is the volatility of the test material and care must be taken to control samples for this property From the text of the study with CHO the flasks were tightly capped and loss of test material should not have been a factor (Gee 71888)
CHROMOSOMES
010 036560 Evaluation of Telone II Soil Fumigant in the Mouse Bone Marrow Micronucleus Test (Dow 585) Telone II (495-cis and 426-trans 13-dichloropropene) 380 115 38 or 0 mgkg by oral gavage in CD-1 mice 5sexgroup 24 or 48 hour sac Reviewed 22586 as incomplete but upgradeable with justification of the use of only two sacrifice times This has been submitted as Record 55630 in 50046-025 based on excretion of 93 within 48 hours The study is now reviewed as ACCEPTABLE NO increase in MN-PCEs reported (Gee 22586 and 41687)
Note The reregistration standard of 1986 indicates that EPA is requiring additional testing for chromosomal effects notably in vivo testing of bone marrow in rats
DNAOTHER
010 036557 Mutagenicity Test on 13-Dichloropropene in Bacteria Test System (Nomura Sogo Res Inst 1278) Bacillus subtilis rec assay strains H17 and M45 498 cis- and 463 trans-13-dichloropropene 1250 500 125 50 or 0 microgwell without activation UNACCEPTABLE and not upgradeable due to design deficiencies Slight growth differences at highest level Reviewed 22486 by Gee
010 036559 Evaluation of Telone II in the Rat Hepatocyte Unscheduled DNA Synthesis Assay (Dow 485) UDS in rat hepatocytes Telone II (495 cis and 426 trans-13-dichloropropene) 1x10⁻⁷ to 3x10⁻³ M concentration
DPR MEDICAL TOXICOLOGY TELONE II (13-DICHLOROPROPENE) TOX SUMMARY T940810 Page 8
(solubility limit) plus control Report complete and study ACCEPTABLE NO evidence of UDS even when cytotoxicity was noted (Gee 22486)
Summary These two tests measure different endpoints so no one conclusion can be reached and a possible adverse genotoxic effect is noted Gee 71888
Note The reregistration standard of 1986 noted requirements for in vitroin vivo primary hepatocyte UDS testing both in vitro and in vivo exposure shyspecies not specified Record 036559 is not cited (Gee 52389)
Note In addition to the studies formally submitted by the registrant publications in the open literature have been reviewed (no worksheets) The conclusion is that exposure to telone was genotoxic in multiple tests with multiple endpoints The registrant has presented the position that the effects in early studies were due to mutagenic impurities and to the stabilizer The stabilizer has been changed in recent products In the absence of additional studies however which clearly demonstrate negative results the overall weight-of-evidence indicates that telone is mutagenic in both prokaryotes and eukaryotes (Gee 81094)
NEUROTOXICITY
Not required at this time
GENERAL INFORMATION
007 932850 Communication to EPA from Dow dated 2982 contains risk assessment based on data from NTP rat and mouse studies ( 036552 amp 53) as well as published dermal studies ( 036554) and refers to oncogenic effects noted in the former (Martz 81886)
016 932849 932853 and 022757 Contain preliminary summary of NTP studies ( 036552 amp 53) summary of mutagenicity studies showing positive effects ( 036556-58) and summary of the one generation reproduction study with technical D-D ( 36555) respectively (Martz 81886)
APPENDIX B
EXPOSURE ASSESSMENT
Human Exposure Assessment for 13-dichloropropene
by
James R Sanborn Staff Toxicologist
Sally Powell Senior Environmental Research Scientist
HS 1634
May 26 1989 Revised July 20 1994
California Environmental Protection Agency Department of Pesticide Regulation Worker Health and Safety Branch
1020 N Street Sacramento California 95814
ABSTRACT
The soil fumigant 13-dichloropropene (13-D) is used to control soil parasitic nematodes and other soil pests in annual crops and some perennials before planting Metabolism and pharmacokinetic data on 13-D indicate facile conjugation as a mercapturate and renal elimination after inhalation The primary mode of exposure is inhalation with dermal absorption of the vapor considered unimportant Inadvertent exposure of humans during application equipment failure or repair has resulted in skin andor eye irritation Biological monitoring of workers demonstrated an estimated Absorbed Daily Dosage of 19 ugkgday (113 and 073 ugkgday for application and loading respectively) when adjusted for respiratory protection worn during the entire fumigation cycle These adjusted numbers are reflective of practices to be implemented in California should 13-D be reinstated including spill control dry disconnects and vapor recovery measures Non-occupational inhalation exposure for residents of a Telone reinstatement area was estimated by stochastic simulation Estimated 95th percentile Lifetime Average Daily Dosages ranged from 0167 ugkgday for residents living 500 m from treated fields for 30 years to 0373 ugkgday for residents living 100 m from fields for 70 years Estimated 95th percentile 62-day Average Daily Dosages ranged from 0674 ugkgday for infants living 500 m from treated fields to 6272 ugkgday for young children living 100 m from fields This report was prepared as Appendix B to the Departments risk assessment document for 13-D The necessity for this risk document stemmed from the identification of adverse effects in acute and chronic studies as well as characterization of 13-D as an oncogen in rat chronic feeding and mouse inhalation studies
APPENDIX B
CALIFORNIA ENVIRONMENTAL PROTECTION AGENCY DEPARTMENT OF PESTICIDE REGULATION WORKER HEALTH AND SAFETY BRANCH
HUMAN EXPOSURE ASSESSMENT
13-DICHLOROPROPENE
May 261989 Revised July 20 1994
INTRODUCTION
The fumigant 13-dichloropropene (13-D) (CAS 542-75-6 molecular formula C3H4Cl2) is a liquid used as a soil treatment for the control of plant parasitic nematodes and other soil pests The physical properties of 13-D are listed below
Boiling point 108oC (Composite of cistrans isomers higher BP 1120oC lower BP 1043oC) Vapor pressure 273 mm at 25oC Density 12 gml at 25oC Water solubility 2180 ppm (cis-) 2320 ppm (trans-) Octanolwater partition coefficient 104 Cis-trans- ratio 11
EPA STATUS
A Registration Standard was issued in September 1986 for 13-D which includes exposure and risk assessments for workers handling 13-D These assessments assume that inhalation is the primary route of exposure and that dermal exposure may only contribute during episodes of equipment repair or failure Respirators chemically resistant clothing and gloves are required during mixing and loading
USAGE
13-D is manufactured by Dow Chemical Co as a formulation containing 94 active ingredient (11 cis-trans- isomer ratio) and 6 inert ingredients Commercial 13-D is sold under the name Telone IItrade and contains 95 lbs ai per gallon 13-D is registered for use on more than 120 crops and ornamentals It is used for preplant soil treatments for vegetable crops field crops deciduous fruit trees nut trees and vines It is recommended that soils where annual crops are grown be treated each year before planting Over 15 million pounds were reported sold in California in 1987 (California Department of Food and Agriculture 1988) Application rates of 13-D depend on crop and soil type and range from 43 to 970 lbs aiacre The soil surface is sealed by covering or rolling after application to increase efficacy by reduction of vapor loss Application equipment injects 13-D to a depth of at least 12 inches below the sealed soil surface
LABEL PRECAUTIONS
The label for Telone II contains the signal word WARNING and the following precautionary statements
PRECAUTIONARY STATEMENTS
HAZARDOUS TO HUMANS AND DOMESTIC ANIMALS HAZARDOUS LIQUID AND VAPOR
o MAY CAUSE ALLERGIC SKIN REACTION o MAY BE FATAL IF INHALED ABSORBED THROUGH SKIN OR SWALLOWED o CAUSES SEVERE EYE DAMAGE o CAUSES BURNS OF SKIN o MAY CAUSE LUNG LIVER AND KIDNEY DAMAGE AND RESPIRATORY SYSTEM UPON
PROLONGED CONTACT o Do not breathe vapor o Do not get in eyes on skin on clothing o Do not take internally o Use only with adequate ventilation o Wear eye and skin protection necessary to prevent contact when handling TELONE II o Wash thoroughly with soap and water after handling and before eating or smoking o If protective gear such as boots or gloves becomes contaminated immediately wash with
soap and water Never wear protective gear having the odor of 13-dichloropropene Aerate and wash all protective gear thoroughly after each use until odor is gone
o Render unusable and dispose of contaminated leather goods including shoes o Do not apply this product in such a manner as to directly or through drift expose workers or
other personnel The area being treated must be vacated by unprotected persons
California regulations and permit conditions Additional requirements
California regulations require respiratory protection when inhalation exposure potential is high (eg during loading and equipment repair) Eye and skin protection (gloves and chemical resistant clothing) are required when handling Telone II
The California permit conditions will require additional protective equipment Loaders will be required to wear full-face respirators Applicators must either wear a half-face respirator or be inside a charcoal-filtered cab during application Workers re-entering a treated area during the first 7 days post application will be required to wear a one-half face respirator
3
___________________________________________________________________________
___________________________________________________________________________
WORKER ILLNESS
Table 1 shows that from 1982-1990 there were 55 illnesses that were related to exposure to 13-D In terms of type of illness they were almost equally divided between systemic (16) eye (14) and skin (18) With respect to the causality most of the illnesses were classified as definite (33) followed by probable (9) and possible
Table 1 13-dichloropropene illnesses in California (1982-1990)
Year Type Causality
Systemic Eye Skin EyeSkin Definite Probable Possible
1982 4 2 1 0 1 2 4 1983 2 3 1 0 5 1 0 1984 1 3 2 0 4 1 1 1985 0 2 3 0 4 1 0 1986 1 0 2 1 1 2 1 1987 1 0 0 0 1 0 0 1988 1 2 7 0 6 2 2 1989 1 2 1 2 5 0 1 1990 5 0 1 0 6 0 0
METABOLISMPHARMACOKINETICS
ANIMAL STUDIES
Inhalation
Rats exposed nose-only to 30 90 300 or 900 ppm of 13-dichloropropene (cis- 493 transshy428) for three hours absorbed 14 29 85 and 171 mgkg respectively or 82 65 66 62 percent respectively of the exposure dose (Stott and Kastl 1986) Decreases in percent absorbed as the exposure concentration increases are apparently related to the decreased ventilation frequency at higher exposure levels Tissue distribution of inhaled vapors indicated the lungs contained approximately 50 percent of the total inhaled vapors and the nasal passages contained an additional 10-16 percent Depuration of 13-D in the blood was biphasic with the initial half-life estimated to be 3-6 minutes and the terminal half-life 30-40 minutes Levels of protein sulfhydryl amino acids were reduced but no reduction in pulmonary sulfhydryl amino acids was observed Similar results for rats were reported for tissue distribution and glutathione depletion after a one-hour exposure (Fisher and Kilgore 1988a)
The characterization of the primary urinary metabolite from rats after inhalation was accomplished by Fisher and Kilgore (1988b) who found a mercapturate after a one hour exposure to 13-D at 40 107 284 398 or 789 ppm The excretion of the conjugate was nearly linear with respect to 13-D exposure up to 400 ppm Above 400 ppm the excretion of the mercapturate declined relative to this initial linearity This may have been due to decreased ventilation frequency in rats exposed three hours to doses greater than 90 ppm as reported by Stott and Kastl (1986) Alternatively it may have been due to depletion of conjugable glutathione
4
Oral dosing
Several investigators have examined the metabolic fate of 13-D in animals after an oral dose Hutson et al (1971) reported that 81 of 10-mg doses of cis-13-D and 57 of 10-mg doses of trans-13-D were eliminated in the urine Dietz et al (1984 ab) reported 50-80 percent renal elimination and 14-17 percent elimination as CO2 in rats or mice treated with 13-D No evidence of saturation of metabolic pathways was observed up to 50 mgkg in these later studies Urinary elimination of 14C-equivalents was estimated to have a half-life of approximately 55 hours
The primary metabolite in urine of rodents dosed orally with 13-D is N-acetyl-S-(3-chloropropshy2-enyl) cysteine (DCPMER) and its sulfoxide This indicates that 13-D is metabolized and conjugated via a glutathione pathway in rodents The formation of this metabolite is consistent with the loss of non-protein sulfhydryl levels in the liver and stomach after per os doses with 13-D (Dietz et al 1984 Climie et al 1979)
HUMANS
Inhalation
In workers exposed to 13-D during loading and application Osterloh et al (1984 1989) Brouwer et al (1991) and van Welie et al (1991) observed DCPMER as a urinary metabolite The common urinary metabolite in rodents and humans indicates that these species metabolize 13-D by similar metabolic pathways
A PBPK study was conducted by the registrant in which six humans were exposed to 13-D in an inhalation chamber at 1 ppm for 6 hours (Waechter et al 1992) Estimates of respiratory uptake made from analysis of exhaled breath during the exposure averaged 78 for the two isomers Urine was collected during and after exposure (84 hrs post exposure) Excretion of the cis- and trans-mercapturates was complete 36 hours post exposure The combined conversion of inhaled 13-D to the two mercapturates was found to be 24 (Stott 1992)
DERMAL ABSORPTION
The high vapor pressure of 13-D (273 mm) reduces its dermal absorption potential There is a single report in the literature concerning dermal absorption of 13-D and other low-boiling organic chemicals (Cohen and Poppendorf 1989) The experimental details are not complete as the paper reported the values from a thesis by the first author The values reported for dermal absorption of 13-D in rats in vivo were 062 and 15 for doses of 19 and 19 ugcm2 respectively This range of absorption values was found for exposed skin that was not occluded
5
___________________________________________________________________________
___________________________________________________________________________
___________________________________________________________________________
___________________________________________________________________________
WORKER EXPOSURE
Inhalation
Worker inhalation exposure assessed by breathing zone measurements during loading application or equipment repair are summarized in Table 2
Table 2 Breathing zone air concentrations of workers handling 13-dichloropropene during loading and application
ppm Reference Date
037a Davies and Fraser 1988 004-040 Tobol and Axe 1982b
038a Maddy et al 1980 071a Maddy et al 1982 017a Fong and Maykoski 1985 lt10a Albrecht 1987 lt02a Cook 1982b
a Time-weighted average b Cited by Davies and Fraser (1988)
These studies suggest that workers are exposed to time-weighted average levels that are below the recommended 1 ppm Permissible Exposure Limit set by the Occupational Safety and Health Administration
Since concentrations were measured in the workers breathing zones while they performed a variety of tasks (some loaded and some applied others loaded or applied and some unspecified) the reported inhalation exposure results from a composite of work tasks The individual studies did not always report exposures by task nor did they report any more than TWA values or monitoring results making it difficult to obtain an absorbed dose for each work task
Table 3 Potential inhalation exposure for 13-dichloropropene estimated from reported breathing zone concentrations assuming a respiratory rate of 29 Lmin
Study mg8-hr day
Poppendorf et al(1983) 1423 Maddy et al (1980) 240 Maddy et al(1982) 448 Fong and Maykoski(1985) 108 Davies and Fraser (1988) 233 Cook(1983) 126 Albrecht1987) 631
Geometric Mean 315
6
___________________________________________________________________________
___________________________________________________________________________
The air monitoring results of several studies have been converted to potential inhalation exposures in mg8-hr day by assuming a respiration rate of 29 Lmin (Table 3) The geometric mean of these data is reported because the data are log-normally distributed (Shapiro and Wilk 1965) It is conventional to treat exposure data by this statistical method as it allows the use of all the environmental or exposure data that may be widely variant (Owen and DeRouen 1980) If the mean for potential inhalation exposure from breathing zone measurements is mitigated by a respirator (90 reduction in exposure) corrected for respiratory uptake (78 Waechter et al 1992)) and a 70-kg person is assumed then the ADD (Absorbed Daily Dosage) is 351 ugkgday
Hand Exposure
The data available on potential hand exposure to 13-D are conflicting Maddy et al (1980 1982) reported hand a contamination level of 164 ughr for workers wearing gloves The other data on hand exposure (Table 4) were taken from the work of Davies and Fraser (1988) on an application of 13-D in Canada The range of the data for the eight individuals hand residues was 01-570 mghr with a geometric mean of 97 mghr
Table 4 Hand exposure to 13-dichloropropene during loadinga
Worker mghr
1 14 2 08 3 265 4 193 5 570 6 07 7 333 8 01
Geometric Mean 97
a Davies and Fraser (1988)
This exposure value for the hand of 97 mghr is almost 600-fold greater than that reported by Maddy (1982) The reasons for this large difference may be in the experimental design In the Davies and Fraser (1988) study the protocol was a cotton glove-polyethylene glove (1 mm)-cotton glove arrangement where the inner cotton gloves were analyzed for 13-D The inner glove provides an absorptive sink whereas the outer glove compared to the smooth protective glove normally worn provides a sponge for liquid 13-D for eventual penetration through the thin polyethylene glove This type of thin glove (polyethylene) is not normally utilized in application of this material as it would not withstand the physical abuse of daily operations during loading the fumigant into the tanks It is likely that in the studies of Maddy et al (1982) where hand residues were monitored under normal work conditions that thicker gloves were worn Further Maddy suggests that hand washes may not be an effective means for the removal of residues because some evaporation may have occurred as well as some dermal absorption Even so the analysis of hand washes in the work reported by Maddy et al reported microgram amounts of 13-D rather than the milligram amounts in the work of
7
_____________________________________________________________________
_____________________________________________________________________
Davies and Fraser While the Maddy data is very likely an underestimate of dermal exposure the dermal estimates of Davies and Fraser are overestimates due to the experimental design Since the hand exposure values are for 12 hrsday (estimated daily loading time) the dermal component becomes a minor contributor of the overall human exposure which is primarily via inhalation
Annual and Lifetime Exposure Days
Estimates of worker exposure time are provided by the US EPA Data Call-In for handlers of 13-D in crops grown in California that have been treated with 13-D (Houtman 1992) This survey provided information on the number days per year for each crop that 13-D was handled for applicators and loaders in California (Table 5 ) The maximum number of days per career was estimated to be 270 The number of days per career ranged from a low of 24 for potatoes to a high of 270 for brassica It is possible that the same individuals applying for brassica could be applying in vegetables which could mean that an individuals exposure days per year or career could be as high as the total for all crops However it is likely to be much less because the calendar window for application to each crop prevents any one person from working all of them
Table 5 Annual and lifetime handling days for loaders (L) applicators (A) and repairs (R)
Tomato Potato Cotton Vegetables Brassica Beets TreeVine LAR LAR LAR LAR LAR LAR LAR
Annual Custom 162334 444 403626 183524 363636 101010 2298
Grower 111 111 2213 353535 000 111 444
Lifetime Custom 104150221 242424 260234169 108210144 270270270 656565 1988172
Grower 454545 252525 99585 875875875 000 454545 121212
Biological Monitoring
Osterloh et al (1984 1989 a and b) reported human exposure studies with 22 workers loading and applying in which they conducted urinary monitoring for N-acetyl-S-(3-chloroprop-2shyenyl)cysteine (DCPMER) Respiratory protection (half-face) was worn only during loading and not during application An average of 34 mg of DCPMER was excreted in the 24-hour period after exposure Correction for the molecular weight difference between 13-D (111) and DCPMER (237) gives an ADD of 16 mgpersonday or 227 ugkgday Using the data of Davies and Fraser (1988) it is possible to calculate the percentage of the exposure received during application and loading In Davies and Fraser it was determined that 261 percent of the exposure occurred during application 739 during loading Osterloh et al assumed 90 protection from the half-face respirator worn during loading hence the inhaled dose was 01 times the exposure During application 10 (0 respiratory protection) indicates the absence of respirators The absorbed dose for each activity may be found by the following equation
8
Loading Application (739 )(X)(01) + (261)(X)(10) = 227 ugkgday (1)
where X is exposure Solving for X gives 678 ugkgday Putting this value back into equation (1) and adding respiratory protection (half-face respirators) during application gives
Loading Application (739)(678)(01) + (261 )(678)(01) = 68 ugkgday
The value of 68 ugkgday is the expected ADD if half-face respirators are worn during both loading and application
Houtman (1993) monitored five individuals loading or applying 13-D in Washington state The same individual did not do both tasks These applicators and loaders carried out one application per day at a rate of 25 galacre lasting about four hours One application was done without mitigation measures while the others used various mitigation measures specified by the US EPA including dry disconnects (with and without vapor recovery) spill control at the end of the rows and a cab with charcoal-filtered air Houtman collected urinary monitoring data only for the application conducted without mitigation measures To estimate the absorbed daily dose from these unmitigated conditions respiratory protection factors of 09 and 095 for half-face and full-face respirators were used for applicators and loaders respectively The human chamber PBPK exposure study data were used in the absorbed dose calculation These respiratory protection requirements for loaders and applicators were part of the Permit Conditions in California for the flux studies and the Monterey Commercial Use Project These same respiratory protection conditions will be required if 13-D is reinstated in California
The exposure data shown in Table 6 as geometric means have been normalized to an 68shyhour day which is consistent with the data of Davies and Fraser (1988) and allows comparison with the data of Osterloh et al where one person performed both loading and application
Houtman (1993) found that utilizing spill control during application reduced the ambient air concentrations by 79 The urinary metabolite data were adjusted by this factor The absorbed dose was adjusted for the wearing of a one-half face respirator from the unmitigated application in Washington The final adjustment of the data from Washington was the factoring of the reduced rate in California (12 galacre) as compared to the 25 galacre that were used in the studies in Washington The loader exposure data were not adjusted for the reduced rate in California as the exposure occurs primarily during the connecting and disconnection of the hose from the nurse tank and is unrelated to the amount placed in the tank on the tractor
With respect to the estimation of AADD and LADD the range of values for loading and applying were obtained from the crop specific data compiled in Table 5 There are several reasons for the reduced exposure of a combined (one person doing both tasks) load and apply (19 ugkgday) in the Washington study (Houtman 1993) as compared to the earlier combined estimate of Osterloh et al (68 ugkgday) Firstly for the loader the Washington study used dry disconnects and vapor recovery devices For the applicator spill control was used at the end of the rows Each of these mitigation strategies reduces ambient air concentration which resulted in lower estimated exposure value of more than three-fold It is further likely that the soil moisture content will be higher in California than occurred during the applications in Washington This will further reduce emissions
9
_____________________________________________________________________
_____________________________________________________________________
Table 6 ADD AADD and LADD values for loading and application of 13- dichloropropene
Study Task ADD1 Days SADD4 AADD5 Days LADD6
(ugkgd) Year (ugkgd) (ugkgd) Career (ugkgd)
Osterloh et al LoadApply 680
Houtman Load 0733 4 0016 0008 24 69x10-4
40 016 008 270 77x10-3
Apply 1133 4 36
0025 023
0012 011
24 270
11x10-3
12x10-2
Total2 186
1 Absorbed Daily Dosage two load and application cyclesday body weights of study volunteers used in calculations
2 One person doing both loading and applying-for comparison to studies of Osterloh et al 3 Normalized to 68 hrs based on registrant study (Davies and Fraser 1988) for one
person doing both tasks to be compared with Osterloh et al 4 Split application for brassica 90-day window (see Table 5) 5 Annual Average Daily Dosage (365 daysyear) 6 Lifetime Average Daily Dosage 70 years life (25550 days)
Exposure Appraisal
The exposure estimates based on the Houtman (1993) study in which exposures were measured separately for loading and application should be used for the assessment of risk These estimates are based on biological monitoring that assessed both cis- and transshymercapturate metabolites in the urine and utilized the pharmacokinetic information developed from exposure of humans under controlled conditions Hand exposure information developed by previous investigators was not used as this route of exposure would be reflected in the total exposure measured by the biological monitoring
None of the occupational exposure studies in which biological monitoring was conducted employed exactly the mitigation measures that would be required in California These requirements are for full-face respiratory protection during loading and half-face protection during application
NON-OCCUPATIONAL EXPOSURE
Inhalation exposure was estimated for residents of an area where Telone is used in carrot growing Both lifetime and subchronic (seasonal) exposures were estimated for residents of the area in general and for residents with homes at specified distances from Telone-treated fields (100 200 and 500 meters) The estimated lifetime exposure distributions are given in Tables 7 through 10 seasonal exposures in Tables 11 through 14
10
=
The exposure assessment relied on simulated air concentrations from a study provided by the registrant (Calhoun et al 1994) in which the ISCST simulation model (Wagner 1987) was used to predict concentrations of 13-D in air for a scenario of limited reintroduction of Telone IItrade soil fumigant in carrots In the use scenario modeled Telone is applied to 25 80-acre fields (2000 acres total) per year in a 9-township (324-square-mile) area in Kern County Under this scenario there is no other use of Telone All applications are at the rate of 12 gallons per acre and no field is treated more than once in three years Calhoun et al simulated three years of daily air concentrations for one point at the center of each section in the reintroduction area to produce an annual average daily concentration for each point The locations of treated fields were assigned randomly in their model so that concentrations at the section centers vary in part due to being different distances and directions from applications The modeled concentrations thus represent long-term ambient concentrations for the reintroduction area Calhoun et al presented separately the concentrations for the township of highest Telone use within the 9-township area These concentrations were used in the exposure assessment
Probability distributions of exposure were estimated using stochastic simulation (Monte Carlo) methods implemented with the program RISK (Palisades Corporation 1992) The distribution of lifetime average daily dose (LADD) as ug of 13-D inhaled per kg of body weight per day (ugkgday) was estimated separately for persons living 1) the first 30 years of and 2) all of a 70-year lifetime in the reintroduction area Seasonal exposure was estimated for July-August the period of greatest Telone use by adjusting the long-term air concentrations for proportional use and mass loss during that 62-day period Additional simulated air concentrations provided by the Environmental Monitoring Branch (Johnson 1994a) were incorporated to estimate both lifetime and 62-day exposures to residents whose dwellings are close to treated fields Exposure distributions were estimated separately for residents living 100 200 and 500 meters from the edges of treated fields Each estimated exposure distribution is based on a simulation with 10000 trials
LADD (ugkgday) was calculated by the following equation
10
([ ]) i 1
where the summation is over 10 age intervals RTi = number of years in age interval i that the person
resides in the Telone use area Conci = average of air concentrations (ugm3) in 5
locations weighted by the proportion of time spent in each location in interval i
BRi = average breathing rate (m3day) at each of 4 activity levels weighted by proportion of time spent at each level in interval i
BWi = body weight (kg) in interval i and 70 years is the assumed lifetime
LADD = RT Conci x BR BW 70i i i
11
Seasonal exposure (62-day average ugkgday) was calculated separately for each age interval as Conc x BR
Average daily dose = BW
where concentration breathing rate and body weight are as defined above for LADD but with air concentrations modified to approximate seasonal averages as explained in the next section
Concentration breathing rate and body weight were stochastic variables in the exposure simulation model The statistical distributions used to simulate them are described in the sections on specific input variables following Tables 7-14
12
___________________________________________________________________________
Table 7 Lifetime average daily dose (ugkgday) of 13-D inhaled by residents of an area where Telone is applied to a total of 25 80-acre fields each year
Residence Time
Birth to age 30 Birth to age 70 Male Female Male Female
Mean 00800 00783 01510 01436 Std Deviation 00480 00487 00867 00902
Percentile 5 0027 0026 0053 0047
10 0032 0031 0063 0056 25 0044 0042 0087 0078 50 0066 0063 0129 0116 75 0103 0101 0193 0186 90 0150 0148 0277 0270 95 0179 0179 0326 0330
975 --a -- -- -shy99 0230 0236 0425 0444
a not calculated
Table 8 Lifetime average daily dose (ugkgday) of 13-D inhaled by residents living 100 m from treated fields in an area where Telone is applied to a total of 25 80-acre fields each year
Residence Time
Birth to age 30 Birth to age 70 Male Female Male Female
Mean 01022 01001 01892 01829 Std Deviation 00514 00515 00926 00959
Percentile 5 0042 004 0078 0071
10 0048 0047 0091 0084 25 0063 0061 012 0111 50 009 0087 0168 0159 75 0129 0128 0238 0233 90 0176 0174 0319 0319 95 0204 0201 0373 0371
975 0228 0227 0416 0423 99 0262 0257 0481 0481
13
___________________________________________________________________________
Table 9 Lifetime average daily dose (ugkgday) of 13-D inhaled by residents living 200 m from treated fields in an area where Telone is applied to a total of 25 80-acre fields each year
Residence Time
Birth to age 30 Birth to age 70 Male Female Male Female
Mean 00996 00973 01846 0178 Std Deviation 00501 00499 00901 00932
Percentile 5 0039 0038 0073 0067
10 0046 0044 0087 008 25 0061 006 0116 0108 50 0088 0086 0165 0156 75 0127 0124 0234 0227 90 0171 0168 0311 0307 95 0199 0196 036 0363
975 0222 022 0408 0414 99 0253 0248 0458 0465
Table 10 Lifetime average daily dose (ugkgday) of 13-D inhaled by residents living 500 m from treated fields in an area where Telone is applied to a total of 25 80-acre fields each year
Residence Time
Birth to age 30 Birth to age 70 Male Female Male Female
Mean 0084 00818 01577 01498 Std Deviation 00423 00419 00772 00781
Percentile 5 0034 0033 0065 0059
10 004 0039 0076 0069 25 0053 0051 0101 0093 50 0074 0071 014 013 75 0106 0103 0198 0189 90 0144 0141 0265 0259 95 0169 0167 031 0305
975 0191 0189 0352 0352 99 0216 0212 04 04
14
Table 11 Average daily dose (ugkgday) of 13-D inhaled by residents during the 62-day period of highest Telone use in an area where Telone is applied to a total of 25 80-acre fields each year
Age Group
lt 1 1 lt 2 2 lt 3 3 lt 6 6 lt 9 Male Female Male Female Male Female Male Female Male Female
Mean 02499 02707 15513 16841 13685 14366 11103 11467 10548 10651 Std Deviation 02270 02431 10419 11219 09039 09243 07460 07561 06797 06863
Percentile 5 0045 0050 0470 0520 0422 0464 0333 0361 0330 0326
10 0058 0065 0558 0616 0501 0549 0399 0426 0397 0395 25 0098 0108 0770 0841 0691 0750 0553 0589 0558 0560 50 0173 0192 1207 1308 1070 1134 0869 0904 0849 0863 75 0321 0343 2052 2244 1815 1897 1466 1507 1367 1396 90 0539 0590 3126 3385 2738 2804 2242 2249 2050 2038 95 0714 0789 3750 4047 3260 3375 2659 2731 2464 2474
975 0903 0966 4233 4530 3667 3821 3010 3137 2783 2880 99 1125 1183 4711 5124 4108 4260 3468 3522 3230 3296
9 lt 12 12 lt 15 15 lt 18 18lt 25 25 lt 70 Male Female Male Female Male Female Male Female Male Female
Mean 07953 07730 06536 05394 05300 04984 05297 04964 04809 04414 Std Deviation 05168 04897 04050 03320 03172 02980 02904 02913 02688 02840
Percentile 5 0239 0237 0208 0172 0176 0164 0188 0164 0167 0132
10 0291 0292 0254 0209 0214 0196 0228 0200 0201 0164 25 0417 0412 0360 0295 0298 0278 0314 0284 0281 0236 50 0645 0635 0545 0453 0447 0419 0459 0422 0416 0362 75 1029 1007 0835 0694 0676 0645 0676 0637 0618 0567 90 1529 1455 1209 0998 0977 0917 0930 0904 0848 0830 95 1870 1767 1457 1207 1171 1103 1103 1085 1018 1022
975 2118 2080 1713 1413 1338 1279 1267 1252 1166 1190 99 2496 2341 2020 1645 1568 1450 1468 1433 1342 1382
15
Table 12 Average daily dose (ugkgday) of 13-D inhaled during the 62-day period of highest Telone use by residents living 100 m from fields in an area where Telone is applied to a total of 25 80-acre fields each year
Age Group
lt 1 1 lt 2 2 lt 3 3 lt 6 6 lt 9 Male Female Male Female Male Female Male Female Male Female
Mean 04940 05352 30723 33330 26876 27770 21802 22126 19918 19861 Std Deviation 03548 03830 14181 15406 12335 12549 10277 10370 09528 09564
Percentile 5 0118 0128 1368 1490 1206 1263 0942 0968 0852 0833
10 0152 0166 1545 1672 1347 1418 1069 1098 0969 0965 25 0238 0258 1924 2096 1697 1757 1366 1393 1255 1254 50 0395 0425 2710 2949 2360 2470 1918 1960 1760 1766 75 0641 0699 4008 4347 3502 3620 2833 2868 2545 2529 90 0976 1076 5137 5567 4481 4594 3657 3725 3371 3371 95 1217 1331 5792 6272 5021 5177 4158 4258 3831 3879
975 1450 1563 6306 6950 5536 5720 4615 4647 4261 4271 99 1680 1784 6915 7610 6021 6204 5033 5157 4801 4847
9 lt 12 12 lt 15 15 lt 18 18lt 25 25 lt 70 Male Female Male Female Male Female Male Female Male Female
Mean 14857 14065 11533 09575 09336 08872 08833 08610 08063 08020 Std Deviation 07344 06874 05796 04659 04444 04134 03970 04030 03694 04061
Percentile 5 0603 0573 0464 0396 0393 0379 0383 0359 0350 0305
10 0701 0667 0539 0459 0454 0438 0447 0422 0405 0366 25 0923 0890 0723 0610 0599 0571 0584 0558 0526 0499 50 1314 1244 1020 0849 0833 0792 0802 0770 0733 0704 75 1899 1795 1456 1209 1184 1126 1111 1091 1007 1034 90 2530 2389 1927 1605 1549 1481 1436 1433 1316 1382 95 2925 2770 2287 1863 1809 1695 1662 1661 1524 1604
975 3280 3076 2623 2102 2000 1867 1841 1818 1725 1790 99 3678 3463 3033 2434 2278 2101 2083 2029 1922 2018
16
Table 13 Average daily dose (ugkgday) of 13-D inhaled during the 62-day period of highest Telone use by residents living 200 m from fields in an area where Telone is applied to a total of 25 80-acre fields each year
Age Group
lt 1 1 lt 2 2 lt 3 3 lt 6 6 lt 9 Male Female Male Female Male Female Male Female Male Female
Mean 04605 05018 28772 31305 25168 26084 20439 20856 18713 18739 Std Deviation 03227 03596 13044 14290 11309 11633 09438 09779 08750 08917
Percentile 5 0112 0117 1229 1308 1089 1124 0851 0854 0758 0745
10 0139 0155 1382 1492 1222 1278 0978 0986 0895 0871 25 0219 0243 1778 1935 1568 1633 1265 1293 1169 1170 50 0374 0401 2647 2865 2324 2404 1865 1887 1700 1694 75 0607 0664 3775 4152 3289 3433 2687 2734 2426 2428 90 0906 0998 4704 5195 4114 4278 3387 3499 3103 3164 95 1112 1238 5266 5730 4585 4726 3771 3915 3536 3593
975 1300 1441 5770 6269 5016 5128 4206 4249 3908 3920 99 1534 1688 6289 6837 5542 5607 4605 4696 4281 4346
9 lt 12 12 lt 15 15 lt 18 18lt 25 25 lt 70 Male Female Male Female Male Female Male Female Male Female
Mean 13973 13308 10879 09069 08808 08389 08368 08156 07646 07564 Std Deviation 06736 06511 05331 04368 04053 03864 03650 03789 03405 03774
Percentile 5 0539 0511 0423 0356 0362 0348 0358 0328 0322 0284
10 0648 0604 0501 0423 0424 0405 0419 0390 0376 0336 25 0872 0824 0679 0567 0570 0530 0554 0523 0503 0462 50 1254 1199 0982 0819 0799 0766 0779 0745 0706 0675 75 1816 1723 1388 1170 1128 1081 1064 1044 0961 0984 90 2351 2273 1816 1521 1439 1382 1328 1350 1231 1286 95 2687 2563 2107 1726 1643 1579 1522 1527 1409 1483
975 2965 2847 2365 1940 1850 1741 1692 1704 1581 1659 99 3358 3142 2680 2170 2043 1922 1877 1904 1767 1851
17
Table 14 Average daily dose (ugkgday) of 13-D inhaled during the 62-day period of highest Telone use by residents living 500 m from fields in an area where Telone is applied to a total of 25 80-acre fields each year
Age Group
lt 1 1 lt 2 2 lt 3 3 lt 6 6 lt 9 Male Female Male Female Male Female Male Female Male Female
Mean 02906 03157 18121 19672 15953 16652 12951 13295 12146 12220 Std Deviation 01948 02105 07170 07709 06263 06341 05264 05343 04984 05174
Percentile 5 0078 0085 0934 1024 0826 0878 0655 0659 0588 0584
10 0099 0107 1041 1141 0920 0977 0724 0750 0671 0666 25 0147 0161 1257 1387 1111 1185 0892 0940 0840 0842 50 0242 0264 1653 1777 1457 1523 1180 1209 1114 1116 75 0378 0413 2232 2419 1974 2044 1596 1633 1494 1494 90 0550 0592 2797 3022 2460 2547 2028 2059 1897 1936 95 0674 0724 3194 3462 2803 2891 2301 2344 2167 2204
975 0809 0878 3536 3831 3097 3174 2574 2652 2438 2478 99 0957 1046 3922 4256 3424 3539 2853 2981 2705 2881
9 lt 12 12 lt 15 15 lt 18 18lt 25 25 lt 70 Male Female Male Female Male Female Male Female Male Female
Mean 09136 08829 07399 06103 05984 05640 05913 05588 05364 05024 Std Deviation 03929 03854 03262 02660 02473 02308 02375 02331 02169 02240
Percentile 5 0418 0399 0330 0285 0280 0274 0280 0264 0254 0223
10 0481 0463 0381 0324 0321 0310 0327 0305 0292 0258 25 0621 0603 0501 0418 0418 0392 0415 0385 0373 0336 50 0841 0805 0677 0556 0557 0517 0553 0516 0501 0455 75 1127 1084 0917 0749 0732 0689 0724 0689 0658 0624 90 1458 1401 1188 0961 0927 0877 0908 0872 0833 0813 95 1674 1633 1373 1129 1069 1009 1044 0999 0947 0922
975 1843 1818 1532 1256 1208 1112 1175 1101 1055 1031 99 2078 2087 1729 1481 1323 1276 1306 1277 1190 1210
18
___________________________________________________________________________
___________________________________________________________________________
INPUT VARIABLES FOR EXPOSURE SIMULATION
Air concentrations
Table 15 gives the probability distributions of air concentrations (in ugm3) used as input in the exposure simulations The first column gives percentiles of the distribution interpolated from a four-parameter logistic curve fit to the original Calhoun et al frequency distribution The interpolated concentrations were adjusted by factors developed by the Environmental Monitoring Branch of DPR (Johnson 1994b) shown in the second column Environmental Monitoring did additional modeling with ISCST to develop an adjustment to approximate the effect of using a 36-point-per-section spatial grid to model air concentrations instead of the relatively coarse 1-point-per-section grid used by Calhoun et al The effect of the adjustment is to increase the variability of the air concentrations while the mean level is unchanged The adjusted concentrations appear in the third column These adjusted values reflecting annual average daily concentrations for points on a 36-point-per-section grid were used for the estimation of lifetime average exposure
Table 15 Air concentration (ugm3) probability distributions used in exposure simulation
Concentrations Adjustment Adjusted Adjusted interpolated from 4shy factors to concentrations concentrations parameter logistic approximate used to estimate used to estimate
Percentile curvea 36-point gridb lifetime exposure 62-day exposure
00001 0103842 069359 0072024 0278587 001 0106063 084461 0089582 0346503 01 0128835 093182 0120051 0464356 02 0160687 096331 0154791 0598731 03 0201575 098483 0198517 0767865 04 0254546 100283 0255267 0987372 05 0323879 101963 0330237 1277356 06 0415684 103671 0430944 1666892 07 0538854 105566 0568846 2200298 08 0706593 107924 0762583 2949673 09 0938983 111571 1047632 4052242 095 1088601 115040 1252327 4844000 099 1228987 123092 1512784 5851450 0999 1263482 135000 1705701 6597652 09999 1266995 149000 1887822 7302097
a Curve fit to high-end air concentration frequency distribution in Calhoun et al (1994) b Johnson (1994b)
19
Seasonal exposure was estimated for July-August the period of historically highest Telone use To estimate average daily concentrations for this 62-day period the adjusted annual concentrations were modified as follows In the Calhoun et al simulation all positive air concentrations occurred in two 74shyday periods (60 days of Telone use plus 14 additional days for the material to dissipate) one in spring and the other in summer In their simulation 707 of the total Telone was applied during the summer use period with 40 mass loss to air In the spring period 293 of the Telone was applied with a mass loss rate of 25 To approximate the average daily concentrations during the summer period the fraction of the annual concentration contributed by the summer period was assumed to be (707 x 40) [(707 x 40) + (293 x 25)] = 0794 This fraction was condensed into 74 days by multiplying by 36574 Since actual Telone applications will probably not be restricted to the four months assumed by Calhoun et al historical use patterns were consulted Pesticide use reporting data showed that in 1988 and 1989 585 and 499 respectively of 13-D applied to carrots in Kern County was applied during July and August The simulation summer-period concentrations were further modified to represent concentrations for the 62 days of July-August by multiplying by (585 707) x (7462) The net effect was to multiply the annual concentrations by 3868 The concentrations thus modified shown in the fourth column of Table 15 were used for the estimation of seasonal exposure
For both lifetime and seasonal exposure assessments the average air concentration experienced by each person was simulated by randomly selecting five values from the relevant air distribution These values represented five locations where the individual spent his or her time A weighted average of the five concentrations weighted by the proportion of time spent at each location was used as the air concentration experienced by the individual The same five locations were used throughout a persons life but the division of time between them changed as a function of age The division of time between locations was a random variable in the simulation and is discussed in the section on individual mobility
To estimate exposure to persons living close to fields additional modeling with ISCST was done by the Environmental Monitoring Branch to provide annual average daily air concentrations at 100-meter increments from edges of treated fields (Johnson 1994a) The probability distributions of concentrations at 100 200 and 500 meters which were used in this exposure assessment are given in Table 16 In calculating the average concentration experienced by a person the first location selected at which the greatest portion of time is spent was considered the home location The concentration for the home location was simulated by selecting one value from eg the 100-meter distribution and one from the general distribution then calculating a weighted average with the two values weighted one-third and two-thirds respectively to reflect the fact that a field is treated only once in three years The two values were chosen to have a rank order correlation coefficient of 080 based on an observed correlation of 086 between ambient concentrations in the same township from year to year (personal communication Bruce Johnson Environmental Monitoring Branch DPR June 22 1994) For seasonal exposures the home concentration was simply a value from the relevant distance distribution This home location concentration was then used as described in the preceding paragraph in the calculation of the average concentration over five locations
20
___________________________________________________________________________
________________________________________________________________________________
Table 16 Annual average air concentrations (ugm3) at specified distances from treated fieldsa
Percentile 100 meters 200 meters 500 meters
000333 035393 030113 024996 001 037037 031439 026472 005 046011 040619 029312 01 050768 044753 031998 015 055763 048264 035456 02 058246 051404 036323 025 060290 055147 037940 03 064604 058207 038904 035 070250 062520 040306 04 077585 074610 041207 045 087638 085215 045127 05 090497 090723 049474 055 097657 096199 055052 06 105653 102253 057466 065 117366 117403 062218 07 131421 125398 067783 075 143991 134267 075510 08 154023 142689 079173 085 163177 151078 083575 09 175806 159046 087488 095 195317 178902 099410 099 220345 198031 127958 099667 226113 204338 135822
a Johnson (1994a)
21
________________________________________________________________________________
________________________________________________________________________________
Individual mobility within the Telone use area
Individuals were assumed to divide their total time between five randomly selected locations within the Telone high-use area The average air concentration to which an individual is exposed was calculated as described above as the mean of the five location concentrations weighted by the proportion of time spent in each location The mean division of time between locations was derived for each age interval from Table 45 in the Arabrsquos Survey of Childrens Activity Patterns (Wiley 1991a) and Table 33 in Activity Patterns of California Residents (Wiley 1991b) Wileys time at home was used as the time spent in the first selected location his time in transit was divided equally between two locations and the remaining time in the day divided between two others The division of time between these last two locations was 7030 for infants stepping down by age interval to a 5050 division for adults Individual time divisions were allowed to vary from the mean by randomly generating them from a multinomial distribution with n chosen to give fairly small variability in the youngest intervals and greater variability in the adolescent and adult intervals The distributions for time division are shown in Table 17
Table 17 Probability distributions of time spent in five locations
Multinomial Age n Average minutes per day spent in location
interval parameter 1 2 3 4 5
0 to 1 100 Male 1157 27 27 160 69 Female 1151 38 38 150 63
1 to 2 100 Male 1157 27 27 160 69 Female 1151 38 38 150 63
2 to 3 90 Male 1134 31 31 170 74 Female 1099 44 44 151 102
3 to 6 90 Male 1134 31 31 170 74 Female 1099 44 44 151 102
6 to 9 80 Male 1044 59 30 170 137 Female 1021 27 26 256 110
9 to 12 80 Male 1020 31 31 250 108 Female 968 47 46 265 114
12 to 15 70 Male 893 61 60 256 170 Female 917 49 49 255 170
15 to 18 70 Male 893 61 60 256 170 Female 917 49 49 255 170
18 to 25 60 Male 782 75 74 255 254 Female 862 60 60 229 229
25 to 70 60 Male 798 60 59 262 261 Female 960 51 51 189 189
22
Breathing rates
An individuals average breathing rate in each age interval was calculated as a weighted average of his rates at each of four activity levels resting light moderate and heavy The rate at each level was weighted by the proportion of time the individual was assumed to spend at that level Breathing rate at each activity level was a random variable The proportion of time at each level was a constant fixed for each age interval
For infants (0-1 year) a triangular distribution of breathing rates was derived from the mean and range reported in the Exposure Factors Handbook Table 3A-2 (USEPA 1990) The mode of the triangular distribution was set equal to the lower limit of the range in order to match the EPA mean For the other age intervals uniform distributions were derived from data in the ARBs Measurement of Breathing Rate and Volume (Adams 1993) In each case the range was chosen to include all the reported rates relevant to an activity level for a specific sex and age group These ranges are given in Table 18 Data were unavailable for children aged 1-3 so the breathing rates for 3-6-year-olds were used The breathing rates of an individual at different activity levels within and across ages were assumed to have the rank order correlations shown in Table 19 (The value of 08 on the diagonal represents the correlation between breathing rates of the same individual at the same activity level at different ages) It was not possible to incorporate correlations between body weight and breathing rates because the software used did not handle them correctly Correlation coefficients of body surface area and breathing rate within age intervals and activity levels reported in Adams (1993) ranged from 006 to 084 with a mean of 040 The correlation of body weight and breathing rate may be similar The effect of omitting this correlation from the simulation was probably to increase the estimated exposures to an unknown degree because if the greater exposures associated with high breathing rates tended to be paired with high body weights the exposure would be mitigated somewhat
The proportion of time assumed to be spent at each activity level is shown in Table 20
Body weight
Body weight distributions were taken directly from Tables 5A-1 through 5A-4 in the Exposure Factors Handbook (USEPA 1990) The histograms reported in these tables were used without smoothing Upper and lower bounds were supplied to produce a mean weight equal to the mean given in the EPA tables An individuals weights in different age intervals were assumed to have the rank order correlations shown in Table 21
Residence time and lifetime
In estimating lifetime exposures lifetime length was fixed at 70 years Exposure was estimated separately for fixed times of residence in the Telone use area of 30 and 70 years Since the exposure assessment is viewed as applying to any areas where Telone may be reintroduced in the proposed way and not just to the specific township in Kern County for which Calhoun et al modeled air concentrations it was not reasonable to define a distribution of residence time in the area Instead the estimated exposures are those expected to result from living the first 30 or 70 years of a 70-year lifetime in any area with Telone use like that described here
23
________________________________________________________________________________
________________________________________________________________________________
Table 18 Breathing rates (Lmin) as ranges of uniform distributions
Age interval Activity level Male Female
0 to 1 All Triangular ( 025 025 209 ) 1 to 2 Resting 5-7
Light 7-11 Moderate 8-15 Heavy 14-22
2 to 3 Resting 5-7 Light 7-11 Moderate 8-15 Heavy 14-22
3 to 6 Resting 5-7 Light 7-11 Moderate 8-15 Heavy 14-22
6 to 9 Resting 5-9 Light 10-17 Moderate 11-23 Heavy 20-45
9 to 12 Resting 5-9 Light 10-17 Moderate 11-23 Heavy 20-45
12 to 15 Resting 6-12 5-10 Light 7-17 7-15 Moderate 17-35 15-27 Heavy 25-72 24-59
15 to 18 Resting 6-12 5-10 Light 7-17 7-15 Moderate 17-35 15-27 Heavy 25-72 24-59
18 to 25 Resting 7-11 5-10 Light 8-18 6-15 Moderate 18-42 15-28 Heavy 48-80 39-62
25 to 70 Resting 7-11 5-10 Light 8-18 6-15 Moderate 18-42 15-28 Heavy 48-80 39-62
24
________________________________________________________________________________
_____________________________________________________________________________
________________________________________________________________________________
________________________________________________________________________________
Table 19 Rank order correlation coefficients between individuals breathing rates at different activity levels within and across age intervals
Resting Light Moderate Heavy Resting 08 05 05 04 Light 08 05 04 Moderate 08 05 Heavy 08
Table 20 Proportion of time at each activity level (constant in exposure simulation)
Age Activity level interval
Resting Light Moderate Heavy
0 to 1 Male 1 0 0 0 Female 1 0 0 0
1 to 2 Male 08 015 004 001 Female 08 015 004 001
2 to 3 Male 075 02 004 001 Female 075 02 004 001
3 to 6 Male 07 02 008 002 Female 07 02 008 002
6 to 9 Male 07 017 010 003 Female 07 02 008 002
9 to 12 Male 06 032 005 003 Female 06 033 005 002
12 to 15 Male 06 032 005 003 Female 06 033 005 002
15 to 18 Male 05 04 006 004 Female 05 042 005 003
18 to 25 Male 04 050 006 004 Female 04 052 005 003
25 to 70 Male 035 057 005 003 Female 035 060 004 001
25
________________________________________________________________________________
_______________________________________________________________________________
Table 21 Rank order correlation coefficients between the weights of an individual at different ages
0 to 1 1 to 2 2 to 3 3 to 6 6 to 9 9 to 12 12 to 15 15 to 18 18 to 25 25 to 70
0 to 1 100 092 082 072 061 061 061 061 061 061 1 to 2 100 092 082 072 061 061 061 061 061 2 to 3 100 092 082 072 061 061 061 061 3 to 6 100 092 082 072 061 061 061 6 to 9 100 092 082 072 061 061 9 to 12 100 092 082 072 061 12 to 15 100 082 082 072 15 to 18 100 082 082 18 to 25 100 082 25 to 70 100
Exposure appraisal
The estimated exposure distributions may be regarded as providing a reasonable idea of the highest exposures that should be expected under the use scenario The distributions should not be interpreted as reflecting the exposures of a population of individuals but as a set of values that are likely to bracket the exposure of an individual in this situation
It should be noted that the large differences between estimated seasonal exposures of children less than one and children from one to three are largely produced by the input breathing rate distributions The breathing rate data for infants under one came from a different source than all the other breathing rate data In addition no data were available for children from one to three so the rates for three- to six-year-old children were used In combination with the small body size of these children this may have overestimated their exposures
An important limitation of this exposure assessment is that it used 13-D concentrations in outdoor air to estimate 24-hourday exposure even though most people spend the greatest part of the day indoors Since the registrant provided no data on indoor concentrations and since no appropriate surrogate data were available to estimate them it was judged that there was no alternative
It is important to remember that these estimates of non-occupational exposure apply only to the use scenario of Calhoun et al which specified Telone applications to only 2000 acres per year in an area which has 8500 acres of carrots alone Any change in the use scenario would require a new exposure assessment
26
REFERENCES
Adams WC 1993 Measurement of breathing rate and volume in routinely performed daily activities Final report contract no A033-205 Research Division California Air Resources Board Sacramento CA
Albrecht WN 1987 Occupational exposure to 13-dichloropropene (Telone II) in Hawaiian pineapple culture Arch Environ Health 42286-290
Brouwer DH Brouwer EJ de Vreede JAF van Welie RTH Vermuelen NPE and van Hemmen JJ 1991 Inhalation exposure to 13-dichloropropene in the Dutch flower-bulb culture Part I Environmental monitoring Arch Environ Contam Toxicol 201-5
Calhoun LL Fontaine DD Stuart BL and Landenberger BD 1994 13shydichloropropene (13-D) An assessment of implied exposure and risk for the proposed commercial reentry of TELONE soil fumigant into California Dow Chemical Co Midland MI
California Department of Food and Agriculture 1988 Report of pesticides sold in California in 1987 Pesticide Use Enforcement Branch California Department of Food and Agriculture Sacramento CA
Climie IJG Hutson DH Morrison BJ and Stoydin G 1979 Glutathione conjugation in the detoxification of (Z)-13-dichloropropene (a component of the nematicide D-D) Xenobiotica 9149-156
Cohen B-S M and Poppendorf W 1989 A method for monitoring dermal exposure to volatile chemicals Am Ind Hyg Assoc J 50 216-223
Cook RE 1983 Fumigators exposure to airborne 13-dichloropropene during fumigation operation of Telone II soil fumigant Driscoll Citrus Service Inc Fort Pierce Florida Unpublished report of the Dow Chemical Chemical Company Industrial Hygiene Laboratory Midland MI January 4 1983
Davies DB and Fraser PA 1988 Evaluation of potential operator fieldworker and bystander exposure to 13-dichloropropene as a result of tobacco field fumigation with Telone II soil fumigant in southwestern Ontario (Canada) May-June 1985 CDFA Reg Doc No 50046-039
Dietz FK Hermann EA and Ramsey JC 1984a The pharmacokinetics of 14C-13shydichloropropene in rats and mice following oral administration The Toxicologist 4 Abstr No 585
Dietz FK Dittenber DA Krik HD and Ramsey JC 1984b Non-protein sulfhydryl content and macromolecular binding in rats and mice following oral administration of 13shydichloropropene The Toxicologist 4 Abstr No 586
Fisher GD and Kilgore WW 1988a Tissue levels of glutathione following acute inhalation of 13-dichloropropene J Toxicol Environ Health 23171-182
Fisher GD and Kilgore WW 1988b Mercapturic acid excretion in rats following 13shydichloropropene inhalation exposure Fund Appl Toxicol 11 303-307
27
Fisher GD and Kilgore WW 1989 Pharmacokinetics of S-[3-chloroprop-2shyenyl]glutathione in rats following acute inhalation exposure to 13-dichloropropene Xenobiotica 19269-278
Fong HR and Maykoski R 1985 Air exposure monitoring of EHAP personnel during a Telone II soil translocation study in Fresno County CDFA Rpt HS 1299
Houtman BA 1992 Managing worker exposure 13-D in California
Houtman BA 1993 An evaluation of 13-dichloropropene worker exposure associated with Telone II soil fumigant loading application and reentry phase I ECL92095 (interim report)
Hutson DH Moss JA and Pickering BA 1971 The excretion and retention of components of the soil fumigant D-D and their metabolites in the rat Food Cosmet Toxicol 9 677-680
Johnson B 1994a Memorandum to John Sanders June 20 1994 on buffer zone calculations for 13-D in Kern County Environmental Monitoring and Pest Management Branch Department of Pesticide Regulation Sacramento CA
Johnson B 1994b Memorandum to Kean Goh May 16 1994 on estimated adjusted air concentration percentiles based on Dow simulation results for T29R26 Environmental Monitoring and Pest Management Branch Department of Pesticide Regulation Sacramento CA
Maddy KT Cusick B Richmond D 1980 Studies concerning the field application of Telone and DD in California in 1979 and the ambient air concentration of these pesticides during and following application by shank injection into soil in fields CDFA Rpt HS 686
Maddy KT Schneider F and Fredrickson S 1982 Monitoring of Telone II during and following experimental application by shank injection to established trees and grape vines in California in 1980-1981 CDFA Rpt 967
NIOSHOSHA Occupational Safety and Health Guidelines for Chemical Hazards 1988 DHHS (NIOSH) Publication No 81-1231981 and supplements Publication Nos 88-118 and 89-104
Osterloh JD Cohen BS Poppendorf W and Pond SM 1984 Urinary excretion of the N-cysteine conjugate of cis-13-dichloropropene by exposed individuals Arch Environ Health 39 271-275
Osterloh JD Wang R OConnell L Jacob III P and Maddy KT 1989a Pilot study for biological monitoring of 13-dichloropropene In Biological Monitoring of Pesticide Exposure RG Wang CA Franklin RC Honeycutt and JC Reinert (eds) Amer Chem Soc Soc Symp Ser No 382 215-230
Osterloh JD Wang R Schneider F and Maddy K 1989b Biological monitoring of dichloropropene Air concentrations urinary metabolite and renal enzyme excretion Arch Environ Health 44 207-213
Owen WJ and DeRouen TA 1980 Estimation of the mean for lognormal data containing zeroes and left-censored values with applications to the measurement of worker exposure to air contaminants Biometrics 36 707 719
28
Palisades Corporation 1992 RISK Risk analysis and simulation add-in for Microsoft Excel Release 11 users guide 31 Decker Rd Newfield NY 14867
Poppendorf W Leffingwell JT and Cohen B 1983 Development of methods and procedures for the assessment of occupational health risks in the application and use of nematicides in California CDFA Rpt HS 1162
Shapiro SS and Wilk MB 1965 An analysis for normality (complete samples) Biometrika 52 591-611
Stott WT and Kastl PE 1986 Inhalation pharmacokinetics of technical grade 13shydichloropropene Toxicol Appl Pharmacol 85 332-341
Stott WT 1992 Letter to J R Sanborn August 11 1992
Tobol HK and Axe FD 1982 Airborne concentrations of 13-dichloropropene during fumigation of established grapevines almond trees and peach trees California December 1980-January 1981 Unpublished report of the Dow Chemical Company Environmental ServicesIndustrial Hygiene Western Division Dow Chemical USA Report No HeRW-AG(8)
US EPA 1990 Exposure factors handbook EPA6008-89043 Office of Health and Environmental Assessment Washington DC
Van Welie RTH van Duyn P Brouwer DH van Hemmen JJ Brouwer EJ and Vermuelen NPE 1991 Inhalation exposure to 13-dichloropropene in the Dutch flower-bulb culture Part II Biological monitoring by measurement of urinary excretion of two mercapturic acid metabolites Arch Environ Contam Toxicol 206-12
Waechter JM Brazak KA McCarty LP LaPack MA and Brownson 1992 13shydichloropropene (Telone II Soil Fumigant) Inhalation pharmacokinetics and metabolism in human volunteers DowElanco (Interim Report) Laboratory Project Study ID M-002993-023
Wagner CP 1987 Industrial source complex (ISC) dispersion model users guide 2nd edition (revised) Vol I US Environmental Protection Agency Report No EPA-4054-88shy002 a
Wiley JA 1991a Study of childrens activity patterns Final report contract no A733-149 Research Division California Air Resources Board Sacramento CA
Wiley JA 1991b Activity patterns of California residents Final report contract no A6-177shy33 Research Division California Air Resources Board Sacramento CA
29
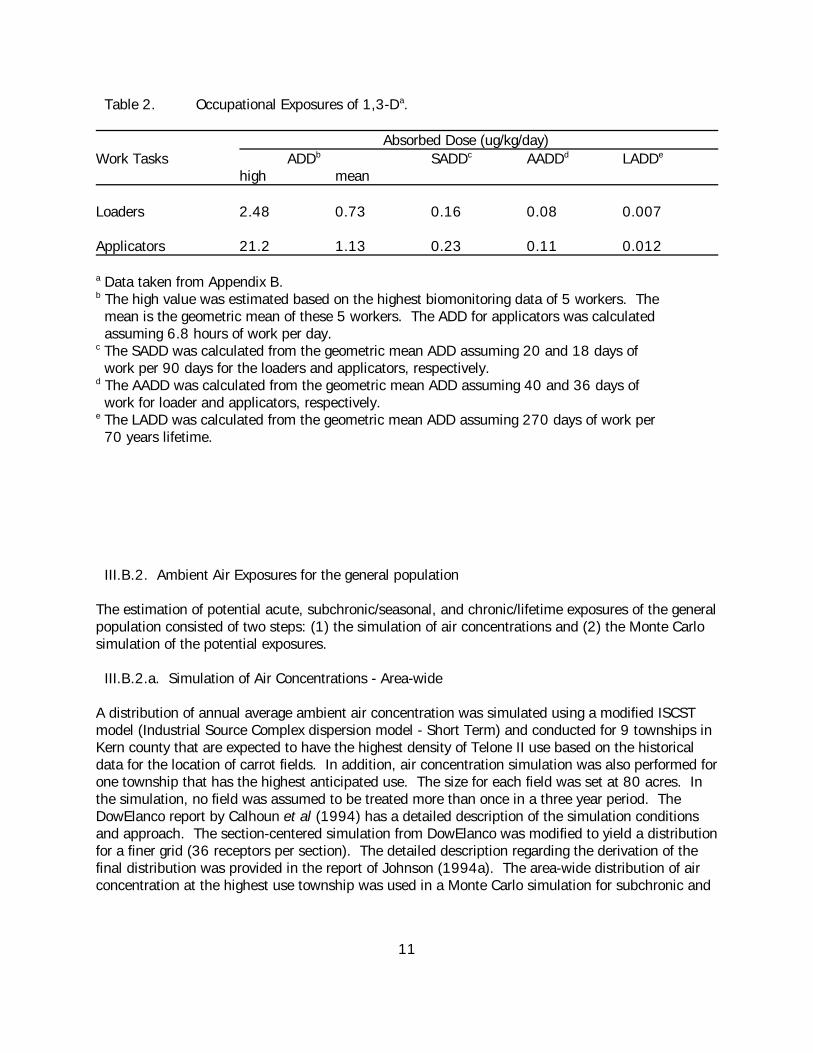
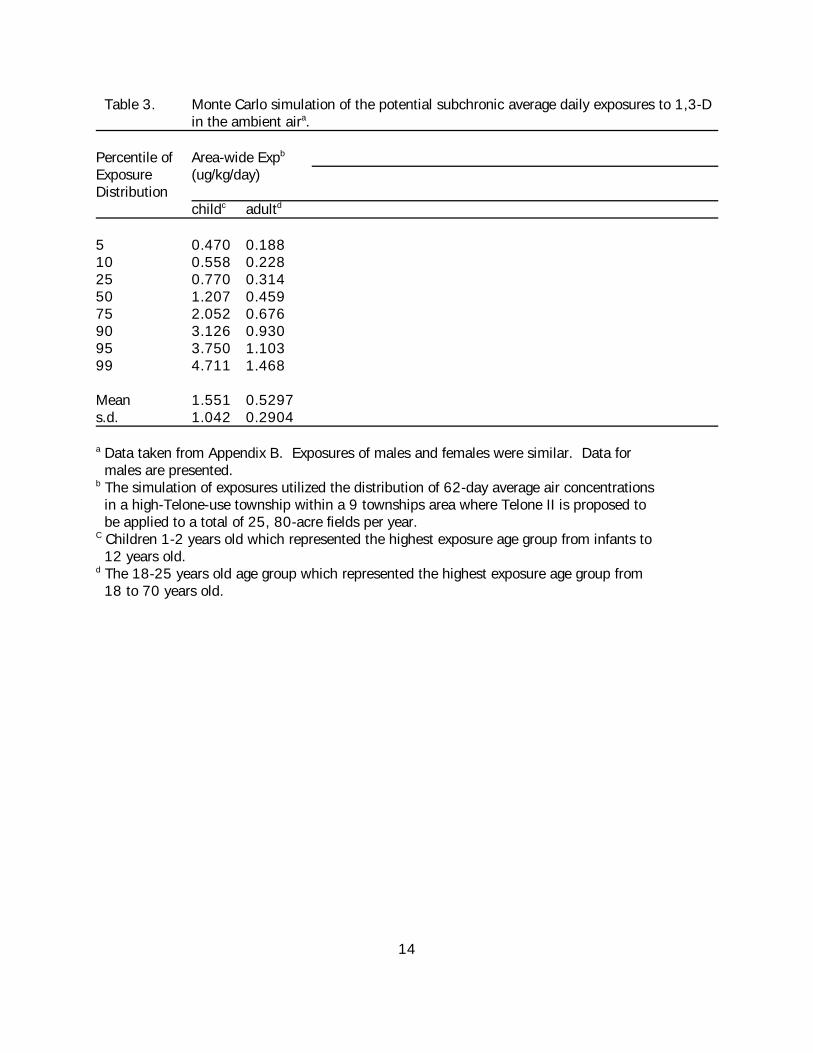

Occupational exposures for workers
The SADDs for loaders and applicators were taken from data in Table 2 The MOSs are calculated from the SADD of 016 ugkgday for a loader and 023 ugkgday for an applicator The MOSs for a loader and an applicator are
Subchronic MOSloader 71(016 x 10-3) = 44000
Subchronic MOSapplicator 71(023 x 10-3) = 31000
Ambient Air Exposures for general population
Data in Table 3 showed that the high range of the average daily exposure was 4711 ugkgday for a child (1-2 years old) This was the highest simulated potential exposure The MOS is
Subchronic MOS 71(4711 x 10-3) = 1500
IIIC3 Lifetime oncogenic risk
The MLE and UCL potency values extrapolated from the dose-response relationship of lung tumors in male mice were 0025 and 0055 (mgkgday)-1 respectively
Occupational exposures for workers
The LADDs for loaders and applicators were taken from data in Table 2 The potential oncogenic risk in a lifetime are calculated from the LADD of 0007 ugkgday for a loader and 0012 ugkgday for an applicator using both MLE and UCL of potency values The risks are
MLE Riskloader 0025 (mgkgday)-1 x (0007 x 10-3) (mgkgday) = 18 x 10-7
UCL Riskloader 0055 (mgkgday)-1 x (0007 x 10-3) (mgkgday) = 39 x 10-7
MLE Riskappl 0025 (mgkgday)-1 x (0012 x 10-3) (mgkgday) = 30 x 10-7
UCL Riskappl 0055 (mgkgday)-1 x (0012 x 10-3) (mgkgday) = 66 x 10-7
Ambient air exposures for general population
The potential oncogenic risks at the 50th and 95th percentile of the simulated distribution of average daily exposure for area-wide scenarios (Table 4) are presented in Table 5 Risks were calculated using both the MLE and UCL of potency estimates
17
Table 5 The potential lifetime oncogenic risk from 30 and 70 years of exposures to 13-D in the ambient aira
50th percentile 95th percentile Geographic locations
MLE UCL MLE UCL
30 years
Area-wideb 17 x 10-6 36 x 10-6 45 x 10-6 98 x 10-6
70 years
Area-wideb 32 x 10-6 71 x 10-6 82 x 10-6 18 x 10-5
a Risk was calculated as the exposure multiplied by the potency The exposures data were taken from Table 4 The MLE and UCL potency values extrapolated from the dose- response relationship of lung tumors in male mice were 0025 and 0055 (mgkgday)-1 respectively b The simulation of exposures utilized the distribution of 3-year average exposures in a high-Telone-use township within a 9 townships area where Telone II is proposed to be applied to a total of 25 80-acre fields per year
18
IV CONCLUSION
The potential risk from the proposed use of Telone II in California for 1994-95 has been assessed The occupational exposure appeared to be minimal compared to the potential ambient air exposures for the general public The MOSs for the estimated high values of acute and subchronicseasonal exposures for the general public were at least 630 The MOS exceeded the MOS of 100 which is generally considered as sufficient for protection against non-oncogenic effects when the NOEL used to calculate the MOS was established in laboratory animals
The potential lifetime oncogenic risk was calculated based on the DPR potency values and the exposure distributions generated from Monte Carlo simulations The calculated risk is approximately 2-fold lower using DPR potency when compared to the risk using US EPA potency The exposure used in risk calculation was the average exposure over a lifetime Although the risk may be higher for the potential episodically high exposures the current toxicity data are not sufficient for a quantitative assessment other than to assume that the risk is proportional to the lifetime annual average exposures The simulations of exposures utilized distributions of annual average ambient air concentrations simulated from a modified ISCST dispersion model and with the assumption that a field is treated with Telone II once every three years Air concentrations were simulated for characterizing the air concentrations of a township in Kern county that has the highest anticipated use of Telone II Using the distributions of air concentrations the subsequent Monte Carlo simulation of lifetime average exposures incorporated parameters of exposure such as daily geographic mobility and age-related breathing rates and body weights The lifetime average exposures were simulated both for a 30- and a 70-year exposure The current DPR default duration for a lifetime exposures to a pesticide is 70 years The simulated lifetime exposures represent the exposures for areas with proposed Telone II use The exposure for a 30-year duration was simulated for the purpose of comparison to the risk assessment submitted by DowElanco (Calhoun 1994)
At the 95th percentile of the area-wide exposure scenario the MLE and UCL of risk for a 30-year exposure were 45 x 10-6 and 98 x 10-6 They were approximately 50-67 higher than the risks estimated by Calhoun et al (1994) using different input parameters for the Monte Carlo simulation
19
REFERENCES
Barry T 1994 Memo from Terri Barry to Ruby Reed and Bruce Johnson on June 22 1994 regarding Simulated Telone acute exposure concentrations
Breslin W J H D Kirk C M Streeter J F Quast and J R Szabo 1987 Telone II soil fumigant Two-generation inhalation reproduction study in Fischer 344 rats Dow Chemical Company Laboratory Project Study M-003993-015 CPR Vol 50046-030 60676 (This study is also published as Breslin et al 1988 in Fund Appl Toxicol 12129-143)
Calhoun LL D D Fontaine B L Stuart and B D Landenberger 1994 13- Dichloropropene (13-D) An assessment of implied exposure and risk for the proposed commercial reentry of TELONE soil fumigant into California DowElanco
Coate W B 1979 Final report 90-day inhalation toxicity study in rats an mice Telone II Hazleton Laboratories America Inc DPR Vol 50046-010 36551
DowElanco 1994 Memo from Craig Blewett to Rich Bireley January 28 1994 regarding Revised permit conditions for Telone II and meeting presentation materials
Engler R 1994 An April 1 1994 memo from Engler Health Effects DivisionOPP on List of Chemicals Evaluated for Carcinogenic Potential
Houtman B A 1992 Managing worker exposure of 13-D in California
Houtman B A 1993 An evaluation of 13-dichloropropene worker exposure associated with Telone II soil fumigant loading application and reentry phase I DowElanco ECL92095 (Interim report)
IRIS (Integrated Risk Information System) 1994 US EPA
John J A P M Kloes L L Calhoun and J T Young 1983a Telone II Inhalation teratology study in Fischer 344 rats Dow Chemical Company DPR Vol 50046-010 36561
John J A P M Kloes L L Calhoun and J T Young 1983b Telone II Inhalation teratology study in New Zealand white rabbits Dow Chemical Company DPR Vol 50046-010 36562
Johnson B 1994a Memo from Bruce Johnson to Kean Goh on May 11 1994 regarding Potential impact of finer receptor grid on DowElanco evaluation of average air concentrations of 13-D in Kern County
Johnson B 1994b Memo from Bruce Johnson to John Sanders on July 19 1994 regarding Bufferzone calculations for 13-D in Kern
20
Konishi Y A Kawabata A Denda T Ikeda H Katada H Maruyama and R Higashiguchi 1980 Forestomach tumors induced by orally administered epichlorohydrin in male Wistar rats GANN 71(6) 922-923
Lomax L G L L Calhoun W T Stott and L E Frauson 1987 Telone II soil fumigant 2-year inhalation chronic toxicity - oncogenicity study in rats Dow Chemical Company Laboratory Project Study ID M-003993-009R DPR Vol 50046-031 60677
Markovitz A and W H Crosby 1984 Chemical carcinogenesis A soil fumigant 13- dichloropropene as possible cause of hematologic malignancies Arch Intern Med 1441409-1411
McConnell E E H A Solleveld J A Swenberg and G A Boorman 1986 guidelines for combining neoplasms for evaluation of rodent carcinogenesis studies JNCI 76283-289
NAS (National Academy of Sciences) 1980 Chapter 4 Toxicity of Selected Drinking Water Contaminants in Drinking Water and Health Volume 3 Washington DC
NTP (National Toxicology Program) 1985 Toxicology and carcinogenesis studies of Telone II in F344N rats and B6C3F1 mice NTP Technical Report Series No 269 US Department of health and Human Services Public Health Service National Institutes of Health NIH Publication No 85-2525
Parker C M W B Coate and R W Voelker 1982 Subchronic inhalation toxicity of 13-dichloropropene12-dichloropropane (D-D) in mice and rats Jour Toxicol Environ Health 9899-910
Stott W T J T Young L L Calhoun and J E Battjes 1984 Telone II soil fumigant a 13-week inhalation study in rats and mice Dow Chemical Company DPR Vol 50046- 038 71713
Stott W T K A Johnson L L Calhoun S K Weiss and L E Frauson 1987 Telone II soil fumigant 2-year inhalation chronic toxicity - oncogenicity study in mice Dow Chemical Company Laboratory Project Study ID M-003993-009R DPR Vol 50046-029 60675
Streeter C M J E Battjes and L G Lomax 1987 Telone II soil fumigant An acute vapor inhalation study in Fischer 344 rats Dow Chemical Company HETM-003993-018 DPR Vol 50046-032 62070
US EPA 1989 Exposure factors handbook Office of Health and Environmental Assessment US EPA Report No EPA6008-89043 WashingtonDC
Van Duuren B L B M Goldschmidt G Loewengart A C Smith S Melchionne I Seidman and D Roth 1979 Carcinogenicity of halogenated olefinic and aliphatic hydrocarbons in mice JNCI 631433-1439
21
Waechter J M Waechter K A Brzak L P McCarty M A LaPack and P J Brownson 1992 13-Dichloropropene (Telone II soil fumigant) Inhalation pharmacokinetics and metabolism in human volunteers DowElanco
22
Appendix A
SUMMARY OF TOXICOLOGY DATA
TELONE II (13-dichloropropene)
________________________________________________________________________
CALIFORNIA ENVIRONMENTAL PROTECTION AGENCY DEPARTMENT OF PESTICIDE REGULATION
MEDICAL TOXICOLOGY BRANCH
SUMMARY OF TOXICOLOGY DATA
TELONE II (13-dichloropropene)
Chemical Code 000573 Tolerance 50046 SB 950 137
August 18 1986 Revised 41687 71888 52389 42790 6190 61594 81094
I DATA GAP STATUS
Combined (onco + chronic) rat No data gap possible adverse chronic effects
Chronic dog No data gap possible adverse effect
Onco mouse No data gap possible adverse effects
Repro rat No data gap no adverse effects
Terato rat No data gap no adverse effects
Terato rabbit No data gap no adverse effects
Gene mutation No data gap possible adverse effect
Chromosome No data gap no adverse effect
DNA damage No data gap possible adverse effect
Neurotox Not required at this time
Note Toxicology one-liners are attached All record numbers through 117410 in 061 were examined indicates an acceptable study Bold face indicates a possible adverse effect Original Summary prepared by F Martz revised April 16 1987 July 18 1988 May 23 1989 April 27 1990 June 1 1990 June 15 1994 and August 10 1994 by J Gee Filename T940810 See also Guidance for the Reregistration of Pesticide Products (Reregistration Standard) Containing 13-Dichloropropene (Telone II) as the Active Ingredient US EPA 91886 CDFA Record 050620 The position of EPA (1986) was that if significant residues were found oral studies would be required in addition to the inhalation studies Gee 52389
DPR MEDICAL TOXICOLOGY TELONE II (13-DICHLOROPROPENE) TOX SUMMARY T940810 Page 2
II TOXICOLOGY ONE-LINERS AND CONCLUSIONS
These pages contain summaries only Individual worksheets may contain additional effects
ONCOGENICITYCARCINOGENICITY COMBINED RAT
010 036552 Toxicology and Carcinogenesis Studies of Telone II in F344N Rats and B6C3F1 Mice (NTP Frederick Cancer Research Center 585) Rats F344 strain Telone II (13-dichloropropene 875 pure) with epichlorohydrin as stabilizer 50 25 or 0 mgkg by oral gavage 3 times a week 52sexgroup with an additional 28sexgroup (3 as substitutes) in satellite groups with sacrifices at 9 16 21 24 and 27 months of 5sexgroup Study scientifically valid but UNACCEPTABLE and not upgradeable due to guideline deviations ONCO effects with NO NOEL forestomach cancer at 50 mgkg liver cancer in males at 25 and 50 mgkg trend for thyroid cancer in females mammary cancer in females at 50 mgkg with trend at 25 mgkg stomach epithelial hyperplasia at 25 and 50 mgkg (Reviewed 11686 by Martz)
031 005 060677 036218 Telone II Soil Fumigant 2-Year Inhalation 0hronic Toxicity-Oncogenicity Study in Rats (Dow Chemical Midland MI 71387 M-003993-009R) 13-Dichloropropene 921 (cis 495 and trans 426) 12-dichloropropane 07 13-dichloropropane 18 1-chlorohexane 11 with remaining 43 a mixture of isomers of chlorohexane chlorohexene and trichloropropene stabilized with soybean oil 70sexgroup exposed by inhalation 6 hoursday 5 daysweek for 2 years - whole body exposure - at 0 5 20 or 60 ppm nominal 10sexgroup sacrificed at 6 and at 12 months (interim report 036218) NOEL = 20 ppm (decreased weight gain changes in nasal tissues in males and females) no evidence of an oncogenic effect reported ACCEPTABLE with a possible adverse chronic effect (Gee 71188)
005 036218 Dow 985 (1 year interim report - see above) F344 strain exposure conditions identical to those of mouse study listed below (36219) UNREMARKABLE at 1 year nasal changes noted in mice not reproduced in rats no effects except slight weight-gain inhibition in high dose group (Martz 11386)
010 36551 90-day Inhalation Toxicity Study in Rats and Mice Telone II (Hazleton Laboratories 51579 Project No 174-127) Fischer 344 rats 10sexdose were exposed to 0 10 30 or 90 ppm nominal (actual - 0 1198 3214 and 9302 ppm) 6 hours per day 5 daywk for 13 weeks terminal body weights were significantly reduced (8-11) in the high dose male and female rats dose-related alterations of the nasal epithelium were observed in high dose of both sexes (1010 and 1010)and in mid-dose females (910) as reported in the Addendum to the Final Report dated 7979 giving a NOEL = 10 ppm in female rats and 30 ppm in males UNACCEPTABLE (deficiencies include no hematology no serum chemistry performed not all required tissues were examined histologically in control and high dose groups) not upgradeable Initially reviewed by Martz 42986 re-reviewed by C Lewis 7689 and updated by J Gee 61594 No worksheets
038 071713 Telone II Soil Fumigant A 13-Week Inhalation Study in Rats and Mice (Dow 113084) Telone II 909 lot WP-82-1111-56 given by inhalation 6 hrday 5 dayweek 10 Fischer 344 rats per sex exposed
DPR MEDICAL TOXICOLOGY TELONE II (13-DICHLOROPROPENE) TOX SUMMARY T940810 Page 3
to 0 10 30 90 or 150 ppm nominal 13-week exposure only findings were degeneration in the olfactory epithelium and hyperplasia of the respiratory epithelium in both sexes especially at 90 and 150 ppm body weight gains were significantly lower at 90 and 150 ppm NOEL = 10 ppm based on hyperplasia in 210 males at 30 ppm Supplementary data (Gee 52289)
CHRONIC DOG
50046-061 117410 Stott WT Stebbins KE Haut KT Quast JF and Shabrang SN TeloneII soil fumigant One-year dietary toxicity study in beagle dogs The Dow Chemical Co Midland Study ID M-003993-024 72292 Dogs were fed diets containing microencapsulated TeloneII at 0 05 25 or 15 mgkgday for 1 year NOEL = 25 mgkgday [hematology profile typical of hypochromic microcytic anemia related to increased hematopoiesis in bone marrow and extramedullary hematopoiesis in spleen in both sexes] Clinical signs in 2 high dose males of pale skinmucous membranes apparently reflected the anemia Body weights were depressed and relative liver weights were increased in both sexes at 15 mgkgday The relatively low NOEL for signs of anemia constitutes a possible adverse effect Acceptable Aldous 111593
046 075537 Telone II 13-Week Dietary Toxicity Study in Beagle Dogs Quast J F Dow Chemical Company August 1 1989 The 3-page letter was submitted as an adverse effects disclosure for microcytic hypochromic anemia in the 13-week study in beagle dogs Doses were 0 130 380 or 1000 ppm with Telone II incorporated in a starch sucrose matrix and administered in the dog chow The letter contains no data but states the anemia was dose-related Some dogs were being maintained after dosing for further study The final report has not yet been received by CDFA (Gee 42790)
Document 50046-043 contains a protocol (dated 41289) for a 13-week study with beagle dogs Title Telone II 13-Week Dietary Toxicity Study in Beagle Dogs Record 073875 The purpose was to evaluate the affects of dietary exposure of non-rodents to doses of 0 130 380 or 1000 ppm in the diet prepared with 13-dichloropropene formulated by microencapsulation in a starchsucrose matrix The document summarized several studies on dosing of dogs by several routes A cover letter dated April 27 1989 from the registrant still questioned the need for a chronic study (Gee 52389)
025 050620 The EPA Registration Standard dated September 18 1986 indicates that the requirement for a chronic feeding study in nonrodent species namely dog is dependent on the outcome of residue tests If residues are found in foodfeed commodities chronic feeding studies in rat and dog may be required Residue data for crop field trials are due in March 1989 Requirements for residues in foodfeed etc are reserved (Gee 41687) See 061 117410 for the full study (Gee 61594)
ONCOGENICITY MOUSE
007 28361 28362 and 28363 Parts of published report on three different exposure scenarios See 010 036554 for complete copy of the publication in J National Cancer Institute 63 (6) 1433-1439 (1979)
010 036553 Toxicology and Carcinogenesis Studies of Telone II in F344N Rats and B6C3F1 Mice (NTP Frederick Cancer Research Center 585) Mice B6C3F1 strain Telone II (875 13-dichloropropene) 100 50 or 0 mgkgday
DPR MEDICAL TOXICOLOGY TELONE II (13-DICHLOROPROPENE) TOX SUMMARY T940810 Page 4
by oral gavage 3 times a week 50sexgroup UNACCEPTABLE and not upgradeable due to guideline deviations but scientifically valid for female data ONCO effects with NO NOEL in females cancer of urinary bladder at 100 and 50 mgkg forestomach and lung at 100 mgkg results in males inconclusive due to inadequate randomization and poor control group survival (Martz 11786)
010 036554 Carcinogenicity of Halogenated Olefinic and Aliphatic hydrocarbons in Mice (Van Duuren B L et al NYU Med Ctr JNCI 63 1433-1439 1979) HaICR Swiss strain cis-13-dichloropropene (Chemical Samples Co Columbus OH) 122 mgmouse or 41 mgmouse by dermal application 3week for about 77 weeks initially reviewed as having caused no local or distant tumors UNACCEPTABLE and not upgradeable Reviewed 6385 by AAspostolou peer review 220 and 81886 by Martz Re-review as part of the risk assessment process noted that the incidence of lung tumors in both groups of treated mice was statistically significant by Fishers Exact Test although not so noted in the publication table The incidences were 30100 for controls and 1930 and 1730 at low and high doses respectively Remains UNACCEPTABLE but with a possible adverse effect (Gee 53190)
010 036554 Carcinogenicity of Halogenated Olefinic and Aliphatic Hydrocarbons in Mice (NYU Med Ctr JNCI 63 1433-1439 1979) HaICR Swiss strain cis-13-dichloropropene (Chemical Samples Co Columbus OH) 3 mgmouse once weekly x 77 weeks by subcutaneous injection examined injection site and liver only fibrosarcoma at injection site 630 vs 030 vehicle control probably due to irritation by physical-chemical properties of AI Otherwise insufficient for assessment UNACCEPTABLE and not upgradeable (AA 6385 Martz 220 and 81886)
010 036554 Carcinogenicity of Halogenated Olefinic and Aliphatic Hydrocarbons in Mice (NYU Med Ctr JNCI 63 1433-1439 1979) HaICR Swiss strain cis-13-dichloropropene (Chemical Samples Co Columbus OH) 122 mgmouse by dermal application once followed by promotion with 5 mg phorbol myristate acetate dermally 3week for about 77 weeks no tumors UNACCEPTABLE and not upgradeable (Reviewed 6385 by AA peer review 220 and 81886 by Martz)
029 006 060675 036219 Telone II Soil Fumigant 2-Year Inhalation Chronic Toxicity-Oncogenicity Study in Mice (Dow 71387 M-003993-009)
13-Dichloropropene 921 (cis 495 and trans 426) plus 12-dichloropropane 07 13-dichloropropane 18 1-chlorohexane 11 and the remainder a mixture of isomers of chlorohexane chlorohexene and trichloropropene lot TB831213-4 given by inhalation at 0 5 20 or 60 ppm nominal uncorrected for 92 purity 6 hoursday 5 daysweek for 2 years 70sexgroup with intermediate sacrifices of 10sexgroup at 6 months and at 12 months (interim report 036219 in 006) daily analytical data for 13-dichloropropene concentration Hyperplasia of the urinary bladder mucosa was found in females at 20 and 60 ppm and in males at 60 ppm with a trend at 20 ppm Increase in benign lung bronchioloalveolar adenomas in males at 60 ppm Degeneration of the olfactory epithelium and hyperplasia of the respiratory epithelium bilateral at 60 ppm in both sexes Decreased liver vacuolation in females at 60 ppm NOEL = 5 ppm ACCEPTABLE with possible adverse effects (Gee 71288)
DPR MEDICAL TOXICOLOGY TELONE II (13-DICHLOROPROPENE) TOX SUMMARY T940810 Page 5
006 036219 Dow 985 (1 year interim report B6C3F1 strain Telone II (lot TB831213-4) 60 20 5 or 0 ppm 6 hoursday x 5 daysweek x 6 or 12 months NO TUMORS slight focal hyperplasia and hypertrophy of epithelium of nasal turbinates at 20 ppm in males and at 60 ppm and in both sexes liver glycogen and kidney lipid decrease in males at 60 ppm (decreased organ weights and vacuolation) urinary bladder hyperplasia of transitional epithelium in females at 60 ppm possible adverse effects NOEL = 5 ppm (Martz 11486)
SUBCHRONIC
10 036551 90-Day Inhalation toxicity Study in Rats and Mice (Hazleton (VA) 579) CD-1 strain Telone II purity unspecified 90 30 10 or 0 ppm 6 hoursday x 5 daysweek x 13 weeks (65 exposures) Unacceptable and not upgradeable - was intended as range finder for future study EFFECTS In 90 ppm females - epithelium of dorsal nasal septum and turbinates - decreased cytoplasm and single cell necrosis slight weight gain reduction 90 ppm NOEL = 30 ppm (Martz 42986) In addition alterations in nasal epithelium were noted in high-dose female mice but not in male mice NOEL = 30 ppm in females and 90 ppm in males Revised by Gee 61594
038 071713 Telone II Soil Fumigant A 13-Week Inhalation Study in Rats and Mice (Dow 113084) Telone II 909 lot WP-82-1111-56 given by inhalation 6 hrday 5 dayweek 10 B6C3F1 mice per sex exposed to 0 10 30 90 or 150 ppm nominal 13-week exposure findings were degeneration in the olfactory epithelium and hyperplasia of the respiratory epithelium in both sexes especially at 90 and 150 ppm body weight gains were significantly lower at 90 and 150 ppm females in 90 and 150 ppm showed effects in the epithelial cells of the urinary bladder NOEL = 30 ppm Supplementary data (Gee 52289)
REPRODUCTION AND FERTILITY
010 036555 D-D A 10 Week Inhalation Study of Mating Behavior in Male and Female Rats (Shell (UK) 480) Wistar strain technical D-D (epi-chlorohydrin free) 537 13-dichloropropene remaining constituents mainly chlorinated isomersanalogs 96 32 14 or 0 ppm for 6 hoursday x 5 daysweek treated males mated with naive females after 2 4 7 and 10 weeks exposure treated females mated with naive males after 10 weeks exposure hematology serum chemistry urinalysis and histopathology on satellite animals 30 males and 24 females per group with 20 and 15 respectively for reproduction performance and the remainder for hematology etc UNACCEPTABLE and not upgradeable only 1 generation and inadequate group sizes Otherwise appears to be a well conducted and documented study with scientifically valid results NO reproductive effects Liver and kidney weight elevation at 96 ppm reversible upon withdrawal except female kidney values (Martz 2086)
030 060676 Telone II Soil Fumigant Two-Generation Inhalation Reproduction Study in Fischer 344 Rats (Dow Chemical 71387 M-003993-015) 13-Dichloropropene 912 lot TB831213-4 exposures of 0 5 20 or 60 ppm for 7 days increased to 0 10 30 or 90 ppm on day 8 6 hoursday 5 daysweek two generations two litters each 30sexgroup maternal animals removed from chamber after gestation day 20 until day 4 postpartum when separated from pups for the 6 hours exposure parental NOEL =
DPR MEDICAL TOXICOLOGY TELONE II (13-DICHLOROPROPENE) TOX SUMMARY T940810 Page 6
30 (decreased weight gain nasal tissue changes at 90 ppm) reproduction NOEL gt 90 ppm (no adverse effect on reproduction parameters) ACCEPTABLE (Gee 71388)
TERATOLOGY RAT
010 036561 Telone II Inhalation Teratology Study in Fischer 344 Rats and New Zealand White Rabbits (Dow 1083) F344 strain Telone II (13-dichloropropene 901 pure) 120 60 20 or 0 ppm via inhalation 30group Study and report ACCEPTABLE NO developmental effects (NOEL = 120 ppm for malformationsdevelopmental effects) maternal NOEL lt 20 ppm (reduced maternal weight gain at all 3 treatment levels) (Martz 22186)
TERATOLOGY RABBIT
010 036562 Telone II Inhalation Teratology Study in Fischer 344 Rats and New Zealand White Rabbits (Dow 1083) New Zealand White Telone II (13-dichloropropene 901 pure) 120 60 20 or 0 ppm via inhalation 17 - 24 pregnant rabbits per group Study OK but report incomplete reviewed as upgradeable with submission of historical control data 22186 The historical control data are in 50619 Document 50046-025 The study has been rereviewed as ACCEPTABLE 32687 NO developmental effects (NOEL = 120 ppm for malformations) NOEL = 20 ppm for reduced maternal weight gain (Martz 22186 and 32687)
GENETIC TOXICOLOGY
GENE MUTATION
016 004282 amp 004293 Mutagenicity of 13-Dichloropropene using Ames Testing (Schering AG summary report 982) Formulated mixtures containing 13-dichloropropene in addition to various other constituents were tested for mutagenic activity in the Ames Salmonella Test Results were conflicting and insufficient for independent assessment UNACCEPTABLE but upgradeable upon submission of complete report(s) Summary contains statement that positive effects were seen with TA1535 and TA100 but no data Report contains a statement that the methyl isothiocyanate in the sample tested caused cytotoxicity before the mutagenic effect was detectable No data (Reviewed 6385 BY AA peer review 81886 by Martz and 71888 by Gee)
010 036556 Mutagenicity of 13-Dichloropropene in Bacteria Test System (Nomura Sogo Res Inst 1278) E coli strain Br Wp 2 Try- 498-cis and 463-trans 13-dichloropropene 5000 2500 1000 500 250 100 25 or 0 microgplate +S9 Unacceptable and not upgradeable due to design deficiencies No mutagenic effects reported (Gee 22486)
010 036558 Mutagenicity of 13-Dichloropropene in Bacteria Test System (Nomura Sogo Res Inst 1278) Five Salmonella strains for plate assay 498-cis and 463-trans 13-dichloropropene 0-5000 microgplate + S9 G46 for host-mediated assay in ICR mice at 30 or 60 mgkg x 3 times3 hours UNACCEPTABLE and not upgradeable single plates Significant Positive response in several strains indicative of base-pair substitution negative in host-mediated assay (Gee 22486)
DPR MEDICAL TOXICOLOGY TELONE II (13-DICHLOROPROPENE) TOX SUMMARY T940810 Page 7
019 042945 The Evaluation of Telone II Soil Fumigant in the CHO CellHGPRT Forward Mutation Assay (Dow 22786) CHOHGPRT assay Telone II (489 cis and 432 trans 13-dichloropropene) 250 200 150 100 50 or 0 mM without S9 (3 trials) and 200 150 125 100 50 or 0 microM with S9 (1 trial) Report complete and study ACCEPTABLE NO evidence of mutagenicity (Gee 72486)
No record number Chemical Mutagenesis Testing in Drosophila III Results of 48 Coded Compounds Tested for the National Toxicology Program (Valencia R et al Environmental Mutagenesis 7 325 - 348 (1985)) 13-Dichloropropene technical 955 was tested with male Canton-S wild-type stock by feeding at 5570 ppm for 72 hours from soaked filter paper The males were mated to Basc females for 3 2 and 2 days No more than 40 females per parental male were mated from each brood A total of 6584 tests were performed The percent lethals were 012 for control broods and 030 for treated broods - considered positive by the authors The translocation test was negative No worksheet [Review done in connection with the risk assessment] (Gee 53190)
Summary Although the test in mammalian cells was negative there appear to be several studies with Salmonella giving positive results although none of those on file are acceptable The positive effect reported in 036558 was quite significant The possible adverse effect for gene mutation therefore stands at this time One problem is the volatility of the test material and care must be taken to control samples for this property From the text of the study with CHO the flasks were tightly capped and loss of test material should not have been a factor (Gee 71888)
CHROMOSOMES
010 036560 Evaluation of Telone II Soil Fumigant in the Mouse Bone Marrow Micronucleus Test (Dow 585) Telone II (495-cis and 426-trans 13-dichloropropene) 380 115 38 or 0 mgkg by oral gavage in CD-1 mice 5sexgroup 24 or 48 hour sac Reviewed 22586 as incomplete but upgradeable with justification of the use of only two sacrifice times This has been submitted as Record 55630 in 50046-025 based on excretion of 93 within 48 hours The study is now reviewed as ACCEPTABLE NO increase in MN-PCEs reported (Gee 22586 and 41687)
Note The reregistration standard of 1986 indicates that EPA is requiring additional testing for chromosomal effects notably in vivo testing of bone marrow in rats
DNAOTHER
010 036557 Mutagenicity Test on 13-Dichloropropene in Bacteria Test System (Nomura Sogo Res Inst 1278) Bacillus subtilis rec assay strains H17 and M45 498 cis- and 463 trans-13-dichloropropene 1250 500 125 50 or 0 microgwell without activation UNACCEPTABLE and not upgradeable due to design deficiencies Slight growth differences at highest level Reviewed 22486 by Gee
010 036559 Evaluation of Telone II in the Rat Hepatocyte Unscheduled DNA Synthesis Assay (Dow 485) UDS in rat hepatocytes Telone II (495 cis and 426 trans-13-dichloropropene) 1x10⁻⁷ to 3x10⁻³ M concentration
DPR MEDICAL TOXICOLOGY TELONE II (13-DICHLOROPROPENE) TOX SUMMARY T940810 Page 8
(solubility limit) plus control Report complete and study ACCEPTABLE NO evidence of UDS even when cytotoxicity was noted (Gee 22486)
Summary These two tests measure different endpoints so no one conclusion can be reached and a possible adverse genotoxic effect is noted Gee 71888
Note The reregistration standard of 1986 noted requirements for in vitroin vivo primary hepatocyte UDS testing both in vitro and in vivo exposure shyspecies not specified Record 036559 is not cited (Gee 52389)
Note In addition to the studies formally submitted by the registrant publications in the open literature have been reviewed (no worksheets) The conclusion is that exposure to telone was genotoxic in multiple tests with multiple endpoints The registrant has presented the position that the effects in early studies were due to mutagenic impurities and to the stabilizer The stabilizer has been changed in recent products In the absence of additional studies however which clearly demonstrate negative results the overall weight-of-evidence indicates that telone is mutagenic in both prokaryotes and eukaryotes (Gee 81094)
NEUROTOXICITY
Not required at this time
GENERAL INFORMATION
007 932850 Communication to EPA from Dow dated 2982 contains risk assessment based on data from NTP rat and mouse studies ( 036552 amp 53) as well as published dermal studies ( 036554) and refers to oncogenic effects noted in the former (Martz 81886)
016 932849 932853 and 022757 Contain preliminary summary of NTP studies ( 036552 amp 53) summary of mutagenicity studies showing positive effects ( 036556-58) and summary of the one generation reproduction study with technical D-D ( 36555) respectively (Martz 81886)
APPENDIX B
EXPOSURE ASSESSMENT
Human Exposure Assessment for 13-dichloropropene
by
James R Sanborn Staff Toxicologist
Sally Powell Senior Environmental Research Scientist
HS 1634
May 26 1989 Revised July 20 1994
California Environmental Protection Agency Department of Pesticide Regulation Worker Health and Safety Branch
1020 N Street Sacramento California 95814
ABSTRACT
The soil fumigant 13-dichloropropene (13-D) is used to control soil parasitic nematodes and other soil pests in annual crops and some perennials before planting Metabolism and pharmacokinetic data on 13-D indicate facile conjugation as a mercapturate and renal elimination after inhalation The primary mode of exposure is inhalation with dermal absorption of the vapor considered unimportant Inadvertent exposure of humans during application equipment failure or repair has resulted in skin andor eye irritation Biological monitoring of workers demonstrated an estimated Absorbed Daily Dosage of 19 ugkgday (113 and 073 ugkgday for application and loading respectively) when adjusted for respiratory protection worn during the entire fumigation cycle These adjusted numbers are reflective of practices to be implemented in California should 13-D be reinstated including spill control dry disconnects and vapor recovery measures Non-occupational inhalation exposure for residents of a Telone reinstatement area was estimated by stochastic simulation Estimated 95th percentile Lifetime Average Daily Dosages ranged from 0167 ugkgday for residents living 500 m from treated fields for 30 years to 0373 ugkgday for residents living 100 m from fields for 70 years Estimated 95th percentile 62-day Average Daily Dosages ranged from 0674 ugkgday for infants living 500 m from treated fields to 6272 ugkgday for young children living 100 m from fields This report was prepared as Appendix B to the Departments risk assessment document for 13-D The necessity for this risk document stemmed from the identification of adverse effects in acute and chronic studies as well as characterization of 13-D as an oncogen in rat chronic feeding and mouse inhalation studies
APPENDIX B
CALIFORNIA ENVIRONMENTAL PROTECTION AGENCY DEPARTMENT OF PESTICIDE REGULATION WORKER HEALTH AND SAFETY BRANCH
HUMAN EXPOSURE ASSESSMENT
13-DICHLOROPROPENE
May 261989 Revised July 20 1994
INTRODUCTION
The fumigant 13-dichloropropene (13-D) (CAS 542-75-6 molecular formula C3H4Cl2) is a liquid used as a soil treatment for the control of plant parasitic nematodes and other soil pests The physical properties of 13-D are listed below
Boiling point 108oC (Composite of cistrans isomers higher BP 1120oC lower BP 1043oC) Vapor pressure 273 mm at 25oC Density 12 gml at 25oC Water solubility 2180 ppm (cis-) 2320 ppm (trans-) Octanolwater partition coefficient 104 Cis-trans- ratio 11
EPA STATUS
A Registration Standard was issued in September 1986 for 13-D which includes exposure and risk assessments for workers handling 13-D These assessments assume that inhalation is the primary route of exposure and that dermal exposure may only contribute during episodes of equipment repair or failure Respirators chemically resistant clothing and gloves are required during mixing and loading
USAGE
13-D is manufactured by Dow Chemical Co as a formulation containing 94 active ingredient (11 cis-trans- isomer ratio) and 6 inert ingredients Commercial 13-D is sold under the name Telone IItrade and contains 95 lbs ai per gallon 13-D is registered for use on more than 120 crops and ornamentals It is used for preplant soil treatments for vegetable crops field crops deciduous fruit trees nut trees and vines It is recommended that soils where annual crops are grown be treated each year before planting Over 15 million pounds were reported sold in California in 1987 (California Department of Food and Agriculture 1988) Application rates of 13-D depend on crop and soil type and range from 43 to 970 lbs aiacre The soil surface is sealed by covering or rolling after application to increase efficacy by reduction of vapor loss Application equipment injects 13-D to a depth of at least 12 inches below the sealed soil surface
LABEL PRECAUTIONS
The label for Telone II contains the signal word WARNING and the following precautionary statements
PRECAUTIONARY STATEMENTS
HAZARDOUS TO HUMANS AND DOMESTIC ANIMALS HAZARDOUS LIQUID AND VAPOR
o MAY CAUSE ALLERGIC SKIN REACTION o MAY BE FATAL IF INHALED ABSORBED THROUGH SKIN OR SWALLOWED o CAUSES SEVERE EYE DAMAGE o CAUSES BURNS OF SKIN o MAY CAUSE LUNG LIVER AND KIDNEY DAMAGE AND RESPIRATORY SYSTEM UPON
PROLONGED CONTACT o Do not breathe vapor o Do not get in eyes on skin on clothing o Do not take internally o Use only with adequate ventilation o Wear eye and skin protection necessary to prevent contact when handling TELONE II o Wash thoroughly with soap and water after handling and before eating or smoking o If protective gear such as boots or gloves becomes contaminated immediately wash with
soap and water Never wear protective gear having the odor of 13-dichloropropene Aerate and wash all protective gear thoroughly after each use until odor is gone
o Render unusable and dispose of contaminated leather goods including shoes o Do not apply this product in such a manner as to directly or through drift expose workers or
other personnel The area being treated must be vacated by unprotected persons
California regulations and permit conditions Additional requirements
California regulations require respiratory protection when inhalation exposure potential is high (eg during loading and equipment repair) Eye and skin protection (gloves and chemical resistant clothing) are required when handling Telone II
The California permit conditions will require additional protective equipment Loaders will be required to wear full-face respirators Applicators must either wear a half-face respirator or be inside a charcoal-filtered cab during application Workers re-entering a treated area during the first 7 days post application will be required to wear a one-half face respirator
3
___________________________________________________________________________
___________________________________________________________________________
WORKER ILLNESS
Table 1 shows that from 1982-1990 there were 55 illnesses that were related to exposure to 13-D In terms of type of illness they were almost equally divided between systemic (16) eye (14) and skin (18) With respect to the causality most of the illnesses were classified as definite (33) followed by probable (9) and possible
Table 1 13-dichloropropene illnesses in California (1982-1990)
Year Type Causality
Systemic Eye Skin EyeSkin Definite Probable Possible
1982 4 2 1 0 1 2 4 1983 2 3 1 0 5 1 0 1984 1 3 2 0 4 1 1 1985 0 2 3 0 4 1 0 1986 1 0 2 1 1 2 1 1987 1 0 0 0 1 0 0 1988 1 2 7 0 6 2 2 1989 1 2 1 2 5 0 1 1990 5 0 1 0 6 0 0
METABOLISMPHARMACOKINETICS
ANIMAL STUDIES
Inhalation
Rats exposed nose-only to 30 90 300 or 900 ppm of 13-dichloropropene (cis- 493 transshy428) for three hours absorbed 14 29 85 and 171 mgkg respectively or 82 65 66 62 percent respectively of the exposure dose (Stott and Kastl 1986) Decreases in percent absorbed as the exposure concentration increases are apparently related to the decreased ventilation frequency at higher exposure levels Tissue distribution of inhaled vapors indicated the lungs contained approximately 50 percent of the total inhaled vapors and the nasal passages contained an additional 10-16 percent Depuration of 13-D in the blood was biphasic with the initial half-life estimated to be 3-6 minutes and the terminal half-life 30-40 minutes Levels of protein sulfhydryl amino acids were reduced but no reduction in pulmonary sulfhydryl amino acids was observed Similar results for rats were reported for tissue distribution and glutathione depletion after a one-hour exposure (Fisher and Kilgore 1988a)
The characterization of the primary urinary metabolite from rats after inhalation was accomplished by Fisher and Kilgore (1988b) who found a mercapturate after a one hour exposure to 13-D at 40 107 284 398 or 789 ppm The excretion of the conjugate was nearly linear with respect to 13-D exposure up to 400 ppm Above 400 ppm the excretion of the mercapturate declined relative to this initial linearity This may have been due to decreased ventilation frequency in rats exposed three hours to doses greater than 90 ppm as reported by Stott and Kastl (1986) Alternatively it may have been due to depletion of conjugable glutathione
4
Oral dosing
Several investigators have examined the metabolic fate of 13-D in animals after an oral dose Hutson et al (1971) reported that 81 of 10-mg doses of cis-13-D and 57 of 10-mg doses of trans-13-D were eliminated in the urine Dietz et al (1984 ab) reported 50-80 percent renal elimination and 14-17 percent elimination as CO2 in rats or mice treated with 13-D No evidence of saturation of metabolic pathways was observed up to 50 mgkg in these later studies Urinary elimination of 14C-equivalents was estimated to have a half-life of approximately 55 hours
The primary metabolite in urine of rodents dosed orally with 13-D is N-acetyl-S-(3-chloropropshy2-enyl) cysteine (DCPMER) and its sulfoxide This indicates that 13-D is metabolized and conjugated via a glutathione pathway in rodents The formation of this metabolite is consistent with the loss of non-protein sulfhydryl levels in the liver and stomach after per os doses with 13-D (Dietz et al 1984 Climie et al 1979)
HUMANS
Inhalation
In workers exposed to 13-D during loading and application Osterloh et al (1984 1989) Brouwer et al (1991) and van Welie et al (1991) observed DCPMER as a urinary metabolite The common urinary metabolite in rodents and humans indicates that these species metabolize 13-D by similar metabolic pathways
A PBPK study was conducted by the registrant in which six humans were exposed to 13-D in an inhalation chamber at 1 ppm for 6 hours (Waechter et al 1992) Estimates of respiratory uptake made from analysis of exhaled breath during the exposure averaged 78 for the two isomers Urine was collected during and after exposure (84 hrs post exposure) Excretion of the cis- and trans-mercapturates was complete 36 hours post exposure The combined conversion of inhaled 13-D to the two mercapturates was found to be 24 (Stott 1992)
DERMAL ABSORPTION
The high vapor pressure of 13-D (273 mm) reduces its dermal absorption potential There is a single report in the literature concerning dermal absorption of 13-D and other low-boiling organic chemicals (Cohen and Poppendorf 1989) The experimental details are not complete as the paper reported the values from a thesis by the first author The values reported for dermal absorption of 13-D in rats in vivo were 062 and 15 for doses of 19 and 19 ugcm2 respectively This range of absorption values was found for exposed skin that was not occluded
5
___________________________________________________________________________
___________________________________________________________________________
___________________________________________________________________________
___________________________________________________________________________
WORKER EXPOSURE
Inhalation
Worker inhalation exposure assessed by breathing zone measurements during loading application or equipment repair are summarized in Table 2
Table 2 Breathing zone air concentrations of workers handling 13-dichloropropene during loading and application
ppm Reference Date
037a Davies and Fraser 1988 004-040 Tobol and Axe 1982b
038a Maddy et al 1980 071a Maddy et al 1982 017a Fong and Maykoski 1985 lt10a Albrecht 1987 lt02a Cook 1982b
a Time-weighted average b Cited by Davies and Fraser (1988)
These studies suggest that workers are exposed to time-weighted average levels that are below the recommended 1 ppm Permissible Exposure Limit set by the Occupational Safety and Health Administration
Since concentrations were measured in the workers breathing zones while they performed a variety of tasks (some loaded and some applied others loaded or applied and some unspecified) the reported inhalation exposure results from a composite of work tasks The individual studies did not always report exposures by task nor did they report any more than TWA values or monitoring results making it difficult to obtain an absorbed dose for each work task
Table 3 Potential inhalation exposure for 13-dichloropropene estimated from reported breathing zone concentrations assuming a respiratory rate of 29 Lmin
Study mg8-hr day
Poppendorf et al(1983) 1423 Maddy et al (1980) 240 Maddy et al(1982) 448 Fong and Maykoski(1985) 108 Davies and Fraser (1988) 233 Cook(1983) 126 Albrecht1987) 631
Geometric Mean 315
6
___________________________________________________________________________
___________________________________________________________________________
The air monitoring results of several studies have been converted to potential inhalation exposures in mg8-hr day by assuming a respiration rate of 29 Lmin (Table 3) The geometric mean of these data is reported because the data are log-normally distributed (Shapiro and Wilk 1965) It is conventional to treat exposure data by this statistical method as it allows the use of all the environmental or exposure data that may be widely variant (Owen and DeRouen 1980) If the mean for potential inhalation exposure from breathing zone measurements is mitigated by a respirator (90 reduction in exposure) corrected for respiratory uptake (78 Waechter et al 1992)) and a 70-kg person is assumed then the ADD (Absorbed Daily Dosage) is 351 ugkgday
Hand Exposure
The data available on potential hand exposure to 13-D are conflicting Maddy et al (1980 1982) reported hand a contamination level of 164 ughr for workers wearing gloves The other data on hand exposure (Table 4) were taken from the work of Davies and Fraser (1988) on an application of 13-D in Canada The range of the data for the eight individuals hand residues was 01-570 mghr with a geometric mean of 97 mghr
Table 4 Hand exposure to 13-dichloropropene during loadinga
Worker mghr
1 14 2 08 3 265 4 193 5 570 6 07 7 333 8 01
Geometric Mean 97
a Davies and Fraser (1988)
This exposure value for the hand of 97 mghr is almost 600-fold greater than that reported by Maddy (1982) The reasons for this large difference may be in the experimental design In the Davies and Fraser (1988) study the protocol was a cotton glove-polyethylene glove (1 mm)-cotton glove arrangement where the inner cotton gloves were analyzed for 13-D The inner glove provides an absorptive sink whereas the outer glove compared to the smooth protective glove normally worn provides a sponge for liquid 13-D for eventual penetration through the thin polyethylene glove This type of thin glove (polyethylene) is not normally utilized in application of this material as it would not withstand the physical abuse of daily operations during loading the fumigant into the tanks It is likely that in the studies of Maddy et al (1982) where hand residues were monitored under normal work conditions that thicker gloves were worn Further Maddy suggests that hand washes may not be an effective means for the removal of residues because some evaporation may have occurred as well as some dermal absorption Even so the analysis of hand washes in the work reported by Maddy et al reported microgram amounts of 13-D rather than the milligram amounts in the work of
7
_____________________________________________________________________
_____________________________________________________________________
Davies and Fraser While the Maddy data is very likely an underestimate of dermal exposure the dermal estimates of Davies and Fraser are overestimates due to the experimental design Since the hand exposure values are for 12 hrsday (estimated daily loading time) the dermal component becomes a minor contributor of the overall human exposure which is primarily via inhalation
Annual and Lifetime Exposure Days
Estimates of worker exposure time are provided by the US EPA Data Call-In for handlers of 13-D in crops grown in California that have been treated with 13-D (Houtman 1992) This survey provided information on the number days per year for each crop that 13-D was handled for applicators and loaders in California (Table 5 ) The maximum number of days per career was estimated to be 270 The number of days per career ranged from a low of 24 for potatoes to a high of 270 for brassica It is possible that the same individuals applying for brassica could be applying in vegetables which could mean that an individuals exposure days per year or career could be as high as the total for all crops However it is likely to be much less because the calendar window for application to each crop prevents any one person from working all of them
Table 5 Annual and lifetime handling days for loaders (L) applicators (A) and repairs (R)
Tomato Potato Cotton Vegetables Brassica Beets TreeVine LAR LAR LAR LAR LAR LAR LAR
Annual Custom 162334 444 403626 183524 363636 101010 2298
Grower 111 111 2213 353535 000 111 444
Lifetime Custom 104150221 242424 260234169 108210144 270270270 656565 1988172
Grower 454545 252525 99585 875875875 000 454545 121212
Biological Monitoring
Osterloh et al (1984 1989 a and b) reported human exposure studies with 22 workers loading and applying in which they conducted urinary monitoring for N-acetyl-S-(3-chloroprop-2shyenyl)cysteine (DCPMER) Respiratory protection (half-face) was worn only during loading and not during application An average of 34 mg of DCPMER was excreted in the 24-hour period after exposure Correction for the molecular weight difference between 13-D (111) and DCPMER (237) gives an ADD of 16 mgpersonday or 227 ugkgday Using the data of Davies and Fraser (1988) it is possible to calculate the percentage of the exposure received during application and loading In Davies and Fraser it was determined that 261 percent of the exposure occurred during application 739 during loading Osterloh et al assumed 90 protection from the half-face respirator worn during loading hence the inhaled dose was 01 times the exposure During application 10 (0 respiratory protection) indicates the absence of respirators The absorbed dose for each activity may be found by the following equation
8
Loading Application (739 )(X)(01) + (261)(X)(10) = 227 ugkgday (1)
where X is exposure Solving for X gives 678 ugkgday Putting this value back into equation (1) and adding respiratory protection (half-face respirators) during application gives
Loading Application (739)(678)(01) + (261 )(678)(01) = 68 ugkgday
The value of 68 ugkgday is the expected ADD if half-face respirators are worn during both loading and application
Houtman (1993) monitored five individuals loading or applying 13-D in Washington state The same individual did not do both tasks These applicators and loaders carried out one application per day at a rate of 25 galacre lasting about four hours One application was done without mitigation measures while the others used various mitigation measures specified by the US EPA including dry disconnects (with and without vapor recovery) spill control at the end of the rows and a cab with charcoal-filtered air Houtman collected urinary monitoring data only for the application conducted without mitigation measures To estimate the absorbed daily dose from these unmitigated conditions respiratory protection factors of 09 and 095 for half-face and full-face respirators were used for applicators and loaders respectively The human chamber PBPK exposure study data were used in the absorbed dose calculation These respiratory protection requirements for loaders and applicators were part of the Permit Conditions in California for the flux studies and the Monterey Commercial Use Project These same respiratory protection conditions will be required if 13-D is reinstated in California
The exposure data shown in Table 6 as geometric means have been normalized to an 68shyhour day which is consistent with the data of Davies and Fraser (1988) and allows comparison with the data of Osterloh et al where one person performed both loading and application
Houtman (1993) found that utilizing spill control during application reduced the ambient air concentrations by 79 The urinary metabolite data were adjusted by this factor The absorbed dose was adjusted for the wearing of a one-half face respirator from the unmitigated application in Washington The final adjustment of the data from Washington was the factoring of the reduced rate in California (12 galacre) as compared to the 25 galacre that were used in the studies in Washington The loader exposure data were not adjusted for the reduced rate in California as the exposure occurs primarily during the connecting and disconnection of the hose from the nurse tank and is unrelated to the amount placed in the tank on the tractor
With respect to the estimation of AADD and LADD the range of values for loading and applying were obtained from the crop specific data compiled in Table 5 There are several reasons for the reduced exposure of a combined (one person doing both tasks) load and apply (19 ugkgday) in the Washington study (Houtman 1993) as compared to the earlier combined estimate of Osterloh et al (68 ugkgday) Firstly for the loader the Washington study used dry disconnects and vapor recovery devices For the applicator spill control was used at the end of the rows Each of these mitigation strategies reduces ambient air concentration which resulted in lower estimated exposure value of more than three-fold It is further likely that the soil moisture content will be higher in California than occurred during the applications in Washington This will further reduce emissions
9
_____________________________________________________________________
_____________________________________________________________________
Table 6 ADD AADD and LADD values for loading and application of 13- dichloropropene
Study Task ADD1 Days SADD4 AADD5 Days LADD6
(ugkgd) Year (ugkgd) (ugkgd) Career (ugkgd)
Osterloh et al LoadApply 680
Houtman Load 0733 4 0016 0008 24 69x10-4
40 016 008 270 77x10-3
Apply 1133 4 36
0025 023
0012 011
24 270
11x10-3
12x10-2
Total2 186
1 Absorbed Daily Dosage two load and application cyclesday body weights of study volunteers used in calculations
2 One person doing both loading and applying-for comparison to studies of Osterloh et al 3 Normalized to 68 hrs based on registrant study (Davies and Fraser 1988) for one
person doing both tasks to be compared with Osterloh et al 4 Split application for brassica 90-day window (see Table 5) 5 Annual Average Daily Dosage (365 daysyear) 6 Lifetime Average Daily Dosage 70 years life (25550 days)
Exposure Appraisal
The exposure estimates based on the Houtman (1993) study in which exposures were measured separately for loading and application should be used for the assessment of risk These estimates are based on biological monitoring that assessed both cis- and transshymercapturate metabolites in the urine and utilized the pharmacokinetic information developed from exposure of humans under controlled conditions Hand exposure information developed by previous investigators was not used as this route of exposure would be reflected in the total exposure measured by the biological monitoring
None of the occupational exposure studies in which biological monitoring was conducted employed exactly the mitigation measures that would be required in California These requirements are for full-face respiratory protection during loading and half-face protection during application
NON-OCCUPATIONAL EXPOSURE
Inhalation exposure was estimated for residents of an area where Telone is used in carrot growing Both lifetime and subchronic (seasonal) exposures were estimated for residents of the area in general and for residents with homes at specified distances from Telone-treated fields (100 200 and 500 meters) The estimated lifetime exposure distributions are given in Tables 7 through 10 seasonal exposures in Tables 11 through 14
10
=
The exposure assessment relied on simulated air concentrations from a study provided by the registrant (Calhoun et al 1994) in which the ISCST simulation model (Wagner 1987) was used to predict concentrations of 13-D in air for a scenario of limited reintroduction of Telone IItrade soil fumigant in carrots In the use scenario modeled Telone is applied to 25 80-acre fields (2000 acres total) per year in a 9-township (324-square-mile) area in Kern County Under this scenario there is no other use of Telone All applications are at the rate of 12 gallons per acre and no field is treated more than once in three years Calhoun et al simulated three years of daily air concentrations for one point at the center of each section in the reintroduction area to produce an annual average daily concentration for each point The locations of treated fields were assigned randomly in their model so that concentrations at the section centers vary in part due to being different distances and directions from applications The modeled concentrations thus represent long-term ambient concentrations for the reintroduction area Calhoun et al presented separately the concentrations for the township of highest Telone use within the 9-township area These concentrations were used in the exposure assessment
Probability distributions of exposure were estimated using stochastic simulation (Monte Carlo) methods implemented with the program RISK (Palisades Corporation 1992) The distribution of lifetime average daily dose (LADD) as ug of 13-D inhaled per kg of body weight per day (ugkgday) was estimated separately for persons living 1) the first 30 years of and 2) all of a 70-year lifetime in the reintroduction area Seasonal exposure was estimated for July-August the period of greatest Telone use by adjusting the long-term air concentrations for proportional use and mass loss during that 62-day period Additional simulated air concentrations provided by the Environmental Monitoring Branch (Johnson 1994a) were incorporated to estimate both lifetime and 62-day exposures to residents whose dwellings are close to treated fields Exposure distributions were estimated separately for residents living 100 200 and 500 meters from the edges of treated fields Each estimated exposure distribution is based on a simulation with 10000 trials
LADD (ugkgday) was calculated by the following equation
10
([ ]) i 1
where the summation is over 10 age intervals RTi = number of years in age interval i that the person
resides in the Telone use area Conci = average of air concentrations (ugm3) in 5
locations weighted by the proportion of time spent in each location in interval i
BRi = average breathing rate (m3day) at each of 4 activity levels weighted by proportion of time spent at each level in interval i
BWi = body weight (kg) in interval i and 70 years is the assumed lifetime
LADD = RT Conci x BR BW 70i i i
11
Seasonal exposure (62-day average ugkgday) was calculated separately for each age interval as Conc x BR
Average daily dose = BW
where concentration breathing rate and body weight are as defined above for LADD but with air concentrations modified to approximate seasonal averages as explained in the next section
Concentration breathing rate and body weight were stochastic variables in the exposure simulation model The statistical distributions used to simulate them are described in the sections on specific input variables following Tables 7-14
12
___________________________________________________________________________
Table 7 Lifetime average daily dose (ugkgday) of 13-D inhaled by residents of an area where Telone is applied to a total of 25 80-acre fields each year
Residence Time
Birth to age 30 Birth to age 70 Male Female Male Female
Mean 00800 00783 01510 01436 Std Deviation 00480 00487 00867 00902
Percentile 5 0027 0026 0053 0047
10 0032 0031 0063 0056 25 0044 0042 0087 0078 50 0066 0063 0129 0116 75 0103 0101 0193 0186 90 0150 0148 0277 0270 95 0179 0179 0326 0330
975 --a -- -- -shy99 0230 0236 0425 0444
a not calculated
Table 8 Lifetime average daily dose (ugkgday) of 13-D inhaled by residents living 100 m from treated fields in an area where Telone is applied to a total of 25 80-acre fields each year
Residence Time
Birth to age 30 Birth to age 70 Male Female Male Female
Mean 01022 01001 01892 01829 Std Deviation 00514 00515 00926 00959
Percentile 5 0042 004 0078 0071
10 0048 0047 0091 0084 25 0063 0061 012 0111 50 009 0087 0168 0159 75 0129 0128 0238 0233 90 0176 0174 0319 0319 95 0204 0201 0373 0371
975 0228 0227 0416 0423 99 0262 0257 0481 0481
13
___________________________________________________________________________
Table 9 Lifetime average daily dose (ugkgday) of 13-D inhaled by residents living 200 m from treated fields in an area where Telone is applied to a total of 25 80-acre fields each year
Residence Time
Birth to age 30 Birth to age 70 Male Female Male Female
Mean 00996 00973 01846 0178 Std Deviation 00501 00499 00901 00932
Percentile 5 0039 0038 0073 0067
10 0046 0044 0087 008 25 0061 006 0116 0108 50 0088 0086 0165 0156 75 0127 0124 0234 0227 90 0171 0168 0311 0307 95 0199 0196 036 0363
975 0222 022 0408 0414 99 0253 0248 0458 0465
Table 10 Lifetime average daily dose (ugkgday) of 13-D inhaled by residents living 500 m from treated fields in an area where Telone is applied to a total of 25 80-acre fields each year
Residence Time
Birth to age 30 Birth to age 70 Male Female Male Female
Mean 0084 00818 01577 01498 Std Deviation 00423 00419 00772 00781
Percentile 5 0034 0033 0065 0059
10 004 0039 0076 0069 25 0053 0051 0101 0093 50 0074 0071 014 013 75 0106 0103 0198 0189 90 0144 0141 0265 0259 95 0169 0167 031 0305
975 0191 0189 0352 0352 99 0216 0212 04 04
14
Table 11 Average daily dose (ugkgday) of 13-D inhaled by residents during the 62-day period of highest Telone use in an area where Telone is applied to a total of 25 80-acre fields each year
Age Group
lt 1 1 lt 2 2 lt 3 3 lt 6 6 lt 9 Male Female Male Female Male Female Male Female Male Female
Mean 02499 02707 15513 16841 13685 14366 11103 11467 10548 10651 Std Deviation 02270 02431 10419 11219 09039 09243 07460 07561 06797 06863
Percentile 5 0045 0050 0470 0520 0422 0464 0333 0361 0330 0326
10 0058 0065 0558 0616 0501 0549 0399 0426 0397 0395 25 0098 0108 0770 0841 0691 0750 0553 0589 0558 0560 50 0173 0192 1207 1308 1070 1134 0869 0904 0849 0863 75 0321 0343 2052 2244 1815 1897 1466 1507 1367 1396 90 0539 0590 3126 3385 2738 2804 2242 2249 2050 2038 95 0714 0789 3750 4047 3260 3375 2659 2731 2464 2474
975 0903 0966 4233 4530 3667 3821 3010 3137 2783 2880 99 1125 1183 4711 5124 4108 4260 3468 3522 3230 3296
9 lt 12 12 lt 15 15 lt 18 18lt 25 25 lt 70 Male Female Male Female Male Female Male Female Male Female
Mean 07953 07730 06536 05394 05300 04984 05297 04964 04809 04414 Std Deviation 05168 04897 04050 03320 03172 02980 02904 02913 02688 02840
Percentile 5 0239 0237 0208 0172 0176 0164 0188 0164 0167 0132
10 0291 0292 0254 0209 0214 0196 0228 0200 0201 0164 25 0417 0412 0360 0295 0298 0278 0314 0284 0281 0236 50 0645 0635 0545 0453 0447 0419 0459 0422 0416 0362 75 1029 1007 0835 0694 0676 0645 0676 0637 0618 0567 90 1529 1455 1209 0998 0977 0917 0930 0904 0848 0830 95 1870 1767 1457 1207 1171 1103 1103 1085 1018 1022
975 2118 2080 1713 1413 1338 1279 1267 1252 1166 1190 99 2496 2341 2020 1645 1568 1450 1468 1433 1342 1382
15
Table 12 Average daily dose (ugkgday) of 13-D inhaled during the 62-day period of highest Telone use by residents living 100 m from fields in an area where Telone is applied to a total of 25 80-acre fields each year
Age Group
lt 1 1 lt 2 2 lt 3 3 lt 6 6 lt 9 Male Female Male Female Male Female Male Female Male Female
Mean 04940 05352 30723 33330 26876 27770 21802 22126 19918 19861 Std Deviation 03548 03830 14181 15406 12335 12549 10277 10370 09528 09564
Percentile 5 0118 0128 1368 1490 1206 1263 0942 0968 0852 0833
10 0152 0166 1545 1672 1347 1418 1069 1098 0969 0965 25 0238 0258 1924 2096 1697 1757 1366 1393 1255 1254 50 0395 0425 2710 2949 2360 2470 1918 1960 1760 1766 75 0641 0699 4008 4347 3502 3620 2833 2868 2545 2529 90 0976 1076 5137 5567 4481 4594 3657 3725 3371 3371 95 1217 1331 5792 6272 5021 5177 4158 4258 3831 3879
975 1450 1563 6306 6950 5536 5720 4615 4647 4261 4271 99 1680 1784 6915 7610 6021 6204 5033 5157 4801 4847
9 lt 12 12 lt 15 15 lt 18 18lt 25 25 lt 70 Male Female Male Female Male Female Male Female Male Female
Mean 14857 14065 11533 09575 09336 08872 08833 08610 08063 08020 Std Deviation 07344 06874 05796 04659 04444 04134 03970 04030 03694 04061
Percentile 5 0603 0573 0464 0396 0393 0379 0383 0359 0350 0305
10 0701 0667 0539 0459 0454 0438 0447 0422 0405 0366 25 0923 0890 0723 0610 0599 0571 0584 0558 0526 0499 50 1314 1244 1020 0849 0833 0792 0802 0770 0733 0704 75 1899 1795 1456 1209 1184 1126 1111 1091 1007 1034 90 2530 2389 1927 1605 1549 1481 1436 1433 1316 1382 95 2925 2770 2287 1863 1809 1695 1662 1661 1524 1604
975 3280 3076 2623 2102 2000 1867 1841 1818 1725 1790 99 3678 3463 3033 2434 2278 2101 2083 2029 1922 2018
16
Table 13 Average daily dose (ugkgday) of 13-D inhaled during the 62-day period of highest Telone use by residents living 200 m from fields in an area where Telone is applied to a total of 25 80-acre fields each year
Age Group
lt 1 1 lt 2 2 lt 3 3 lt 6 6 lt 9 Male Female Male Female Male Female Male Female Male Female
Mean 04605 05018 28772 31305 25168 26084 20439 20856 18713 18739 Std Deviation 03227 03596 13044 14290 11309 11633 09438 09779 08750 08917
Percentile 5 0112 0117 1229 1308 1089 1124 0851 0854 0758 0745
10 0139 0155 1382 1492 1222 1278 0978 0986 0895 0871 25 0219 0243 1778 1935 1568 1633 1265 1293 1169 1170 50 0374 0401 2647 2865 2324 2404 1865 1887 1700 1694 75 0607 0664 3775 4152 3289 3433 2687 2734 2426 2428 90 0906 0998 4704 5195 4114 4278 3387 3499 3103 3164 95 1112 1238 5266 5730 4585 4726 3771 3915 3536 3593
975 1300 1441 5770 6269 5016 5128 4206 4249 3908 3920 99 1534 1688 6289 6837 5542 5607 4605 4696 4281 4346
9 lt 12 12 lt 15 15 lt 18 18lt 25 25 lt 70 Male Female Male Female Male Female Male Female Male Female
Mean 13973 13308 10879 09069 08808 08389 08368 08156 07646 07564 Std Deviation 06736 06511 05331 04368 04053 03864 03650 03789 03405 03774
Percentile 5 0539 0511 0423 0356 0362 0348 0358 0328 0322 0284
10 0648 0604 0501 0423 0424 0405 0419 0390 0376 0336 25 0872 0824 0679 0567 0570 0530 0554 0523 0503 0462 50 1254 1199 0982 0819 0799 0766 0779 0745 0706 0675 75 1816 1723 1388 1170 1128 1081 1064 1044 0961 0984 90 2351 2273 1816 1521 1439 1382 1328 1350 1231 1286 95 2687 2563 2107 1726 1643 1579 1522 1527 1409 1483
975 2965 2847 2365 1940 1850 1741 1692 1704 1581 1659 99 3358 3142 2680 2170 2043 1922 1877 1904 1767 1851
17
Table 14 Average daily dose (ugkgday) of 13-D inhaled during the 62-day period of highest Telone use by residents living 500 m from fields in an area where Telone is applied to a total of 25 80-acre fields each year
Age Group
lt 1 1 lt 2 2 lt 3 3 lt 6 6 lt 9 Male Female Male Female Male Female Male Female Male Female
Mean 02906 03157 18121 19672 15953 16652 12951 13295 12146 12220 Std Deviation 01948 02105 07170 07709 06263 06341 05264 05343 04984 05174
Percentile 5 0078 0085 0934 1024 0826 0878 0655 0659 0588 0584
10 0099 0107 1041 1141 0920 0977 0724 0750 0671 0666 25 0147 0161 1257 1387 1111 1185 0892 0940 0840 0842 50 0242 0264 1653 1777 1457 1523 1180 1209 1114 1116 75 0378 0413 2232 2419 1974 2044 1596 1633 1494 1494 90 0550 0592 2797 3022 2460 2547 2028 2059 1897 1936 95 0674 0724 3194 3462 2803 2891 2301 2344 2167 2204
975 0809 0878 3536 3831 3097 3174 2574 2652 2438 2478 99 0957 1046 3922 4256 3424 3539 2853 2981 2705 2881
9 lt 12 12 lt 15 15 lt 18 18lt 25 25 lt 70 Male Female Male Female Male Female Male Female Male Female
Mean 09136 08829 07399 06103 05984 05640 05913 05588 05364 05024 Std Deviation 03929 03854 03262 02660 02473 02308 02375 02331 02169 02240
Percentile 5 0418 0399 0330 0285 0280 0274 0280 0264 0254 0223
10 0481 0463 0381 0324 0321 0310 0327 0305 0292 0258 25 0621 0603 0501 0418 0418 0392 0415 0385 0373 0336 50 0841 0805 0677 0556 0557 0517 0553 0516 0501 0455 75 1127 1084 0917 0749 0732 0689 0724 0689 0658 0624 90 1458 1401 1188 0961 0927 0877 0908 0872 0833 0813 95 1674 1633 1373 1129 1069 1009 1044 0999 0947 0922
975 1843 1818 1532 1256 1208 1112 1175 1101 1055 1031 99 2078 2087 1729 1481 1323 1276 1306 1277 1190 1210
18
___________________________________________________________________________
___________________________________________________________________________
INPUT VARIABLES FOR EXPOSURE SIMULATION
Air concentrations
Table 15 gives the probability distributions of air concentrations (in ugm3) used as input in the exposure simulations The first column gives percentiles of the distribution interpolated from a four-parameter logistic curve fit to the original Calhoun et al frequency distribution The interpolated concentrations were adjusted by factors developed by the Environmental Monitoring Branch of DPR (Johnson 1994b) shown in the second column Environmental Monitoring did additional modeling with ISCST to develop an adjustment to approximate the effect of using a 36-point-per-section spatial grid to model air concentrations instead of the relatively coarse 1-point-per-section grid used by Calhoun et al The effect of the adjustment is to increase the variability of the air concentrations while the mean level is unchanged The adjusted concentrations appear in the third column These adjusted values reflecting annual average daily concentrations for points on a 36-point-per-section grid were used for the estimation of lifetime average exposure
Table 15 Air concentration (ugm3) probability distributions used in exposure simulation
Concentrations Adjustment Adjusted Adjusted interpolated from 4shy factors to concentrations concentrations parameter logistic approximate used to estimate used to estimate
Percentile curvea 36-point gridb lifetime exposure 62-day exposure
00001 0103842 069359 0072024 0278587 001 0106063 084461 0089582 0346503 01 0128835 093182 0120051 0464356 02 0160687 096331 0154791 0598731 03 0201575 098483 0198517 0767865 04 0254546 100283 0255267 0987372 05 0323879 101963 0330237 1277356 06 0415684 103671 0430944 1666892 07 0538854 105566 0568846 2200298 08 0706593 107924 0762583 2949673 09 0938983 111571 1047632 4052242 095 1088601 115040 1252327 4844000 099 1228987 123092 1512784 5851450 0999 1263482 135000 1705701 6597652 09999 1266995 149000 1887822 7302097
a Curve fit to high-end air concentration frequency distribution in Calhoun et al (1994) b Johnson (1994b)
19
Seasonal exposure was estimated for July-August the period of historically highest Telone use To estimate average daily concentrations for this 62-day period the adjusted annual concentrations were modified as follows In the Calhoun et al simulation all positive air concentrations occurred in two 74shyday periods (60 days of Telone use plus 14 additional days for the material to dissipate) one in spring and the other in summer In their simulation 707 of the total Telone was applied during the summer use period with 40 mass loss to air In the spring period 293 of the Telone was applied with a mass loss rate of 25 To approximate the average daily concentrations during the summer period the fraction of the annual concentration contributed by the summer period was assumed to be (707 x 40) [(707 x 40) + (293 x 25)] = 0794 This fraction was condensed into 74 days by multiplying by 36574 Since actual Telone applications will probably not be restricted to the four months assumed by Calhoun et al historical use patterns were consulted Pesticide use reporting data showed that in 1988 and 1989 585 and 499 respectively of 13-D applied to carrots in Kern County was applied during July and August The simulation summer-period concentrations were further modified to represent concentrations for the 62 days of July-August by multiplying by (585 707) x (7462) The net effect was to multiply the annual concentrations by 3868 The concentrations thus modified shown in the fourth column of Table 15 were used for the estimation of seasonal exposure
For both lifetime and seasonal exposure assessments the average air concentration experienced by each person was simulated by randomly selecting five values from the relevant air distribution These values represented five locations where the individual spent his or her time A weighted average of the five concentrations weighted by the proportion of time spent at each location was used as the air concentration experienced by the individual The same five locations were used throughout a persons life but the division of time between them changed as a function of age The division of time between locations was a random variable in the simulation and is discussed in the section on individual mobility
To estimate exposure to persons living close to fields additional modeling with ISCST was done by the Environmental Monitoring Branch to provide annual average daily air concentrations at 100-meter increments from edges of treated fields (Johnson 1994a) The probability distributions of concentrations at 100 200 and 500 meters which were used in this exposure assessment are given in Table 16 In calculating the average concentration experienced by a person the first location selected at which the greatest portion of time is spent was considered the home location The concentration for the home location was simulated by selecting one value from eg the 100-meter distribution and one from the general distribution then calculating a weighted average with the two values weighted one-third and two-thirds respectively to reflect the fact that a field is treated only once in three years The two values were chosen to have a rank order correlation coefficient of 080 based on an observed correlation of 086 between ambient concentrations in the same township from year to year (personal communication Bruce Johnson Environmental Monitoring Branch DPR June 22 1994) For seasonal exposures the home concentration was simply a value from the relevant distance distribution This home location concentration was then used as described in the preceding paragraph in the calculation of the average concentration over five locations
20
___________________________________________________________________________
________________________________________________________________________________
Table 16 Annual average air concentrations (ugm3) at specified distances from treated fieldsa
Percentile 100 meters 200 meters 500 meters
000333 035393 030113 024996 001 037037 031439 026472 005 046011 040619 029312 01 050768 044753 031998 015 055763 048264 035456 02 058246 051404 036323 025 060290 055147 037940 03 064604 058207 038904 035 070250 062520 040306 04 077585 074610 041207 045 087638 085215 045127 05 090497 090723 049474 055 097657 096199 055052 06 105653 102253 057466 065 117366 117403 062218 07 131421 125398 067783 075 143991 134267 075510 08 154023 142689 079173 085 163177 151078 083575 09 175806 159046 087488 095 195317 178902 099410 099 220345 198031 127958 099667 226113 204338 135822
a Johnson (1994a)
21
________________________________________________________________________________
________________________________________________________________________________
Individual mobility within the Telone use area
Individuals were assumed to divide their total time between five randomly selected locations within the Telone high-use area The average air concentration to which an individual is exposed was calculated as described above as the mean of the five location concentrations weighted by the proportion of time spent in each location The mean division of time between locations was derived for each age interval from Table 45 in the Arabrsquos Survey of Childrens Activity Patterns (Wiley 1991a) and Table 33 in Activity Patterns of California Residents (Wiley 1991b) Wileys time at home was used as the time spent in the first selected location his time in transit was divided equally between two locations and the remaining time in the day divided between two others The division of time between these last two locations was 7030 for infants stepping down by age interval to a 5050 division for adults Individual time divisions were allowed to vary from the mean by randomly generating them from a multinomial distribution with n chosen to give fairly small variability in the youngest intervals and greater variability in the adolescent and adult intervals The distributions for time division are shown in Table 17
Table 17 Probability distributions of time spent in five locations
Multinomial Age n Average minutes per day spent in location
interval parameter 1 2 3 4 5
0 to 1 100 Male 1157 27 27 160 69 Female 1151 38 38 150 63
1 to 2 100 Male 1157 27 27 160 69 Female 1151 38 38 150 63
2 to 3 90 Male 1134 31 31 170 74 Female 1099 44 44 151 102
3 to 6 90 Male 1134 31 31 170 74 Female 1099 44 44 151 102
6 to 9 80 Male 1044 59 30 170 137 Female 1021 27 26 256 110
9 to 12 80 Male 1020 31 31 250 108 Female 968 47 46 265 114
12 to 15 70 Male 893 61 60 256 170 Female 917 49 49 255 170
15 to 18 70 Male 893 61 60 256 170 Female 917 49 49 255 170
18 to 25 60 Male 782 75 74 255 254 Female 862 60 60 229 229
25 to 70 60 Male 798 60 59 262 261 Female 960 51 51 189 189
22
Breathing rates
An individuals average breathing rate in each age interval was calculated as a weighted average of his rates at each of four activity levels resting light moderate and heavy The rate at each level was weighted by the proportion of time the individual was assumed to spend at that level Breathing rate at each activity level was a random variable The proportion of time at each level was a constant fixed for each age interval
For infants (0-1 year) a triangular distribution of breathing rates was derived from the mean and range reported in the Exposure Factors Handbook Table 3A-2 (USEPA 1990) The mode of the triangular distribution was set equal to the lower limit of the range in order to match the EPA mean For the other age intervals uniform distributions were derived from data in the ARBs Measurement of Breathing Rate and Volume (Adams 1993) In each case the range was chosen to include all the reported rates relevant to an activity level for a specific sex and age group These ranges are given in Table 18 Data were unavailable for children aged 1-3 so the breathing rates for 3-6-year-olds were used The breathing rates of an individual at different activity levels within and across ages were assumed to have the rank order correlations shown in Table 19 (The value of 08 on the diagonal represents the correlation between breathing rates of the same individual at the same activity level at different ages) It was not possible to incorporate correlations between body weight and breathing rates because the software used did not handle them correctly Correlation coefficients of body surface area and breathing rate within age intervals and activity levels reported in Adams (1993) ranged from 006 to 084 with a mean of 040 The correlation of body weight and breathing rate may be similar The effect of omitting this correlation from the simulation was probably to increase the estimated exposures to an unknown degree because if the greater exposures associated with high breathing rates tended to be paired with high body weights the exposure would be mitigated somewhat
The proportion of time assumed to be spent at each activity level is shown in Table 20
Body weight
Body weight distributions were taken directly from Tables 5A-1 through 5A-4 in the Exposure Factors Handbook (USEPA 1990) The histograms reported in these tables were used without smoothing Upper and lower bounds were supplied to produce a mean weight equal to the mean given in the EPA tables An individuals weights in different age intervals were assumed to have the rank order correlations shown in Table 21
Residence time and lifetime
In estimating lifetime exposures lifetime length was fixed at 70 years Exposure was estimated separately for fixed times of residence in the Telone use area of 30 and 70 years Since the exposure assessment is viewed as applying to any areas where Telone may be reintroduced in the proposed way and not just to the specific township in Kern County for which Calhoun et al modeled air concentrations it was not reasonable to define a distribution of residence time in the area Instead the estimated exposures are those expected to result from living the first 30 or 70 years of a 70-year lifetime in any area with Telone use like that described here
23
________________________________________________________________________________
________________________________________________________________________________
Table 18 Breathing rates (Lmin) as ranges of uniform distributions
Age interval Activity level Male Female
0 to 1 All Triangular ( 025 025 209 ) 1 to 2 Resting 5-7
Light 7-11 Moderate 8-15 Heavy 14-22
2 to 3 Resting 5-7 Light 7-11 Moderate 8-15 Heavy 14-22
3 to 6 Resting 5-7 Light 7-11 Moderate 8-15 Heavy 14-22
6 to 9 Resting 5-9 Light 10-17 Moderate 11-23 Heavy 20-45
9 to 12 Resting 5-9 Light 10-17 Moderate 11-23 Heavy 20-45
12 to 15 Resting 6-12 5-10 Light 7-17 7-15 Moderate 17-35 15-27 Heavy 25-72 24-59
15 to 18 Resting 6-12 5-10 Light 7-17 7-15 Moderate 17-35 15-27 Heavy 25-72 24-59
18 to 25 Resting 7-11 5-10 Light 8-18 6-15 Moderate 18-42 15-28 Heavy 48-80 39-62
25 to 70 Resting 7-11 5-10 Light 8-18 6-15 Moderate 18-42 15-28 Heavy 48-80 39-62
24
________________________________________________________________________________
_____________________________________________________________________________
________________________________________________________________________________
________________________________________________________________________________
Table 19 Rank order correlation coefficients between individuals breathing rates at different activity levels within and across age intervals
Resting Light Moderate Heavy Resting 08 05 05 04 Light 08 05 04 Moderate 08 05 Heavy 08
Table 20 Proportion of time at each activity level (constant in exposure simulation)
Age Activity level interval
Resting Light Moderate Heavy
0 to 1 Male 1 0 0 0 Female 1 0 0 0
1 to 2 Male 08 015 004 001 Female 08 015 004 001
2 to 3 Male 075 02 004 001 Female 075 02 004 001
3 to 6 Male 07 02 008 002 Female 07 02 008 002
6 to 9 Male 07 017 010 003 Female 07 02 008 002
9 to 12 Male 06 032 005 003 Female 06 033 005 002
12 to 15 Male 06 032 005 003 Female 06 033 005 002
15 to 18 Male 05 04 006 004 Female 05 042 005 003
18 to 25 Male 04 050 006 004 Female 04 052 005 003
25 to 70 Male 035 057 005 003 Female 035 060 004 001
25
________________________________________________________________________________
_______________________________________________________________________________
Table 21 Rank order correlation coefficients between the weights of an individual at different ages
0 to 1 1 to 2 2 to 3 3 to 6 6 to 9 9 to 12 12 to 15 15 to 18 18 to 25 25 to 70
0 to 1 100 092 082 072 061 061 061 061 061 061 1 to 2 100 092 082 072 061 061 061 061 061 2 to 3 100 092 082 072 061 061 061 061 3 to 6 100 092 082 072 061 061 061 6 to 9 100 092 082 072 061 061 9 to 12 100 092 082 072 061 12 to 15 100 082 082 072 15 to 18 100 082 082 18 to 25 100 082 25 to 70 100
Exposure appraisal
The estimated exposure distributions may be regarded as providing a reasonable idea of the highest exposures that should be expected under the use scenario The distributions should not be interpreted as reflecting the exposures of a population of individuals but as a set of values that are likely to bracket the exposure of an individual in this situation
It should be noted that the large differences between estimated seasonal exposures of children less than one and children from one to three are largely produced by the input breathing rate distributions The breathing rate data for infants under one came from a different source than all the other breathing rate data In addition no data were available for children from one to three so the rates for three- to six-year-old children were used In combination with the small body size of these children this may have overestimated their exposures
An important limitation of this exposure assessment is that it used 13-D concentrations in outdoor air to estimate 24-hourday exposure even though most people spend the greatest part of the day indoors Since the registrant provided no data on indoor concentrations and since no appropriate surrogate data were available to estimate them it was judged that there was no alternative
It is important to remember that these estimates of non-occupational exposure apply only to the use scenario of Calhoun et al which specified Telone applications to only 2000 acres per year in an area which has 8500 acres of carrots alone Any change in the use scenario would require a new exposure assessment
26
REFERENCES
Adams WC 1993 Measurement of breathing rate and volume in routinely performed daily activities Final report contract no A033-205 Research Division California Air Resources Board Sacramento CA
Albrecht WN 1987 Occupational exposure to 13-dichloropropene (Telone II) in Hawaiian pineapple culture Arch Environ Health 42286-290
Brouwer DH Brouwer EJ de Vreede JAF van Welie RTH Vermuelen NPE and van Hemmen JJ 1991 Inhalation exposure to 13-dichloropropene in the Dutch flower-bulb culture Part I Environmental monitoring Arch Environ Contam Toxicol 201-5
Calhoun LL Fontaine DD Stuart BL and Landenberger BD 1994 13shydichloropropene (13-D) An assessment of implied exposure and risk for the proposed commercial reentry of TELONE soil fumigant into California Dow Chemical Co Midland MI
California Department of Food and Agriculture 1988 Report of pesticides sold in California in 1987 Pesticide Use Enforcement Branch California Department of Food and Agriculture Sacramento CA
Climie IJG Hutson DH Morrison BJ and Stoydin G 1979 Glutathione conjugation in the detoxification of (Z)-13-dichloropropene (a component of the nematicide D-D) Xenobiotica 9149-156
Cohen B-S M and Poppendorf W 1989 A method for monitoring dermal exposure to volatile chemicals Am Ind Hyg Assoc J 50 216-223
Cook RE 1983 Fumigators exposure to airborne 13-dichloropropene during fumigation operation of Telone II soil fumigant Driscoll Citrus Service Inc Fort Pierce Florida Unpublished report of the Dow Chemical Chemical Company Industrial Hygiene Laboratory Midland MI January 4 1983
Davies DB and Fraser PA 1988 Evaluation of potential operator fieldworker and bystander exposure to 13-dichloropropene as a result of tobacco field fumigation with Telone II soil fumigant in southwestern Ontario (Canada) May-June 1985 CDFA Reg Doc No 50046-039
Dietz FK Hermann EA and Ramsey JC 1984a The pharmacokinetics of 14C-13shydichloropropene in rats and mice following oral administration The Toxicologist 4 Abstr No 585
Dietz FK Dittenber DA Krik HD and Ramsey JC 1984b Non-protein sulfhydryl content and macromolecular binding in rats and mice following oral administration of 13shydichloropropene The Toxicologist 4 Abstr No 586
Fisher GD and Kilgore WW 1988a Tissue levels of glutathione following acute inhalation of 13-dichloropropene J Toxicol Environ Health 23171-182
Fisher GD and Kilgore WW 1988b Mercapturic acid excretion in rats following 13shydichloropropene inhalation exposure Fund Appl Toxicol 11 303-307
27
Fisher GD and Kilgore WW 1989 Pharmacokinetics of S-[3-chloroprop-2shyenyl]glutathione in rats following acute inhalation exposure to 13-dichloropropene Xenobiotica 19269-278
Fong HR and Maykoski R 1985 Air exposure monitoring of EHAP personnel during a Telone II soil translocation study in Fresno County CDFA Rpt HS 1299
Houtman BA 1992 Managing worker exposure 13-D in California
Houtman BA 1993 An evaluation of 13-dichloropropene worker exposure associated with Telone II soil fumigant loading application and reentry phase I ECL92095 (interim report)
Hutson DH Moss JA and Pickering BA 1971 The excretion and retention of components of the soil fumigant D-D and their metabolites in the rat Food Cosmet Toxicol 9 677-680
Johnson B 1994a Memorandum to John Sanders June 20 1994 on buffer zone calculations for 13-D in Kern County Environmental Monitoring and Pest Management Branch Department of Pesticide Regulation Sacramento CA
Johnson B 1994b Memorandum to Kean Goh May 16 1994 on estimated adjusted air concentration percentiles based on Dow simulation results for T29R26 Environmental Monitoring and Pest Management Branch Department of Pesticide Regulation Sacramento CA
Maddy KT Cusick B Richmond D 1980 Studies concerning the field application of Telone and DD in California in 1979 and the ambient air concentration of these pesticides during and following application by shank injection into soil in fields CDFA Rpt HS 686
Maddy KT Schneider F and Fredrickson S 1982 Monitoring of Telone II during and following experimental application by shank injection to established trees and grape vines in California in 1980-1981 CDFA Rpt 967
NIOSHOSHA Occupational Safety and Health Guidelines for Chemical Hazards 1988 DHHS (NIOSH) Publication No 81-1231981 and supplements Publication Nos 88-118 and 89-104
Osterloh JD Cohen BS Poppendorf W and Pond SM 1984 Urinary excretion of the N-cysteine conjugate of cis-13-dichloropropene by exposed individuals Arch Environ Health 39 271-275
Osterloh JD Wang R OConnell L Jacob III P and Maddy KT 1989a Pilot study for biological monitoring of 13-dichloropropene In Biological Monitoring of Pesticide Exposure RG Wang CA Franklin RC Honeycutt and JC Reinert (eds) Amer Chem Soc Soc Symp Ser No 382 215-230
Osterloh JD Wang R Schneider F and Maddy K 1989b Biological monitoring of dichloropropene Air concentrations urinary metabolite and renal enzyme excretion Arch Environ Health 44 207-213
Owen WJ and DeRouen TA 1980 Estimation of the mean for lognormal data containing zeroes and left-censored values with applications to the measurement of worker exposure to air contaminants Biometrics 36 707 719
28
Palisades Corporation 1992 RISK Risk analysis and simulation add-in for Microsoft Excel Release 11 users guide 31 Decker Rd Newfield NY 14867
Poppendorf W Leffingwell JT and Cohen B 1983 Development of methods and procedures for the assessment of occupational health risks in the application and use of nematicides in California CDFA Rpt HS 1162
Shapiro SS and Wilk MB 1965 An analysis for normality (complete samples) Biometrika 52 591-611
Stott WT and Kastl PE 1986 Inhalation pharmacokinetics of technical grade 13shydichloropropene Toxicol Appl Pharmacol 85 332-341
Stott WT 1992 Letter to J R Sanborn August 11 1992
Tobol HK and Axe FD 1982 Airborne concentrations of 13-dichloropropene during fumigation of established grapevines almond trees and peach trees California December 1980-January 1981 Unpublished report of the Dow Chemical Company Environmental ServicesIndustrial Hygiene Western Division Dow Chemical USA Report No HeRW-AG(8)
US EPA 1990 Exposure factors handbook EPA6008-89043 Office of Health and Environmental Assessment Washington DC
Van Welie RTH van Duyn P Brouwer DH van Hemmen JJ Brouwer EJ and Vermuelen NPE 1991 Inhalation exposure to 13-dichloropropene in the Dutch flower-bulb culture Part II Biological monitoring by measurement of urinary excretion of two mercapturic acid metabolites Arch Environ Contam Toxicol 206-12
Waechter JM Brazak KA McCarty LP LaPack MA and Brownson 1992 13shydichloropropene (Telone II Soil Fumigant) Inhalation pharmacokinetics and metabolism in human volunteers DowElanco (Interim Report) Laboratory Project Study ID M-002993-023
Wagner CP 1987 Industrial source complex (ISC) dispersion model users guide 2nd edition (revised) Vol I US Environmental Protection Agency Report No EPA-4054-88shy002 a
Wiley JA 1991a Study of childrens activity patterns Final report contract no A733-149 Research Division California Air Resources Board Sacramento CA
Wiley JA 1991b Activity patterns of California residents Final report contract no A6-177shy33 Research Division California Air Resources Board Sacramento CA
29
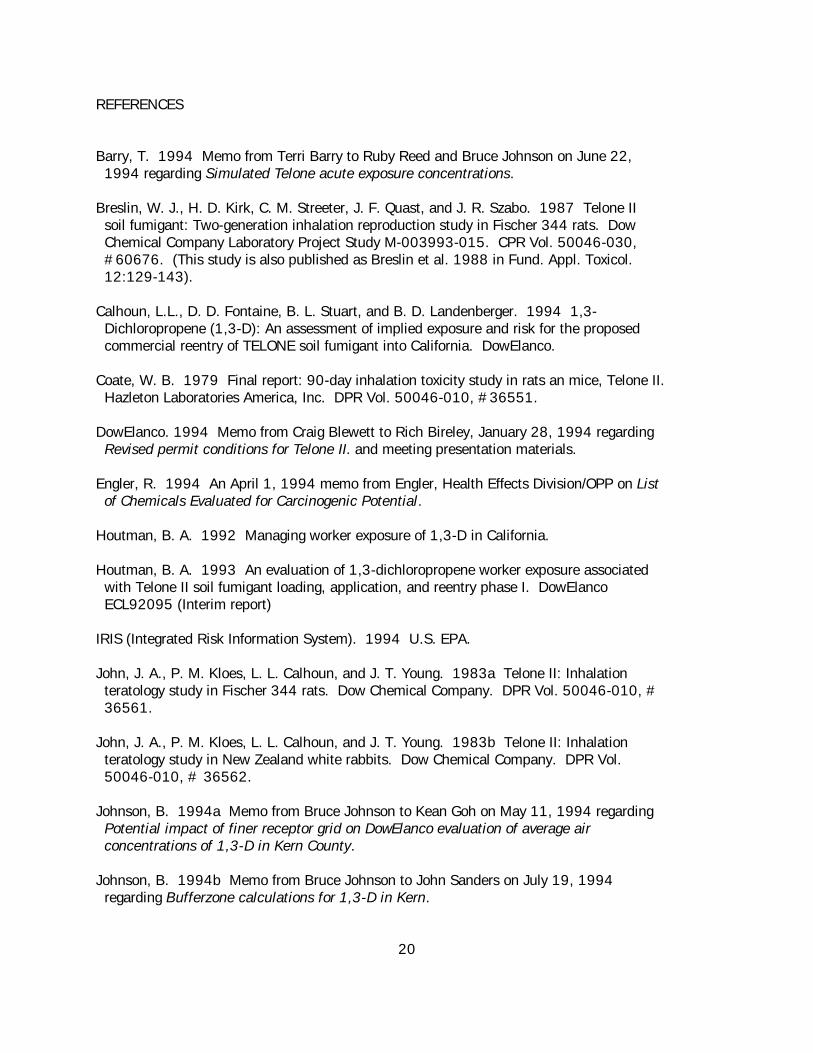
REFERENCES
Barry T 1994 Memo from Terri Barry to Ruby Reed and Bruce Johnson on June 22 1994 regarding Simulated Telone acute exposure concentrations
Breslin W J H D Kirk C M Streeter J F Quast and J R Szabo 1987 Telone II soil fumigant Two-generation inhalation reproduction study in Fischer 344 rats Dow Chemical Company Laboratory Project Study M-003993-015 CPR Vol 50046-030 60676 (This study is also published as Breslin et al 1988 in Fund Appl Toxicol 12129-143)
Calhoun LL D D Fontaine B L Stuart and B D Landenberger 1994 13- Dichloropropene (13-D) An assessment of implied exposure and risk for the proposed commercial reentry of TELONE soil fumigant into California DowElanco
Coate W B 1979 Final report 90-day inhalation toxicity study in rats an mice Telone II Hazleton Laboratories America Inc DPR Vol 50046-010 36551
DowElanco 1994 Memo from Craig Blewett to Rich Bireley January 28 1994 regarding Revised permit conditions for Telone II and meeting presentation materials
Engler R 1994 An April 1 1994 memo from Engler Health Effects DivisionOPP on List of Chemicals Evaluated for Carcinogenic Potential
Houtman B A 1992 Managing worker exposure of 13-D in California
Houtman B A 1993 An evaluation of 13-dichloropropene worker exposure associated with Telone II soil fumigant loading application and reentry phase I DowElanco ECL92095 (Interim report)
IRIS (Integrated Risk Information System) 1994 US EPA
John J A P M Kloes L L Calhoun and J T Young 1983a Telone II Inhalation teratology study in Fischer 344 rats Dow Chemical Company DPR Vol 50046-010 36561
John J A P M Kloes L L Calhoun and J T Young 1983b Telone II Inhalation teratology study in New Zealand white rabbits Dow Chemical Company DPR Vol 50046-010 36562
Johnson B 1994a Memo from Bruce Johnson to Kean Goh on May 11 1994 regarding Potential impact of finer receptor grid on DowElanco evaluation of average air concentrations of 13-D in Kern County
Johnson B 1994b Memo from Bruce Johnson to John Sanders on July 19 1994 regarding Bufferzone calculations for 13-D in Kern
20
Konishi Y A Kawabata A Denda T Ikeda H Katada H Maruyama and R Higashiguchi 1980 Forestomach tumors induced by orally administered epichlorohydrin in male Wistar rats GANN 71(6) 922-923
Lomax L G L L Calhoun W T Stott and L E Frauson 1987 Telone II soil fumigant 2-year inhalation chronic toxicity - oncogenicity study in rats Dow Chemical Company Laboratory Project Study ID M-003993-009R DPR Vol 50046-031 60677
Markovitz A and W H Crosby 1984 Chemical carcinogenesis A soil fumigant 13- dichloropropene as possible cause of hematologic malignancies Arch Intern Med 1441409-1411
McConnell E E H A Solleveld J A Swenberg and G A Boorman 1986 guidelines for combining neoplasms for evaluation of rodent carcinogenesis studies JNCI 76283-289
NAS (National Academy of Sciences) 1980 Chapter 4 Toxicity of Selected Drinking Water Contaminants in Drinking Water and Health Volume 3 Washington DC
NTP (National Toxicology Program) 1985 Toxicology and carcinogenesis studies of Telone II in F344N rats and B6C3F1 mice NTP Technical Report Series No 269 US Department of health and Human Services Public Health Service National Institutes of Health NIH Publication No 85-2525
Parker C M W B Coate and R W Voelker 1982 Subchronic inhalation toxicity of 13-dichloropropene12-dichloropropane (D-D) in mice and rats Jour Toxicol Environ Health 9899-910
Stott W T J T Young L L Calhoun and J E Battjes 1984 Telone II soil fumigant a 13-week inhalation study in rats and mice Dow Chemical Company DPR Vol 50046- 038 71713
Stott W T K A Johnson L L Calhoun S K Weiss and L E Frauson 1987 Telone II soil fumigant 2-year inhalation chronic toxicity - oncogenicity study in mice Dow Chemical Company Laboratory Project Study ID M-003993-009R DPR Vol 50046-029 60675
Streeter C M J E Battjes and L G Lomax 1987 Telone II soil fumigant An acute vapor inhalation study in Fischer 344 rats Dow Chemical Company HETM-003993-018 DPR Vol 50046-032 62070
US EPA 1989 Exposure factors handbook Office of Health and Environmental Assessment US EPA Report No EPA6008-89043 WashingtonDC
Van Duuren B L B M Goldschmidt G Loewengart A C Smith S Melchionne I Seidman and D Roth 1979 Carcinogenicity of halogenated olefinic and aliphatic hydrocarbons in mice JNCI 631433-1439
21
Waechter J M Waechter K A Brzak L P McCarty M A LaPack and P J Brownson 1992 13-Dichloropropene (Telone II soil fumigant) Inhalation pharmacokinetics and metabolism in human volunteers DowElanco
22
Appendix A
SUMMARY OF TOXICOLOGY DATA
TELONE II (13-dichloropropene)
________________________________________________________________________
CALIFORNIA ENVIRONMENTAL PROTECTION AGENCY DEPARTMENT OF PESTICIDE REGULATION
MEDICAL TOXICOLOGY BRANCH
SUMMARY OF TOXICOLOGY DATA
TELONE II (13-dichloropropene)
Chemical Code 000573 Tolerance 50046 SB 950 137
August 18 1986 Revised 41687 71888 52389 42790 6190 61594 81094
I DATA GAP STATUS
Combined (onco + chronic) rat No data gap possible adverse chronic effects
Chronic dog No data gap possible adverse effect
Onco mouse No data gap possible adverse effects
Repro rat No data gap no adverse effects
Terato rat No data gap no adverse effects
Terato rabbit No data gap no adverse effects
Gene mutation No data gap possible adverse effect
Chromosome No data gap no adverse effect
DNA damage No data gap possible adverse effect
Neurotox Not required at this time
Note Toxicology one-liners are attached All record numbers through 117410 in 061 were examined indicates an acceptable study Bold face indicates a possible adverse effect Original Summary prepared by F Martz revised April 16 1987 July 18 1988 May 23 1989 April 27 1990 June 1 1990 June 15 1994 and August 10 1994 by J Gee Filename T940810 See also Guidance for the Reregistration of Pesticide Products (Reregistration Standard) Containing 13-Dichloropropene (Telone II) as the Active Ingredient US EPA 91886 CDFA Record 050620 The position of EPA (1986) was that if significant residues were found oral studies would be required in addition to the inhalation studies Gee 52389
DPR MEDICAL TOXICOLOGY TELONE II (13-DICHLOROPROPENE) TOX SUMMARY T940810 Page 2
II TOXICOLOGY ONE-LINERS AND CONCLUSIONS
These pages contain summaries only Individual worksheets may contain additional effects
ONCOGENICITYCARCINOGENICITY COMBINED RAT
010 036552 Toxicology and Carcinogenesis Studies of Telone II in F344N Rats and B6C3F1 Mice (NTP Frederick Cancer Research Center 585) Rats F344 strain Telone II (13-dichloropropene 875 pure) with epichlorohydrin as stabilizer 50 25 or 0 mgkg by oral gavage 3 times a week 52sexgroup with an additional 28sexgroup (3 as substitutes) in satellite groups with sacrifices at 9 16 21 24 and 27 months of 5sexgroup Study scientifically valid but UNACCEPTABLE and not upgradeable due to guideline deviations ONCO effects with NO NOEL forestomach cancer at 50 mgkg liver cancer in males at 25 and 50 mgkg trend for thyroid cancer in females mammary cancer in females at 50 mgkg with trend at 25 mgkg stomach epithelial hyperplasia at 25 and 50 mgkg (Reviewed 11686 by Martz)
031 005 060677 036218 Telone II Soil Fumigant 2-Year Inhalation 0hronic Toxicity-Oncogenicity Study in Rats (Dow Chemical Midland MI 71387 M-003993-009R) 13-Dichloropropene 921 (cis 495 and trans 426) 12-dichloropropane 07 13-dichloropropane 18 1-chlorohexane 11 with remaining 43 a mixture of isomers of chlorohexane chlorohexene and trichloropropene stabilized with soybean oil 70sexgroup exposed by inhalation 6 hoursday 5 daysweek for 2 years - whole body exposure - at 0 5 20 or 60 ppm nominal 10sexgroup sacrificed at 6 and at 12 months (interim report 036218) NOEL = 20 ppm (decreased weight gain changes in nasal tissues in males and females) no evidence of an oncogenic effect reported ACCEPTABLE with a possible adverse chronic effect (Gee 71188)
005 036218 Dow 985 (1 year interim report - see above) F344 strain exposure conditions identical to those of mouse study listed below (36219) UNREMARKABLE at 1 year nasal changes noted in mice not reproduced in rats no effects except slight weight-gain inhibition in high dose group (Martz 11386)
010 36551 90-day Inhalation Toxicity Study in Rats and Mice Telone II (Hazleton Laboratories 51579 Project No 174-127) Fischer 344 rats 10sexdose were exposed to 0 10 30 or 90 ppm nominal (actual - 0 1198 3214 and 9302 ppm) 6 hours per day 5 daywk for 13 weeks terminal body weights were significantly reduced (8-11) in the high dose male and female rats dose-related alterations of the nasal epithelium were observed in high dose of both sexes (1010 and 1010)and in mid-dose females (910) as reported in the Addendum to the Final Report dated 7979 giving a NOEL = 10 ppm in female rats and 30 ppm in males UNACCEPTABLE (deficiencies include no hematology no serum chemistry performed not all required tissues were examined histologically in control and high dose groups) not upgradeable Initially reviewed by Martz 42986 re-reviewed by C Lewis 7689 and updated by J Gee 61594 No worksheets
038 071713 Telone II Soil Fumigant A 13-Week Inhalation Study in Rats and Mice (Dow 113084) Telone II 909 lot WP-82-1111-56 given by inhalation 6 hrday 5 dayweek 10 Fischer 344 rats per sex exposed
DPR MEDICAL TOXICOLOGY TELONE II (13-DICHLOROPROPENE) TOX SUMMARY T940810 Page 3
to 0 10 30 90 or 150 ppm nominal 13-week exposure only findings were degeneration in the olfactory epithelium and hyperplasia of the respiratory epithelium in both sexes especially at 90 and 150 ppm body weight gains were significantly lower at 90 and 150 ppm NOEL = 10 ppm based on hyperplasia in 210 males at 30 ppm Supplementary data (Gee 52289)
CHRONIC DOG
50046-061 117410 Stott WT Stebbins KE Haut KT Quast JF and Shabrang SN TeloneII soil fumigant One-year dietary toxicity study in beagle dogs The Dow Chemical Co Midland Study ID M-003993-024 72292 Dogs were fed diets containing microencapsulated TeloneII at 0 05 25 or 15 mgkgday for 1 year NOEL = 25 mgkgday [hematology profile typical of hypochromic microcytic anemia related to increased hematopoiesis in bone marrow and extramedullary hematopoiesis in spleen in both sexes] Clinical signs in 2 high dose males of pale skinmucous membranes apparently reflected the anemia Body weights were depressed and relative liver weights were increased in both sexes at 15 mgkgday The relatively low NOEL for signs of anemia constitutes a possible adverse effect Acceptable Aldous 111593
046 075537 Telone II 13-Week Dietary Toxicity Study in Beagle Dogs Quast J F Dow Chemical Company August 1 1989 The 3-page letter was submitted as an adverse effects disclosure for microcytic hypochromic anemia in the 13-week study in beagle dogs Doses were 0 130 380 or 1000 ppm with Telone II incorporated in a starch sucrose matrix and administered in the dog chow The letter contains no data but states the anemia was dose-related Some dogs were being maintained after dosing for further study The final report has not yet been received by CDFA (Gee 42790)
Document 50046-043 contains a protocol (dated 41289) for a 13-week study with beagle dogs Title Telone II 13-Week Dietary Toxicity Study in Beagle Dogs Record 073875 The purpose was to evaluate the affects of dietary exposure of non-rodents to doses of 0 130 380 or 1000 ppm in the diet prepared with 13-dichloropropene formulated by microencapsulation in a starchsucrose matrix The document summarized several studies on dosing of dogs by several routes A cover letter dated April 27 1989 from the registrant still questioned the need for a chronic study (Gee 52389)
025 050620 The EPA Registration Standard dated September 18 1986 indicates that the requirement for a chronic feeding study in nonrodent species namely dog is dependent on the outcome of residue tests If residues are found in foodfeed commodities chronic feeding studies in rat and dog may be required Residue data for crop field trials are due in March 1989 Requirements for residues in foodfeed etc are reserved (Gee 41687) See 061 117410 for the full study (Gee 61594)
ONCOGENICITY MOUSE
007 28361 28362 and 28363 Parts of published report on three different exposure scenarios See 010 036554 for complete copy of the publication in J National Cancer Institute 63 (6) 1433-1439 (1979)
010 036553 Toxicology and Carcinogenesis Studies of Telone II in F344N Rats and B6C3F1 Mice (NTP Frederick Cancer Research Center 585) Mice B6C3F1 strain Telone II (875 13-dichloropropene) 100 50 or 0 mgkgday
DPR MEDICAL TOXICOLOGY TELONE II (13-DICHLOROPROPENE) TOX SUMMARY T940810 Page 4
by oral gavage 3 times a week 50sexgroup UNACCEPTABLE and not upgradeable due to guideline deviations but scientifically valid for female data ONCO effects with NO NOEL in females cancer of urinary bladder at 100 and 50 mgkg forestomach and lung at 100 mgkg results in males inconclusive due to inadequate randomization and poor control group survival (Martz 11786)
010 036554 Carcinogenicity of Halogenated Olefinic and Aliphatic hydrocarbons in Mice (Van Duuren B L et al NYU Med Ctr JNCI 63 1433-1439 1979) HaICR Swiss strain cis-13-dichloropropene (Chemical Samples Co Columbus OH) 122 mgmouse or 41 mgmouse by dermal application 3week for about 77 weeks initially reviewed as having caused no local or distant tumors UNACCEPTABLE and not upgradeable Reviewed 6385 by AAspostolou peer review 220 and 81886 by Martz Re-review as part of the risk assessment process noted that the incidence of lung tumors in both groups of treated mice was statistically significant by Fishers Exact Test although not so noted in the publication table The incidences were 30100 for controls and 1930 and 1730 at low and high doses respectively Remains UNACCEPTABLE but with a possible adverse effect (Gee 53190)
010 036554 Carcinogenicity of Halogenated Olefinic and Aliphatic Hydrocarbons in Mice (NYU Med Ctr JNCI 63 1433-1439 1979) HaICR Swiss strain cis-13-dichloropropene (Chemical Samples Co Columbus OH) 3 mgmouse once weekly x 77 weeks by subcutaneous injection examined injection site and liver only fibrosarcoma at injection site 630 vs 030 vehicle control probably due to irritation by physical-chemical properties of AI Otherwise insufficient for assessment UNACCEPTABLE and not upgradeable (AA 6385 Martz 220 and 81886)
010 036554 Carcinogenicity of Halogenated Olefinic and Aliphatic Hydrocarbons in Mice (NYU Med Ctr JNCI 63 1433-1439 1979) HaICR Swiss strain cis-13-dichloropropene (Chemical Samples Co Columbus OH) 122 mgmouse by dermal application once followed by promotion with 5 mg phorbol myristate acetate dermally 3week for about 77 weeks no tumors UNACCEPTABLE and not upgradeable (Reviewed 6385 by AA peer review 220 and 81886 by Martz)
029 006 060675 036219 Telone II Soil Fumigant 2-Year Inhalation Chronic Toxicity-Oncogenicity Study in Mice (Dow 71387 M-003993-009)
13-Dichloropropene 921 (cis 495 and trans 426) plus 12-dichloropropane 07 13-dichloropropane 18 1-chlorohexane 11 and the remainder a mixture of isomers of chlorohexane chlorohexene and trichloropropene lot TB831213-4 given by inhalation at 0 5 20 or 60 ppm nominal uncorrected for 92 purity 6 hoursday 5 daysweek for 2 years 70sexgroup with intermediate sacrifices of 10sexgroup at 6 months and at 12 months (interim report 036219 in 006) daily analytical data for 13-dichloropropene concentration Hyperplasia of the urinary bladder mucosa was found in females at 20 and 60 ppm and in males at 60 ppm with a trend at 20 ppm Increase in benign lung bronchioloalveolar adenomas in males at 60 ppm Degeneration of the olfactory epithelium and hyperplasia of the respiratory epithelium bilateral at 60 ppm in both sexes Decreased liver vacuolation in females at 60 ppm NOEL = 5 ppm ACCEPTABLE with possible adverse effects (Gee 71288)
DPR MEDICAL TOXICOLOGY TELONE II (13-DICHLOROPROPENE) TOX SUMMARY T940810 Page 5
006 036219 Dow 985 (1 year interim report B6C3F1 strain Telone II (lot TB831213-4) 60 20 5 or 0 ppm 6 hoursday x 5 daysweek x 6 or 12 months NO TUMORS slight focal hyperplasia and hypertrophy of epithelium of nasal turbinates at 20 ppm in males and at 60 ppm and in both sexes liver glycogen and kidney lipid decrease in males at 60 ppm (decreased organ weights and vacuolation) urinary bladder hyperplasia of transitional epithelium in females at 60 ppm possible adverse effects NOEL = 5 ppm (Martz 11486)
SUBCHRONIC
10 036551 90-Day Inhalation toxicity Study in Rats and Mice (Hazleton (VA) 579) CD-1 strain Telone II purity unspecified 90 30 10 or 0 ppm 6 hoursday x 5 daysweek x 13 weeks (65 exposures) Unacceptable and not upgradeable - was intended as range finder for future study EFFECTS In 90 ppm females - epithelium of dorsal nasal septum and turbinates - decreased cytoplasm and single cell necrosis slight weight gain reduction 90 ppm NOEL = 30 ppm (Martz 42986) In addition alterations in nasal epithelium were noted in high-dose female mice but not in male mice NOEL = 30 ppm in females and 90 ppm in males Revised by Gee 61594
038 071713 Telone II Soil Fumigant A 13-Week Inhalation Study in Rats and Mice (Dow 113084) Telone II 909 lot WP-82-1111-56 given by inhalation 6 hrday 5 dayweek 10 B6C3F1 mice per sex exposed to 0 10 30 90 or 150 ppm nominal 13-week exposure findings were degeneration in the olfactory epithelium and hyperplasia of the respiratory epithelium in both sexes especially at 90 and 150 ppm body weight gains were significantly lower at 90 and 150 ppm females in 90 and 150 ppm showed effects in the epithelial cells of the urinary bladder NOEL = 30 ppm Supplementary data (Gee 52289)
REPRODUCTION AND FERTILITY
010 036555 D-D A 10 Week Inhalation Study of Mating Behavior in Male and Female Rats (Shell (UK) 480) Wistar strain technical D-D (epi-chlorohydrin free) 537 13-dichloropropene remaining constituents mainly chlorinated isomersanalogs 96 32 14 or 0 ppm for 6 hoursday x 5 daysweek treated males mated with naive females after 2 4 7 and 10 weeks exposure treated females mated with naive males after 10 weeks exposure hematology serum chemistry urinalysis and histopathology on satellite animals 30 males and 24 females per group with 20 and 15 respectively for reproduction performance and the remainder for hematology etc UNACCEPTABLE and not upgradeable only 1 generation and inadequate group sizes Otherwise appears to be a well conducted and documented study with scientifically valid results NO reproductive effects Liver and kidney weight elevation at 96 ppm reversible upon withdrawal except female kidney values (Martz 2086)
030 060676 Telone II Soil Fumigant Two-Generation Inhalation Reproduction Study in Fischer 344 Rats (Dow Chemical 71387 M-003993-015) 13-Dichloropropene 912 lot TB831213-4 exposures of 0 5 20 or 60 ppm for 7 days increased to 0 10 30 or 90 ppm on day 8 6 hoursday 5 daysweek two generations two litters each 30sexgroup maternal animals removed from chamber after gestation day 20 until day 4 postpartum when separated from pups for the 6 hours exposure parental NOEL =
DPR MEDICAL TOXICOLOGY TELONE II (13-DICHLOROPROPENE) TOX SUMMARY T940810 Page 6
30 (decreased weight gain nasal tissue changes at 90 ppm) reproduction NOEL gt 90 ppm (no adverse effect on reproduction parameters) ACCEPTABLE (Gee 71388)
TERATOLOGY RAT
010 036561 Telone II Inhalation Teratology Study in Fischer 344 Rats and New Zealand White Rabbits (Dow 1083) F344 strain Telone II (13-dichloropropene 901 pure) 120 60 20 or 0 ppm via inhalation 30group Study and report ACCEPTABLE NO developmental effects (NOEL = 120 ppm for malformationsdevelopmental effects) maternal NOEL lt 20 ppm (reduced maternal weight gain at all 3 treatment levels) (Martz 22186)
TERATOLOGY RABBIT
010 036562 Telone II Inhalation Teratology Study in Fischer 344 Rats and New Zealand White Rabbits (Dow 1083) New Zealand White Telone II (13-dichloropropene 901 pure) 120 60 20 or 0 ppm via inhalation 17 - 24 pregnant rabbits per group Study OK but report incomplete reviewed as upgradeable with submission of historical control data 22186 The historical control data are in 50619 Document 50046-025 The study has been rereviewed as ACCEPTABLE 32687 NO developmental effects (NOEL = 120 ppm for malformations) NOEL = 20 ppm for reduced maternal weight gain (Martz 22186 and 32687)
GENETIC TOXICOLOGY
GENE MUTATION
016 004282 amp 004293 Mutagenicity of 13-Dichloropropene using Ames Testing (Schering AG summary report 982) Formulated mixtures containing 13-dichloropropene in addition to various other constituents were tested for mutagenic activity in the Ames Salmonella Test Results were conflicting and insufficient for independent assessment UNACCEPTABLE but upgradeable upon submission of complete report(s) Summary contains statement that positive effects were seen with TA1535 and TA100 but no data Report contains a statement that the methyl isothiocyanate in the sample tested caused cytotoxicity before the mutagenic effect was detectable No data (Reviewed 6385 BY AA peer review 81886 by Martz and 71888 by Gee)
010 036556 Mutagenicity of 13-Dichloropropene in Bacteria Test System (Nomura Sogo Res Inst 1278) E coli strain Br Wp 2 Try- 498-cis and 463-trans 13-dichloropropene 5000 2500 1000 500 250 100 25 or 0 microgplate +S9 Unacceptable and not upgradeable due to design deficiencies No mutagenic effects reported (Gee 22486)
010 036558 Mutagenicity of 13-Dichloropropene in Bacteria Test System (Nomura Sogo Res Inst 1278) Five Salmonella strains for plate assay 498-cis and 463-trans 13-dichloropropene 0-5000 microgplate + S9 G46 for host-mediated assay in ICR mice at 30 or 60 mgkg x 3 times3 hours UNACCEPTABLE and not upgradeable single plates Significant Positive response in several strains indicative of base-pair substitution negative in host-mediated assay (Gee 22486)
DPR MEDICAL TOXICOLOGY TELONE II (13-DICHLOROPROPENE) TOX SUMMARY T940810 Page 7
019 042945 The Evaluation of Telone II Soil Fumigant in the CHO CellHGPRT Forward Mutation Assay (Dow 22786) CHOHGPRT assay Telone II (489 cis and 432 trans 13-dichloropropene) 250 200 150 100 50 or 0 mM without S9 (3 trials) and 200 150 125 100 50 or 0 microM with S9 (1 trial) Report complete and study ACCEPTABLE NO evidence of mutagenicity (Gee 72486)
No record number Chemical Mutagenesis Testing in Drosophila III Results of 48 Coded Compounds Tested for the National Toxicology Program (Valencia R et al Environmental Mutagenesis 7 325 - 348 (1985)) 13-Dichloropropene technical 955 was tested with male Canton-S wild-type stock by feeding at 5570 ppm for 72 hours from soaked filter paper The males were mated to Basc females for 3 2 and 2 days No more than 40 females per parental male were mated from each brood A total of 6584 tests were performed The percent lethals were 012 for control broods and 030 for treated broods - considered positive by the authors The translocation test was negative No worksheet [Review done in connection with the risk assessment] (Gee 53190)
Summary Although the test in mammalian cells was negative there appear to be several studies with Salmonella giving positive results although none of those on file are acceptable The positive effect reported in 036558 was quite significant The possible adverse effect for gene mutation therefore stands at this time One problem is the volatility of the test material and care must be taken to control samples for this property From the text of the study with CHO the flasks were tightly capped and loss of test material should not have been a factor (Gee 71888)
CHROMOSOMES
010 036560 Evaluation of Telone II Soil Fumigant in the Mouse Bone Marrow Micronucleus Test (Dow 585) Telone II (495-cis and 426-trans 13-dichloropropene) 380 115 38 or 0 mgkg by oral gavage in CD-1 mice 5sexgroup 24 or 48 hour sac Reviewed 22586 as incomplete but upgradeable with justification of the use of only two sacrifice times This has been submitted as Record 55630 in 50046-025 based on excretion of 93 within 48 hours The study is now reviewed as ACCEPTABLE NO increase in MN-PCEs reported (Gee 22586 and 41687)
Note The reregistration standard of 1986 indicates that EPA is requiring additional testing for chromosomal effects notably in vivo testing of bone marrow in rats
DNAOTHER
010 036557 Mutagenicity Test on 13-Dichloropropene in Bacteria Test System (Nomura Sogo Res Inst 1278) Bacillus subtilis rec assay strains H17 and M45 498 cis- and 463 trans-13-dichloropropene 1250 500 125 50 or 0 microgwell without activation UNACCEPTABLE and not upgradeable due to design deficiencies Slight growth differences at highest level Reviewed 22486 by Gee
010 036559 Evaluation of Telone II in the Rat Hepatocyte Unscheduled DNA Synthesis Assay (Dow 485) UDS in rat hepatocytes Telone II (495 cis and 426 trans-13-dichloropropene) 1x10⁻⁷ to 3x10⁻³ M concentration
DPR MEDICAL TOXICOLOGY TELONE II (13-DICHLOROPROPENE) TOX SUMMARY T940810 Page 8
(solubility limit) plus control Report complete and study ACCEPTABLE NO evidence of UDS even when cytotoxicity was noted (Gee 22486)
Summary These two tests measure different endpoints so no one conclusion can be reached and a possible adverse genotoxic effect is noted Gee 71888
Note The reregistration standard of 1986 noted requirements for in vitroin vivo primary hepatocyte UDS testing both in vitro and in vivo exposure shyspecies not specified Record 036559 is not cited (Gee 52389)
Note In addition to the studies formally submitted by the registrant publications in the open literature have been reviewed (no worksheets) The conclusion is that exposure to telone was genotoxic in multiple tests with multiple endpoints The registrant has presented the position that the effects in early studies were due to mutagenic impurities and to the stabilizer The stabilizer has been changed in recent products In the absence of additional studies however which clearly demonstrate negative results the overall weight-of-evidence indicates that telone is mutagenic in both prokaryotes and eukaryotes (Gee 81094)
NEUROTOXICITY
Not required at this time
GENERAL INFORMATION
007 932850 Communication to EPA from Dow dated 2982 contains risk assessment based on data from NTP rat and mouse studies ( 036552 amp 53) as well as published dermal studies ( 036554) and refers to oncogenic effects noted in the former (Martz 81886)
016 932849 932853 and 022757 Contain preliminary summary of NTP studies ( 036552 amp 53) summary of mutagenicity studies showing positive effects ( 036556-58) and summary of the one generation reproduction study with technical D-D ( 36555) respectively (Martz 81886)
APPENDIX B
EXPOSURE ASSESSMENT
Human Exposure Assessment for 13-dichloropropene
by
James R Sanborn Staff Toxicologist
Sally Powell Senior Environmental Research Scientist
HS 1634
May 26 1989 Revised July 20 1994
California Environmental Protection Agency Department of Pesticide Regulation Worker Health and Safety Branch
1020 N Street Sacramento California 95814
ABSTRACT
The soil fumigant 13-dichloropropene (13-D) is used to control soil parasitic nematodes and other soil pests in annual crops and some perennials before planting Metabolism and pharmacokinetic data on 13-D indicate facile conjugation as a mercapturate and renal elimination after inhalation The primary mode of exposure is inhalation with dermal absorption of the vapor considered unimportant Inadvertent exposure of humans during application equipment failure or repair has resulted in skin andor eye irritation Biological monitoring of workers demonstrated an estimated Absorbed Daily Dosage of 19 ugkgday (113 and 073 ugkgday for application and loading respectively) when adjusted for respiratory protection worn during the entire fumigation cycle These adjusted numbers are reflective of practices to be implemented in California should 13-D be reinstated including spill control dry disconnects and vapor recovery measures Non-occupational inhalation exposure for residents of a Telone reinstatement area was estimated by stochastic simulation Estimated 95th percentile Lifetime Average Daily Dosages ranged from 0167 ugkgday for residents living 500 m from treated fields for 30 years to 0373 ugkgday for residents living 100 m from fields for 70 years Estimated 95th percentile 62-day Average Daily Dosages ranged from 0674 ugkgday for infants living 500 m from treated fields to 6272 ugkgday for young children living 100 m from fields This report was prepared as Appendix B to the Departments risk assessment document for 13-D The necessity for this risk document stemmed from the identification of adverse effects in acute and chronic studies as well as characterization of 13-D as an oncogen in rat chronic feeding and mouse inhalation studies
APPENDIX B
CALIFORNIA ENVIRONMENTAL PROTECTION AGENCY DEPARTMENT OF PESTICIDE REGULATION WORKER HEALTH AND SAFETY BRANCH
HUMAN EXPOSURE ASSESSMENT
13-DICHLOROPROPENE
May 261989 Revised July 20 1994
INTRODUCTION
The fumigant 13-dichloropropene (13-D) (CAS 542-75-6 molecular formula C3H4Cl2) is a liquid used as a soil treatment for the control of plant parasitic nematodes and other soil pests The physical properties of 13-D are listed below
Boiling point 108oC (Composite of cistrans isomers higher BP 1120oC lower BP 1043oC) Vapor pressure 273 mm at 25oC Density 12 gml at 25oC Water solubility 2180 ppm (cis-) 2320 ppm (trans-) Octanolwater partition coefficient 104 Cis-trans- ratio 11
EPA STATUS
A Registration Standard was issued in September 1986 for 13-D which includes exposure and risk assessments for workers handling 13-D These assessments assume that inhalation is the primary route of exposure and that dermal exposure may only contribute during episodes of equipment repair or failure Respirators chemically resistant clothing and gloves are required during mixing and loading
USAGE
13-D is manufactured by Dow Chemical Co as a formulation containing 94 active ingredient (11 cis-trans- isomer ratio) and 6 inert ingredients Commercial 13-D is sold under the name Telone IItrade and contains 95 lbs ai per gallon 13-D is registered for use on more than 120 crops and ornamentals It is used for preplant soil treatments for vegetable crops field crops deciduous fruit trees nut trees and vines It is recommended that soils where annual crops are grown be treated each year before planting Over 15 million pounds were reported sold in California in 1987 (California Department of Food and Agriculture 1988) Application rates of 13-D depend on crop and soil type and range from 43 to 970 lbs aiacre The soil surface is sealed by covering or rolling after application to increase efficacy by reduction of vapor loss Application equipment injects 13-D to a depth of at least 12 inches below the sealed soil surface
LABEL PRECAUTIONS
The label for Telone II contains the signal word WARNING and the following precautionary statements
PRECAUTIONARY STATEMENTS
HAZARDOUS TO HUMANS AND DOMESTIC ANIMALS HAZARDOUS LIQUID AND VAPOR
o MAY CAUSE ALLERGIC SKIN REACTION o MAY BE FATAL IF INHALED ABSORBED THROUGH SKIN OR SWALLOWED o CAUSES SEVERE EYE DAMAGE o CAUSES BURNS OF SKIN o MAY CAUSE LUNG LIVER AND KIDNEY DAMAGE AND RESPIRATORY SYSTEM UPON
PROLONGED CONTACT o Do not breathe vapor o Do not get in eyes on skin on clothing o Do not take internally o Use only with adequate ventilation o Wear eye and skin protection necessary to prevent contact when handling TELONE II o Wash thoroughly with soap and water after handling and before eating or smoking o If protective gear such as boots or gloves becomes contaminated immediately wash with
soap and water Never wear protective gear having the odor of 13-dichloropropene Aerate and wash all protective gear thoroughly after each use until odor is gone
o Render unusable and dispose of contaminated leather goods including shoes o Do not apply this product in such a manner as to directly or through drift expose workers or
other personnel The area being treated must be vacated by unprotected persons
California regulations and permit conditions Additional requirements
California regulations require respiratory protection when inhalation exposure potential is high (eg during loading and equipment repair) Eye and skin protection (gloves and chemical resistant clothing) are required when handling Telone II
The California permit conditions will require additional protective equipment Loaders will be required to wear full-face respirators Applicators must either wear a half-face respirator or be inside a charcoal-filtered cab during application Workers re-entering a treated area during the first 7 days post application will be required to wear a one-half face respirator
3
___________________________________________________________________________
___________________________________________________________________________
WORKER ILLNESS
Table 1 shows that from 1982-1990 there were 55 illnesses that were related to exposure to 13-D In terms of type of illness they were almost equally divided between systemic (16) eye (14) and skin (18) With respect to the causality most of the illnesses were classified as definite (33) followed by probable (9) and possible
Table 1 13-dichloropropene illnesses in California (1982-1990)
Year Type Causality
Systemic Eye Skin EyeSkin Definite Probable Possible
1982 4 2 1 0 1 2 4 1983 2 3 1 0 5 1 0 1984 1 3 2 0 4 1 1 1985 0 2 3 0 4 1 0 1986 1 0 2 1 1 2 1 1987 1 0 0 0 1 0 0 1988 1 2 7 0 6 2 2 1989 1 2 1 2 5 0 1 1990 5 0 1 0 6 0 0
METABOLISMPHARMACOKINETICS
ANIMAL STUDIES
Inhalation
Rats exposed nose-only to 30 90 300 or 900 ppm of 13-dichloropropene (cis- 493 transshy428) for three hours absorbed 14 29 85 and 171 mgkg respectively or 82 65 66 62 percent respectively of the exposure dose (Stott and Kastl 1986) Decreases in percent absorbed as the exposure concentration increases are apparently related to the decreased ventilation frequency at higher exposure levels Tissue distribution of inhaled vapors indicated the lungs contained approximately 50 percent of the total inhaled vapors and the nasal passages contained an additional 10-16 percent Depuration of 13-D in the blood was biphasic with the initial half-life estimated to be 3-6 minutes and the terminal half-life 30-40 minutes Levels of protein sulfhydryl amino acids were reduced but no reduction in pulmonary sulfhydryl amino acids was observed Similar results for rats were reported for tissue distribution and glutathione depletion after a one-hour exposure (Fisher and Kilgore 1988a)
The characterization of the primary urinary metabolite from rats after inhalation was accomplished by Fisher and Kilgore (1988b) who found a mercapturate after a one hour exposure to 13-D at 40 107 284 398 or 789 ppm The excretion of the conjugate was nearly linear with respect to 13-D exposure up to 400 ppm Above 400 ppm the excretion of the mercapturate declined relative to this initial linearity This may have been due to decreased ventilation frequency in rats exposed three hours to doses greater than 90 ppm as reported by Stott and Kastl (1986) Alternatively it may have been due to depletion of conjugable glutathione
4
Oral dosing
Several investigators have examined the metabolic fate of 13-D in animals after an oral dose Hutson et al (1971) reported that 81 of 10-mg doses of cis-13-D and 57 of 10-mg doses of trans-13-D were eliminated in the urine Dietz et al (1984 ab) reported 50-80 percent renal elimination and 14-17 percent elimination as CO2 in rats or mice treated with 13-D No evidence of saturation of metabolic pathways was observed up to 50 mgkg in these later studies Urinary elimination of 14C-equivalents was estimated to have a half-life of approximately 55 hours
The primary metabolite in urine of rodents dosed orally with 13-D is N-acetyl-S-(3-chloropropshy2-enyl) cysteine (DCPMER) and its sulfoxide This indicates that 13-D is metabolized and conjugated via a glutathione pathway in rodents The formation of this metabolite is consistent with the loss of non-protein sulfhydryl levels in the liver and stomach after per os doses with 13-D (Dietz et al 1984 Climie et al 1979)
HUMANS
Inhalation
In workers exposed to 13-D during loading and application Osterloh et al (1984 1989) Brouwer et al (1991) and van Welie et al (1991) observed DCPMER as a urinary metabolite The common urinary metabolite in rodents and humans indicates that these species metabolize 13-D by similar metabolic pathways
A PBPK study was conducted by the registrant in which six humans were exposed to 13-D in an inhalation chamber at 1 ppm for 6 hours (Waechter et al 1992) Estimates of respiratory uptake made from analysis of exhaled breath during the exposure averaged 78 for the two isomers Urine was collected during and after exposure (84 hrs post exposure) Excretion of the cis- and trans-mercapturates was complete 36 hours post exposure The combined conversion of inhaled 13-D to the two mercapturates was found to be 24 (Stott 1992)
DERMAL ABSORPTION
The high vapor pressure of 13-D (273 mm) reduces its dermal absorption potential There is a single report in the literature concerning dermal absorption of 13-D and other low-boiling organic chemicals (Cohen and Poppendorf 1989) The experimental details are not complete as the paper reported the values from a thesis by the first author The values reported for dermal absorption of 13-D in rats in vivo were 062 and 15 for doses of 19 and 19 ugcm2 respectively This range of absorption values was found for exposed skin that was not occluded
5
___________________________________________________________________________
___________________________________________________________________________
___________________________________________________________________________
___________________________________________________________________________
WORKER EXPOSURE
Inhalation
Worker inhalation exposure assessed by breathing zone measurements during loading application or equipment repair are summarized in Table 2
Table 2 Breathing zone air concentrations of workers handling 13-dichloropropene during loading and application
ppm Reference Date
037a Davies and Fraser 1988 004-040 Tobol and Axe 1982b
038a Maddy et al 1980 071a Maddy et al 1982 017a Fong and Maykoski 1985 lt10a Albrecht 1987 lt02a Cook 1982b
a Time-weighted average b Cited by Davies and Fraser (1988)
These studies suggest that workers are exposed to time-weighted average levels that are below the recommended 1 ppm Permissible Exposure Limit set by the Occupational Safety and Health Administration
Since concentrations were measured in the workers breathing zones while they performed a variety of tasks (some loaded and some applied others loaded or applied and some unspecified) the reported inhalation exposure results from a composite of work tasks The individual studies did not always report exposures by task nor did they report any more than TWA values or monitoring results making it difficult to obtain an absorbed dose for each work task
Table 3 Potential inhalation exposure for 13-dichloropropene estimated from reported breathing zone concentrations assuming a respiratory rate of 29 Lmin
Study mg8-hr day
Poppendorf et al(1983) 1423 Maddy et al (1980) 240 Maddy et al(1982) 448 Fong and Maykoski(1985) 108 Davies and Fraser (1988) 233 Cook(1983) 126 Albrecht1987) 631
Geometric Mean 315
6
___________________________________________________________________________
___________________________________________________________________________
The air monitoring results of several studies have been converted to potential inhalation exposures in mg8-hr day by assuming a respiration rate of 29 Lmin (Table 3) The geometric mean of these data is reported because the data are log-normally distributed (Shapiro and Wilk 1965) It is conventional to treat exposure data by this statistical method as it allows the use of all the environmental or exposure data that may be widely variant (Owen and DeRouen 1980) If the mean for potential inhalation exposure from breathing zone measurements is mitigated by a respirator (90 reduction in exposure) corrected for respiratory uptake (78 Waechter et al 1992)) and a 70-kg person is assumed then the ADD (Absorbed Daily Dosage) is 351 ugkgday
Hand Exposure
The data available on potential hand exposure to 13-D are conflicting Maddy et al (1980 1982) reported hand a contamination level of 164 ughr for workers wearing gloves The other data on hand exposure (Table 4) were taken from the work of Davies and Fraser (1988) on an application of 13-D in Canada The range of the data for the eight individuals hand residues was 01-570 mghr with a geometric mean of 97 mghr
Table 4 Hand exposure to 13-dichloropropene during loadinga
Worker mghr
1 14 2 08 3 265 4 193 5 570 6 07 7 333 8 01
Geometric Mean 97
a Davies and Fraser (1988)
This exposure value for the hand of 97 mghr is almost 600-fold greater than that reported by Maddy (1982) The reasons for this large difference may be in the experimental design In the Davies and Fraser (1988) study the protocol was a cotton glove-polyethylene glove (1 mm)-cotton glove arrangement where the inner cotton gloves were analyzed for 13-D The inner glove provides an absorptive sink whereas the outer glove compared to the smooth protective glove normally worn provides a sponge for liquid 13-D for eventual penetration through the thin polyethylene glove This type of thin glove (polyethylene) is not normally utilized in application of this material as it would not withstand the physical abuse of daily operations during loading the fumigant into the tanks It is likely that in the studies of Maddy et al (1982) where hand residues were monitored under normal work conditions that thicker gloves were worn Further Maddy suggests that hand washes may not be an effective means for the removal of residues because some evaporation may have occurred as well as some dermal absorption Even so the analysis of hand washes in the work reported by Maddy et al reported microgram amounts of 13-D rather than the milligram amounts in the work of
7
_____________________________________________________________________
_____________________________________________________________________
Davies and Fraser While the Maddy data is very likely an underestimate of dermal exposure the dermal estimates of Davies and Fraser are overestimates due to the experimental design Since the hand exposure values are for 12 hrsday (estimated daily loading time) the dermal component becomes a minor contributor of the overall human exposure which is primarily via inhalation
Annual and Lifetime Exposure Days
Estimates of worker exposure time are provided by the US EPA Data Call-In for handlers of 13-D in crops grown in California that have been treated with 13-D (Houtman 1992) This survey provided information on the number days per year for each crop that 13-D was handled for applicators and loaders in California (Table 5 ) The maximum number of days per career was estimated to be 270 The number of days per career ranged from a low of 24 for potatoes to a high of 270 for brassica It is possible that the same individuals applying for brassica could be applying in vegetables which could mean that an individuals exposure days per year or career could be as high as the total for all crops However it is likely to be much less because the calendar window for application to each crop prevents any one person from working all of them
Table 5 Annual and lifetime handling days for loaders (L) applicators (A) and repairs (R)
Tomato Potato Cotton Vegetables Brassica Beets TreeVine LAR LAR LAR LAR LAR LAR LAR
Annual Custom 162334 444 403626 183524 363636 101010 2298
Grower 111 111 2213 353535 000 111 444
Lifetime Custom 104150221 242424 260234169 108210144 270270270 656565 1988172
Grower 454545 252525 99585 875875875 000 454545 121212
Biological Monitoring
Osterloh et al (1984 1989 a and b) reported human exposure studies with 22 workers loading and applying in which they conducted urinary monitoring for N-acetyl-S-(3-chloroprop-2shyenyl)cysteine (DCPMER) Respiratory protection (half-face) was worn only during loading and not during application An average of 34 mg of DCPMER was excreted in the 24-hour period after exposure Correction for the molecular weight difference between 13-D (111) and DCPMER (237) gives an ADD of 16 mgpersonday or 227 ugkgday Using the data of Davies and Fraser (1988) it is possible to calculate the percentage of the exposure received during application and loading In Davies and Fraser it was determined that 261 percent of the exposure occurred during application 739 during loading Osterloh et al assumed 90 protection from the half-face respirator worn during loading hence the inhaled dose was 01 times the exposure During application 10 (0 respiratory protection) indicates the absence of respirators The absorbed dose for each activity may be found by the following equation
8
Loading Application (739 )(X)(01) + (261)(X)(10) = 227 ugkgday (1)
where X is exposure Solving for X gives 678 ugkgday Putting this value back into equation (1) and adding respiratory protection (half-face respirators) during application gives
Loading Application (739)(678)(01) + (261 )(678)(01) = 68 ugkgday
The value of 68 ugkgday is the expected ADD if half-face respirators are worn during both loading and application
Houtman (1993) monitored five individuals loading or applying 13-D in Washington state The same individual did not do both tasks These applicators and loaders carried out one application per day at a rate of 25 galacre lasting about four hours One application was done without mitigation measures while the others used various mitigation measures specified by the US EPA including dry disconnects (with and without vapor recovery) spill control at the end of the rows and a cab with charcoal-filtered air Houtman collected urinary monitoring data only for the application conducted without mitigation measures To estimate the absorbed daily dose from these unmitigated conditions respiratory protection factors of 09 and 095 for half-face and full-face respirators were used for applicators and loaders respectively The human chamber PBPK exposure study data were used in the absorbed dose calculation These respiratory protection requirements for loaders and applicators were part of the Permit Conditions in California for the flux studies and the Monterey Commercial Use Project These same respiratory protection conditions will be required if 13-D is reinstated in California
The exposure data shown in Table 6 as geometric means have been normalized to an 68shyhour day which is consistent with the data of Davies and Fraser (1988) and allows comparison with the data of Osterloh et al where one person performed both loading and application
Houtman (1993) found that utilizing spill control during application reduced the ambient air concentrations by 79 The urinary metabolite data were adjusted by this factor The absorbed dose was adjusted for the wearing of a one-half face respirator from the unmitigated application in Washington The final adjustment of the data from Washington was the factoring of the reduced rate in California (12 galacre) as compared to the 25 galacre that were used in the studies in Washington The loader exposure data were not adjusted for the reduced rate in California as the exposure occurs primarily during the connecting and disconnection of the hose from the nurse tank and is unrelated to the amount placed in the tank on the tractor
With respect to the estimation of AADD and LADD the range of values for loading and applying were obtained from the crop specific data compiled in Table 5 There are several reasons for the reduced exposure of a combined (one person doing both tasks) load and apply (19 ugkgday) in the Washington study (Houtman 1993) as compared to the earlier combined estimate of Osterloh et al (68 ugkgday) Firstly for the loader the Washington study used dry disconnects and vapor recovery devices For the applicator spill control was used at the end of the rows Each of these mitigation strategies reduces ambient air concentration which resulted in lower estimated exposure value of more than three-fold It is further likely that the soil moisture content will be higher in California than occurred during the applications in Washington This will further reduce emissions
9
_____________________________________________________________________
_____________________________________________________________________
Table 6 ADD AADD and LADD values for loading and application of 13- dichloropropene
Study Task ADD1 Days SADD4 AADD5 Days LADD6
(ugkgd) Year (ugkgd) (ugkgd) Career (ugkgd)
Osterloh et al LoadApply 680
Houtman Load 0733 4 0016 0008 24 69x10-4
40 016 008 270 77x10-3
Apply 1133 4 36
0025 023
0012 011
24 270
11x10-3
12x10-2
Total2 186
1 Absorbed Daily Dosage two load and application cyclesday body weights of study volunteers used in calculations
2 One person doing both loading and applying-for comparison to studies of Osterloh et al 3 Normalized to 68 hrs based on registrant study (Davies and Fraser 1988) for one
person doing both tasks to be compared with Osterloh et al 4 Split application for brassica 90-day window (see Table 5) 5 Annual Average Daily Dosage (365 daysyear) 6 Lifetime Average Daily Dosage 70 years life (25550 days)
Exposure Appraisal
The exposure estimates based on the Houtman (1993) study in which exposures were measured separately for loading and application should be used for the assessment of risk These estimates are based on biological monitoring that assessed both cis- and transshymercapturate metabolites in the urine and utilized the pharmacokinetic information developed from exposure of humans under controlled conditions Hand exposure information developed by previous investigators was not used as this route of exposure would be reflected in the total exposure measured by the biological monitoring
None of the occupational exposure studies in which biological monitoring was conducted employed exactly the mitigation measures that would be required in California These requirements are for full-face respiratory protection during loading and half-face protection during application
NON-OCCUPATIONAL EXPOSURE
Inhalation exposure was estimated for residents of an area where Telone is used in carrot growing Both lifetime and subchronic (seasonal) exposures were estimated for residents of the area in general and for residents with homes at specified distances from Telone-treated fields (100 200 and 500 meters) The estimated lifetime exposure distributions are given in Tables 7 through 10 seasonal exposures in Tables 11 through 14
10
=
The exposure assessment relied on simulated air concentrations from a study provided by the registrant (Calhoun et al 1994) in which the ISCST simulation model (Wagner 1987) was used to predict concentrations of 13-D in air for a scenario of limited reintroduction of Telone IItrade soil fumigant in carrots In the use scenario modeled Telone is applied to 25 80-acre fields (2000 acres total) per year in a 9-township (324-square-mile) area in Kern County Under this scenario there is no other use of Telone All applications are at the rate of 12 gallons per acre and no field is treated more than once in three years Calhoun et al simulated three years of daily air concentrations for one point at the center of each section in the reintroduction area to produce an annual average daily concentration for each point The locations of treated fields were assigned randomly in their model so that concentrations at the section centers vary in part due to being different distances and directions from applications The modeled concentrations thus represent long-term ambient concentrations for the reintroduction area Calhoun et al presented separately the concentrations for the township of highest Telone use within the 9-township area These concentrations were used in the exposure assessment
Probability distributions of exposure were estimated using stochastic simulation (Monte Carlo) methods implemented with the program RISK (Palisades Corporation 1992) The distribution of lifetime average daily dose (LADD) as ug of 13-D inhaled per kg of body weight per day (ugkgday) was estimated separately for persons living 1) the first 30 years of and 2) all of a 70-year lifetime in the reintroduction area Seasonal exposure was estimated for July-August the period of greatest Telone use by adjusting the long-term air concentrations for proportional use and mass loss during that 62-day period Additional simulated air concentrations provided by the Environmental Monitoring Branch (Johnson 1994a) were incorporated to estimate both lifetime and 62-day exposures to residents whose dwellings are close to treated fields Exposure distributions were estimated separately for residents living 100 200 and 500 meters from the edges of treated fields Each estimated exposure distribution is based on a simulation with 10000 trials
LADD (ugkgday) was calculated by the following equation
10
([ ]) i 1
where the summation is over 10 age intervals RTi = number of years in age interval i that the person
resides in the Telone use area Conci = average of air concentrations (ugm3) in 5
locations weighted by the proportion of time spent in each location in interval i
BRi = average breathing rate (m3day) at each of 4 activity levels weighted by proportion of time spent at each level in interval i
BWi = body weight (kg) in interval i and 70 years is the assumed lifetime
LADD = RT Conci x BR BW 70i i i
11
Seasonal exposure (62-day average ugkgday) was calculated separately for each age interval as Conc x BR
Average daily dose = BW
where concentration breathing rate and body weight are as defined above for LADD but with air concentrations modified to approximate seasonal averages as explained in the next section
Concentration breathing rate and body weight were stochastic variables in the exposure simulation model The statistical distributions used to simulate them are described in the sections on specific input variables following Tables 7-14
12
___________________________________________________________________________
Table 7 Lifetime average daily dose (ugkgday) of 13-D inhaled by residents of an area where Telone is applied to a total of 25 80-acre fields each year
Residence Time
Birth to age 30 Birth to age 70 Male Female Male Female
Mean 00800 00783 01510 01436 Std Deviation 00480 00487 00867 00902
Percentile 5 0027 0026 0053 0047
10 0032 0031 0063 0056 25 0044 0042 0087 0078 50 0066 0063 0129 0116 75 0103 0101 0193 0186 90 0150 0148 0277 0270 95 0179 0179 0326 0330
975 --a -- -- -shy99 0230 0236 0425 0444
a not calculated
Table 8 Lifetime average daily dose (ugkgday) of 13-D inhaled by residents living 100 m from treated fields in an area where Telone is applied to a total of 25 80-acre fields each year
Residence Time
Birth to age 30 Birth to age 70 Male Female Male Female
Mean 01022 01001 01892 01829 Std Deviation 00514 00515 00926 00959
Percentile 5 0042 004 0078 0071
10 0048 0047 0091 0084 25 0063 0061 012 0111 50 009 0087 0168 0159 75 0129 0128 0238 0233 90 0176 0174 0319 0319 95 0204 0201 0373 0371
975 0228 0227 0416 0423 99 0262 0257 0481 0481
13
___________________________________________________________________________
Table 9 Lifetime average daily dose (ugkgday) of 13-D inhaled by residents living 200 m from treated fields in an area where Telone is applied to a total of 25 80-acre fields each year
Residence Time
Birth to age 30 Birth to age 70 Male Female Male Female
Mean 00996 00973 01846 0178 Std Deviation 00501 00499 00901 00932
Percentile 5 0039 0038 0073 0067
10 0046 0044 0087 008 25 0061 006 0116 0108 50 0088 0086 0165 0156 75 0127 0124 0234 0227 90 0171 0168 0311 0307 95 0199 0196 036 0363
975 0222 022 0408 0414 99 0253 0248 0458 0465
Table 10 Lifetime average daily dose (ugkgday) of 13-D inhaled by residents living 500 m from treated fields in an area where Telone is applied to a total of 25 80-acre fields each year
Residence Time
Birth to age 30 Birth to age 70 Male Female Male Female
Mean 0084 00818 01577 01498 Std Deviation 00423 00419 00772 00781
Percentile 5 0034 0033 0065 0059
10 004 0039 0076 0069 25 0053 0051 0101 0093 50 0074 0071 014 013 75 0106 0103 0198 0189 90 0144 0141 0265 0259 95 0169 0167 031 0305
975 0191 0189 0352 0352 99 0216 0212 04 04
14
Table 11 Average daily dose (ugkgday) of 13-D inhaled by residents during the 62-day period of highest Telone use in an area where Telone is applied to a total of 25 80-acre fields each year
Age Group
lt 1 1 lt 2 2 lt 3 3 lt 6 6 lt 9 Male Female Male Female Male Female Male Female Male Female
Mean 02499 02707 15513 16841 13685 14366 11103 11467 10548 10651 Std Deviation 02270 02431 10419 11219 09039 09243 07460 07561 06797 06863
Percentile 5 0045 0050 0470 0520 0422 0464 0333 0361 0330 0326
10 0058 0065 0558 0616 0501 0549 0399 0426 0397 0395 25 0098 0108 0770 0841 0691 0750 0553 0589 0558 0560 50 0173 0192 1207 1308 1070 1134 0869 0904 0849 0863 75 0321 0343 2052 2244 1815 1897 1466 1507 1367 1396 90 0539 0590 3126 3385 2738 2804 2242 2249 2050 2038 95 0714 0789 3750 4047 3260 3375 2659 2731 2464 2474
975 0903 0966 4233 4530 3667 3821 3010 3137 2783 2880 99 1125 1183 4711 5124 4108 4260 3468 3522 3230 3296
9 lt 12 12 lt 15 15 lt 18 18lt 25 25 lt 70 Male Female Male Female Male Female Male Female Male Female
Mean 07953 07730 06536 05394 05300 04984 05297 04964 04809 04414 Std Deviation 05168 04897 04050 03320 03172 02980 02904 02913 02688 02840
Percentile 5 0239 0237 0208 0172 0176 0164 0188 0164 0167 0132
10 0291 0292 0254 0209 0214 0196 0228 0200 0201 0164 25 0417 0412 0360 0295 0298 0278 0314 0284 0281 0236 50 0645 0635 0545 0453 0447 0419 0459 0422 0416 0362 75 1029 1007 0835 0694 0676 0645 0676 0637 0618 0567 90 1529 1455 1209 0998 0977 0917 0930 0904 0848 0830 95 1870 1767 1457 1207 1171 1103 1103 1085 1018 1022
975 2118 2080 1713 1413 1338 1279 1267 1252 1166 1190 99 2496 2341 2020 1645 1568 1450 1468 1433 1342 1382
15
Table 12 Average daily dose (ugkgday) of 13-D inhaled during the 62-day period of highest Telone use by residents living 100 m from fields in an area where Telone is applied to a total of 25 80-acre fields each year
Age Group
lt 1 1 lt 2 2 lt 3 3 lt 6 6 lt 9 Male Female Male Female Male Female Male Female Male Female
Mean 04940 05352 30723 33330 26876 27770 21802 22126 19918 19861 Std Deviation 03548 03830 14181 15406 12335 12549 10277 10370 09528 09564
Percentile 5 0118 0128 1368 1490 1206 1263 0942 0968 0852 0833
10 0152 0166 1545 1672 1347 1418 1069 1098 0969 0965 25 0238 0258 1924 2096 1697 1757 1366 1393 1255 1254 50 0395 0425 2710 2949 2360 2470 1918 1960 1760 1766 75 0641 0699 4008 4347 3502 3620 2833 2868 2545 2529 90 0976 1076 5137 5567 4481 4594 3657 3725 3371 3371 95 1217 1331 5792 6272 5021 5177 4158 4258 3831 3879
975 1450 1563 6306 6950 5536 5720 4615 4647 4261 4271 99 1680 1784 6915 7610 6021 6204 5033 5157 4801 4847
9 lt 12 12 lt 15 15 lt 18 18lt 25 25 lt 70 Male Female Male Female Male Female Male Female Male Female
Mean 14857 14065 11533 09575 09336 08872 08833 08610 08063 08020 Std Deviation 07344 06874 05796 04659 04444 04134 03970 04030 03694 04061
Percentile 5 0603 0573 0464 0396 0393 0379 0383 0359 0350 0305
10 0701 0667 0539 0459 0454 0438 0447 0422 0405 0366 25 0923 0890 0723 0610 0599 0571 0584 0558 0526 0499 50 1314 1244 1020 0849 0833 0792 0802 0770 0733 0704 75 1899 1795 1456 1209 1184 1126 1111 1091 1007 1034 90 2530 2389 1927 1605 1549 1481 1436 1433 1316 1382 95 2925 2770 2287 1863 1809 1695 1662 1661 1524 1604
975 3280 3076 2623 2102 2000 1867 1841 1818 1725 1790 99 3678 3463 3033 2434 2278 2101 2083 2029 1922 2018
16
Table 13 Average daily dose (ugkgday) of 13-D inhaled during the 62-day period of highest Telone use by residents living 200 m from fields in an area where Telone is applied to a total of 25 80-acre fields each year
Age Group
lt 1 1 lt 2 2 lt 3 3 lt 6 6 lt 9 Male Female Male Female Male Female Male Female Male Female
Mean 04605 05018 28772 31305 25168 26084 20439 20856 18713 18739 Std Deviation 03227 03596 13044 14290 11309 11633 09438 09779 08750 08917
Percentile 5 0112 0117 1229 1308 1089 1124 0851 0854 0758 0745
10 0139 0155 1382 1492 1222 1278 0978 0986 0895 0871 25 0219 0243 1778 1935 1568 1633 1265 1293 1169 1170 50 0374 0401 2647 2865 2324 2404 1865 1887 1700 1694 75 0607 0664 3775 4152 3289 3433 2687 2734 2426 2428 90 0906 0998 4704 5195 4114 4278 3387 3499 3103 3164 95 1112 1238 5266 5730 4585 4726 3771 3915 3536 3593
975 1300 1441 5770 6269 5016 5128 4206 4249 3908 3920 99 1534 1688 6289 6837 5542 5607 4605 4696 4281 4346
9 lt 12 12 lt 15 15 lt 18 18lt 25 25 lt 70 Male Female Male Female Male Female Male Female Male Female
Mean 13973 13308 10879 09069 08808 08389 08368 08156 07646 07564 Std Deviation 06736 06511 05331 04368 04053 03864 03650 03789 03405 03774
Percentile 5 0539 0511 0423 0356 0362 0348 0358 0328 0322 0284
10 0648 0604 0501 0423 0424 0405 0419 0390 0376 0336 25 0872 0824 0679 0567 0570 0530 0554 0523 0503 0462 50 1254 1199 0982 0819 0799 0766 0779 0745 0706 0675 75 1816 1723 1388 1170 1128 1081 1064 1044 0961 0984 90 2351 2273 1816 1521 1439 1382 1328 1350 1231 1286 95 2687 2563 2107 1726 1643 1579 1522 1527 1409 1483
975 2965 2847 2365 1940 1850 1741 1692 1704 1581 1659 99 3358 3142 2680 2170 2043 1922 1877 1904 1767 1851
17
Table 14 Average daily dose (ugkgday) of 13-D inhaled during the 62-day period of highest Telone use by residents living 500 m from fields in an area where Telone is applied to a total of 25 80-acre fields each year
Age Group
lt 1 1 lt 2 2 lt 3 3 lt 6 6 lt 9 Male Female Male Female Male Female Male Female Male Female
Mean 02906 03157 18121 19672 15953 16652 12951 13295 12146 12220 Std Deviation 01948 02105 07170 07709 06263 06341 05264 05343 04984 05174
Percentile 5 0078 0085 0934 1024 0826 0878 0655 0659 0588 0584
10 0099 0107 1041 1141 0920 0977 0724 0750 0671 0666 25 0147 0161 1257 1387 1111 1185 0892 0940 0840 0842 50 0242 0264 1653 1777 1457 1523 1180 1209 1114 1116 75 0378 0413 2232 2419 1974 2044 1596 1633 1494 1494 90 0550 0592 2797 3022 2460 2547 2028 2059 1897 1936 95 0674 0724 3194 3462 2803 2891 2301 2344 2167 2204
975 0809 0878 3536 3831 3097 3174 2574 2652 2438 2478 99 0957 1046 3922 4256 3424 3539 2853 2981 2705 2881
9 lt 12 12 lt 15 15 lt 18 18lt 25 25 lt 70 Male Female Male Female Male Female Male Female Male Female
Mean 09136 08829 07399 06103 05984 05640 05913 05588 05364 05024 Std Deviation 03929 03854 03262 02660 02473 02308 02375 02331 02169 02240
Percentile 5 0418 0399 0330 0285 0280 0274 0280 0264 0254 0223
10 0481 0463 0381 0324 0321 0310 0327 0305 0292 0258 25 0621 0603 0501 0418 0418 0392 0415 0385 0373 0336 50 0841 0805 0677 0556 0557 0517 0553 0516 0501 0455 75 1127 1084 0917 0749 0732 0689 0724 0689 0658 0624 90 1458 1401 1188 0961 0927 0877 0908 0872 0833 0813 95 1674 1633 1373 1129 1069 1009 1044 0999 0947 0922
975 1843 1818 1532 1256 1208 1112 1175 1101 1055 1031 99 2078 2087 1729 1481 1323 1276 1306 1277 1190 1210
18
___________________________________________________________________________
___________________________________________________________________________
INPUT VARIABLES FOR EXPOSURE SIMULATION
Air concentrations
Table 15 gives the probability distributions of air concentrations (in ugm3) used as input in the exposure simulations The first column gives percentiles of the distribution interpolated from a four-parameter logistic curve fit to the original Calhoun et al frequency distribution The interpolated concentrations were adjusted by factors developed by the Environmental Monitoring Branch of DPR (Johnson 1994b) shown in the second column Environmental Monitoring did additional modeling with ISCST to develop an adjustment to approximate the effect of using a 36-point-per-section spatial grid to model air concentrations instead of the relatively coarse 1-point-per-section grid used by Calhoun et al The effect of the adjustment is to increase the variability of the air concentrations while the mean level is unchanged The adjusted concentrations appear in the third column These adjusted values reflecting annual average daily concentrations for points on a 36-point-per-section grid were used for the estimation of lifetime average exposure
Table 15 Air concentration (ugm3) probability distributions used in exposure simulation
Concentrations Adjustment Adjusted Adjusted interpolated from 4shy factors to concentrations concentrations parameter logistic approximate used to estimate used to estimate
Percentile curvea 36-point gridb lifetime exposure 62-day exposure
00001 0103842 069359 0072024 0278587 001 0106063 084461 0089582 0346503 01 0128835 093182 0120051 0464356 02 0160687 096331 0154791 0598731 03 0201575 098483 0198517 0767865 04 0254546 100283 0255267 0987372 05 0323879 101963 0330237 1277356 06 0415684 103671 0430944 1666892 07 0538854 105566 0568846 2200298 08 0706593 107924 0762583 2949673 09 0938983 111571 1047632 4052242 095 1088601 115040 1252327 4844000 099 1228987 123092 1512784 5851450 0999 1263482 135000 1705701 6597652 09999 1266995 149000 1887822 7302097
a Curve fit to high-end air concentration frequency distribution in Calhoun et al (1994) b Johnson (1994b)
19
Seasonal exposure was estimated for July-August the period of historically highest Telone use To estimate average daily concentrations for this 62-day period the adjusted annual concentrations were modified as follows In the Calhoun et al simulation all positive air concentrations occurred in two 74shyday periods (60 days of Telone use plus 14 additional days for the material to dissipate) one in spring and the other in summer In their simulation 707 of the total Telone was applied during the summer use period with 40 mass loss to air In the spring period 293 of the Telone was applied with a mass loss rate of 25 To approximate the average daily concentrations during the summer period the fraction of the annual concentration contributed by the summer period was assumed to be (707 x 40) [(707 x 40) + (293 x 25)] = 0794 This fraction was condensed into 74 days by multiplying by 36574 Since actual Telone applications will probably not be restricted to the four months assumed by Calhoun et al historical use patterns were consulted Pesticide use reporting data showed that in 1988 and 1989 585 and 499 respectively of 13-D applied to carrots in Kern County was applied during July and August The simulation summer-period concentrations were further modified to represent concentrations for the 62 days of July-August by multiplying by (585 707) x (7462) The net effect was to multiply the annual concentrations by 3868 The concentrations thus modified shown in the fourth column of Table 15 were used for the estimation of seasonal exposure
For both lifetime and seasonal exposure assessments the average air concentration experienced by each person was simulated by randomly selecting five values from the relevant air distribution These values represented five locations where the individual spent his or her time A weighted average of the five concentrations weighted by the proportion of time spent at each location was used as the air concentration experienced by the individual The same five locations were used throughout a persons life but the division of time between them changed as a function of age The division of time between locations was a random variable in the simulation and is discussed in the section on individual mobility
To estimate exposure to persons living close to fields additional modeling with ISCST was done by the Environmental Monitoring Branch to provide annual average daily air concentrations at 100-meter increments from edges of treated fields (Johnson 1994a) The probability distributions of concentrations at 100 200 and 500 meters which were used in this exposure assessment are given in Table 16 In calculating the average concentration experienced by a person the first location selected at which the greatest portion of time is spent was considered the home location The concentration for the home location was simulated by selecting one value from eg the 100-meter distribution and one from the general distribution then calculating a weighted average with the two values weighted one-third and two-thirds respectively to reflect the fact that a field is treated only once in three years The two values were chosen to have a rank order correlation coefficient of 080 based on an observed correlation of 086 between ambient concentrations in the same township from year to year (personal communication Bruce Johnson Environmental Monitoring Branch DPR June 22 1994) For seasonal exposures the home concentration was simply a value from the relevant distance distribution This home location concentration was then used as described in the preceding paragraph in the calculation of the average concentration over five locations
20
___________________________________________________________________________
________________________________________________________________________________
Table 16 Annual average air concentrations (ugm3) at specified distances from treated fieldsa
Percentile 100 meters 200 meters 500 meters
000333 035393 030113 024996 001 037037 031439 026472 005 046011 040619 029312 01 050768 044753 031998 015 055763 048264 035456 02 058246 051404 036323 025 060290 055147 037940 03 064604 058207 038904 035 070250 062520 040306 04 077585 074610 041207 045 087638 085215 045127 05 090497 090723 049474 055 097657 096199 055052 06 105653 102253 057466 065 117366 117403 062218 07 131421 125398 067783 075 143991 134267 075510 08 154023 142689 079173 085 163177 151078 083575 09 175806 159046 087488 095 195317 178902 099410 099 220345 198031 127958 099667 226113 204338 135822
a Johnson (1994a)
21
________________________________________________________________________________
________________________________________________________________________________
Individual mobility within the Telone use area
Individuals were assumed to divide their total time between five randomly selected locations within the Telone high-use area The average air concentration to which an individual is exposed was calculated as described above as the mean of the five location concentrations weighted by the proportion of time spent in each location The mean division of time between locations was derived for each age interval from Table 45 in the Arabrsquos Survey of Childrens Activity Patterns (Wiley 1991a) and Table 33 in Activity Patterns of California Residents (Wiley 1991b) Wileys time at home was used as the time spent in the first selected location his time in transit was divided equally between two locations and the remaining time in the day divided between two others The division of time between these last two locations was 7030 for infants stepping down by age interval to a 5050 division for adults Individual time divisions were allowed to vary from the mean by randomly generating them from a multinomial distribution with n chosen to give fairly small variability in the youngest intervals and greater variability in the adolescent and adult intervals The distributions for time division are shown in Table 17
Table 17 Probability distributions of time spent in five locations
Multinomial Age n Average minutes per day spent in location
interval parameter 1 2 3 4 5
0 to 1 100 Male 1157 27 27 160 69 Female 1151 38 38 150 63
1 to 2 100 Male 1157 27 27 160 69 Female 1151 38 38 150 63
2 to 3 90 Male 1134 31 31 170 74 Female 1099 44 44 151 102
3 to 6 90 Male 1134 31 31 170 74 Female 1099 44 44 151 102
6 to 9 80 Male 1044 59 30 170 137 Female 1021 27 26 256 110
9 to 12 80 Male 1020 31 31 250 108 Female 968 47 46 265 114
12 to 15 70 Male 893 61 60 256 170 Female 917 49 49 255 170
15 to 18 70 Male 893 61 60 256 170 Female 917 49 49 255 170
18 to 25 60 Male 782 75 74 255 254 Female 862 60 60 229 229
25 to 70 60 Male 798 60 59 262 261 Female 960 51 51 189 189
22
Breathing rates
An individuals average breathing rate in each age interval was calculated as a weighted average of his rates at each of four activity levels resting light moderate and heavy The rate at each level was weighted by the proportion of time the individual was assumed to spend at that level Breathing rate at each activity level was a random variable The proportion of time at each level was a constant fixed for each age interval
For infants (0-1 year) a triangular distribution of breathing rates was derived from the mean and range reported in the Exposure Factors Handbook Table 3A-2 (USEPA 1990) The mode of the triangular distribution was set equal to the lower limit of the range in order to match the EPA mean For the other age intervals uniform distributions were derived from data in the ARBs Measurement of Breathing Rate and Volume (Adams 1993) In each case the range was chosen to include all the reported rates relevant to an activity level for a specific sex and age group These ranges are given in Table 18 Data were unavailable for children aged 1-3 so the breathing rates for 3-6-year-olds were used The breathing rates of an individual at different activity levels within and across ages were assumed to have the rank order correlations shown in Table 19 (The value of 08 on the diagonal represents the correlation between breathing rates of the same individual at the same activity level at different ages) It was not possible to incorporate correlations between body weight and breathing rates because the software used did not handle them correctly Correlation coefficients of body surface area and breathing rate within age intervals and activity levels reported in Adams (1993) ranged from 006 to 084 with a mean of 040 The correlation of body weight and breathing rate may be similar The effect of omitting this correlation from the simulation was probably to increase the estimated exposures to an unknown degree because if the greater exposures associated with high breathing rates tended to be paired with high body weights the exposure would be mitigated somewhat
The proportion of time assumed to be spent at each activity level is shown in Table 20
Body weight
Body weight distributions were taken directly from Tables 5A-1 through 5A-4 in the Exposure Factors Handbook (USEPA 1990) The histograms reported in these tables were used without smoothing Upper and lower bounds were supplied to produce a mean weight equal to the mean given in the EPA tables An individuals weights in different age intervals were assumed to have the rank order correlations shown in Table 21
Residence time and lifetime
In estimating lifetime exposures lifetime length was fixed at 70 years Exposure was estimated separately for fixed times of residence in the Telone use area of 30 and 70 years Since the exposure assessment is viewed as applying to any areas where Telone may be reintroduced in the proposed way and not just to the specific township in Kern County for which Calhoun et al modeled air concentrations it was not reasonable to define a distribution of residence time in the area Instead the estimated exposures are those expected to result from living the first 30 or 70 years of a 70-year lifetime in any area with Telone use like that described here
23
________________________________________________________________________________
________________________________________________________________________________
Table 18 Breathing rates (Lmin) as ranges of uniform distributions
Age interval Activity level Male Female
0 to 1 All Triangular ( 025 025 209 ) 1 to 2 Resting 5-7
Light 7-11 Moderate 8-15 Heavy 14-22
2 to 3 Resting 5-7 Light 7-11 Moderate 8-15 Heavy 14-22
3 to 6 Resting 5-7 Light 7-11 Moderate 8-15 Heavy 14-22
6 to 9 Resting 5-9 Light 10-17 Moderate 11-23 Heavy 20-45
9 to 12 Resting 5-9 Light 10-17 Moderate 11-23 Heavy 20-45
12 to 15 Resting 6-12 5-10 Light 7-17 7-15 Moderate 17-35 15-27 Heavy 25-72 24-59
15 to 18 Resting 6-12 5-10 Light 7-17 7-15 Moderate 17-35 15-27 Heavy 25-72 24-59
18 to 25 Resting 7-11 5-10 Light 8-18 6-15 Moderate 18-42 15-28 Heavy 48-80 39-62
25 to 70 Resting 7-11 5-10 Light 8-18 6-15 Moderate 18-42 15-28 Heavy 48-80 39-62
24
________________________________________________________________________________
_____________________________________________________________________________
________________________________________________________________________________
________________________________________________________________________________
Table 19 Rank order correlation coefficients between individuals breathing rates at different activity levels within and across age intervals
Resting Light Moderate Heavy Resting 08 05 05 04 Light 08 05 04 Moderate 08 05 Heavy 08
Table 20 Proportion of time at each activity level (constant in exposure simulation)
Age Activity level interval
Resting Light Moderate Heavy
0 to 1 Male 1 0 0 0 Female 1 0 0 0
1 to 2 Male 08 015 004 001 Female 08 015 004 001
2 to 3 Male 075 02 004 001 Female 075 02 004 001
3 to 6 Male 07 02 008 002 Female 07 02 008 002
6 to 9 Male 07 017 010 003 Female 07 02 008 002
9 to 12 Male 06 032 005 003 Female 06 033 005 002
12 to 15 Male 06 032 005 003 Female 06 033 005 002
15 to 18 Male 05 04 006 004 Female 05 042 005 003
18 to 25 Male 04 050 006 004 Female 04 052 005 003
25 to 70 Male 035 057 005 003 Female 035 060 004 001
25
________________________________________________________________________________
_______________________________________________________________________________
Table 21 Rank order correlation coefficients between the weights of an individual at different ages
0 to 1 1 to 2 2 to 3 3 to 6 6 to 9 9 to 12 12 to 15 15 to 18 18 to 25 25 to 70
0 to 1 100 092 082 072 061 061 061 061 061 061 1 to 2 100 092 082 072 061 061 061 061 061 2 to 3 100 092 082 072 061 061 061 061 3 to 6 100 092 082 072 061 061 061 6 to 9 100 092 082 072 061 061 9 to 12 100 092 082 072 061 12 to 15 100 082 082 072 15 to 18 100 082 082 18 to 25 100 082 25 to 70 100
Exposure appraisal
The estimated exposure distributions may be regarded as providing a reasonable idea of the highest exposures that should be expected under the use scenario The distributions should not be interpreted as reflecting the exposures of a population of individuals but as a set of values that are likely to bracket the exposure of an individual in this situation
It should be noted that the large differences between estimated seasonal exposures of children less than one and children from one to three are largely produced by the input breathing rate distributions The breathing rate data for infants under one came from a different source than all the other breathing rate data In addition no data were available for children from one to three so the rates for three- to six-year-old children were used In combination with the small body size of these children this may have overestimated their exposures
An important limitation of this exposure assessment is that it used 13-D concentrations in outdoor air to estimate 24-hourday exposure even though most people spend the greatest part of the day indoors Since the registrant provided no data on indoor concentrations and since no appropriate surrogate data were available to estimate them it was judged that there was no alternative
It is important to remember that these estimates of non-occupational exposure apply only to the use scenario of Calhoun et al which specified Telone applications to only 2000 acres per year in an area which has 8500 acres of carrots alone Any change in the use scenario would require a new exposure assessment
26
REFERENCES
Adams WC 1993 Measurement of breathing rate and volume in routinely performed daily activities Final report contract no A033-205 Research Division California Air Resources Board Sacramento CA
Albrecht WN 1987 Occupational exposure to 13-dichloropropene (Telone II) in Hawaiian pineapple culture Arch Environ Health 42286-290
Brouwer DH Brouwer EJ de Vreede JAF van Welie RTH Vermuelen NPE and van Hemmen JJ 1991 Inhalation exposure to 13-dichloropropene in the Dutch flower-bulb culture Part I Environmental monitoring Arch Environ Contam Toxicol 201-5
Calhoun LL Fontaine DD Stuart BL and Landenberger BD 1994 13shydichloropropene (13-D) An assessment of implied exposure and risk for the proposed commercial reentry of TELONE soil fumigant into California Dow Chemical Co Midland MI
California Department of Food and Agriculture 1988 Report of pesticides sold in California in 1987 Pesticide Use Enforcement Branch California Department of Food and Agriculture Sacramento CA
Climie IJG Hutson DH Morrison BJ and Stoydin G 1979 Glutathione conjugation in the detoxification of (Z)-13-dichloropropene (a component of the nematicide D-D) Xenobiotica 9149-156
Cohen B-S M and Poppendorf W 1989 A method for monitoring dermal exposure to volatile chemicals Am Ind Hyg Assoc J 50 216-223
Cook RE 1983 Fumigators exposure to airborne 13-dichloropropene during fumigation operation of Telone II soil fumigant Driscoll Citrus Service Inc Fort Pierce Florida Unpublished report of the Dow Chemical Chemical Company Industrial Hygiene Laboratory Midland MI January 4 1983
Davies DB and Fraser PA 1988 Evaluation of potential operator fieldworker and bystander exposure to 13-dichloropropene as a result of tobacco field fumigation with Telone II soil fumigant in southwestern Ontario (Canada) May-June 1985 CDFA Reg Doc No 50046-039
Dietz FK Hermann EA and Ramsey JC 1984a The pharmacokinetics of 14C-13shydichloropropene in rats and mice following oral administration The Toxicologist 4 Abstr No 585
Dietz FK Dittenber DA Krik HD and Ramsey JC 1984b Non-protein sulfhydryl content and macromolecular binding in rats and mice following oral administration of 13shydichloropropene The Toxicologist 4 Abstr No 586
Fisher GD and Kilgore WW 1988a Tissue levels of glutathione following acute inhalation of 13-dichloropropene J Toxicol Environ Health 23171-182
Fisher GD and Kilgore WW 1988b Mercapturic acid excretion in rats following 13shydichloropropene inhalation exposure Fund Appl Toxicol 11 303-307
27
Fisher GD and Kilgore WW 1989 Pharmacokinetics of S-[3-chloroprop-2shyenyl]glutathione in rats following acute inhalation exposure to 13-dichloropropene Xenobiotica 19269-278
Fong HR and Maykoski R 1985 Air exposure monitoring of EHAP personnel during a Telone II soil translocation study in Fresno County CDFA Rpt HS 1299
Houtman BA 1992 Managing worker exposure 13-D in California
Houtman BA 1993 An evaluation of 13-dichloropropene worker exposure associated with Telone II soil fumigant loading application and reentry phase I ECL92095 (interim report)
Hutson DH Moss JA and Pickering BA 1971 The excretion and retention of components of the soil fumigant D-D and their metabolites in the rat Food Cosmet Toxicol 9 677-680
Johnson B 1994a Memorandum to John Sanders June 20 1994 on buffer zone calculations for 13-D in Kern County Environmental Monitoring and Pest Management Branch Department of Pesticide Regulation Sacramento CA
Johnson B 1994b Memorandum to Kean Goh May 16 1994 on estimated adjusted air concentration percentiles based on Dow simulation results for T29R26 Environmental Monitoring and Pest Management Branch Department of Pesticide Regulation Sacramento CA
Maddy KT Cusick B Richmond D 1980 Studies concerning the field application of Telone and DD in California in 1979 and the ambient air concentration of these pesticides during and following application by shank injection into soil in fields CDFA Rpt HS 686
Maddy KT Schneider F and Fredrickson S 1982 Monitoring of Telone II during and following experimental application by shank injection to established trees and grape vines in California in 1980-1981 CDFA Rpt 967
NIOSHOSHA Occupational Safety and Health Guidelines for Chemical Hazards 1988 DHHS (NIOSH) Publication No 81-1231981 and supplements Publication Nos 88-118 and 89-104
Osterloh JD Cohen BS Poppendorf W and Pond SM 1984 Urinary excretion of the N-cysteine conjugate of cis-13-dichloropropene by exposed individuals Arch Environ Health 39 271-275
Osterloh JD Wang R OConnell L Jacob III P and Maddy KT 1989a Pilot study for biological monitoring of 13-dichloropropene In Biological Monitoring of Pesticide Exposure RG Wang CA Franklin RC Honeycutt and JC Reinert (eds) Amer Chem Soc Soc Symp Ser No 382 215-230
Osterloh JD Wang R Schneider F and Maddy K 1989b Biological monitoring of dichloropropene Air concentrations urinary metabolite and renal enzyme excretion Arch Environ Health 44 207-213
Owen WJ and DeRouen TA 1980 Estimation of the mean for lognormal data containing zeroes and left-censored values with applications to the measurement of worker exposure to air contaminants Biometrics 36 707 719
28
Palisades Corporation 1992 RISK Risk analysis and simulation add-in for Microsoft Excel Release 11 users guide 31 Decker Rd Newfield NY 14867
Poppendorf W Leffingwell JT and Cohen B 1983 Development of methods and procedures for the assessment of occupational health risks in the application and use of nematicides in California CDFA Rpt HS 1162
Shapiro SS and Wilk MB 1965 An analysis for normality (complete samples) Biometrika 52 591-611
Stott WT and Kastl PE 1986 Inhalation pharmacokinetics of technical grade 13shydichloropropene Toxicol Appl Pharmacol 85 332-341
Stott WT 1992 Letter to J R Sanborn August 11 1992
Tobol HK and Axe FD 1982 Airborne concentrations of 13-dichloropropene during fumigation of established grapevines almond trees and peach trees California December 1980-January 1981 Unpublished report of the Dow Chemical Company Environmental ServicesIndustrial Hygiene Western Division Dow Chemical USA Report No HeRW-AG(8)
US EPA 1990 Exposure factors handbook EPA6008-89043 Office of Health and Environmental Assessment Washington DC
Van Welie RTH van Duyn P Brouwer DH van Hemmen JJ Brouwer EJ and Vermuelen NPE 1991 Inhalation exposure to 13-dichloropropene in the Dutch flower-bulb culture Part II Biological monitoring by measurement of urinary excretion of two mercapturic acid metabolites Arch Environ Contam Toxicol 206-12
Waechter JM Brazak KA McCarty LP LaPack MA and Brownson 1992 13shydichloropropene (Telone II Soil Fumigant) Inhalation pharmacokinetics and metabolism in human volunteers DowElanco (Interim Report) Laboratory Project Study ID M-002993-023
Wagner CP 1987 Industrial source complex (ISC) dispersion model users guide 2nd edition (revised) Vol I US Environmental Protection Agency Report No EPA-4054-88shy002 a
Wiley JA 1991a Study of childrens activity patterns Final report contract no A733-149 Research Division California Air Resources Board Sacramento CA
Wiley JA 1991b Activity patterns of California residents Final report contract no A6-177shy33 Research Division California Air Resources Board Sacramento CA
29
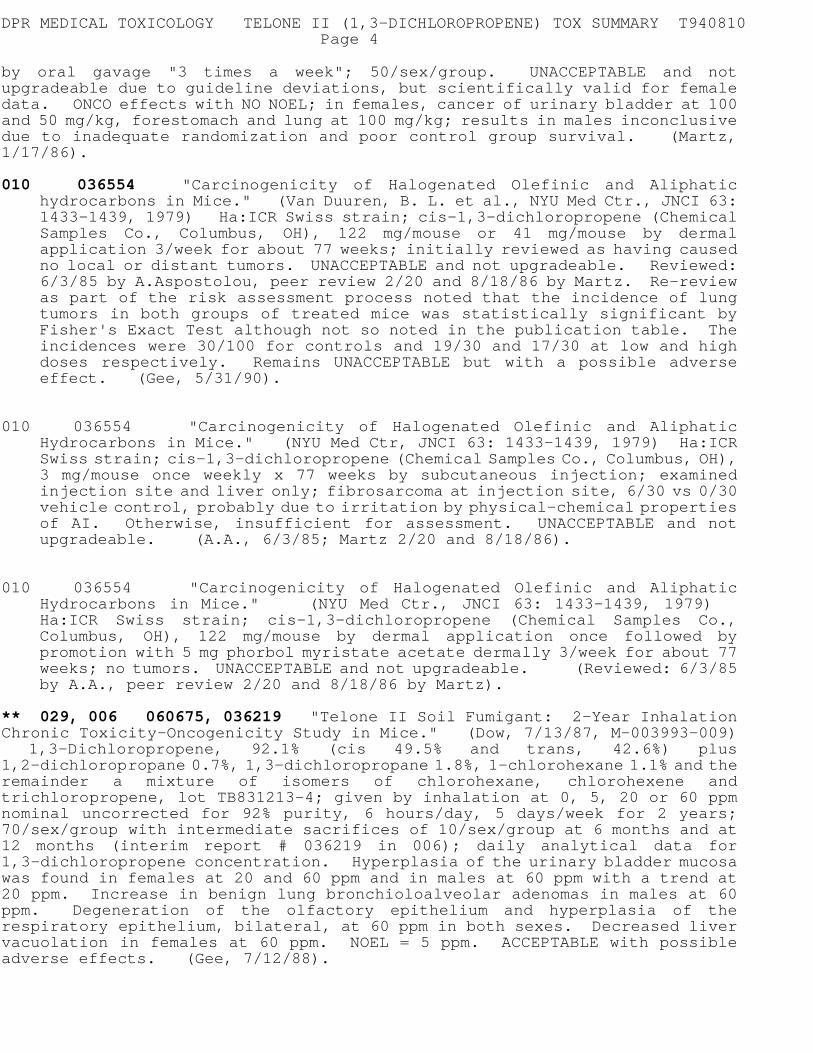

APPENDIX B
EXPOSURE ASSESSMENT
Human Exposure Assessment for 13-dichloropropene
by
James R Sanborn Staff Toxicologist
Sally Powell Senior Environmental Research Scientist
HS 1634
May 26 1989 Revised July 20 1994
California Environmental Protection Agency Department of Pesticide Regulation Worker Health and Safety Branch
1020 N Street Sacramento California 95814
ABSTRACT
The soil fumigant 13-dichloropropene (13-D) is used to control soil parasitic nematodes and other soil pests in annual crops and some perennials before planting Metabolism and pharmacokinetic data on 13-D indicate facile conjugation as a mercapturate and renal elimination after inhalation The primary mode of exposure is inhalation with dermal absorption of the vapor considered unimportant Inadvertent exposure of humans during application equipment failure or repair has resulted in skin andor eye irritation Biological monitoring of workers demonstrated an estimated Absorbed Daily Dosage of 19 ugkgday (113 and 073 ugkgday for application and loading respectively) when adjusted for respiratory protection worn during the entire fumigation cycle These adjusted numbers are reflective of practices to be implemented in California should 13-D be reinstated including spill control dry disconnects and vapor recovery measures Non-occupational inhalation exposure for residents of a Telone reinstatement area was estimated by stochastic simulation Estimated 95th percentile Lifetime Average Daily Dosages ranged from 0167 ugkgday for residents living 500 m from treated fields for 30 years to 0373 ugkgday for residents living 100 m from fields for 70 years Estimated 95th percentile 62-day Average Daily Dosages ranged from 0674 ugkgday for infants living 500 m from treated fields to 6272 ugkgday for young children living 100 m from fields This report was prepared as Appendix B to the Departments risk assessment document for 13-D The necessity for this risk document stemmed from the identification of adverse effects in acute and chronic studies as well as characterization of 13-D as an oncogen in rat chronic feeding and mouse inhalation studies
APPENDIX B
CALIFORNIA ENVIRONMENTAL PROTECTION AGENCY DEPARTMENT OF PESTICIDE REGULATION WORKER HEALTH AND SAFETY BRANCH
HUMAN EXPOSURE ASSESSMENT
13-DICHLOROPROPENE
May 261989 Revised July 20 1994
INTRODUCTION
The fumigant 13-dichloropropene (13-D) (CAS 542-75-6 molecular formula C3H4Cl2) is a liquid used as a soil treatment for the control of plant parasitic nematodes and other soil pests The physical properties of 13-D are listed below
Boiling point 108oC (Composite of cistrans isomers higher BP 1120oC lower BP 1043oC) Vapor pressure 273 mm at 25oC Density 12 gml at 25oC Water solubility 2180 ppm (cis-) 2320 ppm (trans-) Octanolwater partition coefficient 104 Cis-trans- ratio 11
EPA STATUS
A Registration Standard was issued in September 1986 for 13-D which includes exposure and risk assessments for workers handling 13-D These assessments assume that inhalation is the primary route of exposure and that dermal exposure may only contribute during episodes of equipment repair or failure Respirators chemically resistant clothing and gloves are required during mixing and loading
USAGE
13-D is manufactured by Dow Chemical Co as a formulation containing 94 active ingredient (11 cis-trans- isomer ratio) and 6 inert ingredients Commercial 13-D is sold under the name Telone IItrade and contains 95 lbs ai per gallon 13-D is registered for use on more than 120 crops and ornamentals It is used for preplant soil treatments for vegetable crops field crops deciduous fruit trees nut trees and vines It is recommended that soils where annual crops are grown be treated each year before planting Over 15 million pounds were reported sold in California in 1987 (California Department of Food and Agriculture 1988) Application rates of 13-D depend on crop and soil type and range from 43 to 970 lbs aiacre The soil surface is sealed by covering or rolling after application to increase efficacy by reduction of vapor loss Application equipment injects 13-D to a depth of at least 12 inches below the sealed soil surface
LABEL PRECAUTIONS
The label for Telone II contains the signal word WARNING and the following precautionary statements
PRECAUTIONARY STATEMENTS
HAZARDOUS TO HUMANS AND DOMESTIC ANIMALS HAZARDOUS LIQUID AND VAPOR
o MAY CAUSE ALLERGIC SKIN REACTION o MAY BE FATAL IF INHALED ABSORBED THROUGH SKIN OR SWALLOWED o CAUSES SEVERE EYE DAMAGE o CAUSES BURNS OF SKIN o MAY CAUSE LUNG LIVER AND KIDNEY DAMAGE AND RESPIRATORY SYSTEM UPON
PROLONGED CONTACT o Do not breathe vapor o Do not get in eyes on skin on clothing o Do not take internally o Use only with adequate ventilation o Wear eye and skin protection necessary to prevent contact when handling TELONE II o Wash thoroughly with soap and water after handling and before eating or smoking o If protective gear such as boots or gloves becomes contaminated immediately wash with
soap and water Never wear protective gear having the odor of 13-dichloropropene Aerate and wash all protective gear thoroughly after each use until odor is gone
o Render unusable and dispose of contaminated leather goods including shoes o Do not apply this product in such a manner as to directly or through drift expose workers or
other personnel The area being treated must be vacated by unprotected persons
California regulations and permit conditions Additional requirements
California regulations require respiratory protection when inhalation exposure potential is high (eg during loading and equipment repair) Eye and skin protection (gloves and chemical resistant clothing) are required when handling Telone II
The California permit conditions will require additional protective equipment Loaders will be required to wear full-face respirators Applicators must either wear a half-face respirator or be inside a charcoal-filtered cab during application Workers re-entering a treated area during the first 7 days post application will be required to wear a one-half face respirator
3
___________________________________________________________________________
___________________________________________________________________________
WORKER ILLNESS
Table 1 shows that from 1982-1990 there were 55 illnesses that were related to exposure to 13-D In terms of type of illness they were almost equally divided between systemic (16) eye (14) and skin (18) With respect to the causality most of the illnesses were classified as definite (33) followed by probable (9) and possible
Table 1 13-dichloropropene illnesses in California (1982-1990)
Year Type Causality
Systemic Eye Skin EyeSkin Definite Probable Possible
1982 4 2 1 0 1 2 4 1983 2 3 1 0 5 1 0 1984 1 3 2 0 4 1 1 1985 0 2 3 0 4 1 0 1986 1 0 2 1 1 2 1 1987 1 0 0 0 1 0 0 1988 1 2 7 0 6 2 2 1989 1 2 1 2 5 0 1 1990 5 0 1 0 6 0 0
METABOLISMPHARMACOKINETICS
ANIMAL STUDIES
Inhalation
Rats exposed nose-only to 30 90 300 or 900 ppm of 13-dichloropropene (cis- 493 transshy428) for three hours absorbed 14 29 85 and 171 mgkg respectively or 82 65 66 62 percent respectively of the exposure dose (Stott and Kastl 1986) Decreases in percent absorbed as the exposure concentration increases are apparently related to the decreased ventilation frequency at higher exposure levels Tissue distribution of inhaled vapors indicated the lungs contained approximately 50 percent of the total inhaled vapors and the nasal passages contained an additional 10-16 percent Depuration of 13-D in the blood was biphasic with the initial half-life estimated to be 3-6 minutes and the terminal half-life 30-40 minutes Levels of protein sulfhydryl amino acids were reduced but no reduction in pulmonary sulfhydryl amino acids was observed Similar results for rats were reported for tissue distribution and glutathione depletion after a one-hour exposure (Fisher and Kilgore 1988a)
The characterization of the primary urinary metabolite from rats after inhalation was accomplished by Fisher and Kilgore (1988b) who found a mercapturate after a one hour exposure to 13-D at 40 107 284 398 or 789 ppm The excretion of the conjugate was nearly linear with respect to 13-D exposure up to 400 ppm Above 400 ppm the excretion of the mercapturate declined relative to this initial linearity This may have been due to decreased ventilation frequency in rats exposed three hours to doses greater than 90 ppm as reported by Stott and Kastl (1986) Alternatively it may have been due to depletion of conjugable glutathione
4
Oral dosing
Several investigators have examined the metabolic fate of 13-D in animals after an oral dose Hutson et al (1971) reported that 81 of 10-mg doses of cis-13-D and 57 of 10-mg doses of trans-13-D were eliminated in the urine Dietz et al (1984 ab) reported 50-80 percent renal elimination and 14-17 percent elimination as CO2 in rats or mice treated with 13-D No evidence of saturation of metabolic pathways was observed up to 50 mgkg in these later studies Urinary elimination of 14C-equivalents was estimated to have a half-life of approximately 55 hours
The primary metabolite in urine of rodents dosed orally with 13-D is N-acetyl-S-(3-chloropropshy2-enyl) cysteine (DCPMER) and its sulfoxide This indicates that 13-D is metabolized and conjugated via a glutathione pathway in rodents The formation of this metabolite is consistent with the loss of non-protein sulfhydryl levels in the liver and stomach after per os doses with 13-D (Dietz et al 1984 Climie et al 1979)
HUMANS
Inhalation
In workers exposed to 13-D during loading and application Osterloh et al (1984 1989) Brouwer et al (1991) and van Welie et al (1991) observed DCPMER as a urinary metabolite The common urinary metabolite in rodents and humans indicates that these species metabolize 13-D by similar metabolic pathways
A PBPK study was conducted by the registrant in which six humans were exposed to 13-D in an inhalation chamber at 1 ppm for 6 hours (Waechter et al 1992) Estimates of respiratory uptake made from analysis of exhaled breath during the exposure averaged 78 for the two isomers Urine was collected during and after exposure (84 hrs post exposure) Excretion of the cis- and trans-mercapturates was complete 36 hours post exposure The combined conversion of inhaled 13-D to the two mercapturates was found to be 24 (Stott 1992)
DERMAL ABSORPTION
The high vapor pressure of 13-D (273 mm) reduces its dermal absorption potential There is a single report in the literature concerning dermal absorption of 13-D and other low-boiling organic chemicals (Cohen and Poppendorf 1989) The experimental details are not complete as the paper reported the values from a thesis by the first author The values reported for dermal absorption of 13-D in rats in vivo were 062 and 15 for doses of 19 and 19 ugcm2 respectively This range of absorption values was found for exposed skin that was not occluded
5
___________________________________________________________________________
___________________________________________________________________________
___________________________________________________________________________
___________________________________________________________________________
WORKER EXPOSURE
Inhalation
Worker inhalation exposure assessed by breathing zone measurements during loading application or equipment repair are summarized in Table 2
Table 2 Breathing zone air concentrations of workers handling 13-dichloropropene during loading and application
ppm Reference Date
037a Davies and Fraser 1988 004-040 Tobol and Axe 1982b
038a Maddy et al 1980 071a Maddy et al 1982 017a Fong and Maykoski 1985 lt10a Albrecht 1987 lt02a Cook 1982b
a Time-weighted average b Cited by Davies and Fraser (1988)
These studies suggest that workers are exposed to time-weighted average levels that are below the recommended 1 ppm Permissible Exposure Limit set by the Occupational Safety and Health Administration
Since concentrations were measured in the workers breathing zones while they performed a variety of tasks (some loaded and some applied others loaded or applied and some unspecified) the reported inhalation exposure results from a composite of work tasks The individual studies did not always report exposures by task nor did they report any more than TWA values or monitoring results making it difficult to obtain an absorbed dose for each work task
Table 3 Potential inhalation exposure for 13-dichloropropene estimated from reported breathing zone concentrations assuming a respiratory rate of 29 Lmin
Study mg8-hr day
Poppendorf et al(1983) 1423 Maddy et al (1980) 240 Maddy et al(1982) 448 Fong and Maykoski(1985) 108 Davies and Fraser (1988) 233 Cook(1983) 126 Albrecht1987) 631
Geometric Mean 315
6
___________________________________________________________________________
___________________________________________________________________________
The air monitoring results of several studies have been converted to potential inhalation exposures in mg8-hr day by assuming a respiration rate of 29 Lmin (Table 3) The geometric mean of these data is reported because the data are log-normally distributed (Shapiro and Wilk 1965) It is conventional to treat exposure data by this statistical method as it allows the use of all the environmental or exposure data that may be widely variant (Owen and DeRouen 1980) If the mean for potential inhalation exposure from breathing zone measurements is mitigated by a respirator (90 reduction in exposure) corrected for respiratory uptake (78 Waechter et al 1992)) and a 70-kg person is assumed then the ADD (Absorbed Daily Dosage) is 351 ugkgday
Hand Exposure
The data available on potential hand exposure to 13-D are conflicting Maddy et al (1980 1982) reported hand a contamination level of 164 ughr for workers wearing gloves The other data on hand exposure (Table 4) were taken from the work of Davies and Fraser (1988) on an application of 13-D in Canada The range of the data for the eight individuals hand residues was 01-570 mghr with a geometric mean of 97 mghr
Table 4 Hand exposure to 13-dichloropropene during loadinga
Worker mghr
1 14 2 08 3 265 4 193 5 570 6 07 7 333 8 01
Geometric Mean 97
a Davies and Fraser (1988)
This exposure value for the hand of 97 mghr is almost 600-fold greater than that reported by Maddy (1982) The reasons for this large difference may be in the experimental design In the Davies and Fraser (1988) study the protocol was a cotton glove-polyethylene glove (1 mm)-cotton glove arrangement where the inner cotton gloves were analyzed for 13-D The inner glove provides an absorptive sink whereas the outer glove compared to the smooth protective glove normally worn provides a sponge for liquid 13-D for eventual penetration through the thin polyethylene glove This type of thin glove (polyethylene) is not normally utilized in application of this material as it would not withstand the physical abuse of daily operations during loading the fumigant into the tanks It is likely that in the studies of Maddy et al (1982) where hand residues were monitored under normal work conditions that thicker gloves were worn Further Maddy suggests that hand washes may not be an effective means for the removal of residues because some evaporation may have occurred as well as some dermal absorption Even so the analysis of hand washes in the work reported by Maddy et al reported microgram amounts of 13-D rather than the milligram amounts in the work of
7
_____________________________________________________________________
_____________________________________________________________________
Davies and Fraser While the Maddy data is very likely an underestimate of dermal exposure the dermal estimates of Davies and Fraser are overestimates due to the experimental design Since the hand exposure values are for 12 hrsday (estimated daily loading time) the dermal component becomes a minor contributor of the overall human exposure which is primarily via inhalation
Annual and Lifetime Exposure Days
Estimates of worker exposure time are provided by the US EPA Data Call-In for handlers of 13-D in crops grown in California that have been treated with 13-D (Houtman 1992) This survey provided information on the number days per year for each crop that 13-D was handled for applicators and loaders in California (Table 5 ) The maximum number of days per career was estimated to be 270 The number of days per career ranged from a low of 24 for potatoes to a high of 270 for brassica It is possible that the same individuals applying for brassica could be applying in vegetables which could mean that an individuals exposure days per year or career could be as high as the total for all crops However it is likely to be much less because the calendar window for application to each crop prevents any one person from working all of them
Table 5 Annual and lifetime handling days for loaders (L) applicators (A) and repairs (R)
Tomato Potato Cotton Vegetables Brassica Beets TreeVine LAR LAR LAR LAR LAR LAR LAR
Annual Custom 162334 444 403626 183524 363636 101010 2298
Grower 111 111 2213 353535 000 111 444
Lifetime Custom 104150221 242424 260234169 108210144 270270270 656565 1988172
Grower 454545 252525 99585 875875875 000 454545 121212
Biological Monitoring
Osterloh et al (1984 1989 a and b) reported human exposure studies with 22 workers loading and applying in which they conducted urinary monitoring for N-acetyl-S-(3-chloroprop-2shyenyl)cysteine (DCPMER) Respiratory protection (half-face) was worn only during loading and not during application An average of 34 mg of DCPMER was excreted in the 24-hour period after exposure Correction for the molecular weight difference between 13-D (111) and DCPMER (237) gives an ADD of 16 mgpersonday or 227 ugkgday Using the data of Davies and Fraser (1988) it is possible to calculate the percentage of the exposure received during application and loading In Davies and Fraser it was determined that 261 percent of the exposure occurred during application 739 during loading Osterloh et al assumed 90 protection from the half-face respirator worn during loading hence the inhaled dose was 01 times the exposure During application 10 (0 respiratory protection) indicates the absence of respirators The absorbed dose for each activity may be found by the following equation
8
Loading Application (739 )(X)(01) + (261)(X)(10) = 227 ugkgday (1)
where X is exposure Solving for X gives 678 ugkgday Putting this value back into equation (1) and adding respiratory protection (half-face respirators) during application gives
Loading Application (739)(678)(01) + (261 )(678)(01) = 68 ugkgday
The value of 68 ugkgday is the expected ADD if half-face respirators are worn during both loading and application
Houtman (1993) monitored five individuals loading or applying 13-D in Washington state The same individual did not do both tasks These applicators and loaders carried out one application per day at a rate of 25 galacre lasting about four hours One application was done without mitigation measures while the others used various mitigation measures specified by the US EPA including dry disconnects (with and without vapor recovery) spill control at the end of the rows and a cab with charcoal-filtered air Houtman collected urinary monitoring data only for the application conducted without mitigation measures To estimate the absorbed daily dose from these unmitigated conditions respiratory protection factors of 09 and 095 for half-face and full-face respirators were used for applicators and loaders respectively The human chamber PBPK exposure study data were used in the absorbed dose calculation These respiratory protection requirements for loaders and applicators were part of the Permit Conditions in California for the flux studies and the Monterey Commercial Use Project These same respiratory protection conditions will be required if 13-D is reinstated in California
The exposure data shown in Table 6 as geometric means have been normalized to an 68shyhour day which is consistent with the data of Davies and Fraser (1988) and allows comparison with the data of Osterloh et al where one person performed both loading and application
Houtman (1993) found that utilizing spill control during application reduced the ambient air concentrations by 79 The urinary metabolite data were adjusted by this factor The absorbed dose was adjusted for the wearing of a one-half face respirator from the unmitigated application in Washington The final adjustment of the data from Washington was the factoring of the reduced rate in California (12 galacre) as compared to the 25 galacre that were used in the studies in Washington The loader exposure data were not adjusted for the reduced rate in California as the exposure occurs primarily during the connecting and disconnection of the hose from the nurse tank and is unrelated to the amount placed in the tank on the tractor
With respect to the estimation of AADD and LADD the range of values for loading and applying were obtained from the crop specific data compiled in Table 5 There are several reasons for the reduced exposure of a combined (one person doing both tasks) load and apply (19 ugkgday) in the Washington study (Houtman 1993) as compared to the earlier combined estimate of Osterloh et al (68 ugkgday) Firstly for the loader the Washington study used dry disconnects and vapor recovery devices For the applicator spill control was used at the end of the rows Each of these mitigation strategies reduces ambient air concentration which resulted in lower estimated exposure value of more than three-fold It is further likely that the soil moisture content will be higher in California than occurred during the applications in Washington This will further reduce emissions
9
_____________________________________________________________________
_____________________________________________________________________
Table 6 ADD AADD and LADD values for loading and application of 13- dichloropropene
Study Task ADD1 Days SADD4 AADD5 Days LADD6
(ugkgd) Year (ugkgd) (ugkgd) Career (ugkgd)
Osterloh et al LoadApply 680
Houtman Load 0733 4 0016 0008 24 69x10-4
40 016 008 270 77x10-3
Apply 1133 4 36
0025 023
0012 011
24 270
11x10-3
12x10-2
Total2 186
1 Absorbed Daily Dosage two load and application cyclesday body weights of study volunteers used in calculations
2 One person doing both loading and applying-for comparison to studies of Osterloh et al 3 Normalized to 68 hrs based on registrant study (Davies and Fraser 1988) for one
person doing both tasks to be compared with Osterloh et al 4 Split application for brassica 90-day window (see Table 5) 5 Annual Average Daily Dosage (365 daysyear) 6 Lifetime Average Daily Dosage 70 years life (25550 days)
Exposure Appraisal
The exposure estimates based on the Houtman (1993) study in which exposures were measured separately for loading and application should be used for the assessment of risk These estimates are based on biological monitoring that assessed both cis- and transshymercapturate metabolites in the urine and utilized the pharmacokinetic information developed from exposure of humans under controlled conditions Hand exposure information developed by previous investigators was not used as this route of exposure would be reflected in the total exposure measured by the biological monitoring
None of the occupational exposure studies in which biological monitoring was conducted employed exactly the mitigation measures that would be required in California These requirements are for full-face respiratory protection during loading and half-face protection during application
NON-OCCUPATIONAL EXPOSURE
Inhalation exposure was estimated for residents of an area where Telone is used in carrot growing Both lifetime and subchronic (seasonal) exposures were estimated for residents of the area in general and for residents with homes at specified distances from Telone-treated fields (100 200 and 500 meters) The estimated lifetime exposure distributions are given in Tables 7 through 10 seasonal exposures in Tables 11 through 14
10
=
The exposure assessment relied on simulated air concentrations from a study provided by the registrant (Calhoun et al 1994) in which the ISCST simulation model (Wagner 1987) was used to predict concentrations of 13-D in air for a scenario of limited reintroduction of Telone IItrade soil fumigant in carrots In the use scenario modeled Telone is applied to 25 80-acre fields (2000 acres total) per year in a 9-township (324-square-mile) area in Kern County Under this scenario there is no other use of Telone All applications are at the rate of 12 gallons per acre and no field is treated more than once in three years Calhoun et al simulated three years of daily air concentrations for one point at the center of each section in the reintroduction area to produce an annual average daily concentration for each point The locations of treated fields were assigned randomly in their model so that concentrations at the section centers vary in part due to being different distances and directions from applications The modeled concentrations thus represent long-term ambient concentrations for the reintroduction area Calhoun et al presented separately the concentrations for the township of highest Telone use within the 9-township area These concentrations were used in the exposure assessment
Probability distributions of exposure were estimated using stochastic simulation (Monte Carlo) methods implemented with the program RISK (Palisades Corporation 1992) The distribution of lifetime average daily dose (LADD) as ug of 13-D inhaled per kg of body weight per day (ugkgday) was estimated separately for persons living 1) the first 30 years of and 2) all of a 70-year lifetime in the reintroduction area Seasonal exposure was estimated for July-August the period of greatest Telone use by adjusting the long-term air concentrations for proportional use and mass loss during that 62-day period Additional simulated air concentrations provided by the Environmental Monitoring Branch (Johnson 1994a) were incorporated to estimate both lifetime and 62-day exposures to residents whose dwellings are close to treated fields Exposure distributions were estimated separately for residents living 100 200 and 500 meters from the edges of treated fields Each estimated exposure distribution is based on a simulation with 10000 trials
LADD (ugkgday) was calculated by the following equation
10
([ ]) i 1
where the summation is over 10 age intervals RTi = number of years in age interval i that the person
resides in the Telone use area Conci = average of air concentrations (ugm3) in 5
locations weighted by the proportion of time spent in each location in interval i
BRi = average breathing rate (m3day) at each of 4 activity levels weighted by proportion of time spent at each level in interval i
BWi = body weight (kg) in interval i and 70 years is the assumed lifetime
LADD = RT Conci x BR BW 70i i i
11
Seasonal exposure (62-day average ugkgday) was calculated separately for each age interval as Conc x BR
Average daily dose = BW
where concentration breathing rate and body weight are as defined above for LADD but with air concentrations modified to approximate seasonal averages as explained in the next section
Concentration breathing rate and body weight were stochastic variables in the exposure simulation model The statistical distributions used to simulate them are described in the sections on specific input variables following Tables 7-14
12
___________________________________________________________________________
Table 7 Lifetime average daily dose (ugkgday) of 13-D inhaled by residents of an area where Telone is applied to a total of 25 80-acre fields each year
Residence Time
Birth to age 30 Birth to age 70 Male Female Male Female
Mean 00800 00783 01510 01436 Std Deviation 00480 00487 00867 00902
Percentile 5 0027 0026 0053 0047
10 0032 0031 0063 0056 25 0044 0042 0087 0078 50 0066 0063 0129 0116 75 0103 0101 0193 0186 90 0150 0148 0277 0270 95 0179 0179 0326 0330
975 --a -- -- -shy99 0230 0236 0425 0444
a not calculated
Table 8 Lifetime average daily dose (ugkgday) of 13-D inhaled by residents living 100 m from treated fields in an area where Telone is applied to a total of 25 80-acre fields each year
Residence Time
Birth to age 30 Birth to age 70 Male Female Male Female
Mean 01022 01001 01892 01829 Std Deviation 00514 00515 00926 00959
Percentile 5 0042 004 0078 0071
10 0048 0047 0091 0084 25 0063 0061 012 0111 50 009 0087 0168 0159 75 0129 0128 0238 0233 90 0176 0174 0319 0319 95 0204 0201 0373 0371
975 0228 0227 0416 0423 99 0262 0257 0481 0481
13
___________________________________________________________________________
Table 9 Lifetime average daily dose (ugkgday) of 13-D inhaled by residents living 200 m from treated fields in an area where Telone is applied to a total of 25 80-acre fields each year
Residence Time
Birth to age 30 Birth to age 70 Male Female Male Female
Mean 00996 00973 01846 0178 Std Deviation 00501 00499 00901 00932
Percentile 5 0039 0038 0073 0067
10 0046 0044 0087 008 25 0061 006 0116 0108 50 0088 0086 0165 0156 75 0127 0124 0234 0227 90 0171 0168 0311 0307 95 0199 0196 036 0363
975 0222 022 0408 0414 99 0253 0248 0458 0465
Table 10 Lifetime average daily dose (ugkgday) of 13-D inhaled by residents living 500 m from treated fields in an area where Telone is applied to a total of 25 80-acre fields each year
Residence Time
Birth to age 30 Birth to age 70 Male Female Male Female
Mean 0084 00818 01577 01498 Std Deviation 00423 00419 00772 00781
Percentile 5 0034 0033 0065 0059
10 004 0039 0076 0069 25 0053 0051 0101 0093 50 0074 0071 014 013 75 0106 0103 0198 0189 90 0144 0141 0265 0259 95 0169 0167 031 0305
975 0191 0189 0352 0352 99 0216 0212 04 04
14
Table 11 Average daily dose (ugkgday) of 13-D inhaled by residents during the 62-day period of highest Telone use in an area where Telone is applied to a total of 25 80-acre fields each year
Age Group
lt 1 1 lt 2 2 lt 3 3 lt 6 6 lt 9 Male Female Male Female Male Female Male Female Male Female
Mean 02499 02707 15513 16841 13685 14366 11103 11467 10548 10651 Std Deviation 02270 02431 10419 11219 09039 09243 07460 07561 06797 06863
Percentile 5 0045 0050 0470 0520 0422 0464 0333 0361 0330 0326
10 0058 0065 0558 0616 0501 0549 0399 0426 0397 0395 25 0098 0108 0770 0841 0691 0750 0553 0589 0558 0560 50 0173 0192 1207 1308 1070 1134 0869 0904 0849 0863 75 0321 0343 2052 2244 1815 1897 1466 1507 1367 1396 90 0539 0590 3126 3385 2738 2804 2242 2249 2050 2038 95 0714 0789 3750 4047 3260 3375 2659 2731 2464 2474
975 0903 0966 4233 4530 3667 3821 3010 3137 2783 2880 99 1125 1183 4711 5124 4108 4260 3468 3522 3230 3296
9 lt 12 12 lt 15 15 lt 18 18lt 25 25 lt 70 Male Female Male Female Male Female Male Female Male Female
Mean 07953 07730 06536 05394 05300 04984 05297 04964 04809 04414 Std Deviation 05168 04897 04050 03320 03172 02980 02904 02913 02688 02840
Percentile 5 0239 0237 0208 0172 0176 0164 0188 0164 0167 0132
10 0291 0292 0254 0209 0214 0196 0228 0200 0201 0164 25 0417 0412 0360 0295 0298 0278 0314 0284 0281 0236 50 0645 0635 0545 0453 0447 0419 0459 0422 0416 0362 75 1029 1007 0835 0694 0676 0645 0676 0637 0618 0567 90 1529 1455 1209 0998 0977 0917 0930 0904 0848 0830 95 1870 1767 1457 1207 1171 1103 1103 1085 1018 1022
975 2118 2080 1713 1413 1338 1279 1267 1252 1166 1190 99 2496 2341 2020 1645 1568 1450 1468 1433 1342 1382
15
Table 12 Average daily dose (ugkgday) of 13-D inhaled during the 62-day period of highest Telone use by residents living 100 m from fields in an area where Telone is applied to a total of 25 80-acre fields each year
Age Group
lt 1 1 lt 2 2 lt 3 3 lt 6 6 lt 9 Male Female Male Female Male Female Male Female Male Female
Mean 04940 05352 30723 33330 26876 27770 21802 22126 19918 19861 Std Deviation 03548 03830 14181 15406 12335 12549 10277 10370 09528 09564
Percentile 5 0118 0128 1368 1490 1206 1263 0942 0968 0852 0833
10 0152 0166 1545 1672 1347 1418 1069 1098 0969 0965 25 0238 0258 1924 2096 1697 1757 1366 1393 1255 1254 50 0395 0425 2710 2949 2360 2470 1918 1960 1760 1766 75 0641 0699 4008 4347 3502 3620 2833 2868 2545 2529 90 0976 1076 5137 5567 4481 4594 3657 3725 3371 3371 95 1217 1331 5792 6272 5021 5177 4158 4258 3831 3879
975 1450 1563 6306 6950 5536 5720 4615 4647 4261 4271 99 1680 1784 6915 7610 6021 6204 5033 5157 4801 4847
9 lt 12 12 lt 15 15 lt 18 18lt 25 25 lt 70 Male Female Male Female Male Female Male Female Male Female
Mean 14857 14065 11533 09575 09336 08872 08833 08610 08063 08020 Std Deviation 07344 06874 05796 04659 04444 04134 03970 04030 03694 04061
Percentile 5 0603 0573 0464 0396 0393 0379 0383 0359 0350 0305
10 0701 0667 0539 0459 0454 0438 0447 0422 0405 0366 25 0923 0890 0723 0610 0599 0571 0584 0558 0526 0499 50 1314 1244 1020 0849 0833 0792 0802 0770 0733 0704 75 1899 1795 1456 1209 1184 1126 1111 1091 1007 1034 90 2530 2389 1927 1605 1549 1481 1436 1433 1316 1382 95 2925 2770 2287 1863 1809 1695 1662 1661 1524 1604
975 3280 3076 2623 2102 2000 1867 1841 1818 1725 1790 99 3678 3463 3033 2434 2278 2101 2083 2029 1922 2018
16
Table 13 Average daily dose (ugkgday) of 13-D inhaled during the 62-day period of highest Telone use by residents living 200 m from fields in an area where Telone is applied to a total of 25 80-acre fields each year
Age Group
lt 1 1 lt 2 2 lt 3 3 lt 6 6 lt 9 Male Female Male Female Male Female Male Female Male Female
Mean 04605 05018 28772 31305 25168 26084 20439 20856 18713 18739 Std Deviation 03227 03596 13044 14290 11309 11633 09438 09779 08750 08917
Percentile 5 0112 0117 1229 1308 1089 1124 0851 0854 0758 0745
10 0139 0155 1382 1492 1222 1278 0978 0986 0895 0871 25 0219 0243 1778 1935 1568 1633 1265 1293 1169 1170 50 0374 0401 2647 2865 2324 2404 1865 1887 1700 1694 75 0607 0664 3775 4152 3289 3433 2687 2734 2426 2428 90 0906 0998 4704 5195 4114 4278 3387 3499 3103 3164 95 1112 1238 5266 5730 4585 4726 3771 3915 3536 3593
975 1300 1441 5770 6269 5016 5128 4206 4249 3908 3920 99 1534 1688 6289 6837 5542 5607 4605 4696 4281 4346
9 lt 12 12 lt 15 15 lt 18 18lt 25 25 lt 70 Male Female Male Female Male Female Male Female Male Female
Mean 13973 13308 10879 09069 08808 08389 08368 08156 07646 07564 Std Deviation 06736 06511 05331 04368 04053 03864 03650 03789 03405 03774
Percentile 5 0539 0511 0423 0356 0362 0348 0358 0328 0322 0284
10 0648 0604 0501 0423 0424 0405 0419 0390 0376 0336 25 0872 0824 0679 0567 0570 0530 0554 0523 0503 0462 50 1254 1199 0982 0819 0799 0766 0779 0745 0706 0675 75 1816 1723 1388 1170 1128 1081 1064 1044 0961 0984 90 2351 2273 1816 1521 1439 1382 1328 1350 1231 1286 95 2687 2563 2107 1726 1643 1579 1522 1527 1409 1483
975 2965 2847 2365 1940 1850 1741 1692 1704 1581 1659 99 3358 3142 2680 2170 2043 1922 1877 1904 1767 1851
17
Table 14 Average daily dose (ugkgday) of 13-D inhaled during the 62-day period of highest Telone use by residents living 500 m from fields in an area where Telone is applied to a total of 25 80-acre fields each year
Age Group
lt 1 1 lt 2 2 lt 3 3 lt 6 6 lt 9 Male Female Male Female Male Female Male Female Male Female
Mean 02906 03157 18121 19672 15953 16652 12951 13295 12146 12220 Std Deviation 01948 02105 07170 07709 06263 06341 05264 05343 04984 05174
Percentile 5 0078 0085 0934 1024 0826 0878 0655 0659 0588 0584
10 0099 0107 1041 1141 0920 0977 0724 0750 0671 0666 25 0147 0161 1257 1387 1111 1185 0892 0940 0840 0842 50 0242 0264 1653 1777 1457 1523 1180 1209 1114 1116 75 0378 0413 2232 2419 1974 2044 1596 1633 1494 1494 90 0550 0592 2797 3022 2460 2547 2028 2059 1897 1936 95 0674 0724 3194 3462 2803 2891 2301 2344 2167 2204
975 0809 0878 3536 3831 3097 3174 2574 2652 2438 2478 99 0957 1046 3922 4256 3424 3539 2853 2981 2705 2881
9 lt 12 12 lt 15 15 lt 18 18lt 25 25 lt 70 Male Female Male Female Male Female Male Female Male Female
Mean 09136 08829 07399 06103 05984 05640 05913 05588 05364 05024 Std Deviation 03929 03854 03262 02660 02473 02308 02375 02331 02169 02240
Percentile 5 0418 0399 0330 0285 0280 0274 0280 0264 0254 0223
10 0481 0463 0381 0324 0321 0310 0327 0305 0292 0258 25 0621 0603 0501 0418 0418 0392 0415 0385 0373 0336 50 0841 0805 0677 0556 0557 0517 0553 0516 0501 0455 75 1127 1084 0917 0749 0732 0689 0724 0689 0658 0624 90 1458 1401 1188 0961 0927 0877 0908 0872 0833 0813 95 1674 1633 1373 1129 1069 1009 1044 0999 0947 0922
975 1843 1818 1532 1256 1208 1112 1175 1101 1055 1031 99 2078 2087 1729 1481 1323 1276 1306 1277 1190 1210
18
___________________________________________________________________________
___________________________________________________________________________
INPUT VARIABLES FOR EXPOSURE SIMULATION
Air concentrations
Table 15 gives the probability distributions of air concentrations (in ugm3) used as input in the exposure simulations The first column gives percentiles of the distribution interpolated from a four-parameter logistic curve fit to the original Calhoun et al frequency distribution The interpolated concentrations were adjusted by factors developed by the Environmental Monitoring Branch of DPR (Johnson 1994b) shown in the second column Environmental Monitoring did additional modeling with ISCST to develop an adjustment to approximate the effect of using a 36-point-per-section spatial grid to model air concentrations instead of the relatively coarse 1-point-per-section grid used by Calhoun et al The effect of the adjustment is to increase the variability of the air concentrations while the mean level is unchanged The adjusted concentrations appear in the third column These adjusted values reflecting annual average daily concentrations for points on a 36-point-per-section grid were used for the estimation of lifetime average exposure
Table 15 Air concentration (ugm3) probability distributions used in exposure simulation
Concentrations Adjustment Adjusted Adjusted interpolated from 4shy factors to concentrations concentrations parameter logistic approximate used to estimate used to estimate
Percentile curvea 36-point gridb lifetime exposure 62-day exposure
00001 0103842 069359 0072024 0278587 001 0106063 084461 0089582 0346503 01 0128835 093182 0120051 0464356 02 0160687 096331 0154791 0598731 03 0201575 098483 0198517 0767865 04 0254546 100283 0255267 0987372 05 0323879 101963 0330237 1277356 06 0415684 103671 0430944 1666892 07 0538854 105566 0568846 2200298 08 0706593 107924 0762583 2949673 09 0938983 111571 1047632 4052242 095 1088601 115040 1252327 4844000 099 1228987 123092 1512784 5851450 0999 1263482 135000 1705701 6597652 09999 1266995 149000 1887822 7302097
a Curve fit to high-end air concentration frequency distribution in Calhoun et al (1994) b Johnson (1994b)
19
Seasonal exposure was estimated for July-August the period of historically highest Telone use To estimate average daily concentrations for this 62-day period the adjusted annual concentrations were modified as follows In the Calhoun et al simulation all positive air concentrations occurred in two 74shyday periods (60 days of Telone use plus 14 additional days for the material to dissipate) one in spring and the other in summer In their simulation 707 of the total Telone was applied during the summer use period with 40 mass loss to air In the spring period 293 of the Telone was applied with a mass loss rate of 25 To approximate the average daily concentrations during the summer period the fraction of the annual concentration contributed by the summer period was assumed to be (707 x 40) [(707 x 40) + (293 x 25)] = 0794 This fraction was condensed into 74 days by multiplying by 36574 Since actual Telone applications will probably not be restricted to the four months assumed by Calhoun et al historical use patterns were consulted Pesticide use reporting data showed that in 1988 and 1989 585 and 499 respectively of 13-D applied to carrots in Kern County was applied during July and August The simulation summer-period concentrations were further modified to represent concentrations for the 62 days of July-August by multiplying by (585 707) x (7462) The net effect was to multiply the annual concentrations by 3868 The concentrations thus modified shown in the fourth column of Table 15 were used for the estimation of seasonal exposure
For both lifetime and seasonal exposure assessments the average air concentration experienced by each person was simulated by randomly selecting five values from the relevant air distribution These values represented five locations where the individual spent his or her time A weighted average of the five concentrations weighted by the proportion of time spent at each location was used as the air concentration experienced by the individual The same five locations were used throughout a persons life but the division of time between them changed as a function of age The division of time between locations was a random variable in the simulation and is discussed in the section on individual mobility
To estimate exposure to persons living close to fields additional modeling with ISCST was done by the Environmental Monitoring Branch to provide annual average daily air concentrations at 100-meter increments from edges of treated fields (Johnson 1994a) The probability distributions of concentrations at 100 200 and 500 meters which were used in this exposure assessment are given in Table 16 In calculating the average concentration experienced by a person the first location selected at which the greatest portion of time is spent was considered the home location The concentration for the home location was simulated by selecting one value from eg the 100-meter distribution and one from the general distribution then calculating a weighted average with the two values weighted one-third and two-thirds respectively to reflect the fact that a field is treated only once in three years The two values were chosen to have a rank order correlation coefficient of 080 based on an observed correlation of 086 between ambient concentrations in the same township from year to year (personal communication Bruce Johnson Environmental Monitoring Branch DPR June 22 1994) For seasonal exposures the home concentration was simply a value from the relevant distance distribution This home location concentration was then used as described in the preceding paragraph in the calculation of the average concentration over five locations
20
___________________________________________________________________________
________________________________________________________________________________
Table 16 Annual average air concentrations (ugm3) at specified distances from treated fieldsa
Percentile 100 meters 200 meters 500 meters
000333 035393 030113 024996 001 037037 031439 026472 005 046011 040619 029312 01 050768 044753 031998 015 055763 048264 035456 02 058246 051404 036323 025 060290 055147 037940 03 064604 058207 038904 035 070250 062520 040306 04 077585 074610 041207 045 087638 085215 045127 05 090497 090723 049474 055 097657 096199 055052 06 105653 102253 057466 065 117366 117403 062218 07 131421 125398 067783 075 143991 134267 075510 08 154023 142689 079173 085 163177 151078 083575 09 175806 159046 087488 095 195317 178902 099410 099 220345 198031 127958 099667 226113 204338 135822
a Johnson (1994a)
21
________________________________________________________________________________
________________________________________________________________________________
Individual mobility within the Telone use area
Individuals were assumed to divide their total time between five randomly selected locations within the Telone high-use area The average air concentration to which an individual is exposed was calculated as described above as the mean of the five location concentrations weighted by the proportion of time spent in each location The mean division of time between locations was derived for each age interval from Table 45 in the Arabrsquos Survey of Childrens Activity Patterns (Wiley 1991a) and Table 33 in Activity Patterns of California Residents (Wiley 1991b) Wileys time at home was used as the time spent in the first selected location his time in transit was divided equally between two locations and the remaining time in the day divided between two others The division of time between these last two locations was 7030 for infants stepping down by age interval to a 5050 division for adults Individual time divisions were allowed to vary from the mean by randomly generating them from a multinomial distribution with n chosen to give fairly small variability in the youngest intervals and greater variability in the adolescent and adult intervals The distributions for time division are shown in Table 17
Table 17 Probability distributions of time spent in five locations
Multinomial Age n Average minutes per day spent in location
interval parameter 1 2 3 4 5
0 to 1 100 Male 1157 27 27 160 69 Female 1151 38 38 150 63
1 to 2 100 Male 1157 27 27 160 69 Female 1151 38 38 150 63
2 to 3 90 Male 1134 31 31 170 74 Female 1099 44 44 151 102
3 to 6 90 Male 1134 31 31 170 74 Female 1099 44 44 151 102
6 to 9 80 Male 1044 59 30 170 137 Female 1021 27 26 256 110
9 to 12 80 Male 1020 31 31 250 108 Female 968 47 46 265 114
12 to 15 70 Male 893 61 60 256 170 Female 917 49 49 255 170
15 to 18 70 Male 893 61 60 256 170 Female 917 49 49 255 170
18 to 25 60 Male 782 75 74 255 254 Female 862 60 60 229 229
25 to 70 60 Male 798 60 59 262 261 Female 960 51 51 189 189
22
Breathing rates
An individuals average breathing rate in each age interval was calculated as a weighted average of his rates at each of four activity levels resting light moderate and heavy The rate at each level was weighted by the proportion of time the individual was assumed to spend at that level Breathing rate at each activity level was a random variable The proportion of time at each level was a constant fixed for each age interval
For infants (0-1 year) a triangular distribution of breathing rates was derived from the mean and range reported in the Exposure Factors Handbook Table 3A-2 (USEPA 1990) The mode of the triangular distribution was set equal to the lower limit of the range in order to match the EPA mean For the other age intervals uniform distributions were derived from data in the ARBs Measurement of Breathing Rate and Volume (Adams 1993) In each case the range was chosen to include all the reported rates relevant to an activity level for a specific sex and age group These ranges are given in Table 18 Data were unavailable for children aged 1-3 so the breathing rates for 3-6-year-olds were used The breathing rates of an individual at different activity levels within and across ages were assumed to have the rank order correlations shown in Table 19 (The value of 08 on the diagonal represents the correlation between breathing rates of the same individual at the same activity level at different ages) It was not possible to incorporate correlations between body weight and breathing rates because the software used did not handle them correctly Correlation coefficients of body surface area and breathing rate within age intervals and activity levels reported in Adams (1993) ranged from 006 to 084 with a mean of 040 The correlation of body weight and breathing rate may be similar The effect of omitting this correlation from the simulation was probably to increase the estimated exposures to an unknown degree because if the greater exposures associated with high breathing rates tended to be paired with high body weights the exposure would be mitigated somewhat
The proportion of time assumed to be spent at each activity level is shown in Table 20
Body weight
Body weight distributions were taken directly from Tables 5A-1 through 5A-4 in the Exposure Factors Handbook (USEPA 1990) The histograms reported in these tables were used without smoothing Upper and lower bounds were supplied to produce a mean weight equal to the mean given in the EPA tables An individuals weights in different age intervals were assumed to have the rank order correlations shown in Table 21
Residence time and lifetime
In estimating lifetime exposures lifetime length was fixed at 70 years Exposure was estimated separately for fixed times of residence in the Telone use area of 30 and 70 years Since the exposure assessment is viewed as applying to any areas where Telone may be reintroduced in the proposed way and not just to the specific township in Kern County for which Calhoun et al modeled air concentrations it was not reasonable to define a distribution of residence time in the area Instead the estimated exposures are those expected to result from living the first 30 or 70 years of a 70-year lifetime in any area with Telone use like that described here
23
________________________________________________________________________________
________________________________________________________________________________
Table 18 Breathing rates (Lmin) as ranges of uniform distributions
Age interval Activity level Male Female
0 to 1 All Triangular ( 025 025 209 ) 1 to 2 Resting 5-7
Light 7-11 Moderate 8-15 Heavy 14-22
2 to 3 Resting 5-7 Light 7-11 Moderate 8-15 Heavy 14-22
3 to 6 Resting 5-7 Light 7-11 Moderate 8-15 Heavy 14-22
6 to 9 Resting 5-9 Light 10-17 Moderate 11-23 Heavy 20-45
9 to 12 Resting 5-9 Light 10-17 Moderate 11-23 Heavy 20-45
12 to 15 Resting 6-12 5-10 Light 7-17 7-15 Moderate 17-35 15-27 Heavy 25-72 24-59
15 to 18 Resting 6-12 5-10 Light 7-17 7-15 Moderate 17-35 15-27 Heavy 25-72 24-59
18 to 25 Resting 7-11 5-10 Light 8-18 6-15 Moderate 18-42 15-28 Heavy 48-80 39-62
25 to 70 Resting 7-11 5-10 Light 8-18 6-15 Moderate 18-42 15-28 Heavy 48-80 39-62
24
________________________________________________________________________________
_____________________________________________________________________________
________________________________________________________________________________
________________________________________________________________________________
Table 19 Rank order correlation coefficients between individuals breathing rates at different activity levels within and across age intervals
Resting Light Moderate Heavy Resting 08 05 05 04 Light 08 05 04 Moderate 08 05 Heavy 08
Table 20 Proportion of time at each activity level (constant in exposure simulation)
Age Activity level interval
Resting Light Moderate Heavy
0 to 1 Male 1 0 0 0 Female 1 0 0 0
1 to 2 Male 08 015 004 001 Female 08 015 004 001
2 to 3 Male 075 02 004 001 Female 075 02 004 001
3 to 6 Male 07 02 008 002 Female 07 02 008 002
6 to 9 Male 07 017 010 003 Female 07 02 008 002
9 to 12 Male 06 032 005 003 Female 06 033 005 002
12 to 15 Male 06 032 005 003 Female 06 033 005 002
15 to 18 Male 05 04 006 004 Female 05 042 005 003
18 to 25 Male 04 050 006 004 Female 04 052 005 003
25 to 70 Male 035 057 005 003 Female 035 060 004 001
25
________________________________________________________________________________
_______________________________________________________________________________
Table 21 Rank order correlation coefficients between the weights of an individual at different ages
0 to 1 1 to 2 2 to 3 3 to 6 6 to 9 9 to 12 12 to 15 15 to 18 18 to 25 25 to 70
0 to 1 100 092 082 072 061 061 061 061 061 061 1 to 2 100 092 082 072 061 061 061 061 061 2 to 3 100 092 082 072 061 061 061 061 3 to 6 100 092 082 072 061 061 061 6 to 9 100 092 082 072 061 061 9 to 12 100 092 082 072 061 12 to 15 100 082 082 072 15 to 18 100 082 082 18 to 25 100 082 25 to 70 100
Exposure appraisal
The estimated exposure distributions may be regarded as providing a reasonable idea of the highest exposures that should be expected under the use scenario The distributions should not be interpreted as reflecting the exposures of a population of individuals but as a set of values that are likely to bracket the exposure of an individual in this situation
It should be noted that the large differences between estimated seasonal exposures of children less than one and children from one to three are largely produced by the input breathing rate distributions The breathing rate data for infants under one came from a different source than all the other breathing rate data In addition no data were available for children from one to three so the rates for three- to six-year-old children were used In combination with the small body size of these children this may have overestimated their exposures
An important limitation of this exposure assessment is that it used 13-D concentrations in outdoor air to estimate 24-hourday exposure even though most people spend the greatest part of the day indoors Since the registrant provided no data on indoor concentrations and since no appropriate surrogate data were available to estimate them it was judged that there was no alternative
It is important to remember that these estimates of non-occupational exposure apply only to the use scenario of Calhoun et al which specified Telone applications to only 2000 acres per year in an area which has 8500 acres of carrots alone Any change in the use scenario would require a new exposure assessment
26
REFERENCES
Adams WC 1993 Measurement of breathing rate and volume in routinely performed daily activities Final report contract no A033-205 Research Division California Air Resources Board Sacramento CA
Albrecht WN 1987 Occupational exposure to 13-dichloropropene (Telone II) in Hawaiian pineapple culture Arch Environ Health 42286-290
Brouwer DH Brouwer EJ de Vreede JAF van Welie RTH Vermuelen NPE and van Hemmen JJ 1991 Inhalation exposure to 13-dichloropropene in the Dutch flower-bulb culture Part I Environmental monitoring Arch Environ Contam Toxicol 201-5
Calhoun LL Fontaine DD Stuart BL and Landenberger BD 1994 13shydichloropropene (13-D) An assessment of implied exposure and risk for the proposed commercial reentry of TELONE soil fumigant into California Dow Chemical Co Midland MI
California Department of Food and Agriculture 1988 Report of pesticides sold in California in 1987 Pesticide Use Enforcement Branch California Department of Food and Agriculture Sacramento CA
Climie IJG Hutson DH Morrison BJ and Stoydin G 1979 Glutathione conjugation in the detoxification of (Z)-13-dichloropropene (a component of the nematicide D-D) Xenobiotica 9149-156
Cohen B-S M and Poppendorf W 1989 A method for monitoring dermal exposure to volatile chemicals Am Ind Hyg Assoc J 50 216-223
Cook RE 1983 Fumigators exposure to airborne 13-dichloropropene during fumigation operation of Telone II soil fumigant Driscoll Citrus Service Inc Fort Pierce Florida Unpublished report of the Dow Chemical Chemical Company Industrial Hygiene Laboratory Midland MI January 4 1983
Davies DB and Fraser PA 1988 Evaluation of potential operator fieldworker and bystander exposure to 13-dichloropropene as a result of tobacco field fumigation with Telone II soil fumigant in southwestern Ontario (Canada) May-June 1985 CDFA Reg Doc No 50046-039
Dietz FK Hermann EA and Ramsey JC 1984a The pharmacokinetics of 14C-13shydichloropropene in rats and mice following oral administration The Toxicologist 4 Abstr No 585
Dietz FK Dittenber DA Krik HD and Ramsey JC 1984b Non-protein sulfhydryl content and macromolecular binding in rats and mice following oral administration of 13shydichloropropene The Toxicologist 4 Abstr No 586
Fisher GD and Kilgore WW 1988a Tissue levels of glutathione following acute inhalation of 13-dichloropropene J Toxicol Environ Health 23171-182
Fisher GD and Kilgore WW 1988b Mercapturic acid excretion in rats following 13shydichloropropene inhalation exposure Fund Appl Toxicol 11 303-307
27
Fisher GD and Kilgore WW 1989 Pharmacokinetics of S-[3-chloroprop-2shyenyl]glutathione in rats following acute inhalation exposure to 13-dichloropropene Xenobiotica 19269-278
Fong HR and Maykoski R 1985 Air exposure monitoring of EHAP personnel during a Telone II soil translocation study in Fresno County CDFA Rpt HS 1299
Houtman BA 1992 Managing worker exposure 13-D in California
Houtman BA 1993 An evaluation of 13-dichloropropene worker exposure associated with Telone II soil fumigant loading application and reentry phase I ECL92095 (interim report)
Hutson DH Moss JA and Pickering BA 1971 The excretion and retention of components of the soil fumigant D-D and their metabolites in the rat Food Cosmet Toxicol 9 677-680
Johnson B 1994a Memorandum to John Sanders June 20 1994 on buffer zone calculations for 13-D in Kern County Environmental Monitoring and Pest Management Branch Department of Pesticide Regulation Sacramento CA
Johnson B 1994b Memorandum to Kean Goh May 16 1994 on estimated adjusted air concentration percentiles based on Dow simulation results for T29R26 Environmental Monitoring and Pest Management Branch Department of Pesticide Regulation Sacramento CA
Maddy KT Cusick B Richmond D 1980 Studies concerning the field application of Telone and DD in California in 1979 and the ambient air concentration of these pesticides during and following application by shank injection into soil in fields CDFA Rpt HS 686
Maddy KT Schneider F and Fredrickson S 1982 Monitoring of Telone II during and following experimental application by shank injection to established trees and grape vines in California in 1980-1981 CDFA Rpt 967
NIOSHOSHA Occupational Safety and Health Guidelines for Chemical Hazards 1988 DHHS (NIOSH) Publication No 81-1231981 and supplements Publication Nos 88-118 and 89-104
Osterloh JD Cohen BS Poppendorf W and Pond SM 1984 Urinary excretion of the N-cysteine conjugate of cis-13-dichloropropene by exposed individuals Arch Environ Health 39 271-275
Osterloh JD Wang R OConnell L Jacob III P and Maddy KT 1989a Pilot study for biological monitoring of 13-dichloropropene In Biological Monitoring of Pesticide Exposure RG Wang CA Franklin RC Honeycutt and JC Reinert (eds) Amer Chem Soc Soc Symp Ser No 382 215-230
Osterloh JD Wang R Schneider F and Maddy K 1989b Biological monitoring of dichloropropene Air concentrations urinary metabolite and renal enzyme excretion Arch Environ Health 44 207-213
Owen WJ and DeRouen TA 1980 Estimation of the mean for lognormal data containing zeroes and left-censored values with applications to the measurement of worker exposure to air contaminants Biometrics 36 707 719
28
Palisades Corporation 1992 RISK Risk analysis and simulation add-in for Microsoft Excel Release 11 users guide 31 Decker Rd Newfield NY 14867
Poppendorf W Leffingwell JT and Cohen B 1983 Development of methods and procedures for the assessment of occupational health risks in the application and use of nematicides in California CDFA Rpt HS 1162
Shapiro SS and Wilk MB 1965 An analysis for normality (complete samples) Biometrika 52 591-611
Stott WT and Kastl PE 1986 Inhalation pharmacokinetics of technical grade 13shydichloropropene Toxicol Appl Pharmacol 85 332-341
Stott WT 1992 Letter to J R Sanborn August 11 1992
Tobol HK and Axe FD 1982 Airborne concentrations of 13-dichloropropene during fumigation of established grapevines almond trees and peach trees California December 1980-January 1981 Unpublished report of the Dow Chemical Company Environmental ServicesIndustrial Hygiene Western Division Dow Chemical USA Report No HeRW-AG(8)
US EPA 1990 Exposure factors handbook EPA6008-89043 Office of Health and Environmental Assessment Washington DC
Van Welie RTH van Duyn P Brouwer DH van Hemmen JJ Brouwer EJ and Vermuelen NPE 1991 Inhalation exposure to 13-dichloropropene in the Dutch flower-bulb culture Part II Biological monitoring by measurement of urinary excretion of two mercapturic acid metabolites Arch Environ Contam Toxicol 206-12
Waechter JM Brazak KA McCarty LP LaPack MA and Brownson 1992 13shydichloropropene (Telone II Soil Fumigant) Inhalation pharmacokinetics and metabolism in human volunteers DowElanco (Interim Report) Laboratory Project Study ID M-002993-023
Wagner CP 1987 Industrial source complex (ISC) dispersion model users guide 2nd edition (revised) Vol I US Environmental Protection Agency Report No EPA-4054-88shy002 a
Wiley JA 1991a Study of childrens activity patterns Final report contract no A733-149 Research Division California Air Resources Board Sacramento CA
Wiley JA 1991b Activity patterns of California residents Final report contract no A6-177shy33 Research Division California Air Resources Board Sacramento CA
29
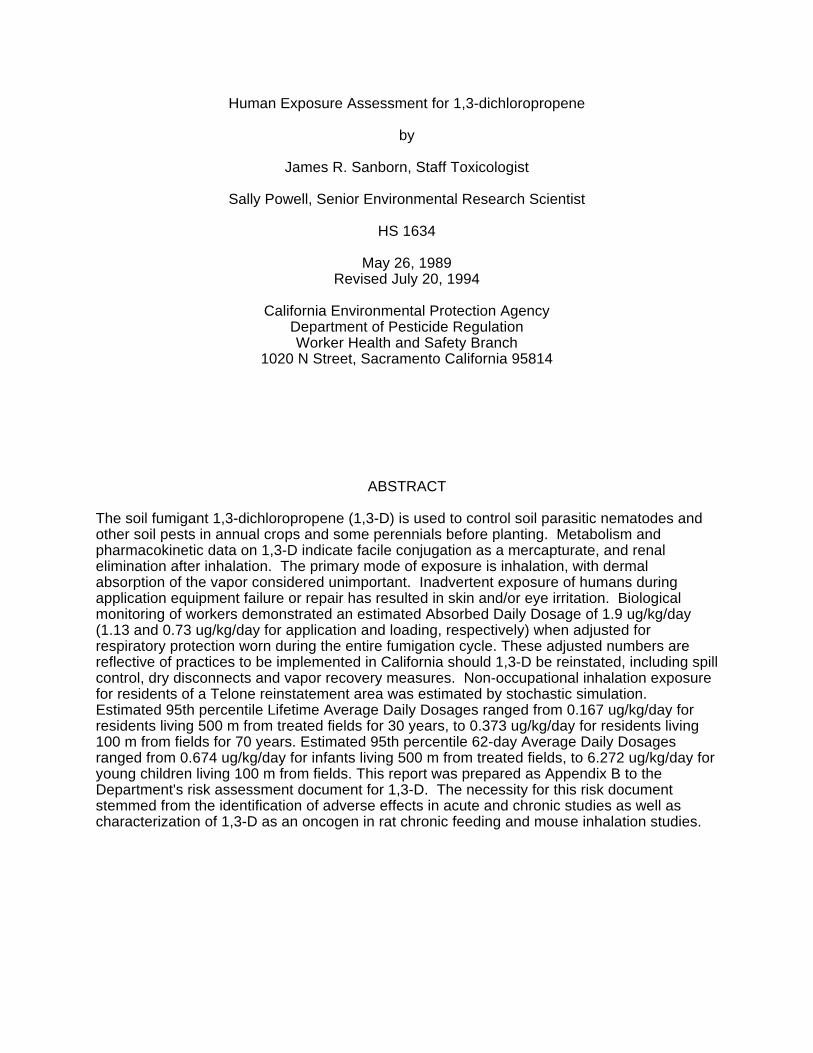
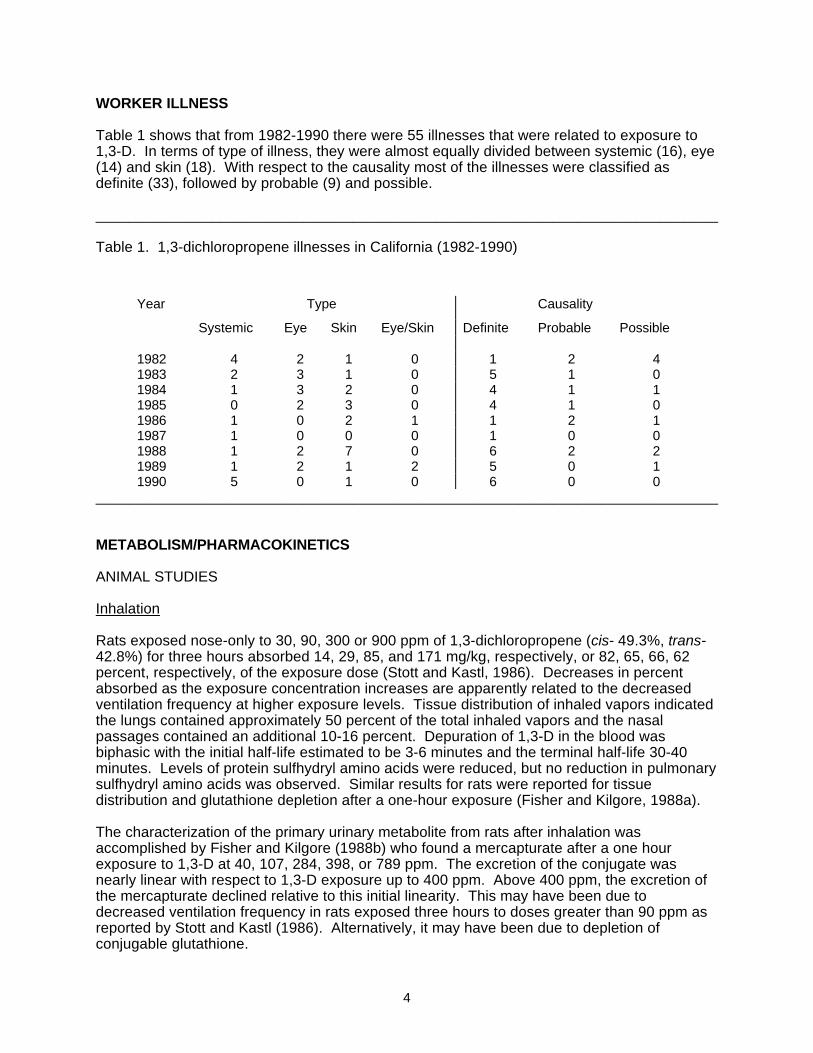
___________________________________________________________________________
___________________________________________________________________________
WORKER ILLNESS
Table 1 shows that from 1982-1990 there were 55 illnesses that were related to exposure to 13-D In terms of type of illness they were almost equally divided between systemic (16) eye (14) and skin (18) With respect to the causality most of the illnesses were classified as definite (33) followed by probable (9) and possible
Table 1 13-dichloropropene illnesses in California (1982-1990)
Year Type Causality
Systemic Eye Skin EyeSkin Definite Probable Possible
1982 4 2 1 0 1 2 4 1983 2 3 1 0 5 1 0 1984 1 3 2 0 4 1 1 1985 0 2 3 0 4 1 0 1986 1 0 2 1 1 2 1 1987 1 0 0 0 1 0 0 1988 1 2 7 0 6 2 2 1989 1 2 1 2 5 0 1 1990 5 0 1 0 6 0 0
METABOLISMPHARMACOKINETICS
ANIMAL STUDIES
Inhalation
Rats exposed nose-only to 30 90 300 or 900 ppm of 13-dichloropropene (cis- 493 transshy428) for three hours absorbed 14 29 85 and 171 mgkg respectively or 82 65 66 62 percent respectively of the exposure dose (Stott and Kastl 1986) Decreases in percent absorbed as the exposure concentration increases are apparently related to the decreased ventilation frequency at higher exposure levels Tissue distribution of inhaled vapors indicated the lungs contained approximately 50 percent of the total inhaled vapors and the nasal passages contained an additional 10-16 percent Depuration of 13-D in the blood was biphasic with the initial half-life estimated to be 3-6 minutes and the terminal half-life 30-40 minutes Levels of protein sulfhydryl amino acids were reduced but no reduction in pulmonary sulfhydryl amino acids was observed Similar results for rats were reported for tissue distribution and glutathione depletion after a one-hour exposure (Fisher and Kilgore 1988a)
The characterization of the primary urinary metabolite from rats after inhalation was accomplished by Fisher and Kilgore (1988b) who found a mercapturate after a one hour exposure to 13-D at 40 107 284 398 or 789 ppm The excretion of the conjugate was nearly linear with respect to 13-D exposure up to 400 ppm Above 400 ppm the excretion of the mercapturate declined relative to this initial linearity This may have been due to decreased ventilation frequency in rats exposed three hours to doses greater than 90 ppm as reported by Stott and Kastl (1986) Alternatively it may have been due to depletion of conjugable glutathione
4
Oral dosing
Several investigators have examined the metabolic fate of 13-D in animals after an oral dose Hutson et al (1971) reported that 81 of 10-mg doses of cis-13-D and 57 of 10-mg doses of trans-13-D were eliminated in the urine Dietz et al (1984 ab) reported 50-80 percent renal elimination and 14-17 percent elimination as CO2 in rats or mice treated with 13-D No evidence of saturation of metabolic pathways was observed up to 50 mgkg in these later studies Urinary elimination of 14C-equivalents was estimated to have a half-life of approximately 55 hours
The primary metabolite in urine of rodents dosed orally with 13-D is N-acetyl-S-(3-chloropropshy2-enyl) cysteine (DCPMER) and its sulfoxide This indicates that 13-D is metabolized and conjugated via a glutathione pathway in rodents The formation of this metabolite is consistent with the loss of non-protein sulfhydryl levels in the liver and stomach after per os doses with 13-D (Dietz et al 1984 Climie et al 1979)
HUMANS
Inhalation
In workers exposed to 13-D during loading and application Osterloh et al (1984 1989) Brouwer et al (1991) and van Welie et al (1991) observed DCPMER as a urinary metabolite The common urinary metabolite in rodents and humans indicates that these species metabolize 13-D by similar metabolic pathways
A PBPK study was conducted by the registrant in which six humans were exposed to 13-D in an inhalation chamber at 1 ppm for 6 hours (Waechter et al 1992) Estimates of respiratory uptake made from analysis of exhaled breath during the exposure averaged 78 for the two isomers Urine was collected during and after exposure (84 hrs post exposure) Excretion of the cis- and trans-mercapturates was complete 36 hours post exposure The combined conversion of inhaled 13-D to the two mercapturates was found to be 24 (Stott 1992)
DERMAL ABSORPTION
The high vapor pressure of 13-D (273 mm) reduces its dermal absorption potential There is a single report in the literature concerning dermal absorption of 13-D and other low-boiling organic chemicals (Cohen and Poppendorf 1989) The experimental details are not complete as the paper reported the values from a thesis by the first author The values reported for dermal absorption of 13-D in rats in vivo were 062 and 15 for doses of 19 and 19 ugcm2 respectively This range of absorption values was found for exposed skin that was not occluded
5
___________________________________________________________________________
___________________________________________________________________________
___________________________________________________________________________
___________________________________________________________________________
WORKER EXPOSURE
Inhalation
Worker inhalation exposure assessed by breathing zone measurements during loading application or equipment repair are summarized in Table 2
Table 2 Breathing zone air concentrations of workers handling 13-dichloropropene during loading and application
ppm Reference Date
037a Davies and Fraser 1988 004-040 Tobol and Axe 1982b
038a Maddy et al 1980 071a Maddy et al 1982 017a Fong and Maykoski 1985 lt10a Albrecht 1987 lt02a Cook 1982b
a Time-weighted average b Cited by Davies and Fraser (1988)
These studies suggest that workers are exposed to time-weighted average levels that are below the recommended 1 ppm Permissible Exposure Limit set by the Occupational Safety and Health Administration
Since concentrations were measured in the workers breathing zones while they performed a variety of tasks (some loaded and some applied others loaded or applied and some unspecified) the reported inhalation exposure results from a composite of work tasks The individual studies did not always report exposures by task nor did they report any more than TWA values or monitoring results making it difficult to obtain an absorbed dose for each work task
Table 3 Potential inhalation exposure for 13-dichloropropene estimated from reported breathing zone concentrations assuming a respiratory rate of 29 Lmin
Study mg8-hr day
Poppendorf et al(1983) 1423 Maddy et al (1980) 240 Maddy et al(1982) 448 Fong and Maykoski(1985) 108 Davies and Fraser (1988) 233 Cook(1983) 126 Albrecht1987) 631
Geometric Mean 315
6
___________________________________________________________________________
___________________________________________________________________________
The air monitoring results of several studies have been converted to potential inhalation exposures in mg8-hr day by assuming a respiration rate of 29 Lmin (Table 3) The geometric mean of these data is reported because the data are log-normally distributed (Shapiro and Wilk 1965) It is conventional to treat exposure data by this statistical method as it allows the use of all the environmental or exposure data that may be widely variant (Owen and DeRouen 1980) If the mean for potential inhalation exposure from breathing zone measurements is mitigated by a respirator (90 reduction in exposure) corrected for respiratory uptake (78 Waechter et al 1992)) and a 70-kg person is assumed then the ADD (Absorbed Daily Dosage) is 351 ugkgday
Hand Exposure
The data available on potential hand exposure to 13-D are conflicting Maddy et al (1980 1982) reported hand a contamination level of 164 ughr for workers wearing gloves The other data on hand exposure (Table 4) were taken from the work of Davies and Fraser (1988) on an application of 13-D in Canada The range of the data for the eight individuals hand residues was 01-570 mghr with a geometric mean of 97 mghr
Table 4 Hand exposure to 13-dichloropropene during loadinga
Worker mghr
1 14 2 08 3 265 4 193 5 570 6 07 7 333 8 01
Geometric Mean 97
a Davies and Fraser (1988)
This exposure value for the hand of 97 mghr is almost 600-fold greater than that reported by Maddy (1982) The reasons for this large difference may be in the experimental design In the Davies and Fraser (1988) study the protocol was a cotton glove-polyethylene glove (1 mm)-cotton glove arrangement where the inner cotton gloves were analyzed for 13-D The inner glove provides an absorptive sink whereas the outer glove compared to the smooth protective glove normally worn provides a sponge for liquid 13-D for eventual penetration through the thin polyethylene glove This type of thin glove (polyethylene) is not normally utilized in application of this material as it would not withstand the physical abuse of daily operations during loading the fumigant into the tanks It is likely that in the studies of Maddy et al (1982) where hand residues were monitored under normal work conditions that thicker gloves were worn Further Maddy suggests that hand washes may not be an effective means for the removal of residues because some evaporation may have occurred as well as some dermal absorption Even so the analysis of hand washes in the work reported by Maddy et al reported microgram amounts of 13-D rather than the milligram amounts in the work of
7
_____________________________________________________________________
_____________________________________________________________________
Davies and Fraser While the Maddy data is very likely an underestimate of dermal exposure the dermal estimates of Davies and Fraser are overestimates due to the experimental design Since the hand exposure values are for 12 hrsday (estimated daily loading time) the dermal component becomes a minor contributor of the overall human exposure which is primarily via inhalation
Annual and Lifetime Exposure Days
Estimates of worker exposure time are provided by the US EPA Data Call-In for handlers of 13-D in crops grown in California that have been treated with 13-D (Houtman 1992) This survey provided information on the number days per year for each crop that 13-D was handled for applicators and loaders in California (Table 5 ) The maximum number of days per career was estimated to be 270 The number of days per career ranged from a low of 24 for potatoes to a high of 270 for brassica It is possible that the same individuals applying for brassica could be applying in vegetables which could mean that an individuals exposure days per year or career could be as high as the total for all crops However it is likely to be much less because the calendar window for application to each crop prevents any one person from working all of them
Table 5 Annual and lifetime handling days for loaders (L) applicators (A) and repairs (R)
Tomato Potato Cotton Vegetables Brassica Beets TreeVine LAR LAR LAR LAR LAR LAR LAR
Annual Custom 162334 444 403626 183524 363636 101010 2298
Grower 111 111 2213 353535 000 111 444
Lifetime Custom 104150221 242424 260234169 108210144 270270270 656565 1988172
Grower 454545 252525 99585 875875875 000 454545 121212
Biological Monitoring
Osterloh et al (1984 1989 a and b) reported human exposure studies with 22 workers loading and applying in which they conducted urinary monitoring for N-acetyl-S-(3-chloroprop-2shyenyl)cysteine (DCPMER) Respiratory protection (half-face) was worn only during loading and not during application An average of 34 mg of DCPMER was excreted in the 24-hour period after exposure Correction for the molecular weight difference between 13-D (111) and DCPMER (237) gives an ADD of 16 mgpersonday or 227 ugkgday Using the data of Davies and Fraser (1988) it is possible to calculate the percentage of the exposure received during application and loading In Davies and Fraser it was determined that 261 percent of the exposure occurred during application 739 during loading Osterloh et al assumed 90 protection from the half-face respirator worn during loading hence the inhaled dose was 01 times the exposure During application 10 (0 respiratory protection) indicates the absence of respirators The absorbed dose for each activity may be found by the following equation
8
Loading Application (739 )(X)(01) + (261)(X)(10) = 227 ugkgday (1)
where X is exposure Solving for X gives 678 ugkgday Putting this value back into equation (1) and adding respiratory protection (half-face respirators) during application gives
Loading Application (739)(678)(01) + (261 )(678)(01) = 68 ugkgday
The value of 68 ugkgday is the expected ADD if half-face respirators are worn during both loading and application
Houtman (1993) monitored five individuals loading or applying 13-D in Washington state The same individual did not do both tasks These applicators and loaders carried out one application per day at a rate of 25 galacre lasting about four hours One application was done without mitigation measures while the others used various mitigation measures specified by the US EPA including dry disconnects (with and without vapor recovery) spill control at the end of the rows and a cab with charcoal-filtered air Houtman collected urinary monitoring data only for the application conducted without mitigation measures To estimate the absorbed daily dose from these unmitigated conditions respiratory protection factors of 09 and 095 for half-face and full-face respirators were used for applicators and loaders respectively The human chamber PBPK exposure study data were used in the absorbed dose calculation These respiratory protection requirements for loaders and applicators were part of the Permit Conditions in California for the flux studies and the Monterey Commercial Use Project These same respiratory protection conditions will be required if 13-D is reinstated in California
The exposure data shown in Table 6 as geometric means have been normalized to an 68shyhour day which is consistent with the data of Davies and Fraser (1988) and allows comparison with the data of Osterloh et al where one person performed both loading and application
Houtman (1993) found that utilizing spill control during application reduced the ambient air concentrations by 79 The urinary metabolite data were adjusted by this factor The absorbed dose was adjusted for the wearing of a one-half face respirator from the unmitigated application in Washington The final adjustment of the data from Washington was the factoring of the reduced rate in California (12 galacre) as compared to the 25 galacre that were used in the studies in Washington The loader exposure data were not adjusted for the reduced rate in California as the exposure occurs primarily during the connecting and disconnection of the hose from the nurse tank and is unrelated to the amount placed in the tank on the tractor
With respect to the estimation of AADD and LADD the range of values for loading and applying were obtained from the crop specific data compiled in Table 5 There are several reasons for the reduced exposure of a combined (one person doing both tasks) load and apply (19 ugkgday) in the Washington study (Houtman 1993) as compared to the earlier combined estimate of Osterloh et al (68 ugkgday) Firstly for the loader the Washington study used dry disconnects and vapor recovery devices For the applicator spill control was used at the end of the rows Each of these mitigation strategies reduces ambient air concentration which resulted in lower estimated exposure value of more than three-fold It is further likely that the soil moisture content will be higher in California than occurred during the applications in Washington This will further reduce emissions
9
_____________________________________________________________________
_____________________________________________________________________
Table 6 ADD AADD and LADD values for loading and application of 13- dichloropropene
Study Task ADD1 Days SADD4 AADD5 Days LADD6
(ugkgd) Year (ugkgd) (ugkgd) Career (ugkgd)
Osterloh et al LoadApply 680
Houtman Load 0733 4 0016 0008 24 69x10-4
40 016 008 270 77x10-3
Apply 1133 4 36
0025 023
0012 011
24 270
11x10-3
12x10-2
Total2 186
1 Absorbed Daily Dosage two load and application cyclesday body weights of study volunteers used in calculations
2 One person doing both loading and applying-for comparison to studies of Osterloh et al 3 Normalized to 68 hrs based on registrant study (Davies and Fraser 1988) for one
person doing both tasks to be compared with Osterloh et al 4 Split application for brassica 90-day window (see Table 5) 5 Annual Average Daily Dosage (365 daysyear) 6 Lifetime Average Daily Dosage 70 years life (25550 days)
Exposure Appraisal
The exposure estimates based on the Houtman (1993) study in which exposures were measured separately for loading and application should be used for the assessment of risk These estimates are based on biological monitoring that assessed both cis- and transshymercapturate metabolites in the urine and utilized the pharmacokinetic information developed from exposure of humans under controlled conditions Hand exposure information developed by previous investigators was not used as this route of exposure would be reflected in the total exposure measured by the biological monitoring
None of the occupational exposure studies in which biological monitoring was conducted employed exactly the mitigation measures that would be required in California These requirements are for full-face respiratory protection during loading and half-face protection during application
NON-OCCUPATIONAL EXPOSURE
Inhalation exposure was estimated for residents of an area where Telone is used in carrot growing Both lifetime and subchronic (seasonal) exposures were estimated for residents of the area in general and for residents with homes at specified distances from Telone-treated fields (100 200 and 500 meters) The estimated lifetime exposure distributions are given in Tables 7 through 10 seasonal exposures in Tables 11 through 14
10
=
The exposure assessment relied on simulated air concentrations from a study provided by the registrant (Calhoun et al 1994) in which the ISCST simulation model (Wagner 1987) was used to predict concentrations of 13-D in air for a scenario of limited reintroduction of Telone IItrade soil fumigant in carrots In the use scenario modeled Telone is applied to 25 80-acre fields (2000 acres total) per year in a 9-township (324-square-mile) area in Kern County Under this scenario there is no other use of Telone All applications are at the rate of 12 gallons per acre and no field is treated more than once in three years Calhoun et al simulated three years of daily air concentrations for one point at the center of each section in the reintroduction area to produce an annual average daily concentration for each point The locations of treated fields were assigned randomly in their model so that concentrations at the section centers vary in part due to being different distances and directions from applications The modeled concentrations thus represent long-term ambient concentrations for the reintroduction area Calhoun et al presented separately the concentrations for the township of highest Telone use within the 9-township area These concentrations were used in the exposure assessment
Probability distributions of exposure were estimated using stochastic simulation (Monte Carlo) methods implemented with the program RISK (Palisades Corporation 1992) The distribution of lifetime average daily dose (LADD) as ug of 13-D inhaled per kg of body weight per day (ugkgday) was estimated separately for persons living 1) the first 30 years of and 2) all of a 70-year lifetime in the reintroduction area Seasonal exposure was estimated for July-August the period of greatest Telone use by adjusting the long-term air concentrations for proportional use and mass loss during that 62-day period Additional simulated air concentrations provided by the Environmental Monitoring Branch (Johnson 1994a) were incorporated to estimate both lifetime and 62-day exposures to residents whose dwellings are close to treated fields Exposure distributions were estimated separately for residents living 100 200 and 500 meters from the edges of treated fields Each estimated exposure distribution is based on a simulation with 10000 trials
LADD (ugkgday) was calculated by the following equation
10
([ ]) i 1
where the summation is over 10 age intervals RTi = number of years in age interval i that the person
resides in the Telone use area Conci = average of air concentrations (ugm3) in 5
locations weighted by the proportion of time spent in each location in interval i
BRi = average breathing rate (m3day) at each of 4 activity levels weighted by proportion of time spent at each level in interval i
BWi = body weight (kg) in interval i and 70 years is the assumed lifetime
LADD = RT Conci x BR BW 70i i i
11
Seasonal exposure (62-day average ugkgday) was calculated separately for each age interval as Conc x BR
Average daily dose = BW
where concentration breathing rate and body weight are as defined above for LADD but with air concentrations modified to approximate seasonal averages as explained in the next section
Concentration breathing rate and body weight were stochastic variables in the exposure simulation model The statistical distributions used to simulate them are described in the sections on specific input variables following Tables 7-14
12
___________________________________________________________________________
Table 7 Lifetime average daily dose (ugkgday) of 13-D inhaled by residents of an area where Telone is applied to a total of 25 80-acre fields each year
Residence Time
Birth to age 30 Birth to age 70 Male Female Male Female
Mean 00800 00783 01510 01436 Std Deviation 00480 00487 00867 00902
Percentile 5 0027 0026 0053 0047
10 0032 0031 0063 0056 25 0044 0042 0087 0078 50 0066 0063 0129 0116 75 0103 0101 0193 0186 90 0150 0148 0277 0270 95 0179 0179 0326 0330
975 --a -- -- -shy99 0230 0236 0425 0444
a not calculated
Table 8 Lifetime average daily dose (ugkgday) of 13-D inhaled by residents living 100 m from treated fields in an area where Telone is applied to a total of 25 80-acre fields each year
Residence Time
Birth to age 30 Birth to age 70 Male Female Male Female
Mean 01022 01001 01892 01829 Std Deviation 00514 00515 00926 00959
Percentile 5 0042 004 0078 0071
10 0048 0047 0091 0084 25 0063 0061 012 0111 50 009 0087 0168 0159 75 0129 0128 0238 0233 90 0176 0174 0319 0319 95 0204 0201 0373 0371
975 0228 0227 0416 0423 99 0262 0257 0481 0481
13
___________________________________________________________________________
Table 9 Lifetime average daily dose (ugkgday) of 13-D inhaled by residents living 200 m from treated fields in an area where Telone is applied to a total of 25 80-acre fields each year
Residence Time
Birth to age 30 Birth to age 70 Male Female Male Female
Mean 00996 00973 01846 0178 Std Deviation 00501 00499 00901 00932
Percentile 5 0039 0038 0073 0067
10 0046 0044 0087 008 25 0061 006 0116 0108 50 0088 0086 0165 0156 75 0127 0124 0234 0227 90 0171 0168 0311 0307 95 0199 0196 036 0363
975 0222 022 0408 0414 99 0253 0248 0458 0465
Table 10 Lifetime average daily dose (ugkgday) of 13-D inhaled by residents living 500 m from treated fields in an area where Telone is applied to a total of 25 80-acre fields each year
Residence Time
Birth to age 30 Birth to age 70 Male Female Male Female
Mean 0084 00818 01577 01498 Std Deviation 00423 00419 00772 00781
Percentile 5 0034 0033 0065 0059
10 004 0039 0076 0069 25 0053 0051 0101 0093 50 0074 0071 014 013 75 0106 0103 0198 0189 90 0144 0141 0265 0259 95 0169 0167 031 0305
975 0191 0189 0352 0352 99 0216 0212 04 04
14
Table 11 Average daily dose (ugkgday) of 13-D inhaled by residents during the 62-day period of highest Telone use in an area where Telone is applied to a total of 25 80-acre fields each year
Age Group
lt 1 1 lt 2 2 lt 3 3 lt 6 6 lt 9 Male Female Male Female Male Female Male Female Male Female
Mean 02499 02707 15513 16841 13685 14366 11103 11467 10548 10651 Std Deviation 02270 02431 10419 11219 09039 09243 07460 07561 06797 06863
Percentile 5 0045 0050 0470 0520 0422 0464 0333 0361 0330 0326
10 0058 0065 0558 0616 0501 0549 0399 0426 0397 0395 25 0098 0108 0770 0841 0691 0750 0553 0589 0558 0560 50 0173 0192 1207 1308 1070 1134 0869 0904 0849 0863 75 0321 0343 2052 2244 1815 1897 1466 1507 1367 1396 90 0539 0590 3126 3385 2738 2804 2242 2249 2050 2038 95 0714 0789 3750 4047 3260 3375 2659 2731 2464 2474
975 0903 0966 4233 4530 3667 3821 3010 3137 2783 2880 99 1125 1183 4711 5124 4108 4260 3468 3522 3230 3296
9 lt 12 12 lt 15 15 lt 18 18lt 25 25 lt 70 Male Female Male Female Male Female Male Female Male Female
Mean 07953 07730 06536 05394 05300 04984 05297 04964 04809 04414 Std Deviation 05168 04897 04050 03320 03172 02980 02904 02913 02688 02840
Percentile 5 0239 0237 0208 0172 0176 0164 0188 0164 0167 0132
10 0291 0292 0254 0209 0214 0196 0228 0200 0201 0164 25 0417 0412 0360 0295 0298 0278 0314 0284 0281 0236 50 0645 0635 0545 0453 0447 0419 0459 0422 0416 0362 75 1029 1007 0835 0694 0676 0645 0676 0637 0618 0567 90 1529 1455 1209 0998 0977 0917 0930 0904 0848 0830 95 1870 1767 1457 1207 1171 1103 1103 1085 1018 1022
975 2118 2080 1713 1413 1338 1279 1267 1252 1166 1190 99 2496 2341 2020 1645 1568 1450 1468 1433 1342 1382
15
Table 12 Average daily dose (ugkgday) of 13-D inhaled during the 62-day period of highest Telone use by residents living 100 m from fields in an area where Telone is applied to a total of 25 80-acre fields each year
Age Group
lt 1 1 lt 2 2 lt 3 3 lt 6 6 lt 9 Male Female Male Female Male Female Male Female Male Female
Mean 04940 05352 30723 33330 26876 27770 21802 22126 19918 19861 Std Deviation 03548 03830 14181 15406 12335 12549 10277 10370 09528 09564
Percentile 5 0118 0128 1368 1490 1206 1263 0942 0968 0852 0833
10 0152 0166 1545 1672 1347 1418 1069 1098 0969 0965 25 0238 0258 1924 2096 1697 1757 1366 1393 1255 1254 50 0395 0425 2710 2949 2360 2470 1918 1960 1760 1766 75 0641 0699 4008 4347 3502 3620 2833 2868 2545 2529 90 0976 1076 5137 5567 4481 4594 3657 3725 3371 3371 95 1217 1331 5792 6272 5021 5177 4158 4258 3831 3879
975 1450 1563 6306 6950 5536 5720 4615 4647 4261 4271 99 1680 1784 6915 7610 6021 6204 5033 5157 4801 4847
9 lt 12 12 lt 15 15 lt 18 18lt 25 25 lt 70 Male Female Male Female Male Female Male Female Male Female
Mean 14857 14065 11533 09575 09336 08872 08833 08610 08063 08020 Std Deviation 07344 06874 05796 04659 04444 04134 03970 04030 03694 04061
Percentile 5 0603 0573 0464 0396 0393 0379 0383 0359 0350 0305
10 0701 0667 0539 0459 0454 0438 0447 0422 0405 0366 25 0923 0890 0723 0610 0599 0571 0584 0558 0526 0499 50 1314 1244 1020 0849 0833 0792 0802 0770 0733 0704 75 1899 1795 1456 1209 1184 1126 1111 1091 1007 1034 90 2530 2389 1927 1605 1549 1481 1436 1433 1316 1382 95 2925 2770 2287 1863 1809 1695 1662 1661 1524 1604
975 3280 3076 2623 2102 2000 1867 1841 1818 1725 1790 99 3678 3463 3033 2434 2278 2101 2083 2029 1922 2018
16
Table 13 Average daily dose (ugkgday) of 13-D inhaled during the 62-day period of highest Telone use by residents living 200 m from fields in an area where Telone is applied to a total of 25 80-acre fields each year
Age Group
lt 1 1 lt 2 2 lt 3 3 lt 6 6 lt 9 Male Female Male Female Male Female Male Female Male Female
Mean 04605 05018 28772 31305 25168 26084 20439 20856 18713 18739 Std Deviation 03227 03596 13044 14290 11309 11633 09438 09779 08750 08917
Percentile 5 0112 0117 1229 1308 1089 1124 0851 0854 0758 0745
10 0139 0155 1382 1492 1222 1278 0978 0986 0895 0871 25 0219 0243 1778 1935 1568 1633 1265 1293 1169 1170 50 0374 0401 2647 2865 2324 2404 1865 1887 1700 1694 75 0607 0664 3775 4152 3289 3433 2687 2734 2426 2428 90 0906 0998 4704 5195 4114 4278 3387 3499 3103 3164 95 1112 1238 5266 5730 4585 4726 3771 3915 3536 3593
975 1300 1441 5770 6269 5016 5128 4206 4249 3908 3920 99 1534 1688 6289 6837 5542 5607 4605 4696 4281 4346
9 lt 12 12 lt 15 15 lt 18 18lt 25 25 lt 70 Male Female Male Female Male Female Male Female Male Female
Mean 13973 13308 10879 09069 08808 08389 08368 08156 07646 07564 Std Deviation 06736 06511 05331 04368 04053 03864 03650 03789 03405 03774
Percentile 5 0539 0511 0423 0356 0362 0348 0358 0328 0322 0284
10 0648 0604 0501 0423 0424 0405 0419 0390 0376 0336 25 0872 0824 0679 0567 0570 0530 0554 0523 0503 0462 50 1254 1199 0982 0819 0799 0766 0779 0745 0706 0675 75 1816 1723 1388 1170 1128 1081 1064 1044 0961 0984 90 2351 2273 1816 1521 1439 1382 1328 1350 1231 1286 95 2687 2563 2107 1726 1643 1579 1522 1527 1409 1483
975 2965 2847 2365 1940 1850 1741 1692 1704 1581 1659 99 3358 3142 2680 2170 2043 1922 1877 1904 1767 1851
17
Table 14 Average daily dose (ugkgday) of 13-D inhaled during the 62-day period of highest Telone use by residents living 500 m from fields in an area where Telone is applied to a total of 25 80-acre fields each year
Age Group
lt 1 1 lt 2 2 lt 3 3 lt 6 6 lt 9 Male Female Male Female Male Female Male Female Male Female
Mean 02906 03157 18121 19672 15953 16652 12951 13295 12146 12220 Std Deviation 01948 02105 07170 07709 06263 06341 05264 05343 04984 05174
Percentile 5 0078 0085 0934 1024 0826 0878 0655 0659 0588 0584
10 0099 0107 1041 1141 0920 0977 0724 0750 0671 0666 25 0147 0161 1257 1387 1111 1185 0892 0940 0840 0842 50 0242 0264 1653 1777 1457 1523 1180 1209 1114 1116 75 0378 0413 2232 2419 1974 2044 1596 1633 1494 1494 90 0550 0592 2797 3022 2460 2547 2028 2059 1897 1936 95 0674 0724 3194 3462 2803 2891 2301 2344 2167 2204
975 0809 0878 3536 3831 3097 3174 2574 2652 2438 2478 99 0957 1046 3922 4256 3424 3539 2853 2981 2705 2881
9 lt 12 12 lt 15 15 lt 18 18lt 25 25 lt 70 Male Female Male Female Male Female Male Female Male Female
Mean 09136 08829 07399 06103 05984 05640 05913 05588 05364 05024 Std Deviation 03929 03854 03262 02660 02473 02308 02375 02331 02169 02240
Percentile 5 0418 0399 0330 0285 0280 0274 0280 0264 0254 0223
10 0481 0463 0381 0324 0321 0310 0327 0305 0292 0258 25 0621 0603 0501 0418 0418 0392 0415 0385 0373 0336 50 0841 0805 0677 0556 0557 0517 0553 0516 0501 0455 75 1127 1084 0917 0749 0732 0689 0724 0689 0658 0624 90 1458 1401 1188 0961 0927 0877 0908 0872 0833 0813 95 1674 1633 1373 1129 1069 1009 1044 0999 0947 0922
975 1843 1818 1532 1256 1208 1112 1175 1101 1055 1031 99 2078 2087 1729 1481 1323 1276 1306 1277 1190 1210
18
___________________________________________________________________________
___________________________________________________________________________
INPUT VARIABLES FOR EXPOSURE SIMULATION
Air concentrations
Table 15 gives the probability distributions of air concentrations (in ugm3) used as input in the exposure simulations The first column gives percentiles of the distribution interpolated from a four-parameter logistic curve fit to the original Calhoun et al frequency distribution The interpolated concentrations were adjusted by factors developed by the Environmental Monitoring Branch of DPR (Johnson 1994b) shown in the second column Environmental Monitoring did additional modeling with ISCST to develop an adjustment to approximate the effect of using a 36-point-per-section spatial grid to model air concentrations instead of the relatively coarse 1-point-per-section grid used by Calhoun et al The effect of the adjustment is to increase the variability of the air concentrations while the mean level is unchanged The adjusted concentrations appear in the third column These adjusted values reflecting annual average daily concentrations for points on a 36-point-per-section grid were used for the estimation of lifetime average exposure
Table 15 Air concentration (ugm3) probability distributions used in exposure simulation
Concentrations Adjustment Adjusted Adjusted interpolated from 4shy factors to concentrations concentrations parameter logistic approximate used to estimate used to estimate
Percentile curvea 36-point gridb lifetime exposure 62-day exposure
00001 0103842 069359 0072024 0278587 001 0106063 084461 0089582 0346503 01 0128835 093182 0120051 0464356 02 0160687 096331 0154791 0598731 03 0201575 098483 0198517 0767865 04 0254546 100283 0255267 0987372 05 0323879 101963 0330237 1277356 06 0415684 103671 0430944 1666892 07 0538854 105566 0568846 2200298 08 0706593 107924 0762583 2949673 09 0938983 111571 1047632 4052242 095 1088601 115040 1252327 4844000 099 1228987 123092 1512784 5851450 0999 1263482 135000 1705701 6597652 09999 1266995 149000 1887822 7302097
a Curve fit to high-end air concentration frequency distribution in Calhoun et al (1994) b Johnson (1994b)
19
Seasonal exposure was estimated for July-August the period of historically highest Telone use To estimate average daily concentrations for this 62-day period the adjusted annual concentrations were modified as follows In the Calhoun et al simulation all positive air concentrations occurred in two 74shyday periods (60 days of Telone use plus 14 additional days for the material to dissipate) one in spring and the other in summer In their simulation 707 of the total Telone was applied during the summer use period with 40 mass loss to air In the spring period 293 of the Telone was applied with a mass loss rate of 25 To approximate the average daily concentrations during the summer period the fraction of the annual concentration contributed by the summer period was assumed to be (707 x 40) [(707 x 40) + (293 x 25)] = 0794 This fraction was condensed into 74 days by multiplying by 36574 Since actual Telone applications will probably not be restricted to the four months assumed by Calhoun et al historical use patterns were consulted Pesticide use reporting data showed that in 1988 and 1989 585 and 499 respectively of 13-D applied to carrots in Kern County was applied during July and August The simulation summer-period concentrations were further modified to represent concentrations for the 62 days of July-August by multiplying by (585 707) x (7462) The net effect was to multiply the annual concentrations by 3868 The concentrations thus modified shown in the fourth column of Table 15 were used for the estimation of seasonal exposure
For both lifetime and seasonal exposure assessments the average air concentration experienced by each person was simulated by randomly selecting five values from the relevant air distribution These values represented five locations where the individual spent his or her time A weighted average of the five concentrations weighted by the proportion of time spent at each location was used as the air concentration experienced by the individual The same five locations were used throughout a persons life but the division of time between them changed as a function of age The division of time between locations was a random variable in the simulation and is discussed in the section on individual mobility
To estimate exposure to persons living close to fields additional modeling with ISCST was done by the Environmental Monitoring Branch to provide annual average daily air concentrations at 100-meter increments from edges of treated fields (Johnson 1994a) The probability distributions of concentrations at 100 200 and 500 meters which were used in this exposure assessment are given in Table 16 In calculating the average concentration experienced by a person the first location selected at which the greatest portion of time is spent was considered the home location The concentration for the home location was simulated by selecting one value from eg the 100-meter distribution and one from the general distribution then calculating a weighted average with the two values weighted one-third and two-thirds respectively to reflect the fact that a field is treated only once in three years The two values were chosen to have a rank order correlation coefficient of 080 based on an observed correlation of 086 between ambient concentrations in the same township from year to year (personal communication Bruce Johnson Environmental Monitoring Branch DPR June 22 1994) For seasonal exposures the home concentration was simply a value from the relevant distance distribution This home location concentration was then used as described in the preceding paragraph in the calculation of the average concentration over five locations
20
___________________________________________________________________________
________________________________________________________________________________
Table 16 Annual average air concentrations (ugm3) at specified distances from treated fieldsa
Percentile 100 meters 200 meters 500 meters
000333 035393 030113 024996 001 037037 031439 026472 005 046011 040619 029312 01 050768 044753 031998 015 055763 048264 035456 02 058246 051404 036323 025 060290 055147 037940 03 064604 058207 038904 035 070250 062520 040306 04 077585 074610 041207 045 087638 085215 045127 05 090497 090723 049474 055 097657 096199 055052 06 105653 102253 057466 065 117366 117403 062218 07 131421 125398 067783 075 143991 134267 075510 08 154023 142689 079173 085 163177 151078 083575 09 175806 159046 087488 095 195317 178902 099410 099 220345 198031 127958 099667 226113 204338 135822
a Johnson (1994a)
21
________________________________________________________________________________
________________________________________________________________________________
Individual mobility within the Telone use area
Individuals were assumed to divide their total time between five randomly selected locations within the Telone high-use area The average air concentration to which an individual is exposed was calculated as described above as the mean of the five location concentrations weighted by the proportion of time spent in each location The mean division of time between locations was derived for each age interval from Table 45 in the Arabrsquos Survey of Childrens Activity Patterns (Wiley 1991a) and Table 33 in Activity Patterns of California Residents (Wiley 1991b) Wileys time at home was used as the time spent in the first selected location his time in transit was divided equally between two locations and the remaining time in the day divided between two others The division of time between these last two locations was 7030 for infants stepping down by age interval to a 5050 division for adults Individual time divisions were allowed to vary from the mean by randomly generating them from a multinomial distribution with n chosen to give fairly small variability in the youngest intervals and greater variability in the adolescent and adult intervals The distributions for time division are shown in Table 17
Table 17 Probability distributions of time spent in five locations
Multinomial Age n Average minutes per day spent in location
interval parameter 1 2 3 4 5
0 to 1 100 Male 1157 27 27 160 69 Female 1151 38 38 150 63
1 to 2 100 Male 1157 27 27 160 69 Female 1151 38 38 150 63
2 to 3 90 Male 1134 31 31 170 74 Female 1099 44 44 151 102
3 to 6 90 Male 1134 31 31 170 74 Female 1099 44 44 151 102
6 to 9 80 Male 1044 59 30 170 137 Female 1021 27 26 256 110
9 to 12 80 Male 1020 31 31 250 108 Female 968 47 46 265 114
12 to 15 70 Male 893 61 60 256 170 Female 917 49 49 255 170
15 to 18 70 Male 893 61 60 256 170 Female 917 49 49 255 170
18 to 25 60 Male 782 75 74 255 254 Female 862 60 60 229 229
25 to 70 60 Male 798 60 59 262 261 Female 960 51 51 189 189
22
Breathing rates
An individuals average breathing rate in each age interval was calculated as a weighted average of his rates at each of four activity levels resting light moderate and heavy The rate at each level was weighted by the proportion of time the individual was assumed to spend at that level Breathing rate at each activity level was a random variable The proportion of time at each level was a constant fixed for each age interval
For infants (0-1 year) a triangular distribution of breathing rates was derived from the mean and range reported in the Exposure Factors Handbook Table 3A-2 (USEPA 1990) The mode of the triangular distribution was set equal to the lower limit of the range in order to match the EPA mean For the other age intervals uniform distributions were derived from data in the ARBs Measurement of Breathing Rate and Volume (Adams 1993) In each case the range was chosen to include all the reported rates relevant to an activity level for a specific sex and age group These ranges are given in Table 18 Data were unavailable for children aged 1-3 so the breathing rates for 3-6-year-olds were used The breathing rates of an individual at different activity levels within and across ages were assumed to have the rank order correlations shown in Table 19 (The value of 08 on the diagonal represents the correlation between breathing rates of the same individual at the same activity level at different ages) It was not possible to incorporate correlations between body weight and breathing rates because the software used did not handle them correctly Correlation coefficients of body surface area and breathing rate within age intervals and activity levels reported in Adams (1993) ranged from 006 to 084 with a mean of 040 The correlation of body weight and breathing rate may be similar The effect of omitting this correlation from the simulation was probably to increase the estimated exposures to an unknown degree because if the greater exposures associated with high breathing rates tended to be paired with high body weights the exposure would be mitigated somewhat
The proportion of time assumed to be spent at each activity level is shown in Table 20
Body weight
Body weight distributions were taken directly from Tables 5A-1 through 5A-4 in the Exposure Factors Handbook (USEPA 1990) The histograms reported in these tables were used without smoothing Upper and lower bounds were supplied to produce a mean weight equal to the mean given in the EPA tables An individuals weights in different age intervals were assumed to have the rank order correlations shown in Table 21
Residence time and lifetime
In estimating lifetime exposures lifetime length was fixed at 70 years Exposure was estimated separately for fixed times of residence in the Telone use area of 30 and 70 years Since the exposure assessment is viewed as applying to any areas where Telone may be reintroduced in the proposed way and not just to the specific township in Kern County for which Calhoun et al modeled air concentrations it was not reasonable to define a distribution of residence time in the area Instead the estimated exposures are those expected to result from living the first 30 or 70 years of a 70-year lifetime in any area with Telone use like that described here
23
________________________________________________________________________________
________________________________________________________________________________
Table 18 Breathing rates (Lmin) as ranges of uniform distributions
Age interval Activity level Male Female
0 to 1 All Triangular ( 025 025 209 ) 1 to 2 Resting 5-7
Light 7-11 Moderate 8-15 Heavy 14-22
2 to 3 Resting 5-7 Light 7-11 Moderate 8-15 Heavy 14-22
3 to 6 Resting 5-7 Light 7-11 Moderate 8-15 Heavy 14-22
6 to 9 Resting 5-9 Light 10-17 Moderate 11-23 Heavy 20-45
9 to 12 Resting 5-9 Light 10-17 Moderate 11-23 Heavy 20-45
12 to 15 Resting 6-12 5-10 Light 7-17 7-15 Moderate 17-35 15-27 Heavy 25-72 24-59
15 to 18 Resting 6-12 5-10 Light 7-17 7-15 Moderate 17-35 15-27 Heavy 25-72 24-59
18 to 25 Resting 7-11 5-10 Light 8-18 6-15 Moderate 18-42 15-28 Heavy 48-80 39-62
25 to 70 Resting 7-11 5-10 Light 8-18 6-15 Moderate 18-42 15-28 Heavy 48-80 39-62
24
________________________________________________________________________________
_____________________________________________________________________________
________________________________________________________________________________
________________________________________________________________________________
Table 19 Rank order correlation coefficients between individuals breathing rates at different activity levels within and across age intervals
Resting Light Moderate Heavy Resting 08 05 05 04 Light 08 05 04 Moderate 08 05 Heavy 08
Table 20 Proportion of time at each activity level (constant in exposure simulation)
Age Activity level interval
Resting Light Moderate Heavy
0 to 1 Male 1 0 0 0 Female 1 0 0 0
1 to 2 Male 08 015 004 001 Female 08 015 004 001
2 to 3 Male 075 02 004 001 Female 075 02 004 001
3 to 6 Male 07 02 008 002 Female 07 02 008 002
6 to 9 Male 07 017 010 003 Female 07 02 008 002
9 to 12 Male 06 032 005 003 Female 06 033 005 002
12 to 15 Male 06 032 005 003 Female 06 033 005 002
15 to 18 Male 05 04 006 004 Female 05 042 005 003
18 to 25 Male 04 050 006 004 Female 04 052 005 003
25 to 70 Male 035 057 005 003 Female 035 060 004 001
25
________________________________________________________________________________
_______________________________________________________________________________
Table 21 Rank order correlation coefficients between the weights of an individual at different ages
0 to 1 1 to 2 2 to 3 3 to 6 6 to 9 9 to 12 12 to 15 15 to 18 18 to 25 25 to 70
0 to 1 100 092 082 072 061 061 061 061 061 061 1 to 2 100 092 082 072 061 061 061 061 061 2 to 3 100 092 082 072 061 061 061 061 3 to 6 100 092 082 072 061 061 061 6 to 9 100 092 082 072 061 061 9 to 12 100 092 082 072 061 12 to 15 100 082 082 072 15 to 18 100 082 082 18 to 25 100 082 25 to 70 100
Exposure appraisal
The estimated exposure distributions may be regarded as providing a reasonable idea of the highest exposures that should be expected under the use scenario The distributions should not be interpreted as reflecting the exposures of a population of individuals but as a set of values that are likely to bracket the exposure of an individual in this situation
It should be noted that the large differences between estimated seasonal exposures of children less than one and children from one to three are largely produced by the input breathing rate distributions The breathing rate data for infants under one came from a different source than all the other breathing rate data In addition no data were available for children from one to three so the rates for three- to six-year-old children were used In combination with the small body size of these children this may have overestimated their exposures
An important limitation of this exposure assessment is that it used 13-D concentrations in outdoor air to estimate 24-hourday exposure even though most people spend the greatest part of the day indoors Since the registrant provided no data on indoor concentrations and since no appropriate surrogate data were available to estimate them it was judged that there was no alternative
It is important to remember that these estimates of non-occupational exposure apply only to the use scenario of Calhoun et al which specified Telone applications to only 2000 acres per year in an area which has 8500 acres of carrots alone Any change in the use scenario would require a new exposure assessment
26
REFERENCES
Adams WC 1993 Measurement of breathing rate and volume in routinely performed daily activities Final report contract no A033-205 Research Division California Air Resources Board Sacramento CA
Albrecht WN 1987 Occupational exposure to 13-dichloropropene (Telone II) in Hawaiian pineapple culture Arch Environ Health 42286-290
Brouwer DH Brouwer EJ de Vreede JAF van Welie RTH Vermuelen NPE and van Hemmen JJ 1991 Inhalation exposure to 13-dichloropropene in the Dutch flower-bulb culture Part I Environmental monitoring Arch Environ Contam Toxicol 201-5
Calhoun LL Fontaine DD Stuart BL and Landenberger BD 1994 13shydichloropropene (13-D) An assessment of implied exposure and risk for the proposed commercial reentry of TELONE soil fumigant into California Dow Chemical Co Midland MI
California Department of Food and Agriculture 1988 Report of pesticides sold in California in 1987 Pesticide Use Enforcement Branch California Department of Food and Agriculture Sacramento CA
Climie IJG Hutson DH Morrison BJ and Stoydin G 1979 Glutathione conjugation in the detoxification of (Z)-13-dichloropropene (a component of the nematicide D-D) Xenobiotica 9149-156
Cohen B-S M and Poppendorf W 1989 A method for monitoring dermal exposure to volatile chemicals Am Ind Hyg Assoc J 50 216-223
Cook RE 1983 Fumigators exposure to airborne 13-dichloropropene during fumigation operation of Telone II soil fumigant Driscoll Citrus Service Inc Fort Pierce Florida Unpublished report of the Dow Chemical Chemical Company Industrial Hygiene Laboratory Midland MI January 4 1983
Davies DB and Fraser PA 1988 Evaluation of potential operator fieldworker and bystander exposure to 13-dichloropropene as a result of tobacco field fumigation with Telone II soil fumigant in southwestern Ontario (Canada) May-June 1985 CDFA Reg Doc No 50046-039
Dietz FK Hermann EA and Ramsey JC 1984a The pharmacokinetics of 14C-13shydichloropropene in rats and mice following oral administration The Toxicologist 4 Abstr No 585
Dietz FK Dittenber DA Krik HD and Ramsey JC 1984b Non-protein sulfhydryl content and macromolecular binding in rats and mice following oral administration of 13shydichloropropene The Toxicologist 4 Abstr No 586
Fisher GD and Kilgore WW 1988a Tissue levels of glutathione following acute inhalation of 13-dichloropropene J Toxicol Environ Health 23171-182
Fisher GD and Kilgore WW 1988b Mercapturic acid excretion in rats following 13shydichloropropene inhalation exposure Fund Appl Toxicol 11 303-307
27
Fisher GD and Kilgore WW 1989 Pharmacokinetics of S-[3-chloroprop-2shyenyl]glutathione in rats following acute inhalation exposure to 13-dichloropropene Xenobiotica 19269-278
Fong HR and Maykoski R 1985 Air exposure monitoring of EHAP personnel during a Telone II soil translocation study in Fresno County CDFA Rpt HS 1299
Houtman BA 1992 Managing worker exposure 13-D in California
Houtman BA 1993 An evaluation of 13-dichloropropene worker exposure associated with Telone II soil fumigant loading application and reentry phase I ECL92095 (interim report)
Hutson DH Moss JA and Pickering BA 1971 The excretion and retention of components of the soil fumigant D-D and their metabolites in the rat Food Cosmet Toxicol 9 677-680
Johnson B 1994a Memorandum to John Sanders June 20 1994 on buffer zone calculations for 13-D in Kern County Environmental Monitoring and Pest Management Branch Department of Pesticide Regulation Sacramento CA
Johnson B 1994b Memorandum to Kean Goh May 16 1994 on estimated adjusted air concentration percentiles based on Dow simulation results for T29R26 Environmental Monitoring and Pest Management Branch Department of Pesticide Regulation Sacramento CA
Maddy KT Cusick B Richmond D 1980 Studies concerning the field application of Telone and DD in California in 1979 and the ambient air concentration of these pesticides during and following application by shank injection into soil in fields CDFA Rpt HS 686
Maddy KT Schneider F and Fredrickson S 1982 Monitoring of Telone II during and following experimental application by shank injection to established trees and grape vines in California in 1980-1981 CDFA Rpt 967
NIOSHOSHA Occupational Safety and Health Guidelines for Chemical Hazards 1988 DHHS (NIOSH) Publication No 81-1231981 and supplements Publication Nos 88-118 and 89-104
Osterloh JD Cohen BS Poppendorf W and Pond SM 1984 Urinary excretion of the N-cysteine conjugate of cis-13-dichloropropene by exposed individuals Arch Environ Health 39 271-275
Osterloh JD Wang R OConnell L Jacob III P and Maddy KT 1989a Pilot study for biological monitoring of 13-dichloropropene In Biological Monitoring of Pesticide Exposure RG Wang CA Franklin RC Honeycutt and JC Reinert (eds) Amer Chem Soc Soc Symp Ser No 382 215-230
Osterloh JD Wang R Schneider F and Maddy K 1989b Biological monitoring of dichloropropene Air concentrations urinary metabolite and renal enzyme excretion Arch Environ Health 44 207-213
Owen WJ and DeRouen TA 1980 Estimation of the mean for lognormal data containing zeroes and left-censored values with applications to the measurement of worker exposure to air contaminants Biometrics 36 707 719
28
Palisades Corporation 1992 RISK Risk analysis and simulation add-in for Microsoft Excel Release 11 users guide 31 Decker Rd Newfield NY 14867
Poppendorf W Leffingwell JT and Cohen B 1983 Development of methods and procedures for the assessment of occupational health risks in the application and use of nematicides in California CDFA Rpt HS 1162
Shapiro SS and Wilk MB 1965 An analysis for normality (complete samples) Biometrika 52 591-611
Stott WT and Kastl PE 1986 Inhalation pharmacokinetics of technical grade 13shydichloropropene Toxicol Appl Pharmacol 85 332-341
Stott WT 1992 Letter to J R Sanborn August 11 1992
Tobol HK and Axe FD 1982 Airborne concentrations of 13-dichloropropene during fumigation of established grapevines almond trees and peach trees California December 1980-January 1981 Unpublished report of the Dow Chemical Company Environmental ServicesIndustrial Hygiene Western Division Dow Chemical USA Report No HeRW-AG(8)
US EPA 1990 Exposure factors handbook EPA6008-89043 Office of Health and Environmental Assessment Washington DC
Van Welie RTH van Duyn P Brouwer DH van Hemmen JJ Brouwer EJ and Vermuelen NPE 1991 Inhalation exposure to 13-dichloropropene in the Dutch flower-bulb culture Part II Biological monitoring by measurement of urinary excretion of two mercapturic acid metabolites Arch Environ Contam Toxicol 206-12
Waechter JM Brazak KA McCarty LP LaPack MA and Brownson 1992 13shydichloropropene (Telone II Soil Fumigant) Inhalation pharmacokinetics and metabolism in human volunteers DowElanco (Interim Report) Laboratory Project Study ID M-002993-023
Wagner CP 1987 Industrial source complex (ISC) dispersion model users guide 2nd edition (revised) Vol I US Environmental Protection Agency Report No EPA-4054-88shy002 a
Wiley JA 1991a Study of childrens activity patterns Final report contract no A733-149 Research Division California Air Resources Board Sacramento CA
Wiley JA 1991b Activity patterns of California residents Final report contract no A6-177shy33 Research Division California Air Resources Board Sacramento CA
29

___________________________________________________________________________
___________________________________________________________________________
___________________________________________________________________________
___________________________________________________________________________
WORKER EXPOSURE
Inhalation
Worker inhalation exposure assessed by breathing zone measurements during loading application or equipment repair are summarized in Table 2
Table 2 Breathing zone air concentrations of workers handling 13-dichloropropene during loading and application
ppm Reference Date
037a Davies and Fraser 1988 004-040 Tobol and Axe 1982b
038a Maddy et al 1980 071a Maddy et al 1982 017a Fong and Maykoski 1985 lt10a Albrecht 1987 lt02a Cook 1982b
a Time-weighted average b Cited by Davies and Fraser (1988)
These studies suggest that workers are exposed to time-weighted average levels that are below the recommended 1 ppm Permissible Exposure Limit set by the Occupational Safety and Health Administration
Since concentrations were measured in the workers breathing zones while they performed a variety of tasks (some loaded and some applied others loaded or applied and some unspecified) the reported inhalation exposure results from a composite of work tasks The individual studies did not always report exposures by task nor did they report any more than TWA values or monitoring results making it difficult to obtain an absorbed dose for each work task
Table 3 Potential inhalation exposure for 13-dichloropropene estimated from reported breathing zone concentrations assuming a respiratory rate of 29 Lmin
Study mg8-hr day
Poppendorf et al(1983) 1423 Maddy et al (1980) 240 Maddy et al(1982) 448 Fong and Maykoski(1985) 108 Davies and Fraser (1988) 233 Cook(1983) 126 Albrecht1987) 631
Geometric Mean 315
6
___________________________________________________________________________
___________________________________________________________________________
The air monitoring results of several studies have been converted to potential inhalation exposures in mg8-hr day by assuming a respiration rate of 29 Lmin (Table 3) The geometric mean of these data is reported because the data are log-normally distributed (Shapiro and Wilk 1965) It is conventional to treat exposure data by this statistical method as it allows the use of all the environmental or exposure data that may be widely variant (Owen and DeRouen 1980) If the mean for potential inhalation exposure from breathing zone measurements is mitigated by a respirator (90 reduction in exposure) corrected for respiratory uptake (78 Waechter et al 1992)) and a 70-kg person is assumed then the ADD (Absorbed Daily Dosage) is 351 ugkgday
Hand Exposure
The data available on potential hand exposure to 13-D are conflicting Maddy et al (1980 1982) reported hand a contamination level of 164 ughr for workers wearing gloves The other data on hand exposure (Table 4) were taken from the work of Davies and Fraser (1988) on an application of 13-D in Canada The range of the data for the eight individuals hand residues was 01-570 mghr with a geometric mean of 97 mghr
Table 4 Hand exposure to 13-dichloropropene during loadinga
Worker mghr
1 14 2 08 3 265 4 193 5 570 6 07 7 333 8 01
Geometric Mean 97
a Davies and Fraser (1988)
This exposure value for the hand of 97 mghr is almost 600-fold greater than that reported by Maddy (1982) The reasons for this large difference may be in the experimental design In the Davies and Fraser (1988) study the protocol was a cotton glove-polyethylene glove (1 mm)-cotton glove arrangement where the inner cotton gloves were analyzed for 13-D The inner glove provides an absorptive sink whereas the outer glove compared to the smooth protective glove normally worn provides a sponge for liquid 13-D for eventual penetration through the thin polyethylene glove This type of thin glove (polyethylene) is not normally utilized in application of this material as it would not withstand the physical abuse of daily operations during loading the fumigant into the tanks It is likely that in the studies of Maddy et al (1982) where hand residues were monitored under normal work conditions that thicker gloves were worn Further Maddy suggests that hand washes may not be an effective means for the removal of residues because some evaporation may have occurred as well as some dermal absorption Even so the analysis of hand washes in the work reported by Maddy et al reported microgram amounts of 13-D rather than the milligram amounts in the work of
7
_____________________________________________________________________
_____________________________________________________________________
Davies and Fraser While the Maddy data is very likely an underestimate of dermal exposure the dermal estimates of Davies and Fraser are overestimates due to the experimental design Since the hand exposure values are for 12 hrsday (estimated daily loading time) the dermal component becomes a minor contributor of the overall human exposure which is primarily via inhalation
Annual and Lifetime Exposure Days
Estimates of worker exposure time are provided by the US EPA Data Call-In for handlers of 13-D in crops grown in California that have been treated with 13-D (Houtman 1992) This survey provided information on the number days per year for each crop that 13-D was handled for applicators and loaders in California (Table 5 ) The maximum number of days per career was estimated to be 270 The number of days per career ranged from a low of 24 for potatoes to a high of 270 for brassica It is possible that the same individuals applying for brassica could be applying in vegetables which could mean that an individuals exposure days per year or career could be as high as the total for all crops However it is likely to be much less because the calendar window for application to each crop prevents any one person from working all of them
Table 5 Annual and lifetime handling days for loaders (L) applicators (A) and repairs (R)
Tomato Potato Cotton Vegetables Brassica Beets TreeVine LAR LAR LAR LAR LAR LAR LAR
Annual Custom 162334 444 403626 183524 363636 101010 2298
Grower 111 111 2213 353535 000 111 444
Lifetime Custom 104150221 242424 260234169 108210144 270270270 656565 1988172
Grower 454545 252525 99585 875875875 000 454545 121212
Biological Monitoring
Osterloh et al (1984 1989 a and b) reported human exposure studies with 22 workers loading and applying in which they conducted urinary monitoring for N-acetyl-S-(3-chloroprop-2shyenyl)cysteine (DCPMER) Respiratory protection (half-face) was worn only during loading and not during application An average of 34 mg of DCPMER was excreted in the 24-hour period after exposure Correction for the molecular weight difference between 13-D (111) and DCPMER (237) gives an ADD of 16 mgpersonday or 227 ugkgday Using the data of Davies and Fraser (1988) it is possible to calculate the percentage of the exposure received during application and loading In Davies and Fraser it was determined that 261 percent of the exposure occurred during application 739 during loading Osterloh et al assumed 90 protection from the half-face respirator worn during loading hence the inhaled dose was 01 times the exposure During application 10 (0 respiratory protection) indicates the absence of respirators The absorbed dose for each activity may be found by the following equation
8
Loading Application (739 )(X)(01) + (261)(X)(10) = 227 ugkgday (1)
where X is exposure Solving for X gives 678 ugkgday Putting this value back into equation (1) and adding respiratory protection (half-face respirators) during application gives
Loading Application (739)(678)(01) + (261 )(678)(01) = 68 ugkgday
The value of 68 ugkgday is the expected ADD if half-face respirators are worn during both loading and application
Houtman (1993) monitored five individuals loading or applying 13-D in Washington state The same individual did not do both tasks These applicators and loaders carried out one application per day at a rate of 25 galacre lasting about four hours One application was done without mitigation measures while the others used various mitigation measures specified by the US EPA including dry disconnects (with and without vapor recovery) spill control at the end of the rows and a cab with charcoal-filtered air Houtman collected urinary monitoring data only for the application conducted without mitigation measures To estimate the absorbed daily dose from these unmitigated conditions respiratory protection factors of 09 and 095 for half-face and full-face respirators were used for applicators and loaders respectively The human chamber PBPK exposure study data were used in the absorbed dose calculation These respiratory protection requirements for loaders and applicators were part of the Permit Conditions in California for the flux studies and the Monterey Commercial Use Project These same respiratory protection conditions will be required if 13-D is reinstated in California
The exposure data shown in Table 6 as geometric means have been normalized to an 68shyhour day which is consistent with the data of Davies and Fraser (1988) and allows comparison with the data of Osterloh et al where one person performed both loading and application
Houtman (1993) found that utilizing spill control during application reduced the ambient air concentrations by 79 The urinary metabolite data were adjusted by this factor The absorbed dose was adjusted for the wearing of a one-half face respirator from the unmitigated application in Washington The final adjustment of the data from Washington was the factoring of the reduced rate in California (12 galacre) as compared to the 25 galacre that were used in the studies in Washington The loader exposure data were not adjusted for the reduced rate in California as the exposure occurs primarily during the connecting and disconnection of the hose from the nurse tank and is unrelated to the amount placed in the tank on the tractor
With respect to the estimation of AADD and LADD the range of values for loading and applying were obtained from the crop specific data compiled in Table 5 There are several reasons for the reduced exposure of a combined (one person doing both tasks) load and apply (19 ugkgday) in the Washington study (Houtman 1993) as compared to the earlier combined estimate of Osterloh et al (68 ugkgday) Firstly for the loader the Washington study used dry disconnects and vapor recovery devices For the applicator spill control was used at the end of the rows Each of these mitigation strategies reduces ambient air concentration which resulted in lower estimated exposure value of more than three-fold It is further likely that the soil moisture content will be higher in California than occurred during the applications in Washington This will further reduce emissions
9
_____________________________________________________________________
_____________________________________________________________________
Table 6 ADD AADD and LADD values for loading and application of 13- dichloropropene
Study Task ADD1 Days SADD4 AADD5 Days LADD6
(ugkgd) Year (ugkgd) (ugkgd) Career (ugkgd)
Osterloh et al LoadApply 680
Houtman Load 0733 4 0016 0008 24 69x10-4
40 016 008 270 77x10-3
Apply 1133 4 36
0025 023
0012 011
24 270
11x10-3
12x10-2
Total2 186
1 Absorbed Daily Dosage two load and application cyclesday body weights of study volunteers used in calculations
2 One person doing both loading and applying-for comparison to studies of Osterloh et al 3 Normalized to 68 hrs based on registrant study (Davies and Fraser 1988) for one
person doing both tasks to be compared with Osterloh et al 4 Split application for brassica 90-day window (see Table 5) 5 Annual Average Daily Dosage (365 daysyear) 6 Lifetime Average Daily Dosage 70 years life (25550 days)
Exposure Appraisal
The exposure estimates based on the Houtman (1993) study in which exposures were measured separately for loading and application should be used for the assessment of risk These estimates are based on biological monitoring that assessed both cis- and transshymercapturate metabolites in the urine and utilized the pharmacokinetic information developed from exposure of humans under controlled conditions Hand exposure information developed by previous investigators was not used as this route of exposure would be reflected in the total exposure measured by the biological monitoring
None of the occupational exposure studies in which biological monitoring was conducted employed exactly the mitigation measures that would be required in California These requirements are for full-face respiratory protection during loading and half-face protection during application
NON-OCCUPATIONAL EXPOSURE
Inhalation exposure was estimated for residents of an area where Telone is used in carrot growing Both lifetime and subchronic (seasonal) exposures were estimated for residents of the area in general and for residents with homes at specified distances from Telone-treated fields (100 200 and 500 meters) The estimated lifetime exposure distributions are given in Tables 7 through 10 seasonal exposures in Tables 11 through 14
10
=
The exposure assessment relied on simulated air concentrations from a study provided by the registrant (Calhoun et al 1994) in which the ISCST simulation model (Wagner 1987) was used to predict concentrations of 13-D in air for a scenario of limited reintroduction of Telone IItrade soil fumigant in carrots In the use scenario modeled Telone is applied to 25 80-acre fields (2000 acres total) per year in a 9-township (324-square-mile) area in Kern County Under this scenario there is no other use of Telone All applications are at the rate of 12 gallons per acre and no field is treated more than once in three years Calhoun et al simulated three years of daily air concentrations for one point at the center of each section in the reintroduction area to produce an annual average daily concentration for each point The locations of treated fields were assigned randomly in their model so that concentrations at the section centers vary in part due to being different distances and directions from applications The modeled concentrations thus represent long-term ambient concentrations for the reintroduction area Calhoun et al presented separately the concentrations for the township of highest Telone use within the 9-township area These concentrations were used in the exposure assessment
Probability distributions of exposure were estimated using stochastic simulation (Monte Carlo) methods implemented with the program RISK (Palisades Corporation 1992) The distribution of lifetime average daily dose (LADD) as ug of 13-D inhaled per kg of body weight per day (ugkgday) was estimated separately for persons living 1) the first 30 years of and 2) all of a 70-year lifetime in the reintroduction area Seasonal exposure was estimated for July-August the period of greatest Telone use by adjusting the long-term air concentrations for proportional use and mass loss during that 62-day period Additional simulated air concentrations provided by the Environmental Monitoring Branch (Johnson 1994a) were incorporated to estimate both lifetime and 62-day exposures to residents whose dwellings are close to treated fields Exposure distributions were estimated separately for residents living 100 200 and 500 meters from the edges of treated fields Each estimated exposure distribution is based on a simulation with 10000 trials
LADD (ugkgday) was calculated by the following equation
10
([ ]) i 1
where the summation is over 10 age intervals RTi = number of years in age interval i that the person
resides in the Telone use area Conci = average of air concentrations (ugm3) in 5
locations weighted by the proportion of time spent in each location in interval i
BRi = average breathing rate (m3day) at each of 4 activity levels weighted by proportion of time spent at each level in interval i
BWi = body weight (kg) in interval i and 70 years is the assumed lifetime
LADD = RT Conci x BR BW 70i i i
11
Seasonal exposure (62-day average ugkgday) was calculated separately for each age interval as Conc x BR
Average daily dose = BW
where concentration breathing rate and body weight are as defined above for LADD but with air concentrations modified to approximate seasonal averages as explained in the next section
Concentration breathing rate and body weight were stochastic variables in the exposure simulation model The statistical distributions used to simulate them are described in the sections on specific input variables following Tables 7-14
12
___________________________________________________________________________
Table 7 Lifetime average daily dose (ugkgday) of 13-D inhaled by residents of an area where Telone is applied to a total of 25 80-acre fields each year
Residence Time
Birth to age 30 Birth to age 70 Male Female Male Female
Mean 00800 00783 01510 01436 Std Deviation 00480 00487 00867 00902
Percentile 5 0027 0026 0053 0047
10 0032 0031 0063 0056 25 0044 0042 0087 0078 50 0066 0063 0129 0116 75 0103 0101 0193 0186 90 0150 0148 0277 0270 95 0179 0179 0326 0330
975 --a -- -- -shy99 0230 0236 0425 0444
a not calculated
Table 8 Lifetime average daily dose (ugkgday) of 13-D inhaled by residents living 100 m from treated fields in an area where Telone is applied to a total of 25 80-acre fields each year
Residence Time
Birth to age 30 Birth to age 70 Male Female Male Female
Mean 01022 01001 01892 01829 Std Deviation 00514 00515 00926 00959
Percentile 5 0042 004 0078 0071
10 0048 0047 0091 0084 25 0063 0061 012 0111 50 009 0087 0168 0159 75 0129 0128 0238 0233 90 0176 0174 0319 0319 95 0204 0201 0373 0371
975 0228 0227 0416 0423 99 0262 0257 0481 0481
13
___________________________________________________________________________
Table 9 Lifetime average daily dose (ugkgday) of 13-D inhaled by residents living 200 m from treated fields in an area where Telone is applied to a total of 25 80-acre fields each year
Residence Time
Birth to age 30 Birth to age 70 Male Female Male Female
Mean 00996 00973 01846 0178 Std Deviation 00501 00499 00901 00932
Percentile 5 0039 0038 0073 0067
10 0046 0044 0087 008 25 0061 006 0116 0108 50 0088 0086 0165 0156 75 0127 0124 0234 0227 90 0171 0168 0311 0307 95 0199 0196 036 0363
975 0222 022 0408 0414 99 0253 0248 0458 0465
Table 10 Lifetime average daily dose (ugkgday) of 13-D inhaled by residents living 500 m from treated fields in an area where Telone is applied to a total of 25 80-acre fields each year
Residence Time
Birth to age 30 Birth to age 70 Male Female Male Female
Mean 0084 00818 01577 01498 Std Deviation 00423 00419 00772 00781
Percentile 5 0034 0033 0065 0059
10 004 0039 0076 0069 25 0053 0051 0101 0093 50 0074 0071 014 013 75 0106 0103 0198 0189 90 0144 0141 0265 0259 95 0169 0167 031 0305
975 0191 0189 0352 0352 99 0216 0212 04 04
14
Table 11 Average daily dose (ugkgday) of 13-D inhaled by residents during the 62-day period of highest Telone use in an area where Telone is applied to a total of 25 80-acre fields each year
Age Group
lt 1 1 lt 2 2 lt 3 3 lt 6 6 lt 9 Male Female Male Female Male Female Male Female Male Female
Mean 02499 02707 15513 16841 13685 14366 11103 11467 10548 10651 Std Deviation 02270 02431 10419 11219 09039 09243 07460 07561 06797 06863
Percentile 5 0045 0050 0470 0520 0422 0464 0333 0361 0330 0326
10 0058 0065 0558 0616 0501 0549 0399 0426 0397 0395 25 0098 0108 0770 0841 0691 0750 0553 0589 0558 0560 50 0173 0192 1207 1308 1070 1134 0869 0904 0849 0863 75 0321 0343 2052 2244 1815 1897 1466 1507 1367 1396 90 0539 0590 3126 3385 2738 2804 2242 2249 2050 2038 95 0714 0789 3750 4047 3260 3375 2659 2731 2464 2474
975 0903 0966 4233 4530 3667 3821 3010 3137 2783 2880 99 1125 1183 4711 5124 4108 4260 3468 3522 3230 3296
9 lt 12 12 lt 15 15 lt 18 18lt 25 25 lt 70 Male Female Male Female Male Female Male Female Male Female
Mean 07953 07730 06536 05394 05300 04984 05297 04964 04809 04414 Std Deviation 05168 04897 04050 03320 03172 02980 02904 02913 02688 02840
Percentile 5 0239 0237 0208 0172 0176 0164 0188 0164 0167 0132
10 0291 0292 0254 0209 0214 0196 0228 0200 0201 0164 25 0417 0412 0360 0295 0298 0278 0314 0284 0281 0236 50 0645 0635 0545 0453 0447 0419 0459 0422 0416 0362 75 1029 1007 0835 0694 0676 0645 0676 0637 0618 0567 90 1529 1455 1209 0998 0977 0917 0930 0904 0848 0830 95 1870 1767 1457 1207 1171 1103 1103 1085 1018 1022
975 2118 2080 1713 1413 1338 1279 1267 1252 1166 1190 99 2496 2341 2020 1645 1568 1450 1468 1433 1342 1382
15
Table 12 Average daily dose (ugkgday) of 13-D inhaled during the 62-day period of highest Telone use by residents living 100 m from fields in an area where Telone is applied to a total of 25 80-acre fields each year
Age Group
lt 1 1 lt 2 2 lt 3 3 lt 6 6 lt 9 Male Female Male Female Male Female Male Female Male Female
Mean 04940 05352 30723 33330 26876 27770 21802 22126 19918 19861 Std Deviation 03548 03830 14181 15406 12335 12549 10277 10370 09528 09564
Percentile 5 0118 0128 1368 1490 1206 1263 0942 0968 0852 0833
10 0152 0166 1545 1672 1347 1418 1069 1098 0969 0965 25 0238 0258 1924 2096 1697 1757 1366 1393 1255 1254 50 0395 0425 2710 2949 2360 2470 1918 1960 1760 1766 75 0641 0699 4008 4347 3502 3620 2833 2868 2545 2529 90 0976 1076 5137 5567 4481 4594 3657 3725 3371 3371 95 1217 1331 5792 6272 5021 5177 4158 4258 3831 3879
975 1450 1563 6306 6950 5536 5720 4615 4647 4261 4271 99 1680 1784 6915 7610 6021 6204 5033 5157 4801 4847
9 lt 12 12 lt 15 15 lt 18 18lt 25 25 lt 70 Male Female Male Female Male Female Male Female Male Female
Mean 14857 14065 11533 09575 09336 08872 08833 08610 08063 08020 Std Deviation 07344 06874 05796 04659 04444 04134 03970 04030 03694 04061
Percentile 5 0603 0573 0464 0396 0393 0379 0383 0359 0350 0305
10 0701 0667 0539 0459 0454 0438 0447 0422 0405 0366 25 0923 0890 0723 0610 0599 0571 0584 0558 0526 0499 50 1314 1244 1020 0849 0833 0792 0802 0770 0733 0704 75 1899 1795 1456 1209 1184 1126 1111 1091 1007 1034 90 2530 2389 1927 1605 1549 1481 1436 1433 1316 1382 95 2925 2770 2287 1863 1809 1695 1662 1661 1524 1604
975 3280 3076 2623 2102 2000 1867 1841 1818 1725 1790 99 3678 3463 3033 2434 2278 2101 2083 2029 1922 2018
16
Table 13 Average daily dose (ugkgday) of 13-D inhaled during the 62-day period of highest Telone use by residents living 200 m from fields in an area where Telone is applied to a total of 25 80-acre fields each year
Age Group
lt 1 1 lt 2 2 lt 3 3 lt 6 6 lt 9 Male Female Male Female Male Female Male Female Male Female
Mean 04605 05018 28772 31305 25168 26084 20439 20856 18713 18739 Std Deviation 03227 03596 13044 14290 11309 11633 09438 09779 08750 08917
Percentile 5 0112 0117 1229 1308 1089 1124 0851 0854 0758 0745
10 0139 0155 1382 1492 1222 1278 0978 0986 0895 0871 25 0219 0243 1778 1935 1568 1633 1265 1293 1169 1170 50 0374 0401 2647 2865 2324 2404 1865 1887 1700 1694 75 0607 0664 3775 4152 3289 3433 2687 2734 2426 2428 90 0906 0998 4704 5195 4114 4278 3387 3499 3103 3164 95 1112 1238 5266 5730 4585 4726 3771 3915 3536 3593
975 1300 1441 5770 6269 5016 5128 4206 4249 3908 3920 99 1534 1688 6289 6837 5542 5607 4605 4696 4281 4346
9 lt 12 12 lt 15 15 lt 18 18lt 25 25 lt 70 Male Female Male Female Male Female Male Female Male Female
Mean 13973 13308 10879 09069 08808 08389 08368 08156 07646 07564 Std Deviation 06736 06511 05331 04368 04053 03864 03650 03789 03405 03774
Percentile 5 0539 0511 0423 0356 0362 0348 0358 0328 0322 0284
10 0648 0604 0501 0423 0424 0405 0419 0390 0376 0336 25 0872 0824 0679 0567 0570 0530 0554 0523 0503 0462 50 1254 1199 0982 0819 0799 0766 0779 0745 0706 0675 75 1816 1723 1388 1170 1128 1081 1064 1044 0961 0984 90 2351 2273 1816 1521 1439 1382 1328 1350 1231 1286 95 2687 2563 2107 1726 1643 1579 1522 1527 1409 1483
975 2965 2847 2365 1940 1850 1741 1692 1704 1581 1659 99 3358 3142 2680 2170 2043 1922 1877 1904 1767 1851
17
Table 14 Average daily dose (ugkgday) of 13-D inhaled during the 62-day period of highest Telone use by residents living 500 m from fields in an area where Telone is applied to a total of 25 80-acre fields each year
Age Group
lt 1 1 lt 2 2 lt 3 3 lt 6 6 lt 9 Male Female Male Female Male Female Male Female Male Female
Mean 02906 03157 18121 19672 15953 16652 12951 13295 12146 12220 Std Deviation 01948 02105 07170 07709 06263 06341 05264 05343 04984 05174
Percentile 5 0078 0085 0934 1024 0826 0878 0655 0659 0588 0584
10 0099 0107 1041 1141 0920 0977 0724 0750 0671 0666 25 0147 0161 1257 1387 1111 1185 0892 0940 0840 0842 50 0242 0264 1653 1777 1457 1523 1180 1209 1114 1116 75 0378 0413 2232 2419 1974 2044 1596 1633 1494 1494 90 0550 0592 2797 3022 2460 2547 2028 2059 1897 1936 95 0674 0724 3194 3462 2803 2891 2301 2344 2167 2204
975 0809 0878 3536 3831 3097 3174 2574 2652 2438 2478 99 0957 1046 3922 4256 3424 3539 2853 2981 2705 2881
9 lt 12 12 lt 15 15 lt 18 18lt 25 25 lt 70 Male Female Male Female Male Female Male Female Male Female
Mean 09136 08829 07399 06103 05984 05640 05913 05588 05364 05024 Std Deviation 03929 03854 03262 02660 02473 02308 02375 02331 02169 02240
Percentile 5 0418 0399 0330 0285 0280 0274 0280 0264 0254 0223
10 0481 0463 0381 0324 0321 0310 0327 0305 0292 0258 25 0621 0603 0501 0418 0418 0392 0415 0385 0373 0336 50 0841 0805 0677 0556 0557 0517 0553 0516 0501 0455 75 1127 1084 0917 0749 0732 0689 0724 0689 0658 0624 90 1458 1401 1188 0961 0927 0877 0908 0872 0833 0813 95 1674 1633 1373 1129 1069 1009 1044 0999 0947 0922
975 1843 1818 1532 1256 1208 1112 1175 1101 1055 1031 99 2078 2087 1729 1481 1323 1276 1306 1277 1190 1210
18
___________________________________________________________________________
___________________________________________________________________________
INPUT VARIABLES FOR EXPOSURE SIMULATION
Air concentrations
Table 15 gives the probability distributions of air concentrations (in ugm3) used as input in the exposure simulations The first column gives percentiles of the distribution interpolated from a four-parameter logistic curve fit to the original Calhoun et al frequency distribution The interpolated concentrations were adjusted by factors developed by the Environmental Monitoring Branch of DPR (Johnson 1994b) shown in the second column Environmental Monitoring did additional modeling with ISCST to develop an adjustment to approximate the effect of using a 36-point-per-section spatial grid to model air concentrations instead of the relatively coarse 1-point-per-section grid used by Calhoun et al The effect of the adjustment is to increase the variability of the air concentrations while the mean level is unchanged The adjusted concentrations appear in the third column These adjusted values reflecting annual average daily concentrations for points on a 36-point-per-section grid were used for the estimation of lifetime average exposure
Table 15 Air concentration (ugm3) probability distributions used in exposure simulation
Concentrations Adjustment Adjusted Adjusted interpolated from 4shy factors to concentrations concentrations parameter logistic approximate used to estimate used to estimate
Percentile curvea 36-point gridb lifetime exposure 62-day exposure
00001 0103842 069359 0072024 0278587 001 0106063 084461 0089582 0346503 01 0128835 093182 0120051 0464356 02 0160687 096331 0154791 0598731 03 0201575 098483 0198517 0767865 04 0254546 100283 0255267 0987372 05 0323879 101963 0330237 1277356 06 0415684 103671 0430944 1666892 07 0538854 105566 0568846 2200298 08 0706593 107924 0762583 2949673 09 0938983 111571 1047632 4052242 095 1088601 115040 1252327 4844000 099 1228987 123092 1512784 5851450 0999 1263482 135000 1705701 6597652 09999 1266995 149000 1887822 7302097
a Curve fit to high-end air concentration frequency distribution in Calhoun et al (1994) b Johnson (1994b)
19
Seasonal exposure was estimated for July-August the period of historically highest Telone use To estimate average daily concentrations for this 62-day period the adjusted annual concentrations were modified as follows In the Calhoun et al simulation all positive air concentrations occurred in two 74shyday periods (60 days of Telone use plus 14 additional days for the material to dissipate) one in spring and the other in summer In their simulation 707 of the total Telone was applied during the summer use period with 40 mass loss to air In the spring period 293 of the Telone was applied with a mass loss rate of 25 To approximate the average daily concentrations during the summer period the fraction of the annual concentration contributed by the summer period was assumed to be (707 x 40) [(707 x 40) + (293 x 25)] = 0794 This fraction was condensed into 74 days by multiplying by 36574 Since actual Telone applications will probably not be restricted to the four months assumed by Calhoun et al historical use patterns were consulted Pesticide use reporting data showed that in 1988 and 1989 585 and 499 respectively of 13-D applied to carrots in Kern County was applied during July and August The simulation summer-period concentrations were further modified to represent concentrations for the 62 days of July-August by multiplying by (585 707) x (7462) The net effect was to multiply the annual concentrations by 3868 The concentrations thus modified shown in the fourth column of Table 15 were used for the estimation of seasonal exposure
For both lifetime and seasonal exposure assessments the average air concentration experienced by each person was simulated by randomly selecting five values from the relevant air distribution These values represented five locations where the individual spent his or her time A weighted average of the five concentrations weighted by the proportion of time spent at each location was used as the air concentration experienced by the individual The same five locations were used throughout a persons life but the division of time between them changed as a function of age The division of time between locations was a random variable in the simulation and is discussed in the section on individual mobility
To estimate exposure to persons living close to fields additional modeling with ISCST was done by the Environmental Monitoring Branch to provide annual average daily air concentrations at 100-meter increments from edges of treated fields (Johnson 1994a) The probability distributions of concentrations at 100 200 and 500 meters which were used in this exposure assessment are given in Table 16 In calculating the average concentration experienced by a person the first location selected at which the greatest portion of time is spent was considered the home location The concentration for the home location was simulated by selecting one value from eg the 100-meter distribution and one from the general distribution then calculating a weighted average with the two values weighted one-third and two-thirds respectively to reflect the fact that a field is treated only once in three years The two values were chosen to have a rank order correlation coefficient of 080 based on an observed correlation of 086 between ambient concentrations in the same township from year to year (personal communication Bruce Johnson Environmental Monitoring Branch DPR June 22 1994) For seasonal exposures the home concentration was simply a value from the relevant distance distribution This home location concentration was then used as described in the preceding paragraph in the calculation of the average concentration over five locations
20
___________________________________________________________________________
________________________________________________________________________________
Table 16 Annual average air concentrations (ugm3) at specified distances from treated fieldsa
Percentile 100 meters 200 meters 500 meters
000333 035393 030113 024996 001 037037 031439 026472 005 046011 040619 029312 01 050768 044753 031998 015 055763 048264 035456 02 058246 051404 036323 025 060290 055147 037940 03 064604 058207 038904 035 070250 062520 040306 04 077585 074610 041207 045 087638 085215 045127 05 090497 090723 049474 055 097657 096199 055052 06 105653 102253 057466 065 117366 117403 062218 07 131421 125398 067783 075 143991 134267 075510 08 154023 142689 079173 085 163177 151078 083575 09 175806 159046 087488 095 195317 178902 099410 099 220345 198031 127958 099667 226113 204338 135822
a Johnson (1994a)
21
________________________________________________________________________________
________________________________________________________________________________
Individual mobility within the Telone use area
Individuals were assumed to divide their total time between five randomly selected locations within the Telone high-use area The average air concentration to which an individual is exposed was calculated as described above as the mean of the five location concentrations weighted by the proportion of time spent in each location The mean division of time between locations was derived for each age interval from Table 45 in the Arabrsquos Survey of Childrens Activity Patterns (Wiley 1991a) and Table 33 in Activity Patterns of California Residents (Wiley 1991b) Wileys time at home was used as the time spent in the first selected location his time in transit was divided equally between two locations and the remaining time in the day divided between two others The division of time between these last two locations was 7030 for infants stepping down by age interval to a 5050 division for adults Individual time divisions were allowed to vary from the mean by randomly generating them from a multinomial distribution with n chosen to give fairly small variability in the youngest intervals and greater variability in the adolescent and adult intervals The distributions for time division are shown in Table 17
Table 17 Probability distributions of time spent in five locations
Multinomial Age n Average minutes per day spent in location
interval parameter 1 2 3 4 5
0 to 1 100 Male 1157 27 27 160 69 Female 1151 38 38 150 63
1 to 2 100 Male 1157 27 27 160 69 Female 1151 38 38 150 63
2 to 3 90 Male 1134 31 31 170 74 Female 1099 44 44 151 102
3 to 6 90 Male 1134 31 31 170 74 Female 1099 44 44 151 102
6 to 9 80 Male 1044 59 30 170 137 Female 1021 27 26 256 110
9 to 12 80 Male 1020 31 31 250 108 Female 968 47 46 265 114
12 to 15 70 Male 893 61 60 256 170 Female 917 49 49 255 170
15 to 18 70 Male 893 61 60 256 170 Female 917 49 49 255 170
18 to 25 60 Male 782 75 74 255 254 Female 862 60 60 229 229
25 to 70 60 Male 798 60 59 262 261 Female 960 51 51 189 189
22
Breathing rates
An individuals average breathing rate in each age interval was calculated as a weighted average of his rates at each of four activity levels resting light moderate and heavy The rate at each level was weighted by the proportion of time the individual was assumed to spend at that level Breathing rate at each activity level was a random variable The proportion of time at each level was a constant fixed for each age interval
For infants (0-1 year) a triangular distribution of breathing rates was derived from the mean and range reported in the Exposure Factors Handbook Table 3A-2 (USEPA 1990) The mode of the triangular distribution was set equal to the lower limit of the range in order to match the EPA mean For the other age intervals uniform distributions were derived from data in the ARBs Measurement of Breathing Rate and Volume (Adams 1993) In each case the range was chosen to include all the reported rates relevant to an activity level for a specific sex and age group These ranges are given in Table 18 Data were unavailable for children aged 1-3 so the breathing rates for 3-6-year-olds were used The breathing rates of an individual at different activity levels within and across ages were assumed to have the rank order correlations shown in Table 19 (The value of 08 on the diagonal represents the correlation between breathing rates of the same individual at the same activity level at different ages) It was not possible to incorporate correlations between body weight and breathing rates because the software used did not handle them correctly Correlation coefficients of body surface area and breathing rate within age intervals and activity levels reported in Adams (1993) ranged from 006 to 084 with a mean of 040 The correlation of body weight and breathing rate may be similar The effect of omitting this correlation from the simulation was probably to increase the estimated exposures to an unknown degree because if the greater exposures associated with high breathing rates tended to be paired with high body weights the exposure would be mitigated somewhat
The proportion of time assumed to be spent at each activity level is shown in Table 20
Body weight
Body weight distributions were taken directly from Tables 5A-1 through 5A-4 in the Exposure Factors Handbook (USEPA 1990) The histograms reported in these tables were used without smoothing Upper and lower bounds were supplied to produce a mean weight equal to the mean given in the EPA tables An individuals weights in different age intervals were assumed to have the rank order correlations shown in Table 21
Residence time and lifetime
In estimating lifetime exposures lifetime length was fixed at 70 years Exposure was estimated separately for fixed times of residence in the Telone use area of 30 and 70 years Since the exposure assessment is viewed as applying to any areas where Telone may be reintroduced in the proposed way and not just to the specific township in Kern County for which Calhoun et al modeled air concentrations it was not reasonable to define a distribution of residence time in the area Instead the estimated exposures are those expected to result from living the first 30 or 70 years of a 70-year lifetime in any area with Telone use like that described here
23
________________________________________________________________________________
________________________________________________________________________________
Table 18 Breathing rates (Lmin) as ranges of uniform distributions
Age interval Activity level Male Female
0 to 1 All Triangular ( 025 025 209 ) 1 to 2 Resting 5-7
Light 7-11 Moderate 8-15 Heavy 14-22
2 to 3 Resting 5-7 Light 7-11 Moderate 8-15 Heavy 14-22
3 to 6 Resting 5-7 Light 7-11 Moderate 8-15 Heavy 14-22
6 to 9 Resting 5-9 Light 10-17 Moderate 11-23 Heavy 20-45
9 to 12 Resting 5-9 Light 10-17 Moderate 11-23 Heavy 20-45
12 to 15 Resting 6-12 5-10 Light 7-17 7-15 Moderate 17-35 15-27 Heavy 25-72 24-59
15 to 18 Resting 6-12 5-10 Light 7-17 7-15 Moderate 17-35 15-27 Heavy 25-72 24-59
18 to 25 Resting 7-11 5-10 Light 8-18 6-15 Moderate 18-42 15-28 Heavy 48-80 39-62
25 to 70 Resting 7-11 5-10 Light 8-18 6-15 Moderate 18-42 15-28 Heavy 48-80 39-62
24
________________________________________________________________________________
_____________________________________________________________________________
________________________________________________________________________________
________________________________________________________________________________
Table 19 Rank order correlation coefficients between individuals breathing rates at different activity levels within and across age intervals
Resting Light Moderate Heavy Resting 08 05 05 04 Light 08 05 04 Moderate 08 05 Heavy 08
Table 20 Proportion of time at each activity level (constant in exposure simulation)
Age Activity level interval
Resting Light Moderate Heavy
0 to 1 Male 1 0 0 0 Female 1 0 0 0
1 to 2 Male 08 015 004 001 Female 08 015 004 001
2 to 3 Male 075 02 004 001 Female 075 02 004 001
3 to 6 Male 07 02 008 002 Female 07 02 008 002
6 to 9 Male 07 017 010 003 Female 07 02 008 002
9 to 12 Male 06 032 005 003 Female 06 033 005 002
12 to 15 Male 06 032 005 003 Female 06 033 005 002
15 to 18 Male 05 04 006 004 Female 05 042 005 003
18 to 25 Male 04 050 006 004 Female 04 052 005 003
25 to 70 Male 035 057 005 003 Female 035 060 004 001
25
________________________________________________________________________________
_______________________________________________________________________________
Table 21 Rank order correlation coefficients between the weights of an individual at different ages
0 to 1 1 to 2 2 to 3 3 to 6 6 to 9 9 to 12 12 to 15 15 to 18 18 to 25 25 to 70
0 to 1 100 092 082 072 061 061 061 061 061 061 1 to 2 100 092 082 072 061 061 061 061 061 2 to 3 100 092 082 072 061 061 061 061 3 to 6 100 092 082 072 061 061 061 6 to 9 100 092 082 072 061 061 9 to 12 100 092 082 072 061 12 to 15 100 082 082 072 15 to 18 100 082 082 18 to 25 100 082 25 to 70 100
Exposure appraisal
The estimated exposure distributions may be regarded as providing a reasonable idea of the highest exposures that should be expected under the use scenario The distributions should not be interpreted as reflecting the exposures of a population of individuals but as a set of values that are likely to bracket the exposure of an individual in this situation
It should be noted that the large differences between estimated seasonal exposures of children less than one and children from one to three are largely produced by the input breathing rate distributions The breathing rate data for infants under one came from a different source than all the other breathing rate data In addition no data were available for children from one to three so the rates for three- to six-year-old children were used In combination with the small body size of these children this may have overestimated their exposures
An important limitation of this exposure assessment is that it used 13-D concentrations in outdoor air to estimate 24-hourday exposure even though most people spend the greatest part of the day indoors Since the registrant provided no data on indoor concentrations and since no appropriate surrogate data were available to estimate them it was judged that there was no alternative
It is important to remember that these estimates of non-occupational exposure apply only to the use scenario of Calhoun et al which specified Telone applications to only 2000 acres per year in an area which has 8500 acres of carrots alone Any change in the use scenario would require a new exposure assessment
26
REFERENCES
Adams WC 1993 Measurement of breathing rate and volume in routinely performed daily activities Final report contract no A033-205 Research Division California Air Resources Board Sacramento CA
Albrecht WN 1987 Occupational exposure to 13-dichloropropene (Telone II) in Hawaiian pineapple culture Arch Environ Health 42286-290
Brouwer DH Brouwer EJ de Vreede JAF van Welie RTH Vermuelen NPE and van Hemmen JJ 1991 Inhalation exposure to 13-dichloropropene in the Dutch flower-bulb culture Part I Environmental monitoring Arch Environ Contam Toxicol 201-5
Calhoun LL Fontaine DD Stuart BL and Landenberger BD 1994 13shydichloropropene (13-D) An assessment of implied exposure and risk for the proposed commercial reentry of TELONE soil fumigant into California Dow Chemical Co Midland MI
California Department of Food and Agriculture 1988 Report of pesticides sold in California in 1987 Pesticide Use Enforcement Branch California Department of Food and Agriculture Sacramento CA
Climie IJG Hutson DH Morrison BJ and Stoydin G 1979 Glutathione conjugation in the detoxification of (Z)-13-dichloropropene (a component of the nematicide D-D) Xenobiotica 9149-156
Cohen B-S M and Poppendorf W 1989 A method for monitoring dermal exposure to volatile chemicals Am Ind Hyg Assoc J 50 216-223
Cook RE 1983 Fumigators exposure to airborne 13-dichloropropene during fumigation operation of Telone II soil fumigant Driscoll Citrus Service Inc Fort Pierce Florida Unpublished report of the Dow Chemical Chemical Company Industrial Hygiene Laboratory Midland MI January 4 1983
Davies DB and Fraser PA 1988 Evaluation of potential operator fieldworker and bystander exposure to 13-dichloropropene as a result of tobacco field fumigation with Telone II soil fumigant in southwestern Ontario (Canada) May-June 1985 CDFA Reg Doc No 50046-039
Dietz FK Hermann EA and Ramsey JC 1984a The pharmacokinetics of 14C-13shydichloropropene in rats and mice following oral administration The Toxicologist 4 Abstr No 585
Dietz FK Dittenber DA Krik HD and Ramsey JC 1984b Non-protein sulfhydryl content and macromolecular binding in rats and mice following oral administration of 13shydichloropropene The Toxicologist 4 Abstr No 586
Fisher GD and Kilgore WW 1988a Tissue levels of glutathione following acute inhalation of 13-dichloropropene J Toxicol Environ Health 23171-182
Fisher GD and Kilgore WW 1988b Mercapturic acid excretion in rats following 13shydichloropropene inhalation exposure Fund Appl Toxicol 11 303-307
27
Fisher GD and Kilgore WW 1989 Pharmacokinetics of S-[3-chloroprop-2shyenyl]glutathione in rats following acute inhalation exposure to 13-dichloropropene Xenobiotica 19269-278
Fong HR and Maykoski R 1985 Air exposure monitoring of EHAP personnel during a Telone II soil translocation study in Fresno County CDFA Rpt HS 1299
Houtman BA 1992 Managing worker exposure 13-D in California
Houtman BA 1993 An evaluation of 13-dichloropropene worker exposure associated with Telone II soil fumigant loading application and reentry phase I ECL92095 (interim report)
Hutson DH Moss JA and Pickering BA 1971 The excretion and retention of components of the soil fumigant D-D and their metabolites in the rat Food Cosmet Toxicol 9 677-680
Johnson B 1994a Memorandum to John Sanders June 20 1994 on buffer zone calculations for 13-D in Kern County Environmental Monitoring and Pest Management Branch Department of Pesticide Regulation Sacramento CA
Johnson B 1994b Memorandum to Kean Goh May 16 1994 on estimated adjusted air concentration percentiles based on Dow simulation results for T29R26 Environmental Monitoring and Pest Management Branch Department of Pesticide Regulation Sacramento CA
Maddy KT Cusick B Richmond D 1980 Studies concerning the field application of Telone and DD in California in 1979 and the ambient air concentration of these pesticides during and following application by shank injection into soil in fields CDFA Rpt HS 686
Maddy KT Schneider F and Fredrickson S 1982 Monitoring of Telone II during and following experimental application by shank injection to established trees and grape vines in California in 1980-1981 CDFA Rpt 967
NIOSHOSHA Occupational Safety and Health Guidelines for Chemical Hazards 1988 DHHS (NIOSH) Publication No 81-1231981 and supplements Publication Nos 88-118 and 89-104
Osterloh JD Cohen BS Poppendorf W and Pond SM 1984 Urinary excretion of the N-cysteine conjugate of cis-13-dichloropropene by exposed individuals Arch Environ Health 39 271-275
Osterloh JD Wang R OConnell L Jacob III P and Maddy KT 1989a Pilot study for biological monitoring of 13-dichloropropene In Biological Monitoring of Pesticide Exposure RG Wang CA Franklin RC Honeycutt and JC Reinert (eds) Amer Chem Soc Soc Symp Ser No 382 215-230
Osterloh JD Wang R Schneider F and Maddy K 1989b Biological monitoring of dichloropropene Air concentrations urinary metabolite and renal enzyme excretion Arch Environ Health 44 207-213
Owen WJ and DeRouen TA 1980 Estimation of the mean for lognormal data containing zeroes and left-censored values with applications to the measurement of worker exposure to air contaminants Biometrics 36 707 719
28
Palisades Corporation 1992 RISK Risk analysis and simulation add-in for Microsoft Excel Release 11 users guide 31 Decker Rd Newfield NY 14867
Poppendorf W Leffingwell JT and Cohen B 1983 Development of methods and procedures for the assessment of occupational health risks in the application and use of nematicides in California CDFA Rpt HS 1162
Shapiro SS and Wilk MB 1965 An analysis for normality (complete samples) Biometrika 52 591-611
Stott WT and Kastl PE 1986 Inhalation pharmacokinetics of technical grade 13shydichloropropene Toxicol Appl Pharmacol 85 332-341
Stott WT 1992 Letter to J R Sanborn August 11 1992
Tobol HK and Axe FD 1982 Airborne concentrations of 13-dichloropropene during fumigation of established grapevines almond trees and peach trees California December 1980-January 1981 Unpublished report of the Dow Chemical Company Environmental ServicesIndustrial Hygiene Western Division Dow Chemical USA Report No HeRW-AG(8)
US EPA 1990 Exposure factors handbook EPA6008-89043 Office of Health and Environmental Assessment Washington DC
Van Welie RTH van Duyn P Brouwer DH van Hemmen JJ Brouwer EJ and Vermuelen NPE 1991 Inhalation exposure to 13-dichloropropene in the Dutch flower-bulb culture Part II Biological monitoring by measurement of urinary excretion of two mercapturic acid metabolites Arch Environ Contam Toxicol 206-12
Waechter JM Brazak KA McCarty LP LaPack MA and Brownson 1992 13shydichloropropene (Telone II Soil Fumigant) Inhalation pharmacokinetics and metabolism in human volunteers DowElanco (Interim Report) Laboratory Project Study ID M-002993-023
Wagner CP 1987 Industrial source complex (ISC) dispersion model users guide 2nd edition (revised) Vol I US Environmental Protection Agency Report No EPA-4054-88shy002 a
Wiley JA 1991a Study of childrens activity patterns Final report contract no A733-149 Research Division California Air Resources Board Sacramento CA
Wiley JA 1991b Activity patterns of California residents Final report contract no A6-177shy33 Research Division California Air Resources Board Sacramento CA
29

___________________________________________________________________________
___________________________________________________________________________
The air monitoring results of several studies have been converted to potential inhalation exposures in mg8-hr day by assuming a respiration rate of 29 Lmin (Table 3) The geometric mean of these data is reported because the data are log-normally distributed (Shapiro and Wilk 1965) It is conventional to treat exposure data by this statistical method as it allows the use of all the environmental or exposure data that may be widely variant (Owen and DeRouen 1980) If the mean for potential inhalation exposure from breathing zone measurements is mitigated by a respirator (90 reduction in exposure) corrected for respiratory uptake (78 Waechter et al 1992)) and a 70-kg person is assumed then the ADD (Absorbed Daily Dosage) is 351 ugkgday
Hand Exposure
The data available on potential hand exposure to 13-D are conflicting Maddy et al (1980 1982) reported hand a contamination level of 164 ughr for workers wearing gloves The other data on hand exposure (Table 4) were taken from the work of Davies and Fraser (1988) on an application of 13-D in Canada The range of the data for the eight individuals hand residues was 01-570 mghr with a geometric mean of 97 mghr
Table 4 Hand exposure to 13-dichloropropene during loadinga
Worker mghr
1 14 2 08 3 265 4 193 5 570 6 07 7 333 8 01
Geometric Mean 97
a Davies and Fraser (1988)
This exposure value for the hand of 97 mghr is almost 600-fold greater than that reported by Maddy (1982) The reasons for this large difference may be in the experimental design In the Davies and Fraser (1988) study the protocol was a cotton glove-polyethylene glove (1 mm)-cotton glove arrangement where the inner cotton gloves were analyzed for 13-D The inner glove provides an absorptive sink whereas the outer glove compared to the smooth protective glove normally worn provides a sponge for liquid 13-D for eventual penetration through the thin polyethylene glove This type of thin glove (polyethylene) is not normally utilized in application of this material as it would not withstand the physical abuse of daily operations during loading the fumigant into the tanks It is likely that in the studies of Maddy et al (1982) where hand residues were monitored under normal work conditions that thicker gloves were worn Further Maddy suggests that hand washes may not be an effective means for the removal of residues because some evaporation may have occurred as well as some dermal absorption Even so the analysis of hand washes in the work reported by Maddy et al reported microgram amounts of 13-D rather than the milligram amounts in the work of
7
_____________________________________________________________________
_____________________________________________________________________
Davies and Fraser While the Maddy data is very likely an underestimate of dermal exposure the dermal estimates of Davies and Fraser are overestimates due to the experimental design Since the hand exposure values are for 12 hrsday (estimated daily loading time) the dermal component becomes a minor contributor of the overall human exposure which is primarily via inhalation
Annual and Lifetime Exposure Days
Estimates of worker exposure time are provided by the US EPA Data Call-In for handlers of 13-D in crops grown in California that have been treated with 13-D (Houtman 1992) This survey provided information on the number days per year for each crop that 13-D was handled for applicators and loaders in California (Table 5 ) The maximum number of days per career was estimated to be 270 The number of days per career ranged from a low of 24 for potatoes to a high of 270 for brassica It is possible that the same individuals applying for brassica could be applying in vegetables which could mean that an individuals exposure days per year or career could be as high as the total for all crops However it is likely to be much less because the calendar window for application to each crop prevents any one person from working all of them
Table 5 Annual and lifetime handling days for loaders (L) applicators (A) and repairs (R)
Tomato Potato Cotton Vegetables Brassica Beets TreeVine LAR LAR LAR LAR LAR LAR LAR
Annual Custom 162334 444 403626 183524 363636 101010 2298
Grower 111 111 2213 353535 000 111 444
Lifetime Custom 104150221 242424 260234169 108210144 270270270 656565 1988172
Grower 454545 252525 99585 875875875 000 454545 121212
Biological Monitoring
Osterloh et al (1984 1989 a and b) reported human exposure studies with 22 workers loading and applying in which they conducted urinary monitoring for N-acetyl-S-(3-chloroprop-2shyenyl)cysteine (DCPMER) Respiratory protection (half-face) was worn only during loading and not during application An average of 34 mg of DCPMER was excreted in the 24-hour period after exposure Correction for the molecular weight difference between 13-D (111) and DCPMER (237) gives an ADD of 16 mgpersonday or 227 ugkgday Using the data of Davies and Fraser (1988) it is possible to calculate the percentage of the exposure received during application and loading In Davies and Fraser it was determined that 261 percent of the exposure occurred during application 739 during loading Osterloh et al assumed 90 protection from the half-face respirator worn during loading hence the inhaled dose was 01 times the exposure During application 10 (0 respiratory protection) indicates the absence of respirators The absorbed dose for each activity may be found by the following equation
8
Loading Application (739 )(X)(01) + (261)(X)(10) = 227 ugkgday (1)
where X is exposure Solving for X gives 678 ugkgday Putting this value back into equation (1) and adding respiratory protection (half-face respirators) during application gives
Loading Application (739)(678)(01) + (261 )(678)(01) = 68 ugkgday
The value of 68 ugkgday is the expected ADD if half-face respirators are worn during both loading and application
Houtman (1993) monitored five individuals loading or applying 13-D in Washington state The same individual did not do both tasks These applicators and loaders carried out one application per day at a rate of 25 galacre lasting about four hours One application was done without mitigation measures while the others used various mitigation measures specified by the US EPA including dry disconnects (with and without vapor recovery) spill control at the end of the rows and a cab with charcoal-filtered air Houtman collected urinary monitoring data only for the application conducted without mitigation measures To estimate the absorbed daily dose from these unmitigated conditions respiratory protection factors of 09 and 095 for half-face and full-face respirators were used for applicators and loaders respectively The human chamber PBPK exposure study data were used in the absorbed dose calculation These respiratory protection requirements for loaders and applicators were part of the Permit Conditions in California for the flux studies and the Monterey Commercial Use Project These same respiratory protection conditions will be required if 13-D is reinstated in California
The exposure data shown in Table 6 as geometric means have been normalized to an 68shyhour day which is consistent with the data of Davies and Fraser (1988) and allows comparison with the data of Osterloh et al where one person performed both loading and application
Houtman (1993) found that utilizing spill control during application reduced the ambient air concentrations by 79 The urinary metabolite data were adjusted by this factor The absorbed dose was adjusted for the wearing of a one-half face respirator from the unmitigated application in Washington The final adjustment of the data from Washington was the factoring of the reduced rate in California (12 galacre) as compared to the 25 galacre that were used in the studies in Washington The loader exposure data were not adjusted for the reduced rate in California as the exposure occurs primarily during the connecting and disconnection of the hose from the nurse tank and is unrelated to the amount placed in the tank on the tractor
With respect to the estimation of AADD and LADD the range of values for loading and applying were obtained from the crop specific data compiled in Table 5 There are several reasons for the reduced exposure of a combined (one person doing both tasks) load and apply (19 ugkgday) in the Washington study (Houtman 1993) as compared to the earlier combined estimate of Osterloh et al (68 ugkgday) Firstly for the loader the Washington study used dry disconnects and vapor recovery devices For the applicator spill control was used at the end of the rows Each of these mitigation strategies reduces ambient air concentration which resulted in lower estimated exposure value of more than three-fold It is further likely that the soil moisture content will be higher in California than occurred during the applications in Washington This will further reduce emissions
9
_____________________________________________________________________
_____________________________________________________________________
Table 6 ADD AADD and LADD values for loading and application of 13- dichloropropene
Study Task ADD1 Days SADD4 AADD5 Days LADD6
(ugkgd) Year (ugkgd) (ugkgd) Career (ugkgd)
Osterloh et al LoadApply 680
Houtman Load 0733 4 0016 0008 24 69x10-4
40 016 008 270 77x10-3
Apply 1133 4 36
0025 023
0012 011
24 270
11x10-3
12x10-2
Total2 186
1 Absorbed Daily Dosage two load and application cyclesday body weights of study volunteers used in calculations
2 One person doing both loading and applying-for comparison to studies of Osterloh et al 3 Normalized to 68 hrs based on registrant study (Davies and Fraser 1988) for one
person doing both tasks to be compared with Osterloh et al 4 Split application for brassica 90-day window (see Table 5) 5 Annual Average Daily Dosage (365 daysyear) 6 Lifetime Average Daily Dosage 70 years life (25550 days)
Exposure Appraisal
The exposure estimates based on the Houtman (1993) study in which exposures were measured separately for loading and application should be used for the assessment of risk These estimates are based on biological monitoring that assessed both cis- and transshymercapturate metabolites in the urine and utilized the pharmacokinetic information developed from exposure of humans under controlled conditions Hand exposure information developed by previous investigators was not used as this route of exposure would be reflected in the total exposure measured by the biological monitoring
None of the occupational exposure studies in which biological monitoring was conducted employed exactly the mitigation measures that would be required in California These requirements are for full-face respiratory protection during loading and half-face protection during application
NON-OCCUPATIONAL EXPOSURE
Inhalation exposure was estimated for residents of an area where Telone is used in carrot growing Both lifetime and subchronic (seasonal) exposures were estimated for residents of the area in general and for residents with homes at specified distances from Telone-treated fields (100 200 and 500 meters) The estimated lifetime exposure distributions are given in Tables 7 through 10 seasonal exposures in Tables 11 through 14
10
=
The exposure assessment relied on simulated air concentrations from a study provided by the registrant (Calhoun et al 1994) in which the ISCST simulation model (Wagner 1987) was used to predict concentrations of 13-D in air for a scenario of limited reintroduction of Telone IItrade soil fumigant in carrots In the use scenario modeled Telone is applied to 25 80-acre fields (2000 acres total) per year in a 9-township (324-square-mile) area in Kern County Under this scenario there is no other use of Telone All applications are at the rate of 12 gallons per acre and no field is treated more than once in three years Calhoun et al simulated three years of daily air concentrations for one point at the center of each section in the reintroduction area to produce an annual average daily concentration for each point The locations of treated fields were assigned randomly in their model so that concentrations at the section centers vary in part due to being different distances and directions from applications The modeled concentrations thus represent long-term ambient concentrations for the reintroduction area Calhoun et al presented separately the concentrations for the township of highest Telone use within the 9-township area These concentrations were used in the exposure assessment
Probability distributions of exposure were estimated using stochastic simulation (Monte Carlo) methods implemented with the program RISK (Palisades Corporation 1992) The distribution of lifetime average daily dose (LADD) as ug of 13-D inhaled per kg of body weight per day (ugkgday) was estimated separately for persons living 1) the first 30 years of and 2) all of a 70-year lifetime in the reintroduction area Seasonal exposure was estimated for July-August the period of greatest Telone use by adjusting the long-term air concentrations for proportional use and mass loss during that 62-day period Additional simulated air concentrations provided by the Environmental Monitoring Branch (Johnson 1994a) were incorporated to estimate both lifetime and 62-day exposures to residents whose dwellings are close to treated fields Exposure distributions were estimated separately for residents living 100 200 and 500 meters from the edges of treated fields Each estimated exposure distribution is based on a simulation with 10000 trials
LADD (ugkgday) was calculated by the following equation
10
([ ]) i 1
where the summation is over 10 age intervals RTi = number of years in age interval i that the person
resides in the Telone use area Conci = average of air concentrations (ugm3) in 5
locations weighted by the proportion of time spent in each location in interval i
BRi = average breathing rate (m3day) at each of 4 activity levels weighted by proportion of time spent at each level in interval i
BWi = body weight (kg) in interval i and 70 years is the assumed lifetime
LADD = RT Conci x BR BW 70i i i
11
Seasonal exposure (62-day average ugkgday) was calculated separately for each age interval as Conc x BR
Average daily dose = BW
where concentration breathing rate and body weight are as defined above for LADD but with air concentrations modified to approximate seasonal averages as explained in the next section
Concentration breathing rate and body weight were stochastic variables in the exposure simulation model The statistical distributions used to simulate them are described in the sections on specific input variables following Tables 7-14
12
___________________________________________________________________________
Table 7 Lifetime average daily dose (ugkgday) of 13-D inhaled by residents of an area where Telone is applied to a total of 25 80-acre fields each year
Residence Time
Birth to age 30 Birth to age 70 Male Female Male Female
Mean 00800 00783 01510 01436 Std Deviation 00480 00487 00867 00902
Percentile 5 0027 0026 0053 0047
10 0032 0031 0063 0056 25 0044 0042 0087 0078 50 0066 0063 0129 0116 75 0103 0101 0193 0186 90 0150 0148 0277 0270 95 0179 0179 0326 0330
975 --a -- -- -shy99 0230 0236 0425 0444
a not calculated
Table 8 Lifetime average daily dose (ugkgday) of 13-D inhaled by residents living 100 m from treated fields in an area where Telone is applied to a total of 25 80-acre fields each year
Residence Time
Birth to age 30 Birth to age 70 Male Female Male Female
Mean 01022 01001 01892 01829 Std Deviation 00514 00515 00926 00959
Percentile 5 0042 004 0078 0071
10 0048 0047 0091 0084 25 0063 0061 012 0111 50 009 0087 0168 0159 75 0129 0128 0238 0233 90 0176 0174 0319 0319 95 0204 0201 0373 0371
975 0228 0227 0416 0423 99 0262 0257 0481 0481
13
___________________________________________________________________________
Table 9 Lifetime average daily dose (ugkgday) of 13-D inhaled by residents living 200 m from treated fields in an area where Telone is applied to a total of 25 80-acre fields each year
Residence Time
Birth to age 30 Birth to age 70 Male Female Male Female
Mean 00996 00973 01846 0178 Std Deviation 00501 00499 00901 00932
Percentile 5 0039 0038 0073 0067
10 0046 0044 0087 008 25 0061 006 0116 0108 50 0088 0086 0165 0156 75 0127 0124 0234 0227 90 0171 0168 0311 0307 95 0199 0196 036 0363
975 0222 022 0408 0414 99 0253 0248 0458 0465
Table 10 Lifetime average daily dose (ugkgday) of 13-D inhaled by residents living 500 m from treated fields in an area where Telone is applied to a total of 25 80-acre fields each year
Residence Time
Birth to age 30 Birth to age 70 Male Female Male Female
Mean 0084 00818 01577 01498 Std Deviation 00423 00419 00772 00781
Percentile 5 0034 0033 0065 0059
10 004 0039 0076 0069 25 0053 0051 0101 0093 50 0074 0071 014 013 75 0106 0103 0198 0189 90 0144 0141 0265 0259 95 0169 0167 031 0305
975 0191 0189 0352 0352 99 0216 0212 04 04
14
Table 11 Average daily dose (ugkgday) of 13-D inhaled by residents during the 62-day period of highest Telone use in an area where Telone is applied to a total of 25 80-acre fields each year
Age Group
lt 1 1 lt 2 2 lt 3 3 lt 6 6 lt 9 Male Female Male Female Male Female Male Female Male Female
Mean 02499 02707 15513 16841 13685 14366 11103 11467 10548 10651 Std Deviation 02270 02431 10419 11219 09039 09243 07460 07561 06797 06863
Percentile 5 0045 0050 0470 0520 0422 0464 0333 0361 0330 0326
10 0058 0065 0558 0616 0501 0549 0399 0426 0397 0395 25 0098 0108 0770 0841 0691 0750 0553 0589 0558 0560 50 0173 0192 1207 1308 1070 1134 0869 0904 0849 0863 75 0321 0343 2052 2244 1815 1897 1466 1507 1367 1396 90 0539 0590 3126 3385 2738 2804 2242 2249 2050 2038 95 0714 0789 3750 4047 3260 3375 2659 2731 2464 2474
975 0903 0966 4233 4530 3667 3821 3010 3137 2783 2880 99 1125 1183 4711 5124 4108 4260 3468 3522 3230 3296
9 lt 12 12 lt 15 15 lt 18 18lt 25 25 lt 70 Male Female Male Female Male Female Male Female Male Female
Mean 07953 07730 06536 05394 05300 04984 05297 04964 04809 04414 Std Deviation 05168 04897 04050 03320 03172 02980 02904 02913 02688 02840
Percentile 5 0239 0237 0208 0172 0176 0164 0188 0164 0167 0132
10 0291 0292 0254 0209 0214 0196 0228 0200 0201 0164 25 0417 0412 0360 0295 0298 0278 0314 0284 0281 0236 50 0645 0635 0545 0453 0447 0419 0459 0422 0416 0362 75 1029 1007 0835 0694 0676 0645 0676 0637 0618 0567 90 1529 1455 1209 0998 0977 0917 0930 0904 0848 0830 95 1870 1767 1457 1207 1171 1103 1103 1085 1018 1022
975 2118 2080 1713 1413 1338 1279 1267 1252 1166 1190 99 2496 2341 2020 1645 1568 1450 1468 1433 1342 1382
15
Table 12 Average daily dose (ugkgday) of 13-D inhaled during the 62-day period of highest Telone use by residents living 100 m from fields in an area where Telone is applied to a total of 25 80-acre fields each year
Age Group
lt 1 1 lt 2 2 lt 3 3 lt 6 6 lt 9 Male Female Male Female Male Female Male Female Male Female
Mean 04940 05352 30723 33330 26876 27770 21802 22126 19918 19861 Std Deviation 03548 03830 14181 15406 12335 12549 10277 10370 09528 09564
Percentile 5 0118 0128 1368 1490 1206 1263 0942 0968 0852 0833
10 0152 0166 1545 1672 1347 1418 1069 1098 0969 0965 25 0238 0258 1924 2096 1697 1757 1366 1393 1255 1254 50 0395 0425 2710 2949 2360 2470 1918 1960 1760 1766 75 0641 0699 4008 4347 3502 3620 2833 2868 2545 2529 90 0976 1076 5137 5567 4481 4594 3657 3725 3371 3371 95 1217 1331 5792 6272 5021 5177 4158 4258 3831 3879
975 1450 1563 6306 6950 5536 5720 4615 4647 4261 4271 99 1680 1784 6915 7610 6021 6204 5033 5157 4801 4847
9 lt 12 12 lt 15 15 lt 18 18lt 25 25 lt 70 Male Female Male Female Male Female Male Female Male Female
Mean 14857 14065 11533 09575 09336 08872 08833 08610 08063 08020 Std Deviation 07344 06874 05796 04659 04444 04134 03970 04030 03694 04061
Percentile 5 0603 0573 0464 0396 0393 0379 0383 0359 0350 0305
10 0701 0667 0539 0459 0454 0438 0447 0422 0405 0366 25 0923 0890 0723 0610 0599 0571 0584 0558 0526 0499 50 1314 1244 1020 0849 0833 0792 0802 0770 0733 0704 75 1899 1795 1456 1209 1184 1126 1111 1091 1007 1034 90 2530 2389 1927 1605 1549 1481 1436 1433 1316 1382 95 2925 2770 2287 1863 1809 1695 1662 1661 1524 1604
975 3280 3076 2623 2102 2000 1867 1841 1818 1725 1790 99 3678 3463 3033 2434 2278 2101 2083 2029 1922 2018
16
Table 13 Average daily dose (ugkgday) of 13-D inhaled during the 62-day period of highest Telone use by residents living 200 m from fields in an area where Telone is applied to a total of 25 80-acre fields each year
Age Group
lt 1 1 lt 2 2 lt 3 3 lt 6 6 lt 9 Male Female Male Female Male Female Male Female Male Female
Mean 04605 05018 28772 31305 25168 26084 20439 20856 18713 18739 Std Deviation 03227 03596 13044 14290 11309 11633 09438 09779 08750 08917
Percentile 5 0112 0117 1229 1308 1089 1124 0851 0854 0758 0745
10 0139 0155 1382 1492 1222 1278 0978 0986 0895 0871 25 0219 0243 1778 1935 1568 1633 1265 1293 1169 1170 50 0374 0401 2647 2865 2324 2404 1865 1887 1700 1694 75 0607 0664 3775 4152 3289 3433 2687 2734 2426 2428 90 0906 0998 4704 5195 4114 4278 3387 3499 3103 3164 95 1112 1238 5266 5730 4585 4726 3771 3915 3536 3593
975 1300 1441 5770 6269 5016 5128 4206 4249 3908 3920 99 1534 1688 6289 6837 5542 5607 4605 4696 4281 4346
9 lt 12 12 lt 15 15 lt 18 18lt 25 25 lt 70 Male Female Male Female Male Female Male Female Male Female
Mean 13973 13308 10879 09069 08808 08389 08368 08156 07646 07564 Std Deviation 06736 06511 05331 04368 04053 03864 03650 03789 03405 03774
Percentile 5 0539 0511 0423 0356 0362 0348 0358 0328 0322 0284
10 0648 0604 0501 0423 0424 0405 0419 0390 0376 0336 25 0872 0824 0679 0567 0570 0530 0554 0523 0503 0462 50 1254 1199 0982 0819 0799 0766 0779 0745 0706 0675 75 1816 1723 1388 1170 1128 1081 1064 1044 0961 0984 90 2351 2273 1816 1521 1439 1382 1328 1350 1231 1286 95 2687 2563 2107 1726 1643 1579 1522 1527 1409 1483
975 2965 2847 2365 1940 1850 1741 1692 1704 1581 1659 99 3358 3142 2680 2170 2043 1922 1877 1904 1767 1851
17
Table 14 Average daily dose (ugkgday) of 13-D inhaled during the 62-day period of highest Telone use by residents living 500 m from fields in an area where Telone is applied to a total of 25 80-acre fields each year
Age Group
lt 1 1 lt 2 2 lt 3 3 lt 6 6 lt 9 Male Female Male Female Male Female Male Female Male Female
Mean 02906 03157 18121 19672 15953 16652 12951 13295 12146 12220 Std Deviation 01948 02105 07170 07709 06263 06341 05264 05343 04984 05174
Percentile 5 0078 0085 0934 1024 0826 0878 0655 0659 0588 0584
10 0099 0107 1041 1141 0920 0977 0724 0750 0671 0666 25 0147 0161 1257 1387 1111 1185 0892 0940 0840 0842 50 0242 0264 1653 1777 1457 1523 1180 1209 1114 1116 75 0378 0413 2232 2419 1974 2044 1596 1633 1494 1494 90 0550 0592 2797 3022 2460 2547 2028 2059 1897 1936 95 0674 0724 3194 3462 2803 2891 2301 2344 2167 2204
975 0809 0878 3536 3831 3097 3174 2574 2652 2438 2478 99 0957 1046 3922 4256 3424 3539 2853 2981 2705 2881
9 lt 12 12 lt 15 15 lt 18 18lt 25 25 lt 70 Male Female Male Female Male Female Male Female Male Female
Mean 09136 08829 07399 06103 05984 05640 05913 05588 05364 05024 Std Deviation 03929 03854 03262 02660 02473 02308 02375 02331 02169 02240
Percentile 5 0418 0399 0330 0285 0280 0274 0280 0264 0254 0223
10 0481 0463 0381 0324 0321 0310 0327 0305 0292 0258 25 0621 0603 0501 0418 0418 0392 0415 0385 0373 0336 50 0841 0805 0677 0556 0557 0517 0553 0516 0501 0455 75 1127 1084 0917 0749 0732 0689 0724 0689 0658 0624 90 1458 1401 1188 0961 0927 0877 0908 0872 0833 0813 95 1674 1633 1373 1129 1069 1009 1044 0999 0947 0922
975 1843 1818 1532 1256 1208 1112 1175 1101 1055 1031 99 2078 2087 1729 1481 1323 1276 1306 1277 1190 1210
18
___________________________________________________________________________
___________________________________________________________________________
INPUT VARIABLES FOR EXPOSURE SIMULATION
Air concentrations
Table 15 gives the probability distributions of air concentrations (in ugm3) used as input in the exposure simulations The first column gives percentiles of the distribution interpolated from a four-parameter logistic curve fit to the original Calhoun et al frequency distribution The interpolated concentrations were adjusted by factors developed by the Environmental Monitoring Branch of DPR (Johnson 1994b) shown in the second column Environmental Monitoring did additional modeling with ISCST to develop an adjustment to approximate the effect of using a 36-point-per-section spatial grid to model air concentrations instead of the relatively coarse 1-point-per-section grid used by Calhoun et al The effect of the adjustment is to increase the variability of the air concentrations while the mean level is unchanged The adjusted concentrations appear in the third column These adjusted values reflecting annual average daily concentrations for points on a 36-point-per-section grid were used for the estimation of lifetime average exposure
Table 15 Air concentration (ugm3) probability distributions used in exposure simulation
Concentrations Adjustment Adjusted Adjusted interpolated from 4shy factors to concentrations concentrations parameter logistic approximate used to estimate used to estimate
Percentile curvea 36-point gridb lifetime exposure 62-day exposure
00001 0103842 069359 0072024 0278587 001 0106063 084461 0089582 0346503 01 0128835 093182 0120051 0464356 02 0160687 096331 0154791 0598731 03 0201575 098483 0198517 0767865 04 0254546 100283 0255267 0987372 05 0323879 101963 0330237 1277356 06 0415684 103671 0430944 1666892 07 0538854 105566 0568846 2200298 08 0706593 107924 0762583 2949673 09 0938983 111571 1047632 4052242 095 1088601 115040 1252327 4844000 099 1228987 123092 1512784 5851450 0999 1263482 135000 1705701 6597652 09999 1266995 149000 1887822 7302097
a Curve fit to high-end air concentration frequency distribution in Calhoun et al (1994) b Johnson (1994b)
19
Seasonal exposure was estimated for July-August the period of historically highest Telone use To estimate average daily concentrations for this 62-day period the adjusted annual concentrations were modified as follows In the Calhoun et al simulation all positive air concentrations occurred in two 74shyday periods (60 days of Telone use plus 14 additional days for the material to dissipate) one in spring and the other in summer In their simulation 707 of the total Telone was applied during the summer use period with 40 mass loss to air In the spring period 293 of the Telone was applied with a mass loss rate of 25 To approximate the average daily concentrations during the summer period the fraction of the annual concentration contributed by the summer period was assumed to be (707 x 40) [(707 x 40) + (293 x 25)] = 0794 This fraction was condensed into 74 days by multiplying by 36574 Since actual Telone applications will probably not be restricted to the four months assumed by Calhoun et al historical use patterns were consulted Pesticide use reporting data showed that in 1988 and 1989 585 and 499 respectively of 13-D applied to carrots in Kern County was applied during July and August The simulation summer-period concentrations were further modified to represent concentrations for the 62 days of July-August by multiplying by (585 707) x (7462) The net effect was to multiply the annual concentrations by 3868 The concentrations thus modified shown in the fourth column of Table 15 were used for the estimation of seasonal exposure
For both lifetime and seasonal exposure assessments the average air concentration experienced by each person was simulated by randomly selecting five values from the relevant air distribution These values represented five locations where the individual spent his or her time A weighted average of the five concentrations weighted by the proportion of time spent at each location was used as the air concentration experienced by the individual The same five locations were used throughout a persons life but the division of time between them changed as a function of age The division of time between locations was a random variable in the simulation and is discussed in the section on individual mobility
To estimate exposure to persons living close to fields additional modeling with ISCST was done by the Environmental Monitoring Branch to provide annual average daily air concentrations at 100-meter increments from edges of treated fields (Johnson 1994a) The probability distributions of concentrations at 100 200 and 500 meters which were used in this exposure assessment are given in Table 16 In calculating the average concentration experienced by a person the first location selected at which the greatest portion of time is spent was considered the home location The concentration for the home location was simulated by selecting one value from eg the 100-meter distribution and one from the general distribution then calculating a weighted average with the two values weighted one-third and two-thirds respectively to reflect the fact that a field is treated only once in three years The two values were chosen to have a rank order correlation coefficient of 080 based on an observed correlation of 086 between ambient concentrations in the same township from year to year (personal communication Bruce Johnson Environmental Monitoring Branch DPR June 22 1994) For seasonal exposures the home concentration was simply a value from the relevant distance distribution This home location concentration was then used as described in the preceding paragraph in the calculation of the average concentration over five locations
20
___________________________________________________________________________
________________________________________________________________________________
Table 16 Annual average air concentrations (ugm3) at specified distances from treated fieldsa
Percentile 100 meters 200 meters 500 meters
000333 035393 030113 024996 001 037037 031439 026472 005 046011 040619 029312 01 050768 044753 031998 015 055763 048264 035456 02 058246 051404 036323 025 060290 055147 037940 03 064604 058207 038904 035 070250 062520 040306 04 077585 074610 041207 045 087638 085215 045127 05 090497 090723 049474 055 097657 096199 055052 06 105653 102253 057466 065 117366 117403 062218 07 131421 125398 067783 075 143991 134267 075510 08 154023 142689 079173 085 163177 151078 083575 09 175806 159046 087488 095 195317 178902 099410 099 220345 198031 127958 099667 226113 204338 135822
a Johnson (1994a)
21
________________________________________________________________________________
________________________________________________________________________________
Individual mobility within the Telone use area
Individuals were assumed to divide their total time between five randomly selected locations within the Telone high-use area The average air concentration to which an individual is exposed was calculated as described above as the mean of the five location concentrations weighted by the proportion of time spent in each location The mean division of time between locations was derived for each age interval from Table 45 in the Arabrsquos Survey of Childrens Activity Patterns (Wiley 1991a) and Table 33 in Activity Patterns of California Residents (Wiley 1991b) Wileys time at home was used as the time spent in the first selected location his time in transit was divided equally between two locations and the remaining time in the day divided between two others The division of time between these last two locations was 7030 for infants stepping down by age interval to a 5050 division for adults Individual time divisions were allowed to vary from the mean by randomly generating them from a multinomial distribution with n chosen to give fairly small variability in the youngest intervals and greater variability in the adolescent and adult intervals The distributions for time division are shown in Table 17
Table 17 Probability distributions of time spent in five locations
Multinomial Age n Average minutes per day spent in location
interval parameter 1 2 3 4 5
0 to 1 100 Male 1157 27 27 160 69 Female 1151 38 38 150 63
1 to 2 100 Male 1157 27 27 160 69 Female 1151 38 38 150 63
2 to 3 90 Male 1134 31 31 170 74 Female 1099 44 44 151 102
3 to 6 90 Male 1134 31 31 170 74 Female 1099 44 44 151 102
6 to 9 80 Male 1044 59 30 170 137 Female 1021 27 26 256 110
9 to 12 80 Male 1020 31 31 250 108 Female 968 47 46 265 114
12 to 15 70 Male 893 61 60 256 170 Female 917 49 49 255 170
15 to 18 70 Male 893 61 60 256 170 Female 917 49 49 255 170
18 to 25 60 Male 782 75 74 255 254 Female 862 60 60 229 229
25 to 70 60 Male 798 60 59 262 261 Female 960 51 51 189 189
22
Breathing rates
An individuals average breathing rate in each age interval was calculated as a weighted average of his rates at each of four activity levels resting light moderate and heavy The rate at each level was weighted by the proportion of time the individual was assumed to spend at that level Breathing rate at each activity level was a random variable The proportion of time at each level was a constant fixed for each age interval
For infants (0-1 year) a triangular distribution of breathing rates was derived from the mean and range reported in the Exposure Factors Handbook Table 3A-2 (USEPA 1990) The mode of the triangular distribution was set equal to the lower limit of the range in order to match the EPA mean For the other age intervals uniform distributions were derived from data in the ARBs Measurement of Breathing Rate and Volume (Adams 1993) In each case the range was chosen to include all the reported rates relevant to an activity level for a specific sex and age group These ranges are given in Table 18 Data were unavailable for children aged 1-3 so the breathing rates for 3-6-year-olds were used The breathing rates of an individual at different activity levels within and across ages were assumed to have the rank order correlations shown in Table 19 (The value of 08 on the diagonal represents the correlation between breathing rates of the same individual at the same activity level at different ages) It was not possible to incorporate correlations between body weight and breathing rates because the software used did not handle them correctly Correlation coefficients of body surface area and breathing rate within age intervals and activity levels reported in Adams (1993) ranged from 006 to 084 with a mean of 040 The correlation of body weight and breathing rate may be similar The effect of omitting this correlation from the simulation was probably to increase the estimated exposures to an unknown degree because if the greater exposures associated with high breathing rates tended to be paired with high body weights the exposure would be mitigated somewhat
The proportion of time assumed to be spent at each activity level is shown in Table 20
Body weight
Body weight distributions were taken directly from Tables 5A-1 through 5A-4 in the Exposure Factors Handbook (USEPA 1990) The histograms reported in these tables were used without smoothing Upper and lower bounds were supplied to produce a mean weight equal to the mean given in the EPA tables An individuals weights in different age intervals were assumed to have the rank order correlations shown in Table 21
Residence time and lifetime
In estimating lifetime exposures lifetime length was fixed at 70 years Exposure was estimated separately for fixed times of residence in the Telone use area of 30 and 70 years Since the exposure assessment is viewed as applying to any areas where Telone may be reintroduced in the proposed way and not just to the specific township in Kern County for which Calhoun et al modeled air concentrations it was not reasonable to define a distribution of residence time in the area Instead the estimated exposures are those expected to result from living the first 30 or 70 years of a 70-year lifetime in any area with Telone use like that described here
23
________________________________________________________________________________
________________________________________________________________________________
Table 18 Breathing rates (Lmin) as ranges of uniform distributions
Age interval Activity level Male Female
0 to 1 All Triangular ( 025 025 209 ) 1 to 2 Resting 5-7
Light 7-11 Moderate 8-15 Heavy 14-22
2 to 3 Resting 5-7 Light 7-11 Moderate 8-15 Heavy 14-22
3 to 6 Resting 5-7 Light 7-11 Moderate 8-15 Heavy 14-22
6 to 9 Resting 5-9 Light 10-17 Moderate 11-23 Heavy 20-45
9 to 12 Resting 5-9 Light 10-17 Moderate 11-23 Heavy 20-45
12 to 15 Resting 6-12 5-10 Light 7-17 7-15 Moderate 17-35 15-27 Heavy 25-72 24-59
15 to 18 Resting 6-12 5-10 Light 7-17 7-15 Moderate 17-35 15-27 Heavy 25-72 24-59
18 to 25 Resting 7-11 5-10 Light 8-18 6-15 Moderate 18-42 15-28 Heavy 48-80 39-62
25 to 70 Resting 7-11 5-10 Light 8-18 6-15 Moderate 18-42 15-28 Heavy 48-80 39-62
24
________________________________________________________________________________
_____________________________________________________________________________
________________________________________________________________________________
________________________________________________________________________________
Table 19 Rank order correlation coefficients between individuals breathing rates at different activity levels within and across age intervals
Resting Light Moderate Heavy Resting 08 05 05 04 Light 08 05 04 Moderate 08 05 Heavy 08
Table 20 Proportion of time at each activity level (constant in exposure simulation)
Age Activity level interval
Resting Light Moderate Heavy
0 to 1 Male 1 0 0 0 Female 1 0 0 0
1 to 2 Male 08 015 004 001 Female 08 015 004 001
2 to 3 Male 075 02 004 001 Female 075 02 004 001
3 to 6 Male 07 02 008 002 Female 07 02 008 002
6 to 9 Male 07 017 010 003 Female 07 02 008 002
9 to 12 Male 06 032 005 003 Female 06 033 005 002
12 to 15 Male 06 032 005 003 Female 06 033 005 002
15 to 18 Male 05 04 006 004 Female 05 042 005 003
18 to 25 Male 04 050 006 004 Female 04 052 005 003
25 to 70 Male 035 057 005 003 Female 035 060 004 001
25
________________________________________________________________________________
_______________________________________________________________________________
Table 21 Rank order correlation coefficients between the weights of an individual at different ages
0 to 1 1 to 2 2 to 3 3 to 6 6 to 9 9 to 12 12 to 15 15 to 18 18 to 25 25 to 70
0 to 1 100 092 082 072 061 061 061 061 061 061 1 to 2 100 092 082 072 061 061 061 061 061 2 to 3 100 092 082 072 061 061 061 061 3 to 6 100 092 082 072 061 061 061 6 to 9 100 092 082 072 061 061 9 to 12 100 092 082 072 061 12 to 15 100 082 082 072 15 to 18 100 082 082 18 to 25 100 082 25 to 70 100
Exposure appraisal
The estimated exposure distributions may be regarded as providing a reasonable idea of the highest exposures that should be expected under the use scenario The distributions should not be interpreted as reflecting the exposures of a population of individuals but as a set of values that are likely to bracket the exposure of an individual in this situation
It should be noted that the large differences between estimated seasonal exposures of children less than one and children from one to three are largely produced by the input breathing rate distributions The breathing rate data for infants under one came from a different source than all the other breathing rate data In addition no data were available for children from one to three so the rates for three- to six-year-old children were used In combination with the small body size of these children this may have overestimated their exposures
An important limitation of this exposure assessment is that it used 13-D concentrations in outdoor air to estimate 24-hourday exposure even though most people spend the greatest part of the day indoors Since the registrant provided no data on indoor concentrations and since no appropriate surrogate data were available to estimate them it was judged that there was no alternative
It is important to remember that these estimates of non-occupational exposure apply only to the use scenario of Calhoun et al which specified Telone applications to only 2000 acres per year in an area which has 8500 acres of carrots alone Any change in the use scenario would require a new exposure assessment
26
REFERENCES
Adams WC 1993 Measurement of breathing rate and volume in routinely performed daily activities Final report contract no A033-205 Research Division California Air Resources Board Sacramento CA
Albrecht WN 1987 Occupational exposure to 13-dichloropropene (Telone II) in Hawaiian pineapple culture Arch Environ Health 42286-290
Brouwer DH Brouwer EJ de Vreede JAF van Welie RTH Vermuelen NPE and van Hemmen JJ 1991 Inhalation exposure to 13-dichloropropene in the Dutch flower-bulb culture Part I Environmental monitoring Arch Environ Contam Toxicol 201-5
Calhoun LL Fontaine DD Stuart BL and Landenberger BD 1994 13shydichloropropene (13-D) An assessment of implied exposure and risk for the proposed commercial reentry of TELONE soil fumigant into California Dow Chemical Co Midland MI
California Department of Food and Agriculture 1988 Report of pesticides sold in California in 1987 Pesticide Use Enforcement Branch California Department of Food and Agriculture Sacramento CA
Climie IJG Hutson DH Morrison BJ and Stoydin G 1979 Glutathione conjugation in the detoxification of (Z)-13-dichloropropene (a component of the nematicide D-D) Xenobiotica 9149-156
Cohen B-S M and Poppendorf W 1989 A method for monitoring dermal exposure to volatile chemicals Am Ind Hyg Assoc J 50 216-223
Cook RE 1983 Fumigators exposure to airborne 13-dichloropropene during fumigation operation of Telone II soil fumigant Driscoll Citrus Service Inc Fort Pierce Florida Unpublished report of the Dow Chemical Chemical Company Industrial Hygiene Laboratory Midland MI January 4 1983
Davies DB and Fraser PA 1988 Evaluation of potential operator fieldworker and bystander exposure to 13-dichloropropene as a result of tobacco field fumigation with Telone II soil fumigant in southwestern Ontario (Canada) May-June 1985 CDFA Reg Doc No 50046-039
Dietz FK Hermann EA and Ramsey JC 1984a The pharmacokinetics of 14C-13shydichloropropene in rats and mice following oral administration The Toxicologist 4 Abstr No 585
Dietz FK Dittenber DA Krik HD and Ramsey JC 1984b Non-protein sulfhydryl content and macromolecular binding in rats and mice following oral administration of 13shydichloropropene The Toxicologist 4 Abstr No 586
Fisher GD and Kilgore WW 1988a Tissue levels of glutathione following acute inhalation of 13-dichloropropene J Toxicol Environ Health 23171-182
Fisher GD and Kilgore WW 1988b Mercapturic acid excretion in rats following 13shydichloropropene inhalation exposure Fund Appl Toxicol 11 303-307
27
Fisher GD and Kilgore WW 1989 Pharmacokinetics of S-[3-chloroprop-2shyenyl]glutathione in rats following acute inhalation exposure to 13-dichloropropene Xenobiotica 19269-278
Fong HR and Maykoski R 1985 Air exposure monitoring of EHAP personnel during a Telone II soil translocation study in Fresno County CDFA Rpt HS 1299
Houtman BA 1992 Managing worker exposure 13-D in California
Houtman BA 1993 An evaluation of 13-dichloropropene worker exposure associated with Telone II soil fumigant loading application and reentry phase I ECL92095 (interim report)
Hutson DH Moss JA and Pickering BA 1971 The excretion and retention of components of the soil fumigant D-D and their metabolites in the rat Food Cosmet Toxicol 9 677-680
Johnson B 1994a Memorandum to John Sanders June 20 1994 on buffer zone calculations for 13-D in Kern County Environmental Monitoring and Pest Management Branch Department of Pesticide Regulation Sacramento CA
Johnson B 1994b Memorandum to Kean Goh May 16 1994 on estimated adjusted air concentration percentiles based on Dow simulation results for T29R26 Environmental Monitoring and Pest Management Branch Department of Pesticide Regulation Sacramento CA
Maddy KT Cusick B Richmond D 1980 Studies concerning the field application of Telone and DD in California in 1979 and the ambient air concentration of these pesticides during and following application by shank injection into soil in fields CDFA Rpt HS 686
Maddy KT Schneider F and Fredrickson S 1982 Monitoring of Telone II during and following experimental application by shank injection to established trees and grape vines in California in 1980-1981 CDFA Rpt 967
NIOSHOSHA Occupational Safety and Health Guidelines for Chemical Hazards 1988 DHHS (NIOSH) Publication No 81-1231981 and supplements Publication Nos 88-118 and 89-104
Osterloh JD Cohen BS Poppendorf W and Pond SM 1984 Urinary excretion of the N-cysteine conjugate of cis-13-dichloropropene by exposed individuals Arch Environ Health 39 271-275
Osterloh JD Wang R OConnell L Jacob III P and Maddy KT 1989a Pilot study for biological monitoring of 13-dichloropropene In Biological Monitoring of Pesticide Exposure RG Wang CA Franklin RC Honeycutt and JC Reinert (eds) Amer Chem Soc Soc Symp Ser No 382 215-230
Osterloh JD Wang R Schneider F and Maddy K 1989b Biological monitoring of dichloropropene Air concentrations urinary metabolite and renal enzyme excretion Arch Environ Health 44 207-213
Owen WJ and DeRouen TA 1980 Estimation of the mean for lognormal data containing zeroes and left-censored values with applications to the measurement of worker exposure to air contaminants Biometrics 36 707 719
28
Palisades Corporation 1992 RISK Risk analysis and simulation add-in for Microsoft Excel Release 11 users guide 31 Decker Rd Newfield NY 14867
Poppendorf W Leffingwell JT and Cohen B 1983 Development of methods and procedures for the assessment of occupational health risks in the application and use of nematicides in California CDFA Rpt HS 1162
Shapiro SS and Wilk MB 1965 An analysis for normality (complete samples) Biometrika 52 591-611
Stott WT and Kastl PE 1986 Inhalation pharmacokinetics of technical grade 13shydichloropropene Toxicol Appl Pharmacol 85 332-341
Stott WT 1992 Letter to J R Sanborn August 11 1992
Tobol HK and Axe FD 1982 Airborne concentrations of 13-dichloropropene during fumigation of established grapevines almond trees and peach trees California December 1980-January 1981 Unpublished report of the Dow Chemical Company Environmental ServicesIndustrial Hygiene Western Division Dow Chemical USA Report No HeRW-AG(8)
US EPA 1990 Exposure factors handbook EPA6008-89043 Office of Health and Environmental Assessment Washington DC
Van Welie RTH van Duyn P Brouwer DH van Hemmen JJ Brouwer EJ and Vermuelen NPE 1991 Inhalation exposure to 13-dichloropropene in the Dutch flower-bulb culture Part II Biological monitoring by measurement of urinary excretion of two mercapturic acid metabolites Arch Environ Contam Toxicol 206-12
Waechter JM Brazak KA McCarty LP LaPack MA and Brownson 1992 13shydichloropropene (Telone II Soil Fumigant) Inhalation pharmacokinetics and metabolism in human volunteers DowElanco (Interim Report) Laboratory Project Study ID M-002993-023
Wagner CP 1987 Industrial source complex (ISC) dispersion model users guide 2nd edition (revised) Vol I US Environmental Protection Agency Report No EPA-4054-88shy002 a
Wiley JA 1991a Study of childrens activity patterns Final report contract no A733-149 Research Division California Air Resources Board Sacramento CA
Wiley JA 1991b Activity patterns of California residents Final report contract no A6-177shy33 Research Division California Air Resources Board Sacramento CA
29

_____________________________________________________________________
_____________________________________________________________________
Davies and Fraser While the Maddy data is very likely an underestimate of dermal exposure the dermal estimates of Davies and Fraser are overestimates due to the experimental design Since the hand exposure values are for 12 hrsday (estimated daily loading time) the dermal component becomes a minor contributor of the overall human exposure which is primarily via inhalation
Annual and Lifetime Exposure Days
Estimates of worker exposure time are provided by the US EPA Data Call-In for handlers of 13-D in crops grown in California that have been treated with 13-D (Houtman 1992) This survey provided information on the number days per year for each crop that 13-D was handled for applicators and loaders in California (Table 5 ) The maximum number of days per career was estimated to be 270 The number of days per career ranged from a low of 24 for potatoes to a high of 270 for brassica It is possible that the same individuals applying for brassica could be applying in vegetables which could mean that an individuals exposure days per year or career could be as high as the total for all crops However it is likely to be much less because the calendar window for application to each crop prevents any one person from working all of them
Table 5 Annual and lifetime handling days for loaders (L) applicators (A) and repairs (R)
Tomato Potato Cotton Vegetables Brassica Beets TreeVine LAR LAR LAR LAR LAR LAR LAR
Annual Custom 162334 444 403626 183524 363636 101010 2298
Grower 111 111 2213 353535 000 111 444
Lifetime Custom 104150221 242424 260234169 108210144 270270270 656565 1988172
Grower 454545 252525 99585 875875875 000 454545 121212
Biological Monitoring
Osterloh et al (1984 1989 a and b) reported human exposure studies with 22 workers loading and applying in which they conducted urinary monitoring for N-acetyl-S-(3-chloroprop-2shyenyl)cysteine (DCPMER) Respiratory protection (half-face) was worn only during loading and not during application An average of 34 mg of DCPMER was excreted in the 24-hour period after exposure Correction for the molecular weight difference between 13-D (111) and DCPMER (237) gives an ADD of 16 mgpersonday or 227 ugkgday Using the data of Davies and Fraser (1988) it is possible to calculate the percentage of the exposure received during application and loading In Davies and Fraser it was determined that 261 percent of the exposure occurred during application 739 during loading Osterloh et al assumed 90 protection from the half-face respirator worn during loading hence the inhaled dose was 01 times the exposure During application 10 (0 respiratory protection) indicates the absence of respirators The absorbed dose for each activity may be found by the following equation
8
Loading Application (739 )(X)(01) + (261)(X)(10) = 227 ugkgday (1)
where X is exposure Solving for X gives 678 ugkgday Putting this value back into equation (1) and adding respiratory protection (half-face respirators) during application gives
Loading Application (739)(678)(01) + (261 )(678)(01) = 68 ugkgday
The value of 68 ugkgday is the expected ADD if half-face respirators are worn during both loading and application
Houtman (1993) monitored five individuals loading or applying 13-D in Washington state The same individual did not do both tasks These applicators and loaders carried out one application per day at a rate of 25 galacre lasting about four hours One application was done without mitigation measures while the others used various mitigation measures specified by the US EPA including dry disconnects (with and without vapor recovery) spill control at the end of the rows and a cab with charcoal-filtered air Houtman collected urinary monitoring data only for the application conducted without mitigation measures To estimate the absorbed daily dose from these unmitigated conditions respiratory protection factors of 09 and 095 for half-face and full-face respirators were used for applicators and loaders respectively The human chamber PBPK exposure study data were used in the absorbed dose calculation These respiratory protection requirements for loaders and applicators were part of the Permit Conditions in California for the flux studies and the Monterey Commercial Use Project These same respiratory protection conditions will be required if 13-D is reinstated in California
The exposure data shown in Table 6 as geometric means have been normalized to an 68shyhour day which is consistent with the data of Davies and Fraser (1988) and allows comparison with the data of Osterloh et al where one person performed both loading and application
Houtman (1993) found that utilizing spill control during application reduced the ambient air concentrations by 79 The urinary metabolite data were adjusted by this factor The absorbed dose was adjusted for the wearing of a one-half face respirator from the unmitigated application in Washington The final adjustment of the data from Washington was the factoring of the reduced rate in California (12 galacre) as compared to the 25 galacre that were used in the studies in Washington The loader exposure data were not adjusted for the reduced rate in California as the exposure occurs primarily during the connecting and disconnection of the hose from the nurse tank and is unrelated to the amount placed in the tank on the tractor
With respect to the estimation of AADD and LADD the range of values for loading and applying were obtained from the crop specific data compiled in Table 5 There are several reasons for the reduced exposure of a combined (one person doing both tasks) load and apply (19 ugkgday) in the Washington study (Houtman 1993) as compared to the earlier combined estimate of Osterloh et al (68 ugkgday) Firstly for the loader the Washington study used dry disconnects and vapor recovery devices For the applicator spill control was used at the end of the rows Each of these mitigation strategies reduces ambient air concentration which resulted in lower estimated exposure value of more than three-fold It is further likely that the soil moisture content will be higher in California than occurred during the applications in Washington This will further reduce emissions
9
_____________________________________________________________________
_____________________________________________________________________
Table 6 ADD AADD and LADD values for loading and application of 13- dichloropropene
Study Task ADD1 Days SADD4 AADD5 Days LADD6
(ugkgd) Year (ugkgd) (ugkgd) Career (ugkgd)
Osterloh et al LoadApply 680
Houtman Load 0733 4 0016 0008 24 69x10-4
40 016 008 270 77x10-3
Apply 1133 4 36
0025 023
0012 011
24 270
11x10-3
12x10-2
Total2 186
1 Absorbed Daily Dosage two load and application cyclesday body weights of study volunteers used in calculations
2 One person doing both loading and applying-for comparison to studies of Osterloh et al 3 Normalized to 68 hrs based on registrant study (Davies and Fraser 1988) for one
person doing both tasks to be compared with Osterloh et al 4 Split application for brassica 90-day window (see Table 5) 5 Annual Average Daily Dosage (365 daysyear) 6 Lifetime Average Daily Dosage 70 years life (25550 days)
Exposure Appraisal
The exposure estimates based on the Houtman (1993) study in which exposures were measured separately for loading and application should be used for the assessment of risk These estimates are based on biological monitoring that assessed both cis- and transshymercapturate metabolites in the urine and utilized the pharmacokinetic information developed from exposure of humans under controlled conditions Hand exposure information developed by previous investigators was not used as this route of exposure would be reflected in the total exposure measured by the biological monitoring
None of the occupational exposure studies in which biological monitoring was conducted employed exactly the mitigation measures that would be required in California These requirements are for full-face respiratory protection during loading and half-face protection during application
NON-OCCUPATIONAL EXPOSURE
Inhalation exposure was estimated for residents of an area where Telone is used in carrot growing Both lifetime and subchronic (seasonal) exposures were estimated for residents of the area in general and for residents with homes at specified distances from Telone-treated fields (100 200 and 500 meters) The estimated lifetime exposure distributions are given in Tables 7 through 10 seasonal exposures in Tables 11 through 14
10
=
The exposure assessment relied on simulated air concentrations from a study provided by the registrant (Calhoun et al 1994) in which the ISCST simulation model (Wagner 1987) was used to predict concentrations of 13-D in air for a scenario of limited reintroduction of Telone IItrade soil fumigant in carrots In the use scenario modeled Telone is applied to 25 80-acre fields (2000 acres total) per year in a 9-township (324-square-mile) area in Kern County Under this scenario there is no other use of Telone All applications are at the rate of 12 gallons per acre and no field is treated more than once in three years Calhoun et al simulated three years of daily air concentrations for one point at the center of each section in the reintroduction area to produce an annual average daily concentration for each point The locations of treated fields were assigned randomly in their model so that concentrations at the section centers vary in part due to being different distances and directions from applications The modeled concentrations thus represent long-term ambient concentrations for the reintroduction area Calhoun et al presented separately the concentrations for the township of highest Telone use within the 9-township area These concentrations were used in the exposure assessment
Probability distributions of exposure were estimated using stochastic simulation (Monte Carlo) methods implemented with the program RISK (Palisades Corporation 1992) The distribution of lifetime average daily dose (LADD) as ug of 13-D inhaled per kg of body weight per day (ugkgday) was estimated separately for persons living 1) the first 30 years of and 2) all of a 70-year lifetime in the reintroduction area Seasonal exposure was estimated for July-August the period of greatest Telone use by adjusting the long-term air concentrations for proportional use and mass loss during that 62-day period Additional simulated air concentrations provided by the Environmental Monitoring Branch (Johnson 1994a) were incorporated to estimate both lifetime and 62-day exposures to residents whose dwellings are close to treated fields Exposure distributions were estimated separately for residents living 100 200 and 500 meters from the edges of treated fields Each estimated exposure distribution is based on a simulation with 10000 trials
LADD (ugkgday) was calculated by the following equation
10
([ ]) i 1
where the summation is over 10 age intervals RTi = number of years in age interval i that the person
resides in the Telone use area Conci = average of air concentrations (ugm3) in 5
locations weighted by the proportion of time spent in each location in interval i
BRi = average breathing rate (m3day) at each of 4 activity levels weighted by proportion of time spent at each level in interval i
BWi = body weight (kg) in interval i and 70 years is the assumed lifetime
LADD = RT Conci x BR BW 70i i i
11
Seasonal exposure (62-day average ugkgday) was calculated separately for each age interval as Conc x BR
Average daily dose = BW
where concentration breathing rate and body weight are as defined above for LADD but with air concentrations modified to approximate seasonal averages as explained in the next section
Concentration breathing rate and body weight were stochastic variables in the exposure simulation model The statistical distributions used to simulate them are described in the sections on specific input variables following Tables 7-14
12
___________________________________________________________________________
Table 7 Lifetime average daily dose (ugkgday) of 13-D inhaled by residents of an area where Telone is applied to a total of 25 80-acre fields each year
Residence Time
Birth to age 30 Birth to age 70 Male Female Male Female
Mean 00800 00783 01510 01436 Std Deviation 00480 00487 00867 00902
Percentile 5 0027 0026 0053 0047
10 0032 0031 0063 0056 25 0044 0042 0087 0078 50 0066 0063 0129 0116 75 0103 0101 0193 0186 90 0150 0148 0277 0270 95 0179 0179 0326 0330
975 --a -- -- -shy99 0230 0236 0425 0444
a not calculated
Table 8 Lifetime average daily dose (ugkgday) of 13-D inhaled by residents living 100 m from treated fields in an area where Telone is applied to a total of 25 80-acre fields each year
Residence Time
Birth to age 30 Birth to age 70 Male Female Male Female
Mean 01022 01001 01892 01829 Std Deviation 00514 00515 00926 00959
Percentile 5 0042 004 0078 0071
10 0048 0047 0091 0084 25 0063 0061 012 0111 50 009 0087 0168 0159 75 0129 0128 0238 0233 90 0176 0174 0319 0319 95 0204 0201 0373 0371
975 0228 0227 0416 0423 99 0262 0257 0481 0481
13
___________________________________________________________________________
Table 9 Lifetime average daily dose (ugkgday) of 13-D inhaled by residents living 200 m from treated fields in an area where Telone is applied to a total of 25 80-acre fields each year
Residence Time
Birth to age 30 Birth to age 70 Male Female Male Female
Mean 00996 00973 01846 0178 Std Deviation 00501 00499 00901 00932
Percentile 5 0039 0038 0073 0067
10 0046 0044 0087 008 25 0061 006 0116 0108 50 0088 0086 0165 0156 75 0127 0124 0234 0227 90 0171 0168 0311 0307 95 0199 0196 036 0363
975 0222 022 0408 0414 99 0253 0248 0458 0465
Table 10 Lifetime average daily dose (ugkgday) of 13-D inhaled by residents living 500 m from treated fields in an area where Telone is applied to a total of 25 80-acre fields each year
Residence Time
Birth to age 30 Birth to age 70 Male Female Male Female
Mean 0084 00818 01577 01498 Std Deviation 00423 00419 00772 00781
Percentile 5 0034 0033 0065 0059
10 004 0039 0076 0069 25 0053 0051 0101 0093 50 0074 0071 014 013 75 0106 0103 0198 0189 90 0144 0141 0265 0259 95 0169 0167 031 0305
975 0191 0189 0352 0352 99 0216 0212 04 04
14
Table 11 Average daily dose (ugkgday) of 13-D inhaled by residents during the 62-day period of highest Telone use in an area where Telone is applied to a total of 25 80-acre fields each year
Age Group
lt 1 1 lt 2 2 lt 3 3 lt 6 6 lt 9 Male Female Male Female Male Female Male Female Male Female
Mean 02499 02707 15513 16841 13685 14366 11103 11467 10548 10651 Std Deviation 02270 02431 10419 11219 09039 09243 07460 07561 06797 06863
Percentile 5 0045 0050 0470 0520 0422 0464 0333 0361 0330 0326
10 0058 0065 0558 0616 0501 0549 0399 0426 0397 0395 25 0098 0108 0770 0841 0691 0750 0553 0589 0558 0560 50 0173 0192 1207 1308 1070 1134 0869 0904 0849 0863 75 0321 0343 2052 2244 1815 1897 1466 1507 1367 1396 90 0539 0590 3126 3385 2738 2804 2242 2249 2050 2038 95 0714 0789 3750 4047 3260 3375 2659 2731 2464 2474
975 0903 0966 4233 4530 3667 3821 3010 3137 2783 2880 99 1125 1183 4711 5124 4108 4260 3468 3522 3230 3296
9 lt 12 12 lt 15 15 lt 18 18lt 25 25 lt 70 Male Female Male Female Male Female Male Female Male Female
Mean 07953 07730 06536 05394 05300 04984 05297 04964 04809 04414 Std Deviation 05168 04897 04050 03320 03172 02980 02904 02913 02688 02840
Percentile 5 0239 0237 0208 0172 0176 0164 0188 0164 0167 0132
10 0291 0292 0254 0209 0214 0196 0228 0200 0201 0164 25 0417 0412 0360 0295 0298 0278 0314 0284 0281 0236 50 0645 0635 0545 0453 0447 0419 0459 0422 0416 0362 75 1029 1007 0835 0694 0676 0645 0676 0637 0618 0567 90 1529 1455 1209 0998 0977 0917 0930 0904 0848 0830 95 1870 1767 1457 1207 1171 1103 1103 1085 1018 1022
975 2118 2080 1713 1413 1338 1279 1267 1252 1166 1190 99 2496 2341 2020 1645 1568 1450 1468 1433 1342 1382
15
Table 12 Average daily dose (ugkgday) of 13-D inhaled during the 62-day period of highest Telone use by residents living 100 m from fields in an area where Telone is applied to a total of 25 80-acre fields each year
Age Group
lt 1 1 lt 2 2 lt 3 3 lt 6 6 lt 9 Male Female Male Female Male Female Male Female Male Female
Mean 04940 05352 30723 33330 26876 27770 21802 22126 19918 19861 Std Deviation 03548 03830 14181 15406 12335 12549 10277 10370 09528 09564
Percentile 5 0118 0128 1368 1490 1206 1263 0942 0968 0852 0833
10 0152 0166 1545 1672 1347 1418 1069 1098 0969 0965 25 0238 0258 1924 2096 1697 1757 1366 1393 1255 1254 50 0395 0425 2710 2949 2360 2470 1918 1960 1760 1766 75 0641 0699 4008 4347 3502 3620 2833 2868 2545 2529 90 0976 1076 5137 5567 4481 4594 3657 3725 3371 3371 95 1217 1331 5792 6272 5021 5177 4158 4258 3831 3879
975 1450 1563 6306 6950 5536 5720 4615 4647 4261 4271 99 1680 1784 6915 7610 6021 6204 5033 5157 4801 4847
9 lt 12 12 lt 15 15 lt 18 18lt 25 25 lt 70 Male Female Male Female Male Female Male Female Male Female
Mean 14857 14065 11533 09575 09336 08872 08833 08610 08063 08020 Std Deviation 07344 06874 05796 04659 04444 04134 03970 04030 03694 04061
Percentile 5 0603 0573 0464 0396 0393 0379 0383 0359 0350 0305
10 0701 0667 0539 0459 0454 0438 0447 0422 0405 0366 25 0923 0890 0723 0610 0599 0571 0584 0558 0526 0499 50 1314 1244 1020 0849 0833 0792 0802 0770 0733 0704 75 1899 1795 1456 1209 1184 1126 1111 1091 1007 1034 90 2530 2389 1927 1605 1549 1481 1436 1433 1316 1382 95 2925 2770 2287 1863 1809 1695 1662 1661 1524 1604
975 3280 3076 2623 2102 2000 1867 1841 1818 1725 1790 99 3678 3463 3033 2434 2278 2101 2083 2029 1922 2018
16
Table 13 Average daily dose (ugkgday) of 13-D inhaled during the 62-day period of highest Telone use by residents living 200 m from fields in an area where Telone is applied to a total of 25 80-acre fields each year
Age Group
lt 1 1 lt 2 2 lt 3 3 lt 6 6 lt 9 Male Female Male Female Male Female Male Female Male Female
Mean 04605 05018 28772 31305 25168 26084 20439 20856 18713 18739 Std Deviation 03227 03596 13044 14290 11309 11633 09438 09779 08750 08917
Percentile 5 0112 0117 1229 1308 1089 1124 0851 0854 0758 0745
10 0139 0155 1382 1492 1222 1278 0978 0986 0895 0871 25 0219 0243 1778 1935 1568 1633 1265 1293 1169 1170 50 0374 0401 2647 2865 2324 2404 1865 1887 1700 1694 75 0607 0664 3775 4152 3289 3433 2687 2734 2426 2428 90 0906 0998 4704 5195 4114 4278 3387 3499 3103 3164 95 1112 1238 5266 5730 4585 4726 3771 3915 3536 3593
975 1300 1441 5770 6269 5016 5128 4206 4249 3908 3920 99 1534 1688 6289 6837 5542 5607 4605 4696 4281 4346
9 lt 12 12 lt 15 15 lt 18 18lt 25 25 lt 70 Male Female Male Female Male Female Male Female Male Female
Mean 13973 13308 10879 09069 08808 08389 08368 08156 07646 07564 Std Deviation 06736 06511 05331 04368 04053 03864 03650 03789 03405 03774
Percentile 5 0539 0511 0423 0356 0362 0348 0358 0328 0322 0284
10 0648 0604 0501 0423 0424 0405 0419 0390 0376 0336 25 0872 0824 0679 0567 0570 0530 0554 0523 0503 0462 50 1254 1199 0982 0819 0799 0766 0779 0745 0706 0675 75 1816 1723 1388 1170 1128 1081 1064 1044 0961 0984 90 2351 2273 1816 1521 1439 1382 1328 1350 1231 1286 95 2687 2563 2107 1726 1643 1579 1522 1527 1409 1483
975 2965 2847 2365 1940 1850 1741 1692 1704 1581 1659 99 3358 3142 2680 2170 2043 1922 1877 1904 1767 1851
17
Table 14 Average daily dose (ugkgday) of 13-D inhaled during the 62-day period of highest Telone use by residents living 500 m from fields in an area where Telone is applied to a total of 25 80-acre fields each year
Age Group
lt 1 1 lt 2 2 lt 3 3 lt 6 6 lt 9 Male Female Male Female Male Female Male Female Male Female
Mean 02906 03157 18121 19672 15953 16652 12951 13295 12146 12220 Std Deviation 01948 02105 07170 07709 06263 06341 05264 05343 04984 05174
Percentile 5 0078 0085 0934 1024 0826 0878 0655 0659 0588 0584
10 0099 0107 1041 1141 0920 0977 0724 0750 0671 0666 25 0147 0161 1257 1387 1111 1185 0892 0940 0840 0842 50 0242 0264 1653 1777 1457 1523 1180 1209 1114 1116 75 0378 0413 2232 2419 1974 2044 1596 1633 1494 1494 90 0550 0592 2797 3022 2460 2547 2028 2059 1897 1936 95 0674 0724 3194 3462 2803 2891 2301 2344 2167 2204
975 0809 0878 3536 3831 3097 3174 2574 2652 2438 2478 99 0957 1046 3922 4256 3424 3539 2853 2981 2705 2881
9 lt 12 12 lt 15 15 lt 18 18lt 25 25 lt 70 Male Female Male Female Male Female Male Female Male Female
Mean 09136 08829 07399 06103 05984 05640 05913 05588 05364 05024 Std Deviation 03929 03854 03262 02660 02473 02308 02375 02331 02169 02240
Percentile 5 0418 0399 0330 0285 0280 0274 0280 0264 0254 0223
10 0481 0463 0381 0324 0321 0310 0327 0305 0292 0258 25 0621 0603 0501 0418 0418 0392 0415 0385 0373 0336 50 0841 0805 0677 0556 0557 0517 0553 0516 0501 0455 75 1127 1084 0917 0749 0732 0689 0724 0689 0658 0624 90 1458 1401 1188 0961 0927 0877 0908 0872 0833 0813 95 1674 1633 1373 1129 1069 1009 1044 0999 0947 0922
975 1843 1818 1532 1256 1208 1112 1175 1101 1055 1031 99 2078 2087 1729 1481 1323 1276 1306 1277 1190 1210
18
___________________________________________________________________________
___________________________________________________________________________
INPUT VARIABLES FOR EXPOSURE SIMULATION
Air concentrations
Table 15 gives the probability distributions of air concentrations (in ugm3) used as input in the exposure simulations The first column gives percentiles of the distribution interpolated from a four-parameter logistic curve fit to the original Calhoun et al frequency distribution The interpolated concentrations were adjusted by factors developed by the Environmental Monitoring Branch of DPR (Johnson 1994b) shown in the second column Environmental Monitoring did additional modeling with ISCST to develop an adjustment to approximate the effect of using a 36-point-per-section spatial grid to model air concentrations instead of the relatively coarse 1-point-per-section grid used by Calhoun et al The effect of the adjustment is to increase the variability of the air concentrations while the mean level is unchanged The adjusted concentrations appear in the third column These adjusted values reflecting annual average daily concentrations for points on a 36-point-per-section grid were used for the estimation of lifetime average exposure
Table 15 Air concentration (ugm3) probability distributions used in exposure simulation
Concentrations Adjustment Adjusted Adjusted interpolated from 4shy factors to concentrations concentrations parameter logistic approximate used to estimate used to estimate
Percentile curvea 36-point gridb lifetime exposure 62-day exposure
00001 0103842 069359 0072024 0278587 001 0106063 084461 0089582 0346503 01 0128835 093182 0120051 0464356 02 0160687 096331 0154791 0598731 03 0201575 098483 0198517 0767865 04 0254546 100283 0255267 0987372 05 0323879 101963 0330237 1277356 06 0415684 103671 0430944 1666892 07 0538854 105566 0568846 2200298 08 0706593 107924 0762583 2949673 09 0938983 111571 1047632 4052242 095 1088601 115040 1252327 4844000 099 1228987 123092 1512784 5851450 0999 1263482 135000 1705701 6597652 09999 1266995 149000 1887822 7302097
a Curve fit to high-end air concentration frequency distribution in Calhoun et al (1994) b Johnson (1994b)
19
Seasonal exposure was estimated for July-August the period of historically highest Telone use To estimate average daily concentrations for this 62-day period the adjusted annual concentrations were modified as follows In the Calhoun et al simulation all positive air concentrations occurred in two 74shyday periods (60 days of Telone use plus 14 additional days for the material to dissipate) one in spring and the other in summer In their simulation 707 of the total Telone was applied during the summer use period with 40 mass loss to air In the spring period 293 of the Telone was applied with a mass loss rate of 25 To approximate the average daily concentrations during the summer period the fraction of the annual concentration contributed by the summer period was assumed to be (707 x 40) [(707 x 40) + (293 x 25)] = 0794 This fraction was condensed into 74 days by multiplying by 36574 Since actual Telone applications will probably not be restricted to the four months assumed by Calhoun et al historical use patterns were consulted Pesticide use reporting data showed that in 1988 and 1989 585 and 499 respectively of 13-D applied to carrots in Kern County was applied during July and August The simulation summer-period concentrations were further modified to represent concentrations for the 62 days of July-August by multiplying by (585 707) x (7462) The net effect was to multiply the annual concentrations by 3868 The concentrations thus modified shown in the fourth column of Table 15 were used for the estimation of seasonal exposure
For both lifetime and seasonal exposure assessments the average air concentration experienced by each person was simulated by randomly selecting five values from the relevant air distribution These values represented five locations where the individual spent his or her time A weighted average of the five concentrations weighted by the proportion of time spent at each location was used as the air concentration experienced by the individual The same five locations were used throughout a persons life but the division of time between them changed as a function of age The division of time between locations was a random variable in the simulation and is discussed in the section on individual mobility
To estimate exposure to persons living close to fields additional modeling with ISCST was done by the Environmental Monitoring Branch to provide annual average daily air concentrations at 100-meter increments from edges of treated fields (Johnson 1994a) The probability distributions of concentrations at 100 200 and 500 meters which were used in this exposure assessment are given in Table 16 In calculating the average concentration experienced by a person the first location selected at which the greatest portion of time is spent was considered the home location The concentration for the home location was simulated by selecting one value from eg the 100-meter distribution and one from the general distribution then calculating a weighted average with the two values weighted one-third and two-thirds respectively to reflect the fact that a field is treated only once in three years The two values were chosen to have a rank order correlation coefficient of 080 based on an observed correlation of 086 between ambient concentrations in the same township from year to year (personal communication Bruce Johnson Environmental Monitoring Branch DPR June 22 1994) For seasonal exposures the home concentration was simply a value from the relevant distance distribution This home location concentration was then used as described in the preceding paragraph in the calculation of the average concentration over five locations
20
___________________________________________________________________________
________________________________________________________________________________
Table 16 Annual average air concentrations (ugm3) at specified distances from treated fieldsa
Percentile 100 meters 200 meters 500 meters
000333 035393 030113 024996 001 037037 031439 026472 005 046011 040619 029312 01 050768 044753 031998 015 055763 048264 035456 02 058246 051404 036323 025 060290 055147 037940 03 064604 058207 038904 035 070250 062520 040306 04 077585 074610 041207 045 087638 085215 045127 05 090497 090723 049474 055 097657 096199 055052 06 105653 102253 057466 065 117366 117403 062218 07 131421 125398 067783 075 143991 134267 075510 08 154023 142689 079173 085 163177 151078 083575 09 175806 159046 087488 095 195317 178902 099410 099 220345 198031 127958 099667 226113 204338 135822
a Johnson (1994a)
21
________________________________________________________________________________
________________________________________________________________________________
Individual mobility within the Telone use area
Individuals were assumed to divide their total time between five randomly selected locations within the Telone high-use area The average air concentration to which an individual is exposed was calculated as described above as the mean of the five location concentrations weighted by the proportion of time spent in each location The mean division of time between locations was derived for each age interval from Table 45 in the Arabrsquos Survey of Childrens Activity Patterns (Wiley 1991a) and Table 33 in Activity Patterns of California Residents (Wiley 1991b) Wileys time at home was used as the time spent in the first selected location his time in transit was divided equally between two locations and the remaining time in the day divided between two others The division of time between these last two locations was 7030 for infants stepping down by age interval to a 5050 division for adults Individual time divisions were allowed to vary from the mean by randomly generating them from a multinomial distribution with n chosen to give fairly small variability in the youngest intervals and greater variability in the adolescent and adult intervals The distributions for time division are shown in Table 17
Table 17 Probability distributions of time spent in five locations
Multinomial Age n Average minutes per day spent in location
interval parameter 1 2 3 4 5
0 to 1 100 Male 1157 27 27 160 69 Female 1151 38 38 150 63
1 to 2 100 Male 1157 27 27 160 69 Female 1151 38 38 150 63
2 to 3 90 Male 1134 31 31 170 74 Female 1099 44 44 151 102
3 to 6 90 Male 1134 31 31 170 74 Female 1099 44 44 151 102
6 to 9 80 Male 1044 59 30 170 137 Female 1021 27 26 256 110
9 to 12 80 Male 1020 31 31 250 108 Female 968 47 46 265 114
12 to 15 70 Male 893 61 60 256 170 Female 917 49 49 255 170
15 to 18 70 Male 893 61 60 256 170 Female 917 49 49 255 170
18 to 25 60 Male 782 75 74 255 254 Female 862 60 60 229 229
25 to 70 60 Male 798 60 59 262 261 Female 960 51 51 189 189
22
Breathing rates
An individuals average breathing rate in each age interval was calculated as a weighted average of his rates at each of four activity levels resting light moderate and heavy The rate at each level was weighted by the proportion of time the individual was assumed to spend at that level Breathing rate at each activity level was a random variable The proportion of time at each level was a constant fixed for each age interval
For infants (0-1 year) a triangular distribution of breathing rates was derived from the mean and range reported in the Exposure Factors Handbook Table 3A-2 (USEPA 1990) The mode of the triangular distribution was set equal to the lower limit of the range in order to match the EPA mean For the other age intervals uniform distributions were derived from data in the ARBs Measurement of Breathing Rate and Volume (Adams 1993) In each case the range was chosen to include all the reported rates relevant to an activity level for a specific sex and age group These ranges are given in Table 18 Data were unavailable for children aged 1-3 so the breathing rates for 3-6-year-olds were used The breathing rates of an individual at different activity levels within and across ages were assumed to have the rank order correlations shown in Table 19 (The value of 08 on the diagonal represents the correlation between breathing rates of the same individual at the same activity level at different ages) It was not possible to incorporate correlations between body weight and breathing rates because the software used did not handle them correctly Correlation coefficients of body surface area and breathing rate within age intervals and activity levels reported in Adams (1993) ranged from 006 to 084 with a mean of 040 The correlation of body weight and breathing rate may be similar The effect of omitting this correlation from the simulation was probably to increase the estimated exposures to an unknown degree because if the greater exposures associated with high breathing rates tended to be paired with high body weights the exposure would be mitigated somewhat
The proportion of time assumed to be spent at each activity level is shown in Table 20
Body weight
Body weight distributions were taken directly from Tables 5A-1 through 5A-4 in the Exposure Factors Handbook (USEPA 1990) The histograms reported in these tables were used without smoothing Upper and lower bounds were supplied to produce a mean weight equal to the mean given in the EPA tables An individuals weights in different age intervals were assumed to have the rank order correlations shown in Table 21
Residence time and lifetime
In estimating lifetime exposures lifetime length was fixed at 70 years Exposure was estimated separately for fixed times of residence in the Telone use area of 30 and 70 years Since the exposure assessment is viewed as applying to any areas where Telone may be reintroduced in the proposed way and not just to the specific township in Kern County for which Calhoun et al modeled air concentrations it was not reasonable to define a distribution of residence time in the area Instead the estimated exposures are those expected to result from living the first 30 or 70 years of a 70-year lifetime in any area with Telone use like that described here
23
________________________________________________________________________________
________________________________________________________________________________
Table 18 Breathing rates (Lmin) as ranges of uniform distributions
Age interval Activity level Male Female
0 to 1 All Triangular ( 025 025 209 ) 1 to 2 Resting 5-7
Light 7-11 Moderate 8-15 Heavy 14-22
2 to 3 Resting 5-7 Light 7-11 Moderate 8-15 Heavy 14-22
3 to 6 Resting 5-7 Light 7-11 Moderate 8-15 Heavy 14-22
6 to 9 Resting 5-9 Light 10-17 Moderate 11-23 Heavy 20-45
9 to 12 Resting 5-9 Light 10-17 Moderate 11-23 Heavy 20-45
12 to 15 Resting 6-12 5-10 Light 7-17 7-15 Moderate 17-35 15-27 Heavy 25-72 24-59
15 to 18 Resting 6-12 5-10 Light 7-17 7-15 Moderate 17-35 15-27 Heavy 25-72 24-59
18 to 25 Resting 7-11 5-10 Light 8-18 6-15 Moderate 18-42 15-28 Heavy 48-80 39-62
25 to 70 Resting 7-11 5-10 Light 8-18 6-15 Moderate 18-42 15-28 Heavy 48-80 39-62
24
________________________________________________________________________________
_____________________________________________________________________________
________________________________________________________________________________
________________________________________________________________________________
Table 19 Rank order correlation coefficients between individuals breathing rates at different activity levels within and across age intervals
Resting Light Moderate Heavy Resting 08 05 05 04 Light 08 05 04 Moderate 08 05 Heavy 08
Table 20 Proportion of time at each activity level (constant in exposure simulation)
Age Activity level interval
Resting Light Moderate Heavy
0 to 1 Male 1 0 0 0 Female 1 0 0 0
1 to 2 Male 08 015 004 001 Female 08 015 004 001
2 to 3 Male 075 02 004 001 Female 075 02 004 001
3 to 6 Male 07 02 008 002 Female 07 02 008 002
6 to 9 Male 07 017 010 003 Female 07 02 008 002
9 to 12 Male 06 032 005 003 Female 06 033 005 002
12 to 15 Male 06 032 005 003 Female 06 033 005 002
15 to 18 Male 05 04 006 004 Female 05 042 005 003
18 to 25 Male 04 050 006 004 Female 04 052 005 003
25 to 70 Male 035 057 005 003 Female 035 060 004 001
25
________________________________________________________________________________
_______________________________________________________________________________
Table 21 Rank order correlation coefficients between the weights of an individual at different ages
0 to 1 1 to 2 2 to 3 3 to 6 6 to 9 9 to 12 12 to 15 15 to 18 18 to 25 25 to 70
0 to 1 100 092 082 072 061 061 061 061 061 061 1 to 2 100 092 082 072 061 061 061 061 061 2 to 3 100 092 082 072 061 061 061 061 3 to 6 100 092 082 072 061 061 061 6 to 9 100 092 082 072 061 061 9 to 12 100 092 082 072 061 12 to 15 100 082 082 072 15 to 18 100 082 082 18 to 25 100 082 25 to 70 100
Exposure appraisal
The estimated exposure distributions may be regarded as providing a reasonable idea of the highest exposures that should be expected under the use scenario The distributions should not be interpreted as reflecting the exposures of a population of individuals but as a set of values that are likely to bracket the exposure of an individual in this situation
It should be noted that the large differences between estimated seasonal exposures of children less than one and children from one to three are largely produced by the input breathing rate distributions The breathing rate data for infants under one came from a different source than all the other breathing rate data In addition no data were available for children from one to three so the rates for three- to six-year-old children were used In combination with the small body size of these children this may have overestimated their exposures
An important limitation of this exposure assessment is that it used 13-D concentrations in outdoor air to estimate 24-hourday exposure even though most people spend the greatest part of the day indoors Since the registrant provided no data on indoor concentrations and since no appropriate surrogate data were available to estimate them it was judged that there was no alternative
It is important to remember that these estimates of non-occupational exposure apply only to the use scenario of Calhoun et al which specified Telone applications to only 2000 acres per year in an area which has 8500 acres of carrots alone Any change in the use scenario would require a new exposure assessment
26
REFERENCES
Adams WC 1993 Measurement of breathing rate and volume in routinely performed daily activities Final report contract no A033-205 Research Division California Air Resources Board Sacramento CA
Albrecht WN 1987 Occupational exposure to 13-dichloropropene (Telone II) in Hawaiian pineapple culture Arch Environ Health 42286-290
Brouwer DH Brouwer EJ de Vreede JAF van Welie RTH Vermuelen NPE and van Hemmen JJ 1991 Inhalation exposure to 13-dichloropropene in the Dutch flower-bulb culture Part I Environmental monitoring Arch Environ Contam Toxicol 201-5
Calhoun LL Fontaine DD Stuart BL and Landenberger BD 1994 13shydichloropropene (13-D) An assessment of implied exposure and risk for the proposed commercial reentry of TELONE soil fumigant into California Dow Chemical Co Midland MI
California Department of Food and Agriculture 1988 Report of pesticides sold in California in 1987 Pesticide Use Enforcement Branch California Department of Food and Agriculture Sacramento CA
Climie IJG Hutson DH Morrison BJ and Stoydin G 1979 Glutathione conjugation in the detoxification of (Z)-13-dichloropropene (a component of the nematicide D-D) Xenobiotica 9149-156
Cohen B-S M and Poppendorf W 1989 A method for monitoring dermal exposure to volatile chemicals Am Ind Hyg Assoc J 50 216-223
Cook RE 1983 Fumigators exposure to airborne 13-dichloropropene during fumigation operation of Telone II soil fumigant Driscoll Citrus Service Inc Fort Pierce Florida Unpublished report of the Dow Chemical Chemical Company Industrial Hygiene Laboratory Midland MI January 4 1983
Davies DB and Fraser PA 1988 Evaluation of potential operator fieldworker and bystander exposure to 13-dichloropropene as a result of tobacco field fumigation with Telone II soil fumigant in southwestern Ontario (Canada) May-June 1985 CDFA Reg Doc No 50046-039
Dietz FK Hermann EA and Ramsey JC 1984a The pharmacokinetics of 14C-13shydichloropropene in rats and mice following oral administration The Toxicologist 4 Abstr No 585
Dietz FK Dittenber DA Krik HD and Ramsey JC 1984b Non-protein sulfhydryl content and macromolecular binding in rats and mice following oral administration of 13shydichloropropene The Toxicologist 4 Abstr No 586
Fisher GD and Kilgore WW 1988a Tissue levels of glutathione following acute inhalation of 13-dichloropropene J Toxicol Environ Health 23171-182
Fisher GD and Kilgore WW 1988b Mercapturic acid excretion in rats following 13shydichloropropene inhalation exposure Fund Appl Toxicol 11 303-307
27
Fisher GD and Kilgore WW 1989 Pharmacokinetics of S-[3-chloroprop-2shyenyl]glutathione in rats following acute inhalation exposure to 13-dichloropropene Xenobiotica 19269-278
Fong HR and Maykoski R 1985 Air exposure monitoring of EHAP personnel during a Telone II soil translocation study in Fresno County CDFA Rpt HS 1299
Houtman BA 1992 Managing worker exposure 13-D in California
Houtman BA 1993 An evaluation of 13-dichloropropene worker exposure associated with Telone II soil fumigant loading application and reentry phase I ECL92095 (interim report)
Hutson DH Moss JA and Pickering BA 1971 The excretion and retention of components of the soil fumigant D-D and their metabolites in the rat Food Cosmet Toxicol 9 677-680
Johnson B 1994a Memorandum to John Sanders June 20 1994 on buffer zone calculations for 13-D in Kern County Environmental Monitoring and Pest Management Branch Department of Pesticide Regulation Sacramento CA
Johnson B 1994b Memorandum to Kean Goh May 16 1994 on estimated adjusted air concentration percentiles based on Dow simulation results for T29R26 Environmental Monitoring and Pest Management Branch Department of Pesticide Regulation Sacramento CA
Maddy KT Cusick B Richmond D 1980 Studies concerning the field application of Telone and DD in California in 1979 and the ambient air concentration of these pesticides during and following application by shank injection into soil in fields CDFA Rpt HS 686
Maddy KT Schneider F and Fredrickson S 1982 Monitoring of Telone II during and following experimental application by shank injection to established trees and grape vines in California in 1980-1981 CDFA Rpt 967
NIOSHOSHA Occupational Safety and Health Guidelines for Chemical Hazards 1988 DHHS (NIOSH) Publication No 81-1231981 and supplements Publication Nos 88-118 and 89-104
Osterloh JD Cohen BS Poppendorf W and Pond SM 1984 Urinary excretion of the N-cysteine conjugate of cis-13-dichloropropene by exposed individuals Arch Environ Health 39 271-275
Osterloh JD Wang R OConnell L Jacob III P and Maddy KT 1989a Pilot study for biological monitoring of 13-dichloropropene In Biological Monitoring of Pesticide Exposure RG Wang CA Franklin RC Honeycutt and JC Reinert (eds) Amer Chem Soc Soc Symp Ser No 382 215-230
Osterloh JD Wang R Schneider F and Maddy K 1989b Biological monitoring of dichloropropene Air concentrations urinary metabolite and renal enzyme excretion Arch Environ Health 44 207-213
Owen WJ and DeRouen TA 1980 Estimation of the mean for lognormal data containing zeroes and left-censored values with applications to the measurement of worker exposure to air contaminants Biometrics 36 707 719
28
Palisades Corporation 1992 RISK Risk analysis and simulation add-in for Microsoft Excel Release 11 users guide 31 Decker Rd Newfield NY 14867
Poppendorf W Leffingwell JT and Cohen B 1983 Development of methods and procedures for the assessment of occupational health risks in the application and use of nematicides in California CDFA Rpt HS 1162
Shapiro SS and Wilk MB 1965 An analysis for normality (complete samples) Biometrika 52 591-611
Stott WT and Kastl PE 1986 Inhalation pharmacokinetics of technical grade 13shydichloropropene Toxicol Appl Pharmacol 85 332-341
Stott WT 1992 Letter to J R Sanborn August 11 1992
Tobol HK and Axe FD 1982 Airborne concentrations of 13-dichloropropene during fumigation of established grapevines almond trees and peach trees California December 1980-January 1981 Unpublished report of the Dow Chemical Company Environmental ServicesIndustrial Hygiene Western Division Dow Chemical USA Report No HeRW-AG(8)
US EPA 1990 Exposure factors handbook EPA6008-89043 Office of Health and Environmental Assessment Washington DC
Van Welie RTH van Duyn P Brouwer DH van Hemmen JJ Brouwer EJ and Vermuelen NPE 1991 Inhalation exposure to 13-dichloropropene in the Dutch flower-bulb culture Part II Biological monitoring by measurement of urinary excretion of two mercapturic acid metabolites Arch Environ Contam Toxicol 206-12
Waechter JM Brazak KA McCarty LP LaPack MA and Brownson 1992 13shydichloropropene (Telone II Soil Fumigant) Inhalation pharmacokinetics and metabolism in human volunteers DowElanco (Interim Report) Laboratory Project Study ID M-002993-023
Wagner CP 1987 Industrial source complex (ISC) dispersion model users guide 2nd edition (revised) Vol I US Environmental Protection Agency Report No EPA-4054-88shy002 a
Wiley JA 1991a Study of childrens activity patterns Final report contract no A733-149 Research Division California Air Resources Board Sacramento CA
Wiley JA 1991b Activity patterns of California residents Final report contract no A6-177shy33 Research Division California Air Resources Board Sacramento CA
29

_____________________________________________________________________
_____________________________________________________________________
Table 6 ADD AADD and LADD values for loading and application of 13- dichloropropene
Study Task ADD1 Days SADD4 AADD5 Days LADD6
(ugkgd) Year (ugkgd) (ugkgd) Career (ugkgd)
Osterloh et al LoadApply 680
Houtman Load 0733 4 0016 0008 24 69x10-4
40 016 008 270 77x10-3
Apply 1133 4 36
0025 023
0012 011
24 270
11x10-3
12x10-2
Total2 186
1 Absorbed Daily Dosage two load and application cyclesday body weights of study volunteers used in calculations
2 One person doing both loading and applying-for comparison to studies of Osterloh et al 3 Normalized to 68 hrs based on registrant study (Davies and Fraser 1988) for one
person doing both tasks to be compared with Osterloh et al 4 Split application for brassica 90-day window (see Table 5) 5 Annual Average Daily Dosage (365 daysyear) 6 Lifetime Average Daily Dosage 70 years life (25550 days)
Exposure Appraisal
The exposure estimates based on the Houtman (1993) study in which exposures were measured separately for loading and application should be used for the assessment of risk These estimates are based on biological monitoring that assessed both cis- and transshymercapturate metabolites in the urine and utilized the pharmacokinetic information developed from exposure of humans under controlled conditions Hand exposure information developed by previous investigators was not used as this route of exposure would be reflected in the total exposure measured by the biological monitoring
None of the occupational exposure studies in which biological monitoring was conducted employed exactly the mitigation measures that would be required in California These requirements are for full-face respiratory protection during loading and half-face protection during application
NON-OCCUPATIONAL EXPOSURE
Inhalation exposure was estimated for residents of an area where Telone is used in carrot growing Both lifetime and subchronic (seasonal) exposures were estimated for residents of the area in general and for residents with homes at specified distances from Telone-treated fields (100 200 and 500 meters) The estimated lifetime exposure distributions are given in Tables 7 through 10 seasonal exposures in Tables 11 through 14
10
=
The exposure assessment relied on simulated air concentrations from a study provided by the registrant (Calhoun et al 1994) in which the ISCST simulation model (Wagner 1987) was used to predict concentrations of 13-D in air for a scenario of limited reintroduction of Telone IItrade soil fumigant in carrots In the use scenario modeled Telone is applied to 25 80-acre fields (2000 acres total) per year in a 9-township (324-square-mile) area in Kern County Under this scenario there is no other use of Telone All applications are at the rate of 12 gallons per acre and no field is treated more than once in three years Calhoun et al simulated three years of daily air concentrations for one point at the center of each section in the reintroduction area to produce an annual average daily concentration for each point The locations of treated fields were assigned randomly in their model so that concentrations at the section centers vary in part due to being different distances and directions from applications The modeled concentrations thus represent long-term ambient concentrations for the reintroduction area Calhoun et al presented separately the concentrations for the township of highest Telone use within the 9-township area These concentrations were used in the exposure assessment
Probability distributions of exposure were estimated using stochastic simulation (Monte Carlo) methods implemented with the program RISK (Palisades Corporation 1992) The distribution of lifetime average daily dose (LADD) as ug of 13-D inhaled per kg of body weight per day (ugkgday) was estimated separately for persons living 1) the first 30 years of and 2) all of a 70-year lifetime in the reintroduction area Seasonal exposure was estimated for July-August the period of greatest Telone use by adjusting the long-term air concentrations for proportional use and mass loss during that 62-day period Additional simulated air concentrations provided by the Environmental Monitoring Branch (Johnson 1994a) were incorporated to estimate both lifetime and 62-day exposures to residents whose dwellings are close to treated fields Exposure distributions were estimated separately for residents living 100 200 and 500 meters from the edges of treated fields Each estimated exposure distribution is based on a simulation with 10000 trials
LADD (ugkgday) was calculated by the following equation
10
([ ]) i 1
where the summation is over 10 age intervals RTi = number of years in age interval i that the person
resides in the Telone use area Conci = average of air concentrations (ugm3) in 5
locations weighted by the proportion of time spent in each location in interval i
BRi = average breathing rate (m3day) at each of 4 activity levels weighted by proportion of time spent at each level in interval i
BWi = body weight (kg) in interval i and 70 years is the assumed lifetime
LADD = RT Conci x BR BW 70i i i
11
Seasonal exposure (62-day average ugkgday) was calculated separately for each age interval as Conc x BR
Average daily dose = BW
where concentration breathing rate and body weight are as defined above for LADD but with air concentrations modified to approximate seasonal averages as explained in the next section
Concentration breathing rate and body weight were stochastic variables in the exposure simulation model The statistical distributions used to simulate them are described in the sections on specific input variables following Tables 7-14
12
___________________________________________________________________________
Table 7 Lifetime average daily dose (ugkgday) of 13-D inhaled by residents of an area where Telone is applied to a total of 25 80-acre fields each year
Residence Time
Birth to age 30 Birth to age 70 Male Female Male Female
Mean 00800 00783 01510 01436 Std Deviation 00480 00487 00867 00902
Percentile 5 0027 0026 0053 0047
10 0032 0031 0063 0056 25 0044 0042 0087 0078 50 0066 0063 0129 0116 75 0103 0101 0193 0186 90 0150 0148 0277 0270 95 0179 0179 0326 0330
975 --a -- -- -shy99 0230 0236 0425 0444
a not calculated
Table 8 Lifetime average daily dose (ugkgday) of 13-D inhaled by residents living 100 m from treated fields in an area where Telone is applied to a total of 25 80-acre fields each year
Residence Time
Birth to age 30 Birth to age 70 Male Female Male Female
Mean 01022 01001 01892 01829 Std Deviation 00514 00515 00926 00959
Percentile 5 0042 004 0078 0071
10 0048 0047 0091 0084 25 0063 0061 012 0111 50 009 0087 0168 0159 75 0129 0128 0238 0233 90 0176 0174 0319 0319 95 0204 0201 0373 0371
975 0228 0227 0416 0423 99 0262 0257 0481 0481
13
___________________________________________________________________________
Table 9 Lifetime average daily dose (ugkgday) of 13-D inhaled by residents living 200 m from treated fields in an area where Telone is applied to a total of 25 80-acre fields each year
Residence Time
Birth to age 30 Birth to age 70 Male Female Male Female
Mean 00996 00973 01846 0178 Std Deviation 00501 00499 00901 00932
Percentile 5 0039 0038 0073 0067
10 0046 0044 0087 008 25 0061 006 0116 0108 50 0088 0086 0165 0156 75 0127 0124 0234 0227 90 0171 0168 0311 0307 95 0199 0196 036 0363
975 0222 022 0408 0414 99 0253 0248 0458 0465
Table 10 Lifetime average daily dose (ugkgday) of 13-D inhaled by residents living 500 m from treated fields in an area where Telone is applied to a total of 25 80-acre fields each year
Residence Time
Birth to age 30 Birth to age 70 Male Female Male Female
Mean 0084 00818 01577 01498 Std Deviation 00423 00419 00772 00781
Percentile 5 0034 0033 0065 0059
10 004 0039 0076 0069 25 0053 0051 0101 0093 50 0074 0071 014 013 75 0106 0103 0198 0189 90 0144 0141 0265 0259 95 0169 0167 031 0305
975 0191 0189 0352 0352 99 0216 0212 04 04
14
Table 11 Average daily dose (ugkgday) of 13-D inhaled by residents during the 62-day period of highest Telone use in an area where Telone is applied to a total of 25 80-acre fields each year
Age Group
lt 1 1 lt 2 2 lt 3 3 lt 6 6 lt 9 Male Female Male Female Male Female Male Female Male Female
Mean 02499 02707 15513 16841 13685 14366 11103 11467 10548 10651 Std Deviation 02270 02431 10419 11219 09039 09243 07460 07561 06797 06863
Percentile 5 0045 0050 0470 0520 0422 0464 0333 0361 0330 0326
10 0058 0065 0558 0616 0501 0549 0399 0426 0397 0395 25 0098 0108 0770 0841 0691 0750 0553 0589 0558 0560 50 0173 0192 1207 1308 1070 1134 0869 0904 0849 0863 75 0321 0343 2052 2244 1815 1897 1466 1507 1367 1396 90 0539 0590 3126 3385 2738 2804 2242 2249 2050 2038 95 0714 0789 3750 4047 3260 3375 2659 2731 2464 2474
975 0903 0966 4233 4530 3667 3821 3010 3137 2783 2880 99 1125 1183 4711 5124 4108 4260 3468 3522 3230 3296
9 lt 12 12 lt 15 15 lt 18 18lt 25 25 lt 70 Male Female Male Female Male Female Male Female Male Female
Mean 07953 07730 06536 05394 05300 04984 05297 04964 04809 04414 Std Deviation 05168 04897 04050 03320 03172 02980 02904 02913 02688 02840
Percentile 5 0239 0237 0208 0172 0176 0164 0188 0164 0167 0132
10 0291 0292 0254 0209 0214 0196 0228 0200 0201 0164 25 0417 0412 0360 0295 0298 0278 0314 0284 0281 0236 50 0645 0635 0545 0453 0447 0419 0459 0422 0416 0362 75 1029 1007 0835 0694 0676 0645 0676 0637 0618 0567 90 1529 1455 1209 0998 0977 0917 0930 0904 0848 0830 95 1870 1767 1457 1207 1171 1103 1103 1085 1018 1022
975 2118 2080 1713 1413 1338 1279 1267 1252 1166 1190 99 2496 2341 2020 1645 1568 1450 1468 1433 1342 1382
15
Table 12 Average daily dose (ugkgday) of 13-D inhaled during the 62-day period of highest Telone use by residents living 100 m from fields in an area where Telone is applied to a total of 25 80-acre fields each year
Age Group
lt 1 1 lt 2 2 lt 3 3 lt 6 6 lt 9 Male Female Male Female Male Female Male Female Male Female
Mean 04940 05352 30723 33330 26876 27770 21802 22126 19918 19861 Std Deviation 03548 03830 14181 15406 12335 12549 10277 10370 09528 09564
Percentile 5 0118 0128 1368 1490 1206 1263 0942 0968 0852 0833
10 0152 0166 1545 1672 1347 1418 1069 1098 0969 0965 25 0238 0258 1924 2096 1697 1757 1366 1393 1255 1254 50 0395 0425 2710 2949 2360 2470 1918 1960 1760 1766 75 0641 0699 4008 4347 3502 3620 2833 2868 2545 2529 90 0976 1076 5137 5567 4481 4594 3657 3725 3371 3371 95 1217 1331 5792 6272 5021 5177 4158 4258 3831 3879
975 1450 1563 6306 6950 5536 5720 4615 4647 4261 4271 99 1680 1784 6915 7610 6021 6204 5033 5157 4801 4847
9 lt 12 12 lt 15 15 lt 18 18lt 25 25 lt 70 Male Female Male Female Male Female Male Female Male Female
Mean 14857 14065 11533 09575 09336 08872 08833 08610 08063 08020 Std Deviation 07344 06874 05796 04659 04444 04134 03970 04030 03694 04061
Percentile 5 0603 0573 0464 0396 0393 0379 0383 0359 0350 0305
10 0701 0667 0539 0459 0454 0438 0447 0422 0405 0366 25 0923 0890 0723 0610 0599 0571 0584 0558 0526 0499 50 1314 1244 1020 0849 0833 0792 0802 0770 0733 0704 75 1899 1795 1456 1209 1184 1126 1111 1091 1007 1034 90 2530 2389 1927 1605 1549 1481 1436 1433 1316 1382 95 2925 2770 2287 1863 1809 1695 1662 1661 1524 1604
975 3280 3076 2623 2102 2000 1867 1841 1818 1725 1790 99 3678 3463 3033 2434 2278 2101 2083 2029 1922 2018
16
Table 13 Average daily dose (ugkgday) of 13-D inhaled during the 62-day period of highest Telone use by residents living 200 m from fields in an area where Telone is applied to a total of 25 80-acre fields each year
Age Group
lt 1 1 lt 2 2 lt 3 3 lt 6 6 lt 9 Male Female Male Female Male Female Male Female Male Female
Mean 04605 05018 28772 31305 25168 26084 20439 20856 18713 18739 Std Deviation 03227 03596 13044 14290 11309 11633 09438 09779 08750 08917
Percentile 5 0112 0117 1229 1308 1089 1124 0851 0854 0758 0745
10 0139 0155 1382 1492 1222 1278 0978 0986 0895 0871 25 0219 0243 1778 1935 1568 1633 1265 1293 1169 1170 50 0374 0401 2647 2865 2324 2404 1865 1887 1700 1694 75 0607 0664 3775 4152 3289 3433 2687 2734 2426 2428 90 0906 0998 4704 5195 4114 4278 3387 3499 3103 3164 95 1112 1238 5266 5730 4585 4726 3771 3915 3536 3593
975 1300 1441 5770 6269 5016 5128 4206 4249 3908 3920 99 1534 1688 6289 6837 5542 5607 4605 4696 4281 4346
9 lt 12 12 lt 15 15 lt 18 18lt 25 25 lt 70 Male Female Male Female Male Female Male Female Male Female
Mean 13973 13308 10879 09069 08808 08389 08368 08156 07646 07564 Std Deviation 06736 06511 05331 04368 04053 03864 03650 03789 03405 03774
Percentile 5 0539 0511 0423 0356 0362 0348 0358 0328 0322 0284
10 0648 0604 0501 0423 0424 0405 0419 0390 0376 0336 25 0872 0824 0679 0567 0570 0530 0554 0523 0503 0462 50 1254 1199 0982 0819 0799 0766 0779 0745 0706 0675 75 1816 1723 1388 1170 1128 1081 1064 1044 0961 0984 90 2351 2273 1816 1521 1439 1382 1328 1350 1231 1286 95 2687 2563 2107 1726 1643 1579 1522 1527 1409 1483
975 2965 2847 2365 1940 1850 1741 1692 1704 1581 1659 99 3358 3142 2680 2170 2043 1922 1877 1904 1767 1851
17
Table 14 Average daily dose (ugkgday) of 13-D inhaled during the 62-day period of highest Telone use by residents living 500 m from fields in an area where Telone is applied to a total of 25 80-acre fields each year
Age Group
lt 1 1 lt 2 2 lt 3 3 lt 6 6 lt 9 Male Female Male Female Male Female Male Female Male Female
Mean 02906 03157 18121 19672 15953 16652 12951 13295 12146 12220 Std Deviation 01948 02105 07170 07709 06263 06341 05264 05343 04984 05174
Percentile 5 0078 0085 0934 1024 0826 0878 0655 0659 0588 0584
10 0099 0107 1041 1141 0920 0977 0724 0750 0671 0666 25 0147 0161 1257 1387 1111 1185 0892 0940 0840 0842 50 0242 0264 1653 1777 1457 1523 1180 1209 1114 1116 75 0378 0413 2232 2419 1974 2044 1596 1633 1494 1494 90 0550 0592 2797 3022 2460 2547 2028 2059 1897 1936 95 0674 0724 3194 3462 2803 2891 2301 2344 2167 2204
975 0809 0878 3536 3831 3097 3174 2574 2652 2438 2478 99 0957 1046 3922 4256 3424 3539 2853 2981 2705 2881
9 lt 12 12 lt 15 15 lt 18 18lt 25 25 lt 70 Male Female Male Female Male Female Male Female Male Female
Mean 09136 08829 07399 06103 05984 05640 05913 05588 05364 05024 Std Deviation 03929 03854 03262 02660 02473 02308 02375 02331 02169 02240
Percentile 5 0418 0399 0330 0285 0280 0274 0280 0264 0254 0223
10 0481 0463 0381 0324 0321 0310 0327 0305 0292 0258 25 0621 0603 0501 0418 0418 0392 0415 0385 0373 0336 50 0841 0805 0677 0556 0557 0517 0553 0516 0501 0455 75 1127 1084 0917 0749 0732 0689 0724 0689 0658 0624 90 1458 1401 1188 0961 0927 0877 0908 0872 0833 0813 95 1674 1633 1373 1129 1069 1009 1044 0999 0947 0922
975 1843 1818 1532 1256 1208 1112 1175 1101 1055 1031 99 2078 2087 1729 1481 1323 1276 1306 1277 1190 1210
18
___________________________________________________________________________
___________________________________________________________________________
INPUT VARIABLES FOR EXPOSURE SIMULATION
Air concentrations
Table 15 gives the probability distributions of air concentrations (in ugm3) used as input in the exposure simulations The first column gives percentiles of the distribution interpolated from a four-parameter logistic curve fit to the original Calhoun et al frequency distribution The interpolated concentrations were adjusted by factors developed by the Environmental Monitoring Branch of DPR (Johnson 1994b) shown in the second column Environmental Monitoring did additional modeling with ISCST to develop an adjustment to approximate the effect of using a 36-point-per-section spatial grid to model air concentrations instead of the relatively coarse 1-point-per-section grid used by Calhoun et al The effect of the adjustment is to increase the variability of the air concentrations while the mean level is unchanged The adjusted concentrations appear in the third column These adjusted values reflecting annual average daily concentrations for points on a 36-point-per-section grid were used for the estimation of lifetime average exposure
Table 15 Air concentration (ugm3) probability distributions used in exposure simulation
Concentrations Adjustment Adjusted Adjusted interpolated from 4shy factors to concentrations concentrations parameter logistic approximate used to estimate used to estimate
Percentile curvea 36-point gridb lifetime exposure 62-day exposure
00001 0103842 069359 0072024 0278587 001 0106063 084461 0089582 0346503 01 0128835 093182 0120051 0464356 02 0160687 096331 0154791 0598731 03 0201575 098483 0198517 0767865 04 0254546 100283 0255267 0987372 05 0323879 101963 0330237 1277356 06 0415684 103671 0430944 1666892 07 0538854 105566 0568846 2200298 08 0706593 107924 0762583 2949673 09 0938983 111571 1047632 4052242 095 1088601 115040 1252327 4844000 099 1228987 123092 1512784 5851450 0999 1263482 135000 1705701 6597652 09999 1266995 149000 1887822 7302097
a Curve fit to high-end air concentration frequency distribution in Calhoun et al (1994) b Johnson (1994b)
19
Seasonal exposure was estimated for July-August the period of historically highest Telone use To estimate average daily concentrations for this 62-day period the adjusted annual concentrations were modified as follows In the Calhoun et al simulation all positive air concentrations occurred in two 74shyday periods (60 days of Telone use plus 14 additional days for the material to dissipate) one in spring and the other in summer In their simulation 707 of the total Telone was applied during the summer use period with 40 mass loss to air In the spring period 293 of the Telone was applied with a mass loss rate of 25 To approximate the average daily concentrations during the summer period the fraction of the annual concentration contributed by the summer period was assumed to be (707 x 40) [(707 x 40) + (293 x 25)] = 0794 This fraction was condensed into 74 days by multiplying by 36574 Since actual Telone applications will probably not be restricted to the four months assumed by Calhoun et al historical use patterns were consulted Pesticide use reporting data showed that in 1988 and 1989 585 and 499 respectively of 13-D applied to carrots in Kern County was applied during July and August The simulation summer-period concentrations were further modified to represent concentrations for the 62 days of July-August by multiplying by (585 707) x (7462) The net effect was to multiply the annual concentrations by 3868 The concentrations thus modified shown in the fourth column of Table 15 were used for the estimation of seasonal exposure
For both lifetime and seasonal exposure assessments the average air concentration experienced by each person was simulated by randomly selecting five values from the relevant air distribution These values represented five locations where the individual spent his or her time A weighted average of the five concentrations weighted by the proportion of time spent at each location was used as the air concentration experienced by the individual The same five locations were used throughout a persons life but the division of time between them changed as a function of age The division of time between locations was a random variable in the simulation and is discussed in the section on individual mobility
To estimate exposure to persons living close to fields additional modeling with ISCST was done by the Environmental Monitoring Branch to provide annual average daily air concentrations at 100-meter increments from edges of treated fields (Johnson 1994a) The probability distributions of concentrations at 100 200 and 500 meters which were used in this exposure assessment are given in Table 16 In calculating the average concentration experienced by a person the first location selected at which the greatest portion of time is spent was considered the home location The concentration for the home location was simulated by selecting one value from eg the 100-meter distribution and one from the general distribution then calculating a weighted average with the two values weighted one-third and two-thirds respectively to reflect the fact that a field is treated only once in three years The two values were chosen to have a rank order correlation coefficient of 080 based on an observed correlation of 086 between ambient concentrations in the same township from year to year (personal communication Bruce Johnson Environmental Monitoring Branch DPR June 22 1994) For seasonal exposures the home concentration was simply a value from the relevant distance distribution This home location concentration was then used as described in the preceding paragraph in the calculation of the average concentration over five locations
20
___________________________________________________________________________
________________________________________________________________________________
Table 16 Annual average air concentrations (ugm3) at specified distances from treated fieldsa
Percentile 100 meters 200 meters 500 meters
000333 035393 030113 024996 001 037037 031439 026472 005 046011 040619 029312 01 050768 044753 031998 015 055763 048264 035456 02 058246 051404 036323 025 060290 055147 037940 03 064604 058207 038904 035 070250 062520 040306 04 077585 074610 041207 045 087638 085215 045127 05 090497 090723 049474 055 097657 096199 055052 06 105653 102253 057466 065 117366 117403 062218 07 131421 125398 067783 075 143991 134267 075510 08 154023 142689 079173 085 163177 151078 083575 09 175806 159046 087488 095 195317 178902 099410 099 220345 198031 127958 099667 226113 204338 135822
a Johnson (1994a)
21
________________________________________________________________________________
________________________________________________________________________________
Individual mobility within the Telone use area
Individuals were assumed to divide their total time between five randomly selected locations within the Telone high-use area The average air concentration to which an individual is exposed was calculated as described above as the mean of the five location concentrations weighted by the proportion of time spent in each location The mean division of time between locations was derived for each age interval from Table 45 in the Arabrsquos Survey of Childrens Activity Patterns (Wiley 1991a) and Table 33 in Activity Patterns of California Residents (Wiley 1991b) Wileys time at home was used as the time spent in the first selected location his time in transit was divided equally between two locations and the remaining time in the day divided between two others The division of time between these last two locations was 7030 for infants stepping down by age interval to a 5050 division for adults Individual time divisions were allowed to vary from the mean by randomly generating them from a multinomial distribution with n chosen to give fairly small variability in the youngest intervals and greater variability in the adolescent and adult intervals The distributions for time division are shown in Table 17
Table 17 Probability distributions of time spent in five locations
Multinomial Age n Average minutes per day spent in location
interval parameter 1 2 3 4 5
0 to 1 100 Male 1157 27 27 160 69 Female 1151 38 38 150 63
1 to 2 100 Male 1157 27 27 160 69 Female 1151 38 38 150 63
2 to 3 90 Male 1134 31 31 170 74 Female 1099 44 44 151 102
3 to 6 90 Male 1134 31 31 170 74 Female 1099 44 44 151 102
6 to 9 80 Male 1044 59 30 170 137 Female 1021 27 26 256 110
9 to 12 80 Male 1020 31 31 250 108 Female 968 47 46 265 114
12 to 15 70 Male 893 61 60 256 170 Female 917 49 49 255 170
15 to 18 70 Male 893 61 60 256 170 Female 917 49 49 255 170
18 to 25 60 Male 782 75 74 255 254 Female 862 60 60 229 229
25 to 70 60 Male 798 60 59 262 261 Female 960 51 51 189 189
22
Breathing rates
An individuals average breathing rate in each age interval was calculated as a weighted average of his rates at each of four activity levels resting light moderate and heavy The rate at each level was weighted by the proportion of time the individual was assumed to spend at that level Breathing rate at each activity level was a random variable The proportion of time at each level was a constant fixed for each age interval
For infants (0-1 year) a triangular distribution of breathing rates was derived from the mean and range reported in the Exposure Factors Handbook Table 3A-2 (USEPA 1990) The mode of the triangular distribution was set equal to the lower limit of the range in order to match the EPA mean For the other age intervals uniform distributions were derived from data in the ARBs Measurement of Breathing Rate and Volume (Adams 1993) In each case the range was chosen to include all the reported rates relevant to an activity level for a specific sex and age group These ranges are given in Table 18 Data were unavailable for children aged 1-3 so the breathing rates for 3-6-year-olds were used The breathing rates of an individual at different activity levels within and across ages were assumed to have the rank order correlations shown in Table 19 (The value of 08 on the diagonal represents the correlation between breathing rates of the same individual at the same activity level at different ages) It was not possible to incorporate correlations between body weight and breathing rates because the software used did not handle them correctly Correlation coefficients of body surface area and breathing rate within age intervals and activity levels reported in Adams (1993) ranged from 006 to 084 with a mean of 040 The correlation of body weight and breathing rate may be similar The effect of omitting this correlation from the simulation was probably to increase the estimated exposures to an unknown degree because if the greater exposures associated with high breathing rates tended to be paired with high body weights the exposure would be mitigated somewhat
The proportion of time assumed to be spent at each activity level is shown in Table 20
Body weight
Body weight distributions were taken directly from Tables 5A-1 through 5A-4 in the Exposure Factors Handbook (USEPA 1990) The histograms reported in these tables were used without smoothing Upper and lower bounds were supplied to produce a mean weight equal to the mean given in the EPA tables An individuals weights in different age intervals were assumed to have the rank order correlations shown in Table 21
Residence time and lifetime
In estimating lifetime exposures lifetime length was fixed at 70 years Exposure was estimated separately for fixed times of residence in the Telone use area of 30 and 70 years Since the exposure assessment is viewed as applying to any areas where Telone may be reintroduced in the proposed way and not just to the specific township in Kern County for which Calhoun et al modeled air concentrations it was not reasonable to define a distribution of residence time in the area Instead the estimated exposures are those expected to result from living the first 30 or 70 years of a 70-year lifetime in any area with Telone use like that described here
23
________________________________________________________________________________
________________________________________________________________________________
Table 18 Breathing rates (Lmin) as ranges of uniform distributions
Age interval Activity level Male Female
0 to 1 All Triangular ( 025 025 209 ) 1 to 2 Resting 5-7
Light 7-11 Moderate 8-15 Heavy 14-22
2 to 3 Resting 5-7 Light 7-11 Moderate 8-15 Heavy 14-22
3 to 6 Resting 5-7 Light 7-11 Moderate 8-15 Heavy 14-22
6 to 9 Resting 5-9 Light 10-17 Moderate 11-23 Heavy 20-45
9 to 12 Resting 5-9 Light 10-17 Moderate 11-23 Heavy 20-45
12 to 15 Resting 6-12 5-10 Light 7-17 7-15 Moderate 17-35 15-27 Heavy 25-72 24-59
15 to 18 Resting 6-12 5-10 Light 7-17 7-15 Moderate 17-35 15-27 Heavy 25-72 24-59
18 to 25 Resting 7-11 5-10 Light 8-18 6-15 Moderate 18-42 15-28 Heavy 48-80 39-62
25 to 70 Resting 7-11 5-10 Light 8-18 6-15 Moderate 18-42 15-28 Heavy 48-80 39-62
24
________________________________________________________________________________
_____________________________________________________________________________
________________________________________________________________________________
________________________________________________________________________________
Table 19 Rank order correlation coefficients between individuals breathing rates at different activity levels within and across age intervals
Resting Light Moderate Heavy Resting 08 05 05 04 Light 08 05 04 Moderate 08 05 Heavy 08
Table 20 Proportion of time at each activity level (constant in exposure simulation)
Age Activity level interval
Resting Light Moderate Heavy
0 to 1 Male 1 0 0 0 Female 1 0 0 0
1 to 2 Male 08 015 004 001 Female 08 015 004 001
2 to 3 Male 075 02 004 001 Female 075 02 004 001
3 to 6 Male 07 02 008 002 Female 07 02 008 002
6 to 9 Male 07 017 010 003 Female 07 02 008 002
9 to 12 Male 06 032 005 003 Female 06 033 005 002
12 to 15 Male 06 032 005 003 Female 06 033 005 002
15 to 18 Male 05 04 006 004 Female 05 042 005 003
18 to 25 Male 04 050 006 004 Female 04 052 005 003
25 to 70 Male 035 057 005 003 Female 035 060 004 001
25
________________________________________________________________________________
_______________________________________________________________________________
Table 21 Rank order correlation coefficients between the weights of an individual at different ages
0 to 1 1 to 2 2 to 3 3 to 6 6 to 9 9 to 12 12 to 15 15 to 18 18 to 25 25 to 70
0 to 1 100 092 082 072 061 061 061 061 061 061 1 to 2 100 092 082 072 061 061 061 061 061 2 to 3 100 092 082 072 061 061 061 061 3 to 6 100 092 082 072 061 061 061 6 to 9 100 092 082 072 061 061 9 to 12 100 092 082 072 061 12 to 15 100 082 082 072 15 to 18 100 082 082 18 to 25 100 082 25 to 70 100
Exposure appraisal
The estimated exposure distributions may be regarded as providing a reasonable idea of the highest exposures that should be expected under the use scenario The distributions should not be interpreted as reflecting the exposures of a population of individuals but as a set of values that are likely to bracket the exposure of an individual in this situation
It should be noted that the large differences between estimated seasonal exposures of children less than one and children from one to three are largely produced by the input breathing rate distributions The breathing rate data for infants under one came from a different source than all the other breathing rate data In addition no data were available for children from one to three so the rates for three- to six-year-old children were used In combination with the small body size of these children this may have overestimated their exposures
An important limitation of this exposure assessment is that it used 13-D concentrations in outdoor air to estimate 24-hourday exposure even though most people spend the greatest part of the day indoors Since the registrant provided no data on indoor concentrations and since no appropriate surrogate data were available to estimate them it was judged that there was no alternative
It is important to remember that these estimates of non-occupational exposure apply only to the use scenario of Calhoun et al which specified Telone applications to only 2000 acres per year in an area which has 8500 acres of carrots alone Any change in the use scenario would require a new exposure assessment
26
REFERENCES
Adams WC 1993 Measurement of breathing rate and volume in routinely performed daily activities Final report contract no A033-205 Research Division California Air Resources Board Sacramento CA
Albrecht WN 1987 Occupational exposure to 13-dichloropropene (Telone II) in Hawaiian pineapple culture Arch Environ Health 42286-290
Brouwer DH Brouwer EJ de Vreede JAF van Welie RTH Vermuelen NPE and van Hemmen JJ 1991 Inhalation exposure to 13-dichloropropene in the Dutch flower-bulb culture Part I Environmental monitoring Arch Environ Contam Toxicol 201-5
Calhoun LL Fontaine DD Stuart BL and Landenberger BD 1994 13shydichloropropene (13-D) An assessment of implied exposure and risk for the proposed commercial reentry of TELONE soil fumigant into California Dow Chemical Co Midland MI
California Department of Food and Agriculture 1988 Report of pesticides sold in California in 1987 Pesticide Use Enforcement Branch California Department of Food and Agriculture Sacramento CA
Climie IJG Hutson DH Morrison BJ and Stoydin G 1979 Glutathione conjugation in the detoxification of (Z)-13-dichloropropene (a component of the nematicide D-D) Xenobiotica 9149-156
Cohen B-S M and Poppendorf W 1989 A method for monitoring dermal exposure to volatile chemicals Am Ind Hyg Assoc J 50 216-223
Cook RE 1983 Fumigators exposure to airborne 13-dichloropropene during fumigation operation of Telone II soil fumigant Driscoll Citrus Service Inc Fort Pierce Florida Unpublished report of the Dow Chemical Chemical Company Industrial Hygiene Laboratory Midland MI January 4 1983
Davies DB and Fraser PA 1988 Evaluation of potential operator fieldworker and bystander exposure to 13-dichloropropene as a result of tobacco field fumigation with Telone II soil fumigant in southwestern Ontario (Canada) May-June 1985 CDFA Reg Doc No 50046-039
Dietz FK Hermann EA and Ramsey JC 1984a The pharmacokinetics of 14C-13shydichloropropene in rats and mice following oral administration The Toxicologist 4 Abstr No 585
Dietz FK Dittenber DA Krik HD and Ramsey JC 1984b Non-protein sulfhydryl content and macromolecular binding in rats and mice following oral administration of 13shydichloropropene The Toxicologist 4 Abstr No 586
Fisher GD and Kilgore WW 1988a Tissue levels of glutathione following acute inhalation of 13-dichloropropene J Toxicol Environ Health 23171-182
Fisher GD and Kilgore WW 1988b Mercapturic acid excretion in rats following 13shydichloropropene inhalation exposure Fund Appl Toxicol 11 303-307
27
Fisher GD and Kilgore WW 1989 Pharmacokinetics of S-[3-chloroprop-2shyenyl]glutathione in rats following acute inhalation exposure to 13-dichloropropene Xenobiotica 19269-278
Fong HR and Maykoski R 1985 Air exposure monitoring of EHAP personnel during a Telone II soil translocation study in Fresno County CDFA Rpt HS 1299
Houtman BA 1992 Managing worker exposure 13-D in California
Houtman BA 1993 An evaluation of 13-dichloropropene worker exposure associated with Telone II soil fumigant loading application and reentry phase I ECL92095 (interim report)
Hutson DH Moss JA and Pickering BA 1971 The excretion and retention of components of the soil fumigant D-D and their metabolites in the rat Food Cosmet Toxicol 9 677-680
Johnson B 1994a Memorandum to John Sanders June 20 1994 on buffer zone calculations for 13-D in Kern County Environmental Monitoring and Pest Management Branch Department of Pesticide Regulation Sacramento CA
Johnson B 1994b Memorandum to Kean Goh May 16 1994 on estimated adjusted air concentration percentiles based on Dow simulation results for T29R26 Environmental Monitoring and Pest Management Branch Department of Pesticide Regulation Sacramento CA
Maddy KT Cusick B Richmond D 1980 Studies concerning the field application of Telone and DD in California in 1979 and the ambient air concentration of these pesticides during and following application by shank injection into soil in fields CDFA Rpt HS 686
Maddy KT Schneider F and Fredrickson S 1982 Monitoring of Telone II during and following experimental application by shank injection to established trees and grape vines in California in 1980-1981 CDFA Rpt 967
NIOSHOSHA Occupational Safety and Health Guidelines for Chemical Hazards 1988 DHHS (NIOSH) Publication No 81-1231981 and supplements Publication Nos 88-118 and 89-104
Osterloh JD Cohen BS Poppendorf W and Pond SM 1984 Urinary excretion of the N-cysteine conjugate of cis-13-dichloropropene by exposed individuals Arch Environ Health 39 271-275
Osterloh JD Wang R OConnell L Jacob III P and Maddy KT 1989a Pilot study for biological monitoring of 13-dichloropropene In Biological Monitoring of Pesticide Exposure RG Wang CA Franklin RC Honeycutt and JC Reinert (eds) Amer Chem Soc Soc Symp Ser No 382 215-230
Osterloh JD Wang R Schneider F and Maddy K 1989b Biological monitoring of dichloropropene Air concentrations urinary metabolite and renal enzyme excretion Arch Environ Health 44 207-213
Owen WJ and DeRouen TA 1980 Estimation of the mean for lognormal data containing zeroes and left-censored values with applications to the measurement of worker exposure to air contaminants Biometrics 36 707 719
28
Palisades Corporation 1992 RISK Risk analysis and simulation add-in for Microsoft Excel Release 11 users guide 31 Decker Rd Newfield NY 14867
Poppendorf W Leffingwell JT and Cohen B 1983 Development of methods and procedures for the assessment of occupational health risks in the application and use of nematicides in California CDFA Rpt HS 1162
Shapiro SS and Wilk MB 1965 An analysis for normality (complete samples) Biometrika 52 591-611
Stott WT and Kastl PE 1986 Inhalation pharmacokinetics of technical grade 13shydichloropropene Toxicol Appl Pharmacol 85 332-341
Stott WT 1992 Letter to J R Sanborn August 11 1992
Tobol HK and Axe FD 1982 Airborne concentrations of 13-dichloropropene during fumigation of established grapevines almond trees and peach trees California December 1980-January 1981 Unpublished report of the Dow Chemical Company Environmental ServicesIndustrial Hygiene Western Division Dow Chemical USA Report No HeRW-AG(8)
US EPA 1990 Exposure factors handbook EPA6008-89043 Office of Health and Environmental Assessment Washington DC
Van Welie RTH van Duyn P Brouwer DH van Hemmen JJ Brouwer EJ and Vermuelen NPE 1991 Inhalation exposure to 13-dichloropropene in the Dutch flower-bulb culture Part II Biological monitoring by measurement of urinary excretion of two mercapturic acid metabolites Arch Environ Contam Toxicol 206-12
Waechter JM Brazak KA McCarty LP LaPack MA and Brownson 1992 13shydichloropropene (Telone II Soil Fumigant) Inhalation pharmacokinetics and metabolism in human volunteers DowElanco (Interim Report) Laboratory Project Study ID M-002993-023
Wagner CP 1987 Industrial source complex (ISC) dispersion model users guide 2nd edition (revised) Vol I US Environmental Protection Agency Report No EPA-4054-88shy002 a
Wiley JA 1991a Study of childrens activity patterns Final report contract no A733-149 Research Division California Air Resources Board Sacramento CA
Wiley JA 1991b Activity patterns of California residents Final report contract no A6-177shy33 Research Division California Air Resources Board Sacramento CA
29
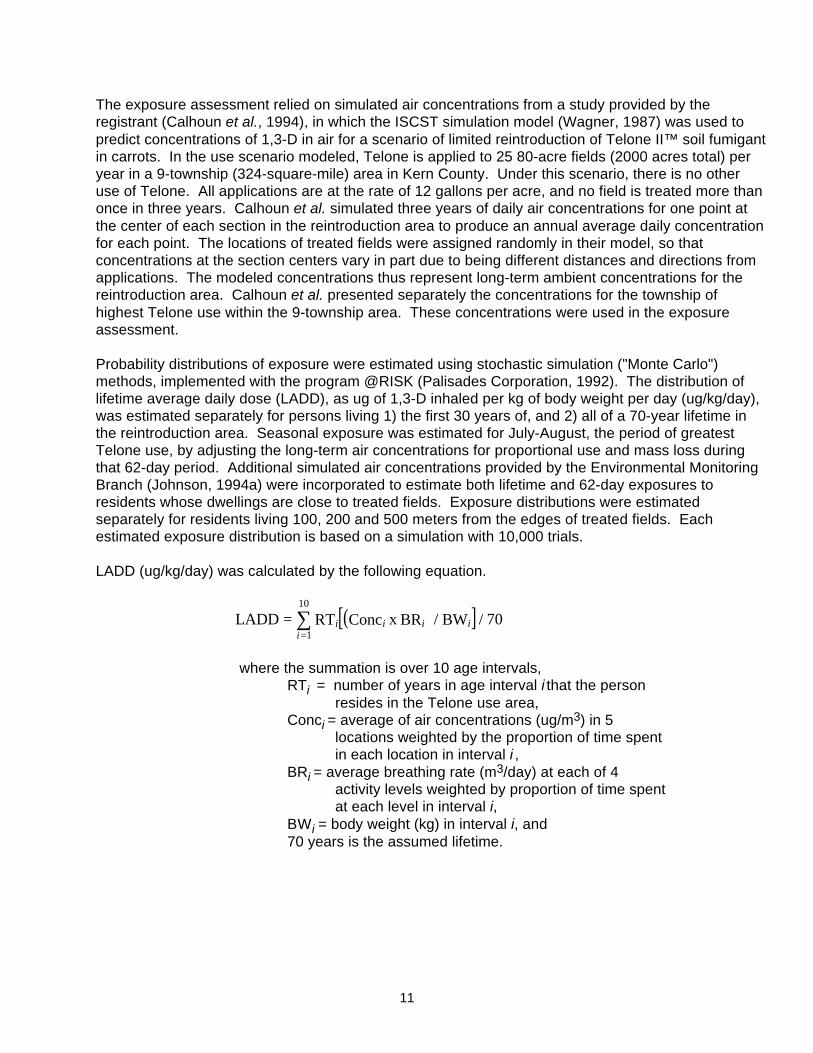

___________________________________________________________________________
Table 9 Lifetime average daily dose (ugkgday) of 13-D inhaled by residents living 200 m from treated fields in an area where Telone is applied to a total of 25 80-acre fields each year
Residence Time
Birth to age 30 Birth to age 70 Male Female Male Female
Mean 00996 00973 01846 0178 Std Deviation 00501 00499 00901 00932
Percentile 5 0039 0038 0073 0067
10 0046 0044 0087 008 25 0061 006 0116 0108 50 0088 0086 0165 0156 75 0127 0124 0234 0227 90 0171 0168 0311 0307 95 0199 0196 036 0363
975 0222 022 0408 0414 99 0253 0248 0458 0465
Table 10 Lifetime average daily dose (ugkgday) of 13-D inhaled by residents living 500 m from treated fields in an area where Telone is applied to a total of 25 80-acre fields each year
Residence Time
Birth to age 30 Birth to age 70 Male Female Male Female
Mean 0084 00818 01577 01498 Std Deviation 00423 00419 00772 00781
Percentile 5 0034 0033 0065 0059
10 004 0039 0076 0069 25 0053 0051 0101 0093 50 0074 0071 014 013 75 0106 0103 0198 0189 90 0144 0141 0265 0259 95 0169 0167 031 0305
975 0191 0189 0352 0352 99 0216 0212 04 04
14
Table 11 Average daily dose (ugkgday) of 13-D inhaled by residents during the 62-day period of highest Telone use in an area where Telone is applied to a total of 25 80-acre fields each year
Age Group
lt 1 1 lt 2 2 lt 3 3 lt 6 6 lt 9 Male Female Male Female Male Female Male Female Male Female
Mean 02499 02707 15513 16841 13685 14366 11103 11467 10548 10651 Std Deviation 02270 02431 10419 11219 09039 09243 07460 07561 06797 06863
Percentile 5 0045 0050 0470 0520 0422 0464 0333 0361 0330 0326
10 0058 0065 0558 0616 0501 0549 0399 0426 0397 0395 25 0098 0108 0770 0841 0691 0750 0553 0589 0558 0560 50 0173 0192 1207 1308 1070 1134 0869 0904 0849 0863 75 0321 0343 2052 2244 1815 1897 1466 1507 1367 1396 90 0539 0590 3126 3385 2738 2804 2242 2249 2050 2038 95 0714 0789 3750 4047 3260 3375 2659 2731 2464 2474
975 0903 0966 4233 4530 3667 3821 3010 3137 2783 2880 99 1125 1183 4711 5124 4108 4260 3468 3522 3230 3296
9 lt 12 12 lt 15 15 lt 18 18lt 25 25 lt 70 Male Female Male Female Male Female Male Female Male Female
Mean 07953 07730 06536 05394 05300 04984 05297 04964 04809 04414 Std Deviation 05168 04897 04050 03320 03172 02980 02904 02913 02688 02840
Percentile 5 0239 0237 0208 0172 0176 0164 0188 0164 0167 0132
10 0291 0292 0254 0209 0214 0196 0228 0200 0201 0164 25 0417 0412 0360 0295 0298 0278 0314 0284 0281 0236 50 0645 0635 0545 0453 0447 0419 0459 0422 0416 0362 75 1029 1007 0835 0694 0676 0645 0676 0637 0618 0567 90 1529 1455 1209 0998 0977 0917 0930 0904 0848 0830 95 1870 1767 1457 1207 1171 1103 1103 1085 1018 1022
975 2118 2080 1713 1413 1338 1279 1267 1252 1166 1190 99 2496 2341 2020 1645 1568 1450 1468 1433 1342 1382
15
Table 12 Average daily dose (ugkgday) of 13-D inhaled during the 62-day period of highest Telone use by residents living 100 m from fields in an area where Telone is applied to a total of 25 80-acre fields each year
Age Group
lt 1 1 lt 2 2 lt 3 3 lt 6 6 lt 9 Male Female Male Female Male Female Male Female Male Female
Mean 04940 05352 30723 33330 26876 27770 21802 22126 19918 19861 Std Deviation 03548 03830 14181 15406 12335 12549 10277 10370 09528 09564
Percentile 5 0118 0128 1368 1490 1206 1263 0942 0968 0852 0833
10 0152 0166 1545 1672 1347 1418 1069 1098 0969 0965 25 0238 0258 1924 2096 1697 1757 1366 1393 1255 1254 50 0395 0425 2710 2949 2360 2470 1918 1960 1760 1766 75 0641 0699 4008 4347 3502 3620 2833 2868 2545 2529 90 0976 1076 5137 5567 4481 4594 3657 3725 3371 3371 95 1217 1331 5792 6272 5021 5177 4158 4258 3831 3879
975 1450 1563 6306 6950 5536 5720 4615 4647 4261 4271 99 1680 1784 6915 7610 6021 6204 5033 5157 4801 4847
9 lt 12 12 lt 15 15 lt 18 18lt 25 25 lt 70 Male Female Male Female Male Female Male Female Male Female
Mean 14857 14065 11533 09575 09336 08872 08833 08610 08063 08020 Std Deviation 07344 06874 05796 04659 04444 04134 03970 04030 03694 04061
Percentile 5 0603 0573 0464 0396 0393 0379 0383 0359 0350 0305
10 0701 0667 0539 0459 0454 0438 0447 0422 0405 0366 25 0923 0890 0723 0610 0599 0571 0584 0558 0526 0499 50 1314 1244 1020 0849 0833 0792 0802 0770 0733 0704 75 1899 1795 1456 1209 1184 1126 1111 1091 1007 1034 90 2530 2389 1927 1605 1549 1481 1436 1433 1316 1382 95 2925 2770 2287 1863 1809 1695 1662 1661 1524 1604
975 3280 3076 2623 2102 2000 1867 1841 1818 1725 1790 99 3678 3463 3033 2434 2278 2101 2083 2029 1922 2018
16
Table 13 Average daily dose (ugkgday) of 13-D inhaled during the 62-day period of highest Telone use by residents living 200 m from fields in an area where Telone is applied to a total of 25 80-acre fields each year
Age Group
lt 1 1 lt 2 2 lt 3 3 lt 6 6 lt 9 Male Female Male Female Male Female Male Female Male Female
Mean 04605 05018 28772 31305 25168 26084 20439 20856 18713 18739 Std Deviation 03227 03596 13044 14290 11309 11633 09438 09779 08750 08917
Percentile 5 0112 0117 1229 1308 1089 1124 0851 0854 0758 0745
10 0139 0155 1382 1492 1222 1278 0978 0986 0895 0871 25 0219 0243 1778 1935 1568 1633 1265 1293 1169 1170 50 0374 0401 2647 2865 2324 2404 1865 1887 1700 1694 75 0607 0664 3775 4152 3289 3433 2687 2734 2426 2428 90 0906 0998 4704 5195 4114 4278 3387 3499 3103 3164 95 1112 1238 5266 5730 4585 4726 3771 3915 3536 3593
975 1300 1441 5770 6269 5016 5128 4206 4249 3908 3920 99 1534 1688 6289 6837 5542 5607 4605 4696 4281 4346
9 lt 12 12 lt 15 15 lt 18 18lt 25 25 lt 70 Male Female Male Female Male Female Male Female Male Female
Mean 13973 13308 10879 09069 08808 08389 08368 08156 07646 07564 Std Deviation 06736 06511 05331 04368 04053 03864 03650 03789 03405 03774
Percentile 5 0539 0511 0423 0356 0362 0348 0358 0328 0322 0284
10 0648 0604 0501 0423 0424 0405 0419 0390 0376 0336 25 0872 0824 0679 0567 0570 0530 0554 0523 0503 0462 50 1254 1199 0982 0819 0799 0766 0779 0745 0706 0675 75 1816 1723 1388 1170 1128 1081 1064 1044 0961 0984 90 2351 2273 1816 1521 1439 1382 1328 1350 1231 1286 95 2687 2563 2107 1726 1643 1579 1522 1527 1409 1483
975 2965 2847 2365 1940 1850 1741 1692 1704 1581 1659 99 3358 3142 2680 2170 2043 1922 1877 1904 1767 1851
17
Table 14 Average daily dose (ugkgday) of 13-D inhaled during the 62-day period of highest Telone use by residents living 500 m from fields in an area where Telone is applied to a total of 25 80-acre fields each year
Age Group
lt 1 1 lt 2 2 lt 3 3 lt 6 6 lt 9 Male Female Male Female Male Female Male Female Male Female
Mean 02906 03157 18121 19672 15953 16652 12951 13295 12146 12220 Std Deviation 01948 02105 07170 07709 06263 06341 05264 05343 04984 05174
Percentile 5 0078 0085 0934 1024 0826 0878 0655 0659 0588 0584
10 0099 0107 1041 1141 0920 0977 0724 0750 0671 0666 25 0147 0161 1257 1387 1111 1185 0892 0940 0840 0842 50 0242 0264 1653 1777 1457 1523 1180 1209 1114 1116 75 0378 0413 2232 2419 1974 2044 1596 1633 1494 1494 90 0550 0592 2797 3022 2460 2547 2028 2059 1897 1936 95 0674 0724 3194 3462 2803 2891 2301 2344 2167 2204
975 0809 0878 3536 3831 3097 3174 2574 2652 2438 2478 99 0957 1046 3922 4256 3424 3539 2853 2981 2705 2881
9 lt 12 12 lt 15 15 lt 18 18lt 25 25 lt 70 Male Female Male Female Male Female Male Female Male Female
Mean 09136 08829 07399 06103 05984 05640 05913 05588 05364 05024 Std Deviation 03929 03854 03262 02660 02473 02308 02375 02331 02169 02240
Percentile 5 0418 0399 0330 0285 0280 0274 0280 0264 0254 0223
10 0481 0463 0381 0324 0321 0310 0327 0305 0292 0258 25 0621 0603 0501 0418 0418 0392 0415 0385 0373 0336 50 0841 0805 0677 0556 0557 0517 0553 0516 0501 0455 75 1127 1084 0917 0749 0732 0689 0724 0689 0658 0624 90 1458 1401 1188 0961 0927 0877 0908 0872 0833 0813 95 1674 1633 1373 1129 1069 1009 1044 0999 0947 0922
975 1843 1818 1532 1256 1208 1112 1175 1101 1055 1031 99 2078 2087 1729 1481 1323 1276 1306 1277 1190 1210
18
___________________________________________________________________________
___________________________________________________________________________
INPUT VARIABLES FOR EXPOSURE SIMULATION
Air concentrations
Table 15 gives the probability distributions of air concentrations (in ugm3) used as input in the exposure simulations The first column gives percentiles of the distribution interpolated from a four-parameter logistic curve fit to the original Calhoun et al frequency distribution The interpolated concentrations were adjusted by factors developed by the Environmental Monitoring Branch of DPR (Johnson 1994b) shown in the second column Environmental Monitoring did additional modeling with ISCST to develop an adjustment to approximate the effect of using a 36-point-per-section spatial grid to model air concentrations instead of the relatively coarse 1-point-per-section grid used by Calhoun et al The effect of the adjustment is to increase the variability of the air concentrations while the mean level is unchanged The adjusted concentrations appear in the third column These adjusted values reflecting annual average daily concentrations for points on a 36-point-per-section grid were used for the estimation of lifetime average exposure
Table 15 Air concentration (ugm3) probability distributions used in exposure simulation
Concentrations Adjustment Adjusted Adjusted interpolated from 4shy factors to concentrations concentrations parameter logistic approximate used to estimate used to estimate
Percentile curvea 36-point gridb lifetime exposure 62-day exposure
00001 0103842 069359 0072024 0278587 001 0106063 084461 0089582 0346503 01 0128835 093182 0120051 0464356 02 0160687 096331 0154791 0598731 03 0201575 098483 0198517 0767865 04 0254546 100283 0255267 0987372 05 0323879 101963 0330237 1277356 06 0415684 103671 0430944 1666892 07 0538854 105566 0568846 2200298 08 0706593 107924 0762583 2949673 09 0938983 111571 1047632 4052242 095 1088601 115040 1252327 4844000 099 1228987 123092 1512784 5851450 0999 1263482 135000 1705701 6597652 09999 1266995 149000 1887822 7302097
a Curve fit to high-end air concentration frequency distribution in Calhoun et al (1994) b Johnson (1994b)
19
Seasonal exposure was estimated for July-August the period of historically highest Telone use To estimate average daily concentrations for this 62-day period the adjusted annual concentrations were modified as follows In the Calhoun et al simulation all positive air concentrations occurred in two 74shyday periods (60 days of Telone use plus 14 additional days for the material to dissipate) one in spring and the other in summer In their simulation 707 of the total Telone was applied during the summer use period with 40 mass loss to air In the spring period 293 of the Telone was applied with a mass loss rate of 25 To approximate the average daily concentrations during the summer period the fraction of the annual concentration contributed by the summer period was assumed to be (707 x 40) [(707 x 40) + (293 x 25)] = 0794 This fraction was condensed into 74 days by multiplying by 36574 Since actual Telone applications will probably not be restricted to the four months assumed by Calhoun et al historical use patterns were consulted Pesticide use reporting data showed that in 1988 and 1989 585 and 499 respectively of 13-D applied to carrots in Kern County was applied during July and August The simulation summer-period concentrations were further modified to represent concentrations for the 62 days of July-August by multiplying by (585 707) x (7462) The net effect was to multiply the annual concentrations by 3868 The concentrations thus modified shown in the fourth column of Table 15 were used for the estimation of seasonal exposure
For both lifetime and seasonal exposure assessments the average air concentration experienced by each person was simulated by randomly selecting five values from the relevant air distribution These values represented five locations where the individual spent his or her time A weighted average of the five concentrations weighted by the proportion of time spent at each location was used as the air concentration experienced by the individual The same five locations were used throughout a persons life but the division of time between them changed as a function of age The division of time between locations was a random variable in the simulation and is discussed in the section on individual mobility
To estimate exposure to persons living close to fields additional modeling with ISCST was done by the Environmental Monitoring Branch to provide annual average daily air concentrations at 100-meter increments from edges of treated fields (Johnson 1994a) The probability distributions of concentrations at 100 200 and 500 meters which were used in this exposure assessment are given in Table 16 In calculating the average concentration experienced by a person the first location selected at which the greatest portion of time is spent was considered the home location The concentration for the home location was simulated by selecting one value from eg the 100-meter distribution and one from the general distribution then calculating a weighted average with the two values weighted one-third and two-thirds respectively to reflect the fact that a field is treated only once in three years The two values were chosen to have a rank order correlation coefficient of 080 based on an observed correlation of 086 between ambient concentrations in the same township from year to year (personal communication Bruce Johnson Environmental Monitoring Branch DPR June 22 1994) For seasonal exposures the home concentration was simply a value from the relevant distance distribution This home location concentration was then used as described in the preceding paragraph in the calculation of the average concentration over five locations
20
___________________________________________________________________________
________________________________________________________________________________
Table 16 Annual average air concentrations (ugm3) at specified distances from treated fieldsa
Percentile 100 meters 200 meters 500 meters
000333 035393 030113 024996 001 037037 031439 026472 005 046011 040619 029312 01 050768 044753 031998 015 055763 048264 035456 02 058246 051404 036323 025 060290 055147 037940 03 064604 058207 038904 035 070250 062520 040306 04 077585 074610 041207 045 087638 085215 045127 05 090497 090723 049474 055 097657 096199 055052 06 105653 102253 057466 065 117366 117403 062218 07 131421 125398 067783 075 143991 134267 075510 08 154023 142689 079173 085 163177 151078 083575 09 175806 159046 087488 095 195317 178902 099410 099 220345 198031 127958 099667 226113 204338 135822
a Johnson (1994a)
21
________________________________________________________________________________
________________________________________________________________________________
Individual mobility within the Telone use area
Individuals were assumed to divide their total time between five randomly selected locations within the Telone high-use area The average air concentration to which an individual is exposed was calculated as described above as the mean of the five location concentrations weighted by the proportion of time spent in each location The mean division of time between locations was derived for each age interval from Table 45 in the Arabrsquos Survey of Childrens Activity Patterns (Wiley 1991a) and Table 33 in Activity Patterns of California Residents (Wiley 1991b) Wileys time at home was used as the time spent in the first selected location his time in transit was divided equally between two locations and the remaining time in the day divided between two others The division of time between these last two locations was 7030 for infants stepping down by age interval to a 5050 division for adults Individual time divisions were allowed to vary from the mean by randomly generating them from a multinomial distribution with n chosen to give fairly small variability in the youngest intervals and greater variability in the adolescent and adult intervals The distributions for time division are shown in Table 17
Table 17 Probability distributions of time spent in five locations
Multinomial Age n Average minutes per day spent in location
interval parameter 1 2 3 4 5
0 to 1 100 Male 1157 27 27 160 69 Female 1151 38 38 150 63
1 to 2 100 Male 1157 27 27 160 69 Female 1151 38 38 150 63
2 to 3 90 Male 1134 31 31 170 74 Female 1099 44 44 151 102
3 to 6 90 Male 1134 31 31 170 74 Female 1099 44 44 151 102
6 to 9 80 Male 1044 59 30 170 137 Female 1021 27 26 256 110
9 to 12 80 Male 1020 31 31 250 108 Female 968 47 46 265 114
12 to 15 70 Male 893 61 60 256 170 Female 917 49 49 255 170
15 to 18 70 Male 893 61 60 256 170 Female 917 49 49 255 170
18 to 25 60 Male 782 75 74 255 254 Female 862 60 60 229 229
25 to 70 60 Male 798 60 59 262 261 Female 960 51 51 189 189
22
Breathing rates
An individuals average breathing rate in each age interval was calculated as a weighted average of his rates at each of four activity levels resting light moderate and heavy The rate at each level was weighted by the proportion of time the individual was assumed to spend at that level Breathing rate at each activity level was a random variable The proportion of time at each level was a constant fixed for each age interval
For infants (0-1 year) a triangular distribution of breathing rates was derived from the mean and range reported in the Exposure Factors Handbook Table 3A-2 (USEPA 1990) The mode of the triangular distribution was set equal to the lower limit of the range in order to match the EPA mean For the other age intervals uniform distributions were derived from data in the ARBs Measurement of Breathing Rate and Volume (Adams 1993) In each case the range was chosen to include all the reported rates relevant to an activity level for a specific sex and age group These ranges are given in Table 18 Data were unavailable for children aged 1-3 so the breathing rates for 3-6-year-olds were used The breathing rates of an individual at different activity levels within and across ages were assumed to have the rank order correlations shown in Table 19 (The value of 08 on the diagonal represents the correlation between breathing rates of the same individual at the same activity level at different ages) It was not possible to incorporate correlations between body weight and breathing rates because the software used did not handle them correctly Correlation coefficients of body surface area and breathing rate within age intervals and activity levels reported in Adams (1993) ranged from 006 to 084 with a mean of 040 The correlation of body weight and breathing rate may be similar The effect of omitting this correlation from the simulation was probably to increase the estimated exposures to an unknown degree because if the greater exposures associated with high breathing rates tended to be paired with high body weights the exposure would be mitigated somewhat
The proportion of time assumed to be spent at each activity level is shown in Table 20
Body weight
Body weight distributions were taken directly from Tables 5A-1 through 5A-4 in the Exposure Factors Handbook (USEPA 1990) The histograms reported in these tables were used without smoothing Upper and lower bounds were supplied to produce a mean weight equal to the mean given in the EPA tables An individuals weights in different age intervals were assumed to have the rank order correlations shown in Table 21
Residence time and lifetime
In estimating lifetime exposures lifetime length was fixed at 70 years Exposure was estimated separately for fixed times of residence in the Telone use area of 30 and 70 years Since the exposure assessment is viewed as applying to any areas where Telone may be reintroduced in the proposed way and not just to the specific township in Kern County for which Calhoun et al modeled air concentrations it was not reasonable to define a distribution of residence time in the area Instead the estimated exposures are those expected to result from living the first 30 or 70 years of a 70-year lifetime in any area with Telone use like that described here
23
________________________________________________________________________________
________________________________________________________________________________
Table 18 Breathing rates (Lmin) as ranges of uniform distributions
Age interval Activity level Male Female
0 to 1 All Triangular ( 025 025 209 ) 1 to 2 Resting 5-7
Light 7-11 Moderate 8-15 Heavy 14-22
2 to 3 Resting 5-7 Light 7-11 Moderate 8-15 Heavy 14-22
3 to 6 Resting 5-7 Light 7-11 Moderate 8-15 Heavy 14-22
6 to 9 Resting 5-9 Light 10-17 Moderate 11-23 Heavy 20-45
9 to 12 Resting 5-9 Light 10-17 Moderate 11-23 Heavy 20-45
12 to 15 Resting 6-12 5-10 Light 7-17 7-15 Moderate 17-35 15-27 Heavy 25-72 24-59
15 to 18 Resting 6-12 5-10 Light 7-17 7-15 Moderate 17-35 15-27 Heavy 25-72 24-59
18 to 25 Resting 7-11 5-10 Light 8-18 6-15 Moderate 18-42 15-28 Heavy 48-80 39-62
25 to 70 Resting 7-11 5-10 Light 8-18 6-15 Moderate 18-42 15-28 Heavy 48-80 39-62
24
________________________________________________________________________________
_____________________________________________________________________________
________________________________________________________________________________
________________________________________________________________________________
Table 19 Rank order correlation coefficients between individuals breathing rates at different activity levels within and across age intervals
Resting Light Moderate Heavy Resting 08 05 05 04 Light 08 05 04 Moderate 08 05 Heavy 08
Table 20 Proportion of time at each activity level (constant in exposure simulation)
Age Activity level interval
Resting Light Moderate Heavy
0 to 1 Male 1 0 0 0 Female 1 0 0 0
1 to 2 Male 08 015 004 001 Female 08 015 004 001
2 to 3 Male 075 02 004 001 Female 075 02 004 001
3 to 6 Male 07 02 008 002 Female 07 02 008 002
6 to 9 Male 07 017 010 003 Female 07 02 008 002
9 to 12 Male 06 032 005 003 Female 06 033 005 002
12 to 15 Male 06 032 005 003 Female 06 033 005 002
15 to 18 Male 05 04 006 004 Female 05 042 005 003
18 to 25 Male 04 050 006 004 Female 04 052 005 003
25 to 70 Male 035 057 005 003 Female 035 060 004 001
25
________________________________________________________________________________
_______________________________________________________________________________
Table 21 Rank order correlation coefficients between the weights of an individual at different ages
0 to 1 1 to 2 2 to 3 3 to 6 6 to 9 9 to 12 12 to 15 15 to 18 18 to 25 25 to 70
0 to 1 100 092 082 072 061 061 061 061 061 061 1 to 2 100 092 082 072 061 061 061 061 061 2 to 3 100 092 082 072 061 061 061 061 3 to 6 100 092 082 072 061 061 061 6 to 9 100 092 082 072 061 061 9 to 12 100 092 082 072 061 12 to 15 100 082 082 072 15 to 18 100 082 082 18 to 25 100 082 25 to 70 100
Exposure appraisal
The estimated exposure distributions may be regarded as providing a reasonable idea of the highest exposures that should be expected under the use scenario The distributions should not be interpreted as reflecting the exposures of a population of individuals but as a set of values that are likely to bracket the exposure of an individual in this situation
It should be noted that the large differences between estimated seasonal exposures of children less than one and children from one to three are largely produced by the input breathing rate distributions The breathing rate data for infants under one came from a different source than all the other breathing rate data In addition no data were available for children from one to three so the rates for three- to six-year-old children were used In combination with the small body size of these children this may have overestimated their exposures
An important limitation of this exposure assessment is that it used 13-D concentrations in outdoor air to estimate 24-hourday exposure even though most people spend the greatest part of the day indoors Since the registrant provided no data on indoor concentrations and since no appropriate surrogate data were available to estimate them it was judged that there was no alternative
It is important to remember that these estimates of non-occupational exposure apply only to the use scenario of Calhoun et al which specified Telone applications to only 2000 acres per year in an area which has 8500 acres of carrots alone Any change in the use scenario would require a new exposure assessment
26
REFERENCES
Adams WC 1993 Measurement of breathing rate and volume in routinely performed daily activities Final report contract no A033-205 Research Division California Air Resources Board Sacramento CA
Albrecht WN 1987 Occupational exposure to 13-dichloropropene (Telone II) in Hawaiian pineapple culture Arch Environ Health 42286-290
Brouwer DH Brouwer EJ de Vreede JAF van Welie RTH Vermuelen NPE and van Hemmen JJ 1991 Inhalation exposure to 13-dichloropropene in the Dutch flower-bulb culture Part I Environmental monitoring Arch Environ Contam Toxicol 201-5
Calhoun LL Fontaine DD Stuart BL and Landenberger BD 1994 13shydichloropropene (13-D) An assessment of implied exposure and risk for the proposed commercial reentry of TELONE soil fumigant into California Dow Chemical Co Midland MI
California Department of Food and Agriculture 1988 Report of pesticides sold in California in 1987 Pesticide Use Enforcement Branch California Department of Food and Agriculture Sacramento CA
Climie IJG Hutson DH Morrison BJ and Stoydin G 1979 Glutathione conjugation in the detoxification of (Z)-13-dichloropropene (a component of the nematicide D-D) Xenobiotica 9149-156
Cohen B-S M and Poppendorf W 1989 A method for monitoring dermal exposure to volatile chemicals Am Ind Hyg Assoc J 50 216-223
Cook RE 1983 Fumigators exposure to airborne 13-dichloropropene during fumigation operation of Telone II soil fumigant Driscoll Citrus Service Inc Fort Pierce Florida Unpublished report of the Dow Chemical Chemical Company Industrial Hygiene Laboratory Midland MI January 4 1983
Davies DB and Fraser PA 1988 Evaluation of potential operator fieldworker and bystander exposure to 13-dichloropropene as a result of tobacco field fumigation with Telone II soil fumigant in southwestern Ontario (Canada) May-June 1985 CDFA Reg Doc No 50046-039
Dietz FK Hermann EA and Ramsey JC 1984a The pharmacokinetics of 14C-13shydichloropropene in rats and mice following oral administration The Toxicologist 4 Abstr No 585
Dietz FK Dittenber DA Krik HD and Ramsey JC 1984b Non-protein sulfhydryl content and macromolecular binding in rats and mice following oral administration of 13shydichloropropene The Toxicologist 4 Abstr No 586
Fisher GD and Kilgore WW 1988a Tissue levels of glutathione following acute inhalation of 13-dichloropropene J Toxicol Environ Health 23171-182
Fisher GD and Kilgore WW 1988b Mercapturic acid excretion in rats following 13shydichloropropene inhalation exposure Fund Appl Toxicol 11 303-307
27
Fisher GD and Kilgore WW 1989 Pharmacokinetics of S-[3-chloroprop-2shyenyl]glutathione in rats following acute inhalation exposure to 13-dichloropropene Xenobiotica 19269-278
Fong HR and Maykoski R 1985 Air exposure monitoring of EHAP personnel during a Telone II soil translocation study in Fresno County CDFA Rpt HS 1299
Houtman BA 1992 Managing worker exposure 13-D in California
Houtman BA 1993 An evaluation of 13-dichloropropene worker exposure associated with Telone II soil fumigant loading application and reentry phase I ECL92095 (interim report)
Hutson DH Moss JA and Pickering BA 1971 The excretion and retention of components of the soil fumigant D-D and their metabolites in the rat Food Cosmet Toxicol 9 677-680
Johnson B 1994a Memorandum to John Sanders June 20 1994 on buffer zone calculations for 13-D in Kern County Environmental Monitoring and Pest Management Branch Department of Pesticide Regulation Sacramento CA
Johnson B 1994b Memorandum to Kean Goh May 16 1994 on estimated adjusted air concentration percentiles based on Dow simulation results for T29R26 Environmental Monitoring and Pest Management Branch Department of Pesticide Regulation Sacramento CA
Maddy KT Cusick B Richmond D 1980 Studies concerning the field application of Telone and DD in California in 1979 and the ambient air concentration of these pesticides during and following application by shank injection into soil in fields CDFA Rpt HS 686
Maddy KT Schneider F and Fredrickson S 1982 Monitoring of Telone II during and following experimental application by shank injection to established trees and grape vines in California in 1980-1981 CDFA Rpt 967
NIOSHOSHA Occupational Safety and Health Guidelines for Chemical Hazards 1988 DHHS (NIOSH) Publication No 81-1231981 and supplements Publication Nos 88-118 and 89-104
Osterloh JD Cohen BS Poppendorf W and Pond SM 1984 Urinary excretion of the N-cysteine conjugate of cis-13-dichloropropene by exposed individuals Arch Environ Health 39 271-275
Osterloh JD Wang R OConnell L Jacob III P and Maddy KT 1989a Pilot study for biological monitoring of 13-dichloropropene In Biological Monitoring of Pesticide Exposure RG Wang CA Franklin RC Honeycutt and JC Reinert (eds) Amer Chem Soc Soc Symp Ser No 382 215-230
Osterloh JD Wang R Schneider F and Maddy K 1989b Biological monitoring of dichloropropene Air concentrations urinary metabolite and renal enzyme excretion Arch Environ Health 44 207-213
Owen WJ and DeRouen TA 1980 Estimation of the mean for lognormal data containing zeroes and left-censored values with applications to the measurement of worker exposure to air contaminants Biometrics 36 707 719
28
Palisades Corporation 1992 RISK Risk analysis and simulation add-in for Microsoft Excel Release 11 users guide 31 Decker Rd Newfield NY 14867
Poppendorf W Leffingwell JT and Cohen B 1983 Development of methods and procedures for the assessment of occupational health risks in the application and use of nematicides in California CDFA Rpt HS 1162
Shapiro SS and Wilk MB 1965 An analysis for normality (complete samples) Biometrika 52 591-611
Stott WT and Kastl PE 1986 Inhalation pharmacokinetics of technical grade 13shydichloropropene Toxicol Appl Pharmacol 85 332-341
Stott WT 1992 Letter to J R Sanborn August 11 1992
Tobol HK and Axe FD 1982 Airborne concentrations of 13-dichloropropene during fumigation of established grapevines almond trees and peach trees California December 1980-January 1981 Unpublished report of the Dow Chemical Company Environmental ServicesIndustrial Hygiene Western Division Dow Chemical USA Report No HeRW-AG(8)
US EPA 1990 Exposure factors handbook EPA6008-89043 Office of Health and Environmental Assessment Washington DC
Van Welie RTH van Duyn P Brouwer DH van Hemmen JJ Brouwer EJ and Vermuelen NPE 1991 Inhalation exposure to 13-dichloropropene in the Dutch flower-bulb culture Part II Biological monitoring by measurement of urinary excretion of two mercapturic acid metabolites Arch Environ Contam Toxicol 206-12
Waechter JM Brazak KA McCarty LP LaPack MA and Brownson 1992 13shydichloropropene (Telone II Soil Fumigant) Inhalation pharmacokinetics and metabolism in human volunteers DowElanco (Interim Report) Laboratory Project Study ID M-002993-023
Wagner CP 1987 Industrial source complex (ISC) dispersion model users guide 2nd edition (revised) Vol I US Environmental Protection Agency Report No EPA-4054-88shy002 a
Wiley JA 1991a Study of childrens activity patterns Final report contract no A733-149 Research Division California Air Resources Board Sacramento CA
Wiley JA 1991b Activity patterns of California residents Final report contract no A6-177shy33 Research Division California Air Resources Board Sacramento CA
29
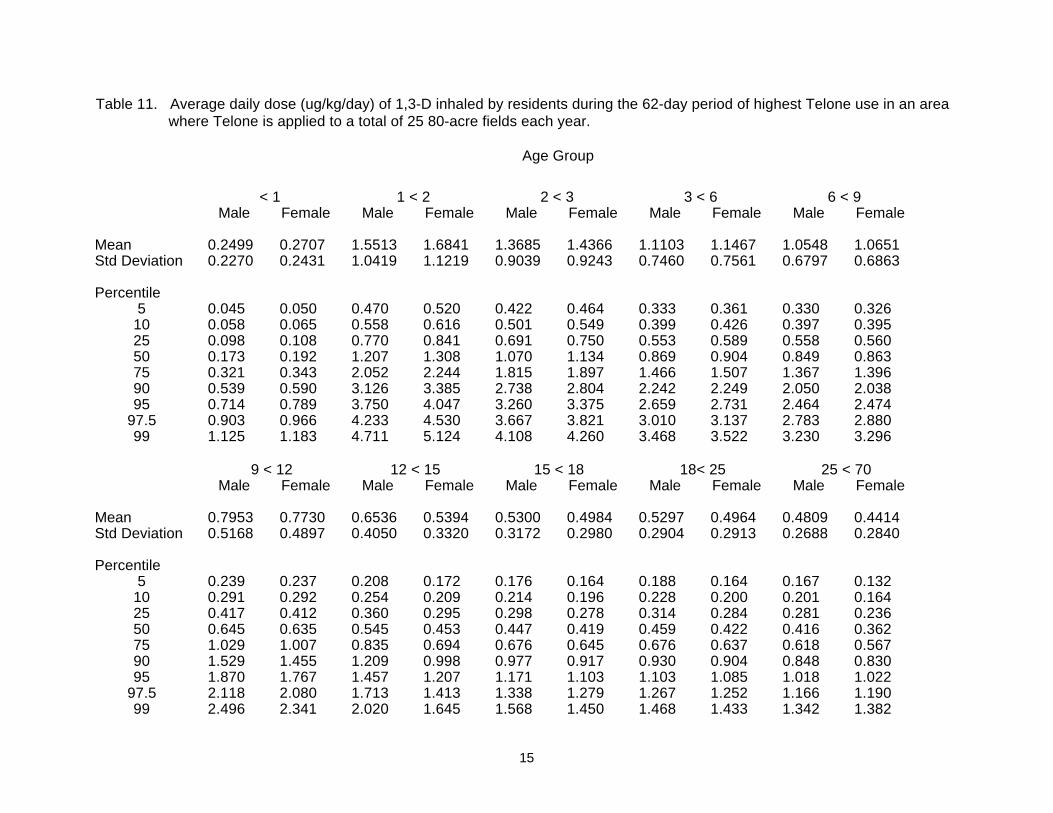

___________________________________________________________________________
___________________________________________________________________________
INPUT VARIABLES FOR EXPOSURE SIMULATION
Air concentrations
Table 15 gives the probability distributions of air concentrations (in ugm3) used as input in the exposure simulations The first column gives percentiles of the distribution interpolated from a four-parameter logistic curve fit to the original Calhoun et al frequency distribution The interpolated concentrations were adjusted by factors developed by the Environmental Monitoring Branch of DPR (Johnson 1994b) shown in the second column Environmental Monitoring did additional modeling with ISCST to develop an adjustment to approximate the effect of using a 36-point-per-section spatial grid to model air concentrations instead of the relatively coarse 1-point-per-section grid used by Calhoun et al The effect of the adjustment is to increase the variability of the air concentrations while the mean level is unchanged The adjusted concentrations appear in the third column These adjusted values reflecting annual average daily concentrations for points on a 36-point-per-section grid were used for the estimation of lifetime average exposure
Table 15 Air concentration (ugm3) probability distributions used in exposure simulation
Concentrations Adjustment Adjusted Adjusted interpolated from 4shy factors to concentrations concentrations parameter logistic approximate used to estimate used to estimate
Percentile curvea 36-point gridb lifetime exposure 62-day exposure
00001 0103842 069359 0072024 0278587 001 0106063 084461 0089582 0346503 01 0128835 093182 0120051 0464356 02 0160687 096331 0154791 0598731 03 0201575 098483 0198517 0767865 04 0254546 100283 0255267 0987372 05 0323879 101963 0330237 1277356 06 0415684 103671 0430944 1666892 07 0538854 105566 0568846 2200298 08 0706593 107924 0762583 2949673 09 0938983 111571 1047632 4052242 095 1088601 115040 1252327 4844000 099 1228987 123092 1512784 5851450 0999 1263482 135000 1705701 6597652 09999 1266995 149000 1887822 7302097
a Curve fit to high-end air concentration frequency distribution in Calhoun et al (1994) b Johnson (1994b)
19
Seasonal exposure was estimated for July-August the period of historically highest Telone use To estimate average daily concentrations for this 62-day period the adjusted annual concentrations were modified as follows In the Calhoun et al simulation all positive air concentrations occurred in two 74shyday periods (60 days of Telone use plus 14 additional days for the material to dissipate) one in spring and the other in summer In their simulation 707 of the total Telone was applied during the summer use period with 40 mass loss to air In the spring period 293 of the Telone was applied with a mass loss rate of 25 To approximate the average daily concentrations during the summer period the fraction of the annual concentration contributed by the summer period was assumed to be (707 x 40) [(707 x 40) + (293 x 25)] = 0794 This fraction was condensed into 74 days by multiplying by 36574 Since actual Telone applications will probably not be restricted to the four months assumed by Calhoun et al historical use patterns were consulted Pesticide use reporting data showed that in 1988 and 1989 585 and 499 respectively of 13-D applied to carrots in Kern County was applied during July and August The simulation summer-period concentrations were further modified to represent concentrations for the 62 days of July-August by multiplying by (585 707) x (7462) The net effect was to multiply the annual concentrations by 3868 The concentrations thus modified shown in the fourth column of Table 15 were used for the estimation of seasonal exposure
For both lifetime and seasonal exposure assessments the average air concentration experienced by each person was simulated by randomly selecting five values from the relevant air distribution These values represented five locations where the individual spent his or her time A weighted average of the five concentrations weighted by the proportion of time spent at each location was used as the air concentration experienced by the individual The same five locations were used throughout a persons life but the division of time between them changed as a function of age The division of time between locations was a random variable in the simulation and is discussed in the section on individual mobility
To estimate exposure to persons living close to fields additional modeling with ISCST was done by the Environmental Monitoring Branch to provide annual average daily air concentrations at 100-meter increments from edges of treated fields (Johnson 1994a) The probability distributions of concentrations at 100 200 and 500 meters which were used in this exposure assessment are given in Table 16 In calculating the average concentration experienced by a person the first location selected at which the greatest portion of time is spent was considered the home location The concentration for the home location was simulated by selecting one value from eg the 100-meter distribution and one from the general distribution then calculating a weighted average with the two values weighted one-third and two-thirds respectively to reflect the fact that a field is treated only once in three years The two values were chosen to have a rank order correlation coefficient of 080 based on an observed correlation of 086 between ambient concentrations in the same township from year to year (personal communication Bruce Johnson Environmental Monitoring Branch DPR June 22 1994) For seasonal exposures the home concentration was simply a value from the relevant distance distribution This home location concentration was then used as described in the preceding paragraph in the calculation of the average concentration over five locations
20
___________________________________________________________________________
________________________________________________________________________________
Table 16 Annual average air concentrations (ugm3) at specified distances from treated fieldsa
Percentile 100 meters 200 meters 500 meters
000333 035393 030113 024996 001 037037 031439 026472 005 046011 040619 029312 01 050768 044753 031998 015 055763 048264 035456 02 058246 051404 036323 025 060290 055147 037940 03 064604 058207 038904 035 070250 062520 040306 04 077585 074610 041207 045 087638 085215 045127 05 090497 090723 049474 055 097657 096199 055052 06 105653 102253 057466 065 117366 117403 062218 07 131421 125398 067783 075 143991 134267 075510 08 154023 142689 079173 085 163177 151078 083575 09 175806 159046 087488 095 195317 178902 099410 099 220345 198031 127958 099667 226113 204338 135822
a Johnson (1994a)
21
________________________________________________________________________________
________________________________________________________________________________
Individual mobility within the Telone use area
Individuals were assumed to divide their total time between five randomly selected locations within the Telone high-use area The average air concentration to which an individual is exposed was calculated as described above as the mean of the five location concentrations weighted by the proportion of time spent in each location The mean division of time between locations was derived for each age interval from Table 45 in the Arabrsquos Survey of Childrens Activity Patterns (Wiley 1991a) and Table 33 in Activity Patterns of California Residents (Wiley 1991b) Wileys time at home was used as the time spent in the first selected location his time in transit was divided equally between two locations and the remaining time in the day divided between two others The division of time between these last two locations was 7030 for infants stepping down by age interval to a 5050 division for adults Individual time divisions were allowed to vary from the mean by randomly generating them from a multinomial distribution with n chosen to give fairly small variability in the youngest intervals and greater variability in the adolescent and adult intervals The distributions for time division are shown in Table 17
Table 17 Probability distributions of time spent in five locations
Multinomial Age n Average minutes per day spent in location
interval parameter 1 2 3 4 5
0 to 1 100 Male 1157 27 27 160 69 Female 1151 38 38 150 63
1 to 2 100 Male 1157 27 27 160 69 Female 1151 38 38 150 63
2 to 3 90 Male 1134 31 31 170 74 Female 1099 44 44 151 102
3 to 6 90 Male 1134 31 31 170 74 Female 1099 44 44 151 102
6 to 9 80 Male 1044 59 30 170 137 Female 1021 27 26 256 110
9 to 12 80 Male 1020 31 31 250 108 Female 968 47 46 265 114
12 to 15 70 Male 893 61 60 256 170 Female 917 49 49 255 170
15 to 18 70 Male 893 61 60 256 170 Female 917 49 49 255 170
18 to 25 60 Male 782 75 74 255 254 Female 862 60 60 229 229
25 to 70 60 Male 798 60 59 262 261 Female 960 51 51 189 189
22
Breathing rates
An individuals average breathing rate in each age interval was calculated as a weighted average of his rates at each of four activity levels resting light moderate and heavy The rate at each level was weighted by the proportion of time the individual was assumed to spend at that level Breathing rate at each activity level was a random variable The proportion of time at each level was a constant fixed for each age interval
For infants (0-1 year) a triangular distribution of breathing rates was derived from the mean and range reported in the Exposure Factors Handbook Table 3A-2 (USEPA 1990) The mode of the triangular distribution was set equal to the lower limit of the range in order to match the EPA mean For the other age intervals uniform distributions were derived from data in the ARBs Measurement of Breathing Rate and Volume (Adams 1993) In each case the range was chosen to include all the reported rates relevant to an activity level for a specific sex and age group These ranges are given in Table 18 Data were unavailable for children aged 1-3 so the breathing rates for 3-6-year-olds were used The breathing rates of an individual at different activity levels within and across ages were assumed to have the rank order correlations shown in Table 19 (The value of 08 on the diagonal represents the correlation between breathing rates of the same individual at the same activity level at different ages) It was not possible to incorporate correlations between body weight and breathing rates because the software used did not handle them correctly Correlation coefficients of body surface area and breathing rate within age intervals and activity levels reported in Adams (1993) ranged from 006 to 084 with a mean of 040 The correlation of body weight and breathing rate may be similar The effect of omitting this correlation from the simulation was probably to increase the estimated exposures to an unknown degree because if the greater exposures associated with high breathing rates tended to be paired with high body weights the exposure would be mitigated somewhat
The proportion of time assumed to be spent at each activity level is shown in Table 20
Body weight
Body weight distributions were taken directly from Tables 5A-1 through 5A-4 in the Exposure Factors Handbook (USEPA 1990) The histograms reported in these tables were used without smoothing Upper and lower bounds were supplied to produce a mean weight equal to the mean given in the EPA tables An individuals weights in different age intervals were assumed to have the rank order correlations shown in Table 21
Residence time and lifetime
In estimating lifetime exposures lifetime length was fixed at 70 years Exposure was estimated separately for fixed times of residence in the Telone use area of 30 and 70 years Since the exposure assessment is viewed as applying to any areas where Telone may be reintroduced in the proposed way and not just to the specific township in Kern County for which Calhoun et al modeled air concentrations it was not reasonable to define a distribution of residence time in the area Instead the estimated exposures are those expected to result from living the first 30 or 70 years of a 70-year lifetime in any area with Telone use like that described here
23
________________________________________________________________________________
________________________________________________________________________________
Table 18 Breathing rates (Lmin) as ranges of uniform distributions
Age interval Activity level Male Female
0 to 1 All Triangular ( 025 025 209 ) 1 to 2 Resting 5-7
Light 7-11 Moderate 8-15 Heavy 14-22
2 to 3 Resting 5-7 Light 7-11 Moderate 8-15 Heavy 14-22
3 to 6 Resting 5-7 Light 7-11 Moderate 8-15 Heavy 14-22
6 to 9 Resting 5-9 Light 10-17 Moderate 11-23 Heavy 20-45
9 to 12 Resting 5-9 Light 10-17 Moderate 11-23 Heavy 20-45
12 to 15 Resting 6-12 5-10 Light 7-17 7-15 Moderate 17-35 15-27 Heavy 25-72 24-59
15 to 18 Resting 6-12 5-10 Light 7-17 7-15 Moderate 17-35 15-27 Heavy 25-72 24-59
18 to 25 Resting 7-11 5-10 Light 8-18 6-15 Moderate 18-42 15-28 Heavy 48-80 39-62
25 to 70 Resting 7-11 5-10 Light 8-18 6-15 Moderate 18-42 15-28 Heavy 48-80 39-62
24
________________________________________________________________________________
_____________________________________________________________________________
________________________________________________________________________________
________________________________________________________________________________
Table 19 Rank order correlation coefficients between individuals breathing rates at different activity levels within and across age intervals
Resting Light Moderate Heavy Resting 08 05 05 04 Light 08 05 04 Moderate 08 05 Heavy 08
Table 20 Proportion of time at each activity level (constant in exposure simulation)
Age Activity level interval
Resting Light Moderate Heavy
0 to 1 Male 1 0 0 0 Female 1 0 0 0
1 to 2 Male 08 015 004 001 Female 08 015 004 001
2 to 3 Male 075 02 004 001 Female 075 02 004 001
3 to 6 Male 07 02 008 002 Female 07 02 008 002
6 to 9 Male 07 017 010 003 Female 07 02 008 002
9 to 12 Male 06 032 005 003 Female 06 033 005 002
12 to 15 Male 06 032 005 003 Female 06 033 005 002
15 to 18 Male 05 04 006 004 Female 05 042 005 003
18 to 25 Male 04 050 006 004 Female 04 052 005 003
25 to 70 Male 035 057 005 003 Female 035 060 004 001
25
________________________________________________________________________________
_______________________________________________________________________________
Table 21 Rank order correlation coefficients between the weights of an individual at different ages
0 to 1 1 to 2 2 to 3 3 to 6 6 to 9 9 to 12 12 to 15 15 to 18 18 to 25 25 to 70
0 to 1 100 092 082 072 061 061 061 061 061 061 1 to 2 100 092 082 072 061 061 061 061 061 2 to 3 100 092 082 072 061 061 061 061 3 to 6 100 092 082 072 061 061 061 6 to 9 100 092 082 072 061 061 9 to 12 100 092 082 072 061 12 to 15 100 082 082 072 15 to 18 100 082 082 18 to 25 100 082 25 to 70 100
Exposure appraisal
The estimated exposure distributions may be regarded as providing a reasonable idea of the highest exposures that should be expected under the use scenario The distributions should not be interpreted as reflecting the exposures of a population of individuals but as a set of values that are likely to bracket the exposure of an individual in this situation
It should be noted that the large differences between estimated seasonal exposures of children less than one and children from one to three are largely produced by the input breathing rate distributions The breathing rate data for infants under one came from a different source than all the other breathing rate data In addition no data were available for children from one to three so the rates for three- to six-year-old children were used In combination with the small body size of these children this may have overestimated their exposures
An important limitation of this exposure assessment is that it used 13-D concentrations in outdoor air to estimate 24-hourday exposure even though most people spend the greatest part of the day indoors Since the registrant provided no data on indoor concentrations and since no appropriate surrogate data were available to estimate them it was judged that there was no alternative
It is important to remember that these estimates of non-occupational exposure apply only to the use scenario of Calhoun et al which specified Telone applications to only 2000 acres per year in an area which has 8500 acres of carrots alone Any change in the use scenario would require a new exposure assessment
26
REFERENCES
Adams WC 1993 Measurement of breathing rate and volume in routinely performed daily activities Final report contract no A033-205 Research Division California Air Resources Board Sacramento CA
Albrecht WN 1987 Occupational exposure to 13-dichloropropene (Telone II) in Hawaiian pineapple culture Arch Environ Health 42286-290
Brouwer DH Brouwer EJ de Vreede JAF van Welie RTH Vermuelen NPE and van Hemmen JJ 1991 Inhalation exposure to 13-dichloropropene in the Dutch flower-bulb culture Part I Environmental monitoring Arch Environ Contam Toxicol 201-5
Calhoun LL Fontaine DD Stuart BL and Landenberger BD 1994 13shydichloropropene (13-D) An assessment of implied exposure and risk for the proposed commercial reentry of TELONE soil fumigant into California Dow Chemical Co Midland MI
California Department of Food and Agriculture 1988 Report of pesticides sold in California in 1987 Pesticide Use Enforcement Branch California Department of Food and Agriculture Sacramento CA
Climie IJG Hutson DH Morrison BJ and Stoydin G 1979 Glutathione conjugation in the detoxification of (Z)-13-dichloropropene (a component of the nematicide D-D) Xenobiotica 9149-156
Cohen B-S M and Poppendorf W 1989 A method for monitoring dermal exposure to volatile chemicals Am Ind Hyg Assoc J 50 216-223
Cook RE 1983 Fumigators exposure to airborne 13-dichloropropene during fumigation operation of Telone II soil fumigant Driscoll Citrus Service Inc Fort Pierce Florida Unpublished report of the Dow Chemical Chemical Company Industrial Hygiene Laboratory Midland MI January 4 1983
Davies DB and Fraser PA 1988 Evaluation of potential operator fieldworker and bystander exposure to 13-dichloropropene as a result of tobacco field fumigation with Telone II soil fumigant in southwestern Ontario (Canada) May-June 1985 CDFA Reg Doc No 50046-039
Dietz FK Hermann EA and Ramsey JC 1984a The pharmacokinetics of 14C-13shydichloropropene in rats and mice following oral administration The Toxicologist 4 Abstr No 585
Dietz FK Dittenber DA Krik HD and Ramsey JC 1984b Non-protein sulfhydryl content and macromolecular binding in rats and mice following oral administration of 13shydichloropropene The Toxicologist 4 Abstr No 586
Fisher GD and Kilgore WW 1988a Tissue levels of glutathione following acute inhalation of 13-dichloropropene J Toxicol Environ Health 23171-182
Fisher GD and Kilgore WW 1988b Mercapturic acid excretion in rats following 13shydichloropropene inhalation exposure Fund Appl Toxicol 11 303-307
27
Fisher GD and Kilgore WW 1989 Pharmacokinetics of S-[3-chloroprop-2shyenyl]glutathione in rats following acute inhalation exposure to 13-dichloropropene Xenobiotica 19269-278
Fong HR and Maykoski R 1985 Air exposure monitoring of EHAP personnel during a Telone II soil translocation study in Fresno County CDFA Rpt HS 1299
Houtman BA 1992 Managing worker exposure 13-D in California
Houtman BA 1993 An evaluation of 13-dichloropropene worker exposure associated with Telone II soil fumigant loading application and reentry phase I ECL92095 (interim report)
Hutson DH Moss JA and Pickering BA 1971 The excretion and retention of components of the soil fumigant D-D and their metabolites in the rat Food Cosmet Toxicol 9 677-680
Johnson B 1994a Memorandum to John Sanders June 20 1994 on buffer zone calculations for 13-D in Kern County Environmental Monitoring and Pest Management Branch Department of Pesticide Regulation Sacramento CA
Johnson B 1994b Memorandum to Kean Goh May 16 1994 on estimated adjusted air concentration percentiles based on Dow simulation results for T29R26 Environmental Monitoring and Pest Management Branch Department of Pesticide Regulation Sacramento CA
Maddy KT Cusick B Richmond D 1980 Studies concerning the field application of Telone and DD in California in 1979 and the ambient air concentration of these pesticides during and following application by shank injection into soil in fields CDFA Rpt HS 686
Maddy KT Schneider F and Fredrickson S 1982 Monitoring of Telone II during and following experimental application by shank injection to established trees and grape vines in California in 1980-1981 CDFA Rpt 967
NIOSHOSHA Occupational Safety and Health Guidelines for Chemical Hazards 1988 DHHS (NIOSH) Publication No 81-1231981 and supplements Publication Nos 88-118 and 89-104
Osterloh JD Cohen BS Poppendorf W and Pond SM 1984 Urinary excretion of the N-cysteine conjugate of cis-13-dichloropropene by exposed individuals Arch Environ Health 39 271-275
Osterloh JD Wang R OConnell L Jacob III P and Maddy KT 1989a Pilot study for biological monitoring of 13-dichloropropene In Biological Monitoring of Pesticide Exposure RG Wang CA Franklin RC Honeycutt and JC Reinert (eds) Amer Chem Soc Soc Symp Ser No 382 215-230
Osterloh JD Wang R Schneider F and Maddy K 1989b Biological monitoring of dichloropropene Air concentrations urinary metabolite and renal enzyme excretion Arch Environ Health 44 207-213
Owen WJ and DeRouen TA 1980 Estimation of the mean for lognormal data containing zeroes and left-censored values with applications to the measurement of worker exposure to air contaminants Biometrics 36 707 719
28
Palisades Corporation 1992 RISK Risk analysis and simulation add-in for Microsoft Excel Release 11 users guide 31 Decker Rd Newfield NY 14867
Poppendorf W Leffingwell JT and Cohen B 1983 Development of methods and procedures for the assessment of occupational health risks in the application and use of nematicides in California CDFA Rpt HS 1162
Shapiro SS and Wilk MB 1965 An analysis for normality (complete samples) Biometrika 52 591-611
Stott WT and Kastl PE 1986 Inhalation pharmacokinetics of technical grade 13shydichloropropene Toxicol Appl Pharmacol 85 332-341
Stott WT 1992 Letter to J R Sanborn August 11 1992
Tobol HK and Axe FD 1982 Airborne concentrations of 13-dichloropropene during fumigation of established grapevines almond trees and peach trees California December 1980-January 1981 Unpublished report of the Dow Chemical Company Environmental ServicesIndustrial Hygiene Western Division Dow Chemical USA Report No HeRW-AG(8)
US EPA 1990 Exposure factors handbook EPA6008-89043 Office of Health and Environmental Assessment Washington DC
Van Welie RTH van Duyn P Brouwer DH van Hemmen JJ Brouwer EJ and Vermuelen NPE 1991 Inhalation exposure to 13-dichloropropene in the Dutch flower-bulb culture Part II Biological monitoring by measurement of urinary excretion of two mercapturic acid metabolites Arch Environ Contam Toxicol 206-12
Waechter JM Brazak KA McCarty LP LaPack MA and Brownson 1992 13shydichloropropene (Telone II Soil Fumigant) Inhalation pharmacokinetics and metabolism in human volunteers DowElanco (Interim Report) Laboratory Project Study ID M-002993-023
Wagner CP 1987 Industrial source complex (ISC) dispersion model users guide 2nd edition (revised) Vol I US Environmental Protection Agency Report No EPA-4054-88shy002 a
Wiley JA 1991a Study of childrens activity patterns Final report contract no A733-149 Research Division California Air Resources Board Sacramento CA
Wiley JA 1991b Activity patterns of California residents Final report contract no A6-177shy33 Research Division California Air Resources Board Sacramento CA
29
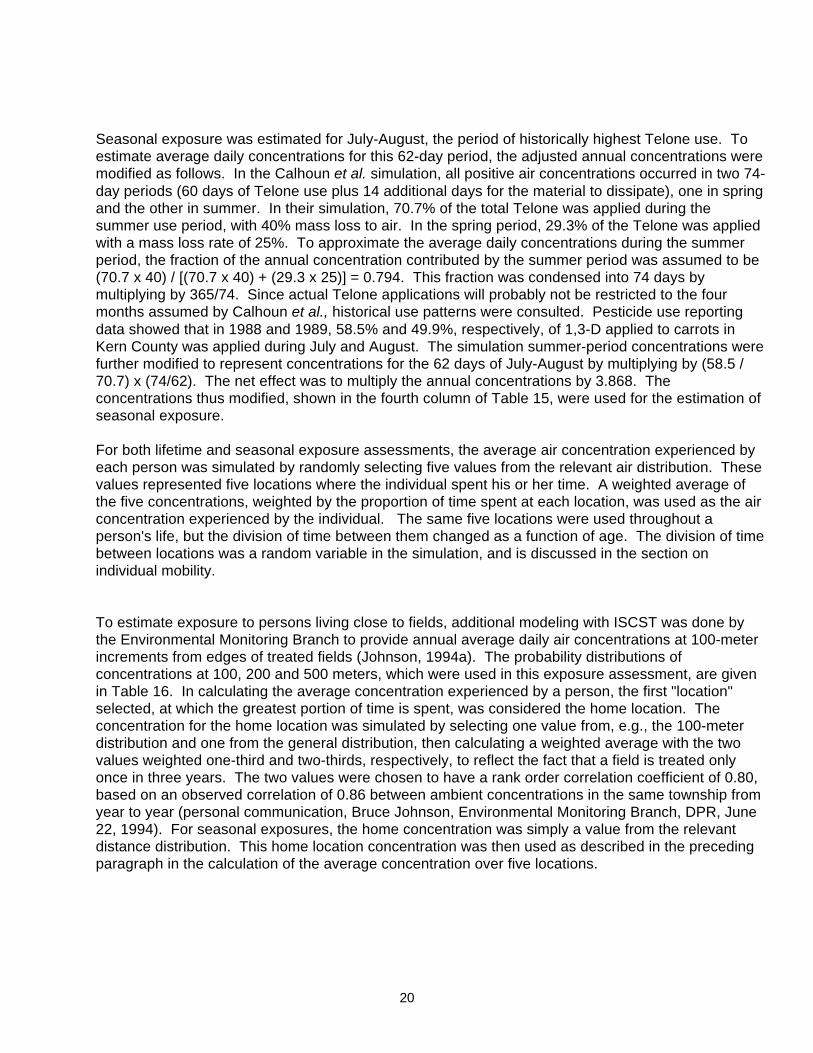

________________________________________________________________________________
________________________________________________________________________________
Individual mobility within the Telone use area
Individuals were assumed to divide their total time between five randomly selected locations within the Telone high-use area The average air concentration to which an individual is exposed was calculated as described above as the mean of the five location concentrations weighted by the proportion of time spent in each location The mean division of time between locations was derived for each age interval from Table 45 in the Arabrsquos Survey of Childrens Activity Patterns (Wiley 1991a) and Table 33 in Activity Patterns of California Residents (Wiley 1991b) Wileys time at home was used as the time spent in the first selected location his time in transit was divided equally between two locations and the remaining time in the day divided between two others The division of time between these last two locations was 7030 for infants stepping down by age interval to a 5050 division for adults Individual time divisions were allowed to vary from the mean by randomly generating them from a multinomial distribution with n chosen to give fairly small variability in the youngest intervals and greater variability in the adolescent and adult intervals The distributions for time division are shown in Table 17
Table 17 Probability distributions of time spent in five locations
Multinomial Age n Average minutes per day spent in location
interval parameter 1 2 3 4 5
0 to 1 100 Male 1157 27 27 160 69 Female 1151 38 38 150 63
1 to 2 100 Male 1157 27 27 160 69 Female 1151 38 38 150 63
2 to 3 90 Male 1134 31 31 170 74 Female 1099 44 44 151 102
3 to 6 90 Male 1134 31 31 170 74 Female 1099 44 44 151 102
6 to 9 80 Male 1044 59 30 170 137 Female 1021 27 26 256 110
9 to 12 80 Male 1020 31 31 250 108 Female 968 47 46 265 114
12 to 15 70 Male 893 61 60 256 170 Female 917 49 49 255 170
15 to 18 70 Male 893 61 60 256 170 Female 917 49 49 255 170
18 to 25 60 Male 782 75 74 255 254 Female 862 60 60 229 229
25 to 70 60 Male 798 60 59 262 261 Female 960 51 51 189 189
22
Breathing rates
An individuals average breathing rate in each age interval was calculated as a weighted average of his rates at each of four activity levels resting light moderate and heavy The rate at each level was weighted by the proportion of time the individual was assumed to spend at that level Breathing rate at each activity level was a random variable The proportion of time at each level was a constant fixed for each age interval
For infants (0-1 year) a triangular distribution of breathing rates was derived from the mean and range reported in the Exposure Factors Handbook Table 3A-2 (USEPA 1990) The mode of the triangular distribution was set equal to the lower limit of the range in order to match the EPA mean For the other age intervals uniform distributions were derived from data in the ARBs Measurement of Breathing Rate and Volume (Adams 1993) In each case the range was chosen to include all the reported rates relevant to an activity level for a specific sex and age group These ranges are given in Table 18 Data were unavailable for children aged 1-3 so the breathing rates for 3-6-year-olds were used The breathing rates of an individual at different activity levels within and across ages were assumed to have the rank order correlations shown in Table 19 (The value of 08 on the diagonal represents the correlation between breathing rates of the same individual at the same activity level at different ages) It was not possible to incorporate correlations between body weight and breathing rates because the software used did not handle them correctly Correlation coefficients of body surface area and breathing rate within age intervals and activity levels reported in Adams (1993) ranged from 006 to 084 with a mean of 040 The correlation of body weight and breathing rate may be similar The effect of omitting this correlation from the simulation was probably to increase the estimated exposures to an unknown degree because if the greater exposures associated with high breathing rates tended to be paired with high body weights the exposure would be mitigated somewhat
The proportion of time assumed to be spent at each activity level is shown in Table 20
Body weight
Body weight distributions were taken directly from Tables 5A-1 through 5A-4 in the Exposure Factors Handbook (USEPA 1990) The histograms reported in these tables were used without smoothing Upper and lower bounds were supplied to produce a mean weight equal to the mean given in the EPA tables An individuals weights in different age intervals were assumed to have the rank order correlations shown in Table 21
Residence time and lifetime
In estimating lifetime exposures lifetime length was fixed at 70 years Exposure was estimated separately for fixed times of residence in the Telone use area of 30 and 70 years Since the exposure assessment is viewed as applying to any areas where Telone may be reintroduced in the proposed way and not just to the specific township in Kern County for which Calhoun et al modeled air concentrations it was not reasonable to define a distribution of residence time in the area Instead the estimated exposures are those expected to result from living the first 30 or 70 years of a 70-year lifetime in any area with Telone use like that described here
23
________________________________________________________________________________
________________________________________________________________________________
Table 18 Breathing rates (Lmin) as ranges of uniform distributions
Age interval Activity level Male Female
0 to 1 All Triangular ( 025 025 209 ) 1 to 2 Resting 5-7
Light 7-11 Moderate 8-15 Heavy 14-22
2 to 3 Resting 5-7 Light 7-11 Moderate 8-15 Heavy 14-22
3 to 6 Resting 5-7 Light 7-11 Moderate 8-15 Heavy 14-22
6 to 9 Resting 5-9 Light 10-17 Moderate 11-23 Heavy 20-45
9 to 12 Resting 5-9 Light 10-17 Moderate 11-23 Heavy 20-45
12 to 15 Resting 6-12 5-10 Light 7-17 7-15 Moderate 17-35 15-27 Heavy 25-72 24-59
15 to 18 Resting 6-12 5-10 Light 7-17 7-15 Moderate 17-35 15-27 Heavy 25-72 24-59
18 to 25 Resting 7-11 5-10 Light 8-18 6-15 Moderate 18-42 15-28 Heavy 48-80 39-62
25 to 70 Resting 7-11 5-10 Light 8-18 6-15 Moderate 18-42 15-28 Heavy 48-80 39-62
24
________________________________________________________________________________
_____________________________________________________________________________
________________________________________________________________________________
________________________________________________________________________________
Table 19 Rank order correlation coefficients between individuals breathing rates at different activity levels within and across age intervals
Resting Light Moderate Heavy Resting 08 05 05 04 Light 08 05 04 Moderate 08 05 Heavy 08
Table 20 Proportion of time at each activity level (constant in exposure simulation)
Age Activity level interval
Resting Light Moderate Heavy
0 to 1 Male 1 0 0 0 Female 1 0 0 0
1 to 2 Male 08 015 004 001 Female 08 015 004 001
2 to 3 Male 075 02 004 001 Female 075 02 004 001
3 to 6 Male 07 02 008 002 Female 07 02 008 002
6 to 9 Male 07 017 010 003 Female 07 02 008 002
9 to 12 Male 06 032 005 003 Female 06 033 005 002
12 to 15 Male 06 032 005 003 Female 06 033 005 002
15 to 18 Male 05 04 006 004 Female 05 042 005 003
18 to 25 Male 04 050 006 004 Female 04 052 005 003
25 to 70 Male 035 057 005 003 Female 035 060 004 001
25
________________________________________________________________________________
_______________________________________________________________________________
Table 21 Rank order correlation coefficients between the weights of an individual at different ages
0 to 1 1 to 2 2 to 3 3 to 6 6 to 9 9 to 12 12 to 15 15 to 18 18 to 25 25 to 70
0 to 1 100 092 082 072 061 061 061 061 061 061 1 to 2 100 092 082 072 061 061 061 061 061 2 to 3 100 092 082 072 061 061 061 061 3 to 6 100 092 082 072 061 061 061 6 to 9 100 092 082 072 061 061 9 to 12 100 092 082 072 061 12 to 15 100 082 082 072 15 to 18 100 082 082 18 to 25 100 082 25 to 70 100
Exposure appraisal
The estimated exposure distributions may be regarded as providing a reasonable idea of the highest exposures that should be expected under the use scenario The distributions should not be interpreted as reflecting the exposures of a population of individuals but as a set of values that are likely to bracket the exposure of an individual in this situation
It should be noted that the large differences between estimated seasonal exposures of children less than one and children from one to three are largely produced by the input breathing rate distributions The breathing rate data for infants under one came from a different source than all the other breathing rate data In addition no data were available for children from one to three so the rates for three- to six-year-old children were used In combination with the small body size of these children this may have overestimated their exposures
An important limitation of this exposure assessment is that it used 13-D concentrations in outdoor air to estimate 24-hourday exposure even though most people spend the greatest part of the day indoors Since the registrant provided no data on indoor concentrations and since no appropriate surrogate data were available to estimate them it was judged that there was no alternative
It is important to remember that these estimates of non-occupational exposure apply only to the use scenario of Calhoun et al which specified Telone applications to only 2000 acres per year in an area which has 8500 acres of carrots alone Any change in the use scenario would require a new exposure assessment
26
REFERENCES
Adams WC 1993 Measurement of breathing rate and volume in routinely performed daily activities Final report contract no A033-205 Research Division California Air Resources Board Sacramento CA
Albrecht WN 1987 Occupational exposure to 13-dichloropropene (Telone II) in Hawaiian pineapple culture Arch Environ Health 42286-290
Brouwer DH Brouwer EJ de Vreede JAF van Welie RTH Vermuelen NPE and van Hemmen JJ 1991 Inhalation exposure to 13-dichloropropene in the Dutch flower-bulb culture Part I Environmental monitoring Arch Environ Contam Toxicol 201-5
Calhoun LL Fontaine DD Stuart BL and Landenberger BD 1994 13shydichloropropene (13-D) An assessment of implied exposure and risk for the proposed commercial reentry of TELONE soil fumigant into California Dow Chemical Co Midland MI
California Department of Food and Agriculture 1988 Report of pesticides sold in California in 1987 Pesticide Use Enforcement Branch California Department of Food and Agriculture Sacramento CA
Climie IJG Hutson DH Morrison BJ and Stoydin G 1979 Glutathione conjugation in the detoxification of (Z)-13-dichloropropene (a component of the nematicide D-D) Xenobiotica 9149-156
Cohen B-S M and Poppendorf W 1989 A method for monitoring dermal exposure to volatile chemicals Am Ind Hyg Assoc J 50 216-223
Cook RE 1983 Fumigators exposure to airborne 13-dichloropropene during fumigation operation of Telone II soil fumigant Driscoll Citrus Service Inc Fort Pierce Florida Unpublished report of the Dow Chemical Chemical Company Industrial Hygiene Laboratory Midland MI January 4 1983
Davies DB and Fraser PA 1988 Evaluation of potential operator fieldworker and bystander exposure to 13-dichloropropene as a result of tobacco field fumigation with Telone II soil fumigant in southwestern Ontario (Canada) May-June 1985 CDFA Reg Doc No 50046-039
Dietz FK Hermann EA and Ramsey JC 1984a The pharmacokinetics of 14C-13shydichloropropene in rats and mice following oral administration The Toxicologist 4 Abstr No 585
Dietz FK Dittenber DA Krik HD and Ramsey JC 1984b Non-protein sulfhydryl content and macromolecular binding in rats and mice following oral administration of 13shydichloropropene The Toxicologist 4 Abstr No 586
Fisher GD and Kilgore WW 1988a Tissue levels of glutathione following acute inhalation of 13-dichloropropene J Toxicol Environ Health 23171-182
Fisher GD and Kilgore WW 1988b Mercapturic acid excretion in rats following 13shydichloropropene inhalation exposure Fund Appl Toxicol 11 303-307
27
Fisher GD and Kilgore WW 1989 Pharmacokinetics of S-[3-chloroprop-2shyenyl]glutathione in rats following acute inhalation exposure to 13-dichloropropene Xenobiotica 19269-278
Fong HR and Maykoski R 1985 Air exposure monitoring of EHAP personnel during a Telone II soil translocation study in Fresno County CDFA Rpt HS 1299
Houtman BA 1992 Managing worker exposure 13-D in California
Houtman BA 1993 An evaluation of 13-dichloropropene worker exposure associated with Telone II soil fumigant loading application and reentry phase I ECL92095 (interim report)
Hutson DH Moss JA and Pickering BA 1971 The excretion and retention of components of the soil fumigant D-D and their metabolites in the rat Food Cosmet Toxicol 9 677-680
Johnson B 1994a Memorandum to John Sanders June 20 1994 on buffer zone calculations for 13-D in Kern County Environmental Monitoring and Pest Management Branch Department of Pesticide Regulation Sacramento CA
Johnson B 1994b Memorandum to Kean Goh May 16 1994 on estimated adjusted air concentration percentiles based on Dow simulation results for T29R26 Environmental Monitoring and Pest Management Branch Department of Pesticide Regulation Sacramento CA
Maddy KT Cusick B Richmond D 1980 Studies concerning the field application of Telone and DD in California in 1979 and the ambient air concentration of these pesticides during and following application by shank injection into soil in fields CDFA Rpt HS 686
Maddy KT Schneider F and Fredrickson S 1982 Monitoring of Telone II during and following experimental application by shank injection to established trees and grape vines in California in 1980-1981 CDFA Rpt 967
NIOSHOSHA Occupational Safety and Health Guidelines for Chemical Hazards 1988 DHHS (NIOSH) Publication No 81-1231981 and supplements Publication Nos 88-118 and 89-104
Osterloh JD Cohen BS Poppendorf W and Pond SM 1984 Urinary excretion of the N-cysteine conjugate of cis-13-dichloropropene by exposed individuals Arch Environ Health 39 271-275
Osterloh JD Wang R OConnell L Jacob III P and Maddy KT 1989a Pilot study for biological monitoring of 13-dichloropropene In Biological Monitoring of Pesticide Exposure RG Wang CA Franklin RC Honeycutt and JC Reinert (eds) Amer Chem Soc Soc Symp Ser No 382 215-230
Osterloh JD Wang R Schneider F and Maddy K 1989b Biological monitoring of dichloropropene Air concentrations urinary metabolite and renal enzyme excretion Arch Environ Health 44 207-213
Owen WJ and DeRouen TA 1980 Estimation of the mean for lognormal data containing zeroes and left-censored values with applications to the measurement of worker exposure to air contaminants Biometrics 36 707 719
28
Palisades Corporation 1992 RISK Risk analysis and simulation add-in for Microsoft Excel Release 11 users guide 31 Decker Rd Newfield NY 14867
Poppendorf W Leffingwell JT and Cohen B 1983 Development of methods and procedures for the assessment of occupational health risks in the application and use of nematicides in California CDFA Rpt HS 1162
Shapiro SS and Wilk MB 1965 An analysis for normality (complete samples) Biometrika 52 591-611
Stott WT and Kastl PE 1986 Inhalation pharmacokinetics of technical grade 13shydichloropropene Toxicol Appl Pharmacol 85 332-341
Stott WT 1992 Letter to J R Sanborn August 11 1992
Tobol HK and Axe FD 1982 Airborne concentrations of 13-dichloropropene during fumigation of established grapevines almond trees and peach trees California December 1980-January 1981 Unpublished report of the Dow Chemical Company Environmental ServicesIndustrial Hygiene Western Division Dow Chemical USA Report No HeRW-AG(8)
US EPA 1990 Exposure factors handbook EPA6008-89043 Office of Health and Environmental Assessment Washington DC
Van Welie RTH van Duyn P Brouwer DH van Hemmen JJ Brouwer EJ and Vermuelen NPE 1991 Inhalation exposure to 13-dichloropropene in the Dutch flower-bulb culture Part II Biological monitoring by measurement of urinary excretion of two mercapturic acid metabolites Arch Environ Contam Toxicol 206-12
Waechter JM Brazak KA McCarty LP LaPack MA and Brownson 1992 13shydichloropropene (Telone II Soil Fumigant) Inhalation pharmacokinetics and metabolism in human volunteers DowElanco (Interim Report) Laboratory Project Study ID M-002993-023
Wagner CP 1987 Industrial source complex (ISC) dispersion model users guide 2nd edition (revised) Vol I US Environmental Protection Agency Report No EPA-4054-88shy002 a
Wiley JA 1991a Study of childrens activity patterns Final report contract no A733-149 Research Division California Air Resources Board Sacramento CA
Wiley JA 1991b Activity patterns of California residents Final report contract no A6-177shy33 Research Division California Air Resources Board Sacramento CA
29
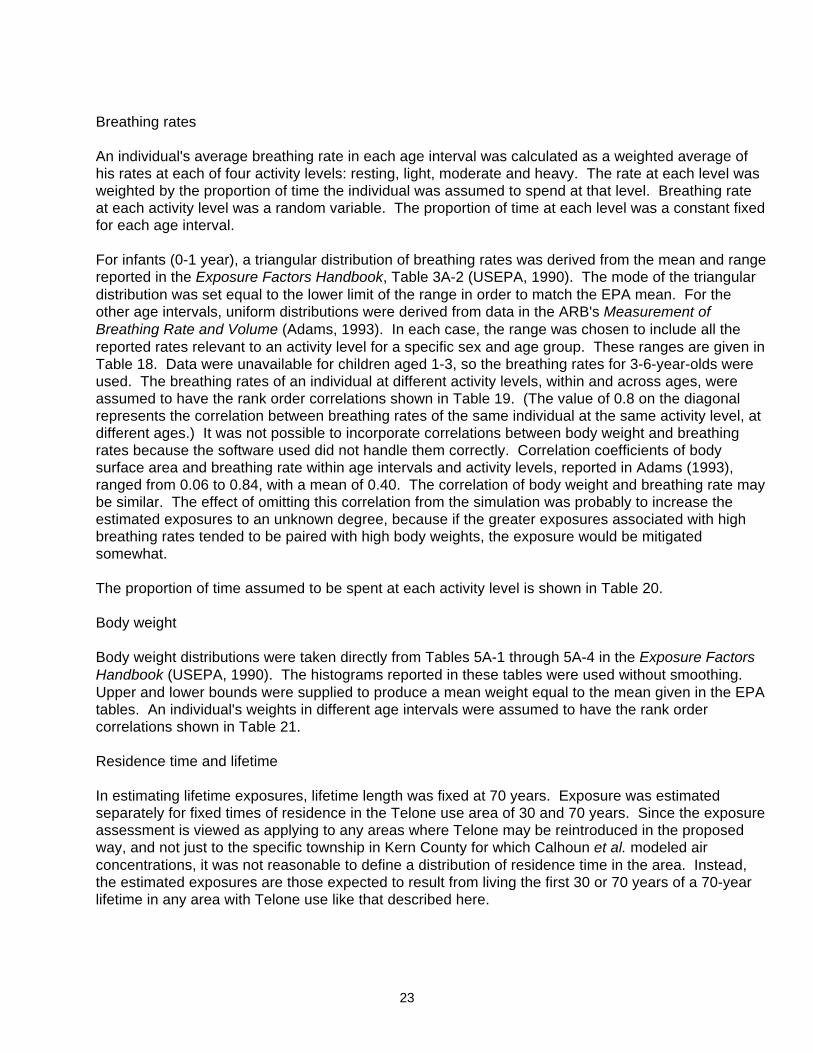

________________________________________________________________________________
________________________________________________________________________________
Table 18 Breathing rates (Lmin) as ranges of uniform distributions
Age interval Activity level Male Female
0 to 1 All Triangular ( 025 025 209 ) 1 to 2 Resting 5-7
Light 7-11 Moderate 8-15 Heavy 14-22
2 to 3 Resting 5-7 Light 7-11 Moderate 8-15 Heavy 14-22
3 to 6 Resting 5-7 Light 7-11 Moderate 8-15 Heavy 14-22
6 to 9 Resting 5-9 Light 10-17 Moderate 11-23 Heavy 20-45
9 to 12 Resting 5-9 Light 10-17 Moderate 11-23 Heavy 20-45
12 to 15 Resting 6-12 5-10 Light 7-17 7-15 Moderate 17-35 15-27 Heavy 25-72 24-59
15 to 18 Resting 6-12 5-10 Light 7-17 7-15 Moderate 17-35 15-27 Heavy 25-72 24-59
18 to 25 Resting 7-11 5-10 Light 8-18 6-15 Moderate 18-42 15-28 Heavy 48-80 39-62
25 to 70 Resting 7-11 5-10 Light 8-18 6-15 Moderate 18-42 15-28 Heavy 48-80 39-62
24
________________________________________________________________________________
_____________________________________________________________________________
________________________________________________________________________________
________________________________________________________________________________
Table 19 Rank order correlation coefficients between individuals breathing rates at different activity levels within and across age intervals
Resting Light Moderate Heavy Resting 08 05 05 04 Light 08 05 04 Moderate 08 05 Heavy 08
Table 20 Proportion of time at each activity level (constant in exposure simulation)
Age Activity level interval
Resting Light Moderate Heavy
0 to 1 Male 1 0 0 0 Female 1 0 0 0
1 to 2 Male 08 015 004 001 Female 08 015 004 001
2 to 3 Male 075 02 004 001 Female 075 02 004 001
3 to 6 Male 07 02 008 002 Female 07 02 008 002
6 to 9 Male 07 017 010 003 Female 07 02 008 002
9 to 12 Male 06 032 005 003 Female 06 033 005 002
12 to 15 Male 06 032 005 003 Female 06 033 005 002
15 to 18 Male 05 04 006 004 Female 05 042 005 003
18 to 25 Male 04 050 006 004 Female 04 052 005 003
25 to 70 Male 035 057 005 003 Female 035 060 004 001
25
________________________________________________________________________________
_______________________________________________________________________________
Table 21 Rank order correlation coefficients between the weights of an individual at different ages
0 to 1 1 to 2 2 to 3 3 to 6 6 to 9 9 to 12 12 to 15 15 to 18 18 to 25 25 to 70
0 to 1 100 092 082 072 061 061 061 061 061 061 1 to 2 100 092 082 072 061 061 061 061 061 2 to 3 100 092 082 072 061 061 061 061 3 to 6 100 092 082 072 061 061 061 6 to 9 100 092 082 072 061 061 9 to 12 100 092 082 072 061 12 to 15 100 082 082 072 15 to 18 100 082 082 18 to 25 100 082 25 to 70 100
Exposure appraisal
The estimated exposure distributions may be regarded as providing a reasonable idea of the highest exposures that should be expected under the use scenario The distributions should not be interpreted as reflecting the exposures of a population of individuals but as a set of values that are likely to bracket the exposure of an individual in this situation
It should be noted that the large differences between estimated seasonal exposures of children less than one and children from one to three are largely produced by the input breathing rate distributions The breathing rate data for infants under one came from a different source than all the other breathing rate data In addition no data were available for children from one to three so the rates for three- to six-year-old children were used In combination with the small body size of these children this may have overestimated their exposures
An important limitation of this exposure assessment is that it used 13-D concentrations in outdoor air to estimate 24-hourday exposure even though most people spend the greatest part of the day indoors Since the registrant provided no data on indoor concentrations and since no appropriate surrogate data were available to estimate them it was judged that there was no alternative
It is important to remember that these estimates of non-occupational exposure apply only to the use scenario of Calhoun et al which specified Telone applications to only 2000 acres per year in an area which has 8500 acres of carrots alone Any change in the use scenario would require a new exposure assessment
26
REFERENCES
Adams WC 1993 Measurement of breathing rate and volume in routinely performed daily activities Final report contract no A033-205 Research Division California Air Resources Board Sacramento CA
Albrecht WN 1987 Occupational exposure to 13-dichloropropene (Telone II) in Hawaiian pineapple culture Arch Environ Health 42286-290
Brouwer DH Brouwer EJ de Vreede JAF van Welie RTH Vermuelen NPE and van Hemmen JJ 1991 Inhalation exposure to 13-dichloropropene in the Dutch flower-bulb culture Part I Environmental monitoring Arch Environ Contam Toxicol 201-5
Calhoun LL Fontaine DD Stuart BL and Landenberger BD 1994 13shydichloropropene (13-D) An assessment of implied exposure and risk for the proposed commercial reentry of TELONE soil fumigant into California Dow Chemical Co Midland MI
California Department of Food and Agriculture 1988 Report of pesticides sold in California in 1987 Pesticide Use Enforcement Branch California Department of Food and Agriculture Sacramento CA
Climie IJG Hutson DH Morrison BJ and Stoydin G 1979 Glutathione conjugation in the detoxification of (Z)-13-dichloropropene (a component of the nematicide D-D) Xenobiotica 9149-156
Cohen B-S M and Poppendorf W 1989 A method for monitoring dermal exposure to volatile chemicals Am Ind Hyg Assoc J 50 216-223
Cook RE 1983 Fumigators exposure to airborne 13-dichloropropene during fumigation operation of Telone II soil fumigant Driscoll Citrus Service Inc Fort Pierce Florida Unpublished report of the Dow Chemical Chemical Company Industrial Hygiene Laboratory Midland MI January 4 1983
Davies DB and Fraser PA 1988 Evaluation of potential operator fieldworker and bystander exposure to 13-dichloropropene as a result of tobacco field fumigation with Telone II soil fumigant in southwestern Ontario (Canada) May-June 1985 CDFA Reg Doc No 50046-039
Dietz FK Hermann EA and Ramsey JC 1984a The pharmacokinetics of 14C-13shydichloropropene in rats and mice following oral administration The Toxicologist 4 Abstr No 585
Dietz FK Dittenber DA Krik HD and Ramsey JC 1984b Non-protein sulfhydryl content and macromolecular binding in rats and mice following oral administration of 13shydichloropropene The Toxicologist 4 Abstr No 586
Fisher GD and Kilgore WW 1988a Tissue levels of glutathione following acute inhalation of 13-dichloropropene J Toxicol Environ Health 23171-182
Fisher GD and Kilgore WW 1988b Mercapturic acid excretion in rats following 13shydichloropropene inhalation exposure Fund Appl Toxicol 11 303-307
27
Fisher GD and Kilgore WW 1989 Pharmacokinetics of S-[3-chloroprop-2shyenyl]glutathione in rats following acute inhalation exposure to 13-dichloropropene Xenobiotica 19269-278
Fong HR and Maykoski R 1985 Air exposure monitoring of EHAP personnel during a Telone II soil translocation study in Fresno County CDFA Rpt HS 1299
Houtman BA 1992 Managing worker exposure 13-D in California
Houtman BA 1993 An evaluation of 13-dichloropropene worker exposure associated with Telone II soil fumigant loading application and reentry phase I ECL92095 (interim report)
Hutson DH Moss JA and Pickering BA 1971 The excretion and retention of components of the soil fumigant D-D and their metabolites in the rat Food Cosmet Toxicol 9 677-680
Johnson B 1994a Memorandum to John Sanders June 20 1994 on buffer zone calculations for 13-D in Kern County Environmental Monitoring and Pest Management Branch Department of Pesticide Regulation Sacramento CA
Johnson B 1994b Memorandum to Kean Goh May 16 1994 on estimated adjusted air concentration percentiles based on Dow simulation results for T29R26 Environmental Monitoring and Pest Management Branch Department of Pesticide Regulation Sacramento CA
Maddy KT Cusick B Richmond D 1980 Studies concerning the field application of Telone and DD in California in 1979 and the ambient air concentration of these pesticides during and following application by shank injection into soil in fields CDFA Rpt HS 686
Maddy KT Schneider F and Fredrickson S 1982 Monitoring of Telone II during and following experimental application by shank injection to established trees and grape vines in California in 1980-1981 CDFA Rpt 967
NIOSHOSHA Occupational Safety and Health Guidelines for Chemical Hazards 1988 DHHS (NIOSH) Publication No 81-1231981 and supplements Publication Nos 88-118 and 89-104
Osterloh JD Cohen BS Poppendorf W and Pond SM 1984 Urinary excretion of the N-cysteine conjugate of cis-13-dichloropropene by exposed individuals Arch Environ Health 39 271-275
Osterloh JD Wang R OConnell L Jacob III P and Maddy KT 1989a Pilot study for biological monitoring of 13-dichloropropene In Biological Monitoring of Pesticide Exposure RG Wang CA Franklin RC Honeycutt and JC Reinert (eds) Amer Chem Soc Soc Symp Ser No 382 215-230
Osterloh JD Wang R Schneider F and Maddy K 1989b Biological monitoring of dichloropropene Air concentrations urinary metabolite and renal enzyme excretion Arch Environ Health 44 207-213
Owen WJ and DeRouen TA 1980 Estimation of the mean for lognormal data containing zeroes and left-censored values with applications to the measurement of worker exposure to air contaminants Biometrics 36 707 719
28
Palisades Corporation 1992 RISK Risk analysis and simulation add-in for Microsoft Excel Release 11 users guide 31 Decker Rd Newfield NY 14867
Poppendorf W Leffingwell JT and Cohen B 1983 Development of methods and procedures for the assessment of occupational health risks in the application and use of nematicides in California CDFA Rpt HS 1162
Shapiro SS and Wilk MB 1965 An analysis for normality (complete samples) Biometrika 52 591-611
Stott WT and Kastl PE 1986 Inhalation pharmacokinetics of technical grade 13shydichloropropene Toxicol Appl Pharmacol 85 332-341
Stott WT 1992 Letter to J R Sanborn August 11 1992
Tobol HK and Axe FD 1982 Airborne concentrations of 13-dichloropropene during fumigation of established grapevines almond trees and peach trees California December 1980-January 1981 Unpublished report of the Dow Chemical Company Environmental ServicesIndustrial Hygiene Western Division Dow Chemical USA Report No HeRW-AG(8)
US EPA 1990 Exposure factors handbook EPA6008-89043 Office of Health and Environmental Assessment Washington DC
Van Welie RTH van Duyn P Brouwer DH van Hemmen JJ Brouwer EJ and Vermuelen NPE 1991 Inhalation exposure to 13-dichloropropene in the Dutch flower-bulb culture Part II Biological monitoring by measurement of urinary excretion of two mercapturic acid metabolites Arch Environ Contam Toxicol 206-12
Waechter JM Brazak KA McCarty LP LaPack MA and Brownson 1992 13shydichloropropene (Telone II Soil Fumigant) Inhalation pharmacokinetics and metabolism in human volunteers DowElanco (Interim Report) Laboratory Project Study ID M-002993-023
Wagner CP 1987 Industrial source complex (ISC) dispersion model users guide 2nd edition (revised) Vol I US Environmental Protection Agency Report No EPA-4054-88shy002 a
Wiley JA 1991a Study of childrens activity patterns Final report contract no A733-149 Research Division California Air Resources Board Sacramento CA
Wiley JA 1991b Activity patterns of California residents Final report contract no A6-177shy33 Research Division California Air Resources Board Sacramento CA
29

________________________________________________________________________________
_____________________________________________________________________________
________________________________________________________________________________
________________________________________________________________________________
Table 19 Rank order correlation coefficients between individuals breathing rates at different activity levels within and across age intervals
Resting Light Moderate Heavy Resting 08 05 05 04 Light 08 05 04 Moderate 08 05 Heavy 08
Table 20 Proportion of time at each activity level (constant in exposure simulation)
Age Activity level interval
Resting Light Moderate Heavy
0 to 1 Male 1 0 0 0 Female 1 0 0 0
1 to 2 Male 08 015 004 001 Female 08 015 004 001
2 to 3 Male 075 02 004 001 Female 075 02 004 001
3 to 6 Male 07 02 008 002 Female 07 02 008 002
6 to 9 Male 07 017 010 003 Female 07 02 008 002
9 to 12 Male 06 032 005 003 Female 06 033 005 002
12 to 15 Male 06 032 005 003 Female 06 033 005 002
15 to 18 Male 05 04 006 004 Female 05 042 005 003
18 to 25 Male 04 050 006 004 Female 04 052 005 003
25 to 70 Male 035 057 005 003 Female 035 060 004 001
25
________________________________________________________________________________
_______________________________________________________________________________
Table 21 Rank order correlation coefficients between the weights of an individual at different ages
0 to 1 1 to 2 2 to 3 3 to 6 6 to 9 9 to 12 12 to 15 15 to 18 18 to 25 25 to 70
0 to 1 100 092 082 072 061 061 061 061 061 061 1 to 2 100 092 082 072 061 061 061 061 061 2 to 3 100 092 082 072 061 061 061 061 3 to 6 100 092 082 072 061 061 061 6 to 9 100 092 082 072 061 061 9 to 12 100 092 082 072 061 12 to 15 100 082 082 072 15 to 18 100 082 082 18 to 25 100 082 25 to 70 100
Exposure appraisal
The estimated exposure distributions may be regarded as providing a reasonable idea of the highest exposures that should be expected under the use scenario The distributions should not be interpreted as reflecting the exposures of a population of individuals but as a set of values that are likely to bracket the exposure of an individual in this situation
It should be noted that the large differences between estimated seasonal exposures of children less than one and children from one to three are largely produced by the input breathing rate distributions The breathing rate data for infants under one came from a different source than all the other breathing rate data In addition no data were available for children from one to three so the rates for three- to six-year-old children were used In combination with the small body size of these children this may have overestimated their exposures
An important limitation of this exposure assessment is that it used 13-D concentrations in outdoor air to estimate 24-hourday exposure even though most people spend the greatest part of the day indoors Since the registrant provided no data on indoor concentrations and since no appropriate surrogate data were available to estimate them it was judged that there was no alternative
It is important to remember that these estimates of non-occupational exposure apply only to the use scenario of Calhoun et al which specified Telone applications to only 2000 acres per year in an area which has 8500 acres of carrots alone Any change in the use scenario would require a new exposure assessment
26
REFERENCES
Adams WC 1993 Measurement of breathing rate and volume in routinely performed daily activities Final report contract no A033-205 Research Division California Air Resources Board Sacramento CA
Albrecht WN 1987 Occupational exposure to 13-dichloropropene (Telone II) in Hawaiian pineapple culture Arch Environ Health 42286-290
Brouwer DH Brouwer EJ de Vreede JAF van Welie RTH Vermuelen NPE and van Hemmen JJ 1991 Inhalation exposure to 13-dichloropropene in the Dutch flower-bulb culture Part I Environmental monitoring Arch Environ Contam Toxicol 201-5
Calhoun LL Fontaine DD Stuart BL and Landenberger BD 1994 13shydichloropropene (13-D) An assessment of implied exposure and risk for the proposed commercial reentry of TELONE soil fumigant into California Dow Chemical Co Midland MI
California Department of Food and Agriculture 1988 Report of pesticides sold in California in 1987 Pesticide Use Enforcement Branch California Department of Food and Agriculture Sacramento CA
Climie IJG Hutson DH Morrison BJ and Stoydin G 1979 Glutathione conjugation in the detoxification of (Z)-13-dichloropropene (a component of the nematicide D-D) Xenobiotica 9149-156
Cohen B-S M and Poppendorf W 1989 A method for monitoring dermal exposure to volatile chemicals Am Ind Hyg Assoc J 50 216-223
Cook RE 1983 Fumigators exposure to airborne 13-dichloropropene during fumigation operation of Telone II soil fumigant Driscoll Citrus Service Inc Fort Pierce Florida Unpublished report of the Dow Chemical Chemical Company Industrial Hygiene Laboratory Midland MI January 4 1983
Davies DB and Fraser PA 1988 Evaluation of potential operator fieldworker and bystander exposure to 13-dichloropropene as a result of tobacco field fumigation with Telone II soil fumigant in southwestern Ontario (Canada) May-June 1985 CDFA Reg Doc No 50046-039
Dietz FK Hermann EA and Ramsey JC 1984a The pharmacokinetics of 14C-13shydichloropropene in rats and mice following oral administration The Toxicologist 4 Abstr No 585
Dietz FK Dittenber DA Krik HD and Ramsey JC 1984b Non-protein sulfhydryl content and macromolecular binding in rats and mice following oral administration of 13shydichloropropene The Toxicologist 4 Abstr No 586
Fisher GD and Kilgore WW 1988a Tissue levels of glutathione following acute inhalation of 13-dichloropropene J Toxicol Environ Health 23171-182
Fisher GD and Kilgore WW 1988b Mercapturic acid excretion in rats following 13shydichloropropene inhalation exposure Fund Appl Toxicol 11 303-307
27
Fisher GD and Kilgore WW 1989 Pharmacokinetics of S-[3-chloroprop-2shyenyl]glutathione in rats following acute inhalation exposure to 13-dichloropropene Xenobiotica 19269-278
Fong HR and Maykoski R 1985 Air exposure monitoring of EHAP personnel during a Telone II soil translocation study in Fresno County CDFA Rpt HS 1299
Houtman BA 1992 Managing worker exposure 13-D in California
Houtman BA 1993 An evaluation of 13-dichloropropene worker exposure associated with Telone II soil fumigant loading application and reentry phase I ECL92095 (interim report)
Hutson DH Moss JA and Pickering BA 1971 The excretion and retention of components of the soil fumigant D-D and their metabolites in the rat Food Cosmet Toxicol 9 677-680
Johnson B 1994a Memorandum to John Sanders June 20 1994 on buffer zone calculations for 13-D in Kern County Environmental Monitoring and Pest Management Branch Department of Pesticide Regulation Sacramento CA
Johnson B 1994b Memorandum to Kean Goh May 16 1994 on estimated adjusted air concentration percentiles based on Dow simulation results for T29R26 Environmental Monitoring and Pest Management Branch Department of Pesticide Regulation Sacramento CA
Maddy KT Cusick B Richmond D 1980 Studies concerning the field application of Telone and DD in California in 1979 and the ambient air concentration of these pesticides during and following application by shank injection into soil in fields CDFA Rpt HS 686
Maddy KT Schneider F and Fredrickson S 1982 Monitoring of Telone II during and following experimental application by shank injection to established trees and grape vines in California in 1980-1981 CDFA Rpt 967
NIOSHOSHA Occupational Safety and Health Guidelines for Chemical Hazards 1988 DHHS (NIOSH) Publication No 81-1231981 and supplements Publication Nos 88-118 and 89-104
Osterloh JD Cohen BS Poppendorf W and Pond SM 1984 Urinary excretion of the N-cysteine conjugate of cis-13-dichloropropene by exposed individuals Arch Environ Health 39 271-275
Osterloh JD Wang R OConnell L Jacob III P and Maddy KT 1989a Pilot study for biological monitoring of 13-dichloropropene In Biological Monitoring of Pesticide Exposure RG Wang CA Franklin RC Honeycutt and JC Reinert (eds) Amer Chem Soc Soc Symp Ser No 382 215-230
Osterloh JD Wang R Schneider F and Maddy K 1989b Biological monitoring of dichloropropene Air concentrations urinary metabolite and renal enzyme excretion Arch Environ Health 44 207-213
Owen WJ and DeRouen TA 1980 Estimation of the mean for lognormal data containing zeroes and left-censored values with applications to the measurement of worker exposure to air contaminants Biometrics 36 707 719
28
Palisades Corporation 1992 RISK Risk analysis and simulation add-in for Microsoft Excel Release 11 users guide 31 Decker Rd Newfield NY 14867
Poppendorf W Leffingwell JT and Cohen B 1983 Development of methods and procedures for the assessment of occupational health risks in the application and use of nematicides in California CDFA Rpt HS 1162
Shapiro SS and Wilk MB 1965 An analysis for normality (complete samples) Biometrika 52 591-611
Stott WT and Kastl PE 1986 Inhalation pharmacokinetics of technical grade 13shydichloropropene Toxicol Appl Pharmacol 85 332-341
Stott WT 1992 Letter to J R Sanborn August 11 1992
Tobol HK and Axe FD 1982 Airborne concentrations of 13-dichloropropene during fumigation of established grapevines almond trees and peach trees California December 1980-January 1981 Unpublished report of the Dow Chemical Company Environmental ServicesIndustrial Hygiene Western Division Dow Chemical USA Report No HeRW-AG(8)
US EPA 1990 Exposure factors handbook EPA6008-89043 Office of Health and Environmental Assessment Washington DC
Van Welie RTH van Duyn P Brouwer DH van Hemmen JJ Brouwer EJ and Vermuelen NPE 1991 Inhalation exposure to 13-dichloropropene in the Dutch flower-bulb culture Part II Biological monitoring by measurement of urinary excretion of two mercapturic acid metabolites Arch Environ Contam Toxicol 206-12
Waechter JM Brazak KA McCarty LP LaPack MA and Brownson 1992 13shydichloropropene (Telone II Soil Fumigant) Inhalation pharmacokinetics and metabolism in human volunteers DowElanco (Interim Report) Laboratory Project Study ID M-002993-023
Wagner CP 1987 Industrial source complex (ISC) dispersion model users guide 2nd edition (revised) Vol I US Environmental Protection Agency Report No EPA-4054-88shy002 a
Wiley JA 1991a Study of childrens activity patterns Final report contract no A733-149 Research Division California Air Resources Board Sacramento CA
Wiley JA 1991b Activity patterns of California residents Final report contract no A6-177shy33 Research Division California Air Resources Board Sacramento CA
29
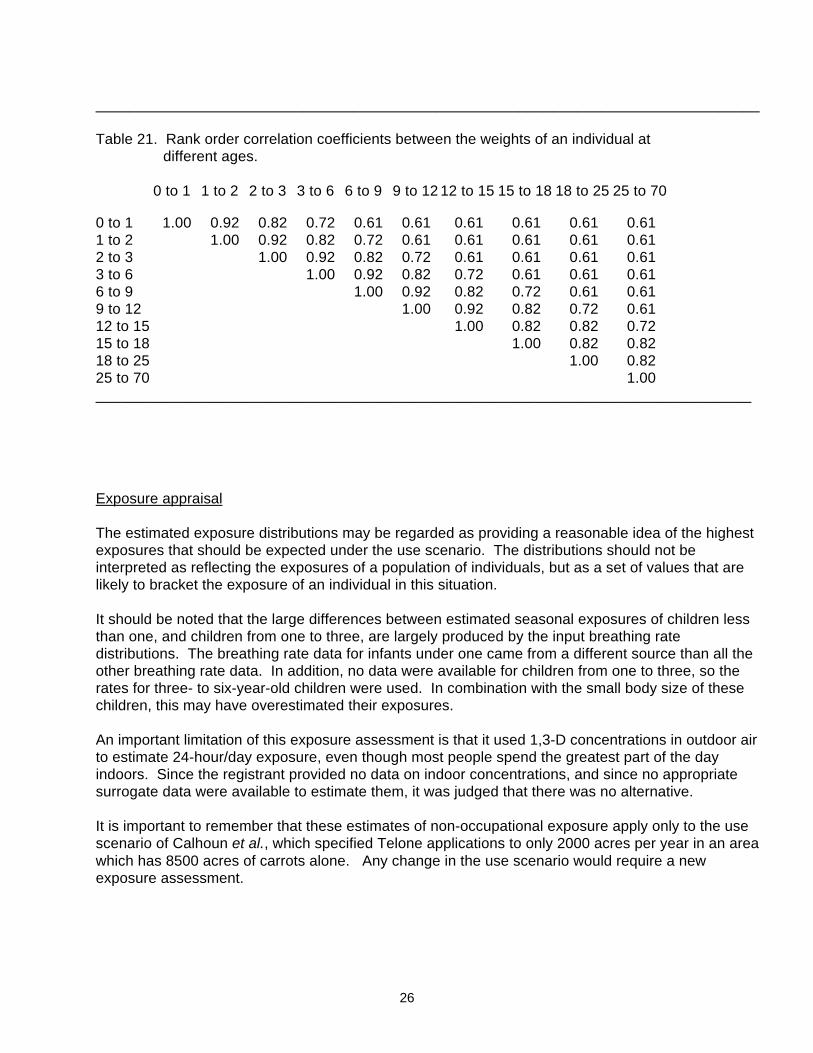
________________________________________________________________________________
_______________________________________________________________________________
Table 21 Rank order correlation coefficients between the weights of an individual at different ages
0 to 1 1 to 2 2 to 3 3 to 6 6 to 9 9 to 12 12 to 15 15 to 18 18 to 25 25 to 70
0 to 1 100 092 082 072 061 061 061 061 061 061 1 to 2 100 092 082 072 061 061 061 061 061 2 to 3 100 092 082 072 061 061 061 061 3 to 6 100 092 082 072 061 061 061 6 to 9 100 092 082 072 061 061 9 to 12 100 092 082 072 061 12 to 15 100 082 082 072 15 to 18 100 082 082 18 to 25 100 082 25 to 70 100
Exposure appraisal
The estimated exposure distributions may be regarded as providing a reasonable idea of the highest exposures that should be expected under the use scenario The distributions should not be interpreted as reflecting the exposures of a population of individuals but as a set of values that are likely to bracket the exposure of an individual in this situation
It should be noted that the large differences between estimated seasonal exposures of children less than one and children from one to three are largely produced by the input breathing rate distributions The breathing rate data for infants under one came from a different source than all the other breathing rate data In addition no data were available for children from one to three so the rates for three- to six-year-old children were used In combination with the small body size of these children this may have overestimated their exposures
An important limitation of this exposure assessment is that it used 13-D concentrations in outdoor air to estimate 24-hourday exposure even though most people spend the greatest part of the day indoors Since the registrant provided no data on indoor concentrations and since no appropriate surrogate data were available to estimate them it was judged that there was no alternative
It is important to remember that these estimates of non-occupational exposure apply only to the use scenario of Calhoun et al which specified Telone applications to only 2000 acres per year in an area which has 8500 acres of carrots alone Any change in the use scenario would require a new exposure assessment
26
REFERENCES
Adams WC 1993 Measurement of breathing rate and volume in routinely performed daily activities Final report contract no A033-205 Research Division California Air Resources Board Sacramento CA
Albrecht WN 1987 Occupational exposure to 13-dichloropropene (Telone II) in Hawaiian pineapple culture Arch Environ Health 42286-290
Brouwer DH Brouwer EJ de Vreede JAF van Welie RTH Vermuelen NPE and van Hemmen JJ 1991 Inhalation exposure to 13-dichloropropene in the Dutch flower-bulb culture Part I Environmental monitoring Arch Environ Contam Toxicol 201-5
Calhoun LL Fontaine DD Stuart BL and Landenberger BD 1994 13shydichloropropene (13-D) An assessment of implied exposure and risk for the proposed commercial reentry of TELONE soil fumigant into California Dow Chemical Co Midland MI
California Department of Food and Agriculture 1988 Report of pesticides sold in California in 1987 Pesticide Use Enforcement Branch California Department of Food and Agriculture Sacramento CA
Climie IJG Hutson DH Morrison BJ and Stoydin G 1979 Glutathione conjugation in the detoxification of (Z)-13-dichloropropene (a component of the nematicide D-D) Xenobiotica 9149-156
Cohen B-S M and Poppendorf W 1989 A method for monitoring dermal exposure to volatile chemicals Am Ind Hyg Assoc J 50 216-223
Cook RE 1983 Fumigators exposure to airborne 13-dichloropropene during fumigation operation of Telone II soil fumigant Driscoll Citrus Service Inc Fort Pierce Florida Unpublished report of the Dow Chemical Chemical Company Industrial Hygiene Laboratory Midland MI January 4 1983
Davies DB and Fraser PA 1988 Evaluation of potential operator fieldworker and bystander exposure to 13-dichloropropene as a result of tobacco field fumigation with Telone II soil fumigant in southwestern Ontario (Canada) May-June 1985 CDFA Reg Doc No 50046-039
Dietz FK Hermann EA and Ramsey JC 1984a The pharmacokinetics of 14C-13shydichloropropene in rats and mice following oral administration The Toxicologist 4 Abstr No 585
Dietz FK Dittenber DA Krik HD and Ramsey JC 1984b Non-protein sulfhydryl content and macromolecular binding in rats and mice following oral administration of 13shydichloropropene The Toxicologist 4 Abstr No 586
Fisher GD and Kilgore WW 1988a Tissue levels of glutathione following acute inhalation of 13-dichloropropene J Toxicol Environ Health 23171-182
Fisher GD and Kilgore WW 1988b Mercapturic acid excretion in rats following 13shydichloropropene inhalation exposure Fund Appl Toxicol 11 303-307
27
Fisher GD and Kilgore WW 1989 Pharmacokinetics of S-[3-chloroprop-2shyenyl]glutathione in rats following acute inhalation exposure to 13-dichloropropene Xenobiotica 19269-278
Fong HR and Maykoski R 1985 Air exposure monitoring of EHAP personnel during a Telone II soil translocation study in Fresno County CDFA Rpt HS 1299
Houtman BA 1992 Managing worker exposure 13-D in California
Houtman BA 1993 An evaluation of 13-dichloropropene worker exposure associated with Telone II soil fumigant loading application and reentry phase I ECL92095 (interim report)
Hutson DH Moss JA and Pickering BA 1971 The excretion and retention of components of the soil fumigant D-D and their metabolites in the rat Food Cosmet Toxicol 9 677-680
Johnson B 1994a Memorandum to John Sanders June 20 1994 on buffer zone calculations for 13-D in Kern County Environmental Monitoring and Pest Management Branch Department of Pesticide Regulation Sacramento CA
Johnson B 1994b Memorandum to Kean Goh May 16 1994 on estimated adjusted air concentration percentiles based on Dow simulation results for T29R26 Environmental Monitoring and Pest Management Branch Department of Pesticide Regulation Sacramento CA
Maddy KT Cusick B Richmond D 1980 Studies concerning the field application of Telone and DD in California in 1979 and the ambient air concentration of these pesticides during and following application by shank injection into soil in fields CDFA Rpt HS 686
Maddy KT Schneider F and Fredrickson S 1982 Monitoring of Telone II during and following experimental application by shank injection to established trees and grape vines in California in 1980-1981 CDFA Rpt 967
NIOSHOSHA Occupational Safety and Health Guidelines for Chemical Hazards 1988 DHHS (NIOSH) Publication No 81-1231981 and supplements Publication Nos 88-118 and 89-104
Osterloh JD Cohen BS Poppendorf W and Pond SM 1984 Urinary excretion of the N-cysteine conjugate of cis-13-dichloropropene by exposed individuals Arch Environ Health 39 271-275
Osterloh JD Wang R OConnell L Jacob III P and Maddy KT 1989a Pilot study for biological monitoring of 13-dichloropropene In Biological Monitoring of Pesticide Exposure RG Wang CA Franklin RC Honeycutt and JC Reinert (eds) Amer Chem Soc Soc Symp Ser No 382 215-230
Osterloh JD Wang R Schneider F and Maddy K 1989b Biological monitoring of dichloropropene Air concentrations urinary metabolite and renal enzyme excretion Arch Environ Health 44 207-213
Owen WJ and DeRouen TA 1980 Estimation of the mean for lognormal data containing zeroes and left-censored values with applications to the measurement of worker exposure to air contaminants Biometrics 36 707 719
28
Palisades Corporation 1992 RISK Risk analysis and simulation add-in for Microsoft Excel Release 11 users guide 31 Decker Rd Newfield NY 14867
Poppendorf W Leffingwell JT and Cohen B 1983 Development of methods and procedures for the assessment of occupational health risks in the application and use of nematicides in California CDFA Rpt HS 1162
Shapiro SS and Wilk MB 1965 An analysis for normality (complete samples) Biometrika 52 591-611
Stott WT and Kastl PE 1986 Inhalation pharmacokinetics of technical grade 13shydichloropropene Toxicol Appl Pharmacol 85 332-341
Stott WT 1992 Letter to J R Sanborn August 11 1992
Tobol HK and Axe FD 1982 Airborne concentrations of 13-dichloropropene during fumigation of established grapevines almond trees and peach trees California December 1980-January 1981 Unpublished report of the Dow Chemical Company Environmental ServicesIndustrial Hygiene Western Division Dow Chemical USA Report No HeRW-AG(8)
US EPA 1990 Exposure factors handbook EPA6008-89043 Office of Health and Environmental Assessment Washington DC
Van Welie RTH van Duyn P Brouwer DH van Hemmen JJ Brouwer EJ and Vermuelen NPE 1991 Inhalation exposure to 13-dichloropropene in the Dutch flower-bulb culture Part II Biological monitoring by measurement of urinary excretion of two mercapturic acid metabolites Arch Environ Contam Toxicol 206-12
Waechter JM Brazak KA McCarty LP LaPack MA and Brownson 1992 13shydichloropropene (Telone II Soil Fumigant) Inhalation pharmacokinetics and metabolism in human volunteers DowElanco (Interim Report) Laboratory Project Study ID M-002993-023
Wagner CP 1987 Industrial source complex (ISC) dispersion model users guide 2nd edition (revised) Vol I US Environmental Protection Agency Report No EPA-4054-88shy002 a
Wiley JA 1991a Study of childrens activity patterns Final report contract no A733-149 Research Division California Air Resources Board Sacramento CA
Wiley JA 1991b Activity patterns of California residents Final report contract no A6-177shy33 Research Division California Air Resources Board Sacramento CA
29


![1,3- Dichloropropene Mitigation and Pilot Program3-D...2020/07/09 · 6 o Considerations: o 1,3-D is extensively used [~12.6m lbs. applied (2011-2015)]. o No commercial-scale alternative](https://img.pdfslide.net/doc/110x75/5f9c8e8f5287016a6f47f462/13-dichloropropene-mitigation-and-pilot-program-3-d-20200709-6-o-considerations.jpg)