Embed Size (px)
Citation preview

Risk Assessment of Loss of Mains Protection – Phase II
23 March 2015
Adam DyśkoUniversity of StrathclydeGlasgow, UKe-mail: [email protected]

Outline
WP1 – Hardware testing based characterisation of DG – PNDC
WP3 – Risk assessment calculation DG connection register analysis (WPD) Establishing dominant connection groups Mixing generation profiles Methodology
WP2 – Simulation based characterisation of DG

PV emulator supplying single phase 3kW Fronius inverter. Desired power output set (power
levels depend on test). PV emulator outputs DC voltage
and current within set limits using MPPT curve.
Fluke power quality analyser measurements at: Inverter output. PCC (convention set as export
to grid).
Single phase load bank used as local load (1kW steps).
Test Setup
WP1 – Hardware testing based characterisation of DG – PNDC

Islanding: 2kW load while inverter output is adjusted to minimise PCC power flow. The public grid is used in this case.
Frequency ramps: ramp down then ramp up between 49.5-48.5Hz at a +/-0.5Hz/s rate. The MG set is used in this case.
HV fault: 60Ω single phase earth fault applied on the upstream 11kV network. The MG set is used in this case.
Tests conducted
5kW PV Emul.
Grid
PCC
ABC
11kV/0.433kV
5kW PV Emul.
MP, Q
meas.M-G setRL load
bank
WP1 – Hardware testing based characterisation of DG – PNDC

At the point of islanding: Measured inverter output around 2.03kW and -20VAr. Measured PCC export around +/-2W and 140VAr.
Inverter trips within 4 cycles.
Islanding results – Inverter Power
Time (s)95 95.2 95.4 95.6 95.8 96 96.2 96.4 96.6 96.8 97
Pow
er (W
, VA
r)
-100
0
100
200
300
400
500
600
700
800
900
1000
1100
1200
1300
1400
1500
1600
1700
1800
1900
2000
2100Inverter Output Power - Islanding
ReactivePower
ActivePower
WP1 – Hardware testing based characterisation of DG – PNDC

Islanding results – Inverter Voltage
Time (s)0.4 0.45 0.5 0.55 0.6 0.65 0.7
Vol
tage
(V)
-400
-300
-200
-100
0
100
200
300
400Inverter Output Voltage - Islanding
Voltage
WP1 – Hardware testing based characterisation of DG – PNDC

Islanding results – Inverter Current
Time (s)0.4 0.45 0.5 0.55 0.6 0.65 0.7
Cur
rent
(A)
-15
-10
-5
0
5
10
15Inverter Output Current - Islanding
Current
WP1 – Hardware testing based characterisation of DG – PNDC

Islanding results – PCC Power
Time (s)121 121.2 121.4 121.6 121.8 122 122.2 122.4 122.6 122.8 123
Pow
er (W
, VA
r)
-10
0
10
20
30
40
50
60
70
80
90
100
110
120
130
140
150
160PCC Power - Islanding
ActivePower
ReactivePower
WP1 – Hardware testing based characterisation of DG – PNDC

Islanding results – PCC Voltage
Time (s)0.3 0.35 0.4 0.45 0.5 0.55 0.6
Vol
tage
(V)
-400
-300
-200
-100
0
100
200
300
400PCC Voltage - Islanding
Voltage
WP1 – Hardware testing based characterisation of DG – PNDC

Islanding results – PCC Current
Time (s)0.3 0.35 0.4 0.45 0.5 0.55 0.6
Cur
rent
(A)
-3
-2
-1
0
1
2
3PCC Current - Islanding
Current
WP1 – Hardware testing based characterisation of DG – PNDC

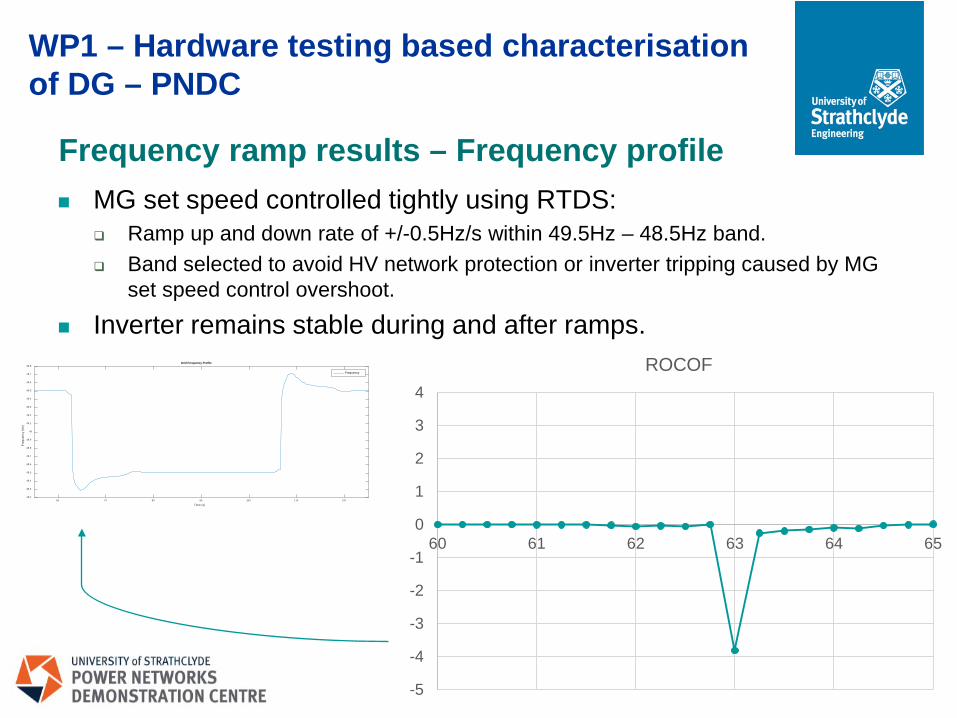
MG set speed controlled tightly using RTDS: Ramp up and down rate of +/-0.5Hz/s within 49.5Hz – 48.5Hz band. Band selected to avoid HV network protection or inverter tripping caused by MG
set speed control overshoot.
Inverter remains stable during and after ramps.
Frequency ramp results – Frequency profile
Time (s)60 70 80 90 100 110 120
Freq
uenc
y (H
z)
48.2
48.3
48.4
48.5
48.6
48.7
48.8
48.9
49
49.1
49.2
49.3
49.4
49.5
49.6
49.7
49.8Grid Frequency Profile
Frequency
WP1 – Hardware testing based characterisation of DG – PNDC
-5
-4
-3
-2
-1
0
1
2
3
4
60 61 62 63 64 65
ROCOF

• Load bank set to 2kW.• Inverter output set to around1.4kW.• Measured inverter output reactive power of around 20VAr.
Frequency ramp results – Inverter Power
Time (s)60 70 80 90 100 110 120
Pow
er (W
, VA
r)
0
100
200
300
400
500
600
700
800
900
1000
1100
1200
1300
1400
1500Inverter Power Output - Frequency Ramp
ActivePower
ReactivePower
WP1 – Hardware testing based characterisation of DG – PNDC

In the process of ordering further inverters for further testing: 5kW SMA SunnyBoy. 5kW ABB (PowerOne). 5kW Kaco. 10kW SMA TriPower (three phase).
Testing will include up to 2 single phase inverters simultaneously. Installation of new inverters and testing planned for second half of
April. Build working group feedback into upcoming testing.
Next steps
WP1 – Hardware testing based characterisation of DG – PNDC

WP3 – Risk assessment calculation
DG register analysis (WPD)

WP3 – Risk assessment calculation
Technology mapping (based on WPD data).
Primary substation Generator type Connected export capacity [kW]
Accepted not yet
connected export
capacity [kW]
Total export capacity [kW]
Abington 33/11kv Photovoltaic 79.38 0 79.38Acreage Lane 33/11kv Hydro 3.56 0 3.56Acreage Lane 33/11kv Landfill Gas Sewage Gas Biogas (not CHP) 11700 0 11700Acreage Lane 33/11kv Other Generation 1200 0 1200Acreage Lane 33/11kv Photovoltaic 503.21 0 503.21
Alford 33/11kv Photovoltaic 260.389 0 260.389Allenton 33/11kv Micro CHP (Domestic) 0.215 0 0.215Allenton 33/11kv Photovoltaic 883.01 0 883.01
Alliance & Leicester 33/11kv Biomass & Energy Crops (not CHP) 1850 0 1850Alliance & Leicester 33/11kv Landfill Gas Sewage Gas Biogas (not CHP) 2590 0 2590Alliance & Leicester 33/11kv Other Generation 1000 0 1000Alliance & Leicester 33/11kv Photovoltaic 225.564 0 225.564
Ambergate 33/11kv Onshore Wind 91 225 316Ambergate 33/11kv Photovoltaic 131.36 0 131.36
Anderson Lane 33/11kv Photovoltaic 597.94 0 597.94Annesley (Kirkby) 11kv S Stn Onshore Wind 11 500 511

WP3 – Risk assessment calculation
Technology mapping (based on WPD data). All types of connections were mapped onto 5 main generating
technologiesBiomass & Energy Crops (not CHP) SMHydro IM
Landfill Gas Sewage Gas Biogas (not CHP) SM
Large CHP (>=50mw) SMMedium CHP (>5MW <50MW) SMMicro CHP (Domestic) SMMini CHP (<1MW) SMOffshore Wind PMSGOnshore Wind DFIGOther Generation SMPhotovoltaic PVSmall CHP (>1MW <5MW) SMWaste Incineration (not CHP) SM

WP3 – Risk assessment calculation
Technologies with cumulative contribution of 10% or less were removed from the mix.
The remaining generation was scaled up to the full capacity installed at the primary substation

WP3 – Risk assessment calculation
Establishing dominant groups.

WP3 – Risk assessment calculation
Establishing dominant groups.
Groups of primary substations with more than 5% of the total population were only considered for risk assessment analysis.
Group Substations PercentageSM 60 5.5PV 544 49.5DFIG 5 0.5IM 0 0.0PMSG 0 0.0SM, PV 283 25.8SM, DFIG 10 0.9SM, IM 1 0.1SM, PMSG 0 0.0PV, DFIG 139 12.7PV, IM 10 0.9PV, PMSG 1 0.1DFIG, IM 0 0.0DFIG, PMSG 0 0.0IM, PMSG 0 0.0SM, PV, DFIG 39 3.6SM, PV, IM 1 0.1SM, PV, PMSG 0 0.0SM, DFIG, IM 0 0.0SM, DFIG, PMSG 0 0.0SM, IM, PMSG 0 0.0PV, DFIG, IM 3 0.3PV. DFIG, PMSG 1 0.1PV, IM, PMSG 0 0.0DFIG, IM, PMSG 0 0.0SM, PV, DFIG, IM 1 0.1SM, PV, DFIG, PMSG 0 0.0SM, PV, IM, PMSG 0 0.0SM, DFIG, IM, PMSG 0 0.0PV, DFIG, IM, PMSG 0 0.0Total 1098 100.0

WP3 – Risk assessment calculation
Distribution of dominant groups.

Generation profile mixingExample: 33% SM (fixed PQ), 33% PV (solar), 33% DFIG (wind)
WP3 – Risk assessment calculation
0 20 40 60 80 100 120 140 160-2
-1
0
1
2
3
4
5
time [h]
P[M
W],Q
[MV
Ar]
PgenQgen

Methodology/assumptions Perform risk assessment based on the number of possible
islands rather (substations) than number of generators.
Represent each predominant island group with an equivalent NDZ. Five predominant have been identified. The largest population is formed by single generation PV for which ROCOF setting change will have no impact.
Profiles for predominant groups are synthesised using the available generation profiles.
In NDZ assessment and generation profile mixing it is assumed all technologies have equal contribution. Cumulative contributions of less than 10% are removed though. (discuss)
Risk assessment will be performed systematically based on group capacity distribution in substations.
WP3 – Risk assessment calculation

Data still desirable
Monitoring data 1s resolution data from example 11kV feeder or
substation in WPD with min load <5MW (pending) 1s or 5s resolution data (P, Q) of small PV unit output
in different seasons (summer, winter, mid-season) (pending – contact from Michael has not responded)
Number of primes in WPD?
WP3 – Risk assessment calculation

WP2 – Simulation based characterisation of DG
Most popular generation mixes have been considered.
Synchronous, PV-Inverter, PMSG-Inverter, DFIG and Asynchronous based generation were modelled.

WP2 – Simulation based characterisation of DG
Individual Connection Stability Studies
Synchronous Generator
Grid
33kV / 11kV
PCCSynchronous
Generator
ABC
E
F
D
Power Island

WP2 – Simulation based characterisation of DG
Active Power Imbalance: 0%Reactive Power Imbalance: 0%
Synchronous generator can be Ssable during LOM event
Assess Non Detection Zone forActive and Reactive Power.
Synchronous Generator

WP2 – Simulation based characterisation of DG
Non Detection Zone Assessment
Setting Option 10.13 Hz/s
, 0 Sec
Setting Option 20.2 Hz/s ,
0 Sec
Setting Option 31.0 Hz/s ,
0.5 Sec
NDZ-P [%] 1.3 1.4 9.44
NDZ-Q [%]
7.9 9.14 43
Synchronous Generator

WP2 – Simulation based characterisation of DG
Photovoltaic Panels
Grid
33kV / 11kV
PCCPV
ABC
E
F
D
Power Island
Individual Connection Stability Studies

WP2 – Simulation based characterisation of DG
Active Power Imbalance: 0%Reactive Power Imbalance: 0%
Photovoltaic Panels are unstableduring LOM event, even forcomplete Active and Reactivepower balance at PCC.
No NDZ

WP2 – Simulation based characterisation of DG
Induction Generator
Grid
33kV / 11kV
PCCInduction Generator
ABC
E
F
D
Power Island
Individual Connection Stability Studies

WP2 – Simulation based characterisation of DG
Active Power Imbalance: 0%Reactive Power Imbalance: 0%
Induction Generator createshigh ROCOF + frequency shiftsaccording to generator slip
No NDZ

WP2 – Simulation based characterisation of DG
DFIG
Individual Connection Stability Studies
Grid
33kV / 11kV
PCCDFIG
ABC
E
F
D
Power Island

WP2 – Simulation based characterisation of DG
Active Power Imbalance: 0%Reactive Power Imbalance: 0%
Model 1
Active Power Imbalance: 0%Reactive Power Imbalance: 0%
Model 2

WP2 – Simulation based characterisation of DG
Grid
33kV / 11kV
PCC DG
ABC
E
F
D
Power Island
SynchronousGenerator
InductionGenerator
Generation Mix Stability Studies
Synchronous Generator & Induction Generator

WP2 – Simulation based characterisation of DG
Total Power : 2 MVASG [%] IG [%]
90 10
Active Power Imbalance: 5%Reactive Power Imbalance: 0%
Active Power Imbalance: 0%Reactive Power Imbalance: 0%
Active Power Imbalance: 0%Reactive Power Imbalance: 5%
Synchronous
Induction

WP2 – Simulation based characterisation of DG
Total Power : 2 MVASG [%] IG [%]
80 20
Active Power Imbalance: 5%Reactive Power Imbalance: 0%
Active Power Imbalance: 0%Reactive Power Imbalance: 0%
Active Power Imbalance: 0%Reactive Power Imbalance: 5%
Synchronous
Induction

WP2 – Simulation based characterisation of DG
Total Power : 2 MVASG [%] IG [%]
70 30
Active Power Imbalance: 5%Reactive Power Imbalance: 0%
Active Power Imbalance: 0%Reactive Power Imbalance: 0%
Active Power Imbalance: 0%Reactive Power Imbalance: 5%
Synchronous
Induction

WP2 – Simulation based characterisation of DG
Grid
33kV / 11kV
PCC DG
ABC
E
F
D
Power Island
SynchronousGenerator
Photovoltaic
Generation Mix Stability Studies
Synchronous Generator & Photovoltaic Panels

Active Power Imbalance: 0%Reactive Power Imbalance: 0%
Active Power Imbalance: 5%Reactive Power Imbalance: 0%
Active Power Imbalance: 0%Reactive Power Imbalance: 5%
Synch…
PV
Total Power : 2 MVA
SG [%] PV [%]
95 5
WP2 – Simulation based characterisation of DG

Active Power Imbalance: 0%Reactive Power Imbalance: 0%
Active Power Imbalance: 5%Reactive Power Imbalance: 0%
Active Power Imbalance: 0%Reactive Power Imbalance: 5%
Synch…
PV
Total Power : 2 MVA
SG [%] PV [%]
90 10
WP2 – Simulation based characterisation of DG

Active Power Imbalance: 0%Reactive Power Imbalance: 0%
Active Power Imbalance: 5%Reactive Power Imbalance: 0%
Active Power Imbalance: 0%Reactive Power Imbalance: 5%
Synch…
PV
Total Power : 2 MVA
SG [%] PV [%]
80 20
WP2 – Simulation based characterisation of DG

Active Power Imbalance: 0%Reactive Power Imbalance: 0%
Active Power Imbalance: 5%Reactive Power Imbalance: 0%
Active Power Imbalance: 0%Reactive Power Imbalance: 5%
Synch…
PVTotal Power : 2 MVA
SG [%] PV [%]
70 30
WP2 – Simulation based characterisation of DG

Active Power Imbalance: 0%Reactive Power Imbalance: 0%
Active Power Imbalance: 5%Reactive Power Imbalance: 0%
Active Power Imbalance: 0%Reactive Power Imbalance: 5%
Synch…PVTotal Power : 2 MVA
SG [%] PV [%]
60 40
WP2 – Simulation based characterisation of DG

Active Power Imbalance: 0%Reactive Power Imbalance: 0%
Active Power Imbalance: 5%Reactive Power Imbalance: 0%
Active Power Imbalance: 0%Reactive Power Imbalance: 5%
Synch…PVTotal Power : 2 MVA
SG [%] PV [%]
50 50
WP2 – Simulation based characterisation of DG

WP2 – Simulation based characterisation of DG
ROCOF setting optionsLOM Option LOM Protection Type Settings
1 ROCOF 0.13 Hz/s (no time delay)
2 ROCOF 0.2 Hz/s (no time delay)
3 (prev. 5) ROCOF 0.5 Hz/s (0.5s delay)
4 (prev. 6) ROCOF 1.0 Hz/s (0.5s delay)
5 (prev. 7) V & f Only G59 Recommended
AmplifierReal Time Simulator
(RTDS)
LOMProtection
(Relay)
ExtractRecords
Configure IED
Control & MonitorSimulation
Tripping Signal
3-PhaseVoltages
3-PhaseVoltages
Due to large amounts of testing and limited access to RTDS facility it is proposed to performNDZ assessment usingan existing ROCOFrelay model (?).


![SECTION 22 – SIDEWALKS AND CURB RAMPS 22.pdf · Ramp or Blended Transition [R304.1].The ramp or blended transition is the portion of a curb ramp that facil itates the change in](https://img.pdfslide.net/doc/110x75/5e237d22000f91286d19383b/section-22-a-sidewalks-and-curb-ramps-22pdf-ramp-or-blended-transition-r3041the.jpg)