Embed Size (px)
Citation preview

J. Mater. Environ. Sci. 7 (2) (2016) 586-595 Muharram et al.
ISSN : 2028-2508
CODEN: JMESCN
586
Risk Assessment of Wastewater, Environmental and Biological Pollution
Reduction in Yemen
Essam Abdullah Muharram*, Cimpeanu Mihai Sorin**, Riyad Ismail***
* Essam Abdullah Muharram University of Sanaa, Yemen.
**Univ. Prof. Cimpeanu Mihai Sorin, University of Agronomical Sciences and veterinary medicine of Bucharest-Faculty of
Reclamation and environmental engineering, Bucharest, Romania
***Dr. Riyad A. M. Ismail, University of Sanaa – Faculty of Engineering, Department of Fundamental engineering
science, Sanaa, Yemen
Received 9 Jan 2016, Revised Jan 2016, Accepted Jan 2016.
E-mail: [email protected]
Abstract
This paper studies the impact that wastewater treatment stations in Yemen have on the environment and society,
the high degree of biological pollution and the lack of concern of the authorities in this regard.It goes on to list
the characteristics of the natural environment in which the wastewater treatment plant located in the capital
Sana'a operates, as well as the areas surrounding that territory.The area’s specific climatic conditions - warm
and dry - make treatment plants for large cities a necessity, and the use of wastewater in agriculture for
irrigation and of sludge as fertilizers. This location was chosen for the study as it is located in a heavily
populated area, in the vicinity of which farming takes place, and because it is an area with significant historical
sites of major tourist interest.The following presents the study materials and methods used. For the conduct of
the study we have worked in collaboration with a group of specialists in the field, with representatives of local
and central authorities and with citizens residing in the area. We have set the perimeter within which samples
were taken for analysis and the area of investigation of the environmental impact by means of questionnaires.
We have used the instruments and equipment found in the treatment stations’ laboratories at Sana'a University -
Faculty of Agriculture and those of the National Laboratory for Water and Environmental Quality
Control.Biological, physical and microbiological analyses were conducted in these laboratories following
specific methodologies, and the results were analyzed and interpreted in accordance with the objectives of the
study. It presents the results of the field analyses, in which questionnaires filled in by the local community were
used, and the results of the physical and biological analyses carried out on different wastewater samples from
different sources. The analyses were performed in the station’s laboratory according to the standards and
specifications in force. The study found that negative results were prevalent. These results largely explain the
phenomenon of environmental pollution and presents conclusions and recommendations for considerable
improvements to the existing situation.
Keywords : Waste Water; Risk; Pollution; biology
1. Introduction :
The environmental impact assessment [1-3] is a study that can be used to improve the decision-making process
and ensure that the development options under consideration are environmentally, socially [4,5] and health
friendly [6], as well as economically sound and sustainable. It is concerned with the identification, evaluation
and estimation of the foreseeable impact types, both beneficial and harmful, of proposed development projects,
but also of alternatives to them. It aims to eliminate or reduce the negative impact, optimize positive impact
through mitigation and improvement measures (Institute of Resource Assessment (1995). The EIA refers to a

J. Mater. Environ. Sci. 7 (2) (2016) 586-595 Muharram et al.
ISSN : 2028-2508
CODEN: JMESCN
587
process, rather than to a specific activity, the environmental impact study itself being only a part of the process
[7].
There is an extensive but incomplete body of scientific knowledge on the impacts of chemicals and wastes on
humans and the environment [8-12]. Chemicals play an important role in human life, economic development
and prosperity, yet they can also have adverse impacts on the environment and human health.
2. Materials and methods used:
The EIA study focuses on the district of Bani al-Harith in Sana'a-Yemen, (Figure 1) that represents the
environment in many conditions. This large area is located above sea level and is surrounded by agricultural
valleys and residential areas in the vicinity of the capital Sana'a, about 25 km away from the city center. The
environment and agricultural crops are varied and include vegetables such as tomatoes, cabbage, onions,
potatoes, etc. and fruit such as grapes, figs, pomegranates and almonds, and berry bushes.
During the summer, the crops are irrigated and greenhouses are used during winter. The average
temperatures in summer fall between 18-30°C, and humidity reaches 55% due to the rainfall during this time of
year. In Yemen, summer is the season with the highest agricultural impact for the region. During winter,
temperatures range between 3 and 12°C and the relative humidity reaches 35%, during this season rain being
rare or non-existent and the use of irrigation facilities is different depending on the season.
Figure 1. Bani al-Harith in Sana'a-Yemen
A number of materials, equipment and equipment were used to analyze the collected samples, as follows:
GPS equipment (Apple) was used to measure distances and to identify points of pollution, but also to gather
samples from within the study area, this being the area with the largest expanse of pollution caused by
sewage.
The different areas exhibiting various levels of environmental contamination were photographed (Figure 2).
Figure 2 Different areas of different pollution levels

J. Mater. Environ. Sci. 7 (2) (2016) 586-595 Muharram et al.
ISSN : 2028-2508
CODEN: JMESCN
588
Questionnaires were distributed to target groups in order to collect information concerning the
contamination and damage caused by the plant to the environment, soil, animals and people (Figure 3).
2.1. Biological analysis:
Determining the presence of bacteria (MPN):
The need for this test arises in order to determine the effectiveness of the sterilization process, as well as
the availability of a standard quantity of water. This test is conducted by placing a number of dilutions in
cascade, especially to highlight the growth of E. coli, such as in the EULER Treptuz (Lauryl TryptoseBroth)
medium or in the pipe environment (environmental analysis of a aMacConkeyMacConkey broth), and the tubes
containing other Durham tubes are incubated upside-down at a temperature of 35-37°C for 24 hours. If any gas
content is detected in the tubes, it is deemed that, in these tubes, the test result is positive. The rest of the Vtturk-
type pipes are left for another 24 hours to obtain confirmation then scanned again. The tubes are delineated,
testing is performed and then compared to standard values. This test is performed at least once a week.
In order to carry out the analyses, the following steps were taken:
- the weight of a standard cleaning and complete drying of the cup;
- filling the flask with water at a moderate temperature until the solution reaches the bottom of the
concavity, and then reaches the neck of the volume flask;
- leaving it to settle for 5 minutes;
- the standard weight of the cup, together with the water content;
- use of an amount of water of different weight;
- Calculation of the data in the table was carried out using the correct size flask.
Calibration has been performed several times, then average size and standard deviation value were calculated.
Subsequently, the sample analysis step was performed by injecting the sample into a ICP device to measure
heavy substances.
At the end, the results were collected from the Laboratory of Standardization and Metrology.
2.2. Statistical Analysis of the Results
The analysis of the data and information contained in this study were conducted using:
- the descriptive analysis of various questionnaires;
- analysis of the data and information obtained through questionnaires using SPSS
- physical analysis of samples; (color-electric conductivity, pH, smell, total dissolved solids (EC x 0.65),
turbidity after filtration, calcium, magnesium, chloride, nitrate, potassium, sodium, total CaCO3 strength).
- biological analysis of samples (COD organic substance, total Coli organisms, Coli organisms from feces,
BOD5, TSS)
The SPSS software and electronic charts were also used.
3. Experimental Results
The data in Tables 1 and 2 and Figure 5 and 6 indicates that the total number of questioned persons is
97. Most of the respondents stated that wells were dug during 1983-1993; over one third stated they were
created during 1993-2003 and only 9 of them were drilled over the past 10 years. Most wells are within 500
meters of the stations’ drying ponds and cease to appear at a distance of 1000-2000 m.
The laboratory data indicate that soil fertility reaches values which are poor, medium and equal in proportions,
and only 9 of the respondents consider the value of the samples to be superior.
The frequencies and percentages for each separate paragraph according to the computerized statistical data
results are as follows:
J. Mater. Environ. Sci. 7 (2) (2016) 586-595 Muharram et al.
ISSN : 2028-2508
CODEN: JMESCN
589
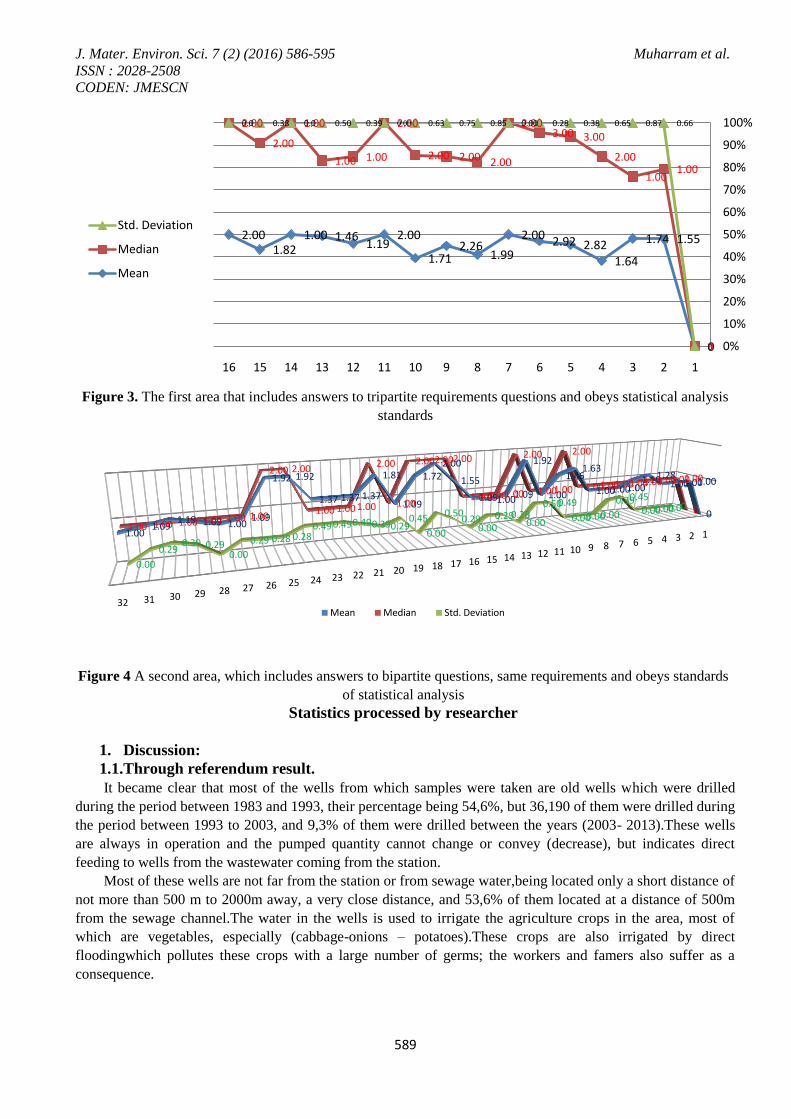
Figure 3. The first area that includes answers to tripartite requirements questions and obeys statistical analysis
standards
Figure 4 A second area, which includes answers to bipartite questions, same requirements and obeys standards
of statistical analysis
Statistics processed by researcher
1. Discussion:
1.1.Through referendum result.
It became clear that most of the wells from which samples were taken are old wells which were drilled
during the period between 1983 and 1993, their percentage being 54,6%, but 36,190 of them were drilled during
the period between 1993 to 2003, and 9,3% of them were drilled between the years (2003- 2013).These wells
are always in operation and the pumped quantity cannot change or convey (decrease), but indicates direct
feeding to wells from the wastewater coming from the station.
Most of these wells are not far from the station or from sewage water,being located only a short distance of
not more than 500 m to 2000m away, a very close distance, and 53,6% of them located at a distance of 500m
from the sewage channel.The water in the wells is used to irrigate the agriculture crops in the area, most of
which are vegetables, especially (cabbage-onions – potatoes).These crops are also irrigated by direct
floodingwhich pollutes these crops with a large number of germs; the workers and famers also suffer as a
consequence.
0
1.551.74
1.642.822.922.00
1.992.26
1.71
2.001.19
1.461.001.82
2.00
0
1.001.00
2.00
3.003.002.00
2.002.002.00
2.00
1.001.00
1.00
2.00
2.00
0
0.660.870.650.380.280.000.850.750.630.000.390.500.00.380.0
0%
10%
20%
30%
40%
50%
60%
70%
80%
90%
100%
12345678910111213141516
Std. Deviation
Median
Mean
1234567891011121314151617181920212223242526272829303132
0
1.001.001.001.281.19
1.001.001.00
1.631.46
1.00
1.92
1.091.001.09
1.55
2.001.72
1.09
1.81
1.371.371.37
1.921.92
1.091.001.091.19
1.091.00
0
1.001.001.001.001.001.001.001.00
2.00
1.001.00
2.00
1.001.001.00
2.002.002.00
1.00
2.00
1.001.001.00
2.002.00
1.001.001.001.001.001.00
00.00.000.00
0.450.39
0.000.000.00
0.490.50
0.000.280.29
0.000.29
0.50
0.00
0.450.290.390.490.490.49
0.280.280.29
0.000.290.39
0.29
0.00
Mean Median Std. Deviation

J. Mater. Environ. Sci. 7 (2) (2016) 586-595 Muharram et al.
ISSN : 2028-2508
CODEN: JMESCN
590
Table 1. The first area that includes answers to tripartite requirements questions and obeys statistical analysis standards
: drilling of wells
Well site
and the
environment
Soil fertility
The
amount
of gas and
odor
emissions
Km variables
over
Tatherkm
What are the
sources of
water used in
agriculture
in your area. After the
establishmen
t of the station
How much
drinking
water is consumed
monthly
per capita?
What
is the value
of
drinking
water
consumptio
n per
capita?
What is the
average
income per
family
in this region?
Do you mix soil
with a
compost mixture
What is
your
education level
Residence
The
number of
hospit
als or medic
al
clinics
What is the economic
impact of
farming in the region
The use of sttion
water for crop irrigation
Averages
N Vali
d
97 97 97 97 97 97 97 97 97 97 97 97 97 97 97
Miss
ing
0 0 0 0 0 0 0 0 0 0 0 0 0 0 0
Mean 1.55 1.74 1.64 2.82 2.92 2.00 1.99 2.26 1.71 2.00 1.19 1.46 1.00 1.82 2.00 1.87
Median 1.00 1.00 2.00 3.00 3.00 2.00 2.00 2.00 2.00 2.00 1.00 1.00 1.00 2.00 2.00 1.80
Std. Deviation 0.66 0.87 0.65 0.38 0.28 0.00 0.85 0.75 0.63 0.00 0.39 0.50 0.00 0.38 0.00 0.42
Percentile
s
25 1.0000 1.0000 1.0000 3.0000 3.0000 2.0000 1.0000 2.000
0
1.0000 2.0000 1.0000 1.000
0
1.000
0
2.0000 2.0000
50 1.0000 1.0000 2.0000 3.0000 3.0000 2.0000 2.0000 2.000
0
2.0000 2.0000 1.0000 1.000
0
1.000
0
2.0000 2.0000
75 2.0000 3.0000 2.0000 3.0000 3.0000 2.0000 3.0000 3.000
0
2.0000 2.0000 1.0000 2.000
0
1.000
0
2.0000 2.0000

J. Mater. Environ. Sci. 7 (2) (2016) 586-595 Muharram et al.
ISSN : 2028-2508
CODEN: JMESCN
591
Table 2. A second area, which includes answers to bipartite questions, same requirements and obeys standards of statistical analysis
Do you
observe
environmental changes from
one year to
another due to
the presence
of the station?
Does Ttatron
waste come
directly
from the
station?
Have
animals or humans
become ill
as a result of
the station’s
activity?
Is population
migration
influenced by
the station?
Are you satisfied
with the
involvement of the local
community in the
issues caused by
the station in the
region?
Are there any
health and safety
procedures for
personnel
working in the
field?
Are there any
plans which
are contingent
on the
station?
Is there
cooperation or
coordination at the station level
between the
population and
station
management?
Is everyday
life based on
agricultural
and animal
production?
the total
Is compost
used in
agriculture?
Are safety
procedures
used for
fertilization
and water?
Are projects
in the area
harmful to
the
environment?
N Valid 97 97 97 97 97 97 97 97 97 97 97 97
Absent 0 0 0 0 0 0 0 0 0 0 0 0
Medium 1.00 1.00 1.00 1.28 1.19 1.00 1.00 1.00 1.63 1.46 1.00 1.92
Median 1.00 1.00 1.00 1.00 1.00 1.00 1.00 1.00 2.00 1.00 1.00 2.00
Standard deviation 0.00 0.00 0.00 0.45 0.39 0.00 0.00 0.00 0.49 0.50 0.00 0.28
Percentage 25 1.0000 1.0000 1.0000 1.0000 1.0000 1.0000 1.0000 1.0000 1.0000 1.0000 1.0000 2.0000
50 1.0000 1.0000 1.0000 1.0000 1.0000 1.0000 1.0000 1.0000 2.0000 1.0000 1.0000 2.0000
75 1.0000 1.0000 1.0000 2.0000 1.0000 1.0000 1.0000 1.0000 2.0000 2.0000 1.0000 2.0000
75 1.0000 1.0000 1.0000 2.0000 1.0000 1.0000 1.0000 1.0000 2.0000 2.0000 1.0000 2.0000
Do you know the
projects’
environ
mental
impact
value?
Is there any
environme
ntal impact of
the station
to be
assessed
in the
area?
Does the
community get involved
in the
environmental
impact
assessment
process?
Do you
consider local
authority involvement
in the
environmental
assessment
process as
appropriate?
Expressing
agreement with regard to
the
involvement of consultants
in the
environmental
assessment
process If
your
Are there
any
hospitals or
medical
centers
in the
area?
Are
Are
there any
emerge
ncy
clinics
in the
area?
Are there
any
epidem
ics in
the
area? n
Is there
an effect
on
touris
m in
the
area?
Are
there
any
effects
of the
station?
Have your living
conditions
improved
after the
establishment
of the station
What issues
have
arisen after
the
establis
hment
of the
station?
Are
there any
other
results
due to
the
station?
What is the
effect of
the
plant on
drinking
water?
What is the
impact
on the soil
fertility
quality
and on
the
plant?
What is
the
station’s impact
on
agricultu
ral
products
?
Do you have
any
stabilit
y issues
in this
region?
Who
were the
sources of
drinking
water before
the
establish
ment of
the
station?
Is
station
water
used
for
crop
irrigati
on?
97 97 97 97 97 97 97 97 97 97 97 97 97 97 97 97 97 97 97
0 0 0 0 0 0 0 0 0 0 0 0 0 0 0 0 0 0 0
1.09 1.00 1.09 1.55 2.00 1.72 1.09 1.81 1.37 1.37 1.37 1.92 1.92 1.09 1.00 1.09 1.19 1.09 1.00 1.30
1.00 1.00 1.00 2.00 2.00 2.00 1.00 2.00 1.00 1.00 1.00 2.00 2.00 1.00 1.00 1.00 1.00 1.00 1.00 1.26
0.29 0.00 0.29 0.50 0.00 0.45 0.29 0.39 0.49 0.49 0.49 0.28 0.28 0.29 0.00 0.29 0.39 0.29 0.00 0.25
1.0000 1.0000 1.0000 1.0000 2.0000 1.0000 1.0000 2.0000 1.0000 1.0000 1.0000 2.0000 2.0000 1.0000 1.0000 1.0000 1.0000 1.0000 1.0000
1.0000 1.0000 1.0000 2.0000 2.0000 2.0000 1.0000 2.0000 1.0000 1.0000 1.0000 2.0000 2.0000 1.0000 1.0000 1.0000 1.0000 1.0000 1.0000
1.0000 1.0000 1.0000 2.0000 2.0000 2.0000 1.0000 2.0000 2.0000 2.0000 2.0000 2.0000 2.0000 1.0000 1.0000 1.0000 1.0000 1.0000 1.0000
J. Mater. Environ. Sci. 7 (2) (2016) 586-595 Muharram et al.
ISSN : 2028-2508
CODEN: JMESCN
592
Furthermore, the survey showed that 72% of the people are suffering from a lack of medical services, lack
of medical centers and clinic units in the area. Also, along the sewage channel there is no monitoring unit
overseeing the pollution process, and there is no emergency clinic, inspite of spreading diseases.The animals in
this area aufferas a result of this station, and the percentage of those who are suffering is 81,6%. It was noticed
that disease and illness spreads more readily among animals and children,this indicating a high percentage of
pollution.
The survey indictates the consumption of drinking water per family is not more than 10-5 m3 monthly, and
most of the people suffer from a lack of clean water.
It indictatedthat 90,7% of people who are suffering from a lack of drinking water are forced to use special
machines to carry/ bring drinking water from distant areas such as BaniHushaish, an area that has deep wells
used only for drinking water, and these wells are private projects and as such citizens that are charged high
prices to buy this water.This hs because the wells used for drinking water in the area concerned in study cannot
be used for drinking water, as they have been polluted at different depths by the station, by station water and
sewage water.
The agriculture crops grown in the area depend on irrigation from drying pools, which yields high production,
and highly commercial produce which are grown in all seasons are an incentive for many farmers to maintain
this occupation,as well as encouraged others to commence or expand it.
100% of the people are mixing fertilizer produced from wastewater into the agricultural soil, and as a result
these crops growing well all the year round, a number of agricultural epidemics have spread, which in turn
forced farmers to fight them by using chemical insecticides. The use of insecticides was random, which
increased pollution, as it was done without using modern tools or protection procedures, and without any
agricultureal guidance.
The treatment station and the external channel net are located in the middle of a crowded living area. The
population distribution on the sides of the foundation and its channel are approximately equal in percentage
between those who live in the Eastern and Southern sides,meaingabout 53.6%, and 46.4% live on the Northern
side.The survey showed that 81.4% of the local community is not contentwith the presence of the station in their
area unless a solution to this pollution is found.They emphasized that there is no procedure in place to protectthe
workers in the fields, whether from the treatment station or from other government agencies, this agreement
being by 100% of respondents.Also, there are no emergency plans or any protection for the local community
from station management,in the event of any emergency which may occur at the station or in case of leaks of
poor quality water causea disasterfor the community.
The study showed that 100% percentage of the population stated that there is no cooperation or arrangement
between station management and the local community to e notified in the event of problems resulting from leaks
of low quality water, norhave they been made aware of any method of treating or controllingwater quantity, or
how to treat or to slow pollution when it occurs.
About 62.90% of the population depends on animals and agricultural production as a source of income and
37.1% is of agriculture in the area provides a subordinate income source.In spite of that, farmers use ardor rising
from the treatment station as a fertilizer on their plantations, but they also added large amounts of the chemical
fertilizer NPK to improve soil fertility and to increase production. 46.4% of the samples in this study use
fertilization methods in addition to using chemical insecticides, in addition towaste water, and they don’t take
into account any occupationalprotection procedures while using this chemical.
While searching for other projects in the same area which address the polluted environment, 91.8% of the
population emphasized that there are no other projects found in the study area. Also the subject of environmentis
absent from many of the individual samples,an evaluation of the effect on the environment not being mentioned,
and 90.7% of the population, accounting for most of the local community, answered that they are not aware of
any projects or information aimed at evaluating the effect on the environment, and they didn't evaluate the
environmental effect since the construction of the station, and 90.7% of the population also emphasized that
there is no community participation in the environment effect evaluation process for any project.

J. Mater. Environ. Sci. 7 (2) (2016) 586-595 Muharram et al.
ISSN : 2028-2508
CODEN: JMESCN
593
Also, 54.6% of the local communityis of the opinion that the local community must be made aware of the
environment effect evaluation process and 100% of the community whishesto press for participating in
consultations regarding the environmental effect evaluation process for projects, as this must also be considered.
1.2. Shapes and images 1. View from the air of the station together with the wastewater line;
2. The station and nearby populated villages;(Figure 7)
3. Water wells (Figure 8.);
4. Agricultural crops (Figure 9);
5. Awareness programme in the case of local communities (Figure 10).
Figure 5 Photographs of local communities and fertile agricultural valleys and swamps adjacent to the channel
Figure 6 Agricultural areas in BaniHarith
Figure 7 Images of awareness program for local communities

J. Mater. Environ. Sci. 7 (2) (2016) 586-595 Muharram et al.
ISSN : 2028-2508
CODEN: JMESCN
594
1.3. Physical and biological test results
Sampling for physical, chemical and biological analyses has been carried out in the period 2013-2014 in
the area of the Sanaa wastewater treatment plant. The analyses were done and collected in (Table 3) and (Table
4) The results of the analyses carried out on the samples taken from the citizens’ shallow wells (1 and 2) The
results of the analyses carried out on samples taken from the state well (3). Results of analyses carried out on
vegetable samples (4)
Table 3 Physical and biological test results
Parameter Unit Value 1 Value 2 Value 3 Value 4 The WHO Guide
Electrical conductivity at 250C µs/cm 1709 2580 455 132.4 -
Total dissolved solids (ECx 0.65) mg/l 1111 1677 296 86 1000
The total CaCO3 hardness mg/l 613 106 46 100 500
Calcium mg/l 168 286 8 28 200
Magnesium mg/l 47 148 6 7
Turbidity after filtration NTU 10 Zero 1 12 5
Chlorine mg/l 171 295 52 13 250
COD organic substance mg/l 20.8x10 38.5x10 3.5x10 24x10 -
Sodium mg/l 131 113 85 11 200
Potassium mg/l 3.99 6.28 1.49 6.66
Nitrate mg/l 289 652 15 24 50
The total number of Coli organisms Col/100ml 857,143 0
Coli organisms from feces Col/100ml 600,000 0
For 2014 the average BOD5 results are presented in Table 4 and Figure 8
Table 4 Average BOD5 results
Parameters Output Input
January BOD5 201 mg/l 1071 mg/l
February BOD5 150 mg/l 1280 mg/l
March BOD5 169 mg/l 1076 mg/l
April BOD5 267 mg/l 1201 mg/l
May BOD5 219 mg/l 1307 mg/l
June BOD5 249 mg/l 1017 mg/l
Source: Laboratory report, 2014
Figure 8 BOD5 average results
0
200
400
600
800
1000
1200
1400
January February March April May June
Output mg/l
Input mg/l

J. Mater. Environ. Sci. 7 (2) (2016) 586-595 Muharram et al.
ISSN : 2028-2508
CODEN: JMESCN
595
Conclusion
In Yemen there are no legislative norms concerning potable water, nor for irrigation water. Standars
used in Yemen are the standards of FAO and WHO.
As part of the study in this thesis, samples taken from six wells show that they are on the uppermost limit in
terms of microbilogical and chemical saturation, but in some cases these values are excedded.
The majority of contaminations are cauzed by the lack of wastewater treatment stations which are
located near wells. The treatment station projects were modified after their execution, because of a dire
necessity to acommodatelarger quanititiesto increase capacityaccordingly to keep pace with the region’s
development.
The absence of regulations and policies permits water found in pools and sweage waste to be used in
agriculture, without any prior treatment.
The impact caused by the presence of the wastewater treatment station upon human health was negative,
causing respiration problems; eye inflammation and skinsensibility ...... etc., and as a result a large number of
people began migrating out of the affected areas.
Acknowledgements-The authors are pleased to acknowledge the University of AgronomicSciences and Veterinary
Medicine of Bucharest (UASVM), also the University of Sana’a for providing the facilities for this research.
References:
1. Chaouki I., Mouhir L., Fekhaoui M., El Abidi A., Bellaouchou A., El Morhit M., J. Mater. Environ. Sci.
6 (2) (2015) 455-464
2. CEEST 1993. Environmental Impacts of Small Scale Mining: A Case Study of Meralani, Kahama,
Nzega, Geita and Musoma , Centre for Energy, Environment, Science and Technology.Report Number
1:07.(1993)
3. Jodeh S., Amarah J., Radi S., Hamed O., Warad I., Salghi R., Chetouani A., Samhan S., Alkowni R.,
Mor. J. Chem. 4 (2016)140-156
4. Bigney.K, Isaacman. L, Jiang. X, Considering Social Impact Assessment in EIA: A Guide for Novice
Reviewers. Unpublished manuscript prepared for the class ENVI500: Environmental Impact
Assessment, Dalhousie University, Halifax, NS. (2003).
5. Fedra K., A computer-based approach to environmental impact assessment. International Institute for
Applied Systems Analysis Reprint RR-91-13. Laxenburg: Austria. 40.(1991)
6. Ben Aakame R., Fekhaoui M., Bellaouchou A., El Abidi A., El Abbassi M., Saoiabi A., J. Mater.
Environ. Sci. 6 (5) (2015) 1228-1233
7. Sadler C.B., Environmental Assessment in a Changing World: Evaluating Practice to Improve
Performance, Final Report.ISBN o-662-24702-7.(1996)
8. Foppen J.W.A., Journal of Hydrology, 263 (2002) 198-216.
9. Freije A.M., Journal of the Association of Arab Universities for Basic and Applied Sciences, 17 (2015)
90-100
10. Omar W.A., Saleh Y. S., Marie M-A.S., Ecotoxicology and Environmental Safety, 110 (2014) 221-231
11. Haines J.A., World Health Organization/International Programme on Chemical Safety (WHO/IPCS),
Reference Module in Biomedical Sciences, from Encyclopedia of Toxicology (Third Edition), (2014)
Pages 984-987.
12. Black C. A. (ed.); Method of Soil Analysis, Part 2, Chemical and Microbiological Properties, American
Society of Agronomy, Inc, Publisher, Madison, Wisconsin USA.(1965)
(2016) ; http://www.jmaterenvironsci.com


![[Dictionary] of Environmental Engineering and Wastewater Treatment](https://img.pdfslide.net/doc/110x75/577c7d551a28abe0549e5f04/dictionary-of-environmental-engineering-and-wastewater-treatment.jpg)