Embed Size (px)
DESCRIPTION
Risk Aversion Elicitation- Reconciling Tractability and Bias Minimization
Citation preview
Risk Aversion Elicitation: Reconciling Tractability andBias Minimization
Mohammed Abdellaoui∗, Ahmed Driouchi†, Olivier L’Haridon‡
June 2009
Abstract
Risk attitude is known to be a key determinant of various economic and financialchoices. Behavioral studies that aim to evaluate the role of risk attitudes in contextsof this type therefore require tools for measuring individual risk tolerance. Recentdevelopments in decision theory provide such tools. However the methods availablecan be time-consuming. As a result, some practitioners might have an incentive toprefer ”quick and dirty” methods to clean but more costly methods. In this article,we focus on a tractable procedure initially proposed by HL to elicit risk attitude. Wegeneralize this method to measure utility and risk aversion as follows. First, we allowmeasurement of probabilistic risk attitude through violations of expected utility dueto probability weighting. Second, we use the outcome scale rather than the probabilityscale in the menu of choices. Third, we compare sure payoffs with lotteries instead ofcomparing non-degenerate lotteries. A within-subject experimental study illustratesthe gains in tractability and bias minimization that can result from such an extension.
∗Greg-HEC and CNRS,†Al Akhawayn University,‡Greg-HEC and University Paris Sorbonne. Corresponding author: HEC-Paris, 1 rue de la Libration,
F-78501 Jouy-en-Josas, France, [email protected] thanks Aurelien Baillon and Enrico Dieccidue for helpful comments
1
1 Introduction
Risk attitude is known to be a key determinant of various economic and financial choices.
Behavioral studies that aim to evaluate the role of risk attitudes in contexts of this type
require tools for measuring risk aversion at both the individual and aggregate levels. The
simplest way to measure risk attitude is to assume that people behave according to Expected
Utility Theory (EUT). In a framework such as this, risk attitude is fully captured by the
curvature of the utility function. Working under EUT, risk aversion, and subsequently con-
cavity of utility, can be measured in the laboratory - or in the field - by presenting a few
simple tasks to the subjects. However, empirical evidence has shown that individuals violate
expected utility in systematic ways and that utility measurements based on expected utility
can lead to inconsistencies (Hersey and Schoemaker, 1985, McCord and de Neufville, 1986,
Bleichrodt, Abellan-Perpinan, Pinto and Mendez-Martinez, 2007, Abdellaoui, Barrios and
Wakker, 2007). One major source of violations of EUT is probability weighting. While EUT
assumes that decision makers process probabilities linearly, people often distort probabilities
non-linearly. This could have direct consequences on the measurement of risk attitudes and
necessitates tools for measuring individual risk tolerance that take probability weighting into
account. Decision theory provides these tools, of course. For example, Wakker and Deneffe
(1996) trade-off method and Abdellaoui, Bleichrodt and Paraschiv (2007) complete method
to elicit utility under prospect theory take probability weighting into consideration. The
latter can also handle loss aversion, another source of violation of EUT. A major drawback
of these methods is that they require that several tasks be performed and in several stages.
If one of the major aims is not to precisely measure risk aversion but to link risk attitudes to
various phenomena or contexts, these methods can be too time-consuming and cognitively
demanding for the purpose at hand. As a result, practitioners might have an incentive to
prefer simple and tractable methods to more general but costly methods.
In this article, we aim to build a bridge between decision theory and experimental economics.
For this purpose, we focus on the tractable procedure initially proposed by HL to elicit risk
attitude. This procedure has been applied in various experimental settings to study game be-
havior (Goeree, Holt and Palfrey, 2003), resolution of uncertainty (Noussair and Wu, 2006),
agricultural economics (Lusk and Coble, 2005), risk attitude outside the lab (Harrison, List
and Towe, 2007) and relationships between risk attitude and discounting (Andersen, Harri-
son, Lau and Rutstrom, 2008). The procedure format is that of a multiple price list where
subjects successively pick the price they prefer. The main advantage of a list is that it is
2
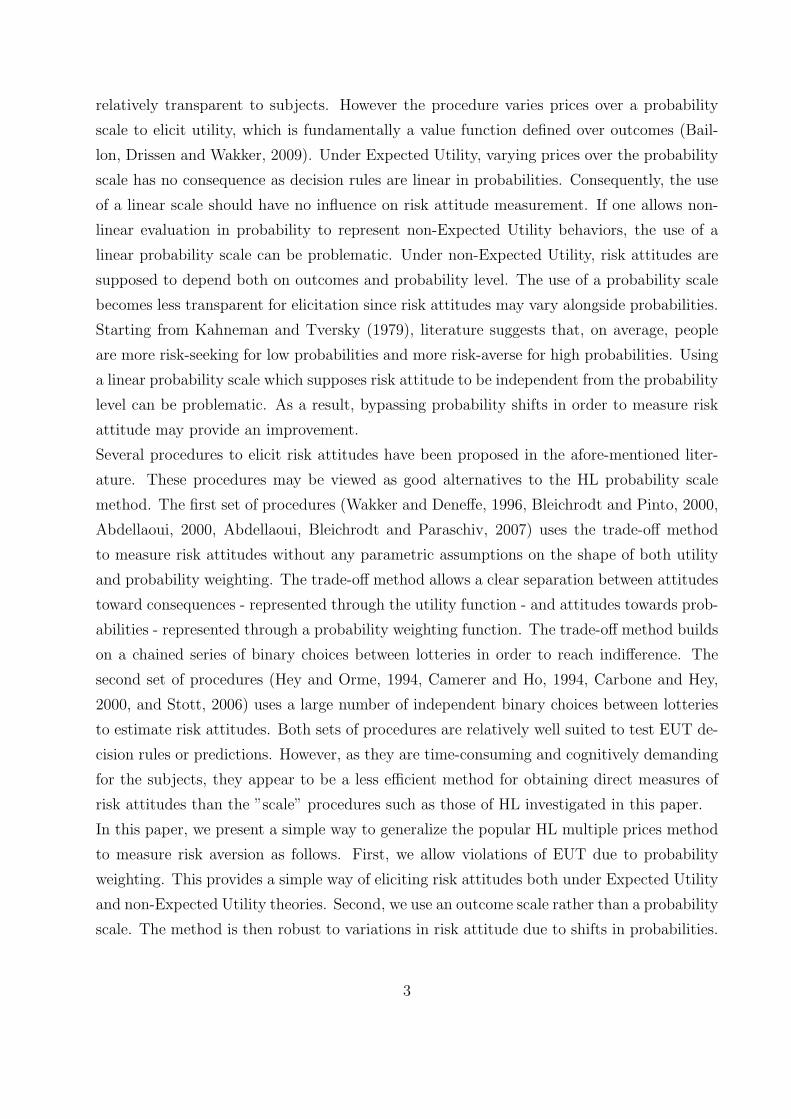
relatively transparent to subjects. However the procedure varies prices over a probability
scale to elicit utility, which is fundamentally a value function defined over outcomes (Bail-
lon, Drissen and Wakker, 2009). Under Expected Utility, varying prices over the probability
scale has no consequence as decision rules are linear in probabilities. Consequently, the use
of a linear scale should have no influence on risk attitude measurement. If one allows non-
linear evaluation in probability to represent non-Expected Utility behaviors, the use of a
linear probability scale can be problematic. Under non-Expected Utility, risk attitudes are
supposed to depend both on outcomes and probability level. The use of a probability scale
becomes less transparent for elicitation since risk attitudes may vary alongside probabilities.
Starting from Kahneman and Tversky (1979), literature suggests that, on average, people
are more risk-seeking for low probabilities and more risk-averse for high probabilities. Using
a linear probability scale which supposes risk attitude to be independent from the probability
level can be problematic. As a result, bypassing probability shifts in order to measure risk
attitude may provide an improvement.
Several procedures to elicit risk attitudes have been proposed in the afore-mentioned liter-
ature. These procedures may be viewed as good alternatives to the HL probability scale
method. The first set of procedures (Wakker and Deneffe, 1996, Bleichrodt and Pinto, 2000,
Abdellaoui, 2000, Abdellaoui, Bleichrodt and Paraschiv, 2007) uses the trade-off method
to measure risk attitudes without any parametric assumptions on the shape of both utility
and probability weighting. The trade-off method allows a clear separation between attitudes
toward consequences - represented through the utility function - and attitudes towards prob-
abilities - represented through a probability weighting function. The trade-off method builds
on a chained series of binary choices between lotteries in order to reach indifference. The
second set of procedures (Hey and Orme, 1994, Camerer and Ho, 1994, Carbone and Hey,
2000, and Stott, 2006) uses a large number of independent binary choices between lotteries
to estimate risk attitudes. Both sets of procedures are relatively well suited to test EUT de-
cision rules or predictions. However, as they are time-consuming and cognitively demanding
for the subjects, they appear to be a less efficient method for obtaining direct measures of
risk attitudes than the ”scale” procedures such as those of HL investigated in this paper.
In this paper, we present a simple way to generalize the popular HL multiple prices method
to measure risk aversion as follows. First, we allow violations of EUT due to probability
weighting. This provides a simple way of eliciting risk attitudes both under Expected Utility
and non-Expected Utility theories. Second, we use an outcome scale rather than a probability
scale. The method is then robust to variations in risk attitude due to shifts in probabilities.
3
Third, we compare sure payoffs with lotteries instead of comparing non-degenerate lotteries,
which is usually more convenient for both the experimentalist and the subject. A within-
subject experimental study illustrates the gains in tractability and bias minimization that
may result from such an extension.
The paper proceeds as follows. In Section 2, we consider two tractable procedures to elicit
risk attitudes under Expected Utility, namely the probability scale method and the outcome
scale method. In Section 3, we integrate these procedures to present a unified tractable
method for measuring risk aversion in a non-Expected Utility context. Section 4 applies
Section 3 in an experimental setting. Section 5 discusses the results and concludes.
2 Elicitating Risk Attitudes under Expected Utility
2.1 Risk Attitudes and Expected Utility
Attitudes toward risk are generally divided into three distinct categories: risk aversion, risk
neutrality and risk seeking. A simple way of distinguishing among these three different
attitudes is to measure the mathematical expected value that one is willing to forego in
order to obtain greater certainty. If this expected value is strictly positive one is willing to
pay a premium to avoid risk, this is the intuitive case of risk aversion. If the expected value
is zero one is not willing to forgo any value to obtain greater certainty: this is the case of
risk neutrality. If the expected value is strictly negative, one must received the absolute
expected value in order to accept greater certainty, this is the case of risk seeking. A more
standard way of defining risk attitude is to consider a choice between an outcome received
with certainty and a risky prospect with the same expected value. People who prefer the
former are risk averse, while people who prefer the latter are risk seeking. Indifference
defines risk neutrality. EUT provides an elegant framework to both represent and measure
risk attitudes
In this article we consider an individual who has to make a choice between risky situations
called lotteries or prospects. Because we use only lotteries with a maximum of two distinct
outcomes in the experimental part of the paper, we restrict the discussion to lotteries of
this type. A lottery writes X = (x, p; y) and results in outcome x with probability p and in
outcome y with probability 1− p. Outcomes are real numbers, and may typically represent
4
money amounts. If x = y the prospect is riskless; if not, it is risky. EUT (von Neumann
and Morgenstern, 1947) provides a clear theoretical foundation on how people make choices
when facing risk. Under a set of behavioral axioms, EUT offers a simple representation of
preferences under risk. EUT states that an individual would choose between lotteries by
comparing the expected utility values and choose the lottery with the highest value. Under
EUT, the value associated with a lottery X = (x, p; y) satisfies:
VEUT (X) = pu(x) + (1− p)u(y) (1)
where u(.) denotes an increasing utility function from R+ to R.
Let us suppose that the decision maker has the choice between two lotteries, lottery X =
(x, p; y) and lottery Y = (z, p; z) with z = px + (1 − p)y the expected value of X. If
VEUT (X) < VEUT (Y ) the decision maker is risk averse and prefers the expected value of the
lottery for sure to the lottery. According to Jensen’s inequality the utility function u(.) is
then a concave function. If VEUT (X) = VEUT (Y ) the decision maker is risk neutral and u(.)
is linear. If VEUT (X) > VEUT (Y ) the decision maker is risk seeking and the utility function
u(.) is convex (still by Jensen’s inequality). As a consequence under EUT a measurement of
the concavity or the convexity of the utility function provides a direct estimate of a decision
maker’s risk attitude. Moreover one can make inter-individual comparisons of risk attitudes
by comparing shapes of the individual utility functions. For instance a decision maker is
said to be more risk averse than another if his/her utility function exhibits more concavity.
In what follows we will focus on two of the traditional ways to elicit risk attitudes embedded
in the utility function, namely probability scale methods and outcome scale methods.
2.2 Probability Scale Methods to Measure Risk Attitudes
The probability scale method investigated in this paper is based on the HL procedure (HL
henceforth). The HL method is based on a very intuitive and simple design. Each subject is
presented with a menu of ten ordered choices between paired lotteries. Each pair of lotteries
consists in a single choice between a safe option (option A) and a risky option (option B)
and takes the following form:
A = (xA, p; yA) vs. B = (xB, p; yB)
5
With xA > yA and xB > yB. Option A is safe in the sense that it offers less variable payoffs
than option B: xA < xB and yA > yB.
The procedure is based on ten different choices ordered by increasing probability p from
0.1 to 1. Accordingly the expected payoff difference between options A and B, p[(xA −yA) − (xB − yB)] + (yA − yB) decreases as probability p increases and becomes negative
for p > (yA − yB)/[(xB − yB) − (xA − yA)]. In terms of risk attitudes, only an extreme
risk seeker would choose option B for any of the probability levels even when probability
p is close to zero. Symmetrically only an extreme risk averse decision maker would keep
on choosing option A for any probability p less than one. Note that no one would choose
dominated option A if the probability p was equal to one. A risk neutral individual would
switch from option A to option B when p > (yA − yB)/[(xB − yB)− (xA − yA)]. In a setting
such as this one, the probability interval at which the decision maker shifts from option A
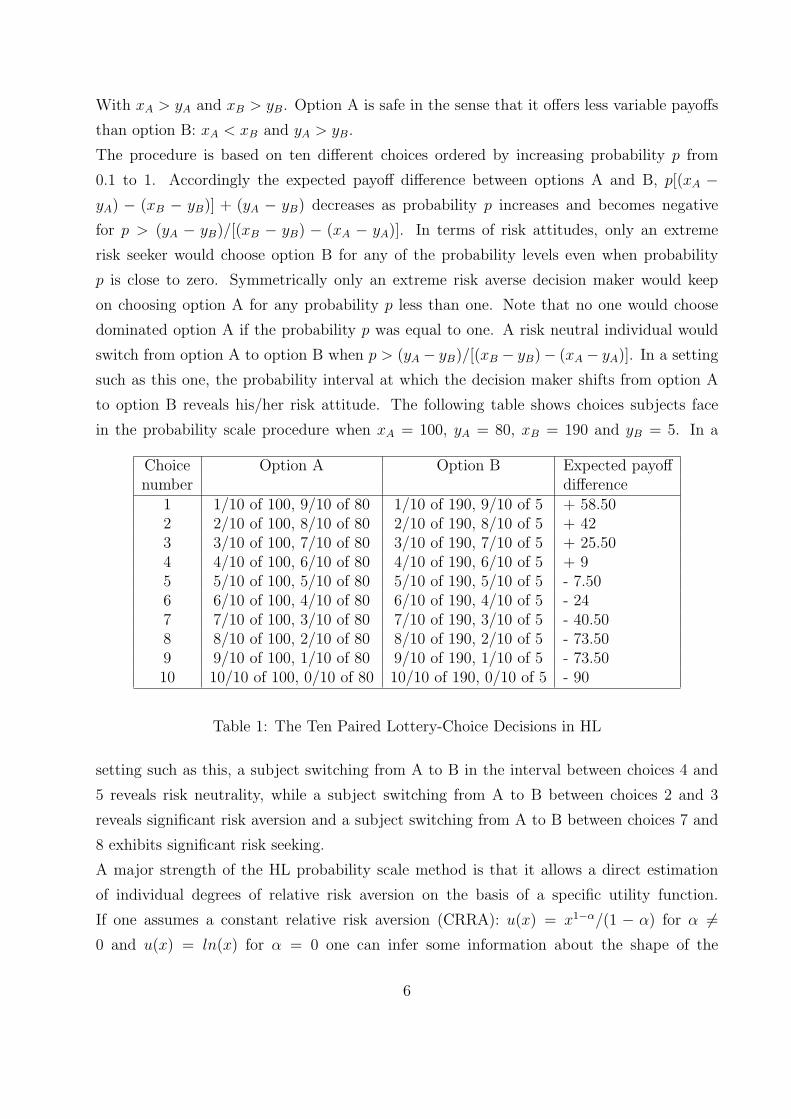
to option B reveals his/her risk attitude. The following table shows choices subjects face
in the probability scale procedure when xA = 100, yA = 80, xB = 190 and yB = 5. In a
Choice Option A Option B Expected payoffnumber difference
1 1/10 of 100, 9/10 of 80 1/10 of 190, 9/10 of 5 + 58.502 2/10 of 100, 8/10 of 80 2/10 of 190, 8/10 of 5 + 423 3/10 of 100, 7/10 of 80 3/10 of 190, 7/10 of 5 + 25.504 4/10 of 100, 6/10 of 80 4/10 of 190, 6/10 of 5 + 95 5/10 of 100, 5/10 of 80 5/10 of 190, 5/10 of 5 - 7.506 6/10 of 100, 4/10 of 80 6/10 of 190, 4/10 of 5 - 247 7/10 of 100, 3/10 of 80 7/10 of 190, 3/10 of 5 - 40.508 8/10 of 100, 2/10 of 80 8/10 of 190, 2/10 of 5 - 73.509 9/10 of 100, 1/10 of 80 9/10 of 190, 1/10 of 5 - 73.5010 10/10 of 100, 0/10 of 80 10/10 of 190, 0/10 of 5 - 90
Table 1: The Ten Paired Lottery-Choice Decisions in HL
setting such as this, a subject switching from A to B in the interval between choices 4 and
5 reveals risk neutrality, while a subject switching from A to B between choices 2 and 3
reveals significant risk aversion and a subject switching from A to B between choices 7 and
8 exhibits significant risk seeking.
A major strength of the HL probability scale method is that it allows a direct estimation
of individual degrees of relative risk aversion on the basis of a specific utility function.
If one assumes a constant relative risk aversion (CRRA): u(x) = x1−α/(1 − α) for α 6=0 and u(x) = ln(x) for α = 0 one can infer some information about the shape of the
6
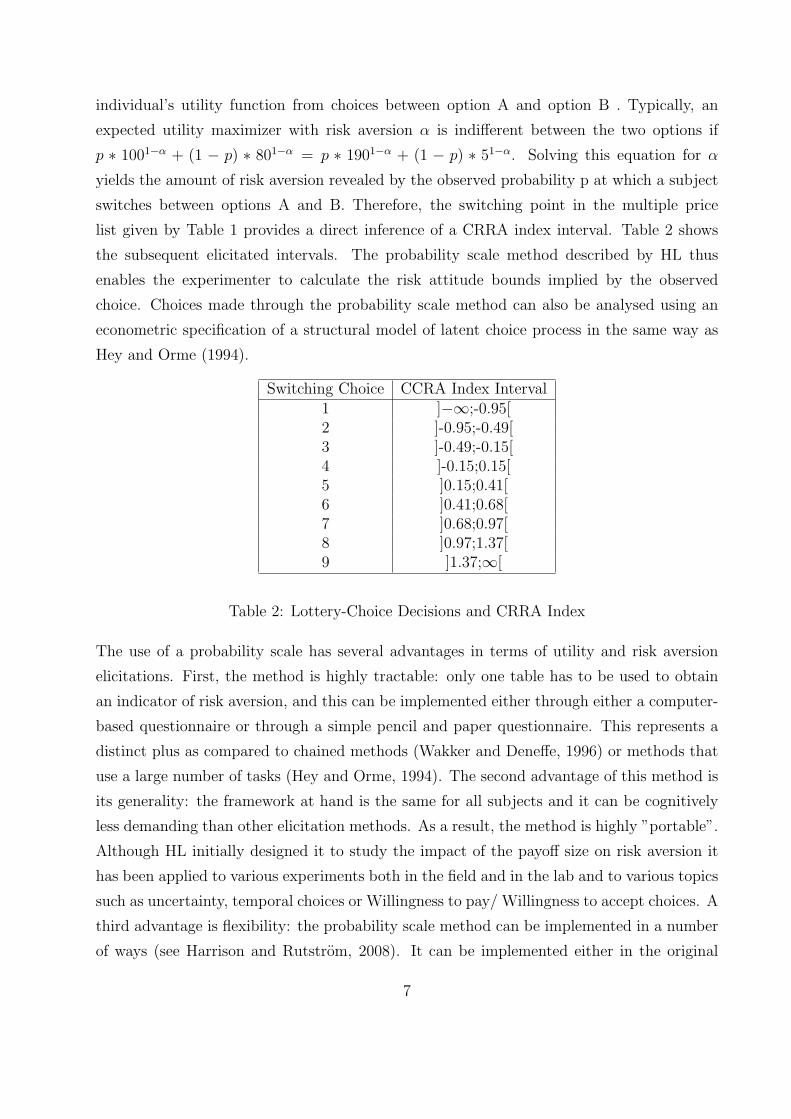
individual’s utility function from choices between option A and option B . Typically, an
expected utility maximizer with risk aversion α is indifferent between the two options if
p ∗ 1001−α + (1 − p) ∗ 801−α = p ∗ 1901−α + (1 − p) ∗ 51−α. Solving this equation for α
yields the amount of risk aversion revealed by the observed probability p at which a subject
switches between options A and B. Therefore, the switching point in the multiple price
list given by Table 1 provides a direct inference of a CRRA index interval. Table 2 shows
the subsequent elicitated intervals. The probability scale method described by HL thus
enables the experimenter to calculate the risk attitude bounds implied by the observed
choice. Choices made through the probability scale method can also be analysed using an
econometric specification of a structural model of latent choice process in the same way as
Hey and Orme (1994).
Switching Choice CCRA Index Interval1 ]−∞;-0.95[2 ]-0.95;-0.49[3 ]-0.49;-0.15[4 ]-0.15;0.15[5 ]0.15;0.41[6 ]0.41;0.68[7 ]0.68;0.97[8 ]0.97;1.37[9 ]1.37;∞[
Table 2: Lottery-Choice Decisions and CRRA Index
The use of a probability scale has several advantages in terms of utility and risk aversion
elicitations. First, the method is highly tractable: only one table has to be used to obtain
an indicator of risk aversion, and this can be implemented either through either a computer-
based questionnaire or through a simple pencil and paper questionnaire. This represents a
distinct plus as compared to chained methods (Wakker and Deneffe, 1996) or methods that
use a large number of tasks (Hey and Orme, 1994). The second advantage of this method is
its generality: the framework at hand is the same for all subjects and it can be cognitively
less demanding than other elicitation methods. As a result, the method is highly ”portable”.
Although HL initially designed it to study the impact of the payoff size on risk aversion it
has been applied to various experiments both in the field and in the lab and to various topics
such as uncertainty, temporal choices or Willingness to pay/ Willingness to accept choices. A
third advantage is flexibility: the probability scale method can be implemented in a number
of ways (see Harrison and Rutstrom, 2008). It can be implemented either in the original
7
multiple price list format as well as in designs in the fashion of Hey and Orme (1994). In the
former subjects are presented with the entire list of prizes (see Andersen, Harrison, Lau and
Rutstrom, 2006 for refinements about multiple price list formats) and choose sequentially
while in the latter subjects are faced with ten independent lotteries. A fourth advantage is
incentive compatibility. A typical real incentive scheme involves the selection of one choice
situation (one row in Table 1) to be played out for real according to the subject’s choices.
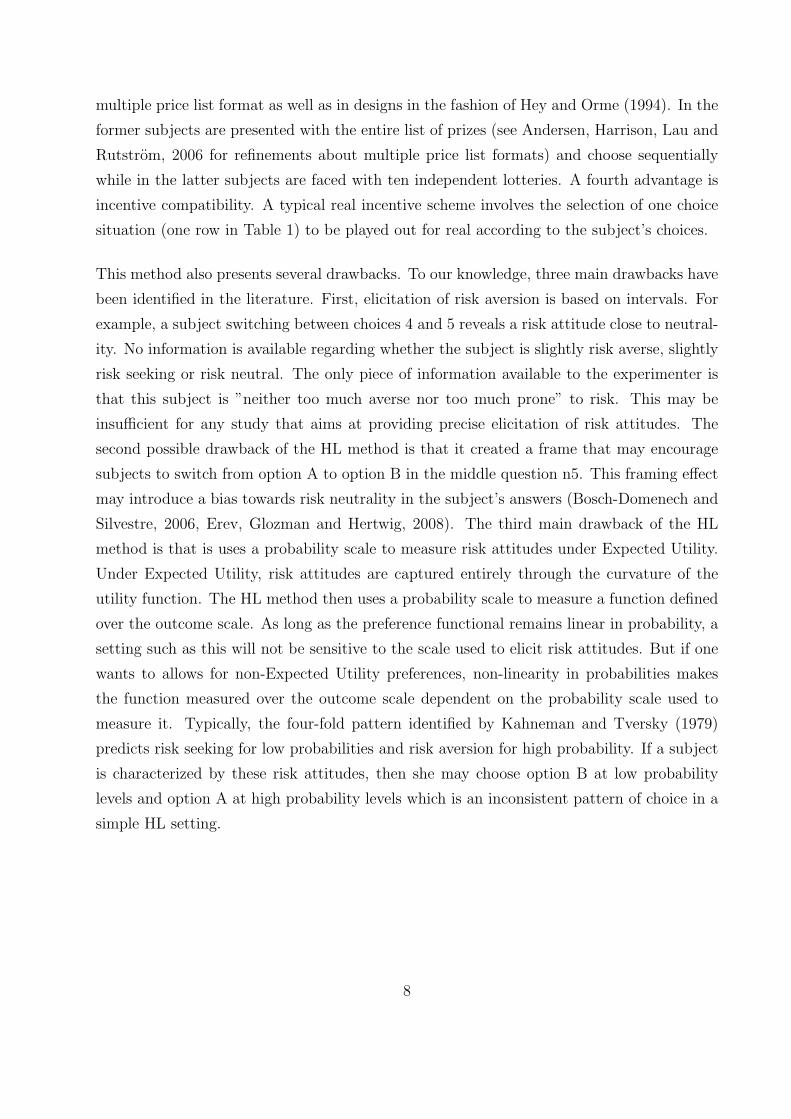
This method also presents several drawbacks. To our knowledge, three main drawbacks have
been identified in the literature. First, elicitation of risk aversion is based on intervals. For
example, a subject switching between choices 4 and 5 reveals a risk attitude close to neutral-
ity. No information is available regarding whether the subject is slightly risk averse, slightly
risk seeking or risk neutral. The only piece of information available to the experimenter is
that this subject is ”neither too much averse nor too much prone” to risk. This may be
insufficient for any study that aims at providing precise elicitation of risk attitudes. The
second possible drawback of the HL method is that it created a frame that may encourage
subjects to switch from option A to option B in the middle question n5. This framing effect
may introduce a bias towards risk neutrality in the subject’s answers (Bosch-Domenech and
Silvestre, 2006, Erev, Glozman and Hertwig, 2008). The third main drawback of the HL
method is that is uses a probability scale to measure risk attitudes under Expected Utility.
Under Expected Utility, risk attitudes are captured entirely through the curvature of the
utility function. The HL method then uses a probability scale to measure a function defined
over the outcome scale. As long as the preference functional remains linear in probability, a
setting such as this will not be sensitive to the scale used to elicit risk attitudes. But if one
wants to allows for non-Expected Utility preferences, non-linearity in probabilities makes
the function measured over the outcome scale dependent on the probability scale used to
measure it. Typically, the four-fold pattern identified by Kahneman and Tversky (1979)
predicts risk seeking for low probabilities and risk aversion for high probability. If a subject
is characterized by these risk attitudes, then she may choose option B at low probability
levels and option A at high probability levels which is an inconsistent pattern of choice in a
simple HL setting.
8
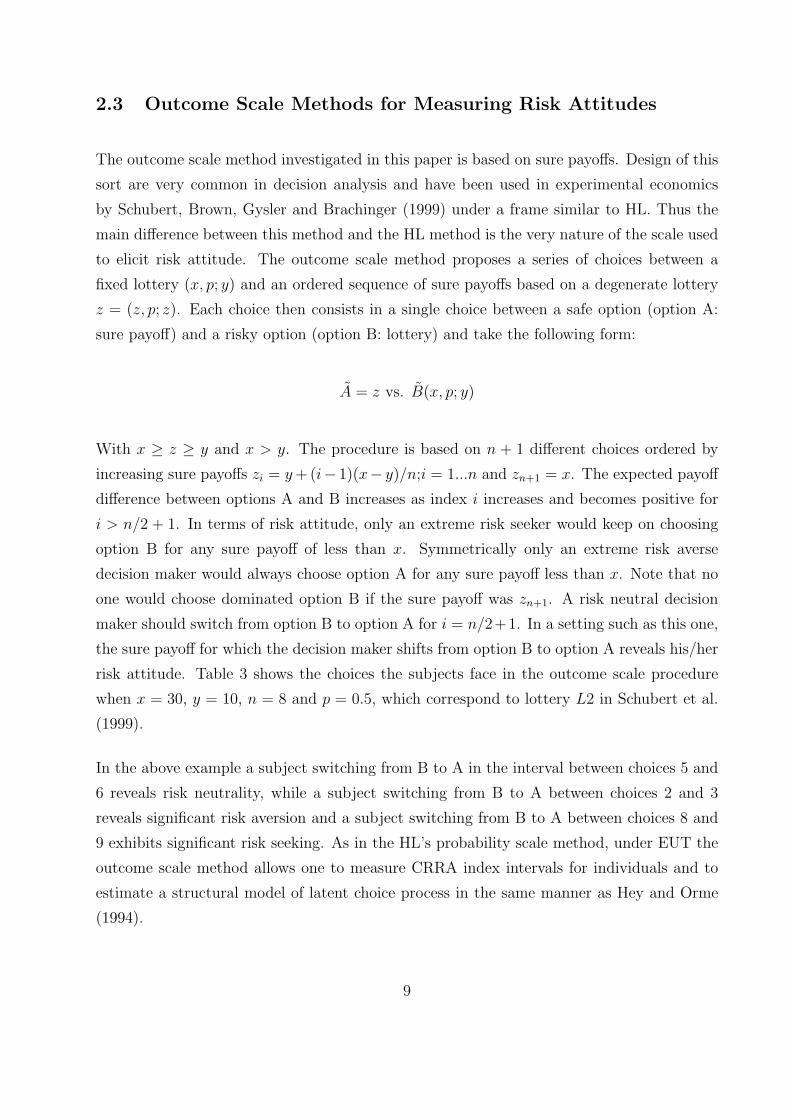
2.3 Outcome Scale Methods for Measuring Risk Attitudes
The outcome scale method investigated in this paper is based on sure payoffs. Design of this
sort are very common in decision analysis and have been used in experimental economics
by Schubert, Brown, Gysler and Brachinger (1999) under a frame similar to HL. Thus the
main difference between this method and the HL method is the very nature of the scale used
to elicit risk attitude. The outcome scale method proposes a series of choices between a
fixed lottery (x, p; y) and an ordered sequence of sure payoffs based on a degenerate lottery
z = (z, p; z). Each choice then consists in a single choice between a safe option (option A:
sure payoff) and a risky option (option B: lottery) and take the following form:
A = z vs. B(x, p; y)
With x ≥ z ≥ y and x > y. The procedure is based on n + 1 different choices ordered by
increasing sure payoffs zi = y+ (i− 1)(x− y)/n;i = 1...n and zn+1 = x. The expected payoff
difference between options A and B increases as index i increases and becomes positive for
i > n/2 + 1. In terms of risk attitude, only an extreme risk seeker would keep on choosing
option B for any sure payoff of less than x. Symmetrically only an extreme risk averse
decision maker would always choose option A for any sure payoff less than x. Note that no
one would choose dominated option B if the sure payoff was zn+1. A risk neutral decision
maker should switch from option B to option A for i = n/2+1. In a setting such as this one,
the sure payoff for which the decision maker shifts from option B to option A reveals his/her
risk attitude. Table 3 shows the choices the subjects face in the outcome scale procedure
when x = 30, y = 10, n = 8 and p = 0.5, which correspond to lottery L2 in Schubert et al.
(1999).
In the above example a subject switching from B to A in the interval between choices 5 and
6 reveals risk neutrality, while a subject switching from B to A between choices 2 and 3
reveals significant risk aversion and a subject switching from B to A between choices 8 and
9 exhibits significant risk seeking. As in the HL’s probability scale method, under EUT the
outcome scale method allows one to measure CRRA index intervals for individuals and to
estimate a structural model of latent choice process in the same manner as Hey and Orme
(1994).
9
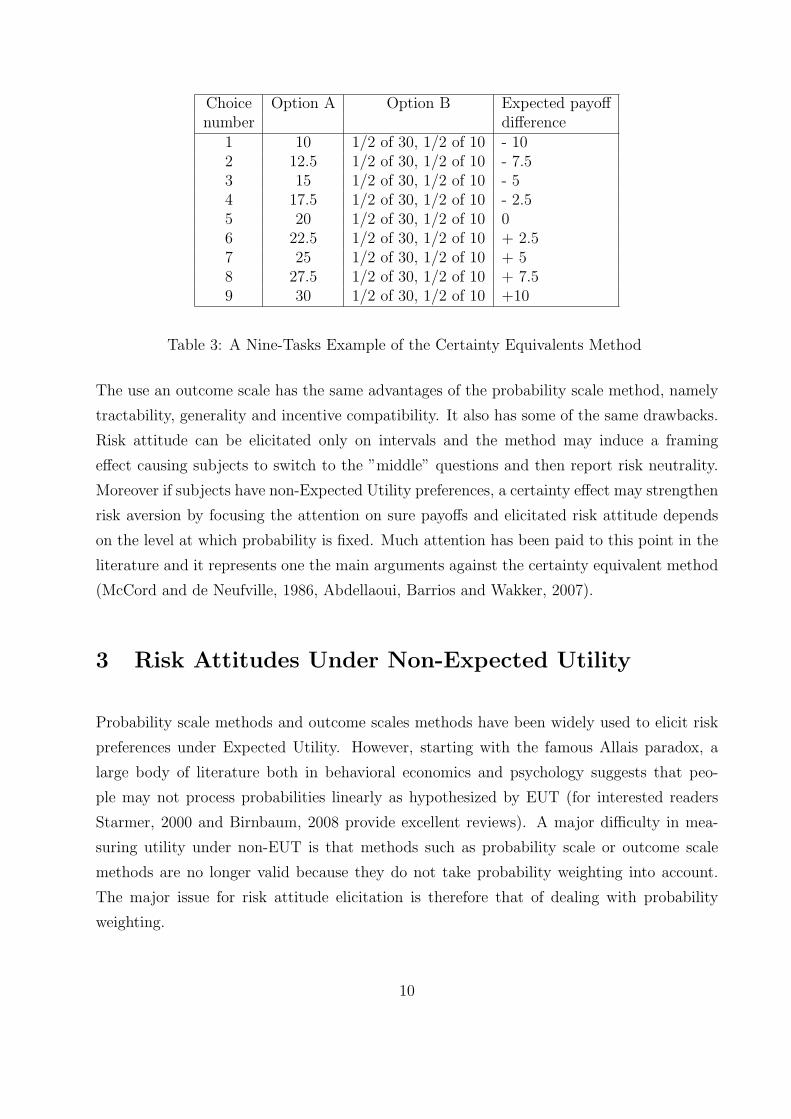
Choice Option A Option B Expected payoffnumber difference
1 10 1/2 of 30, 1/2 of 10 - 102 12.5 1/2 of 30, 1/2 of 10 - 7.53 15 1/2 of 30, 1/2 of 10 - 54 17.5 1/2 of 30, 1/2 of 10 - 2.55 20 1/2 of 30, 1/2 of 10 06 22.5 1/2 of 30, 1/2 of 10 + 2.57 25 1/2 of 30, 1/2 of 10 + 58 27.5 1/2 of 30, 1/2 of 10 + 7.59 30 1/2 of 30, 1/2 of 10 +10
Table 3: A Nine-Tasks Example of the Certainty Equivalents Method
The use an outcome scale has the same advantages of the probability scale method, namely
tractability, generality and incentive compatibility. It also has some of the same drawbacks.
Risk attitude can be elicitated only on intervals and the method may induce a framing
effect causing subjects to switch to the ”middle” questions and then report risk neutrality.
Moreover if subjects have non-Expected Utility preferences, a certainty effect may strengthen
risk aversion by focusing the attention on sure payoffs and elicitated risk attitude depends
on the level at which probability is fixed. Much attention has been paid to this point in the
literature and it represents one the main arguments against the certainty equivalent method
(McCord and de Neufville, 1986, Abdellaoui, Barrios and Wakker, 2007).
3 Risk Attitudes Under Non-Expected Utility
Probability scale methods and outcome scales methods have been widely used to elicit risk
preferences under Expected Utility. However, starting with the famous Allais paradox, a
large body of literature both in behavioral economics and psychology suggests that peo-
ple may not process probabilities linearly as hypothesized by EUT (for interested readers
Starmer, 2000 and Birnbaum, 2008 provide excellent reviews). A major difficulty in mea-
suring utility under non-EUT is that methods such as probability scale or outcome scale
methods are no longer valid because they do not take probability weighting into account.
The major issue for risk attitude elicitation is therefore that of dealing with probability
weighting.
10
3.1 Rank-Dependent Utility Theory Preferences
It is useful to start by considering non-EUT preferences. In the following section, we will
focus on Rank-Dependent Utility Theory (RDUT, Quiggin, 1982) but our basic framework
allows for other (and similar) representations of preferences such as regret theory or prospect
theory in the gain domain. Under Rank-Dependent Utility Theory, preferences satisfy all
EU axioms except for the independence axiom which is replaced by a condition on rank-
dependency, such as the ordinal independence axiom (see Quiggin, 1993 for a review or
Dieccidue and Wakker, 2001). An individual would choose between lotteries by comparing
the rank-dependent utility values and choose the lottery with the highest value. Under
RDUT, the value associated with a lottery X = (x, p; y) with x ≥ y writes:
VRDUT (X) = w(p)u(x) + (1− w(p))u(y) (2)
Where w(.) denotes a weighting function of the probability of obtaining the most favorable
outcome.
One the main advantage of RDUT representation is that risk aversion can be explained either
by the shape of the probability weighing function or by the shape of the utility function. The
former represents probabilistic risk aversion while the latter represents outcome risk aversion.
Probabilistic risk aversion explains the fact that a majority of people can either be both risk
seeking when the gain probability is small and risk averse when the gain probability is large.
Due to distortions in probabilities, people may therefore be optimistic for small probabilities
and pessimistic for large probabilities. Optimism means that the decision maker overweights
his/her chances of winning the high prize. For small probabilities she will be willing to take
more risk than expected utility theory predicts. Conversely for large probabilities, pessimism
lead the decision maker to underweight his/her chances. Consequently, he/she will be willing
to take less risk than Expected Utility predicts. Henceforth, probabilistic risk aversion will
vary in relation to the probability level. Outcome risk aversion is still represented by a
concave utility function and simply states the fact that decision makers are averse to the
variability of outcomes, whatever the source of this variability. One interpretation is to
assume that utility over outcomes to be valid either under certainty or under risk and to
have risk aversion refers to probabilistic risk aversion.
11
3.2 Probability Scale Methods and Non-Expected Utility Prefer-ences
In order to distinguish between probabilistic risk attitudes and outcome attitudes, probabil-
ity scale methods need to specify precisely how individuals process probabilities when they
vary along the scale. A very simple way of distinguishing between behavior at probabil-
ity 10% and behavior at probability 90% is to assume a continuous probability weighting
function that transforms each probability non-linearly into a probability weight. Eliciting
non-EUT preferences supposes that one assumes parametric forms both for utility and for
probability weighting (see Stott, 2006 for a review of parametric forms). Both probability
weighting and utility are now recquired to measure risk attitude. As a consequence the sim-
ple frame provided by HL’s multiple price list may not be sufficient to effectively discriminate
between these two components. A simple solution to a problem of this type is to include
several multiple price lists with different level of outcomes so that choices within-list reveal
information about probabilistic risk attitudes for given outcomes and choices between-list
reveal information about utility for given probabilistic risk attitudes.
3.3 Outcome Scale Methods and Non-Expected Utility Prefer-ences
Tversky and Kahneman (1992) use an outcome scale method, namely certainty equivalents,
to estimate Cumulative Prospect Theory, the rank-dependent version of Prospect Theory. In
order to evaluate probabilistic risk attitudes and attitudes toward outcomes, they postulate
a parametric form both for utility and probability weighting. Therefore, the assumptions
needed to elicitated risk attitudes under non-EUT preferences are for both the outcome scale
method and the probability scale method. However, as shown by Abdellaoui, Bleichrodt
and L’Haridon (2008), outcome scale methods using certainty equivalents may be elicitated
without any assumption about the shape of a probability weighting function. By selecting a
probability p that remains fixed in the elicitation process, equation (2) satisfies:
VRDUT (X) = δ (u(x)− u(y)) + u(y) (3)
where δ = w(p) denotes the decision weight attached to probability p. δ being held constant
in the elicitation, it can therefore be considered and estimated as a simple parameter without
any additional assumption on probability transformation. Probabilistic risk aversion is then
12
measured for probability p only 1. The method is semi-parametric because a parametric form
must be postulated for utility, as it is under EUT. As a result, an outcome scale method
of this type may appear simpler than a probability scale method for non-EUT preferences.
However, outcome scale methods suffer the same drawback as probability scale methods
under non-EUT preferences: the use of a single list of prizes generates a perfect colinearity
between the δ estimate and the utility function parameter estimate. It is obvious than in
a case such as this, estimation is meaningless. As before, a simple solution is to include
several multiple price lists with different levels of outcomes. Choices between-list then reveal
information about utility while probabilistic risk attitude associated with probability p is held
constant. The use of an outcome scale rather than a probability scale avoids the necessity of
having to consider any additional parametric assumption about probability weighting. All
things being equal, a shift from a probability scale to an outcome scale can be viewed as
a simple way of generalizing the HL’s method to non-EUT preferences without having to
include any additional parametric assumptions.
4 Experiment
4.1 Subjects and Procedure
In order to empirically test the outcome scale method as a general HL’s method to measure
risk aversion we applied it in a laboratory experiment. We recruited 39 students (18 women)
in management at Al Akhawayn University in Morocco. The average age of the subjects
was 21.5 years with a standard deviation of 2.4. In order to analyse both probability scale
and outcome scale methods under EUT and non-EUT preferences, the two methods were
presented to the subjects in a within-subject procedure. A within-subject design has two
main advantages over a between-subject design: it offers a considerable gain in statistical
power and it allows a direct comparison of the two methods. It also gives an important
economy in the use of subjects. The experiment was run on a computer using special
software built by the authors for the purpose of the experiment. To avoid any framing effect
subjects faced ordered but no concomittants choices. For the original HL probability scale
method, the software applied a multiple price list logic to order the different tasks. Choices
1Once utility has been elicitated, semi-parametric elicitations of probabilistic risk attitudes for variousprobability levels can be easily obtained by varying p over the probability scale (Abdellaoui, L’Haridon andParaschiv, 2009).
13
were displayed independently in the manner of Hey and Orme (1994). We chosed to use
HL’s (2002) results on 20 x real payoffs as a basis for comparison. The high payoff in this
case was $77. Taking into account the exchange rate between the dollar and the dirham at
the time of the experiment and the purchasing power parity provided by the University of
Pennsylvannia, dh225 represented a purchasing power of $75 in Morocco. To this respect
our probability scale method implementation is a replication of HL’s original experiment.
For the outcome scale method the software started with the expected utility of the lottery
and bracketted choice by bissection. In order to estimate the probability scale method
under non-Expected Utility Theories, we included 4 additional and different settings with
variable outcomes. For the probability scale method, in addition to lotteries from Table 1 we
included the following pairs of lotteries (A vs B): (110, p; 75) vs. (200, p; 25), (100, p; 85) vs.
(200, p; , 100), (125, p; 50) vs. (225, p; 2) and (80, p; 30) vs. (200, p; 2). For the outcome scale
method in addition to lottery B = (225, 0.25; 0) used to elicit preferences under EUT, we
added lotteries B = (225, 0.25, 50), (225, 0.25; 100), (150, 0.25; 100), (225, 0.25; 150) to elicit
preferences under Rank-Dependent Utility Theories. For each lottery B, sure payoffs in
option A ranged between the minimum and the maximum payoff of lottery B.
Responses were collected in personal interview sessions. The responses were entered into
the computer by the interviewer, so that subjects could focus on the tasks. Subjects were
told that there were no right or wrong answers and were allowed to take a break at any
time during the session. To avoid any learning effect the experiment started with several
practice questions. Each experiment lasted on average 30 minutes, including 10 minutes for
explanations and practice. To increase motivation we introduced real incentives. At the end
of the experiment, for each subject, one choice was randomly selected to be played out for
real. Subjects were aware at the beginning of the experiment that one of their choice would
be selected for real.
4.2 Estimation
In order to estimate a structural model of choice it is necessary to specify both a deter-
ministic representation of preferences and a stochastic choice process. The former is given
by the underlying theory of choice, which can be EUT or RDUT. The latter represents the
way errors, or noise, may affect revealed choices. According to equation (1), under EUT a
parametric form for utility function u(.) has to be specified. This is the only assumption
required in order to obtain a deterministic representation of preferences under EUT. In what
14
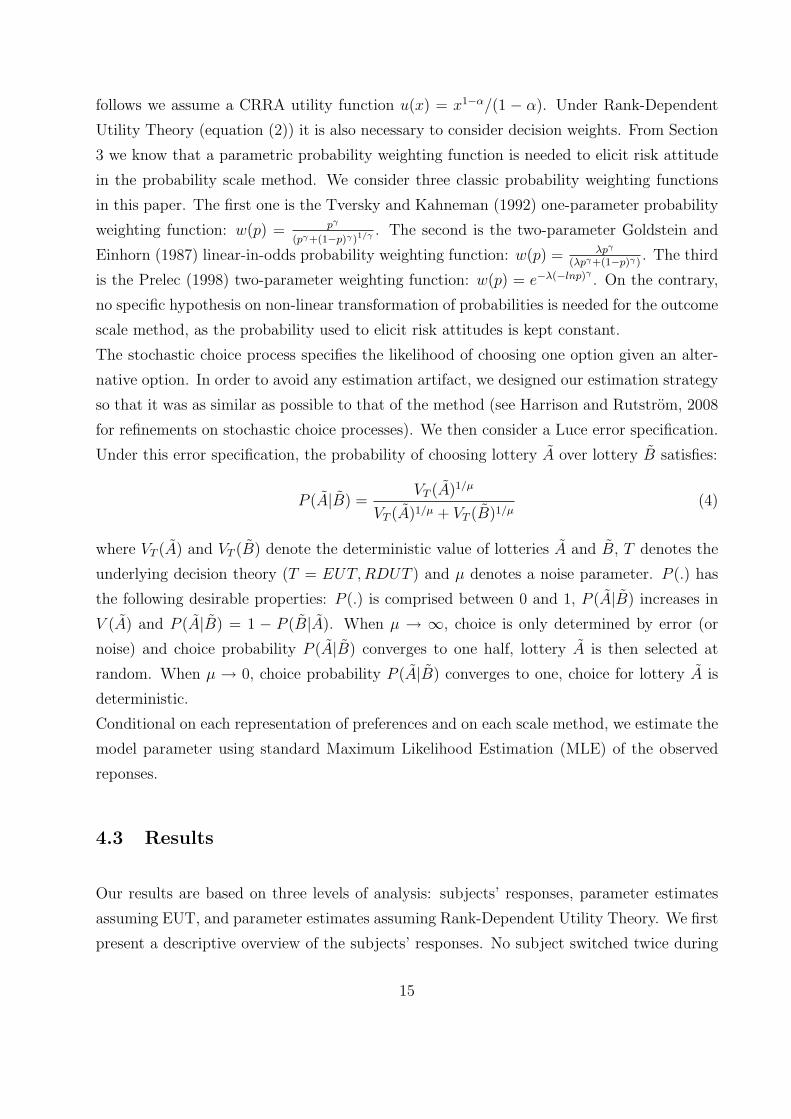
follows we assume a CRRA utility function u(x) = x1−α/(1 − α). Under Rank-Dependent
Utility Theory (equation (2)) it is also necessary to consider decision weights. From Section
3 we know that a parametric probability weighting function is needed to elicit risk attitude
in the probability scale method. We consider three classic probability weighting functions
in this paper. The first one is the Tversky and Kahneman (1992) one-parameter probability
weighting function: w(p) = pγ
(pγ+(1−p)γ)1/γ. The second is the two-parameter Goldstein and
Einhorn (1987) linear-in-odds probability weighting function: w(p) = λpγ
(λpγ+(1−p)γ). The third
is the Prelec (1998) two-parameter weighting function: w(p) = e−λ(−lnp)γ . On the contrary,
no specific hypothesis on non-linear transformation of probabilities is needed for the outcome
scale method, as the probability used to elicit risk attitudes is kept constant.
The stochastic choice process specifies the likelihood of choosing one option given an alter-
native option. In order to avoid any estimation artifact, we designed our estimation strategy
so that it was as similar as possible to that of the method (see Harrison and Rutstrom, 2008
for refinements on stochastic choice processes). We then consider a Luce error specification.
Under this error specification, the probability of choosing lottery A over lottery B satisfies:
P (A|B) =VT (A)1/µ
VT (A)1/µ + VT (B)1/µ(4)
where VT (A) and VT (B) denote the deterministic value of lotteries A and B, T denotes the
underlying decision theory (T = EUT,RDUT ) and µ denotes a noise parameter. P (.) has
the following desirable properties: P (.) is comprised between 0 and 1, P (A|B) increases in
V (A) and P (A|B) = 1 − P (B|A). When µ → ∞, choice is only determined by error (or
noise) and choice probability P (A|B) converges to one half, lottery A is then selected at
random. When µ → 0, choice probability P (A|B) converges to one, choice for lottery A is
deterministic.
Conditional on each representation of preferences and on each scale method, we estimate the
model parameter using standard Maximum Likelihood Estimation (MLE) of the observed
reponses.
4.3 Results
Our results are based on three levels of analysis: subjects’ responses, parameter estimates
assuming EUT, and parameter estimates assuming Rank-Dependent Utility Theory. We first
present a descriptive overview of the subjects’ responses. No subject switched twice during
15
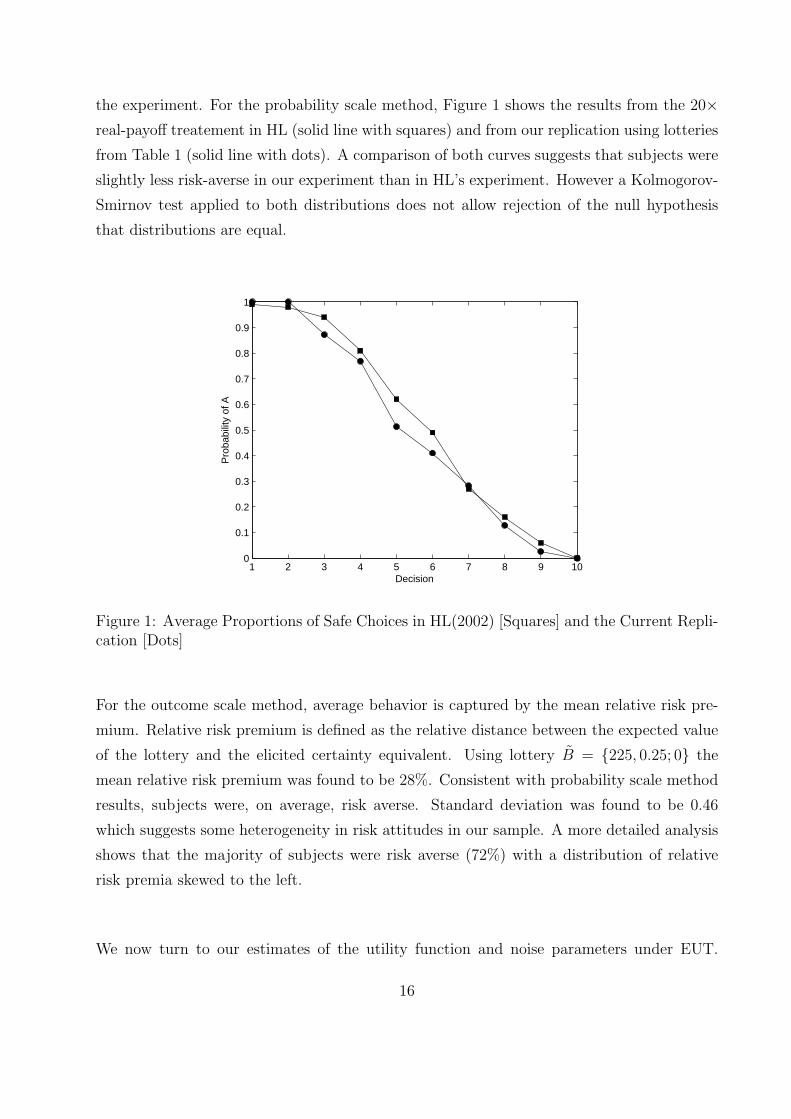
the experiment. For the probability scale method, Figure 1 shows the results from the 20×real-payoff treatement in HL (solid line with squares) and from our replication using lotteries
from Table 1 (solid line with dots). A comparison of both curves suggests that subjects were
slightly less risk-averse in our experiment than in HL’s experiment. However a Kolmogorov-
Smirnov test applied to both distributions does not allow rejection of the null hypothesis
that distributions are equal.
1 2 3 4 5 6 7 8 9 100
0.1
0.2
0.3
0.4
0.5
0.6
0.7
0.8
0.9
1
Decision
Pro
babi
lity
of A
Figure 1: Average Proportions of Safe Choices in HL(2002) [Squares] and the Current Repli-cation [Dots]
For the outcome scale method, average behavior is captured by the mean relative risk pre-
mium. Relative risk premium is defined as the relative distance between the expected value
of the lottery and the elicited certainty equivalent. Using lottery B = {225, 0.25; 0} the
mean relative risk premium was found to be 28%. Consistent with probability scale method
results, subjects were, on average, risk averse. Standard deviation was found to be 0.46
which suggests some heterogeneity in risk attitudes in our sample. A more detailed analysis
shows that the majority of subjects were risk averse (72%) with a distribution of relative
risk premia skewed to the left.
We now turn to our estimates of the utility function and noise parameters under EUT.
16
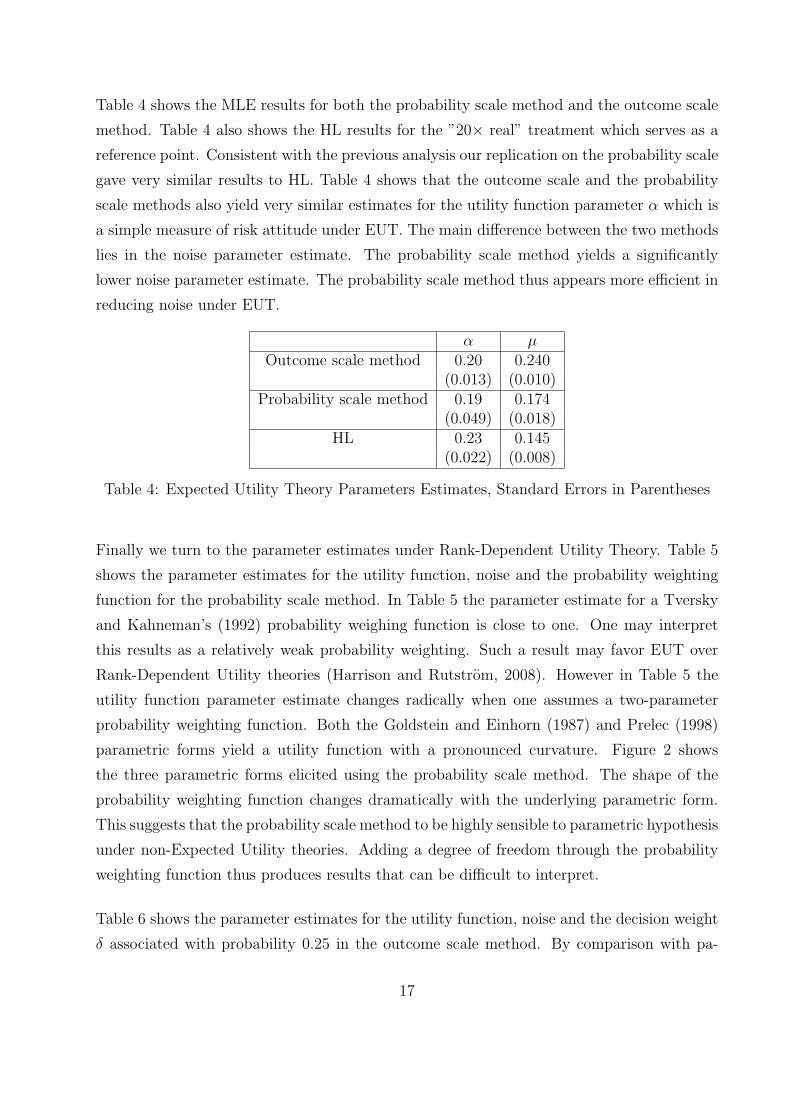
Table 4 shows the MLE results for both the probability scale method and the outcome scale
method. Table 4 also shows the HL results for the ”20× real” treatment which serves as a
reference point. Consistent with the previous analysis our replication on the probability scale
gave very similar results to HL. Table 4 shows that the outcome scale and the probability
scale methods also yield very similar estimates for the utility function parameter α which is
a simple measure of risk attitude under EUT. The main difference between the two methods
lies in the noise parameter estimate. The probability scale method yields a significantly
lower noise parameter estimate. The probability scale method thus appears more efficient in
reducing noise under EUT.
α µOutcome scale method 0.20 0.240
(0.013) (0.010)Probability scale method 0.19 0.174
(0.049) (0.018)HL 0.23 0.145
(0.022) (0.008)
Table 4: Expected Utility Theory Parameters Estimates, Standard Errors in Parentheses
Finally we turn to the parameter estimates under Rank-Dependent Utility Theory. Table 5
shows the parameter estimates for the utility function, noise and the probability weighting
function for the probability scale method. In Table 5 the parameter estimate for a Tversky
and Kahneman’s (1992) probability weighing function is close to one. One may interpret
this results as a relatively weak probability weighting. Such a result may favor EUT over
Rank-Dependent Utility theories (Harrison and Rutstrom, 2008). However in Table 5 the
utility function parameter estimate changes radically when one assumes a two-parameter
probability weighting function. Both the Goldstein and Einhorn (1987) and Prelec (1998)
parametric forms yield a utility function with a pronounced curvature. Figure 2 shows
the three parametric forms elicited using the probability scale method. The shape of the
probability weighting function changes dramatically with the underlying parametric form.
This suggests that the probability scale method to be highly sensible to parametric hypothesis
under non-Expected Utility theories. Adding a degree of freedom through the probability
weighting function thus produces results that can be difficult to interpret.
Table 6 shows the parameter estimates for the utility function, noise and the decision weight
δ associated with probability 0.25 in the outcome scale method. By comparison with pa-
17
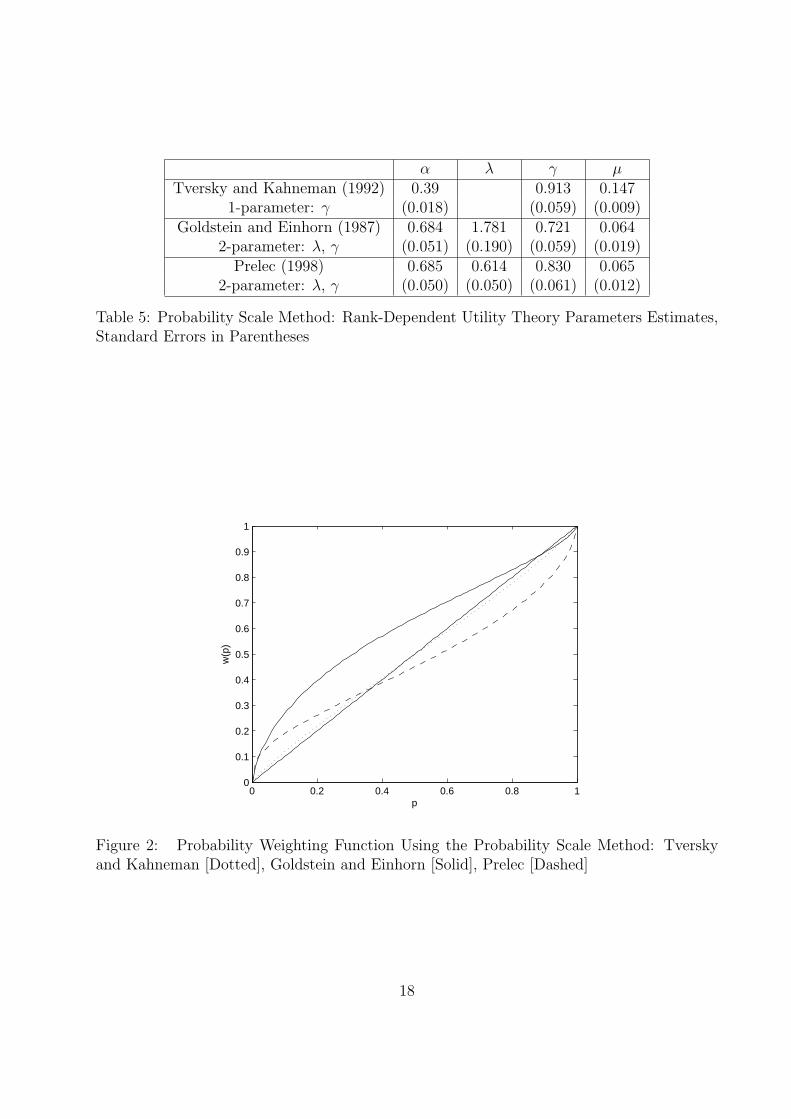
α λ γ µTversky and Kahneman (1992) 0.39 0.913 0.147
1-parameter: γ (0.018) (0.059) (0.009)Goldstein and Einhorn (1987) 0.684 1.781 0.721 0.064
2-parameter: λ, γ (0.051) (0.190) (0.059) (0.019)Prelec (1998) 0.685 0.614 0.830 0.065
2-parameter: λ, γ (0.050) (0.050) (0.061) (0.012)
Table 5: Probability Scale Method: Rank-Dependent Utility Theory Parameters Estimates,Standard Errors in Parentheses
0 0.2 0.4 0.6 0.8 10
0.1
0.2
0.3
0.4
0.5
0.6
0.7
0.8
0.9
1
p
w(p
)
Figure 2: Probability Weighting Function Using the Probability Scale Method: Tverskyand Kahneman [Dotted], Goldstein and Einhorn [Solid], Prelec [Dashed]
18
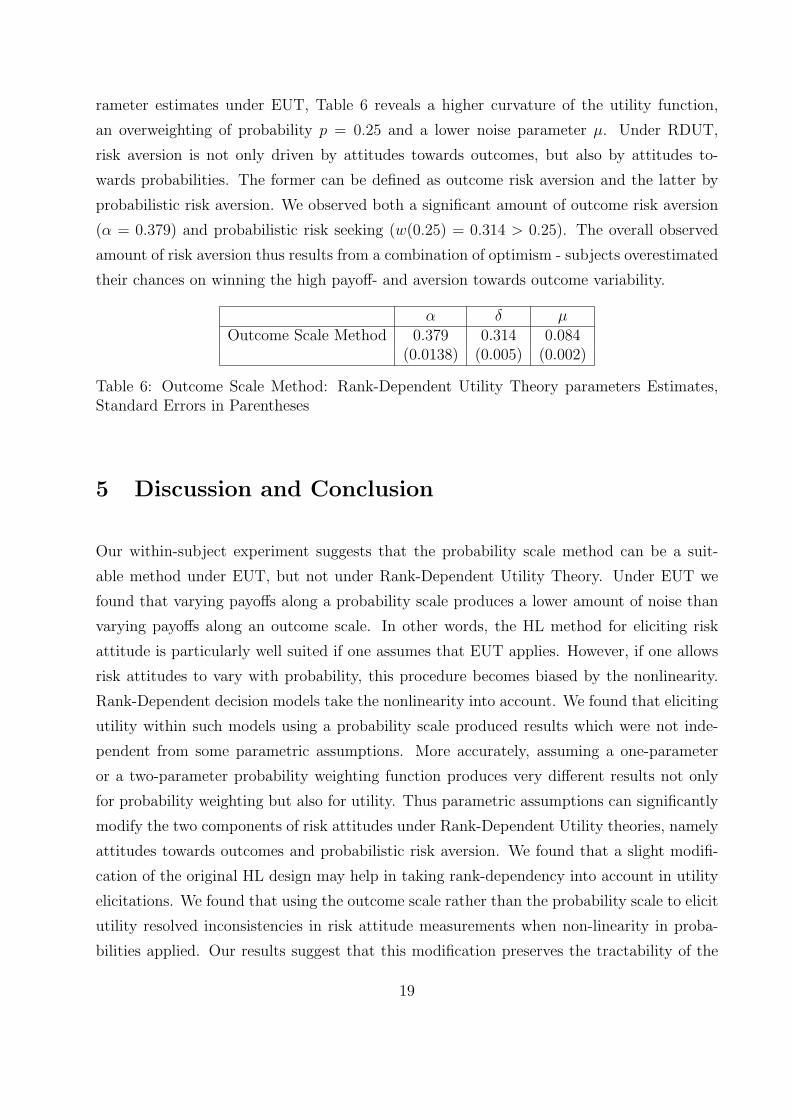
rameter estimates under EUT, Table 6 reveals a higher curvature of the utility function,
an overweighting of probability p = 0.25 and a lower noise parameter µ. Under RDUT,
risk aversion is not only driven by attitudes towards outcomes, but also by attitudes to-
wards probabilities. The former can be defined as outcome risk aversion and the latter by
probabilistic risk aversion. We observed both a significant amount of outcome risk aversion
(α = 0.379) and probabilistic risk seeking (w(0.25) = 0.314 > 0.25). The overall observed
amount of risk aversion thus results from a combination of optimism - subjects overestimated
their chances on winning the high payoff- and aversion towards outcome variability.
α δ µOutcome Scale Method 0.379 0.314 0.084
(0.0138) (0.005) (0.002)
Table 6: Outcome Scale Method: Rank-Dependent Utility Theory parameters Estimates,Standard Errors in Parentheses
5 Discussion and Conclusion
Our within-subject experiment suggests that the probability scale method can be a suit-
able method under EUT, but not under Rank-Dependent Utility Theory. Under EUT we
found that varying payoffs along a probability scale produces a lower amount of noise than
varying payoffs along an outcome scale. In other words, the HL method for eliciting risk
attitude is particularly well suited if one assumes that EUT applies. However, if one allows
risk attitudes to vary with probability, this procedure becomes biased by the nonlinearity.
Rank-Dependent decision models take the nonlinearity into account. We found that eliciting
utility within such models using a probability scale produced results which were not inde-
pendent from some parametric assumptions. More accurately, assuming a one-parameter
or a two-parameter probability weighting function produces very different results not only
for probability weighting but also for utility. Thus parametric assumptions can significantly
modify the two components of risk attitudes under Rank-Dependent Utility theories, namely
attitudes towards outcomes and probabilistic risk aversion. We found that a slight modifi-
cation of the original HL design may help in taking rank-dependency into account in utility
elicitations. We found that using the outcome scale rather than the probability scale to elicit
utility resolved inconsistencies in risk attitude measurements when non-linearity in proba-
bilities applied. Our results suggest that this modification preserves the tractability of the
19
original HL method and corrects for biases that can appear under non-EUT preferences.
The original HL, method and the method investigated in this paper differ only by the scale
used to elicit risk attitude. These methods have some of the same suitable experimental
features for eliciting risk attitude as other elicitation methods. The main advantage over the
Hey and Orme (1994) or Stott (2006) series of binary choices is tractability: using a proba-
bility or an outcome scale is both less cognitively demanding as well as less time-consuming.
For instance, Hey and Orme (1994) and Stott (2006) asked subjects to make preference
choices over 100 pairs of independent lotteries. If the primary goal of the experimenter is
not only to elicit risk attitude, but also to link it to miscellaneous economic behaviors, proce-
dures such as these can be too heavy to handle. Scale methods can easily be presented using
a multiple price list format, i.e presented in few ordered tables. This is a clear advantage
when it comes to tractability even if framing or procedural effects can appear. Procedural
problems such as these are one of the drawbacks of using multiple price lists. However fram-
ing or procedural effects can be resolved by skewed frames and refinements of the multiple
price list format (Andersen, Harrison, Lau and Rutstrom, 2006, Harrison and Rutstrom,
2008). Wakker and Deneffe (1996) provided an elegant trade-off method that allows a clear
separation between utility and attitudes toward probabilities without any parametric as-
sumption. However this method is chained: a given lottery choice depends on subject’s prior
answers. The chained nature of the trade-off method makes it sensitive to error propagation
and raises an incentive incompatibility issue. To this extend, scale methods must assume at
least one parametric form for the utility function but do not rely on chained answers. The
main advantage over Wakker and Deneffe’s (1996) non-parametric measure of risk attitude
is therefore the incentive-compatibility nature of scale methods. Last, the generalization
of the original HL method using an outcome scale has the benefit of being quite flexible.
Various procedures are compatible with this elicitation method: sure payoffs can be ordered
in a multiple price list, offered at random, or determined as a selling price for the alternative
lottery in a Becker-DeGroot-Marshak design.
From a theoretical standpoint, our findings are consistent with recent results by Bleichrodt,
Abellan-Perpinan, Pinto and Mendez-Martinez (2007) in the health domain. These authors
found that utility measurements using two binary risky lotteries are valid under EUT but
biased when comparing a risky and riskless prospect. Our results support this view: the
use of a probability scale with two binary risky lotteries reduces noise if EUT is assumed.
However, using a probability scale method in contexts where descriptive deficiencies of EUT
apply can not provide robust estimates of probabilistic risk aversion. In contexts where
20
RDUT is the best representation of preferences, the outcome scale can be a better way than
the probability scale to elicit risk attitudes.
References
Abdellaoui, M. (2000). Parameter-free elicitation of utility and probability weighting func-
tions. Management Science, 46 , 1497–1512.
Abdellaoui, M., Barrios, C., & Wakker, P. (2007a). Reconciling introspective utility with
revealed preference: Experimental arguments based on prospect theory. Journal of Econo-
metrics , 138 , 356–378.
Abdellaoui, M., Bleichrodt, H., & L’Haridon, O. (2008). A tractable method to measure
utility and loss aversion under prospect theory. Journal of Risk and Uncertainty , 36 ,
245–266.
Abdellaoui, M., Bleichrodt, H., & Paraschiv, C. (2007b). Loss aversion under prospect
theory: a parameter-free measurement. Management Science, 53 , 1659–1674.
Abdellaoui, M., L’Haridon, O., & Paraschiv, C. (2009). Experienced versus described un-
certainty: Do we need two prospect theory specifications? Working Paper, HEC School
of Management .
Andersen, S., Harrison, G., Lau, M., & Rutstrom, E. (2006). Elicitation using multiple price
lists. Experimental Economics , 9 , 383–405.
Andersen, S., Harrison, G., Lau, M., & Rutstrom, E. (2008). Eliciting risk and time prefer-
ences. Econometrica, 76 , 583–618.
Baillon, A., Drissen, B., & Wakker, P. (2009). Relative concave utility for risk and ambiguity.
Working Paper, Erasmus University Rotterdam.
Birnbaum, M. (2008). New paradoxes of risky decision making. Psychological Review , 115 ,
463–501.
Bleichrodt, H., Abellan-Perpinan, J., Pinto, J., & Mendez-Martinez, I. (2007). Resolving
inconsistencies in utility measurment under risk: tests of generalizations of expected utility.
Management Science, 53 , 469–482.
21
Bleichrodt, H., & Pinto, J. (2000). A parameter-free elicitation of the probability weighting
function in medical decision analysis. Management Science, 46 , 1485–1496.
Bosch-Domenech, A., & Silvestre, J. (2006). Risk aversion and embedding bias. Economics
Working Papers from Department of Economics and Business, Universitat Pompeu Fabra.
Camerer, C., & Ho, T. (1994). Violations of betweenness axiom and nonlinearity in proba-
bility. Journal of Risk and Uncertainty , 8 (167-196).
Carbone, E., & Hey, J. (2000). Which error story is best? Journal of Risk and Uncertainty ,
20 , 161–176.
Cohen, J.-Y. J., M., & Saıd, T. (1987). Experimental comparison of individual behavior
under risk and under uncertainty for gains and for losses. Organizational Behavior and
Human Decision Processes , 39 , 1–22.
Diecidue, E., & Wakker, P. (2001). On the intuition of rank-dependent utility. Journal of
Risk and Uncertainty , 23 , 281–298.
Erev, I., Glozman, I., & Hertwig, R. (2008). What impacts the impact of rare events. Journal
of Risk and Uncertainty , 36 , 153–177.
Fishburn, P. (1978). On handa’s new theory of cardinal utility and the maximization of
expected return. Journal of Political Economy , 86 , 321–324.
Fishburn, P., & Kochenberger, G. (1979). Two-piece von neumann-morgenstern utility func-
tions. Decision Sciences , 10 , 503–518.
Goeree, J., Holt, C., & Palfrey, T. (2003). Risk averse behavior in generalized matching
pennies games. Games and Economic Behavior , 45 , 97–113.
Goldstein, W., & Einhorn, H. (1987). Expression theory and the preference reversal phe-
nomena. Psychological Review , 94 , 236–254.
Gonzalez, R., & Wu, G. (1999). On the shape of the probability weighting function. Cognitive
Psychology , 38 , 129–166.
Gul, F. (1991). A theory of disappointment aversion. Econometrica, 59 , 667–686.
Harrison, G., List, J., & Towe, C. (2007). Naturally occurring preferences and exogenous
laboratory experiments: A case study of risk aversion. Econometrica, 75 , 433–458.
22
Harrison, G., & Rustrom, E. (2008). Risk Aversion in Experiments , chap. Risk Aversion in
the Laboratory. No. 12 in Research in Experimental Economic, N.Cox, G.Harrison(eds).
Emerald: Bingley.
Hershey, J., & Schoemaker, P. (1985). Probability versus certainty equivalence methods in
utility measurement: Are they equivalent? Management Science, 31 , 1213–1231.
Hey, J., & Orme, C. (1994). ”investigating generalizations of expected utility theory using
experimental data. Econometrica, 62 , 1391–1426.
Holt, C., & Laury, S. (2002). Risk aversion and incentive effects. American Economic
Review , 92 , 1644–1655.
Kahneman, D., & Tversky, A. (1979). Prospect theory: An analysis of decision under risk.
Econometrica, 47 , 263–291.
Lusk, J., & Coble, K. (2005). Risk perceptions, risk preference, and acceptance of risky food.
American Journal of Agricultural Economics , 87 , 393–405.
McCord, M., & de Neufville, R. (1986). Lottery equivalents: Reduction of the certainty
effect problem in utility assessment. Management Science, 32 , 56–60.
Morgenstern, O., & von Neumann, J. (1947). Theory of Games and Economic Behavior .
Princeton University Press:Princeton, 2nd ed.
Noussair, C., & Wu, P. (2006). Risk tolerance in the present and the future: an experimental
study. Managerial and Decision Economics , 27 , 401–412.
Prelec, D. (1998). The probability weighting function. Econometrica, 66 , 497–528.
Preston, G., & Baratta, P. (1948). An experimental study of the auction-value of an uncertain
outcome. American Journal of Psychology , 61 , 183–193.
Quiggin, J. (1981). Risk perception and risk aversion among australian farmers. Australian
Journal of Agricultural Economics , 25 , 160–169.
Quiggin, J. (1982). A theory of anticipated utility. Journal of Economic Behaviour and
Organization, 3 , 323–343.
Quiggin, J. (1993). Generalized expected utility theory - The rank-dependent model . Kluwer
Academic, Dordrecht.
23
Rabin, M. (2000). Risk aversion and expected-utility theory: A calibration theorem. Econo-
metrica, 68 , 1281–1292.
Schubert, R., Brown, M., Gysler, M., & Brachinger, H. (1999). Financial decision-making:
are women really more risk-averse? American Economic Review , 89 , 381–385.
Starmer, C. (2000). Developments in non-expected utility theory: The hunt for a descriptive
theory of choice under risk. Journal of Economic Literature, 28 , 332–382.
Stott, H. (2006). Cumulative prospect theory’s functional menagerie. Journal of Risk and
Uncertainty , 32 , 101–130.
Tversky, A., & Kahneman, D. (1992). Advances in prospect theory: Cumulative represen-
tation of uncertainty. Journal of Risk and Uncertainty , 5 , 297–323.
Wakker, P., & Deneffe, D. (1996). Eliciting von neumann-morgenstern utilities when prob-
abilities are distorted or unknown. Management Science, 42 .
24