Embed Size (px)
Citation preview

Advances in Applied Sciences 2018; 3(2): 9-18
http://www.sciencepublishinggroup.com/j/aas
doi: 10.11648/j.aas.20180302.11
ISSN: 2575-2065 (Print); ISSN: 2575-1514 (Online)
Risk Early Warning Analysis on Vulnerability of Metro Stampede Accident
Wang Qi-quan, Zhu Qian-kun
Department of Safety Engineering, China University of Labor Relations, Beijing, China
Email address:
To cite this article: Wang Qi-quan, Zhu Qian-kun. Risk Early Warning Analysis on Vulnerability of Metro Stampede Accident. Advances in Applied Sciences.
Vol. 3, No. 2, 2018, pp. 9-18. doi: 10.11648/j.aas.20180302.11
Received: March 21, 2018; Accepted: April 2, 2018; Published: May 5, 2018
Abstract: Based on the statistical analysis of the typical crowded stampede in the past ten years and based on the theory of
vulnerability, determine the vulnerable parts of the crowded stampede in the subway station crowd, combined with interpretative
structural model, systematically analyze the fragile parts of the crowded stampede at the subway station and find out the
relationship between the vulnerable points and establish a multi-level hierarchical subway stampede Structural model. The
generality of the characteristics of the Beijing subway crowd was calculated by setting up observation points for escalators and
stairways at five high-speed subway stations, use Matlab and Spss to calculate the regression equation, and determine the related
relationship between traffic flow, speed and crowd flow and crowded stampede, construct the metro crowding stampede accident
risk matrix and put forward different levels of risk warning control measures.
Keywords: Crowded Stampede, Vulnerability Analysis, Interpretive Structure Model, Risk Early Warning
1. Introductions
Due to the complexity and particular characters of the city
metro system, consequences often tend to be disastrous when
accident occurred. According to incomplete statistics, more
than 60% of the accidents occurred during metro operation
hours [1]. Main types of accident occurring in metro system
are usually overcrowding and stampede, therefore conducting
risk analysis on the vulnerability of metro accidents will help
prevent overcrowding and stampede happening in the metro
station.
Given the fact that passenger flow density in metro systems
outside China rarely reaches the congested state, researches on
metro accidents therefore are mainly focus on emergency
response of terrorist attacks and violent incidents [2] as well as
safety management. Those researches however are focused on
large-scale activities, parades and similar scenarios [3], hence
blanks are still existed in the field of studying overcrowding
metro station specifically and systematically.
In China, researcher tend to apply classical risk theory to
study over overcrowding and stampede [4]; Zhang Qingsong
[5] constructed a formula to express risks of overcrowding and
stampede based on previous studies; Wang Qiquan [6] studied
the potential location and triggering factors of metro
overcrowding and stampede accident by statistic analysis and
establishing quantitative analysis model, it helped to lay the
foundations of the research for metro overcrowding and
stampede; Liu Yan, Wang Tong, etc., [7] based on the previous
studies of Wang Qiquan used the DEA (Date Envelopment
Analysis) model to assess the threats of metro overcrowding
and stampede accident successfully, which provides a new
method of risk assessment of metro overcrowding and
stampede accident. However, in DEA model, monotony of
selections of input and output index as well as weight factors
still exists, hence improvement is further needed. Given the
fact, studies over overcrowding and stampede in China are
still concentrating on reliable analysis [8] and risk assessment,
occurring mechanism of stampede accident, the relations
between influential variables as well as vulnerability analysis
are hence to be studies further. [9]
Based on the researches mentioned, the author will start by
vulnerability analysis, combining data from previous studies,
use the theory of causes of metro accidents, the vulnerability
theory and the interpretive structural models to determine the
potential relations between various vulnerable locations with
structural complexity and establish a multilevel hierarchical
structural model, use the trace intersecting theory considering
factors like human factors (people’s unsafe behaviors) and

10 Wang Qi-quan and Zhu Qian-kun: Risk Early Warning Analysis on Vulnerability of Metro Stampede Accident
material factors (unsafe status of matters) and multiple
environmental variables to perform qualitative analysis and
reveal the relations between factors as well as occurring
mechanism of metro accidents in order to further establish
metro stampede risk assessment matrix, propose advisory
precautions and provide a scientific basis and treatments to
prevent metro overcrowding and stampede accident.
2. Analysis of Vulnerability Factors of
Subway Crowded Stampede
2.1. Analysis on Influence Factors of Subway Crowded
Stampede
During the analysis of the reproduction of a typical subway
stampede accident, it is determined that the subway stampede
can’t be separated from the four elements of
human-machine-environment-management. According to the
theory of accident risk in risk control theory, this paper
analyzes the influencing factors of subway vulnerability.
Taking the "vulnerability" in subway system as the research
center, starting from the four factors of personnel, equipment,
environment and management, besides the 10 typical subway
stampede accidents from 2008 to 2015, this paper combines
the various factors of stampede of large-scale activities,
combines the influence of personnel, equipment, environment
and management on the vulnerability of the subway and
adopts the fuzzy Delphi method to sum up Table 1 shows the
initial factors for the vulnerability of a subway stampede, uses
fuzzy Delphi method to summarize the initial factors of the
vulnerability of subway crowded stampede, as shown in Table
1.
Table 1. Initial factors on the vulnerability of subway crowded stampede.
Personnel factors Specific performance Equipment factors Specific performance
H1 Peak duration F1 Equipment position
H2 Peak passenger flow density F2 Equipment load
H3 Escalator on-board time F3 Number of disease equipment
H4 Walking speed F4 Equipment performance integrity
H5 Proportion of floating population F5 Misoperation recovery ability
H6 Psychological diathesis F6 Equipment stability
H7 Physiologic quality
Environmental factors Specific performance Management factors Specific performance
E1 Rationality of design M1 Emergency command ability of emergency
E2 Effectiveness of passenger flow diversion facilities M2 Evacuation rehearsal
E3 The quickness of accident evacuation M3 Measures to deal with the large passenger flow
2.2. Construct the Interpretation Structure Model of
Subway Crowded Stampede (ISM)
2.2.1. Organize a Team that Implements the Interpretive
Structural Model (ISM)
The team is generally composed of coordinators, technical
experts in methods, and participants. The team consists of five
members, each person should have a certain background of
expertise and the team leader should be the decision-maker.
2.2.2. Set Subway Congestion Stampede Impact Factors
The problem of this study is to analyze the influencing
factors of the vulnerability of the stampede in subway in the
previous part. The model is established to make a qualitative
analysis, and a multi-level hierarchical structural model is
established to integrate the vulnerability factor system into it.
2.2.3. Establish the Leading Factors of the Subway
Crowded Stampede
The members of the group need to decide the specific
contents of the direct indirect factors that lead to the accident
according to the causes of the accident, the casualties and the
place where the subway was stampeded in recent ten years in
Beijing.
2.2.4. Enumerate the Correlation of the Influencing
Factors of the Subway Stampede Accident, Build
Reachable Matrix
According to the mutual influence of the vulnerability
factors of subway stampede accidents, build a directed
connection diagram of subway vulnerability factors and build
an adjacency matrix A. Then add a unit matrix I to the
adjacency matrix A, and after the calculation, the reachable
matrix AI1 is get with the length less than or equal to 1
between the nodes; Suppose the matrix AI2= (A+I) 2is AI
2,
which is calculated using Boolean algebraic operation rules to
obtain a matrix AI2, which represents the reach ability of
paths between nodes with length less than or equal to 2. The
18 factors in this system belong to a major system, so defining
AI(ni) as the set of variables that can be reached by variable i,
that is reachable set; R(ni) is used to represent a set of
variables that can reach the variable I, which is a set of
antecedent set. The accessibility is shown in Table 2 according
to the adjacency matrix R.
Table 2. Reachability matrix analysis table for subway crowded stampede.
H1 H2 H3 H4 H5 H6 H7 F1 F2 F3 F4 F5 F6 E1 E2 E3 M1 M2
H1 0 1 1 0 0 0 0 0 0 0 1 0 0 0 0 0 0 0
H2 0 0 0 1 1 0 0 0 0 0 1 0 0 1 0 0 0 1
H3 0 0 0 1 0 0 0 0 0 0 1 0 0 0 0 0 0 0
H4 0 0 1 0 0 0 0 0 0 0 1 0 0 1 0 0 0 0

Advances in Applied Sciences 2018; 3(2): 9-18 11
H1 H2 H3 H4 H5 H6 H7 F1 F2 F3 F4 F5 F6 E1 E2 E3 M1 M2
H5 0 0 1 1 0 0 0 0 0 0 0 0 0 0 1 1 0 1
H6 0 0 0 0 0 0 0 0 0 0 0 0 0 1 1 1 1 1
H7 1 0 0 1 0 0 0 0 0 0 0 0 0 1 1 1 1 1
F1 1 1 0 1 1 0 0 0 0 0 0 0 0 1 1 1 1 1
F2 0 0 0 0 0 0 0 0 0 1 1 1 0 0 0 1 0 0
F3 0 0 0 0 0 0 0 0 0 0 1 1 0 1 1 1 1 1
F4 0 0 0 0 0 0 0 0 1 1 0 1 0 0 1 1 1 1
F5 0 0 1 0 0 0 0 0 0 1 1 0 0 0 1 1 0 1
F6 0 0 0 0 0 0 0 1 1 1 1 1 0 0 1 1 1 1
E1 1 0 0 1 0 0 0 0 0 0 0 0 0 0 1 1 1 1
E2 0 0 0 1 0 0 0 0 0 0 0 0 0 0 0 1 1 1
E3 0 0 0 1 0 0 0 0 0 0 0 0 0 0 0 0 1 1
M1 0 0 0 0 0 0 0 0 0 0 0 0 0 1 0 1 0 1
M2 0 0 0 0 0 0 0 0 0 0 0 0 0 1 1 1 1 0
2.2.5. Decompose the Reach Ability Matrix, Build the Structure Model and Build the Interpretation Structure Model of the
Subway Crowded Stampede Accident
The adjacency matrix is used for loop analysis of the system so as to obtain a new order, and then use the self-multiplication
method to obtain the reach ability matrix. The data are analyzed by the computer and the skeletal map is drawn as shown in
Figure 1.
Figure 1. ISM skeleton map of subway crowded stampede.

12 Wang Qi-quan and Zhu Qian-kun: Risk Early Warning Analysis on Vulnerability of Metro Stampede Accident
The complex links between the elements are seen in Figure
1, and the 18 factors are divided into 4 nine-levels. Level 1 is
the most important factor that affects the vulnerability of
subway crowded stampede. Type I factors is the human factor,
reflecting that people are important disaster-bearing bodies
and direct victims of stampede in the subway. The impact of
accidents on people is destructive, and it is the result of the
interaction between human and accident vulnerability; Class
II is the factor of equipment, the external factor that affects the
vulnerability of subway, and is closely related to the first
factor and is the auxiliary factor of human vulnerability
analysis; Class III factor is the environmental factor, which is
the dependence point of the subway vulnerability and is the
"hard support" of the subway vulnerability analysis; Class Ⅳ
factor is the management factor, which is the guarantee of the
vulnerability of the subway. The first level factors are the peak
intensity, the proportion of floating population, the speed of
walking and the disoperation recovery ability. It directly
affects the equipment load, physiological quality, equipment
performance integrity and equipment stability and peak
duration; The second level is the physiological quality, and the
physiological quality can affect the psychological quality; The
third level is psychological quality and effectiveness of large
passenger flow response measures, psychological quality
affects the speed of evacuation and the effectiveness of large
passenger flow response measures, and the effectiveness of
large passenger flow response measures will have an impact
on the peak duration; The fourth level is the peak duration and
the speed of evacuation of the incident, which will affect the
location of the equipment and the time it takes for the elevator
to ride; The fifth level is the time taken by the elevator and the
location of the equipment, both of which have an impact on
equipment loading, design rationality, passenger flow
diversion measures and emergency command capabilities of
emergencies, and the location of the equipment will have an
impact on the stability of the equipment alone; The design
rationality of the sixth level will affect the stability of the
equipment; The seventh level is the stability factor of the
equipment. The stability of the equipment will affect the
number of the sick equipment; The eighth level is the quantity
elements of the disease equipment, and the number of the
disease equipment affects the integrity of the equipment.
These four categories of 9 factors correlate with each other,
promote each other, constitute the deportation structure
relationship between the vulnerability of the effect on the
subway, provide a logical way for subway safety management
and risk management decision.
3. Subway Crowded Stampede
Vulnerability Risk Data Analysis
The load bearing individual of occurrence of crowded
stampede is the human being, the accident itself is caused by
the interaction of many factors such as environment,
individual, population density, flow of people and so on.
Therefore, the "degree of pedestrian congestion" is cited here
as a reflection of various parts of the subway, such as corridor,
stair lift, transfer platform and pedestrian aggregation index,
this provides data support in quantitative calculate of
passengers' possibility of a stampede in the process of
movement, defines the critical value of different congestion
states for reducing the probability of crowded stampede in
vulnerable areas in order to timely alert the abnormal status in
subway stations, prevent the occurrence of crowded stampede,
make the passive control into active warning.
3.1. Data Acquisition
3.1.1. Test Purpose
Gather the characteristic parameters of crowd movement in
subway station, such as speed, flow, density and so on.
3.1.2. Test Time
Clear day, morning peak(6:30-8:30).
3.1.3. Test Place
Due to the need to measure the degree of congestion,
Xizhimen Station, Xierqi Station, Xidan Station, Liuliqiao
Station and Guomao Station are chosen as the test location.
3.1.4. Test time
March 28, March 29th, March 30th, April, 2016, morning
peak: 17:00-19:00.
3.1.5. Test Content
During the late peak of Xizhimen, Xidan, Liuliqiao,
Guomao and Xierqi subway stations, pedestrians will be
transferred from Line 13 to Line 2, Line 1 to Line 4 and Line 9
to Line 10, Line 1 to Line 10 and Changping Line to Line 13 to
collect space occupancy rate, flow rate, speed and density data
at stair escalators and to analyze the relationship between the
four data sets.
3.1.6. Acquisition Method
In order to obtain accurate data characteristics of
pedestrians, video data survey method and artificial detection
method is used in this paper investigation, video data research
has the advantages of long detection time, convenient
maintenance, many parameters that can be detected, etc., but it
is more difficult to process the data. So the video data is
chosen to reprocess with the manual detection method.
Compared with the video data survey method, the manual
detection method is more convenient, economical and
practical. However, it takes a lot of manpower and material
resources, is time-consuming and labor-intensive and is not
suitable for long-term data collection.
3.2. Data Processing
3.2.1. Density
Pedestrian density refers to the average number of
pedestrians in a unit area (within the study area) on a transfer
staircase or escalator, the unit isplm2. The method of
calculating pedestrian density is to calculate the total N of

Advances in Applied Sciences 2018; 3(2): 9-18 13
pedestrians who remain in the survey area at the end of the
time. By dividing the area of the survey area, the pedestrian
density value can be get. The formula (1) is as follows: [10]
M = �|�| = �
�∗� (1)
M represents the pedestrian density of the transfer to a
staircase or escalator, the unit is plm2, N is the number of
pedestrians at the escalators on transferring to the stairs at a
time, the unit is ρ, S is the area of area, the unit is m2, L is the
facility length, W is the facility length, the units are m.
Because this method does not consider the observation area,
the observation time interval and the number of consecutive
observations, so if the observation area is different, it has a
great influence on the density, in addition to considering the
influence of the area of accuracy caused by the density, solve
the relationship between velocity and density of the fine
structure, it is referred to the Voronoi Method proposed by A.
Seyfried and B. Steffen in 2010 to collect density data,
formula is as shown in formula (2) and (3) below.
= � �(�→)� �→�|�| (2)
’ = �∑ |�|���� (3)
In the formula, p�( �→) = � ��� , �→∈ �
0, "#ℎ%&'()% and ( �→)=∑ *�( �→)� .
The Mv measurement is suitable for the smaller number of
observations in the observation area, it requires all effective
ThyssenKrupp polygon cells fall within the area of the
measuring area. While My can allow the Tyson polygonal cell
to fall outside the area of the measurement area. So Mv is more
likely to be affected by adjacent edge polygons than Mv‘.
3.2.2. Speed
Speed refers to the rate of people moving in the specified
direction, which can be used to describe a movement or a
static flow of people. The unit is m/s or m/min. According to
the average pedestrian walking speed of 22.5m / min, 60.7%
of the total number of pedestrians is in the 60-80m / min speed
range. The speed is affected by the pedestrian's age, gender,
status, purpose and so on. The speed of men is generally
higher than that of women. The speed of pedestrians is the
highest among middle-aged men and young men, the second is
the speed of young women, the lowest is the old women, and
the speed of children is the most unstable. The individual
pedestrian speed was generally higher than the group
pedestrian speed.
In the speed processing, according to the video data of the
video, the video is segmented into 25 frames per second, video
processing by frame playback, while recording the given video
distance pedestrians from entering the observation area to leave
observation area accurate time node (t1, t2), then calculate the
velocity of pedestrians according to the length of the observation
area, calculation formula as shown in formula (4): [11]
→∆�,� (#) =��,-(./)0��,-(.�)./0.� , t ∈ [#�, #3] (4)
Vi(t) represents the instantaneous velocity at the time of t.
3.2.3. Flow
Flow refers to the number of pedestrians crossing a certain
point or cross-sectional area within a unit of time, the unit is
p/(m*min), here it is taken that the number of people passing
the vertical cross-section per unit width in 1 minute.
According to the basic principle of flow, the pedestrian flow is
calculated to be Q(x, y, t)=M(x, y, t)*V(x, y, t), M and V have
been given in the previous article. In the actual operation, the
number of pedestrians passing through the section is counted
for a time interval and unit width (in this case 1 m width)
through studying the survey section of the target area.
3.3. Data Analysis Results
The relationship between the occupancy rate, flow rate,
speed and density of stair escalators when the passer by
changes from Metro Line 13 to line 2, line 1 to line 4, line 9 to
line 10, line 1 to line 10, and Changping line to line 13 in
Xizhimen, Xidan, Liuliqiao, Guomao and Xierqi thesefive
stations during the late peak is shown in Table 3.
Table 3. The analysis table of the flow statistics of the transfer staircase and the escalator.
Xizhimen station
Parts Survey location Data on flows Speed data
Density data Direction/average flow (person/hour) Category /average flow (m/s)
Stairs Line 13-Line 2 get on/1135 get on/0.590 1.373
get off/349 get off/0.699 2.386
Escalator Line 13-Line 2 get on/2685 enter/0.458 1.583
get off/567 out/0.868 1.757
Guomao station
Parts Survey location Data on flows Speed data
Density data Direction/average flow (person/hour) Category /average flow (m/s)
Stairs Line 1-Line 10 get on /2700 get on /0.577 1.423
get off /4830 get off /0.712 2.369
Escalator Line 1-Line 10 get on /3100 enter/0.473 1.564
get off /6358 out/0.885 1.675
14 Wang Qi-quan and Zhu Qian-kun: Risk Early Warning Analysis on Vulnerability of Metro Stampede Accident
Liuliqiao station
Parts Survey location Data on flows Speed data
Density data Direction/average flow (person/hour) Category /average flow (m/s)
Stairs Line9-Line10 get on/705 get on/0.645 1.435
get off /3859 get off/0.732 2.412
Escalator Line9-Line10 get on/1124 enter/0.425 1.596
get on/5364 out/0.815 1.698
Guomao station Xidan station
Parts Survey location Data on flows Speed data
Density data Direction/average flow (person/hour) Category /average flow (m/s)
Stairs Line 1-Line 4 get on /1705 get on/0.585 1.385
get off /3405 get off /0.679 2.409
Escalator Line 1-Line 4 get on /3931 enter /0.475 1.594
get off /4366 out/0.847 1.749
Xierqi station
Parts Survey location Data on flows Speed data Density data
Direction/average flow (person/hour) Category /average flow (m/s)
Stairs Changping line-Line 13 get on/11846 get on/0.536 1.336
get off /3758 get off /0.644 2.377
Escalator Changping line-Line 13 get on/15956 enter/0.453 1.436
get off /2074 out/0.868 1.574
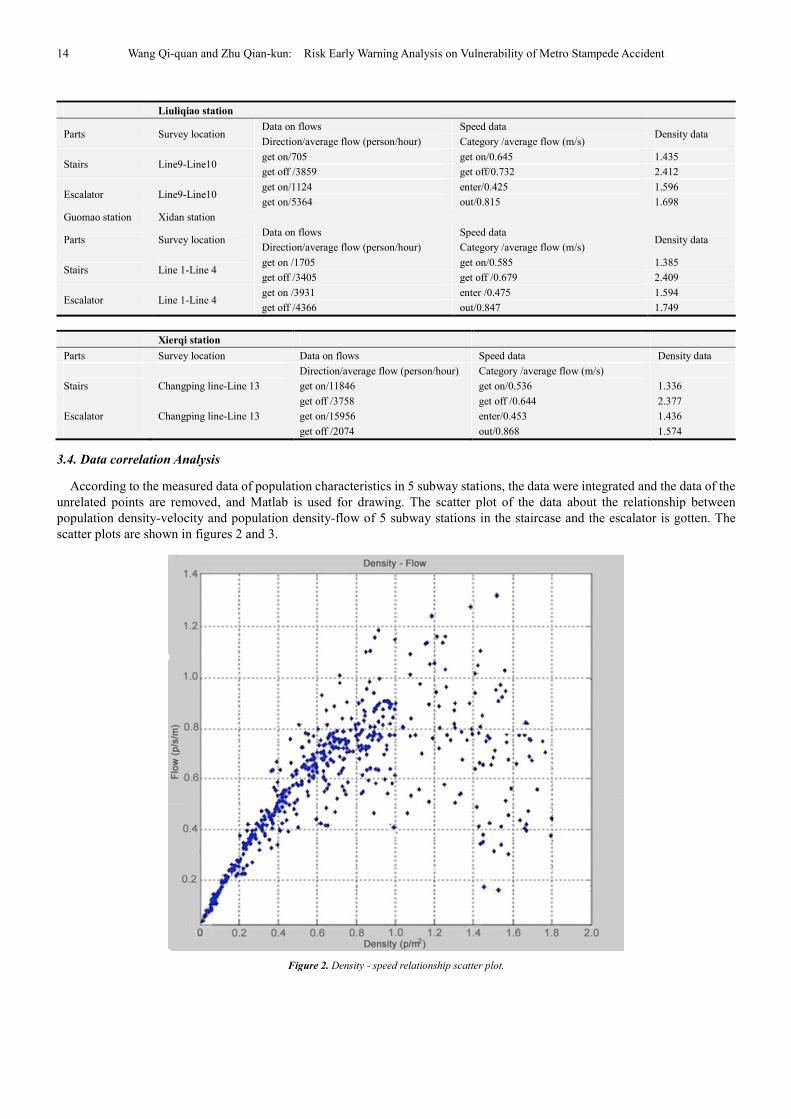
3.4. Data correlation Analysis
According to the measured data of population characteristics in 5 subway stations, the data were integrated and the data of the
unrelated points are removed, and Matlab is used for drawing. The scatter plot of the data about the relationship between
population density-velocity and population density-flow of 5 subway stations in the staircase and the escalator is gotten. The
scatter plots are shown in figures 2 and 3.
Figure 2. Density - speed relationship scatter plot.
Advances in Applied Sciences 2018; 3(2): 9-18 15
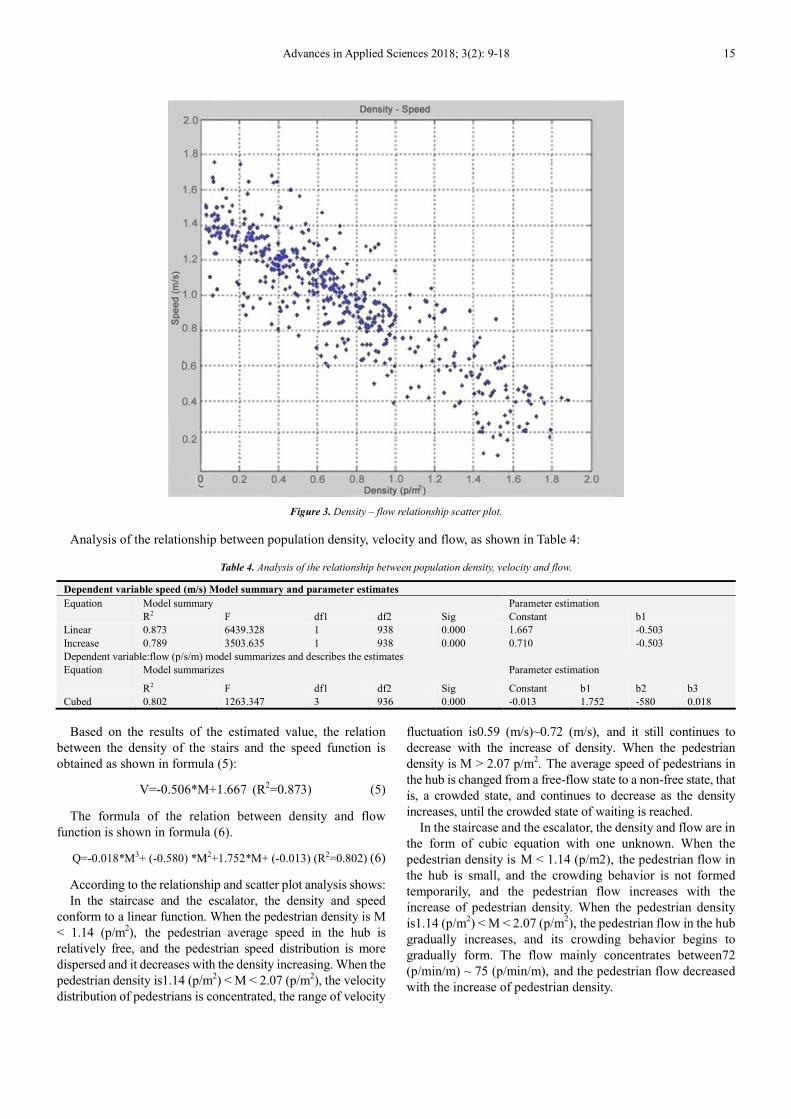
Figure 3. Density – flow relationship scatter plot.
Analysis of the relationship between population density, velocity and flow, as shown in Table 4:
Table 4. Analysis of the relationship between population density, velocity and flow.
Dependent variable speed (m/s) Model summary and parameter estimates
Equation Model summary Parameter estimation
R2 F df1 df2 Sig Constant b1
Linear 0.873 6439.328 1 938 0.000 1.667 -0.503
Increase 0.789 3503.635 1 938 0.000 0.710 -0.503
Dependent variable:flow (p/s/m) model summarizes and describes the estimates
Equation Model summarizes Parameter estimation
R2 F df1 df2 Sig Constant b1 b2 b3
Cubed 0.802 1263.347 3 936 0.000 -0.013 1.752 -580 0.018
Based on the results of the estimated value, the relation
between the density of the stairs and the speed function is
obtained as shown in formula (5):
V=-0.506*M+1.667 (R2=0.873) (5)
The formula of the relation between density and flow
function is shown in formula (6).
Q=-0.018*M3+ (-0.580) *M2+1.752*M+ (-0.013) (R2=0.802) (6)
According to the relationship and scatter plot analysis shows:
In the staircase and the escalator, the density and speed
conform to a linear function. When the pedestrian density is M
< 1.14 (p/m2), the pedestrian average speed in the hub is
relatively free, and the pedestrian speed distribution is more
dispersed and it decreases with the density increasing. When the
pedestrian density is1.14 (p/m2) < M < 2.07 (p/m
2), the velocity
distribution of pedestrians is concentrated, the range of velocity
fluctuation is0.59 (m/s)~0.72 (m/s), and it still continues to
decrease with the increase of density. When the pedestrian
density is M > 2.07 p/m2. The average speed of pedestrians in
the hub is changed from a free-flow state to a non-free state, that
is, a crowded state, and continues to decrease as the density
increases, until the crowded state of waiting is reached.
In the staircase and the escalator, the density and flow are in
the form of cubic equation with one unknown. When the
pedestrian density is M < 1.14 (p/m2), the pedestrian flow in
the hub is small, and the crowding behavior is not formed
temporarily, and the pedestrian flow increases with the
increase of pedestrian density. When the pedestrian density
is1.14 (p/m2) < M < 2.07 (p/m
2), the pedestrian flow in the hub
gradually increases, and its crowding behavior begins to
gradually form. The flow mainly concentrates between72
(p/min/m) ~ 75 (p/min/m), and the pedestrian flow decreased
with the increase of pedestrian density.

16 Wang Qi-quan and Zhu Qian-kun: Risk Early Warning Analysis on Vulnerability of Metro Stampede Accident
4. Vulnerability Risk Early Warning
Analysis of Subway Crowded
Stampede
4.1. Construct the Risk Matrix of Crowded Stampede
Based on the related data analysis of visitors flow rate,
pedestrian flow speed and pedestrian flow density, taking the
basic data density (M) as the observation value, and the
accident probability, economic loss and casualty situation are
listed adjudging criteria. The risk matrix is established to
conduct a qualitative and quantitative analysis of the risk of
crowded stampede in the subway station in order to achieve
precise control. The risk matrix is shown in Table 5.
Table 5. Risk matrix of subway crowded stampede.
Risk
Matrix
Medium
Risk(Level III)
High Risk
(Level IV)
Extremely High
Risk(Level V)
Valid
Categories Value
Possible Loss
Degree of Casualty
Common
Risk
(Level II)
6 12 18 24 30 A 6 Multiple Deaths
5 10 15 20 25 B 5 One person death
4 8 12 16 20 C 4 Multiple Serious Injuries
3 6 9 12 15 D 3 One person Serious Injury
Low Risk
(Level I)
2 4 6 8 10 E 2 Multiple minor Injuries
1 2 3 4 5 F 1 One person Minor Injury
1 2 3 4 5 Value Risk Grade
K J I H G Valid
Categories
Risk
value Risk level Memo
0<M<1.14 1.14<M<2.07 2.07<M Possibility >25
Extremely High
Risk Level V
Never
happened
Happened Once
over 5 years
Happened
Once within 5
years
Happened Once
within 2 years
Once per
year Frequency
18~25 High Risk Level IV
Excellent Great, Hardly
breakdown
Years later may
breakdown
Close to expire
occasionally
breakdown
Out of date
Always
breakdown
Equipment
Status
9~16 Medium Risk Level III
3~8 Common Risk Level II
1~2 Low Risk Level I
The density interval values 0-1.14, 1.14-2.07 and 2. 07-max
is taking as the research samples. [12] Here the author
stipulates that 0-1.14 corresponds to "impossible" and "less
likely" (median 0.57), 1.14 <M <2.07 corresponds to the
"occasional happened in the past" "it happened or happened in
unusual circumstances in the past" (median 1.1), M> 2.07
corresponds to the possibility of "occurred in the expected
situation", here the author makes some explanations for the
classification of the risk:
(1) When the population density reaches 0 <K <1.14, it does
not mean that an accident will never occur. And in this
population density, the population is in a free-flowing state.
Under normal circumstances, it is hard for people to make
physical contact and therefore there is no speed collision. The
risk of an accident is low. One of the cornerstones of crowded
stampede is "speed change". The change of speed means that a
person or a region has a sudden change or collision in speed,
and there is a theoretical peak value curve of speed change.
Peak point represents the speed collision at this point, the
kinetic energy of change caused by changes in speed makes
people fall, so the occurrence of crowded stampede. Therefore,
one of crowded stampede accident conditions is a certain
crowd density. And without a certain amount of crowd density,
crowded stampede cannot happen; the worst of events will
only be "fall" or "collision."
(2) In view of the possibility of "occasionally occurring in
the past" or "occurring in the past or occurring in exceptional
circumstances", the author defines the population density as
1.14 <K <2.07 because the free flow has been restricted under
this population density. As crowds begin to become crowded,
the probability of occurrence of a crowded stampede is raised
when the condition of "sudden jump" is established. In this
density interval, there is more human-to-human contact, and
as the density increases, contact rate increased, the risk then
increased.
(3) When M> 2.07, the crowd free flow characteristics
completely disappeared, in a state of congestion. In this state,
once a sudden event occurs, such as fainting, quarrel, shouting,
violent incidents, terrorist acts, someone falls, etc., will
directly or indirectly lead to the occurrence of crowded
stampede, so when the flow of people at a density of M> 2.07,
the risk of a stampede is "as expected".
4.2. Crowded Subway Accident Risk Warning Stampede
Control
The risk of crowded stampede in the subway station is
divided into four levels, level I includes low risk and general
risk, namely the risk value is 1~2 or 3~8; Level II is medium
risk, the risk value is 9~16; Level III is Significant risk 18~25;
Level IV is particularly significant risk, the value of risk at this
time is greater than 25. The calculation of the risk value is
based on the possible situation and the consequences. It is
proposed to automatically identify the human traffic by setting
up a video facial analysis device above the key crossings and
to determine the traffic density by the traffic and video
surveillance area, so as to obtain the real-time traffic density.
According to the value and possible accident results, the start
emergency plan to prevent the occurrence of crowded
stampede is determined.
Depending on the level of risk, the subway station staffs
need to implement different interventions according to
instructions, and four kinds of warning control measures
Advances in Applied Sciences 2018; 3(2): 9-18 17
according to the different divisions of the level of risk:
Level I (blue): At this level of risk, the probability of an
accident occurring is very low and unlikely or less likely.
Therefore, when the data processing center obtains the density
data and the real-time situation analysis detected by the
detectors of stairways and escalators, the accident risk of level
I am determined. The following interventions can be
implemented: Personnel: Inform staff of station to check
whether the normal setting of diversion facilities at stairwell
and escalator entrance are correct; the staff inside station and
platform staff remind passengers to pay attention to safety
through public address facilities. Facilities: Adjust the speed
of escalators from the control center, slightly increase the
speed of escalators and increase the carrying capacity.
Level II (yellow): At this risk level, the probability of an
accident increases and the density of people starts to change
from a free flow to a turbulent flow so that the contact rate
between passengers increases. When it is determined that the
accident risk is level II, the following interventions need to be
implemented in addition to the implementation of Level I
measures. Personnel: security personnel artificial restriction,
reduce the density of passenger stations, reduce the contact
rate between passengers; increase in the escalators and
stairway crossing monitoring evacuation site staff. Equipment:
reduce the elevator operating speed from the control center (at
this time the population density increases, the movement
speed in the elevator port is lower, in order to reduce the peak
collision speed, thus reducing the elevator speed, passengers
smooth transition from the platform to the elevator). Increase
the elevator stairs crossing diversion facilities.
Level III (orange): In this class, in addition to taking level I
and level II measures, the following measures need to be taken.
Personnel measures: In the subway station to carry out
diversion current limiting measures to reduce the station
traffic; in the staircases and escalators and platforms to
increase the staff to guide the evacuation. Equipment: Open
the station within the current limit, to increase the station can
move area. Management: Into the orange warning period, the
rail transport operators and other relevant member units
should immediately start the relevant special plan to
strengthen information monitoring and collection. Related
inspections of rail transit operators focus on the hidden parts
of the investigation. Professional emergency rescue teams
stand by at all times and receive promptly after receiving the
orders, and take corresponding measures to prevent the
occurrence of the incident or the further expansion of the
situation as the case may be.
Level IV (red): Based on the orange warning response, the
Emergency Leading Group Office shall timely keep
information and report to the Emergency Leading Group to
start the plan. The Emergency Leading Group promptly
conducts the judgment. If the red warning is reached, it will
start the plan and deploy the related early warning and
response work. All the inspectors will be on the job and the
entire area will be inspected one by one. The orbital traffic will
be suspended when necessary. At the same time to strengthen
the ground bus capacity.
5. Conclusions
In this paper, the crowded stampede of subway in China is
calculated and analyzed in the recent ten years, and used the
ISM and MATLAB and SPSS to analyze the actual data of the
five metro stations in Beijing and obtained the following
conclusions.
(1) In view of the huge passenger flow pressure of the
subway at present, each station presents different degrees of
vulnerability, but the overall vulnerability shows a certain
degree of similarity. Based on the research on the concept and
mechanism of the fragile and vulnerable parts of the subway
stampede and by referring to the accident cause theory, this
paper analyzes the correlation between the vulnerable parts
and the fragility from the aspects of personnel, equipment,
environment and management, with the explanation of the
structural model, And finally got the relationship diagram of
nine levels, which can provide some references for the safe
operation of the subway and the formulation of the emergency
management plan.
(2) According to the actual measured value of crowd's
characteristic attribute in subway station, using regression
analysis of MATLAB and SPSS, the relationship between the
density of crowd escalator at the entrance of escalator in
subway station and the speed of people flow is obtained, The
interval value of the population density conditions necessary
for the crowded stampede in the subway station is analyzed to
provide sample values for the data monitoring of the stairways
and escalators in the subway station.
(3) Using the quantitative data of the vulnerable parts and
the statistical data of the subway accidents, the risk matrix
model of the subway congestion stampede is constructed to
provide a technical reference for the prevention of the
crowded stampede in the subway and determine the four
warning risk levels of I, II, III and IV Form conditions and
early warning measures.
In this study, the key risk parts of some stations in Beijing
Subway are selected to study the vulnerability and the
vulnerability analysis did not proceed in a large scale. The
accuracy of the analysis process needs to be further verified.
The experimental population density data also need to be
compared with the actual congestion stampede accident data
for comparison.
Acknowledgements
This paper is supported by ‘Key Technology Projects for
the Prevention and Control of Serious Accidents in Safety
Production’ (Beijing-0001-2017AQ), National
Administration for Work Safety of People Republic of China.
References
[1] XU Tian-kun. Study on Risk Assessment Theory and Methods on Urban Rail Transit Network Operation [D]. Beijing: Beijing Jiaotong University, 2012.

18 Wang Qi-quan and Zhu Qian-kun: Risk Early Warning Analysis on Vulnerability of Metro Stampede Accident
[2] Yamada Y, Takatori T, Nagao M, Iwase H, Kuroda N, Yanagida J, Shinozuka T. Expression of paraoxonase is form did not confer protection from acute sarin poisoning in the Tokyo subway terrorist attack [J]. International Journal of Legal Medicine (Print), 2001, 1152.
[3] Wagner U, Fälker A, Wenzel V. [Fatal incidents by crowd crush during mass events: (Un)preventable phenomenon] [J]. Der Anaesthesist, 2013, 621.
[4] Wang qiquan. safety assessment [M]. Beijing: Chemical Industry Press, 2015:78-81.
[5] Zhang qingsong. The risk theory of crowd stampede and its application in sports competition [D]. Nankai University, 2007.
[6] Wang qiquan. Study on accident risk of subway stampede based on weighted relation degree algorithm [J]. China Safety Science Journal, 2013, 05:94-100.
[7] Liu yan, Wangtong, Dinghui, Wuzhongzi. DEA Model Study on Accident Risk Assessment of subway station crowded stampede [J]. China Safety Science Journal, 2013, 10:100-104.
[8] Wang qiquan, Wang weixian. Planning and counter measures of emergency evacuation route in subway fire [J]. Journal of Safety Science and Technology, 2017, 03:131-136.
[9] Wang shuliang. Vulnerability Analysis of Infrastructure System Based on Complex Network Theory [D]. HUST, 2013.
[10] Wang qiquan, Wu jiaxin, Designing a linkage system for response to subway stampede accidents based on STAMP model [J]. China Safety Science Journal, 2016, 12:158-162.
[11] Wang qiquan. The risk theory of crowd stampede [M]. Beijing: China meteorological Press, 2017:127-143.
[12] Wang qiquan, Wang weixian. Planning and counter measures of emergency evacuation route in subway fire [J]. Journal of Safety Science and Technology, 2017, 03:131-136.