Embed Size (px)
Citation preview

First IMF Statistical ForumStatistics for Global Economic and Financial Stability
Risk Exposures in International
and Sectoral Balance Sheets
Philip Lane Trinity College Dublin
Paper presented at the First IMF Statistical Forum Washington, D.C. | November 12–13, 2013
The views expressed in this paper are those of the author(s) only, and the presence of them, or of links to them, on the IMF website does not imply that the IMF, its Executive Board, or its management endorses or shares the views expressed in the paper.
Risk Exposures in International and Sectoral Balance Sheets
Philip R. Lane, Trinity College Dublin IMF Statistical Forum November 12/13 2013

Introduction
• Trend growth in gross scale of international and sectoral balance sheets
• Balance sheet dynamics: financial flows; valuation effects
• “Balance sheet” recessions; debt overhang; debt restructuring
• International data: IIP; CPIS; CDIS; UN; BIS • Sectoral data: sectoral financial accounts

Outline
• Risks in International Balance Sheets ! Net external stock imbalances ! Composition of foreign assets/liabilities ! International currency exposures • Risks in Sectoral Balance Sheets ! Net sectoral financial positions ! Sector-by-sector balance sheet analysis
!

Net External Stock Imbalances
• Crisis risk • Sudden stops; rollover risk • NIIP ! Net debt; Net equity ! Role of valuation effects (stabilising or
destabilising?)
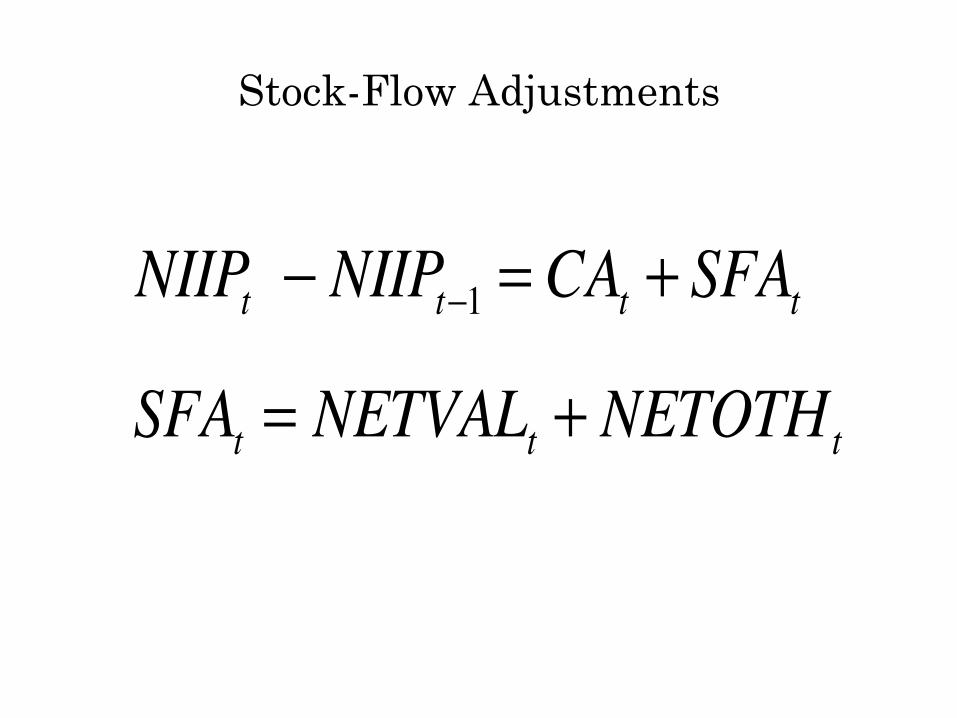
Stock-Flow Adjustments
NIIPt − NIIPt−1 = CAt + SFAt
SFAt = NETVALt + NETOTHt

SFA:!Stabilising!or!Destabilising?!
SFAit =α + βNETFLOWit + ε it
SFAit =α +δSFAit−1 + ε it

Composition of Foreign Assets/Liabilities
• Expansion in scale of international balance sheet (especially, advanced economies)
• Debt-equity mix; maturity; currency composition; geography; sectoral allocation
• ‘Granular’ analysis • Asymmetry: advanced versus developing
countries • Lane and Milesi-Ferretti (2001, 2007, 2013)

NIIP
1995 1997 1999 2001 2003 2005 2007 2009 20117.5
9
10.5
12
13.5
15
16.5
18
19.5
21
22.5
Figure 1: Net International Investment Position Global Index. Note: Average of global net
creditor and net debtor positions, expressed as a ratio to global GDP. Based on updated
version of Lane and Milesi-Ferretti (2007).
41

1998 2000 2002 2004 2006 2008 2010 2012
-2
-1.8
-1.6
-1.4
-1.2
-1
-0.8
-0.6
-0.4
-0.2
0
0.2
0.4
0.6
0.8
1
US
OIL
GER+JPN
OCADC
CHN+EMA
ROW
1998 2000 2002 2004 2006 2008 2010 2012
-2
-1.8
-1.6
-1.4
-1.2
-1
-0.8
-0.6
-0.4
-0.2
0
0.2
0.4
0.6
0.8
1
Figure 2: Global Current Account Imbalances, 1998 to 2012. Note: Based on World
Economic Outlook (October 2013). CHN+EMA = China, Hong Kong SAR, Indonesia,
Korea, Malaysia, Philippines, Singapore, Taiwan Province of China, Thailand; DEU+JPN
= Germany and Japan; IP = industrial production; OCADC = Bulgaria, Croatia, Czech
Republic, Estonia, Greece, Hungary, Ireland, Latvia, Lithuania, Poland, Portugal, Roma-
nia, Slovak Republic, Slovenia, Spain, Turkey, United Kingdom; OIL = oil exporters; ROW
= rest of the world; US = United States.
42

1995 1997 1999 2001 2003 2005 2007 2009 20110
50
100
150
200
250
300
350
400
450
500
550
600
650
700
ADV
EM
Figure 3: International Financial Integration (IFI) Ratios: Advanced and Emerging
Economies, 1995-2012. Note: IFI ratio is sum of foreign assets and foreign liabilities,
expressed as a ratio to GDP. Based on updated version of Lane and Milesi-Ferretti (2007).
43
1995 1997 1999 2001 2003 2005 2007 2009 20110.5
0.75
1
1.25
1.5
1.75
2
2.25
2.5
2.75
3
3.25
3.5
3.75
4
ADV
EM
1995 1997 1999 2001 2003 2005 2007 2009 20110.5
0.75
1
1.25
1.5
1.75
2
2.25
2.5
2.75
3
3.25
3.5
3.75
4
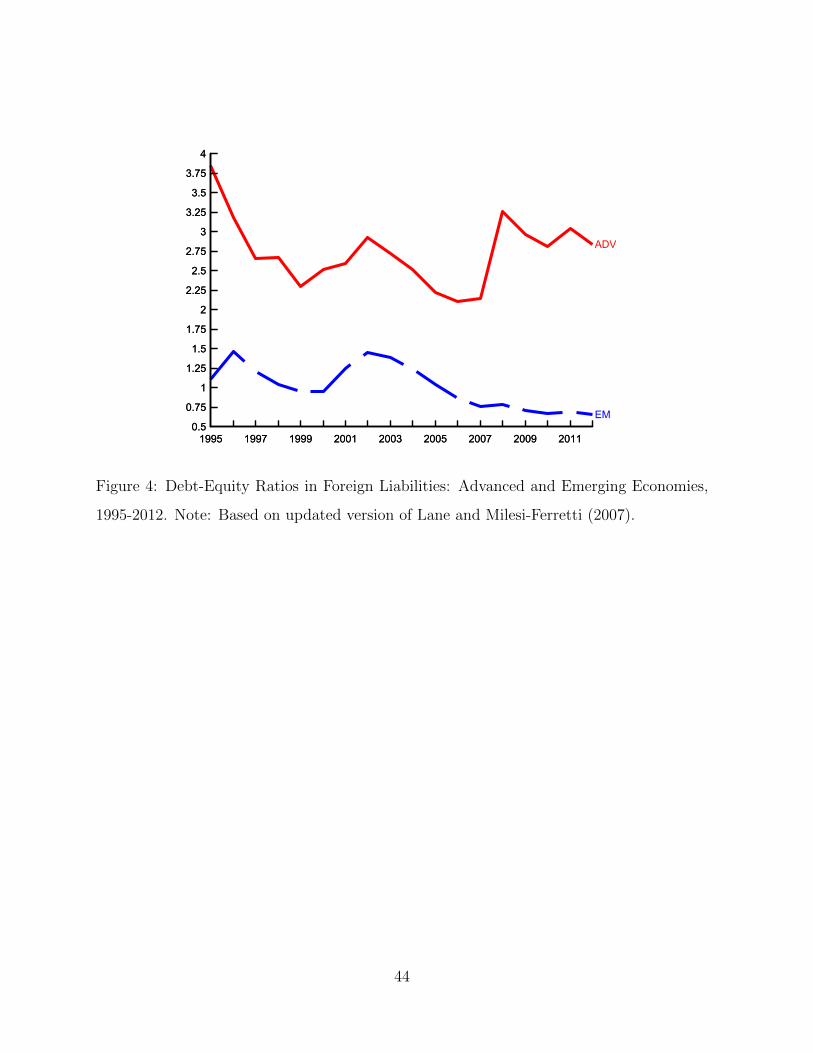
Figure 4: Debt-Equity Ratios in Foreign Liabilities: Advanced and Emerging Economies,
1995-2012. Note: Based on updated version of Lane and Milesi-Ferretti (2007).
44

USA$GBR$
AUT$
BEL$
DNK$
FRA$ DEU$ITA$
NLD$
NOR$SWE$
CHE$CAN$
JPN$EUR$
FIN$GRC$PRT$
ESP$
TUR$
AUS$
NZL$
ISL(8230,114)$
!80$
!60$
!40$
!20$
0$
20$
40$
60$
!120$ !70$ !20$ 30$ 80$ 130$
NET$EQUITY$PC
T$GD
P$
NET$DEBT$(PCT$GDP)$
Figure 5: Net Debt and Net Equity Positions: Advanced, 2007. Note: Ratios to GDP.
Based on updated version of Lane and Milesi-Ferretti (2007).
45

AFG$ALB$
DZA$AGO$
ATG$
ARG$ARM$
ABW$
AZE$
BHS$
BHR$
BGD$
BRB$
BLR$
BLZ$
BEN$BTN$
BOL$BIH$
BWA$
BRA$
BGR$
BFA$BDI$
KHM$CMR$
CPV$
CAF$
TCD$
CHL$CHN$
TWN$
COL$COM$COD$
COG$
CRI$CIV$
HRV$
CYP$
CZE$DJI$
DMA$
DOM$ECU$
EGY$SLV$
GNQ$
ERI$EST$
ETH$
FJI$
GAB$
GMB$
GEO$
GHA$
GRD$
GTM$GIN$
GUY$
HTI$
HND$HUN$IND$IDN$
IRN$IRQ$ISR$
JAM$
JOR$
KAZ$
KEN$ KIR$KOR$ UVK$
KWT$
KGZ$LAO$LVA$
LBN$
LSO$
LBY$
LTU$MAC$
MKD$
MDG$MWI$MYS$MDV$
MLI$
MRT$
MEX$MDA$
MNG$MNE$
MSR$
MAR$MOZ$
MMR$
NAM$NPL$
NIC$
NER$ NGA$OMN$PAK$
PAN$
PNG$PRY$PER$PHL$
POL$
QAT$
ROU$ RUS$
RWA$WSM$
STP$
SAU$
SEN$SRB$
SYC$
SLE$
SVK$
SVN$
SLB$
ZAF$LKA$
KNA$LCA$VCT$
SDN$
SUR$SWZ$SYR$
TJK$TZA$
THA$
TLS$
TGO$
TON$
TTO$TUN$
TKM$UGA$UKR$
ARE$
URY$UZB$
VUT$
VEN$
VNM$
PSE$YEM$
ZMB$
ZWE$
MUS(30,1587)$BRN(5,287)$
GNB$(F191,F14)$
LBR$(12,F352)$
HKG(249,F18)$SGP(221,F12)$
!220$
!170$
!120$
!70$
!20$
30$
80$
130$
F100$ F70$ F40$ F10$ 20$ 50$ 80$ 110$ 140$
NET$DEB
T$PC
T$GD
P$
NET$EQUITY$PCT$GDP$
Figure 6: Net Debt and Net Equity Positions: Emerging Markets, 2007. Note: Ratios to
GDP. Based on updated version of Lane and Milesi-Ferretti (2007).
46

Table 1: Stock-Flow Adjustments in Net International Investment Position: Euro Area
2002-20074NIIP SUMFLOW SFA
Austria -8.2 -10.0 -18.2
Belgium 7.6 -8.6 -1.0
Finland -7.9 -19.4 -27.3
France -4.8 1.1 -3.6
Germany 23.4 -22.3 1.1
Greece -74.1 33.3 -40.8
Ireland -11.5 11.1 -0.4
Italy -19.7 7.2 -12.5
Netherlands 7.7 -28.9 -21.2
Portugal -62.6 33.8 -28.8
Spain -62.0 26.3 -35.7
2007-20114NIIP SUMFLOW SFA
Austria 13.1 -11.9 1.3
Belgium 31.0 3.5 34.5
Finland 38.6 -5.4 33.3
France -18.6 6.9 -11.6
Germany 1.3 -23.0 -21.7
Greece 26.3 45.5 71.8
Ireland -66.4 10.7 -55.6
Italy 3.2 11.5 14.7
Netherlands 36.4 -22.4 13.9
Portugal -8.7 35.5 26.7
Spain -4.8 20.9 16.1
Note: SUMFLOW and SFA refer to cumulative net Önancial áow and stock-áow adjustment term
respectively (ratios to GDP). Source: Based on IMF BOP data and updated version of Lane and
Milesi-Ferretti (2007).35

Table 2: Are Stock-Flow Adjustments Stabilising?
(1) (2) (3) (4) (5) (6)EA EA EA ADV ADV ADV0207 0711 0711 0207 0711 0711
! -15.10*** 6.40 -10.30 -0.15*** 0.003 -0.06(3.90) (8.20) (9.50) (.03) (.07) (.07)
SUMFLOW0207 0.43** 0.19*(.16) (0.10)
SUMFLOW0711 -0.71* 0.89(.32) (-1.20)
SFA0207 -1.35** -0.20(.44) (.37)
R2 0.40 0.24 0.49 0.10 0.09 0.003N 12 12 12 31 31 31
Note: OLS regressions. EA is euro area 12 sample, ADV is 31 country sample of advanced
countries. SFA is stock-áow adjustment, SUMFLOW is cumulative net Önancial áow.
Robust standard errors in parentheses. ***, **, * refer to signiÖcance at 1, 5 and 10
percent levels respectively.
36

International Currency Exposures
• Valuation impact of currency movements • Foreign-currency debt and exchange rate
policies • Shifting exposures over time • Lane and Shambaugh (2010); Benetrix et al
(2013) ! “Financial” exchange rate indices ! Aggregate FX exposures

Aggregate!FX!Exposures!
FXAGG =ω AsA −ω LsL
(sA = A / A + L)
(−1≤ FXAGG ≤1)
NETFX =FXAGG * IFI

0.00#
0.10#
0.20#
0.30#
0.40#
0.50#
0.60#
0.70#
0.80#
0.90#
1.00#
-1.0# -0.8# -0.6# -0.4# -0.2# 0.0# 0.2# 0.4# 0.6# 0.8# 1.0#
1994#
2002#
2007#
2011#
Figure 7: FXAGG Index: Cross-Country Distribution. Note: Drawn from Benetrix and
Lane (2013).
47

Table 3: International Currency Exposures
1994 2002 2007 2011 N
FXAGG
All -0.16 -0.06 0.08 0.08 102
Advanced 0.05 0.05 0.08 0.10 22
Emerging 0.01 0.07 0.23 0.19 28
Developing -0.42 -0.22 0.01 -0.03 52
NETFX
All -0.15 -0.05 0.17 0.14 102
Advanced 0.06 0.18 0.39 0.40 22
Emerging 0.01 0.10 0.35 0.27 28
Developing -0.47 -0.28 0.02 -0.03 52
Note: FXAGG is index of aggregate foreign currency exposure. NETFX is ratio of net
foreign currency assets to GDP. N: number of countries. Based on Benetrix and Lane
(2013).
37
Sectoral Balance Sheets
• Financial Corporates (FC) • Non-Financial Corporates (NFC) • Households (HH) • Government (GOVT) • Rest of World (Linked to IIP) ! [Non-consolidated; consolidated]

0.0#
200.0#
400.0#
600.0#
800.0#
1,000.0#
1,200.0#
2002# 2003# 2004# 2005# 2006# 2007# 2008# 2009# 2010# 2011#
Households# Non8Financial#Corpora@ons# Financial#Corpora@ons# Government##
Figure 10: Sectoral Composition of Financial Assets in the Euro Area, 2002-2011. Source:
Eurostat.
50

0.0#
200.0#
400.0#
600.0#
800.0#
1,000.0#
1,200.0#
2002# 2003# 2004# 2005# 2006# 2007# 2008# 2009# 2010# 2011#
Households# Non8Financial#Corpora@ons# Financial#Corpora@ons# Government##
Figure 11: Sectoral Composition of Financial Liabilities in the Euro Area, 2002-2011.
Source: Eurostat.
51

Net Sectoral Financial Positions
NIIP = NFINAFC + NFINANFC + NFINAHH + NFINAGOVT
SFANIIP = SFAFC + SFANFC + SFAHH + SFAGOVT

Table 4: Stock-Flow Adjustments: Correlation Matrices
HH NFC FC GOVT ROW
2002-2007HH 1.00
NFC -0.55 1.00
FC -0.01 -0.28 1.00
GOVT -0.16 -0.37 0.20 1.00
ROW -0.31 -0.40 -0.30 0.13 1.00
2007-2011
HH 1.00
NFC -0.60 1.00
FC -0.36 0.21 1.00
GOVT -0.55 0.18 0.23 1.00
ROW 0.41 -0.71 -0.75 -0.35 1.00
Note: Pair-wise correlations across stock-áow adjustment terms for each sector. HH: house-
holds; NFC: non-Önancial corporates; FC: Önancial corporates; GOVT: government; ROW:
rest of world. Source: Eurostat.
38

Table 5: Stock-Flow Adjustments: 2002-2007 and 2007-2011
Households -0.10
Non-Financial Corporates -0.55
Financial Corporates -0.50
Government -0.23
Rest of World -0.68
Note: Correlation in stock-áow adjustment terms for 2002-2007 and 2007-2011 for each
sector.
39
Financial Sector
• Net aggregate position typically small • Large intra-sectoral positions • Asset-side risks; Liability-side risks • Growth in cross-border financial linkages;
global liquidity as a driver of balance sheet growth
• Role of foreign-owned banks • Non-bank funding sources; Non-bank
intermediation

1995 1997 1999 2001 2003 2005 2007 2009 2011 20130
5
10
15
20
25
Banks
Non-Banks
Figure 8: External Assets of BIS-Reporting Banks, 1995.1-2013.2. Note: Based on Ta-
ble 1 of BIS Locational Banking Statistics. Banks and Non-Banks refer to sector of the
counterparties.
48

2003 2004 2005 2006 2007 2008 2009 2010 2011 2012 2013 2014020406080100120140160180200220240260280300320340360380400
ALL
Domestically-ActiveIrish-HQ
Figure 9: Foreign Liabilities of Irish Banks, 2003.1 to 2013.2. Note: Expressed as ra-
tios to GDP. ALL: Irish-resident banks; Domestically-Active: substantial lending to Irish
counterparties; Irish-HQ: banks headquartered in Ireland. Source: Central Bank of Ireland.
49

Non-Financial Corporates
! Exporters versus domestic firms ! Foreign-owned firms versus locally-owned
firms ! Construction sector (correlated with HH
sector) ! Firm size distribution ! Sources of non-bank funding

Households
! Net HH wealth and consumption dynamics ! Non-financial assets (housing) ! Present value of future earnings ! Variation in composition of financial assets ! Variation in household debt ! Cross-sectoral implications of HH debt relief

0"
10"
20"
30"
40"
50"
60"
70"
80"
90"
100"
�Germany"" France" Ireland" Greece" Spain" Italy" �Portugal"
Bonds" Equity" ITR*" Deposits*"
Figure 12: Composition of Household Financial Assets, 2007. Note: Bonds denotes ”se-
curities other than shares” category; ITR denotes ”insurance technical reserves” category;
Deposits* includes residual ”other receivables” category in addition to ”deposits” category.
Source: Eurostat.
52

The Government Balance Sheet
• Comprehensive view of government balance sheet (financial assets; contingent liabilities; implicit liabilities)
! Consolidation with central bank ! Present value of future tax revenues • Public balance sheet and crisis management
(bailouts) • Cross-sectoral impact of sovereign default risk
(banks, households, NFCs, ROW)

Table 6: Impact of Financial Crisis on Government Balance Sheets: Euro Area
2009 2010 2011 2012
Assets (e billions) 211 387 349 362
Loans 26 25 29 46
Securities other than shares 80 296 223 216
Equity 105 116 97 100
Liabilities (e billions)
Loans 39 245 212 191
Securities other then shares 182 224 242 336
Contingent Liabilities (e billions)
Guarantees 691 473 491 490
Securities issued under liquidity schemes 5 8 3 3
Special Purpose Entities 78 99 83 86
Assets (%GDP) 2.4 4.2 3.7 3.8
Liabilities (%GDP) 2.5 5.1 4.8 5.5
Contingent Liabilities (%GDP) 8.7 6.3 6.1 6.1
Note: Source is Eurostat (2013).
40

Conclusions
• Risk analysis of balance sheets: opportunities and pitfalls
• Net positions; inter-sectoral and intra-sectoral cross-holdings; role of valuation channel
• Data gaps: ultimate beneficial ownership; sub-sectoral disaggregation
• Stronger theoretical foundations (difficult – nonlinearities; interconnections)


![2017 First Quarter Pillar 3 Report - nab.com.au · Credit Risk Exposures Section 4 Credit Risk Exposures Total and Average Credit Risk Exposures [APS 330 Attachment C, Table 4a] This](https://img.pdfslide.net/doc/110x75/5bb90f7109d3f2930f8d8a9b/2017-first-quarter-pillar-3-report-nabcomau-credit-risk-exposures-section.jpg)