Embed Size (px)
Citation preview
Page | 1
Risk-Informed Decision Making for Flood Risk Assessment and
Management
Bin Wang, P.E., CFM
Daniel Stapleton, P.E.
GZA GeoEnvironmental, Inc.
June 21, 2018
Page | 2
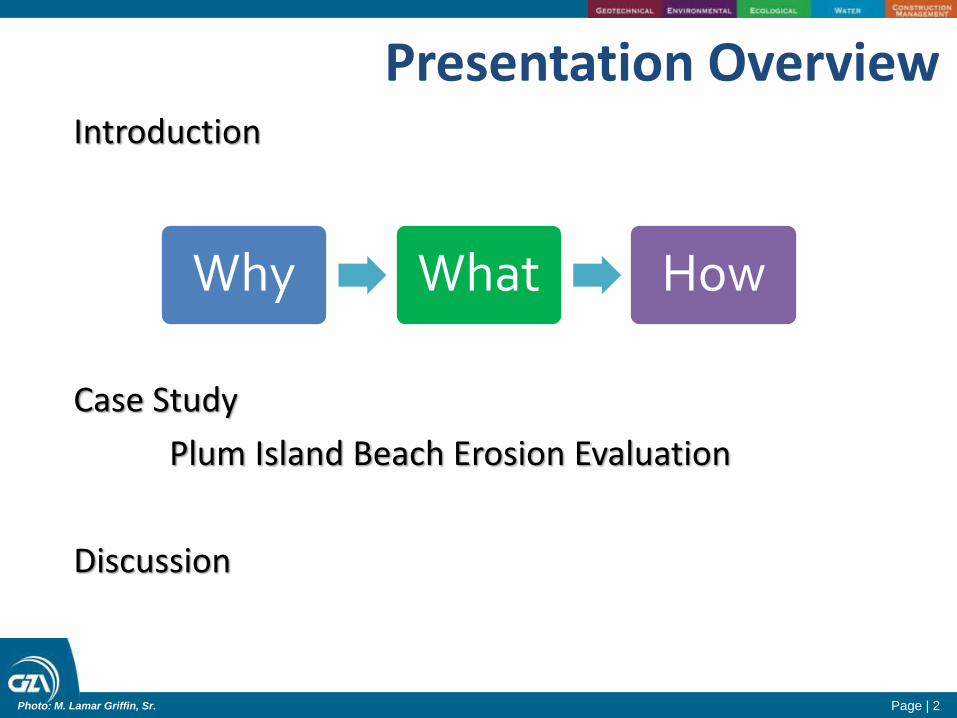
Presentation OverviewIntroduction
Case Study
Plum Island Beach Erosion Evaluation
Discussion
Photo: M. Lamar Griffin, Sr.
Why What How
Page | 3
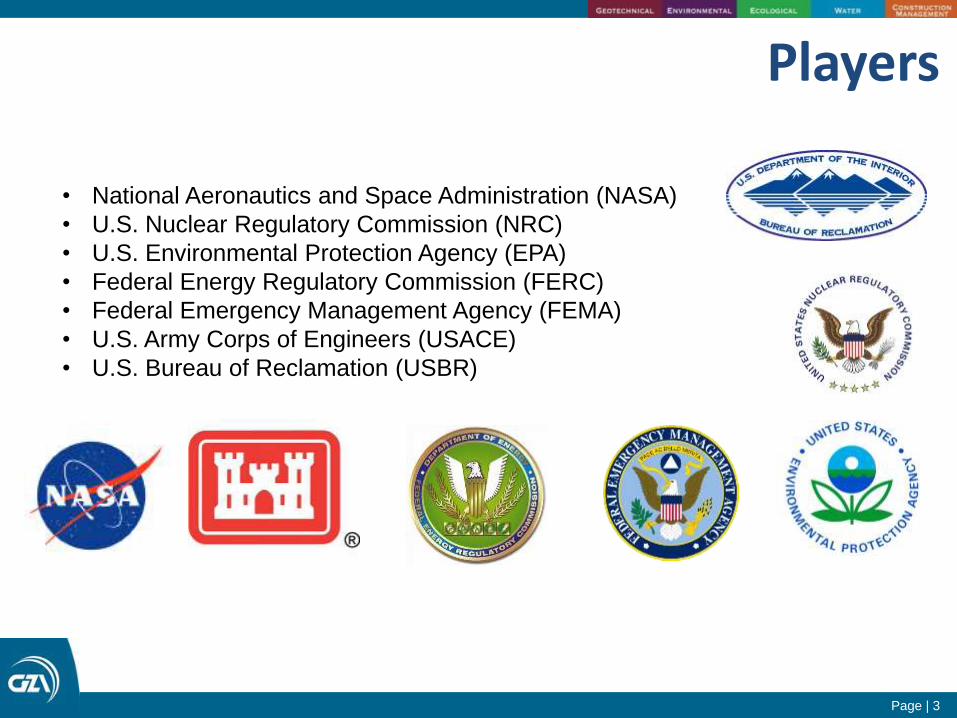
• National Aeronautics and Space Administration (NASA)
• U.S. Nuclear Regulatory Commission (NRC)
• U.S. Environmental Protection Agency (EPA)
• Federal Energy Regulatory Commission (FERC)
• Federal Emergency Management Agency (FEMA)
• U.S. Army Corps of Engineers (USACE)
• U.S. Bureau of Reclamation (USBR)
Players
Page | 4
Page | 5
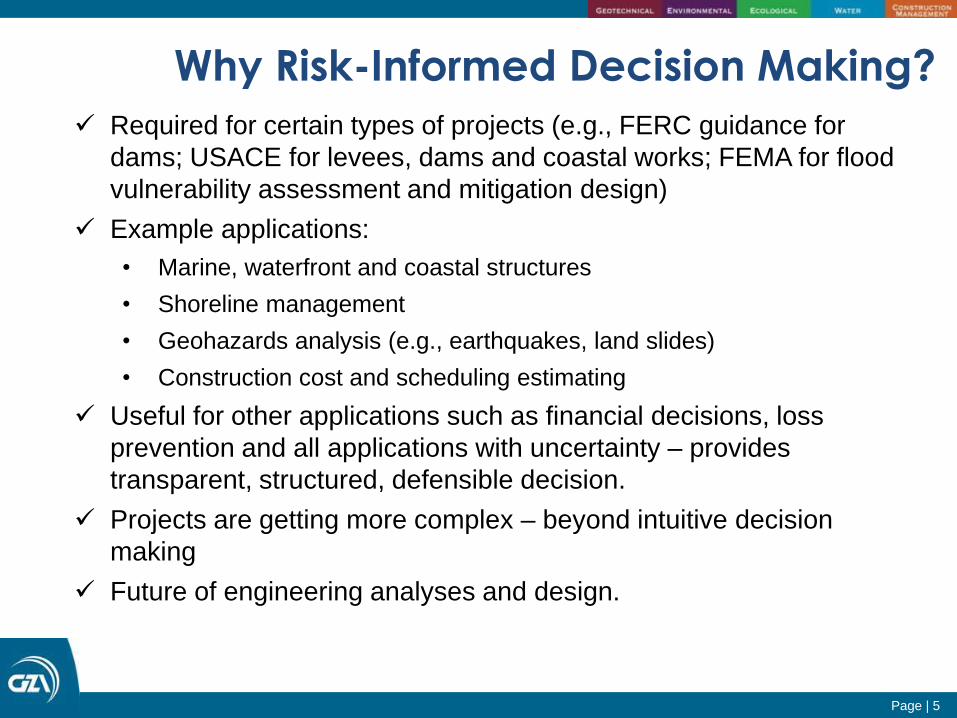
Required for certain types of projects (e.g., FERC guidance for
dams; USACE for levees, dams and coastal works; FEMA for flood
vulnerability assessment and mitigation design)
Example applications:
• Marine, waterfront and coastal structures
• Shoreline management
• Geohazards analysis (e.g., earthquakes, land slides)
• Construction cost and scheduling estimating
Useful for other applications such as financial decisions, loss
prevention and all applications with uncertainty – provides
transparent, structured, defensible decision.
Projects are getting more complex – beyond intuitive decision
making
Future of engineering analyses and design.
Why Risk-Informed Decision Making?
Page | 6
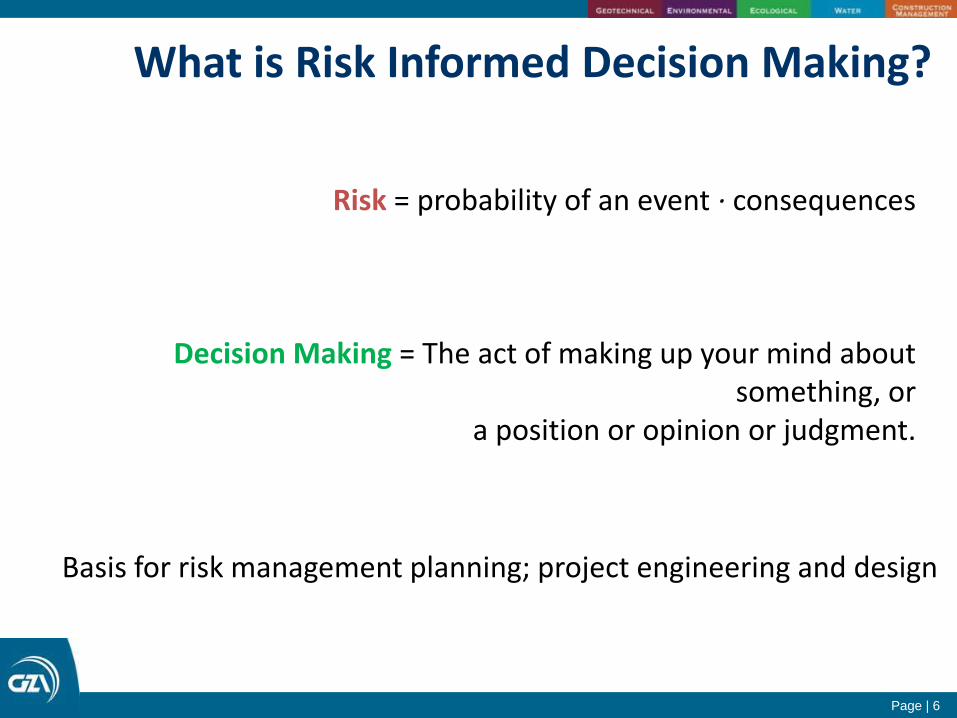
What is Risk Informed Decision Making?
Risk = probability of an event ∙ consequences
Decision Making = The act of making up your mind about something, or
a position or opinion or judgment.
Basis for risk management planning; project engineering and design
Page | 7
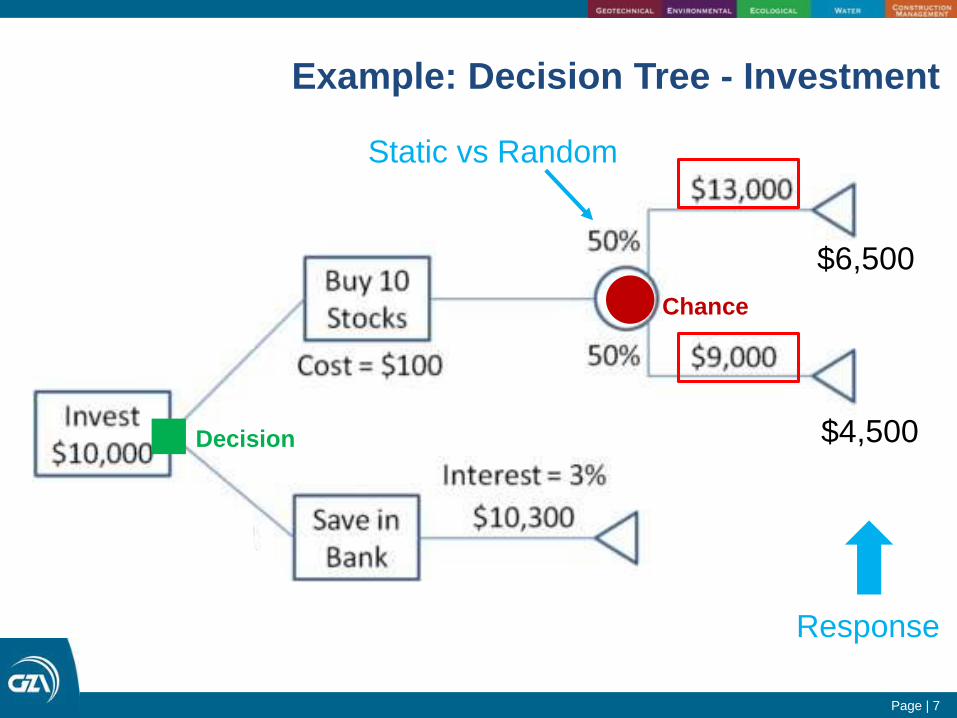
Example: Decision Tree - Investment
$6,500
$4,500Decision
Chance
Response
Static vs Random
Page | 8
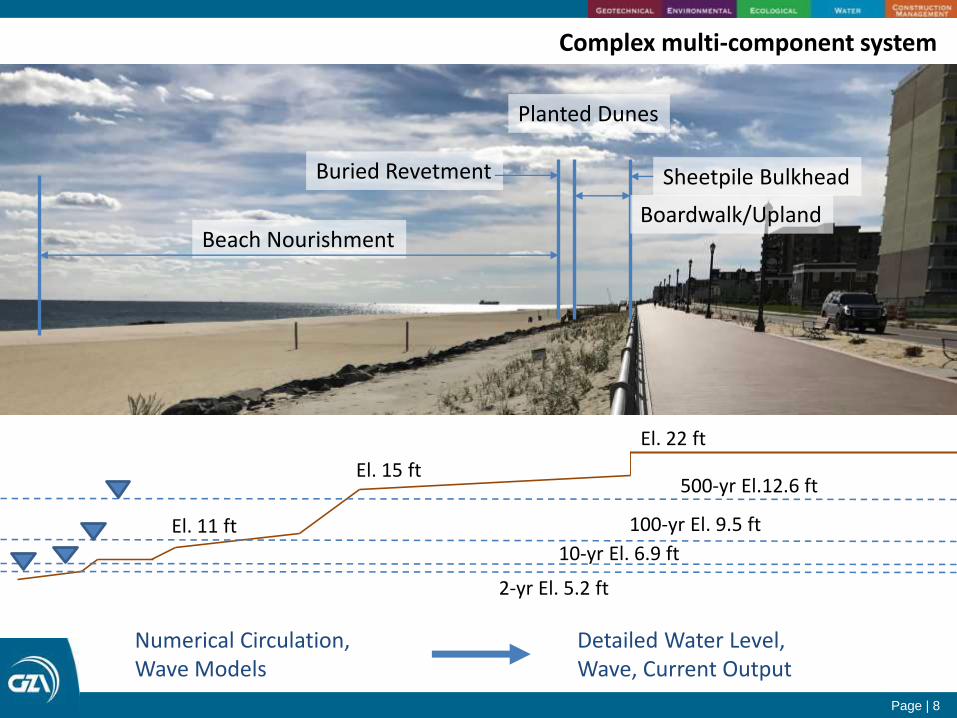
Beach Nourishment
Buried Revetment
Planted Dunes
Sheetpile Bulkhead
Boardwalk/Upland
Complex multi-component system
El. 22 ft
El. 15 ft
El. 11 ft
500-yr El.12.6 ft
100-yr El. 9.5 ft
10-yr El. 6.9 ft
2-yr El. 5.2 ft
Numerical Circulation, Wave Models
Detailed Water Level, Wave, Current Output
Page | 9
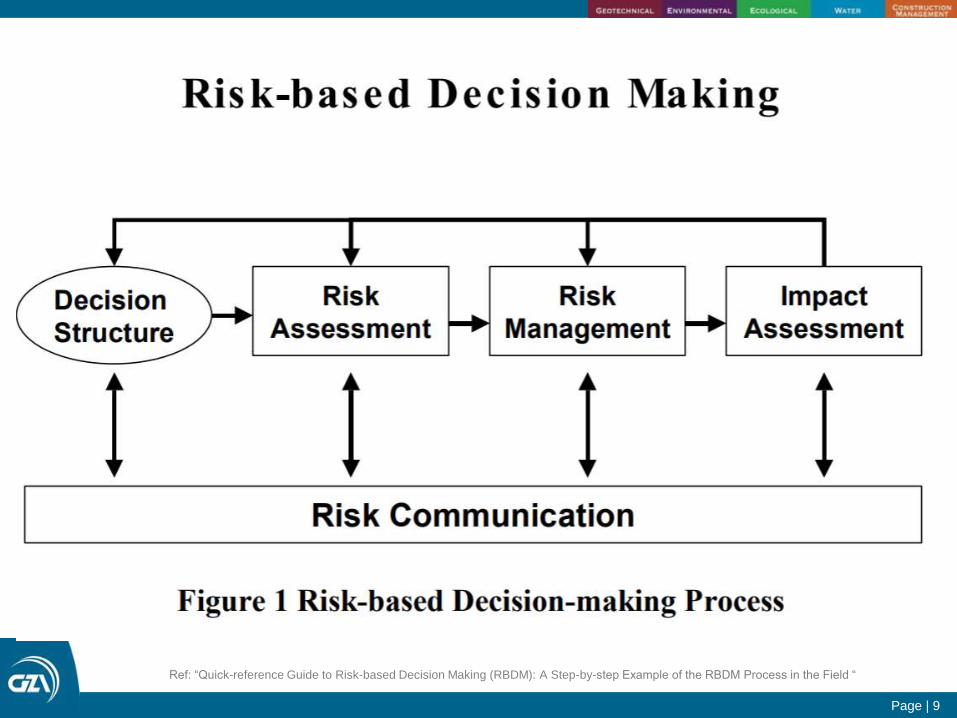
Ref: “Quick-reference Guide to Risk-based Decision Making (RBDM): A Step-by-step Example of the RBDM Process in the Field “
Page | 10
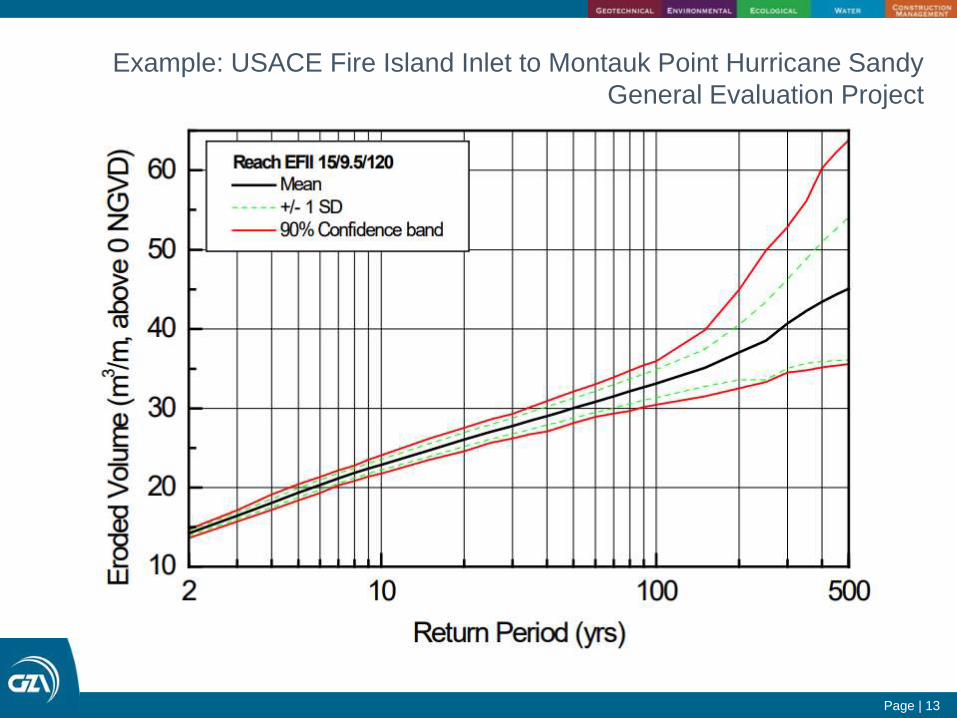
Example: USACE Fire Island Inlet to Montauk Point Hurricane Sandy
General Evaluation Project
Page | 11
Example: USACE Fire Island Inlet to Montauk Point Hurricane Sandy
General Evaluation Project
Page | 12
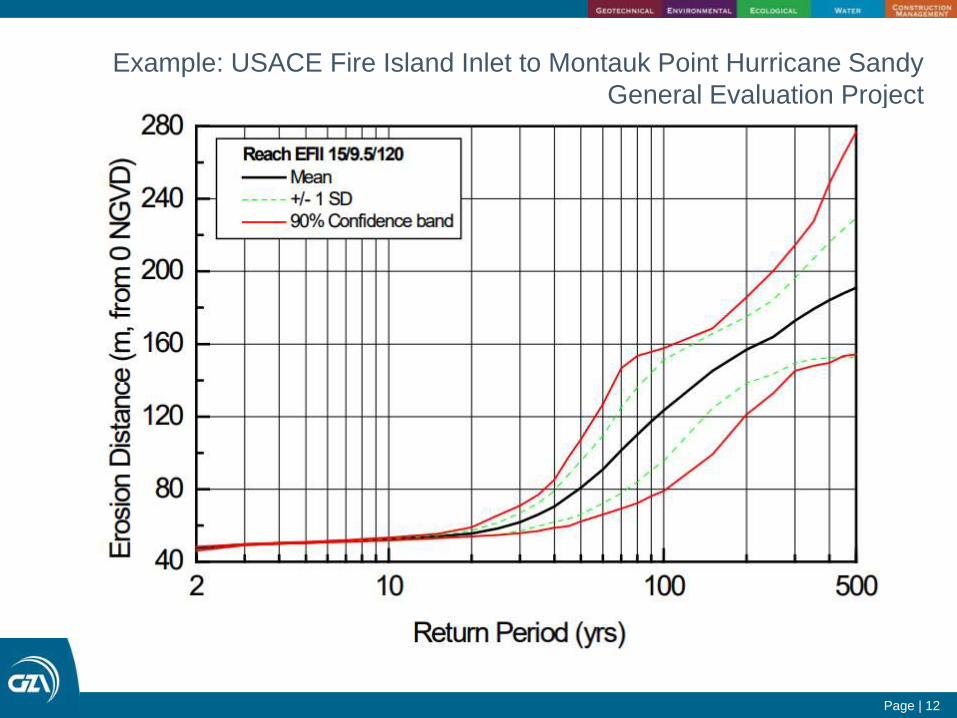
Example: USACE Fire Island Inlet to Montauk Point Hurricane Sandy
General Evaluation Project
Page | 13
Example: USACE Fire Island Inlet to Montauk Point Hurricane Sandy
General Evaluation Project
Page | 14
Case Study
Plum Island Beach Erosion
Page | 15
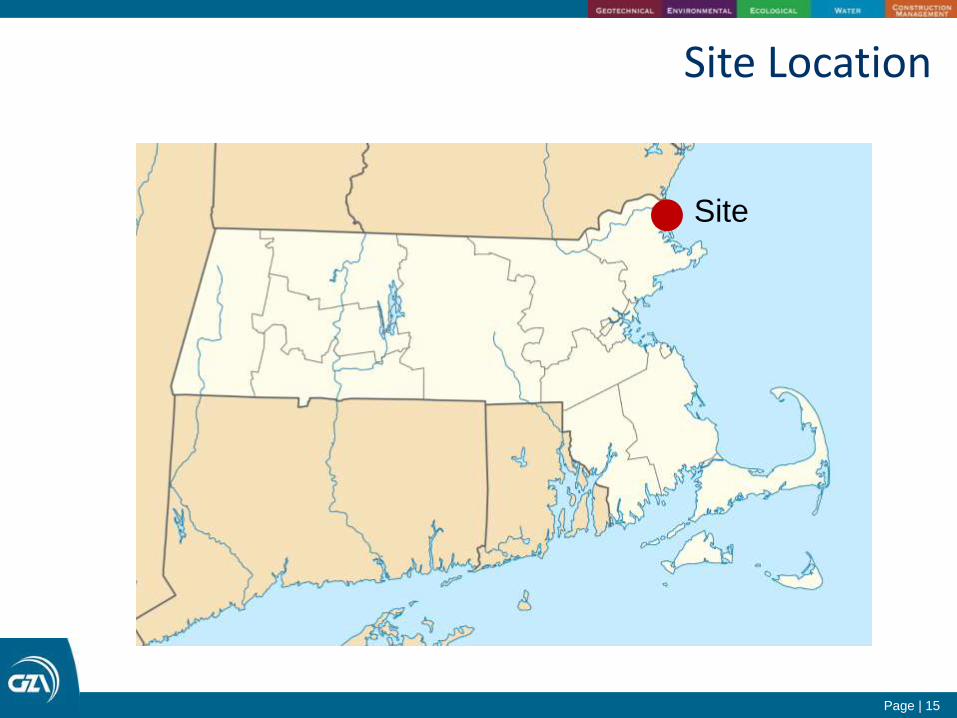
Site
Site Location
Page | 16
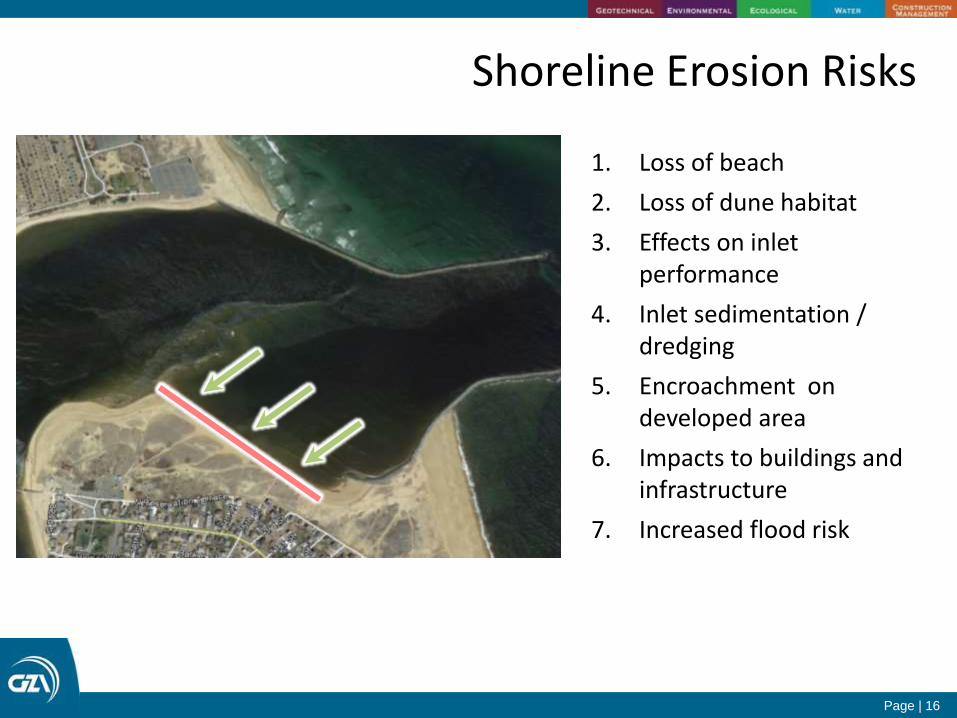
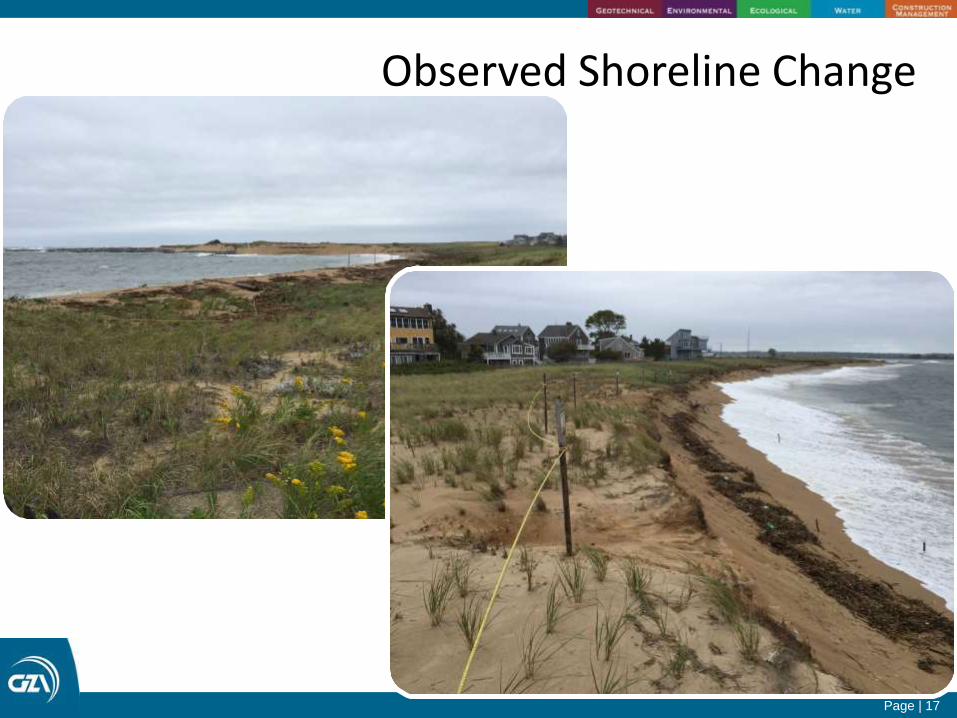
1. Loss of beach
2. Loss of dune habitat
3. Effects on inlet performance
4. Inlet sedimentation / dredging
5. Encroachment on developed area
6. Impacts to buildings and infrastructure
7. Increased flood risk
Shoreline Erosion Risks
Page | 17
Observed Shoreline Change
Page | 18
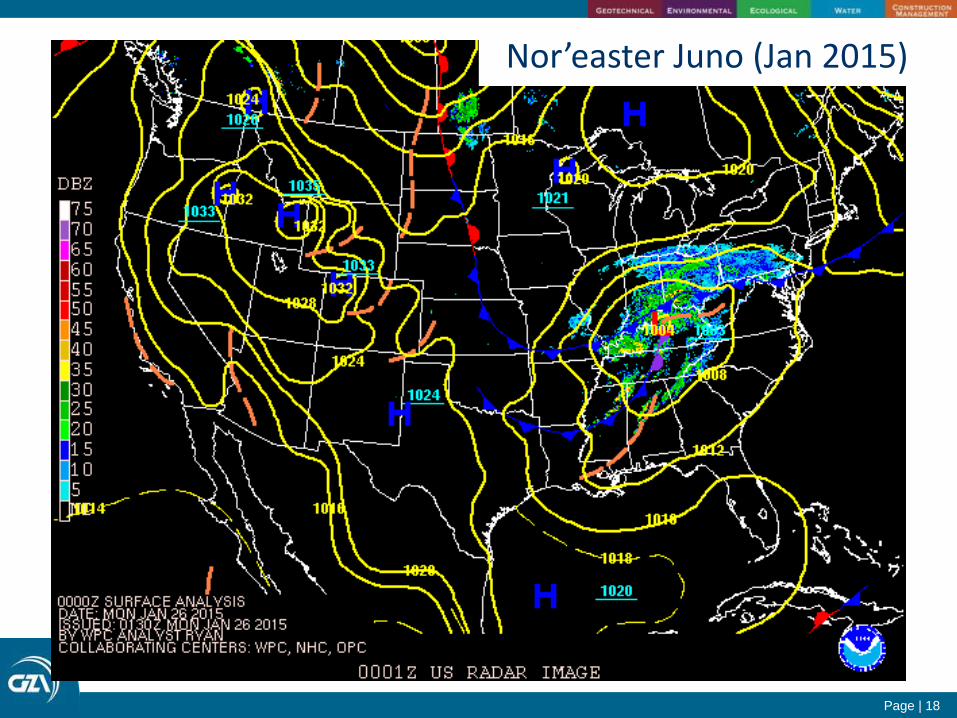
Nor’easter Juno (Jan 2015)
Page | 19
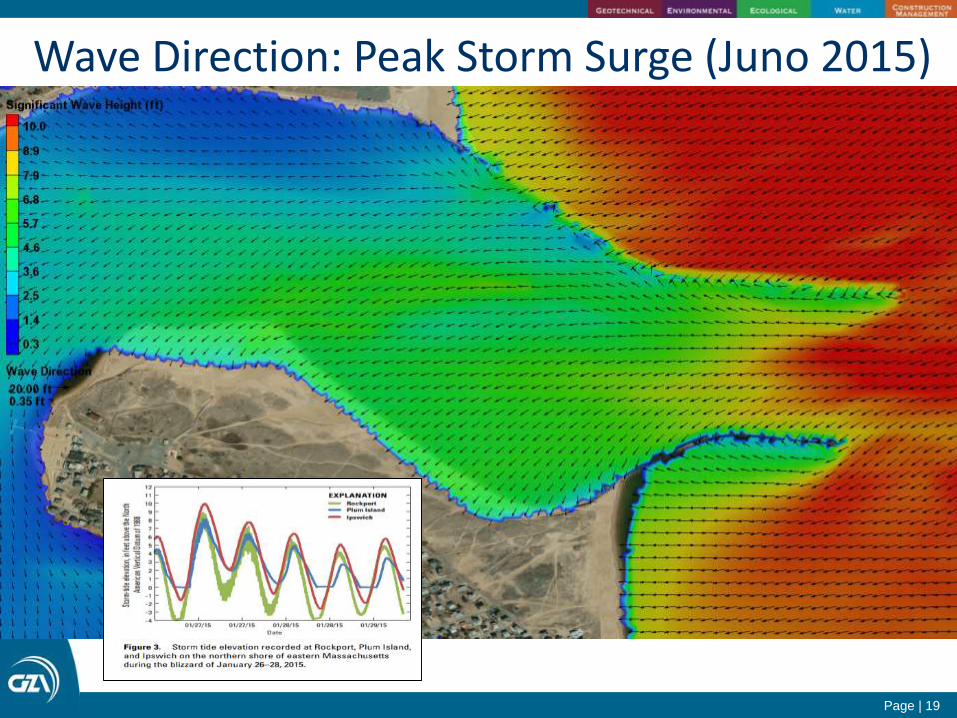
Wave Direction: Peak Storm Surge (Juno 2015)
Page | 20
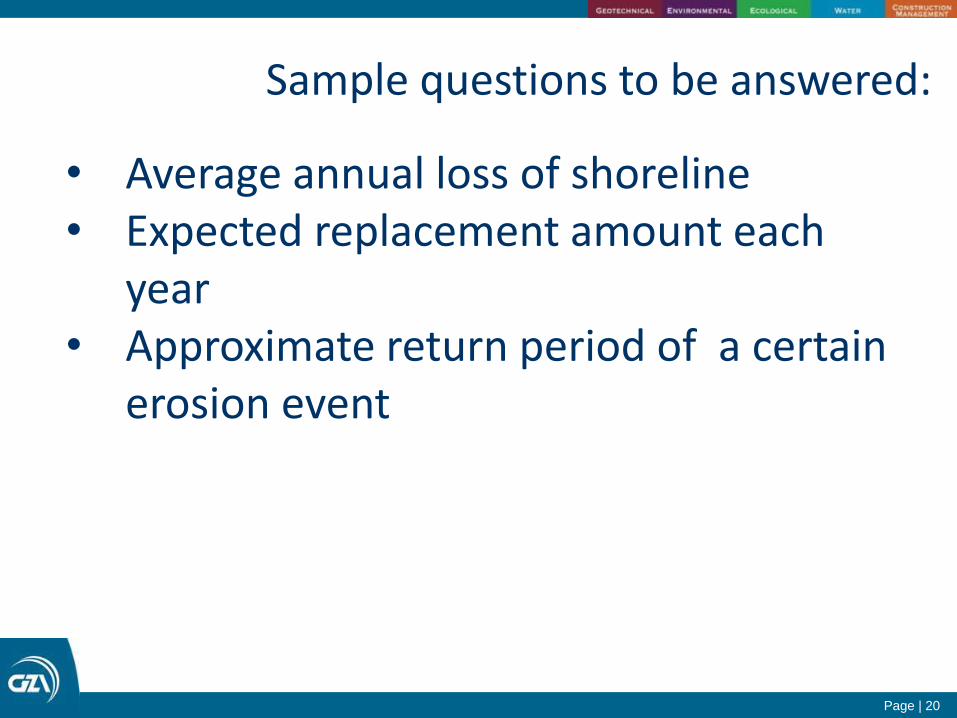
Sample questions to be answered:
• Average annual loss of shoreline• Expected replacement amount each
year• Approximate return period of a certain
erosion event
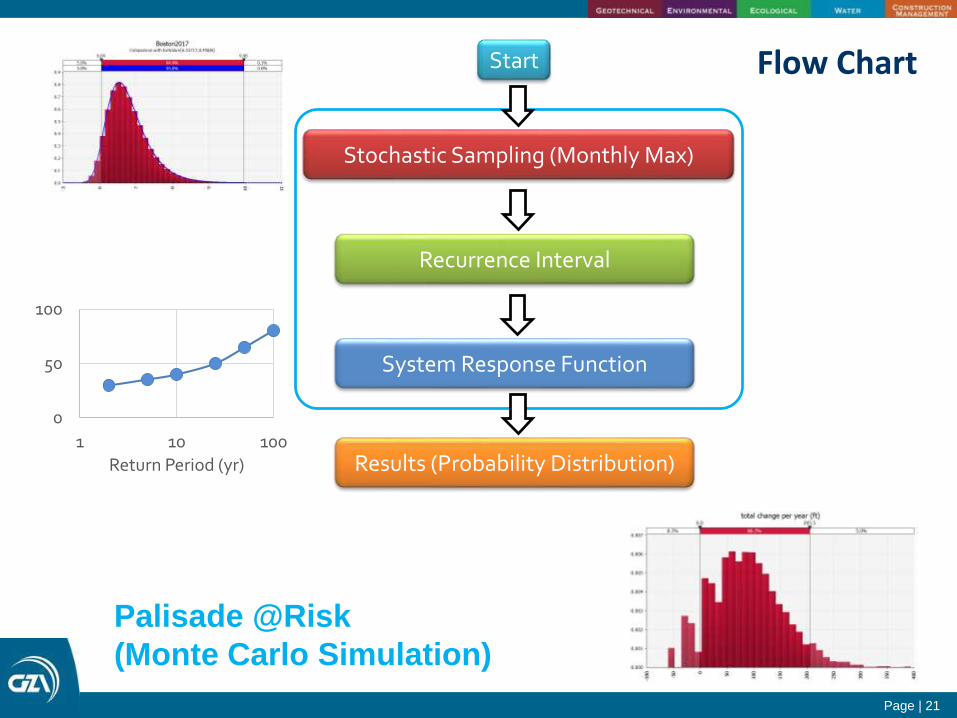
Page | 21
Start
Recurrence Interval
Stochastic Sampling (Monthly Max)
System Response Function
Results (Probability Distribution)
0
50
100
1 10 100Return Period (yr)
Palisade @Risk
(Monte Carlo Simulation)
Flow Chart
Page | 22
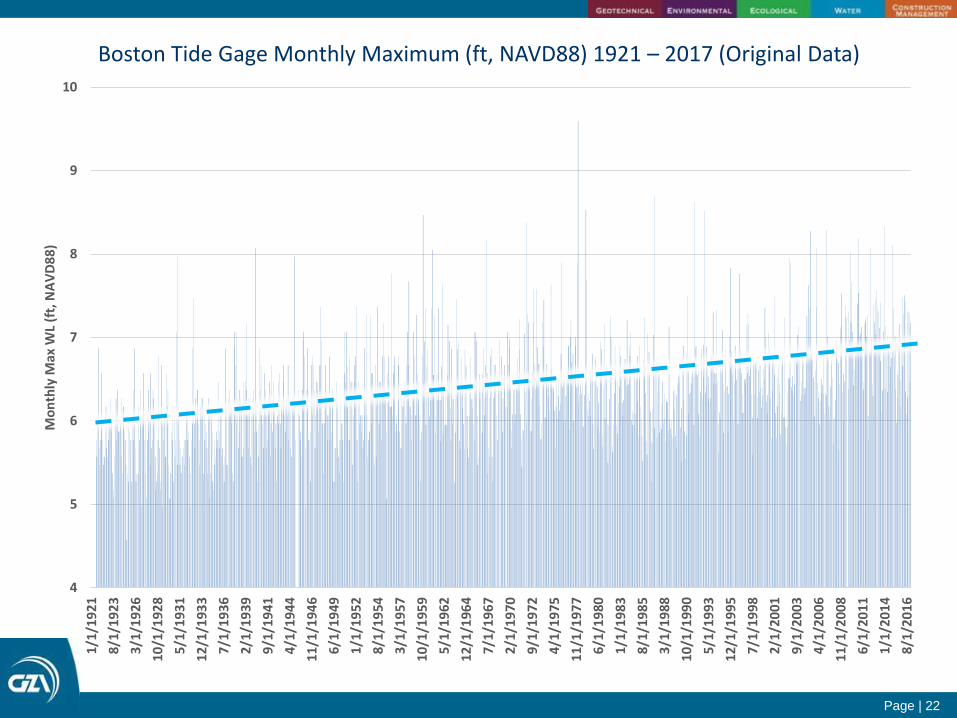
Boston Tide Gage Monthly Maximum (ft, NAVD88) 1921 – 2017 (Original Data)
4
5
6
7
8
9
101/
1/1
921
8/1/
19
23
3/1/
19
26
10/1
/192
8
5/1/
19
31
12/1
/193
3
7/1/
193
6
2/1/
19
39
9/1/
19
41
4/1/
19
44
11/1
/194
6
6/1/
19
49
1/1/
19
52
8/1/
19
54
3/1/
19
57
10/1
/195
9
5/1/
19
62
12/1
/196
4
7/1/
19
67
2/1/
19
70
9/1/
19
72
4/1/
19
75
11/1
/197
7
6/1/
19
80
1/1/
19
83
8/1/
19
85
3/1/
19
88
10/1
/199
0
5/1/
19
93
12/1
/19
95
7/1/
19
98
2/1/
20
01
9/1/
20
03
4/1/
20
06
11/1
/200
8
6/1/
20
11
1/1/
20
14
8/1/
20
16
Mo
nth
ly M
ax W
L (f
t, N
AV
D8
8)
Page | 23
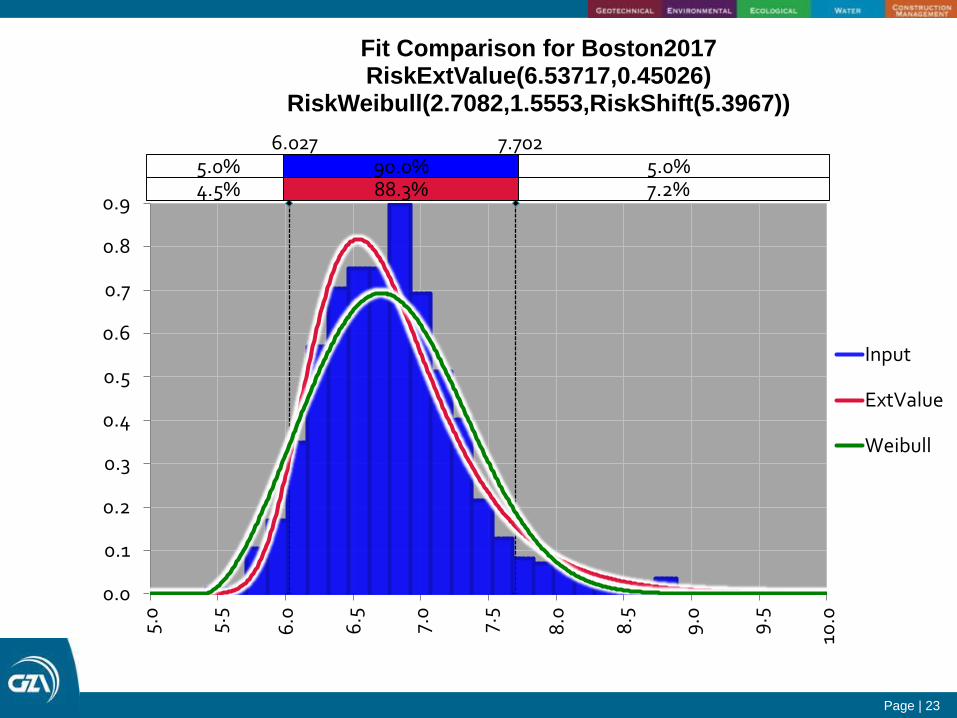
6.027 7.7025.0% 5.0%90.0%4.5% 7.2%88.3%
0.0
0.1
0.2
0.3
0.4
0.5
0.6
0.7
0.8
0.9
5.0
5.5
6.0 6.5 7.0
7.5
8.0 8.5
9.0 9.5
10.0
Fit Comparison for Boston2017RiskExtValue(6.53717,0.45026)
RiskWeibull(2.7082,1.5553,RiskShift(5.3967))
Input
ExtValue
Weibull
Page | 24
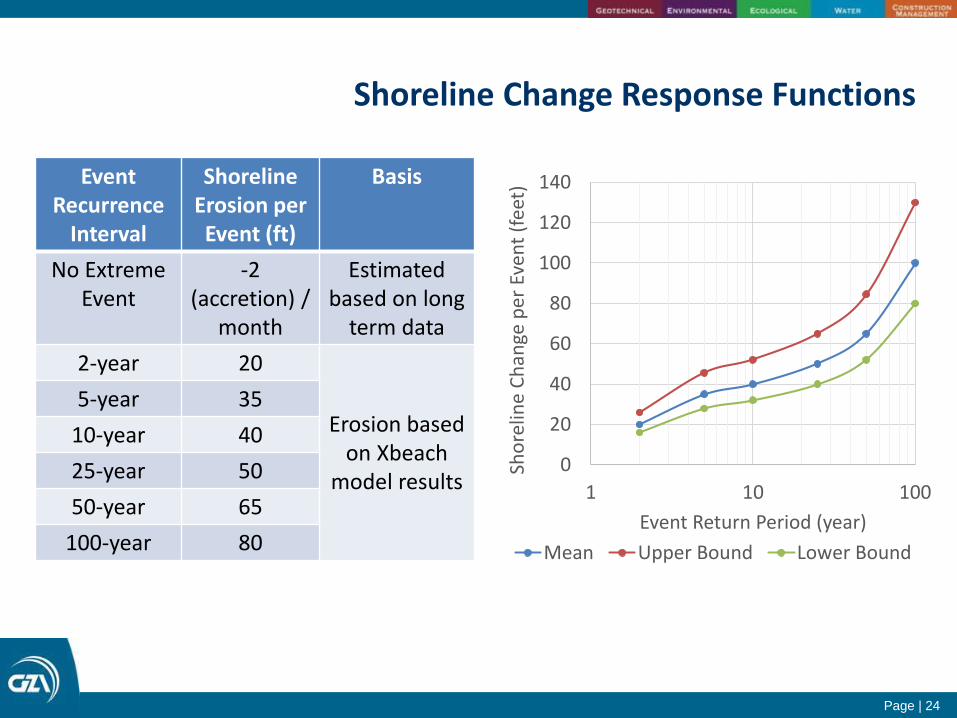
Shoreline Change Response Functions
Event Recurrence
Interval
Shoreline Erosion per Event (ft)
Basis
No Extreme Event
-2 (accretion) /
month
Estimated based on long
term data
2-year 20
Erosion based on Xbeach
model results
5-year 35
10-year 40
25-year 50
50-year 65
100-year 80
0
20
40
60
80
100
120
140
1 10 100Sh
ore
line
Ch
ange
per
Eve
nt
(fee
t)Event Return Period (year)
Mean Upper Bound Lower Bound
Page | 25
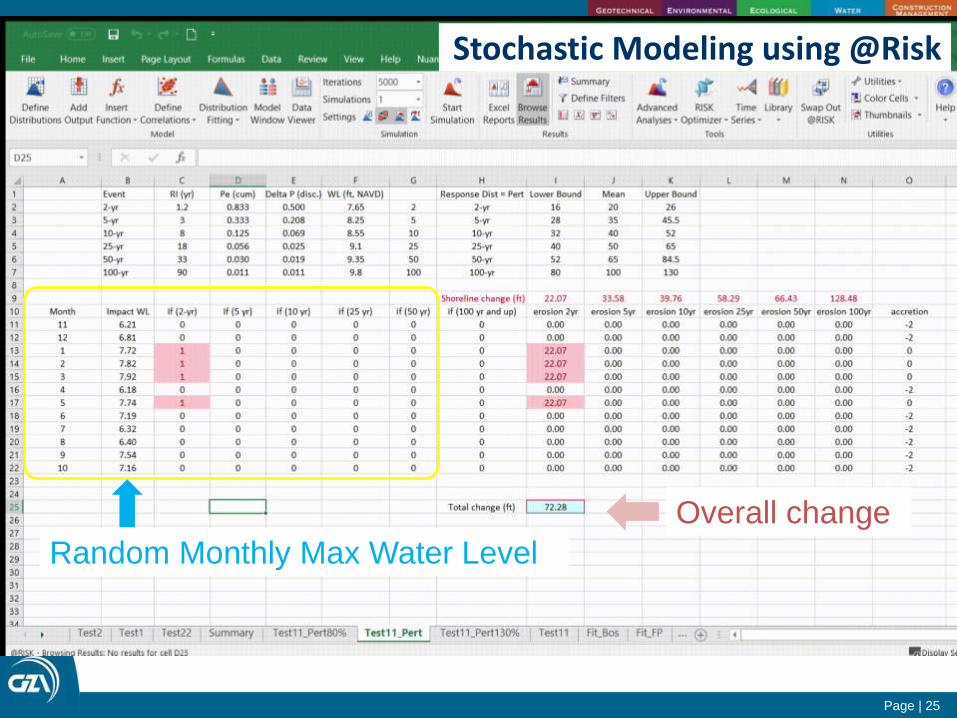
Stochastic Modeling using @Risk
Random Monthly Max Water Level
Overall change
Page | 26
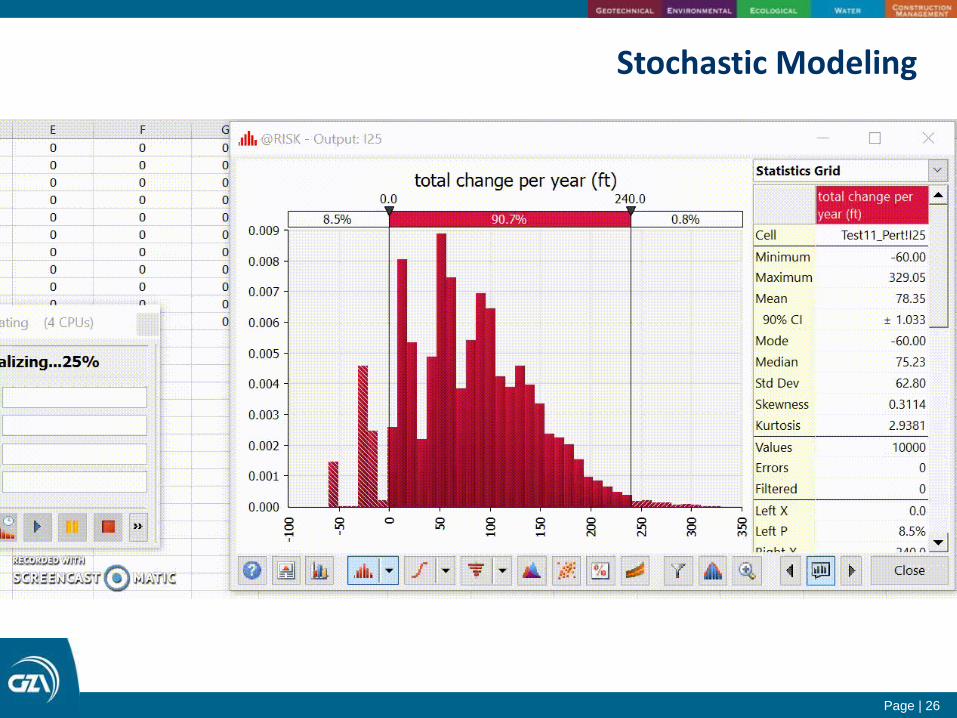
Stochastic Modeling
Page | 27
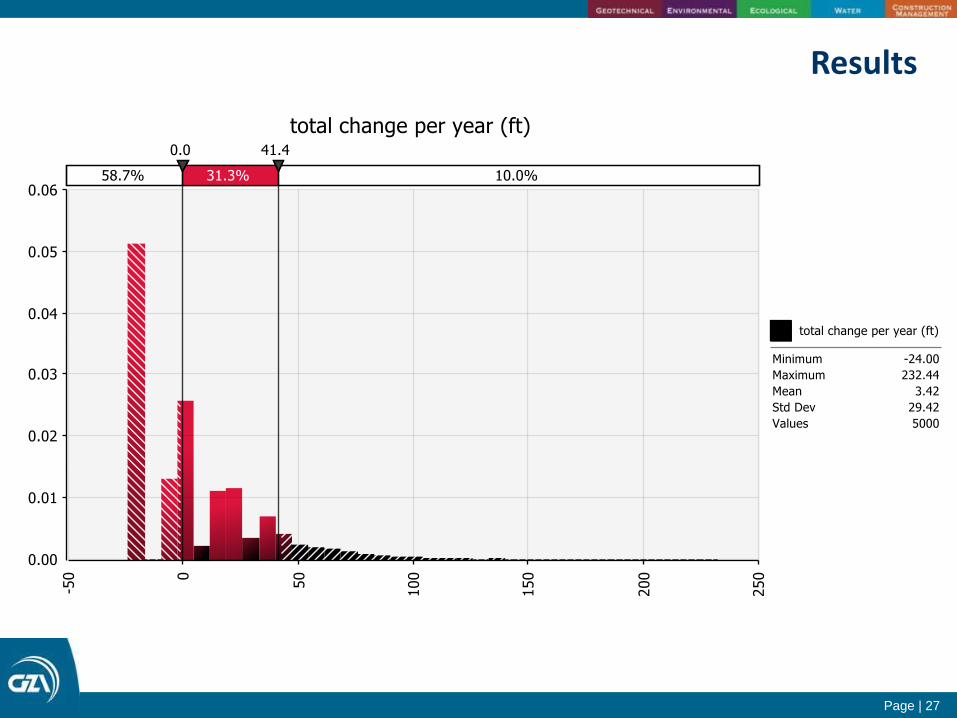
Results
Page | 28
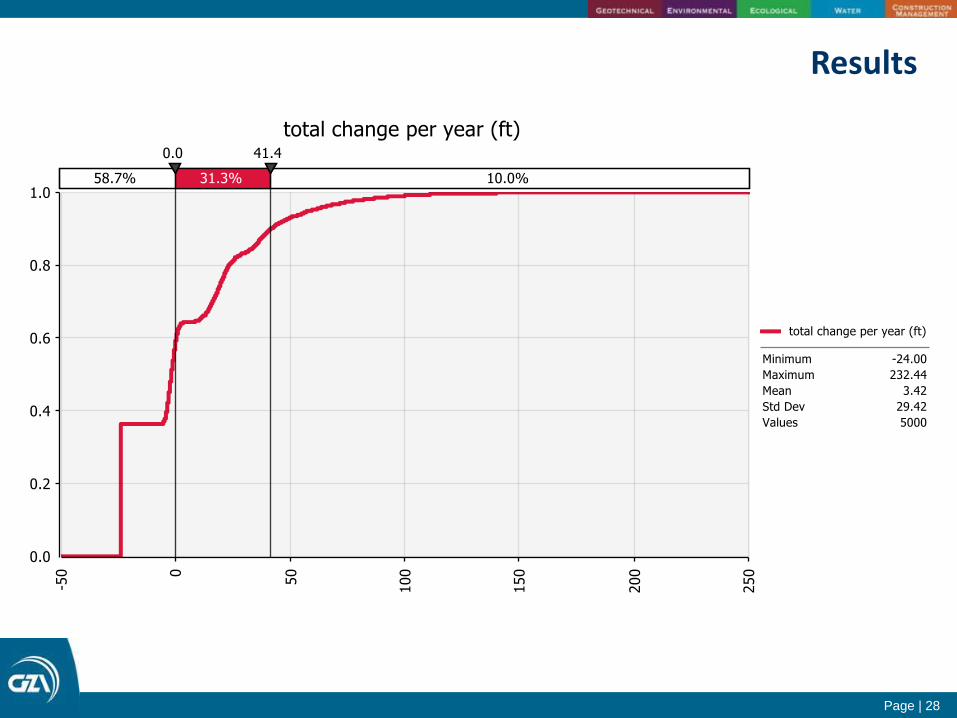
Results
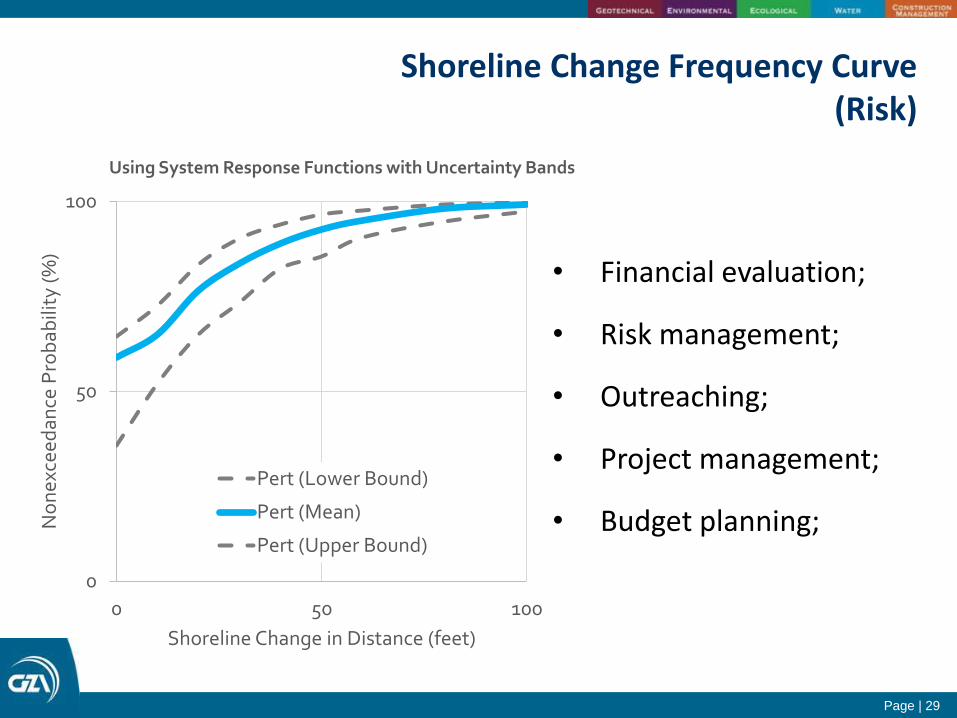
Page | 29
0
50
100
0 50 100
No
nex
ceed
ance
Pro
bab
ility
(%
)
Shoreline Change in Distance (feet)
Using System Response Functions with Uncertainty Bands
Pert (Lower Bound)
Pert (Mean)
Pert (Upper Bound)
Shoreline Change Frequency Curve(Risk)
• Financial evaluation;
• Risk management;
• Outreaching;
• Project management;
• Budget planning;
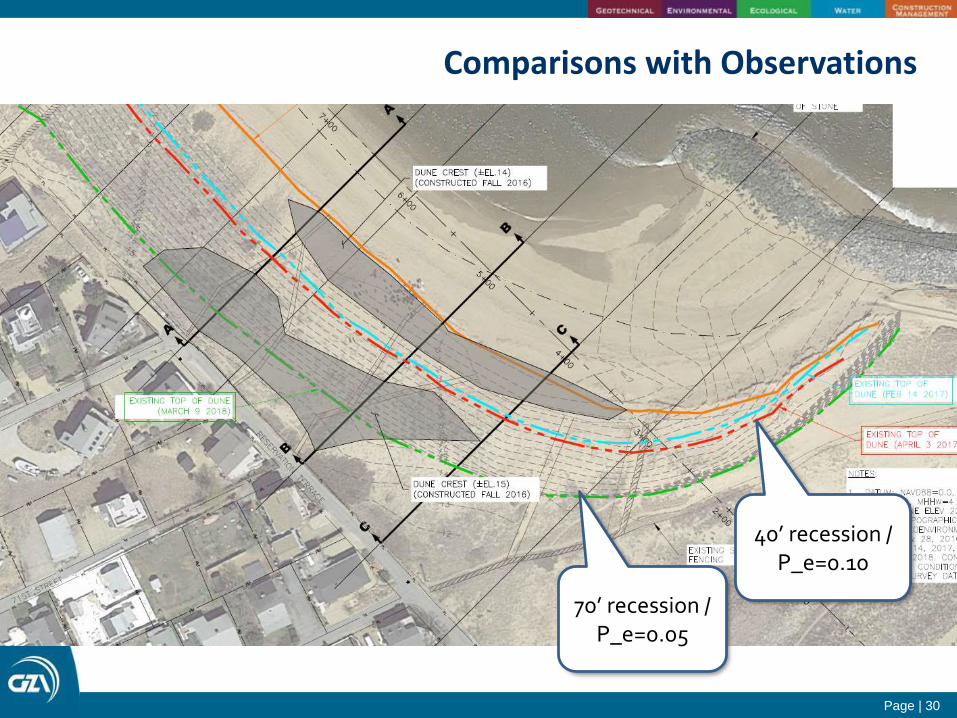
Page | 30
Comparisons with Observations
70’ recession / P_e=0.05
40’ recession / P_e=0.10
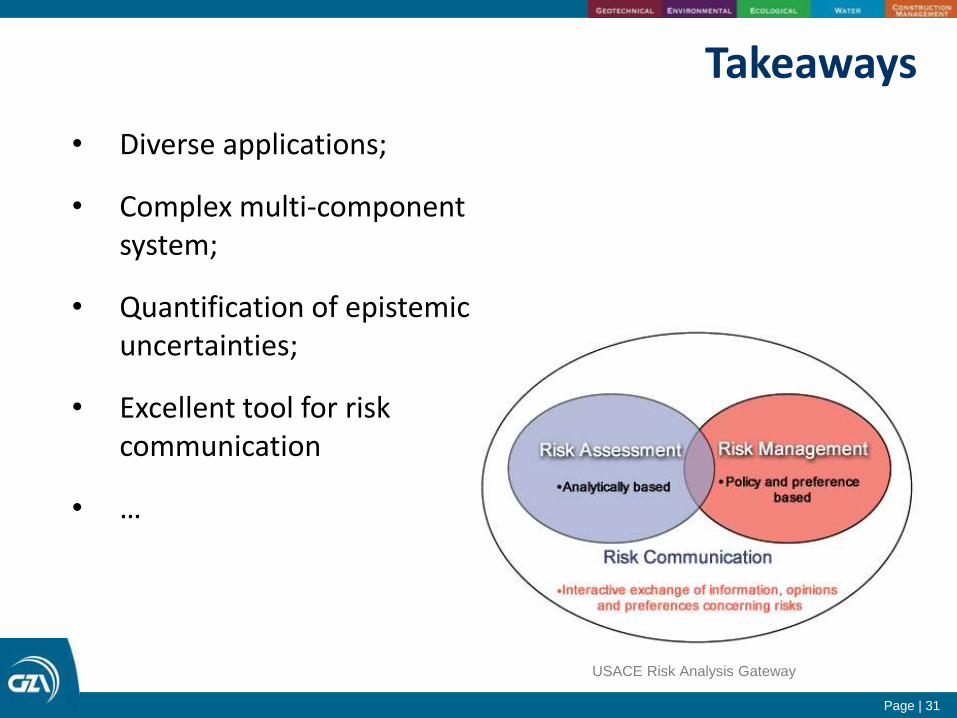
Page | 31
USACE Risk Analysis Gateway
Takeaways
• Diverse applications;
• Complex multi-component system;
• Quantification of epistemic uncertainties;
• Excellent tool for risk communication
• …
Page | 32
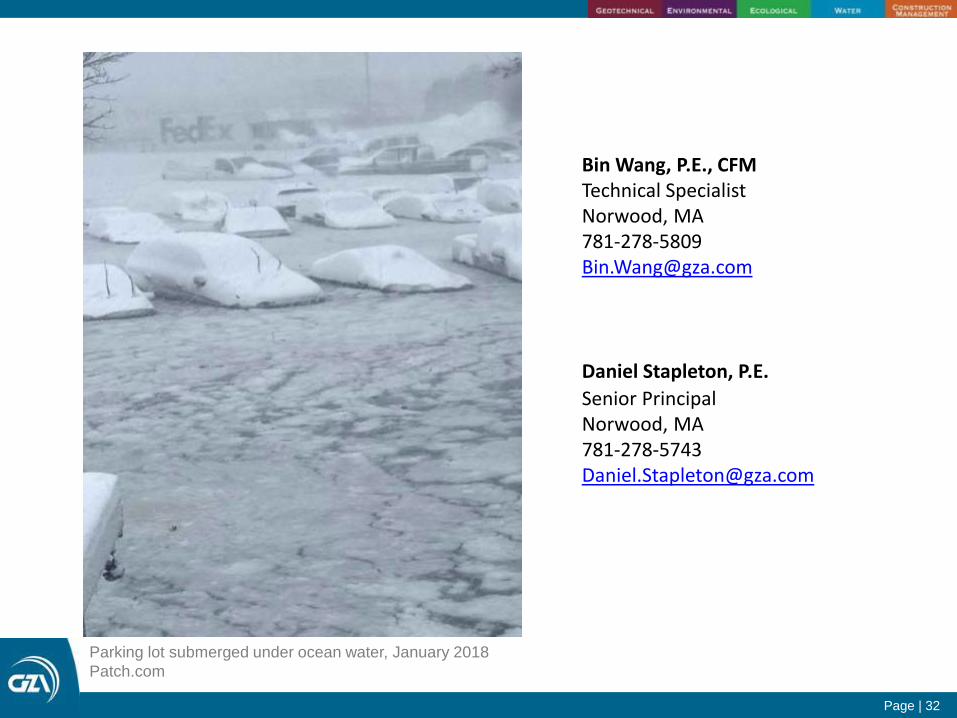
Parking lot submerged under ocean water, January 2018
Patch.com
Bin Wang, P.E., CFMTechnical SpecialistNorwood, MA [email protected]
Daniel Stapleton, P.E.
Senior PrincipalNorwood, MA [email protected]