Embed Size (px)
Citation preview
Economic Modernization through Efficient Reforms and Governance Enhancement (EMERGE) Unit 2003, 139 Corporate Center, 139 Valero St., Salcedo Village, Makati City 1227, Philippines
Tel. No. (632) 752 0881 Fax No. (632) 752 2225
Technical Report
RISK MANAGEMENT DIAGNOSTIC REPORT: THE BUREAU OF CUSTOMS by the Center for Economic Policy Research Team
Prepared for
Bureau of Customs Department of Finance
Republic of the Philippines Submitted for review to USAID/Philippines OEDG
December 13, 2005
Preface
This report is the result of technical assistance provided by the Economic Modernization through Efficient Reforms and Governance Enhancement (EMERGE) Activity, under contract with the CARANA Corporation, Nathan Associates Inc. and The Peoples Group (TRG) to the United States Agency for International Development, Manila, Philippines (USAID/Philippines) (Contract No. AFP-I-00-00-03-00020 Delivery Order 800). The EMERGE Activity is intended to contribute towards the Government of the Republic of the Philippines (GRP) Medium Term Philippine Development Plan (MTPDP) and USAID/Philippines’ Strategic Objective 2, “Investment Climate Less Constrained by Corruption and Poor Governance.” The purpose of the activity is to provide technical assistance to support economic policy reforms that will cause sustainable economic growth and enhance the competitiveness of the Philippine economy by augmenting the efforts of Philippine pro-reform partners and stakeholders. This technical report was written by a team of consultants fielded by the Center for Economic Policy Research (CEPR) composed of Bienvenido P. Alano, Trade Economist, Team Leader, Maria Fe Esperanza V. Madamba, Customs Specialist, Atty. Alex M. Gaticales, Legal Expert, Felicitacion R. Geluz, Institutional Expert, Januario C. Aliwalas, Systems Integrator, Edmund C. Guamen, Systems Specialist, Myrna C. Rillera, Skills Development Specialist, John M. Dowling, Organizational Development Specialist, Agaton O Uvero, Audit Compliance Expert, and Joel P. Grenas, Audit Compliance Specialist. The task was requested by letter from Customs Commissioner George M. Jereos to USAID Mission Director Michael J. Yates dated October 27, 2004, and again by letter from his replacement, Customs Commissioner Alberto D. Lina, to Dr. Robert Wuertz, Chief, USAID Office of Economic Development and Governance (OEDG), dated March 28, 2005. The views expressed and opinions contained in this publication are those of the authors and are not necessarily those of USAID, the GRP, EMERGE or the latter’s parent organizations.
RISK MANAGEMENT DIAGNOSTIC REPORT:
THE BUREAU OF CUSTOMS∗
by the CEPR Team
Bienvenido P. Alano, Trade Economist, Team Leader, Maria Fe Esperanza V. Madamba, Customs Specialist Atty. Alex M. Gaticales, Legal Expert Felicitacion R. Geluz, Institutional Expert Januario C. Aliwalas, Systems Integrator Edmund C. Guamen, Systems Specialist Myrna C. Rillera, Skills Development Specialist John M. Dowling, Organizational Development Specialist Agaton O Uvero, Audit Compliance Expert Joel P. Grenas, Audit Compliance Specialist
13 December 2005 Manila,Philippines
∗ A study conducted under the auspices of the USAID-EMERGE project
1
TABLE OF CONTENTS
Introduction 4 Objectives 4 Review of Best Practices 5
Theory and Concepts 5 The WCO Risk Management Guide 8 Case Studies 9 The Australia n Customs Service (ACS) 9 Canadian Customs Revenue Agency 12 US Department Of Homeland Security 13 Swedish Customs 15
Methodology 16 Analysis 16
The Current Risk Management System 23
Conclusion 30 Recommendations 32
Post Entry Audit 34 The Super Green Lane 37
Impact on Transaction Costs and Corruption 41
2
List of Charts Chart 1 . Control and Facilitation Trade-offs 5 Chart 2 . Value Drivers in trade transactions 6 Chart 3. Enabling Strategies 7 Chart 4. The Management Pyramid 8 Chart 5. The Risk Management Cycle 8 Chart 6. The Australian Customs Service 10 Chart 7. Risk Management Cycle, Treasury Board of Canada 12 Chart 8. The US Department of Homeland Security 14 Chart 9. Organizational Chart of the Bureau of Customs 18 Chart 10 Organizational Chart, Port of Manila 19 Chart 11, Organizational Chart, NAIA 20 Chart 12, Organizational Chart, MICP 20 Chart 13. The Assessment System 22 Chart 14. Proposed BOC Risk Management System 32 Chart 15. Functional Organization, PEAG 36 Chart 16 Organizational Structure of the SGL Committee 39 List of Tables Table 1. Description of steps in the Risk Management Cycle 9 Table 2 Risk Management Actions 9 Table 3. The Assessment System vs. the WCO RM Guide 26 Table 4 Port Operations Systems vs. the WCO RM Guide 27 Table 5. CIIS Systems vs. the WCO RM Guide 28 Table 6. BOC vs. the WCO RM Guide 29
3
RISK MANAGEMENT DIAGNOSTIC REPORT: THE BUREAU OF CUSTOMS
I. INTRODUCTION
The US Department of Homeland Security estimates that in 2005, some 40 million merchandise shipments were processed, doubling from the mid 1990s. With static resources, Customs is able to examine only about 1% of inbound cargo.
Canada’s trade volumes had been growing 20% over a decade from 8.4 million in 1986 to 10.1 million in 1996, and estimated at 13.6 million entries by 2003.
The rapidly changing environment, characterized by remarkable increases in the trade volumes and advances in technology has exerted tremendous pressure on manpower productivity in customs administration, and occasioned a shift from the traditional “gatekeeper” strategies towards a balance between regulatory control and trade facilitation. This has provided the impetus for the adoption of risk management strategies for more efficient use of scarce resources. The need for resource efficiency in customs administration is more acute in developing countries like the Philippines where resources are more severely constrained and government revenue agencies like the Bureau of Customs (BOC) seem hopelessly caught in a vicious cycle of operating resource scarcity and revenue shortfalls. The problem is aggravated if the agency operates in an environment where corruption dominates, partly as a result of unrealistically low government wage rates, as in the case of the BOC.
II. OBJECTIVES The objectives of this study are:
- To undertake a literature review of global best practices - To make a general evaluation, using an analytical framework based on best practice
concepts and global implementation experience, of the BOC’s capacity and performance in managing the various risks, particularly tax and duty evasion as well as non-compliance with customs laws, rules and regulations.
- To analyze the current organizational and resource capability of the various units under the Bureau responsible for managing these risks but with a special focus on the Super Green Lane (SGL) and Post Entry Audit (PEA) programs.
- To gather information on the various operations of these units which are important in
understanding the overall degree of exposure to revenue and regulatory risks of the Bureau and identify an effective strategy for managing the risks associated with the SGL and customs post entry audit functions.
4
III. REVIEW OF BEST PRACTICES
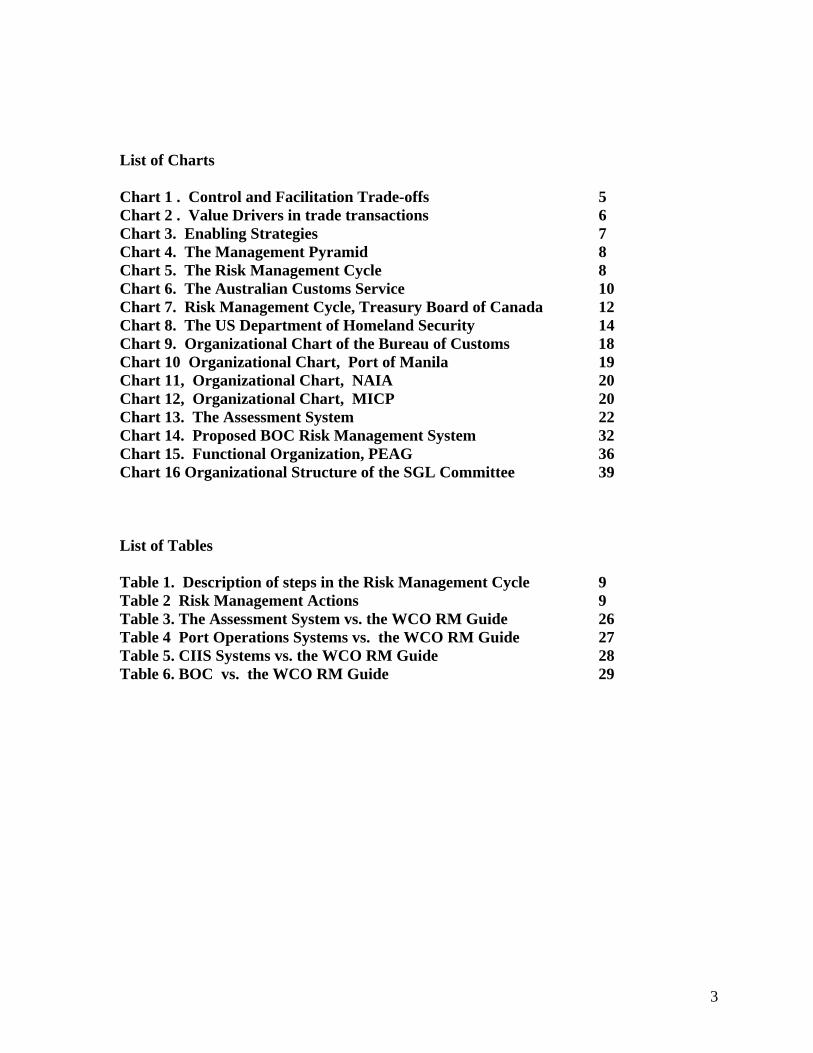
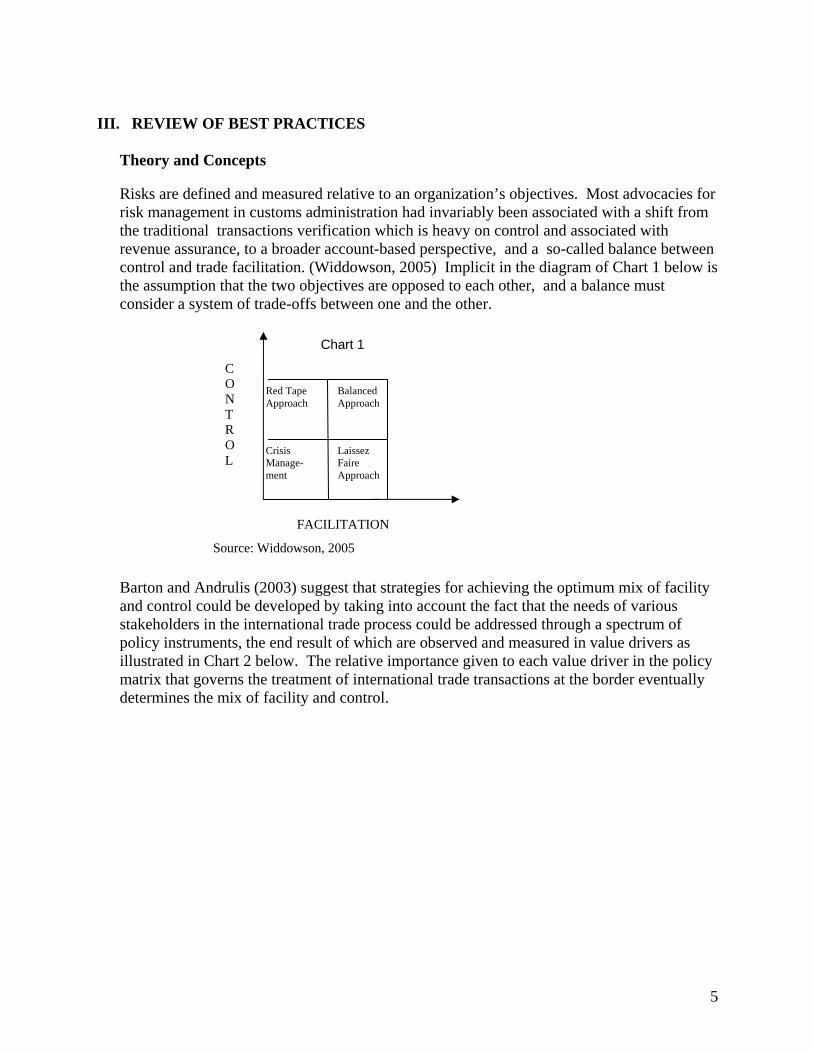
Theory and Concepts Risks are defined and measured relative to an organization’s objectives. Most advocacies for risk management in customs administration had invariably been associated with a shift from the traditional transactions verification which is heavy on control and associated with revenue assurance, to a broader account-based perspective, and a so-called balance between control and trade facilitation. (Widdowson, 2005) Implicit in the diagram of Chart 1 below is the assumption that the two objectives are opposed to each other, and a balance must consider a system of trade-offs between one and the other.
Chart 1
C O Balanced
Approach Red Tape
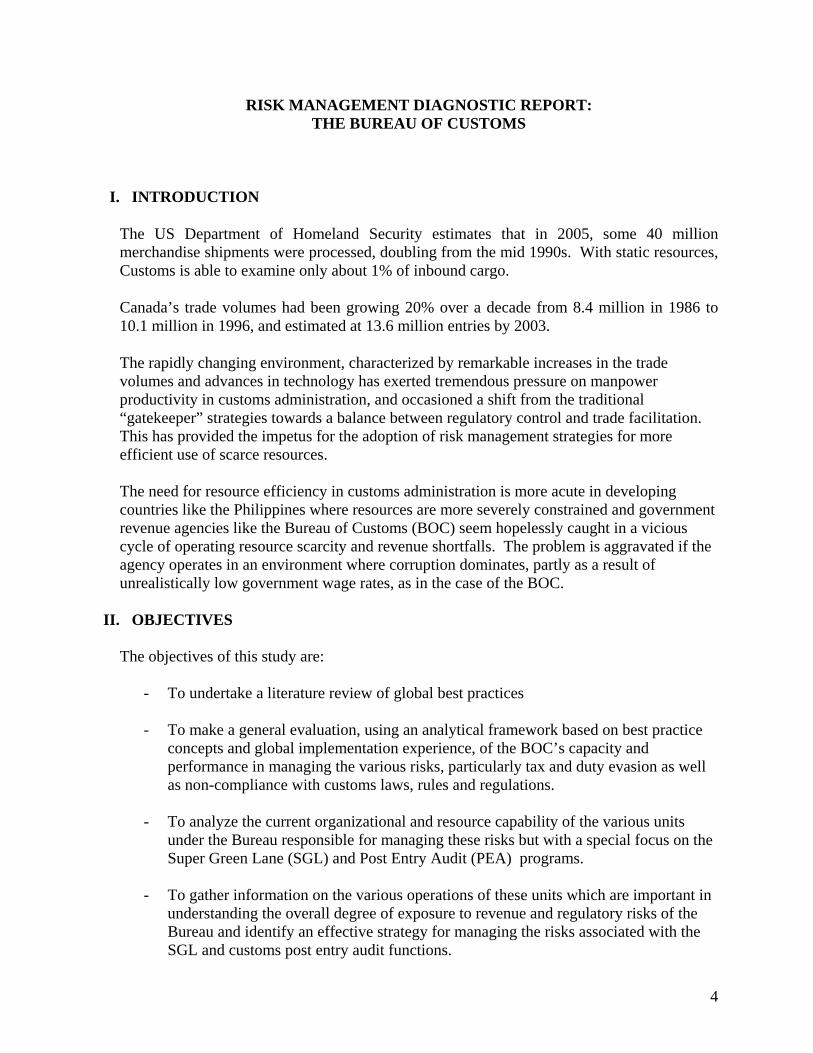
Barton and Andrulis (2003) suggest that strategies for achieving the optimum mix of facility and control could be developed by taking into account the fact that the needs of various stakeholders in the international trade process could be addressed through a spectrum of policy instruments, the end result of which are observed and measured in value drivers as illustrated in Chart 2 below. The relative importance given to each value driver in the policy matrix that governs the treatment of international trade transactions at the border eventually determines the mix of facility and control.
Crisis Manage-ment
Laissez Faire Approach
Approach N T R O L
FACILITATION
Source: Widdowson, 2005
5
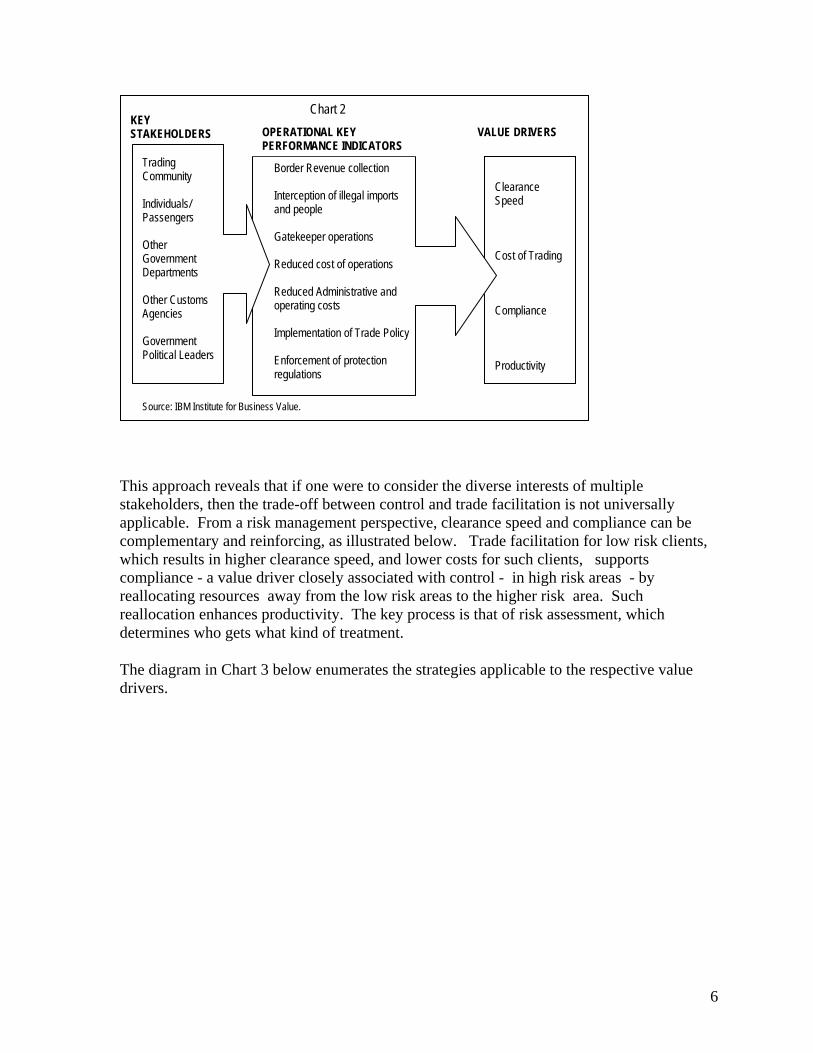
Chart 2 KEY
This approach reveals that if one were to consider the diverse interests of multiple stakeholders, then the trade-off between control and trade facilitation is not universally applicable. From a risk management perspective, clearance speed and compliance can be complementary and reinforcing, as illustrated below. Trade facilitation for low risk clients, which results in higher clearance speed, and lower costs for such clients, supports compliance - a value driver closely associated with control - in high risk areas - by reallocating resources away from the low risk areas to the higher risk area. Such reallocation enhances productivity. The key process is that of risk assessment, which determines who gets what kind of treatment.
The diagram in Chart 3 below enumerates the strategies applicable to the respective value drivers.
Clearance Speed Cost of Trading Compliance Productivity
OPERATIONAL KEY VALUE DRIVERSSTAKEHOLDERS
Border Revenue collection Interception of illegal imports and people Gatekeeper operations Reduced cost of operations Reduced Administrative and operating costs Implementation of Trade Policy Enforcement of protection regulations
PERFORMANCE INDICATORS Trading Community Individuals/ Passengers Other Government Departments Other Customs Agencies Government Political Leaders
Source: IBM Institute for Business Value.
6
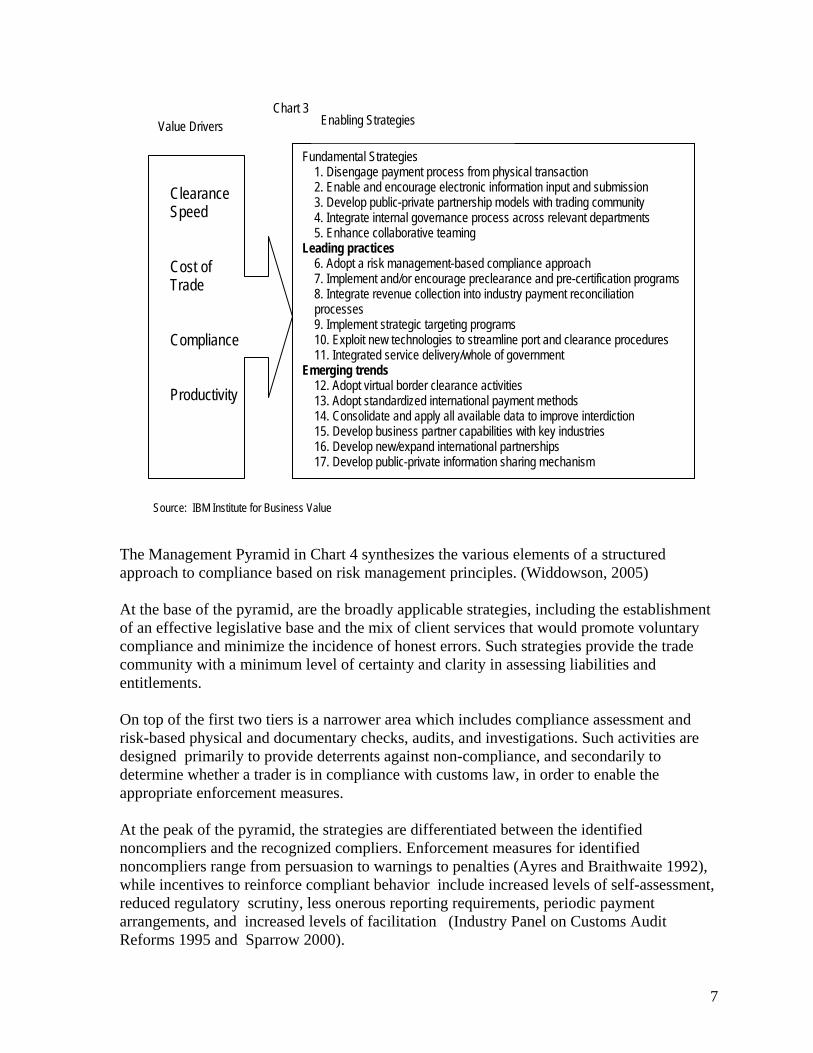
The Management Pyramid in Chart 4 synthesizes the various elements of a structured approach to compliance based on risk management principles. (Widdowson, 2005) At the base of the pyramid, are the broadly applicable strategies, including the establishment of an effective legislative base and the mix of client services that would promote voluntary compliance and minimize the incidence of honest errors. Such strategies provide the trade community with a minimum level of certainty and clarity in assessing liabilities and entitlements. On top of the first two tiers is a narrower area which includes compliance assessment and risk-based physical and documentary checks, audits, and investigations. Such activities are designed primarily to provide deterrents against non-compliance, and secondarily to determine whether a trader is in compliance with customs law, in order to enable the appropriate enforcement measures. At the peak of the pyramid, the strategies are differentiated between the identified noncompliers and the recognized compliers. Enforcement measures for identified noncompliers range from persuasion to warnings to penalties (Ayres and Braithwaite 1992), while incentives to reinforce compliant behavior include increased levels of self-assessment, reduced regulatory scrutiny, less onerous reporting requirements, periodic payment arrangements, and increased levels of facilitation (Industry Panel on Customs Audit Reforms 1995 and Sparrow 2000).
Value Drivers
Chart 3 Enabling Strategies
Fundamental Strategies 1. Disengage payment process from physical transaction 2. Enable and encourage electronic information input and submission Clearance
Speed 3. Develop public-private partnership models with trading community 4. Integrate internal governance process across relevant departments
5. Enhance collaborative teaming Leading practices
6. Adopt a risk management-based compliance approach Cost of Trade 7. Implement and/or encourage preclearance and pre-certification programs
8. Integrate revenue collection into industry payment reconciliation processes
9. Implement strategic targeting programs Compliance 10. Exploit new technologies to streamline port and clearance procedures
11. Integrated service delivery/whole of government Emerging trends 12. Adopt virtual border clearance activities Productivity 13. Adopt standardized international payment methods
14. Consolidate and apply all available data to improve interdiction 15. Develop business partner capabilities with key industries 16. Develop new/expand international partnerships 17. Develop public-private information sharing mechanism
Source: IBM Institute for Business Value
7
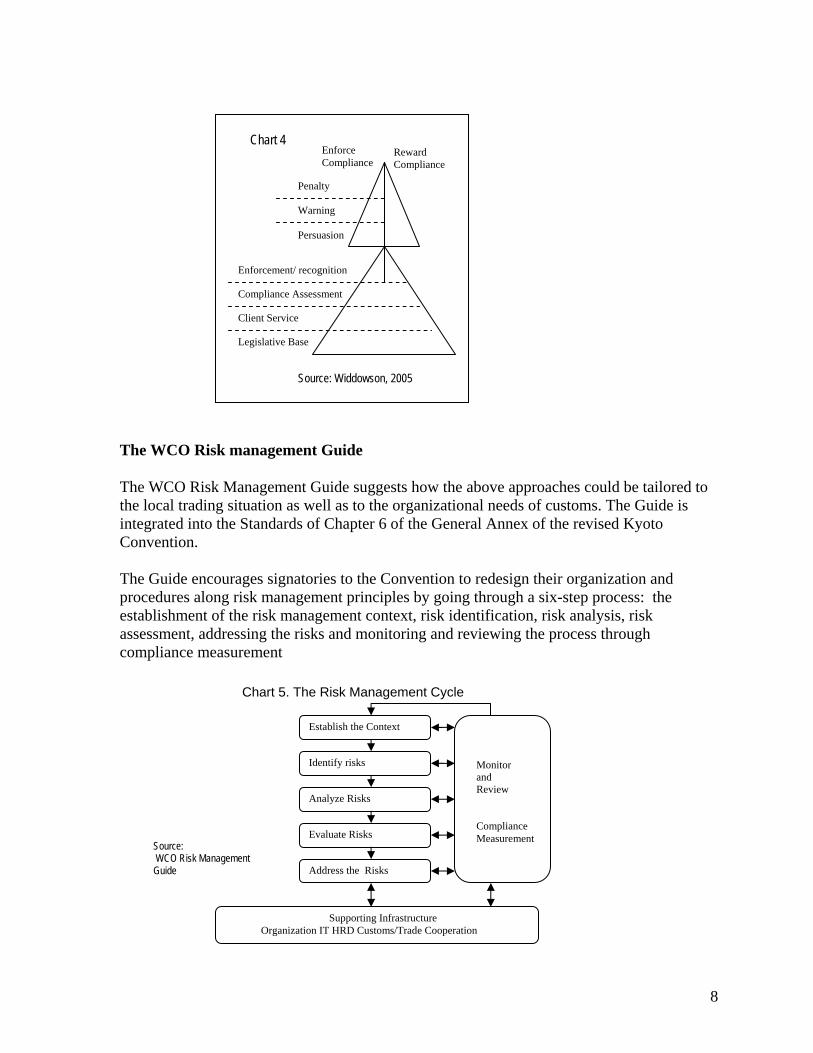
Chart 4 Enforce Reward
The WCO Risk management Guide
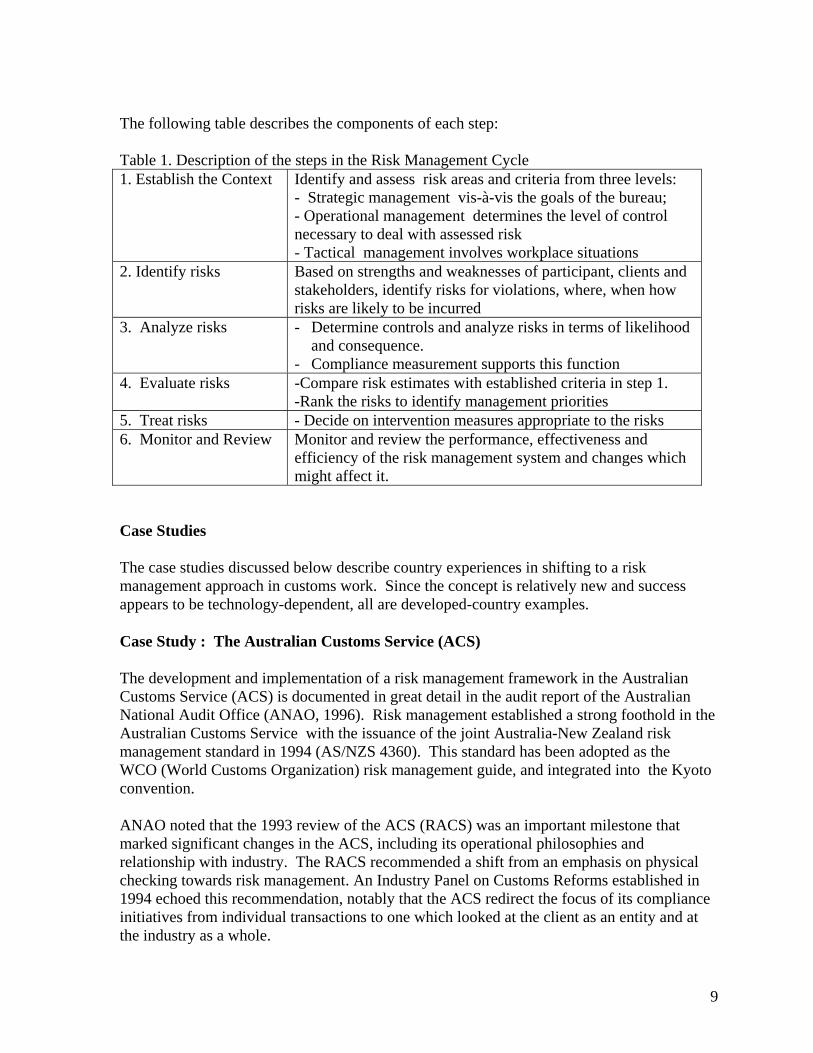
The WCO Risk Management Guide suggests how the above approaches could be tailored to the local trading situation as well as to the organizational needs of customs. The Guide is integrated into the Standards of Chapter 6 of the General Annex of the revised Kyoto Convention. The Guide encourages signatories to the Convention to redesign their organization and procedures along risk management principles by going through a six-step process: the establishment of the risk management context, risk identification, risk analysis, risk assessment, addressing the risks and monitoring and reviewing the process through compliance measurement
Establish the Context
Identify risks
Analyze Risks
Evaluate Risks
Address the Risks
Chart 5. The Risk Management Cycle
Monitor and Review Compliance Measurement
Supporting Infrastructure Organization IT HRD Customs/Trade Cooperation
Source: WCO Risk Management Guide
Enforcement/ recognition
Compliance Assessment
Client Service
Compliance Compliance
Penalty Warning Persuasion
Legislative Base
Source: Widdowson, 2005
8
The following table describes the components of each step: Table 1. Description of the steps in the Risk Management Cycle 1. Establish the Context Identify and assess risk areas and criteria from three levels:
- Strategic management vis-à-vis the goals of the bureau; - Operational management determines the level of control necessary to deal with assessed risk - Tactical management involves workplace situations
2. Identify risks Based on strengths and weaknesses of participant, clients and stakeholders, identify risks for violations, where, when how risks are likely to be incurred
3. Analyze risks - Determine controls and analyze risks in terms of likelihood and consequence.
- Compliance measurement supports this function 4. Evaluate risks -Compare risk estimates with established criteria in step 1.
-Rank the risks to identify management priorities 5. Treat risks - Decide on intervention measures appropriate to the risks 6. Monitor and Review Monitor and review the performance, effectiveness and
efficiency of the risk management system and changes which might affect it.
Case Studies
The case studies discussed below describe country experiences in shifting to a risk management approach in customs work. Since the concept is relatively new and success appears to be technology-dependent, all are developed-country examples.
Case Study : The Australian Customs Service (ACS)
The development and implementation of a risk management framework in the Australian Customs Service (ACS) is documented in great detail in the audit report of the Australian National Audit Office (ANAO, 1996). Risk management established a strong foothold in the Australian Customs Service with the issuance of the joint Australia-New Zealand risk management standard in 1994 (AS/NZS 4360). This standard has been adopted as the WCO (World Customs Organization) risk management guide, and integrated into the Kyoto convention.
ANAO noted that the 1993 review of the ACS (RACS) was an important milestone that marked significant changes in the ACS, including its operational philosophies and relationship with industry. The RACS recommended a shift from an emphasis on physical checking towards risk management. An Industry Panel on Customs Reforms established in 1994 echoed this recommendation, notably that the ACS redirect the focus of its compliance initiatives from individual transactions to one which looked at the client as an entity and at the industry as a whole.
9
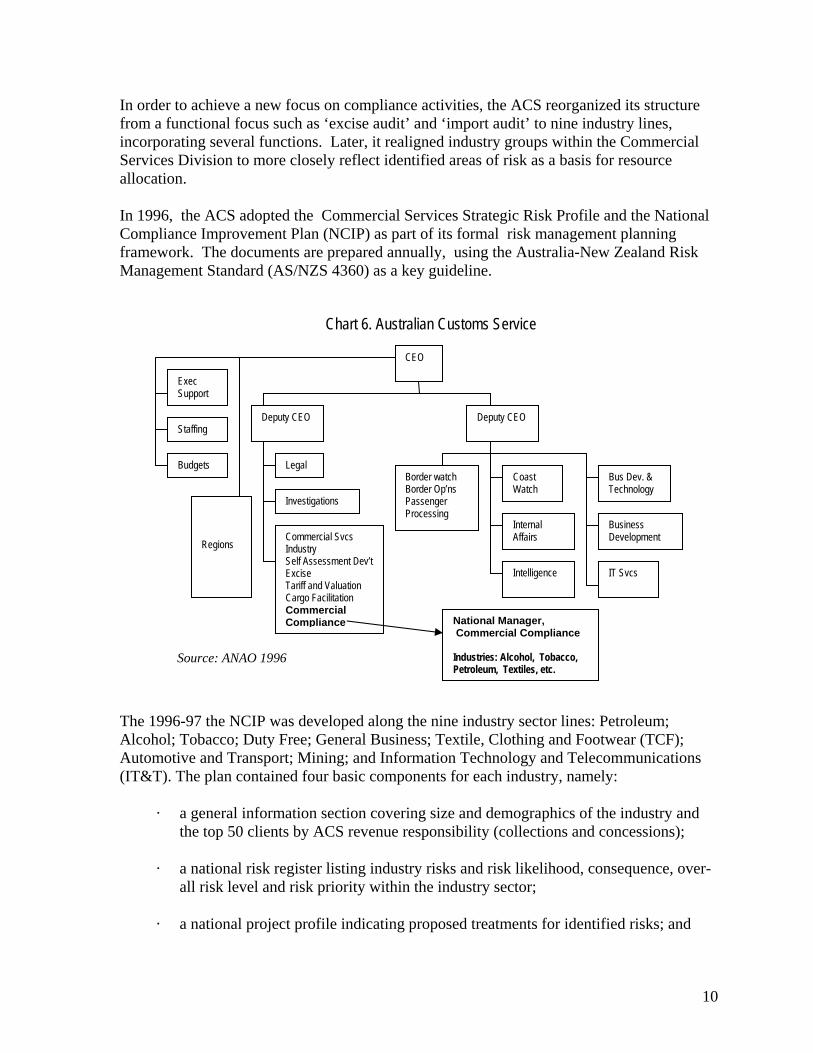
In order to achieve a new focus on compliance activities, the ACS reorganized its structure from a functional focus such as ‘excise audit’ and ‘import audit’ to nine industry lines, incorporating several functions. Later, it realigned industry groups within the Commercial Services Division to more closely reflect identified areas of risk as a basis for resource allocation.
In 1996, the ACS adopted the Commercial Services Strategic Risk Profile and the National Compliance Improvement Plan (NCIP) as part of its formal risk management planning framework. The documents are prepared annually, using the Australia-New Zealand Risk Management Standard (AS/NZS 4360) as a key guideline.
Chart 6. Australian Customs Service
CEO
Exec Support
The 1996-97 the NCIP was developed along the nine industry sector lines: Petroleum; Alcohol; Tobacco; Duty Free; General Business; Textile, Clothing and Footwear (TCF); Automotive and Transport; Mining; and Information Technology and Telecommunications (IT&T). The plan contained four basic components for each industry, namely:
· a general information section covering size and demographics of the industry and the top 50 clients by ACS revenue responsibility (collections and concessions);
· a national risk register listing industry risks and risk likelihood, consequence, over- all risk level and risk priority within the industry sector;
· a national project profile indicating proposed treatments for identified risks; and
Staffing
Budgets Legal
Deputy CEO Deputy CEO
Border watch Coast Watch
Bus Dev. & Technology
Internal Affairs
Intelligence
Border Op’ns
Commercial SvcsIndustry Self Assessment Dev’t Excise Tariff and Valuation Cargo Facilitation Commercial Compliance
Passenger Processing
Business Development
IT Svcs
Investigations Regions
National Manager, Commercial Compliance
Source: ANAO 1996 Industries: Alcohol, Tobacco, Petroleum, Textiles, etc.
10
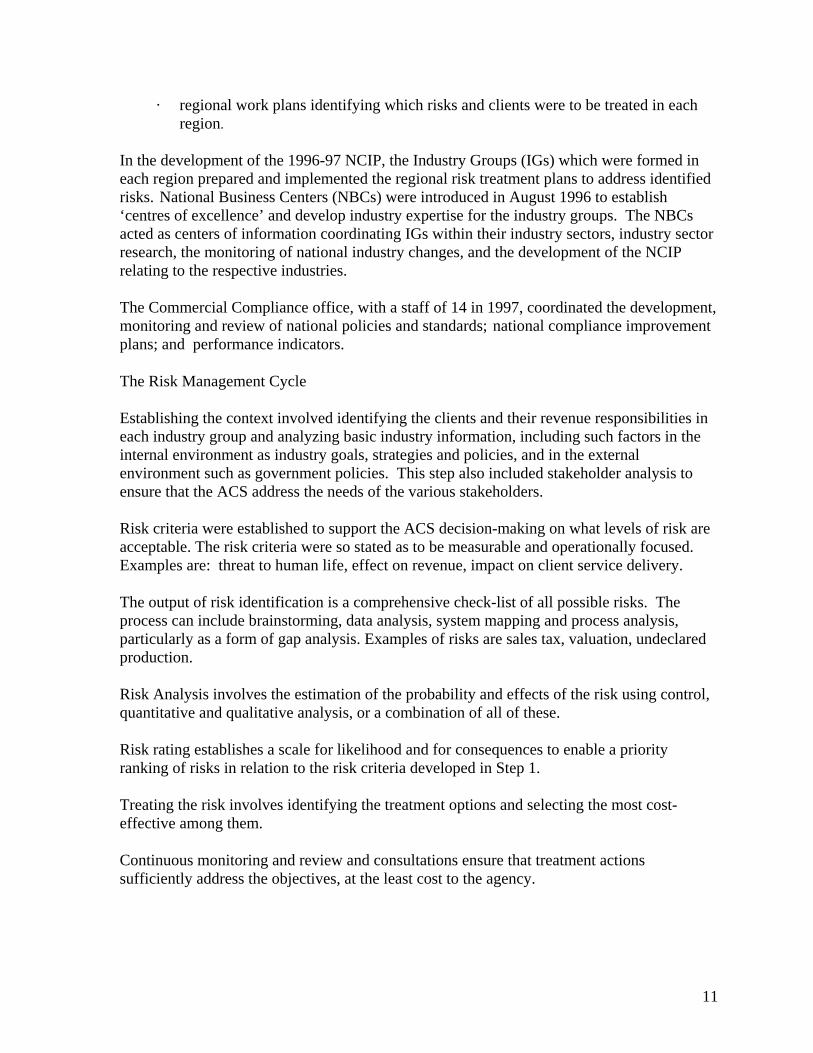
· regional work plans identifying which risks and clients were to be treated in each region.
In the development of the 1996-97 NCIP, the Industry Groups (IGs) which were formed in each region prepared and implemented the regional risk treatment plans to address identified risks. National Business Centers (NBCs) were introduced in August 1996 to establish ‘centres of excellence’ and develop industry expertise for the industry groups. The NBCs acted as centers of information coordinating IGs within their industry sectors, industry sector research, the monitoring of national industry changes, and the development of the NCIP relating to the respective industries.
The Commercial Compliance office, with a staff of 14 in 1997, coordinated the development, monitoring and review of national policies and standards; national compliance improvement plans; and performance indicators.
The Risk Management Cycle
Establishing the context involved identifying the clients and their revenue responsibilities in each industry group and analyzing basic industry information, including such factors in the internal environment as industry goals, strategies and policies, and in the external environment such as government policies. This step also included stakeholder analysis to ensure that the ACS address the needs of the various stakeholders.
Risk criteria were established to support the ACS decision-making on what levels of risk are acceptable. The risk criteria were so stated as to be measurable and operationally focused. Examples are: threat to human life, effect on revenue, impact on client service delivery.
The output of risk identification is a comprehensive check-list of all possible risks. The process can include brainstorming, data analysis, system mapping and process analysis, particularly as a form of gap analysis. Examples of risks are sales tax, valuation, undeclared production.
Risk Analysis involves the estimation of the probability and effects of the risk using control, quantitative and qualitative analysis, or a combination of all of these.
Risk rating establishes a scale for likelihood and for consequences to enable a priority ranking of risks in relation to the risk criteria developed in Step 1.
Treating the risk involves identifying the treatment options and selecting the most cost-effective among them.
Continuous monitoring and review and consultations ensure that treatment actions sufficiently address the objectives, at the least cost to the agency.
11
Case Study: Canadian Customs Revenue Agency (CCR)
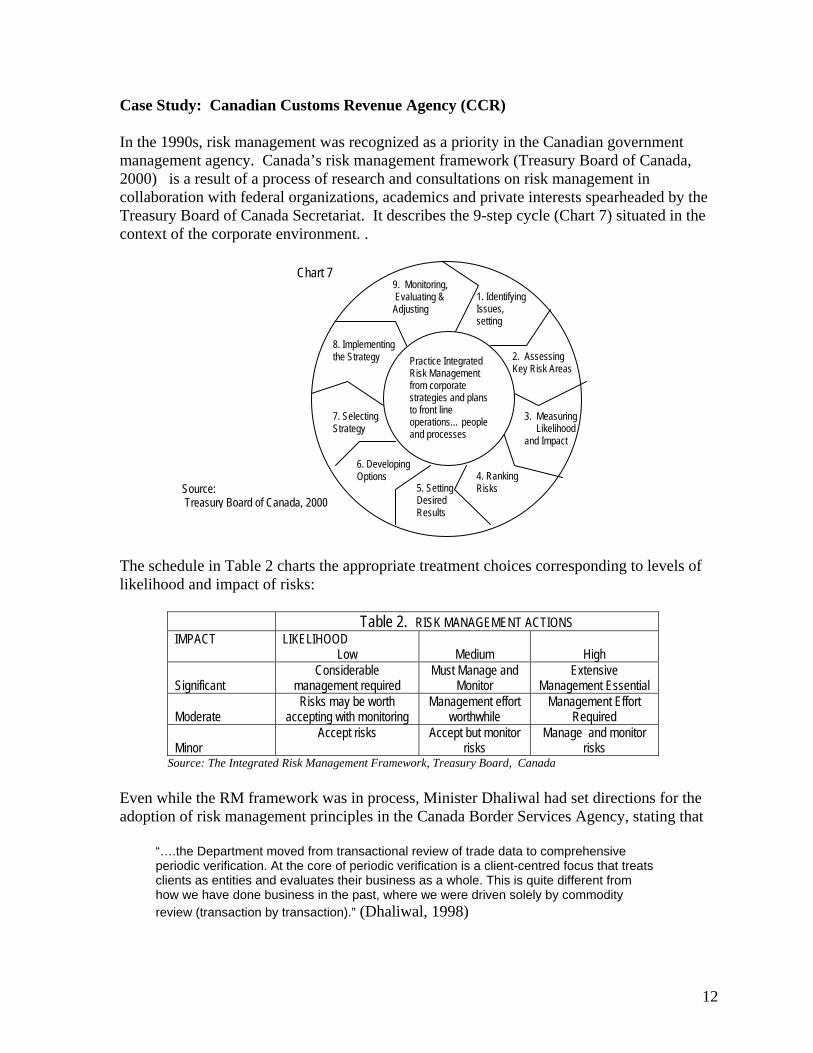
In the 1990s, risk management was recognized as a priority in the Canadian government management agency. Canada’s risk management framework (Treasury Board of Canada, 2000) is a result of a process of research and consultations on risk management in collaboration with federal organizations, academics and private interests spearheaded by the Treasury Board of Canada Secretariat. It describes the 9-step cycle (Chart 7) situated in the context of the corporate environment. .
The schedule in Table 2 chlikelihood and impact of ri
IMPACT L
Significant Moderate a Minor
Source: The Integrated R
Even while the RM framewadoption of risk manageme
“….the Department movperiodic verification. At tclients as entities and evhow we have done busireview (transaction by tr
Source: Treasury Board of Cana
9. Monitoring,
Chart 7
arts the appropriate treatment choices corresponding to levels of sks:
Table 2. RISK MANAGEMENT ACTIONS IKELIHOOD
Low
Medium
High Considerable
management required Must Manage and
Monitor Extensive
Management Essential Risks may be worth
ccepting with monitoring Management effort
worthwhile Management Effort
Required Accept risks Accept but monitor
risks Manage and monitor
risks isk Management Framework, Treasury Board, Canada
ork was in process, Minister Dhaliwal had set directions for the nt principles in the Canada Border Services Agency, stating that
ed from transactional review of trade data to comprehensive he core of periodic verification is a client-centred focus that treats aluates their business as a whole. This is quite different from
ness in the past, where we were driven solely by commodity ansaction).” (Dhaliwal, 1998)
1. Identifying Issues, setting
4. Ranking Risks 5. Setting
Desired Results
6. Developing Options
7. Selecting Strategy
8. Implementing the Strategy
da, 2000
3. Measuring Likelihood
and Impact
Evaluating & Adjusting
2. Assessing Key Risk Areas
Practice Integrated Risk Management from corporate strategies and plans to front line operations… people and processes
12
The decision to treat low risk travelers and importers differently is reflected in the agency’s programs that made increased use of electronics and pre-arrival processing. These are
• CANPASS, introduced in 1995 streamlined cross-border travel including highway, marine and air modes resulting in a 22% increase in participants over a period of three months; and
• Accelerated Commercial Release Operations Support System (ACROSS), an electronic data interchange (EDI) platform introduced in 1996 allowed electronic transmission of data with service available 24 hours a day, seven days a week, and provided a single window for the requirements of other government agencies. The audit report on the CCRA’s import clearance system shows that the EDI improved clearance speed from a standard of two hours for paper releases to 45 minutes. (OAG, 2001)
The OAG also noted the importance of compliance verification in the assessment and management of risks, and expressed its concern at the implementation of the Customs Self Assessment initiative even before compliance verification was well-established.
Case Study: US Department of Homeland Security
At the forefront of technological advancement, the US leads in the application of risk management principles to customs administration. In his 1999 statement before the Senate Committee on Finance, Commissioner Raymond Kelly outlined the key elements of the risk management program in the US Customs Service. (Kelly, 1999)
According to Kelly,
“Each of these national programs allows Customs to collect and analyze data to identify noncompliance and its root causes, to develop and implement solutions, and to monitor the effectiveness of intervention measures. Using them together in a deliberate, systematic fashion constitutes the heart of Customs risk management program for trade.”
The programs are as follows:
a. Primary Focus Industries (PFIs) were identified as highest priority for the attention of the agency based on such factors as revenue, quota and domestic industry impact. These are agriculture, automobiles, communications, critical components (bearings and fasteners), footwear, production equipment, steel, textiles and apparel.
b. Compliance Measurement, using statistically valid sampling techniques to select cargo shipments to examine. Based on these examinations, Customs obtains a picture of compliance levels for all imports and pinpoints areas where the most serious trade violations occur. In 1998, the compliance rate for imports in PFIs increased from 83% to 84%, while the overall compliance rate for imports remained at 81%.
c. Compliance Assessment. The assessment of an importer’s internal controls through statistical sampling and validation of import transactions enabled Customs to improve compliance and collect additional revenues. This exercise was targeted at the largest
13
importers who import at least $10million a year, accounting for 23.5% of total import value, and 43% of PFI imports.
d. The Account Management Program. In 1996, the program covered 25% of the value of imports with 25 national account managers handling 159 accounts. Increasing compliance among this group of importers through the account Managers enabled customs to achieve a substantial impact on overall compliance.
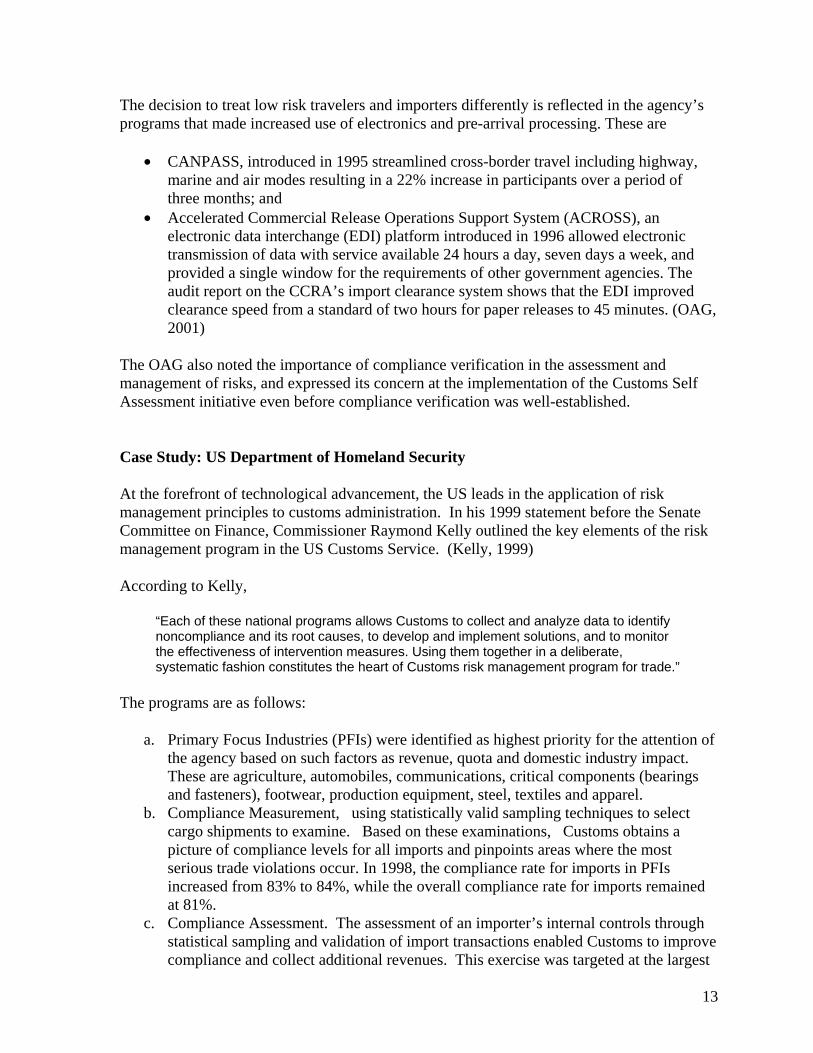
e. Trade Compliance redesign. This involves a shift from a work environment centered on reviewing individual cargo transactions to an automated, account-based focus. The Automated Commercial Environment (ACE) was launched in April 1998 to lay the foundations of the automated account-based processing, clearing 40,000 shipments in its first year of operations solely on the basis of electronic shipment data.
Chart 8. US Department of Homeland Security Secretary Deputy Secretary
There are two more elements that are implicit in the US Customs risk management program. These are
1. Integrity in the workforce. This was addressed through a strengthening of the Office of Internal Affairs, which serves as the focal point of integrity efforts. Accountability Standards were expanded and field managers required to provide their own assessments of their operations every six months, subject to checking and verification by headquarters. The creation of a new Office of Training reinforces the systems of discipline and accountability.
2. Trade partnerships, an example of which is the Customs-Trade Partnership against Terrorism (C-TPAT). (Wilson, J, BearingPoint) An estimated 40% of goods entering the
Exec. Secretary
Legislative Affairs
Public Affairs
State & Local Coordination
Special assistant (private sector)
Nat’l Capital Region Coordination
Shared Services
Citizenship and Immigration Svc. Ombudsman
Commandant, Coast Guard
Inspector General
General Counsel
Civil Rights & Civil Liberties
Director, Secret Svc
International Affairs
Chief of Staff
Dir., Bureau of Citizenship & Immigration Svcs.
Privacy Officer
Small & Disadvantaged Business
Undersecretary, Management
Undersecretary, Science and Technology
Undersecretary, Border and Transportation Security Undersecretary,
Information Analysis & Infrastrcuture Protection
Undersecretary, Emergency Preparedness and Response
Counter Narcotics
Source: Bearing Point
14
US come from CTPAT program participants. Aimed at ensuring trade facilitation with security, the underlying principles of CTPAT are:
• Push the borders out - security begins at the point of origin • Pre- arrival data collection and advanced risk management are used to assess risk for
each transaction prior to arrival to facilitate inspect/ release decisions • Post- entry audits are used to verify transactions and confirm statistical compliance
baselines • Certification as a “low risk” party can result in expedited border clearance • “Low risk” parties and secure transportation channels can be used to establish secure
trade lanes • New systems and policies should not require new international agreements or
negotiations – push voluntary participation • Implement layered security utilizing inspection, data analysis, certification, and
intelligence sources. No single approach is 100% effective. Case Study: Swedish Customs The IBM Institute for Business Value documented the experience of Sweden which provides lessons on the use of cutting edge technology to establish an optimum mix of facility and control in Customs operations. This hi-tech approach has allowed Customs to aim for high levels of compliance while affording significant savings in private sector trading operations. Highlights of the program are summarized as follows:
“Sweden has reduced the costs of trading through a range of leading-edge programs that rely on risk management throughout Customs work. The Stairway ® system offers different levels of service to businesses, based on in-depth quality assurance processes. Transparency and openness toward all stakeholders exists as they promote structured cooperation with trade and industry, on both the policy and operational levels. The “My Customs Office” suite of Internet services such as Tullverkets Internetdeklaration (TID) enables small- and medium-sized companies to lodge declarations via the Internet for free. TID won an award for best extensible Markup Language (XML) application in 2002. A Virtual Customs Office now provides 24x7 access to all Customs and related government processes. Cost of trading also has improved through EMPACT, a European Commission model for cooperation between Customs and the trading community. The benefits of these programs highlight the integrated nature of the four value drivers. Cost of trading benefits include a goal to reduce costs to business by 20 percent, or 500 million Swedish Kronas. They have also established the goal to be the first public authority to offer a paperless transaction flow. Clearance processing also improved in 2001, as 86 percent of import and export declaration were handled electronically and 64 percent were handled automatically within 3 minutes. They have set a goal to clear 95 percent automatically by 2003. Another target is to improve compliance by ensuring 100 percent of businesses pay their Customs duties. The organizational goal is aptly reflected in the following statement: ‘We see it as our duty to work towards simplification in order to reduce the costs Customs procedures cause the companies and thus strengthen their competitive capacity.’”
15
IV. METHODOLOGY
The best practice review above reveals that a successful transition to effective risk-management based customs management and operating systems has the following attributes:
1. Operational shift from the traditional approach of physically checking each transaction to a system that focuses on analyzing firms and industries as a whole and selectively imposes physical examinations following risk-based criteria.
2. A structure that is reorganized from a functional focus (e.g., examination, audit, etc.) to one that is designed along industry lines to encourage industry specialization across critical skills.
3. Mechanisms for risk assessment as well as for monitoring and compliance measurement.
4. Automation coupled with the development of databases that serve identification, analysis and monitoring.
5. Pre-arrival data collection. 6. Layered controls using inspection, data analysis, certification and intelligence sources
for more effective deterrence and interdiction. 7. Measures to strengthen integrity and accountability in the workforce. 8. Collaboration and consultation with the private sector.
Although the above attributes are specific to systems based on risk management principles, a number could be categorized as general management principles which may be applicable in a wide array of operational settings. Their inclusion emphasizes the fact that a systems shift alone does not guaranty effectiveness. In the real world, one would need sound management techniques as well to make things happen the way they should. The above best-practice attributes as well as the WCO 6-step risk management process described above shall serve as a guide in evaluating the state of risk management practices at the BOC. The data used for this purpose were obtained through interviews and focus group discussions with BOC personnel and officials from the following units: Assessment at the MICP and NAIA; Operations at the Port of Manila, the Customs Intelligence and Investigation Service (CIIS); and the Trade and industry Information Research Units of the Post Entry Audit; Administration Service, and the Management Information Systems and Technology Group.
V. ANALYSIS The mission statement of the Bureau of Customs which was articulated in the May 2002 PEAG strategic planning workshop covers six areas, namely:
• To maximize collection of government revenues • To facilitate trade and commerce • To prevent smuggling and enforce compliance with existing laws, rules and
regulations on customs and tariff • To implement international commitments on customs and trade
16
17
• To safeguard the general public/environment against the entry of hazardous and harmful materials and substances
• To support industry and work in partnership with the private sector to promote business in the country
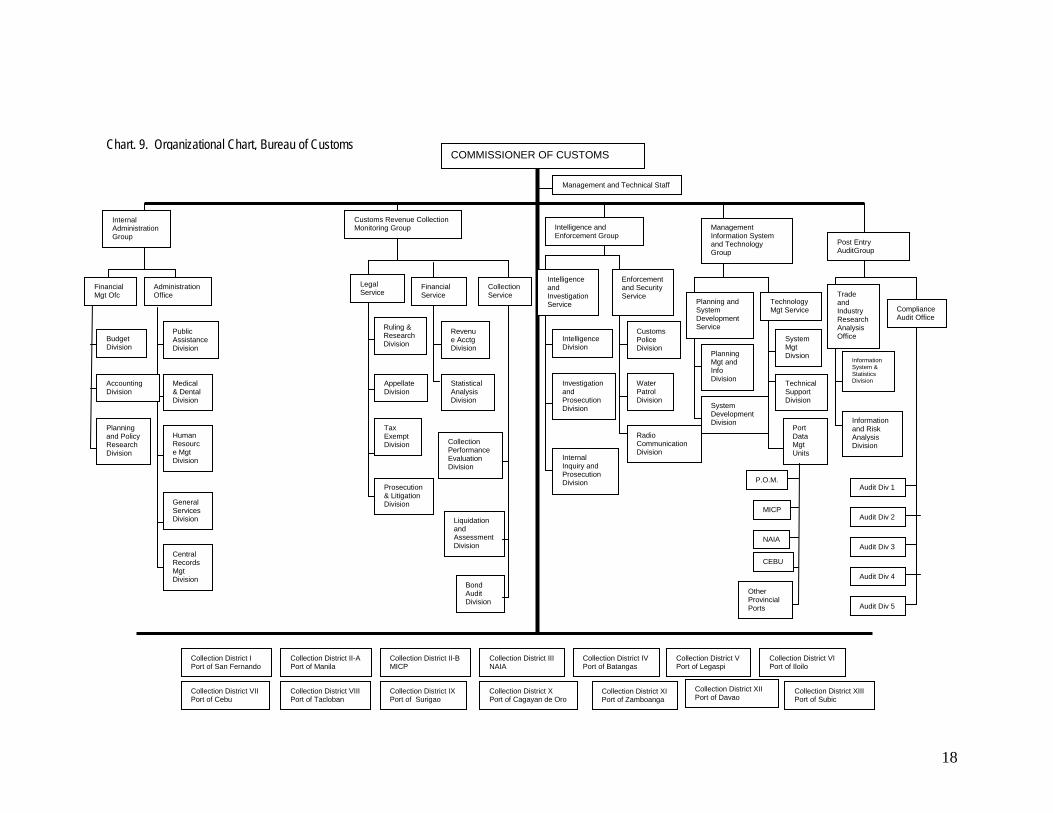
The current organizational structure of the Bureau of Customs was based on the provisions of Executive Order 127 series of 1987. Four groups were initially created under the leadership of the Commissioner, each one headed by a Deputy Commissioner, namely: the Internal Administration Group (IAG), the Assessment and Operations Coordinating Group (AOCG), the Revenue Collection Monitoring Group (RCMG), and the Intelligence and Investigation Group (IEG). As part of its computerization program launched in 1994, the Management Information Systems and Technology Group (MISTG) was added in 1998 through executive fiat. Finally, in 2003, the Post Entry Audit Group (PEAG) headed by an Assistant Commissioner, was established through E.O. 160 pursuant to the provisions of RA 9135. Chart 9 shows the table of organization of the BOC as mandated by law. The Collection Districts comprise the bureau’s main operational units for frontline transaction verification, with the Port and District Collectors given quasi-judicial powers, including the forfeiture of shipments found to have serious customs violations. The organizational structures of the three metroports, Port of Manila, (POM) the Manila International Container Port (MICP) and the Ninoy Aquino International Airport (NAIA) are presented in Charts 10-12 as prototypes of a district port. These are organized along three main functional areas, namely administration, assessment, and operations. Of these three areas, the assessment process directly addresses the goal of revenue collection, which is paramount among the Bureau’s goals.
18
Collection District I Port of San Fernando
Collection District V Port of Legaspi
Collection District XIII Port of Subic
Collection District II-B MICP
Collection District III NAIA
Collection District IV Port of Batangas
Collection District VI Port of Iloilo
Collection District IX Port of Surigao
Collection District VII Port of Cebu
Collection District VIII Port of Tacloban
Collection District X Port of Cagayan de Oro
Collection District XI Port of Zamboanga
Collection District II-A Port of Manila
Collection District XII Port of Davao
Management and Technical Staff
Customs Revenue Collection Monitoring Group
Legal Service
Ruling & Research Division
Prosecution & Litigation Division
Appellate Division
Tax Exempt Division
Revenue Acctg Division
Statistical Analysis Division
Financial Service
Collection Service
Collection Performance Evaluation Division
Liquidation and Assessment Division
Bond Audit Division
Intelligence and Enforcement Group
Intelligence and Investigation Service
Intelligence Division
Investigation and Prosecution Division
Internal Inquiry and Prosecution Division
Customs Police Division
Water Patrol Division
Radio Communication Division
Enforcement and Security Service
Post Entry AuditGroup
Compliance Audit Office
Trade and Industry Research Analysis Office
Audit Div 1
Audit Div 2
Audit Div 3
Audit Div 4
Audit Div 5
Information and Risk Analysis Division
Information System & Statistics Division
COMMISSIONER OF CUSTOMS
Internal Administration Group
Planning and Policy Research Division
Budget Division
Administration Office
Public Assistance Division
Medical & Dental Division
Human Resource Mgt Division
General Services Division
Central Records Mgt Division
Accounting Division
Financial Mgt Ofc
Management Information System and Technology Group
Planning and System Development Service
Planning Mgt and Info Division
Technology Mgt Service
Technical Support Division
System Mgt Divsion
Port Data Mgt Units
System Development Division
MICP
P.O.M.
CEBU
NAIA
Other Provincial Ports
Chart. 9. Organizational Chart, Bureau of Customs
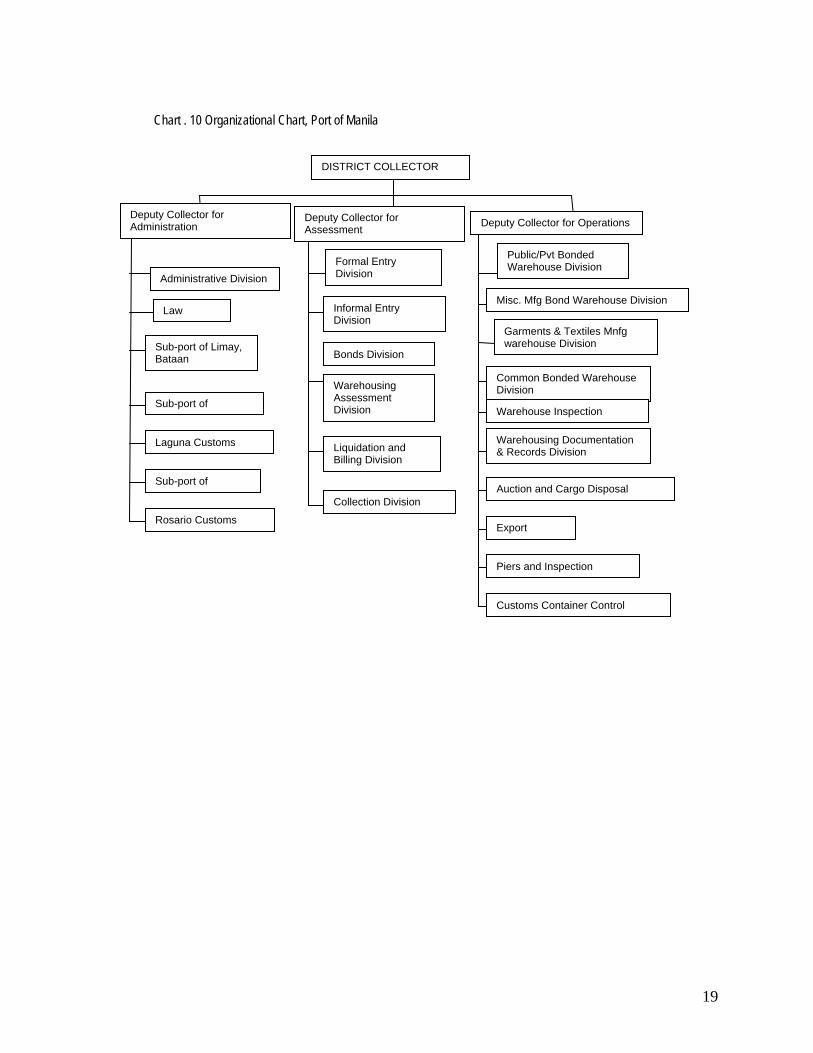
Chart . 10 Organizational Chart, Port of Manila
19
DISTRICT COLLECTOR
Administrative Division
Law
Sub-port of Limay, Bataan
Deputy Collector for Administration
Sub-port of
Laguna Customs
Sub-port of
Rosario Customs
Deputy Collector for Assessment
Formal Entry Division
Informal Entry Division
Bonds Division
Warehousing Assessment Division
Deputy Collector for Operations
Public/Pvt Bonded Warehouse Division
Misc. Mfg Bond Warehouse Division
Garments & Textiles Mnfg warehouse Division
Common Bonded Warehouse Division
Warehouse Inspection
Warehousing Documentation & Records Division Liquidation and
Billing Division
Auction and Cargo Disposal Collection Division
Export
Piers and Inspection
Customs Container Control
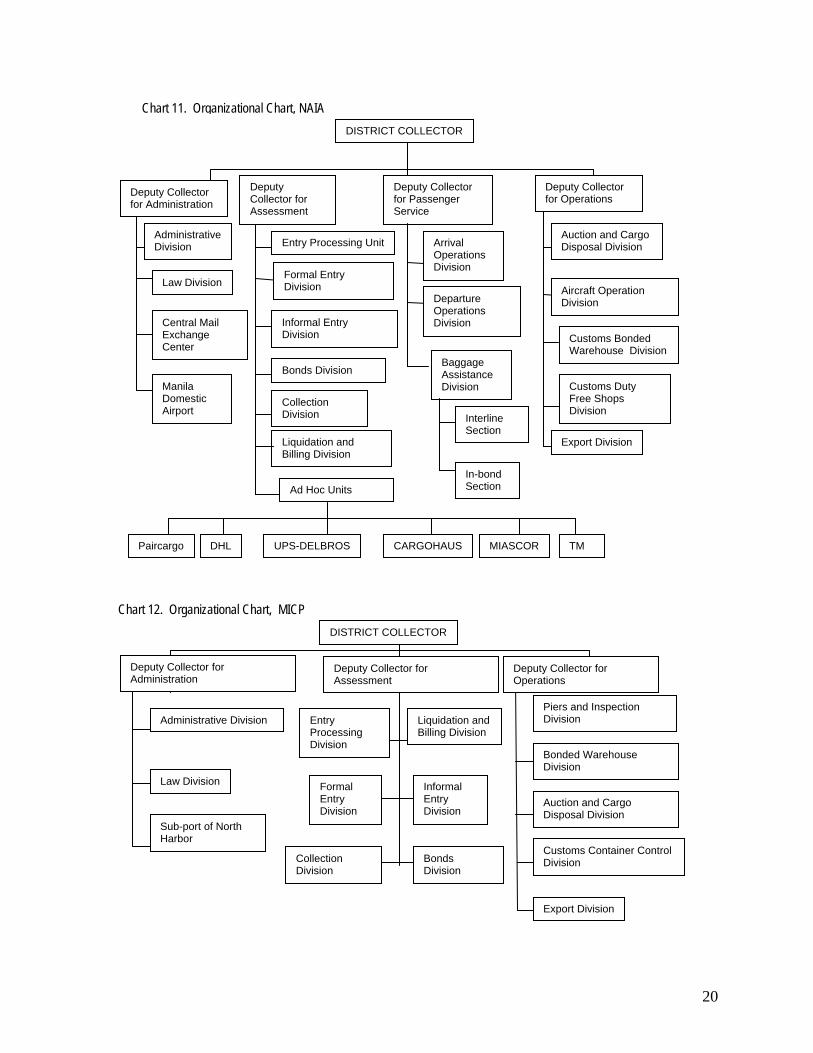
Chart 11. Organizational Chart, NAIA
Administrative Division
Law Division
Central Mail Exchange Center
Deputy Collector for Administration
Manila Domestic Airport
Deputy Collector for Assessment
Aircraft Operation Division
Customs Bonded Warehouse Division
Customs Duty Free Shops Division
Deputy Collector for Operations
Auction and Cargo Disposal Division
DISTRICT COLLECTOR
Deputy Collector for Passenger Service
Formal Entry Division
Liquidation and Billing Division
Informal Entry Division
Collection Division
Bonds Division
Entry Processing Unit Arrival Operations Division
Departure Operations Division
Baggage Assistance Division
Interline Section
Export Division
Ad Hoc Units
Paircargo DHL UPS-DELBROS CARGOHAUS MIASCOR
In-bond Section
TM
Chart 12. Organizational Chart, MICP DISTRICT COLLECTORAdministrative Division
Law Division
Sub-port of North Harbor
Entry Processing Division
Liquidation and Billing Division
Formal Entry Division
Informal Entry Division
Collection Division
Bonds Division
Deputy Collector for Administration
Deputy Collector for Assessment
Deputy Collector for Operations
Piers and Inspection Division
Bonded Warehouse Division
Auction and Cargo Disposal Division
Customs Container Control Division
Export Division
20
In Chart 13, we show a flow chart of the assessment Process, which starts with the selectivity system and ends with the liquidation and turnover of entries to the Commission on Audit (COA). The selectivity system is a module of the ASYCUDA++ (Automated System for Customs Declaration and Assessment) software of the UNCTAD which was adopted by the BOC to computerize the assessment process. It is a critical tool in the current risk management system. The import entry and clearance process is triggered when the importer or his broker obtains the manifest number of his shipment, which he enters, along with other particulars of the import shipment on the Import Entry and Internal Revenue Declaration (IEIRD – BOC Form 236). This form is required to be submitted in both soft and hard copies. Those without the facility to file electronically may submit the document to the entry encoding center (EEC) operated by the Philippine Chamber of Commerce and Industry (PCCI). The data on the IEIRD are encoded into an electronic document called Single Administrative Document (SAD) which becomes an integral part of the BOC record in the ACOS (Automated Customs Operating System). The hard copy IEIRD together with its supporting documents is routed through the assessment process, and the corresponding electronic SAD provides the Bureau with the main source of data for assessing the duties and taxes payable on an import transaction.
21
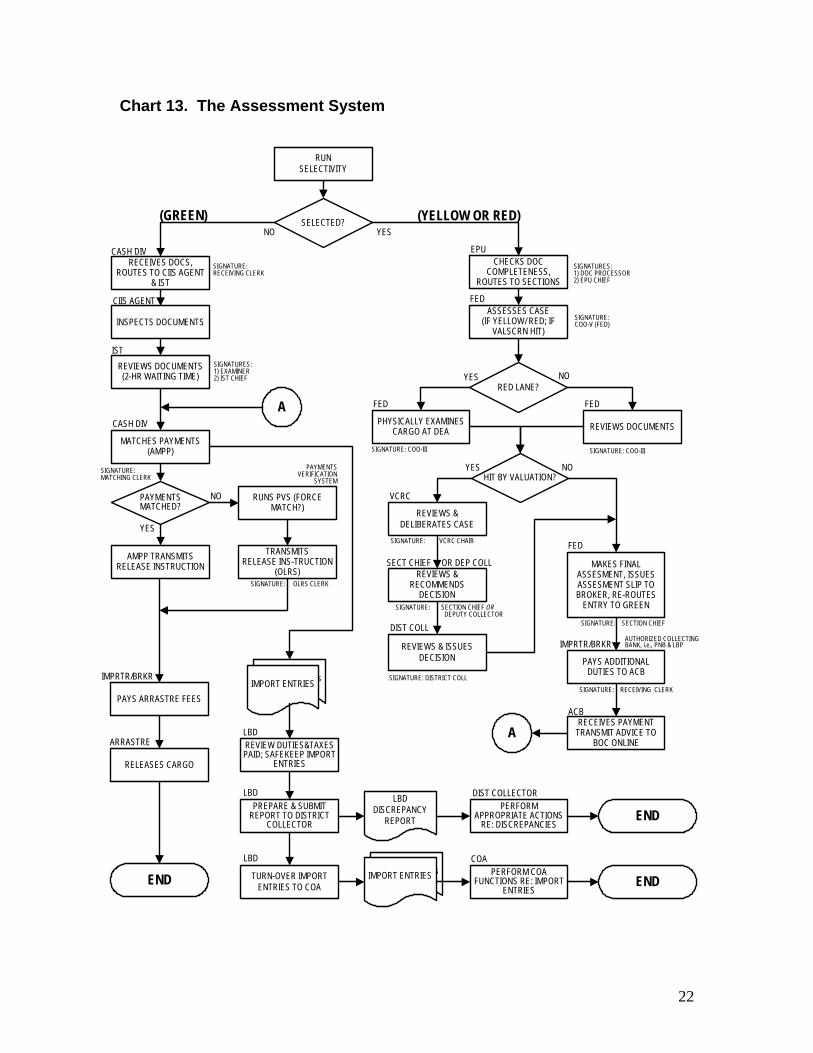
Chart 13. The Assessment System
PAYS ARRASTRE FEES
RUN SELECTIVITY
RELEASES CARGO
IMPRTR/BRKR
ARRASTRE
SELECTED?
MATCHES PAYMENTS (AMPP)
TRANSMITS RELEASE INS-TRUCTION
(OLRS)
RED LANE?
CHECKS DOC COMPLETENESS,
ROUTES TO SECTIONS
EPU
HIT BY VALUATION?
NO
REVIEWS & DELIBERATES CASE
PHYSICALLY EXAMINES CARGO AT DEA
YES
MAKES FINAL ASSESMENT, ISSUES ASSESMENT SLIP TO BROKER, RE-ROUTES
ENTRY TO GREEN
PAYS ADDITIONAL DUTIES TO ACB
NO
YES
(GREEN)
END
VCRC
YES
REVIEWS DOCUMENTS
REVIEWS & RECOMMENDS
DECISION
REVIEWS & ISSUES DECISION
RECEIVES DOCS, ROUTES TO CIIS AGENT
& IST
INSPECTS DOCUMENTS
REVIEWS DOCUMENTS (2-HR WAITING TIME)
CASH DIV
ASSESSES CASE (IF YELLOW/ RED; IF
VALSCRN HIT)
CASH DIV
CIIS AGENT
IST
SECT CHIEF OR DEP COLL
DIST COLL
IMPRTR/BRKR
FED
SIGNATURES:1) EXAMINER2) IST CHIEF
SIGNATURE:RECEIVING CLERK
SIGNATURE:MATCHING CLERK
SIGNATURE: OLRS CLERK
SIGNATURE: DISTRICT COLL
SIGNATURE: SECTION CHIEF ORDEPUTY COLLECTOR
SIGNATURE: SECTION CHIEF
SIGNATURE: RECEIVING CLERK
SIGNATURE: COO-IIISIGNATURE: COO-III
SIGNATURES:1) DOC PROCESSOR2) EPU CHIEF
SIGNATURE:COO-V (FED)
SIGNATURE: VCRC CHAIR
NO
A
A
RECEIVES PAYMENT TRANSMIT ADVICE TO
BOC ONLINE
ACB
PAYMENTS MATCHED?
RUNS PVS (FORCE MATCH?)
AMPP TRANSMITS RELEASE INSTRUCTION
FED
YES
NO
(YELLOW OR RED)
AUTHORIZED COLLECTING BANK, i.e., PNB & LBP
PAYMENTS VERIFICATION
SYSTEM
FED FED
REVIEW DUTIES&TAXES PAID; SAFEKEEP IMPORT
ENTRIES
LBD
PREPARE & SUBMIT REPORT TO DISTRICT
COLLECTOR
TURN-OVER IMPORT ENTRIES TO COA
Selectivity ScreensIMPORT ENTRIES
LBD DISCREPANCY
REPORT
Selectivity ScreensIMPORT ENTRIES
PERFORM APPROPRIATE ACTIONS
RE: DISCREPANCIES
PERFORM COA FUNCTIONS RE: IMPORT
ENTRIES
LBD
LBD
DIST COLLECTOR
COA
END
END
22
The Current Risk Management System During the term of Commissioner Guillermo Parayno in the late 1990’s the BOC undertook a computerization program which introduced important changes into the manner and conduct of business at the Bureau of Customs. For one, it reduced the number of signatures required in the clearance process from about 70 to less than ten. With the use of the ASYCUDA ++ software, it also introduced the Selectivity System, which would select and channel import entries to red, yellow and green lanes respectively, based on certain criteria. The red lane called for physical inspection of cargo; yellow, for documentary review; and green lane for speedy clearance and release of the cargo without physical inspection. The function of setting up, developing and maintaining the selectivity screens that would provide the criteria for the selection process was given to the Risk Management Group (RMG) created for the purpose—a composite group of customs enforcement and intelligence officers. As a matter of policy, however, Commissioner Parayno, possibly realizing its critical nature, mandated that decisions on selectivity criteria be made at his level. This was later changed by his successor, Commissioner Pedro Mendoza who adopted a less hands-on policy and allowed the RMG to perform its task on its own This policy was followed by succeeding administrations, including the present one. The actual programming and installation of the screens in ACOS (Automated Customs Operating System) is done by the Management Information Systems and Technology Group (MISTG) which is responsible for the management and maintenance of the computer system. The following weaknesses have been observed in the implementation of the Selectivity System:
1. Quality of screen development has been poor and appear to lack the specificity required to delineate risk beyond the country level. This is gleaned from the example that is often cited by those who have voiced complaints against Selectivity results: all imports from China are channeled to the red lane regardless of importer or the nature of the shipment. This reveals the inability of the present risk management system to undertake account-based monitoring and analysis. This shortcoming has severely hampered the further development of other important areas of customs operations: 1) it prevents the shift of the assessment process from transactional to account mode and 2) has hampered the ability of the Post Entry Audit Group (PEAG) to undertake meaningful account-based audits.
2. Updating of the screens has been few and far between that the system has become
stagnant and predictable, hence, ineffective for being prone to manipulation. (unscrupulous importers or brokers in connivance with encoders at the entry encoding center can second guess the system and manipulate information entered into the electronic record of a transaction in order to obtain the preferred routing result). The inability to undertake timely screen updates is obviously due
23
mainly to the lack of meaningful inputs into the system. However, this does not mean that frontline personnel lack the information on which to build more effective screens. Informal anecdotal accounts indicate that they are able to gain access to such information. However, the perverse economic incentives that they face encourage them to keep to themselves and use it to develop their version of an informal risk management system which is discussed in more detail below.
3. Broad and non-specific criteria result in significant number (ranging from 50% to
80%) of transactions being channeled to the red lane. Yet, the BOC facilities for cargo inspection at the RED Designated Examination Area (DEA) are not sufficient for such volumes. As a result, examinations conducted are oftentimes perfunctory and ineffective, if at all carried out. In fact, a JICA sponsored a study conducted by a UP School of Economics team (Alburo et al, 2003) had the paradoxical finding that, in many instances, red lane entries were cleared faster than green lane entries. Informal anecdotal accounts reveal a major cause of this perverse result. At the time of the Alburo survey, green lane entries were subjected to post-release spot-checking by intelligence operatives. This often resulted in delay and, at times, under-the-table payments to expedite release. The uncertainty of this situation and the increasing certainty of spot-checks (no doubt encouraged by the prospect of rent income) gave rise to this seemingly perverse importer behavior: they began manipulating the entry encoding system to avoid the green lane. They probably still had to make rent payments on the other lanes but the Alburo results show that they probably got better service (as evidenced by the shorter processing times) and maybe even better terms (if one assumes that the lane profile of transactions is partly the result of such manipulation).
4. Entries routed to the yellow lane are subjected to documentary review. These are
either related to value declarations which exceed the value range indicated for the HS classification, or to regulatory requirements (such as, for example, those of Sanitary Phytosanitary Standards and Bureau of Product Standards and the Food and Drug Administration) The same, non-discriminating level of documentary review is applied to all shipments covered by the regulations – i.e. no distinctions are made based on the importer’s history of compliance, since no formal system exists for the measurement or monitoring of compliance levels. As a result, documentary review can be unwittingly time consuming, and as in cargo inspection, is perfunctory and serves very little purpose especially under the WTO Valuation System where valuation issues are hardly expected to be resolved at the border.
5. A valuation issue is usually raised when the declared value goes beyond the range
provided by the Valuation Screen (Valscreen), the only Selectivity Screen not under RMG cognizance. The Valscreen is updated through the Value Range Information System (VRIS) which is designed to establish and build a historical database of previously accepted value declarations to provide the basis for challenging current value declarations. It has been observed that the integrity of
24
the VRIS is continually undermined because of the ability of importers and brokers to manipulate the values in the VRIS through their own value declarations in prior transactions. This has become possible because of the inability of BOC to detect cases of fraudulent declarations, mainly as a result of double invoicing, a rampant practice in the region, especially in transshipment centers where the practice is hardly policed. This has encouraged traders to routinely cut second invoices which show values much lower than the actual transaction. This is done even if the trader is just a transshipment conduit and was not a party to the original transaction. Under the WTO Valuation rules, BOC would not be able to effectively address this situation unless it develops a comprehensive risk management system that would allow effective audits supported by relevant information from a cooperative private sector and bilateral collaboration arrangements with customs administrations of critical transshipment countries.
6. The undeveloped state of the RM system is exemplified by the fact that BOC does
not even have the capability to learn from its own experience in processing transactions. Except for VRIS, there is no formal system that tracks operational experience or client compliance behavior for compilation in a database that frontline personnel could access to guide their operational decisions. Even the usefulness of VRIS is limited by the weakness described above as well as the fact that there is no feedback system between the appraisers’ findings from documentary review or from cargo inspections back to the selectivity system. Hence, the implicit objective of using data from historical experience and records as a basis for routing entries through the selectivity system is defeated. The selectivity system ends up ineffective, even in support of transaction verification at the border. Although the Customs Intelligence and Investigation Service (CIIS) maintains a watch list of importers, the information is hardly shared and is mostly used for intelligence purposes. In fact operating units of the BOC tend to keep to themselves operational intelligence information that they generate. There is neither a mechanism nor a forum that would encourage them to share such information even on a need-to-know basis.
Informal Risk Assessments and RM Systems at the Unit Level Actually risk assessment has long been practiced by frontline personnel although in an informal and ad hoc manner. Old hands with many years of frontline experience usually become adept at identifying firms and brokers who may be prone to indulge in illegal activities. Although such knowledge would most likely elicit a more vigilant scrutiny of suspected high-risk shipments, it may also serve to tag transactions that may be vulnerable to rent-seeking activities. The double-edged nature of the information would make the holder reluctant to pass it on to others as this may lead to higher detection probabilities and/or rent revenue sharing. One would also therefore have to expect resistance to efforts at developing mechanisms that would institutionalize the generation and compilation of such risk assessments.
25
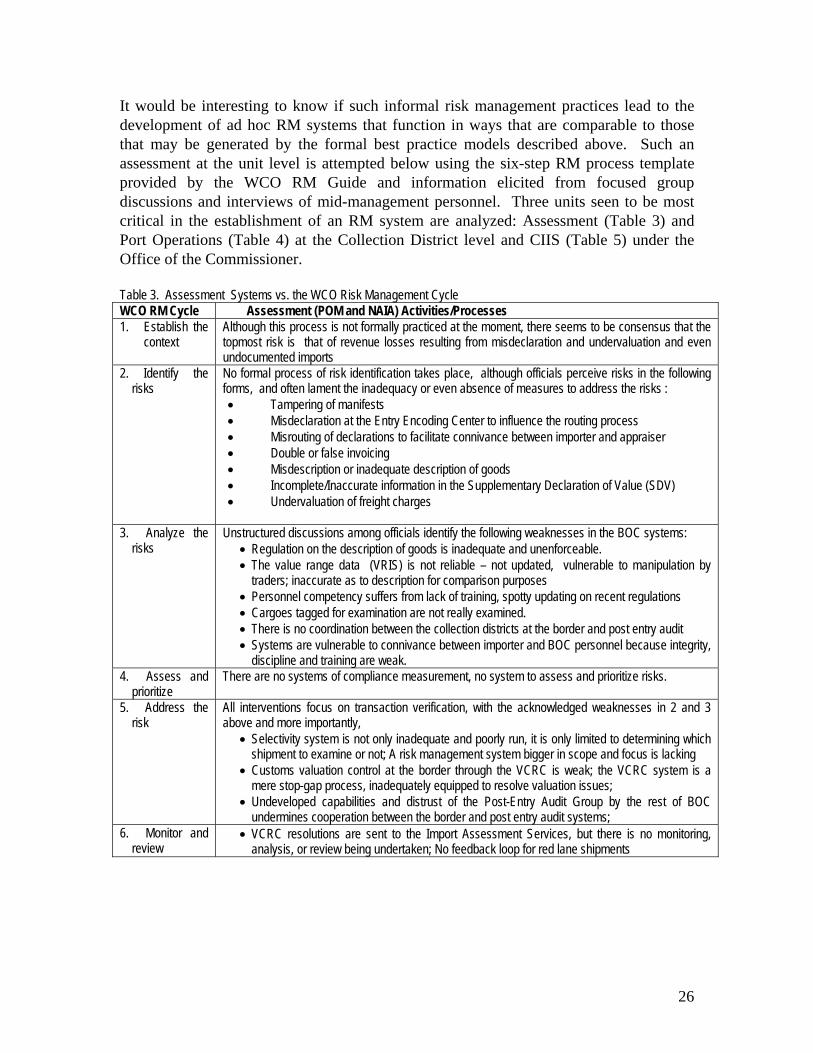
It would be interesting to know if such informal risk management practices lead to the development of ad hoc RM systems that function in ways that are comparable to those that may be generated by the formal best practice models described above. Such an assessment at the unit level is attempted below using the six-step RM process template provided by the WCO RM Guide and information elicited from focused group discussions and interviews of mid-management personnel. Three units seen to be most critical in the establishment of an RM system are analyzed: Assessment (Table 3) and Port Operations (Table 4) at the Collection District level and CIIS (Table 5) under the Office of the Commissioner. Table 3. Assessment Systems vs. the WCO Risk Management Cycle WCO RM Cycle Assessment (POM and NAIA) Activities/Processes 1. Establish the
context
Although this process is not formally practiced at the moment, there seems to be consensus that the topmost risk is that of revenue losses resulting from misdeclaration and undervaluation and even undocumented imports
2. Identify the risks
No formal process of risk identification takes place, although officials perceive risks in the following forms, and often lament the inadequacy or even absence of measures to address the risks : • Tampering of manifests • Misdeclaration at the Entry Encoding Center to influence the routing process • Misrouting of declarations to facilitate connivance between importer and appraiser • Double or false invoicing • Misdescription or inadequate description of goods • Incomplete/Inaccurate information in the Supplementary Declaration of Value (SDV) • Undervaluation of freight charges
3. Analyze the risks
Unstructured discussions among officials identify the following weaknesses in the BOC systems: • Regulation on the description of goods is inadequate and unenforceable. • The value range data (VRIS) is not reliable – not updated, vulnerable to manipulation by
traders; inaccurate as to description for comparison purposes • Personnel competency suffers from lack of training, spotty updating on recent regulations • Cargoes tagged for examination are not really examined. • There is no coordination between the collection districts at the border and post entry audit • Systems are vulnerable to connivance between importer and BOC personnel because integrity,
discipline and training are weak. 4. Assess and
prioritize There are no systems of compliance measurement, no system to assess and prioritize risks.
5. Address the risk
All interventions focus on transaction verification, with the acknowledged weaknesses in 2 and 3 above and more importantly,
• Selectivity system is not only inadequate and poorly run, it is only limited to determining which shipment to examine or not; A risk management system bigger in scope and focus is lacking
• Customs valuation control at the border through the VCRC is weak; the VCRC system is a mere stop-gap process, inadequately equipped to resolve valuation issues;
• Undeveloped capabilities and distrust of the Post-Entry Audit Group by the rest of BOC undermines cooperation between the border and post entry audit systems;
6. Monitor and review
• VCRC resolutions are sent to the Import Assessment Services, but there is no monitoring, analysis, or review being undertaken; No feedback loop for red lane shipments
26
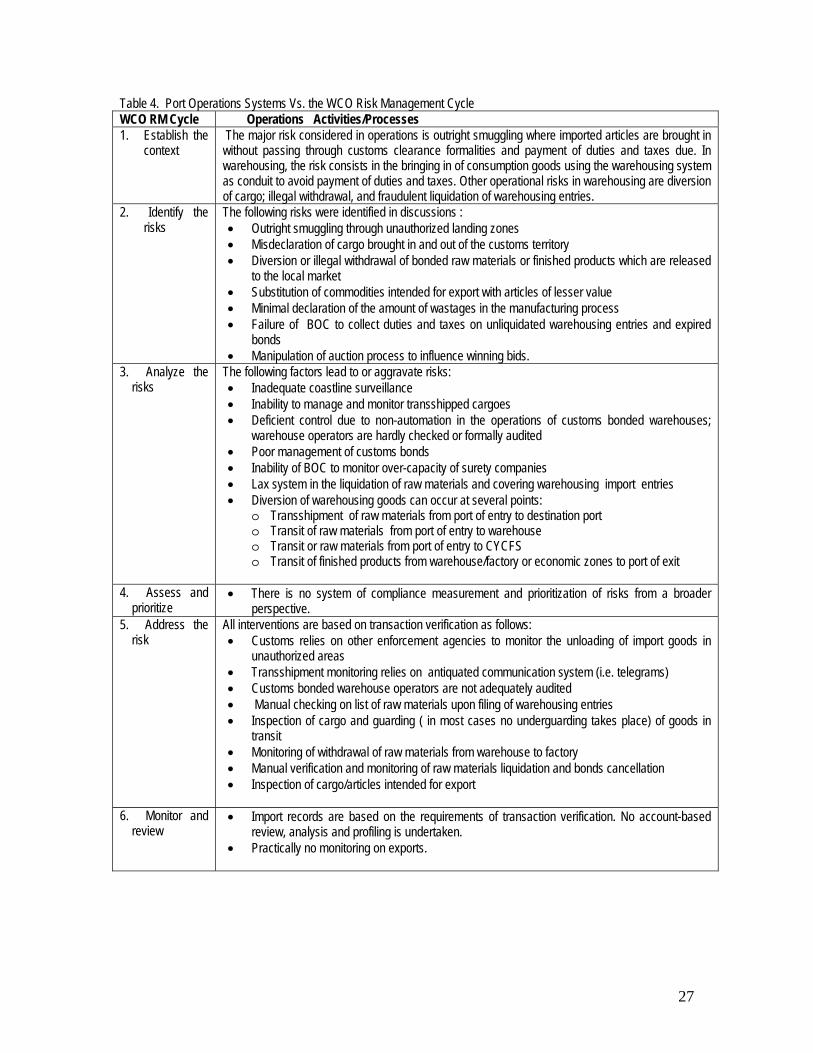
Table 4. Port Operations Systems Vs. the WCO Risk Management Cycle WCO RM Cycle Operations Activities/Processes 1. Establish the
context
The major risk considered in operations is outright smuggling where imported articles are brought in without passing through customs clearance formalities and payment of duties and taxes due. In warehousing, the risk consists in the bringing in of consumption goods using the warehousing system as conduit to avoid payment of duties and taxes. Other operational risks in warehousing are diversion of cargo; illegal withdrawal, and fraudulent liquidation of warehousing entries.
2. Identify the risks
The following risks were identified in discussions : • Outright smuggling through unauthorized landing zones • Misdeclaration of cargo brought in and out of the customs territory • Diversion or illegal withdrawal of bonded raw materials or finished products which are released
to the local market • Substitution of commodities intended for export with articles of lesser value • Minimal declaration of the amount of wastages in the manufacturing process • Failure of BOC to collect duties and taxes on unliquidated warehousing entries and expired
bonds • Manipulation of auction process to influence winning bids.
3. Analyze the risks
The following factors lead to or aggravate risks: • Inadequate coastline surveillance • Inability to manage and monitor transshipped cargoes • Deficient control due to non-automation in the operations of customs bonded warehouses;
warehouse operators are hardly checked or formally audited • Poor management of customs bonds • Inability of BOC to monitor over-capacity of surety companies • Lax system in the liquidation of raw materials and covering warehousing import entries • Diversion of warehousing goods can occur at several points:
o Transshipment of raw materials from port of entry to destination port o Transit of raw materials from port of entry to warehouse o Transit or raw materials from port of entry to CYCFS o Transit of finished products from warehouse/factory or economic zones to port of exit
4. Assess and
prioritize • There is no system of compliance measurement and prioritization of risks from a broader
perspective. 5. Address the
risk All interventions are based on transaction verification as follows: • Customs relies on other enforcement agencies to monitor the unloading of import goods in
unauthorized areas • Transshipment monitoring relies on antiquated communication system (i.e. telegrams) • Customs bonded warehouse operators are not adequately audited • Manual checking on list of raw materials upon filing of warehousing entries • Inspection of cargo and guarding ( in most cases no underguarding takes place) of goods in
transit • Monitoring of withdrawal of raw materials from warehouse to factory • Manual verification and monitoring of raw materials liquidation and bonds cancellation • Inspection of cargo/articles intended for export
6. Monitor and
review • Import records are based on the requirements of transaction verification. No account-based
review, analysis and profiling is undertaken. • Practically no monitoring on exports.
27
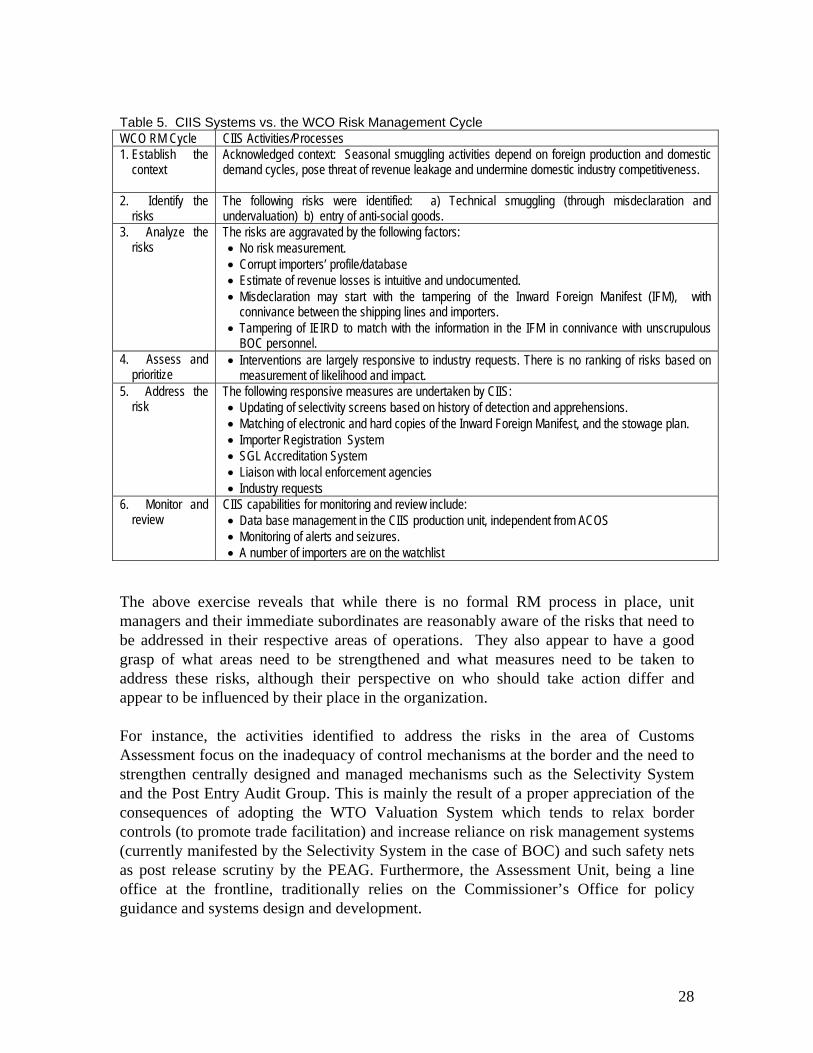
Table 5. CIIS Systems vs. the WCO Risk Management Cycle WCO RM Cycle CIIS Activities/Processes 1. Establish the
context
Acknowledged context: Seasonal smuggling activities depend on foreign production and domestic demand cycles, pose threat of revenue leakage and undermine domestic industry competitiveness.
2. Identify the risks
The following risks were identified: a) Technical smuggling (through misdeclaration and undervaluation) b) entry of anti-social goods.
3. Analyze the risks
The risks are aggravated by the following factors: • No risk measurement. • Corrupt importers’ profile/database • Estimate of revenue losses is intuitive and undocumented. • Misdeclaration may start with the tampering of the Inward Foreign Manifest (IFM), with
connivance between the shipping lines and importers. • Tampering of IEIRD to match with the information in the IFM in connivance with unscrupulous
BOC personnel. 4. Assess and
prioritize • Interventions are largely responsive to industry requests. There is no ranking of risks based on
measurement of likelihood and impact. 5. Address the
risk The following responsive measures are undertaken by CIIS: • Updating of selectivity screens based on history of detection and apprehensions. • Matching of electronic and hard copies of the Inward Foreign Manifest, and the stowage plan. • Importer Registration System • SGL Accreditation System • Liaison with local enforcement agencies • Industry requests
6. Monitor and review
CIIS capabilities for monitoring and review include: • Data base management in the CIIS production unit, independent from ACOS • Monitoring of alerts and seizures. • A number of importers are on the watchlist
The above exercise reveals that while there is no formal RM process in place, unit managers and their immediate subordinates are reasonably aware of the risks that need to be addressed in their respective areas of operations. They also appear to have a good grasp of what areas need to be strengthened and what measures need to be taken to address these risks, although their perspective on who should take action differ and appear to be influenced by their place in the organization. For instance, the activities identified to address the risks in the area of Customs Assessment focus on the inadequacy of control mechanisms at the border and the need to strengthen centrally designed and managed mechanisms such as the Selectivity System and the Post Entry Audit Group. This is mainly the result of a proper appreciation of the consequences of adopting the WTO Valuation System which tends to relax border controls (to promote trade facilitation) and increase reliance on risk management systems (currently manifested by the Selectivity System in the case of BOC) and such safety nets as post release scrutiny by the PEAG. Furthermore, the Assessment Unit, being a line office at the frontline, traditionally relies on the Commissioner’s Office for policy guidance and systems design and development.
28
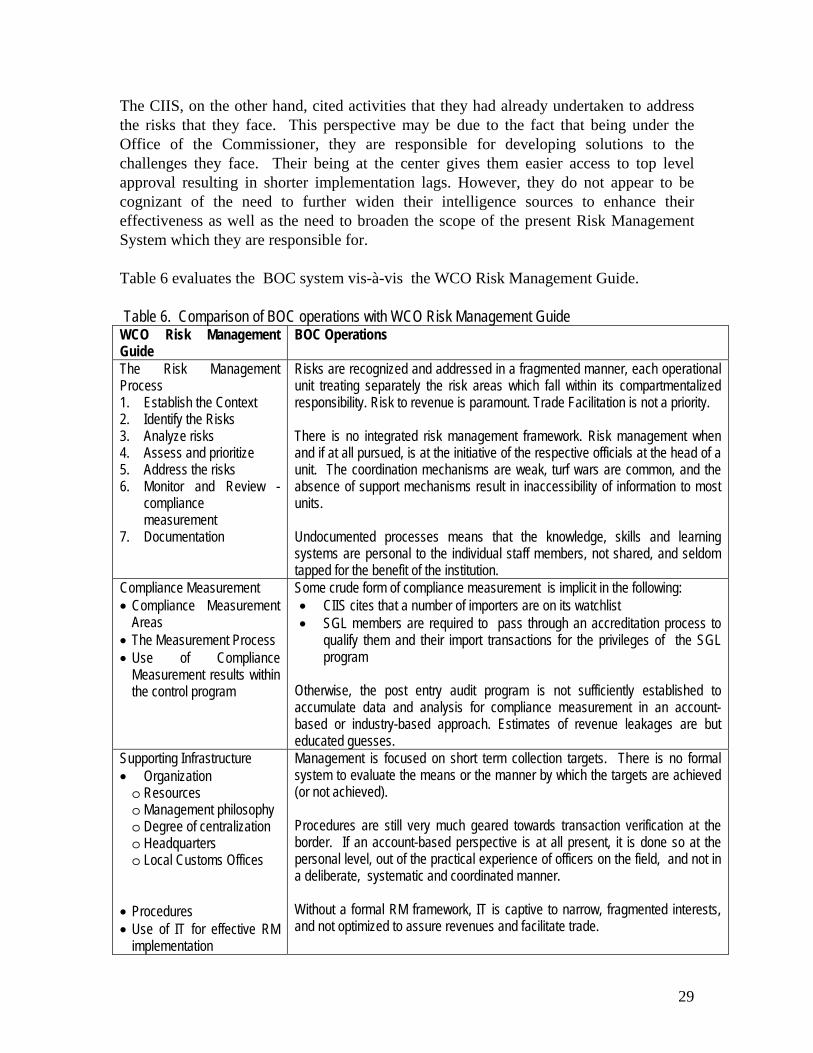
The CIIS, on the other hand, cited activities that they had already undertaken to address the risks that they face. This perspective may be due to the fact that being under the Office of the Commissioner, they are responsible for developing solutions to the challenges they face. Their being at the center gives them easier access to top level approval resulting in shorter implementation lags. However, they do not appear to be cognizant of the need to further widen their intelligence sources to enhance their effectiveness as well as the need to broaden the scope of the present Risk Management System which they are responsible for. Table 6 evaluates the BOC system vis-à-vis the WCO Risk Management Guide. Table 6. Comparison of BOC operations with WCO Risk Management Guide WCO Risk Management Guide
BOC Operations
The Risk Management Process 1. Establish the Context 2. Identify the Risks 3. Analyze risks 4. Assess and prioritize 5. Address the risks 6. Monitor and Review -
compliance measurement
7. Documentation
Risks are recognized and addressed in a fragmented manner, each operational unit treating separately the risk areas which fall within its compartmentalized responsibility. Risk to revenue is paramount. Trade Facilitation is not a priority. There is no integrated risk management framework. Risk management when and if at all pursued, is at the initiative of the respective officials at the head of a unit. The coordination mechanisms are weak, turf wars are common, and the absence of support mechanisms result in inaccessibility of information to most units. Undocumented processes means that the knowledge, skills and learning systems are personal to the individual staff members, not shared, and seldom tapped for the benefit of the institution.
Compliance Measurement • Compliance Measurement
Areas • The Measurement Process • Use of Compliance
Measurement results within the control program
Some crude form of compliance measurement is implicit in the following: • CIIS cites that a number of importers are on its watchlist • SGL members are required to pass through an accreditation process to
qualify them and their import transactions for the privileges of the SGL program
Otherwise, the post entry audit program is not sufficiently established to accumulate data and analysis for compliance measurement in an account-based or industry-based approach. Estimates of revenue leakages are but educated guesses.
Supporting Infrastructure • Organization o Resources o Management philosophy o Degree of centralization o Headquarters o Local Customs Offices
• Procedures • Use of IT for effective RM
implementation
Management is focused on short term collection targets. There is no formal system to evaluate the means or the manner by which the targets are achieved (or not achieved). Procedures are still very much geared towards transaction verification at the border. If an account-based perspective is at all present, it is done so at the personal level, out of the practical experience of officers on the field, and not in a deliberate, systematic and coordinated manner. Without a formal RM framework, IT is captive to narrow, fragmented interests, and not optimized to assure revenues and facilitate trade.
29
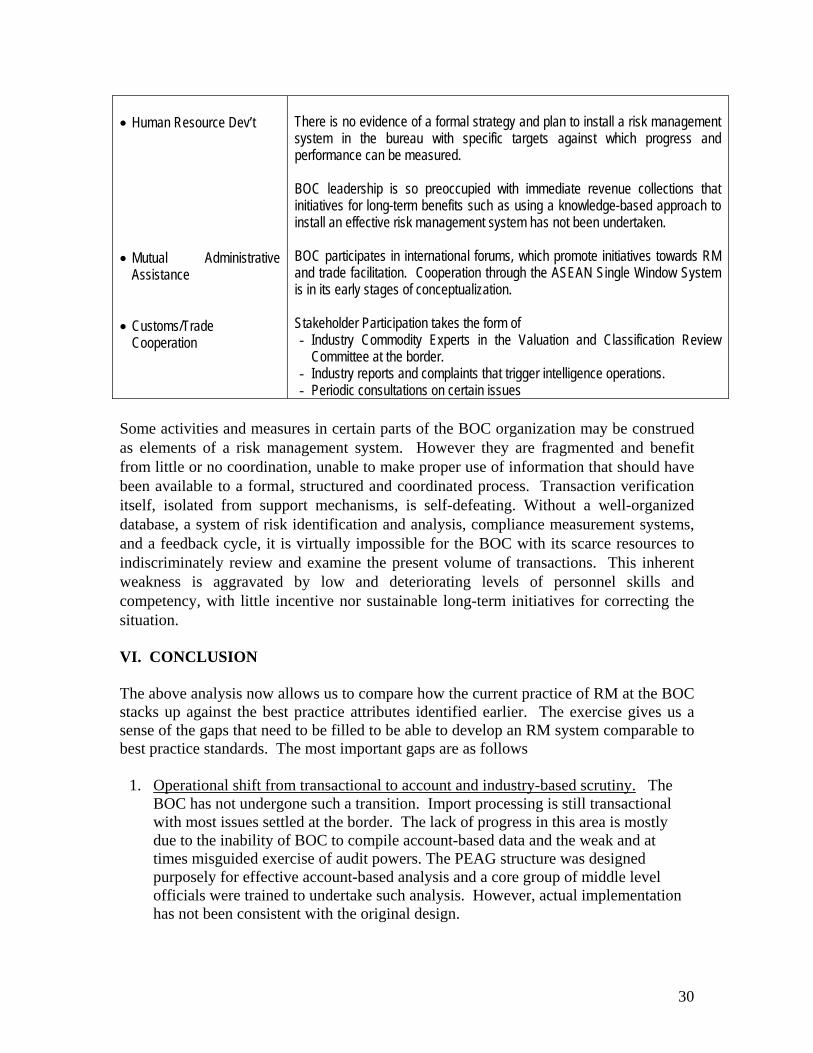
• Human Resource Dev’t • Mutual Administrative
Assistance • Customs/Trade
Cooperation
There is no evidence of a formal strategy and plan to install a risk management system in the bureau with specific targets against which progress and performance can be measured. BOC leadership is so preoccupied with immediate revenue collections that initiatives for long-term benefits such as using a knowledge-based approach to install an effective risk management system has not been undertaken. BOC participates in international forums, which promote initiatives towards RM and trade facilitation. Cooperation through the ASEAN Single Window System is in its early stages of conceptualization. Stakeholder Participation takes the form of - Industry Commodity Experts in the Valuation and Classification Review
Committee at the border. - Industry reports and complaints that trigger intelligence operations. - Periodic consultations on certain issues
Some activities and measures in certain parts of the BOC organization may be construed as elements of a risk management system. However they are fragmented and benefit from little or no coordination, unable to make proper use of information that should have been available to a formal, structured and coordinated process. Transaction verification itself, isolated from support mechanisms, is self-defeating. Without a well-organized database, a system of risk identification and analysis, compliance measurement systems, and a feedback cycle, it is virtually impossible for the BOC with its scarce resources to indiscriminately review and examine the present volume of transactions. This inherent weakness is aggravated by low and deteriorating levels of personnel skills and competency, with little incentive nor sustainable long-term initiatives for correcting the situation. VI. CONCLUSION The above analysis now allows us to compare how the current practice of RM at the BOC stacks up against the best practice attributes identified earlier. The exercise gives us a sense of the gaps that need to be filled to be able to develop an RM system comparable to best practice standards. The most important gaps are as follows
1. Operational shift from transactional to account and industry-based scrutiny. The BOC has not undergone such a transition. Import processing is still transactional with most issues settled at the border. The lack of progress in this area is mostly due to the inability of BOC to compile account-based data and the weak and at times misguided exercise of audit powers. The PEAG structure was designed purposely for effective account-based analysis and a core group of middle level officials were trained to undertake such analysis. However, actual implementation has not been consistent with the original design.
30
2. Organizational shift from an organizational focus to a design along industry lines. Such a shift has not occurred mainly because of 1 above. Both the central office and the Collection Districts are organized along functional lines. The Appraiser sections are organized along the lines of the chapter headings of the Tariff and Customs Code of the Philippines (TCCP). While such a set up does promote some industry specialization, there is no effort to take advantage of this by providing, for instance, training on industry analysis. Furthermore, periodic transfers of personnel mitigate against specialization.
3. Mechanisms for risk assessment as well as for monitoring and compliance
measurement. The above discussion reveals that there are no such formal mechanisms. Frontline units have been found to undertake some form of risk assessment but they are highly informal, severely fragmented and very inadequate.
4. Automation coupled with the development of databases that serve risk
identification, analysis and monitoring. As mentioned above, the BOC has automated its import assessment process. It is well underway to automating its other functions with some fresh government funding. Unfortunately, the development of a database to support an RM system does not appear in the current list of priorities.
5. Pre-arrival data collection. This is currently not being done. There was an attempt
to develop such a system some years back but it never got to the implementation stage.
6. Layered controls using inspection, data analysis, certification and intelligence
sources for more effective deterrence and interdiction. This is being carried out to some extent by frontline assessment and enforcement units, although not in a systematic and coordinated manner.
7. Measures to strengthen integrity and accountability in the workforce. There is no
underestimating the importance of integrity in the BOC leadership and among the workforce as a necessary and sufficient condition for a viable risk management system. The installation of control mechanisms such as an Internal Audit Program, a code of discipline and conduct, and skills and values training have been demonstrated to help prop up workforce integrity elsewhere. However, the indispensable lynchpin is the political will to confront the problem of political patronage, which feeds and sustains institutional systems of corruption. The development of such political will, though not impossible, may take a sustained long-term program of education and information among would-be beneficiaries that would constitute the potential constituents of reforms. The BOC has an Internal Affairs Unit, established pursuant to a Presidential directive, but it has largely been ineffective.
8. Collaboration and consultation with the private sector. Collaboration with the
private sector is largely through the participation of representatives of the Philippine
31
Chamber of Commerce and Industry (PCCI) in the assessment process (they observe the customs examination and provide inputs on valuation and classification). These experts are usually fielded only selectively. Some importers find the practice intrusive especially when the PCCI experts are fielded in pursuit of protectionist goals. Such a collaboration would probably be more useful at the strategic level, geared towards RM objectives. The private sector could provide needed industry information and assist in the crafting of industry-wide compliance strategies.
Hardy any of the best practice attributes could be found at the BOC. Clearly, a lot of work still lies ahead. The next section offers some suggestions. VI. RECOMMENDATIONS TOWARD DEVELOPING A VIABLE RM SYSTEM AND COMPLIANCE PROGRAM A major objective of an RM system is to expand compliant areas and to concentrate resources on interventions aimed at reducing areas of non-compliance. The best practice goal is to make 80% of customs clients compliant. For the BOC, it is suggested that compliant behavior be encouraged through a system of rewards and sanctions as well as through productive collaboration to help firms raise their compliance levels. Chart 14 below shows the important mechanisms of such a system and how they are seen to interface with each other. Compliant behavior is encouraged by offering a set of incentives under SGL, which should include paperless processing and exemption from intrusive scrutiny of shipments and documents. Non-SGL importations will be subjected to the Selectivity System and processed in accordance with the compliance level of their importers. To further encourage compliance, audits should take 2 forms: 1) systems audits to verify the compliance level of firms and suggest measures towards the attainment of compliance levels that would qualify them for SGL membership; 2) punitive audits to ferret out possible violations detected during profiling analysis. An important underlying feature of the system is the database of importer risk profiles. This is an account-oriented database which contains the compliance history of each importer as well as their compliance ratings, among others. Information in this database shall guide the lane choice of the Selectivity System, decisions on SGL membership and the choice of firms for audit. Such a database does not currently exist.
32
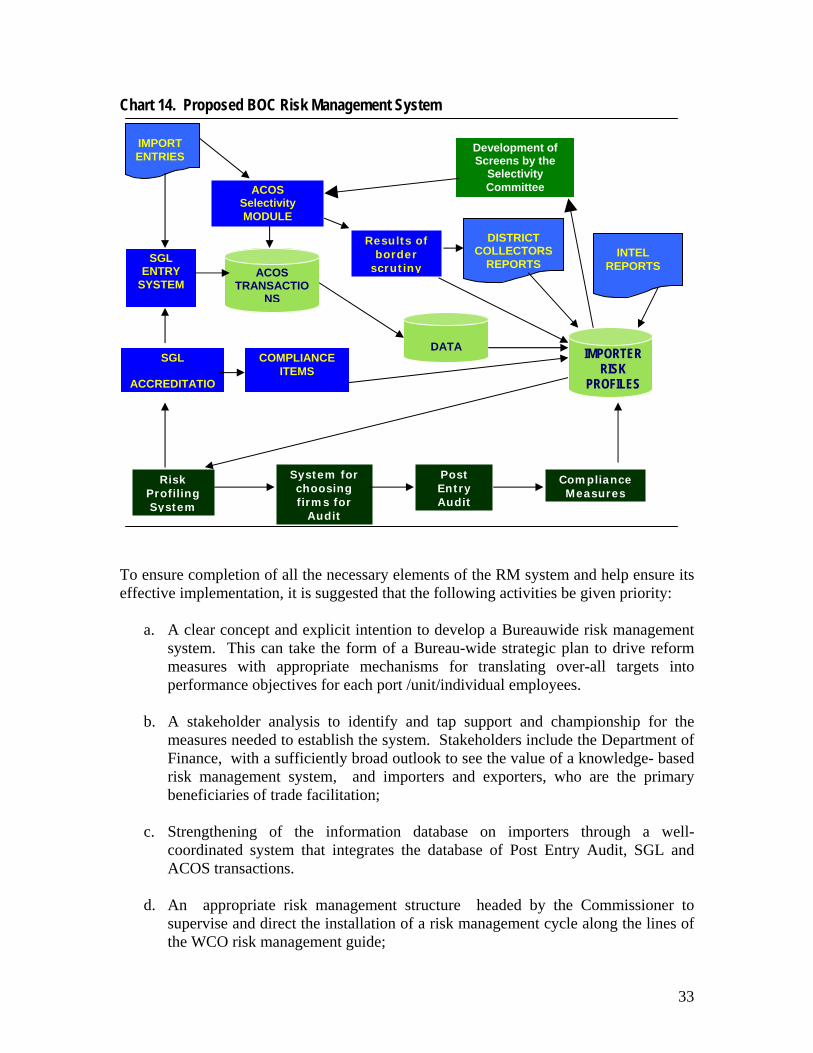
Chart 14. Proposed BOC Risk Management System
To ensure completion of all the necessary elements of the RM system and help ensure its effective implementation, it is suggested that the following activities be given priority:
a. A clear concept and explicit intention to develop a Bureauwide risk management system. This can take the form of a Bureau-wide strategic plan to drive reform measures with appropriate mechanisms for translating over-all targets into performance objectives for each port /unit/individual employees.
b. A stakeholder analysis to identify and tap support and championship for the
measures needed to establish the system. Stakeholders include the Department of Finance, with a sufficiently broad outlook to see the value of a knowledge- based risk management system, and importers and exporters, who are the primary beneficiaries of trade facilitation;
c. Strengthening of the information database on importers through a well-
coordinated system that integrates the database of Post Entry Audit, SGL and ACOS transactions.
d. An appropriate risk management structure headed by the Commissioner to
supervise and direct the installation of a risk management cycle along the lines of the WCO risk management guide;
DATA
IMPORT ENTRIES
ACOS Selectivity MODULE
Results of border
scrutiny
Post Entry Audit
SGL ENTRY
SYSTEM ACOS
TRANSACTIONS
SGL
ACCREDITATIO
COMPLIANCEITEMS
Compliance Measures
System for choosing firms for
Audit
Risk Profiling System
Development ofScreens by the
Selectivity Committee
DISTRICT COLLECTORS
REPORTS INTEL
REPORTS
IMPORTER
RISK PROFILES
33
e. Transformation of the SGL organizational framework into an account
management system which offers sufficient incentives for compliance, facilitates the accreditation process, and ensures its integrity;
f. Strengthening of the PEAG, to build its capability to evaluate compliance levels
of major importers and groups of importers;
g. Improving coordination among SGL, PEAG, Collection Service, Assessment, Intelligence, MISTG to allow them to play crucial roles in the risk management system in a well-coordinated manner.
h. Administrative support in the form of :
- Merit- based recruitment to provide adequate staffing for the respective units; - Skills training programs to match the skills requirements of the respective
units; - Discipline and Integrity among the work force, through internal audit and the
enforcement of sanctions, penalties for violations; and - Installing a realistic values formation program with appropriate rewards and
sanctions Two areas, of the proposed RM system, namely Post Entry Audit and the Super Green Lane Program need more focused attention for two reasons: first because they are critical elements of the system and second, because they are relatively new and need strengthening. The following sections will look at these areas with greater depth in the hope of shedding some light on what needs to be done to strengthen them institutionally and make them more effective. Post Entry Audit In April 2001, the Philippine Congress passed RA 9135, mandating the adoption of the WTO Transaction Value System. The law also mandated Customs to conduct Post Entry Audit of import entries. Post Entry audit is a global best practice associated with the WTO Transaction Value System. Aside from facilitating trade flows by relocating the review process away from the border to the back end, Post Entry audit also enables Customs to
- identify adjustments to dutiable value such as royalties, assists and selling commissions which may not be apparent at the time of importation;
- enforce customs regulations from the broader perspective of the importer’s entire import operations rather than in separate isolated transactions; and
- supplement border controls with back-end controls. The important milestones in the development of BOC’s institutional capability to conduct post entry audit are as follows:
34
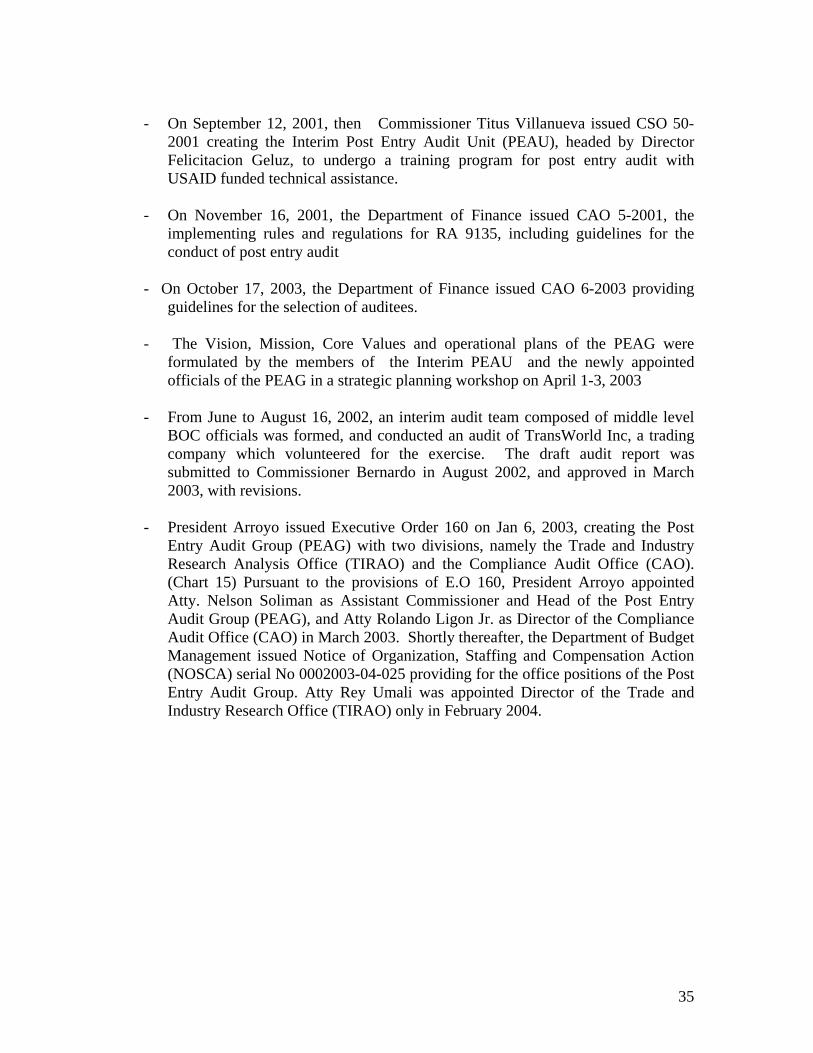
- On September 12, 2001, then Commissioner Titus Villanueva issued CSO 50-
2001 creating the Interim Post Entry Audit Unit (PEAU), headed by Director Felicitacion Geluz, to undergo a training program for post entry audit with USAID funded technical assistance.
- On November 16, 2001, the Department of Finance issued CAO 5-2001, the
implementing rules and regulations for RA 9135, including guidelines for the conduct of post entry audit
- On October 17, 2003, the Department of Finance issued CAO 6-2003 providing
guidelines for the selection of auditees.
- The Vision, Mission, Core Values and operational plans of the PEAG were formulated by the members of the Interim PEAU and the newly appointed officials of the PEAG in a strategic planning workshop on April 1-3, 2003
- From June to August 16, 2002, an interim audit team composed of middle level
BOC officials was formed, and conducted an audit of TransWorld Inc, a trading company which volunteered for the exercise. The draft audit report was submitted to Commissioner Bernardo in August 2002, and approved in March 2003, with revisions.
- President Arroyo issued Executive Order 160 on Jan 6, 2003, creating the Post
Entry Audit Group (PEAG) with two divisions, namely the Trade and Industry Research Analysis Office (TIRAO) and the Compliance Audit Office (CAO). (Chart 15) Pursuant to the provisions of E.O 160, President Arroyo appointed Atty. Nelson Soliman as Assistant Commissioner and Head of the Post Entry Audit Group (PEAG), and Atty Rolando Ligon Jr. as Director of the Compliance Audit Office (CAO) in March 2003. Shortly thereafter, the Department of Budget Management issued Notice of Organization, Staffing and Compensation Action (NOSCA) serial No 0002003-04-025 providing for the office positions of the Post Entry Audit Group. Atty Rey Umali was appointed Director of the Trade and Industry Research Office (TIRAO) only in February 2004.
35
• Ensure effectiveness and strict implementation of PEA policies, systems & directions
Commissioner Bernardo issued CMO 11-2003 on May 29, 2003, providing guidelines for the screening, selection and recruitment of personnel for the positions in the Post Entry Audit Group, under the supervision of a Board of Examiners (BOE). The selection of 60 candidates from some 3,000 applicants took place from July to August, 2003. In October 2003, Commissioner Bernardo issued a Customs Personnel Order naming 13 successful candidates from the Bureau, and instructing them to assume their positions in the PEAG. It took three months (November 2003 to January 2004) for the remaining candidates from outside the Bureau to process their applications. Several capacity building activities were conducted for the newly recruited personnel of the PEAG, as follows:
- a JICA-sponsored two-week training on Valuation and Post Entry Audit Operations in Japan for eleven of the new recruits
- a 28-day training in Japan sponsored by the Ministry of Finance on Valuation and Post Entry Audit Operations.
- a month-long orientation by the World Trade Institute (WTI), covering basic Customs regulations and procedures on classification, and Valuation.
Despite the capacity building measures, the progress of PEAG operations have been sporadic and plagued with a number of serious setbacks. Poor coordination with other units led to problems in accessing data needed to prepare importer profiles. Complaints from the trade community regarding the conduct of post entry audit, and questions on the auditee selection process led to a suspension of audit operations in August 2004, by order of the Department of Finance. It was not until December 2004 that the suspension was lifted, after the issuance of CAO 6-2004 amending CAO 5-2001 in November. Audit operations actually resumed in January 2005.
Post-Entry Audit Group
Chart 15. Functional Organization of the Post Entry Audit Group
• Lead PEA organizational change program
• Support BOC modernization efforts • Lead advocacy & communication
program on PEA
Trade Information &
Compliance Assessment
Office Risk Analysis Office
• Formulate audit work plan • Set framework & benchmarks for compliance
measurements of industry groups • Conduct field audits • Prepare & submit reports
• Develop & implement risk management system • Develop, implement & monitor compliance program • Develop audit selection parameters
• Recommend audit targets • Set policies, guidelines & SOPs on conduct of audit
36
The BOC’s Post Entry Audit Group would have provided the vehicle for gathering, analyzing and accumulating data related to the risk management cycle. However, this potential has yet to be realized. An evaluation of the performance and capabilities of Post Entry Audit Group (Gaticales, Uvero and Madamba, 2005) had the following findings:
- Lack of consensus on policy directions - Absence of horizontal management support - Need to further develop PEA policies - Underdeveloped systems and processes - Deficient data gathering and analytical tools - Private sector poorly informed - Field audit rules lack transparency / fairness - Audit conduct less than reasonable / ”fishing” - No assistance policy nor incentive for compliance - Inadequate logistical and funding support - PEAG complement under-staffed and under-skilled.
The Super Green Lane Program The Super Green Lane Program was established in April 2000 to address the public clamor for a program that would take the place of the pre-shipment inspection system of the Societe Generale Surveillance (SGS) which was then being phased out. On March 31, President Joseph Estrada signed Executive Order 230 authorizing the establishment and maintenance of a “Super Green Lane Facility” at the Bureau of Customs. Pursuant to the provisions of the E.O., Customs Administrative Order 2-2000 and Customs Administrative Order 2-2000 were issued providing for guidelines in the implementation of the program. Since it was a new program, as yet untried and untested, the Bureau cautiously introduced the SGL as a privilege available only to the top 1,000 importers in terms of duties and taxes paid. The Bureau sent invitations to the top 300 importers. However, after almost four years of operations, only about 83 companies had qualified as members, and of the total membership only about 67 were found to be actively using the facility for their import transactions. In 2003, average revenue collections from SGL shipments accounted for less than 8% of total annual collections of the Bureau, well below the 80% target set initially. During the consultations conducted under the AGILE-EGTA program in 2002-2003, the following problems were raised and identified as probable causes of the slow uptake of the program:
1) No specific office to assist importers through the application process and when they encounter programs in entry lodgment;
37
2) The entry fee of a fixed P2,500 was found to be too prohibitive, wiping out the
costs savings that was supposed to result from the program’s benefits;
3) No significant advantage over the Green Lane in terms of transactions time line because of the truck ban
4) Delays caused by such operational problems as computer downtime, delay in
transmission of bank payment advice to customs cash division, and the late uploading of the cargo manifests to ACOS need to be more effectively addressed ;
5) Permits and licenses required by other agencies automatically disqualifies some
imports from SGL coverage. While some of the issues, e.g. those covered in (3), (4) and (5) are beyond the jurisdiction of the BOC, the others were actionable, and with USAID-funded technical assistance to the BOC under the AGILE-EGTA program, the Bureau undertook measures to address these issues. In July 2003, the Bureau issued Customs Administrative Order 6-2003 and Customs Memorandum Order 28-2003. The former expanded the program coverage beyond the top 1,000 importers, allowing other importers to apply for accreditation. The fixed entry fee was also restructured to a graduated fee based on import volume. Effectively, the entry fee was estimated to have been reduced from the fixed P2,500 to P1,000 or less for about 80% of average transactions. CMO 28-2003 established the organizational structure and coordination mechanisms to implement the provisions of CAO 6-2003 (Chart 16). In spite of the provisions of CAO 6-2003, and capacity building activities, membership in the SGL Program has not increased substantially over the past year. The seeming lack of interest in SGL membership could be the result of the similarity of benefits offered under SGL with those under the Green Lane of the Selectivity System. One should bear in mind that SGL members have to go through an accreditation process and incur additional costs. If similar privileges could be availed of for free or at lower costs under the Selectivity System, then SGL membership may not prove at all attractive. There should be clear penalties for lower levels of compliance for SGL to function as an incentive for compliant behavior. However, unless all the elements of the RM system are in place and functioning effectively and unless the BOC develops the capability to assess risk and assign credible compliance ratings, SGL will not be able to function as envisioned.
38
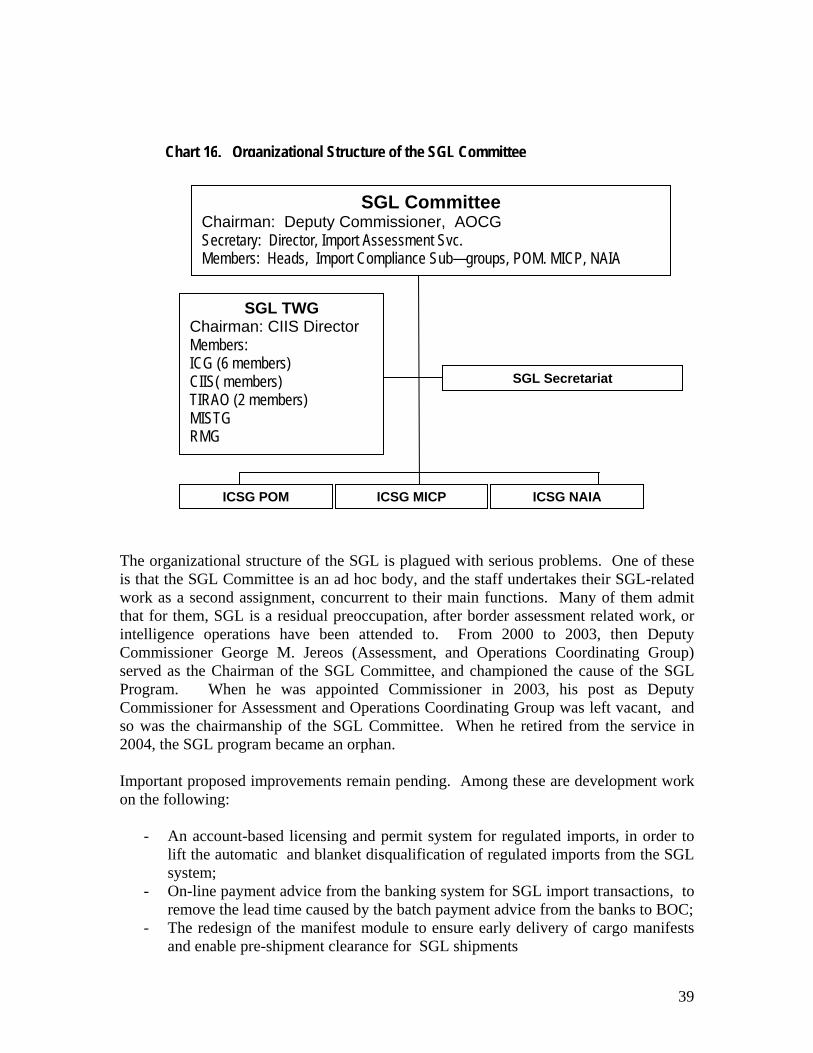
Chart 16. Organizational Structure of the SGL Committee
The organizational structure of the SGL is plagued with serious problems. One of these is that the SGL Committee is an ad hoc body, and the staff undertakes their SGL-related work as a second assignment, concurrent to their main functions. Many of them admit that for them, SGL is a residual preoccupation, after border assessment related work, or intelligence operations have been attended to. From 2000 to 2003, then Deputy Commissioner George M. Jereos (Assessment, and Operations Coordinating Group) served as the Chairman of the SGL Committee, and championed the cause of the SGL Program. When he was appointed Commissioner in 2003, his post as Deputy Commissioner for Assessment and Operations Coordinating Group was left vacant, and so was the chairmanship of the SGL Committee. When he retired from the service in 2004, the SGL program became an orphan. Important proposed improvements remain pending. Among these are development work on the following:
- An account-based licensing and permit system for regulated imports, in order to lift the automatic and blanket disqualification of regulated imports from the SGL system;
- On-line payment advice from the banking system for SGL import transactions, to remove the lead time caused by the batch payment advice from the banks to BOC;
- The redesign of the manifest module to ensure early delivery of cargo manifests and enable pre-shipment clearance for SGL shipments
SGL Committee Chairman: Deputy Commissioner, AOCG Secretary: Director, Import Assessment Svc. Members: Heads, Import Compliance Sub—groups, POM. MICP, NAIA
ICSG MICP
SGL TWG Chairman: CIIS Director Members: ICG (6 members)
SGL Secretariat CIIS( members) TIRAO (2 members) MISTG RMG
ICSG POM ICSG NAIA
39
- The development of systems audit for the accreditation and monitoring of SGL accounts; and
- Reconsideration of the SGL entry fee, or the accessing of the SGL Fund to finance improvements in the computer system.
Today, the SGL program has been sidelined, with no regular meetings for the SGL Committee, and virtually no movement in the accreditation of new members. The accreditation system has not been able to establish a reliable database on compliance standards and measurement among SGL members. Although some SGL members attest to the value and importance of SGL privileges, not many reputable importers are interested because the slow and tedious accreditation process is itself a disincentive. This is aggravated by the fact that brokers see in the SGL a potential threat to the value or indispensability of their services to the importer. Meanwhile, importers regard the mainstream system as a second best equilibrium situation, where brokers can guarantee the release of cargo from customs at an established standard of clearance speed in exchange for informal “facilitation fees”. Impact on Transaction Costs and Corruption Under the conditions of information asymmetry in which Customs operates, information is a valuable commodity. The extent to which importers comply with rules and regulations is not easily known to customs, and significant resources are expended in order to obtain such information. The economic literature demonstrates that certain mechanisms such as signaling and self-selection serve to alleviate the problem of information asymmetry (Stiglitz, 1975). Under an integrated risk management system, the SGL Program, and the Post Entry Audit System could constitute a set of incentives and sanctions to influence private sector behavior. SGL is the carrot that would encourage compliance, and Post Entry is the stick that would deter non-compliant behavior. The Super Green Lane Program The Super Green Lane is fundamentally a signaling and self-selection mechanism. Importers who are interested in complying with the regulations signal their intention and self select through the process of accreditation. If an acceptable compliance level is ascertained through the accreditation process, certain savings in transactions cost redound to both the importer and Customs. On the part of the importer, trade facilitation benefits in exchange for the compliance would translate into lower transactions costs. On the part of Customs, the benefits would be an assurance of a stable revenue source with minimum administrative resources, which could then be reallocated to other importers who have not self-selected, and therefore are more likely to be high risks for non-compliance. No estimates have been made thus far of the impact of BOC policies on transaction costs. Given the paucity of data, one can only make an educated guess. In 2000, when the Super Green Lane was first established, CMO 2-2000 imposed an SGL fee of P2,500
40
per entry. Subsequently, SGL members complained against this fee. The argument forwarded in defense of the fee was that this was roughly the amount of “facilitation fees” that importers would otherwise have to pay to get their shipments released from Customs. In 2003, the SGL fee was restructured to a graduated fee which effectively reduced the fee to about P1,000 for about 80% of SGL transactions. The average SGL transactions volume at the three metroports is estimated at 200 daily. A crude estimate of the trade community’s aggregate savings in transactions cost resulting from such SGL fee restructuring is about P240,000 daily, or a total of P63.4 million in a 264-day year. The benefits to Customs resulting from a reallocation of resources to high risk transactions is more difficult to estimate, perhaps because such a reallocation is not easily achieved under the present circumstances. A note of caution should however be made. Preferential treatment and facilitation privileges for accredited importers is highly vulnerable to the risk of abuse through connivance between unscrupulous importers and BOC personnel that would compromise the integrity of the SGL accreditation process. Hence the importance of top level monitoring and intermittent integrity checks cannot be overemphasized. Post Entry Audit It has been about two and a half years since the Post Entry Audit Group was created through Executive Order 160. There is a temptation to credit the BOC’s favorable collection performance in 2002 and 2003 partly to the deterrent effect of the PEAG, but this is difficult to substantiate. Since its creation, the revenue collections directly credited to the Group amounts to about P55 million. This is often cited as sheer measure of the PEAG’s dismal failure to measure up to its mandate. Considering the low skills level among the staff, revenue targets for the PEAG should probably not be scaled much farther upwards in the immediate future. However, the formulation of policies to promote compliance among low risk importers could lead to revenue generation, even without considerable investments in skills training. A example is a Voluntary Disclosure program that would enable companies to voluntarily pay non-fraud deficiencies in taxes and duties which they uncovered on their own to mitigate their exposure arising from non-compliant activities that otherwise are not considered fraudulent.. In the medium term, the development of audit skills to find and assess adjustments to dutiable value from royalties, assists and commissions is a veritable source of additional revenues that PEAG could contribute to BOC’s collection performance.
41
References: Alburo, Florian, et al, “Time Measurement Study,” Joint program of the Japan International Cooperation Agency and the UP School of Economics, 2003 Australian National Audit Office, Risk Management in Commercial Compliance, Australian Customs Service, Audit Report No. 6, October, 1997 Ayres, Ian, and John Braithwaite. 1992. Responsive Regulation: Transcending the Deregulation Debate. New York: Oxford University Press. Barton, Bryan and Jeremy Adrulis, “Balancing and optimizing trade facilitation and border integrity, Strategies and options for the global Customs agency community,” An IBM Institute for Business Value executive brief, May 2003 Dhaliwal, Herb, Customs and Trade Administration Blueprint, A Discussion Paper, Canada Border Services Agency, RC4136 Autumn 1998 Gaticales, Alex M., Agaton O. Uvero and Maria Fe Esperanza V. Madamba, “Customs Audit Performance and Capability Assessment,” SAF Task 2.1.3.1, EMERGE-USAID, February, 2005 Holloway, Stephen, Risk Management Theory and Concepts, ADB Seminar, Shenzhen, PROC, June 7-10, 2005 Industry Panel on Customs Audit Reforms. 1995. Looking to the Future— Compliance Improvement, Report of the Industry Panel on Customs Audit Reforms. Canberra: Australian Customs Service. Jansson, Kjell, Lars Karlsson and Patrik Heinesson, EU Best Practice Administration 2000, Swedish Customs Administration, The Innovation Journal, April 24, 2000. Joint Technical Committee OB-007, Risk Management, Joint Australia-New Zealand Standard, Council of Standards Australia and Council of Standards, New Zealand, August 2004 Kelly, Raymond, Statement before the Senate Committee on Finance, April 13, 1999.
Office of the Auditor General of Canada, Canada Customs and Revenue Agency — Managing the Risks of Non-Compliance for Commercial Shipments Entering Canada,” 2001 report Sparrow, Malcolm. 2000. The Regulatory Craft. Washington, D.C.: Brookings Institution Press. Stiglitz, J.E. “The Theory of ‘Screening,’ Education, and the Distribution of Income” American Economic Review, June, 1975.
42
Treasury Board of Canada, with President’s message by Lucienne Robillard, The Integrated Risk Management Framework, March 2000 Widdowson, David Managing risk in the Customs Context, ADB Seminar, Shenzhen, PROC, June 7-10 2005 WCO Risk Management Guide, June 2003 Wilson, Thomas J., Protecting the Supply Chain From Disasters, Bearing Point presentation,Fwww. bearingpoint. comr Disasters
Winwood, Charles W. Statement Before the Subcommittee on Trade of the House Committee on Ways and Means Hearing on Trade Agency Budget Authorizations and Other Customs Issues, July 17, 2001
43