Embed Size (px)
Citation preview

Risk management gaining prominenceA risk survey of global asset management firms
Ex ecutive summaryThe results of our 2015 global survey of risk management executives show that although risk management is gaining prominence and is increasingly becoming a “top of the house” and board-level concern, firms continue to wrestle with implementing a more integrated approach.
G lobal regulators are increasingly f ocused on risk governance. They are dem anding that asset m anagers tak e a broader, enterprise-level view of risk and establish and m aintain robust risk governance program s, including direct involvem ent of the C EO and oversight by boards across every segm ent of the asset m anagem ent industry. W e note a potential trend toward a prudential regulatory approach in recent rule proposals subm itted by the U S S ecurities and Exchange C om m ission ( S EC ) , which, am ong other things, require the adoption of f orm aliz ed risk m anagem ent program s.1 , 2
“We find that strong risk management programs especially in asset m anagem ent where incidents have ripple ef f ects through markets, customers and overall confidence translate into firms that possess a heightened sense of awareness of their duties to custom ers, accountability and ownership f or their actions and ultim ately stronger cultures of com pliance.”
S pecial Agent David A. C haves, White Collar Coordinator/Complex Crimes, F ederal B ureau of I nvestigation
To explore how global asset management firms are responding to these challenges, we surveyed the heads of risk m anagem ent at 4 0 US-based global asset management firms. O ur results show that to an increasing degree, C EO s and boards are becom ing directly accountable for risk governance programs. As firms operationalize the risk management function, the role of the chief risk officer ( C RO ) is gaining m ore prom inence. At the sam e tim e, our results indicate the need f or better integration and coordination between the second line of def ense ( L oD) 3 ( i.e., risk m anagem ent and com pliance f unctions) .
The following overview of our survey findings delves into the drivers of the f ast- changing risk m anagem ent landscape, the m ost pervasive challenges firms are facing and how they are responding, including som e of the industry leading practices.
1 O pen- End F und L iquidity Risk M anagem ent P rogram s; S wing P ricing; Re- O pening of C om m ent P eriod f or I nvestm ent C om pany Reporting M oderniz ation Release; P roposed Rule, Release Nos. 3 3 - 9 9 2 2 ( 2 2 S eptem ber 2 0 1 5 ) .2 U se of Derivatives by Registered I nvestm ent C om panies and B usiness Developm ent C om panies; Release No. I C - 3 1 9 3 3 ( 1 1 Decem ber 2 0 1 5 ) .3 The Lo s, simply put, include the business units management first Lo , risk and compliance functions second Lo , Internal Audit third Lo and the Board fourth Lo .
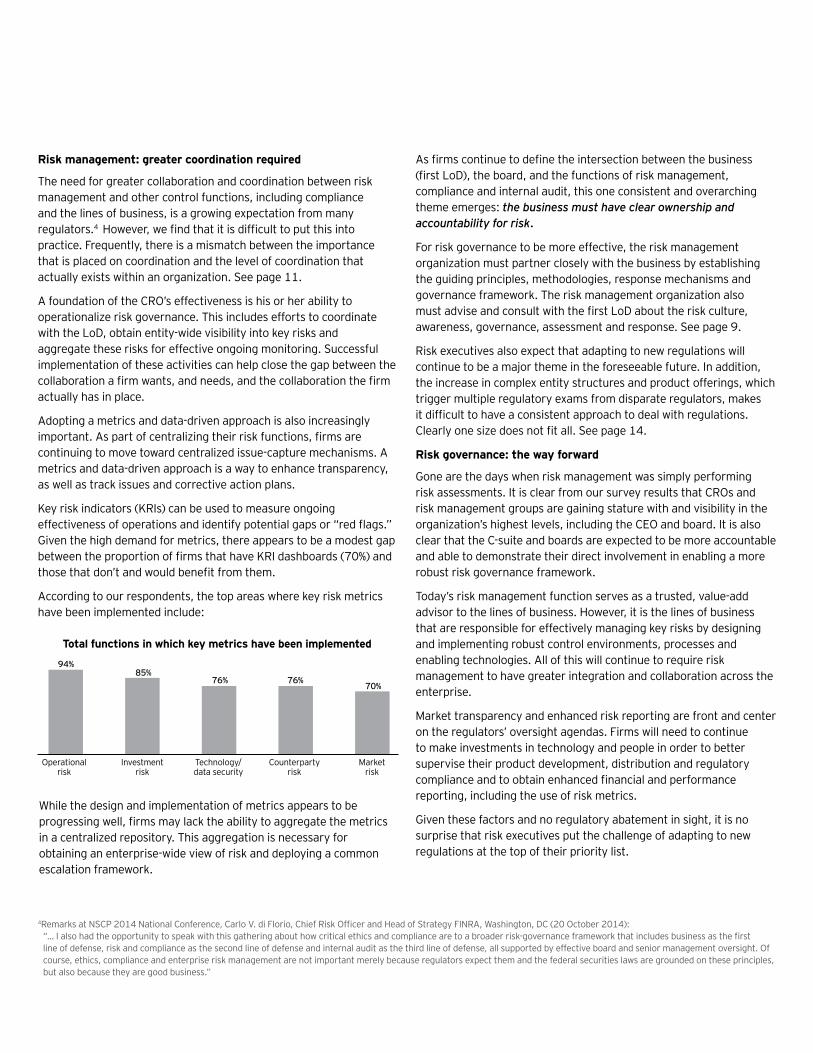
Technology/data security
Regulatory/com pliance risk
O perational risk
Third- party outsourcing risk
L iquidity risk
Rem ained the sam eI ncreased
9 7 %
8 7 %
8 4 %
8 2 %
1 6 %
1 3 %
1 8 %
8 2 %
3 %
1 8 %
8 %
W h at’ s driv ing th e ris k ag enda?
The concept of risk is broad and one that encom passes m any areas. H owever, a f ew types of risk are overwhelm ingly top- of - m ind f or risk m anagem ent executives ( e.g., reputational concerns) as seen in the f ollowing chart, which com pares 2 0 1 5 results f rom our 2 0 1 2 survey:
B ehind all these types of risk is an ever- growing need f or greater transparency into m ark ets. This includes enhanced reporting on potential system ic risk s, risk to retail custom ers and potential regulatory red ags.
To enable greater transparency, regulators have accelerated their rulem ak ing related to data collection. Recent rule proposals include reporting requirem ents f or collecting data on m utual f und portf olio risk s and product attributes, liquidity risk m anagem ent, “ f und census data and forward movement on special pro ects focused on derivatives risk , liquidity m onitoring and controls, stress testing in risk management programs and investment adviser living wills.
I n addition to the regulatory im plications of risk m anagem ent, there are growing reputational risk s. The perils of negative press resulting f rom regulatory enf orcem ent actions or settlem ents, data breaches and investor class- action lawsuits have caught the attention of senior executives and boards not to mention their investors and shareholders.

2 0 1 2
0
10
20
30
40
50
2 0 1 5
4 5 % 4 3 %
7 % 1 0 %
2 5 %
1 4 %7 % 8 %
4 %1 0 %
5 %0 %
7 %
1 5 %
C EO C F O C O O B oard ofdirectors
C hief legalor com pliance
officer
C I O / portf oliom anagers
O ther/don’ t k now
S enio r- mo s t rep o rting line
S enio r- mo s t rep o rting line by c u rrent ap p ro ac h to ris k manag ement
R is k manag ement: C- s u ite and bo ard- lev el c o nc ern
All of these f actors have created an environm ent where the need f or a robust risk governance f ram ework is top- of - m ind f or the C - suite and board. O ur survey results tell us that C EO s are tak ing responsibility f or the direction of their organiz ation’ s risk governance and are exhibiting a high level of involvem ent and accountability. This is a consistent theme regardless of the size of the firm.
I n f act, alm ost three- quarters of respondents reported that their C EO m eets with risk governance stak eholders either week ly or m onthly. A larger proportion of asset m anagers now have risk com m ittees rather than executive m anagem ent- level, investm ent or com pliance committees. At firms that have risk committees, the CEO serves as a member in almost one in three respondent firms. See page 6.
I n addition, we see a continuing trend toward f orm aliz ed risk governance program s. Nearly 8 0 % of survey participants reported that their risk management mandate is well defined, including CEO approval sponsorship. This is an area that has matured significantly in the last three years. S ee page 8 .
According to our respondents, the risk governance structure typically includes:
• W ritten policies and procedures ( 9 8 % )
• O rganiz ational charts ( 9 3 % )
• W ritten roles and responsibilities ( 9 0 % )
• Escalation protocols ( 8 8 % )
• A reporting dashboard with k ey risk indicators ( 7 0 % )
F irm s are tak ing a decidedly global approach to the im plem entation of the risk governance structure. H owever, there is still work to do. M ore than half of risk executives surveyed report that their firm has or plans to have) an initiative in place to f orm aliz e the risk governance structure. This is up from less than one in five from three years ago. S ee page 5 .
This change is lik ely a response to the increase in the breadth of risk s that the risk m anagem ent f unction is f ocused on, as well as the laser-f ocused attention of regulators and growing concerns of boards on risk m anagem ent and governance program s. This f ocus includes how the risk governance framework is being operationalized. The who, what and now why are being clearly explored and examined.
R is k manag ement: g aining p ro minenc e
I ntegral with the high level of C EO involvem ent is an expanding recognition of the risk m anagem ent value proposition. This has led to an increase in both the num ber and prom inence of C RO s. At an increasing pace, the C RO is getting a seat at the table and direct access to the CEO’s office.
The survey results also show a trend toward a centraliz ed risk management organization. Nearly 90 of asset management firms have their risk prof essionals report centrally, a m ark ed increase f rom 6 three years ago. Not surprising, the more mature and centralized an organiz ation’ s risk f unction, the higher up the C RO tends to report.
C Os are faced with the task of keeping their firm’s risk governance program nimble, efficient and capable of withstanding regulatory scrutiny. These executives m ust be able to ef f ectively leverage all of the enterprise’ s control f unctions to identif y, m easure, m onitor, m itigate and respond to risk events.
Am ong the survey results, a f ew f actors stand out as k eys to success. The C RO m ust be able to:
1 . Drive increased risk awareness across the enterprise, particularly the first Lo this typically includes the lines of business and m anagem ent units responsible f or controls
2 . Enhance the efficiency and effectiveness of risk assessments and testing program s
3 . C ollaborate ef f ectively with each L oD ( business, legal, com pliance, internal audit and the board) to reduce overlapping processes and redundancies and realiz e cost savings
H ybrid
0
10
20
30
40
50
60 Em beddedC entraliz ed 5 4 %
2 5 %
4 3 %
2 4 %1 5 %
1 0 %5 %5 %
2 5 %
1 5 %1 0 % 8 %
3 %
2 5 %
8 %0 % 0 % 0 % 0 %0 %
2 5 %
C EO C F O C O O B oard ofdirectors
C hief legalor com pliance
officer
C I O / portf oliom anagers
O ther/don’ t k now
• ,
4 emarks at NSCP 2014 National Conference, Carlo . di Florio, Chief isk Officer and ead of Strategy FIN A, Washington, C 20 October 2014 I also had the opportunity to speak with this gathering about how critical ethics and compliance are to a broader risk-governance framework that includes business as the first line of def ense, risk and com pliance as the second line of def ense and internal audit as the third line of def ense, all supported by ef f ective board and senior m anagem ent oversight. O f course, ethics, com pliance and enterprise risk m anagem ent are not im portant m erely because regulators expect them and the f ederal securities laws are grounded on these principles, but also because they are good business.
T o tal f u nc tio ns in w h ic h k ey metric s h av e been imp lemented
R is k manag ement: g reater c o o rdinatio n req u ired
The need f or greater collaboration and coordination between risk m anagem ent and other control f unctions, including com pliance and the lines of business, is a growing expectation f rom m any regulators.4 owever, we find that it is difficult to put this into practice. F requently, there is a m ism atch between the im portance that is placed on coordination and the level of coordination that actually exists within an organiz ation. S ee page 1 1 .
A f oundation of the C RO ’ s ef f ectiveness is his or her ability to operationaliz e risk governance. This includes ef f orts to coordinate with the L oD, obtain entity- wide visibility into k ey risk s and aggregate these risk s f or ef f ective ongoing m onitoring. S uccessf ul im plem entation of these activities can help close the gap between the collaboration a firm wants, and needs, and the collaboration the firm actually has in place.
Adopting a m etrics and data- driven approach is also increasingly important. As part of centralizing their risk functions, firms are continuing to m ove toward centraliz ed issue- capture m echanism s. A m etrics and data- driven approach is a way to enhance transparency, as well as track issues and corrective action plans.
K ey risk indicators ( K RI s) can be used to m easure ongoing effectiveness of operations and identify potential gaps or red ags. G iven the high dem and f or m etrics, there appears to be a m odest gap between the proportion of firms that have K I dashboards 70 and those that don’t and would benefit from them.
According to our respondents, the top areas where k ey risk m etrics have been im plem ented include:
0
20
40
60
80
100 9 4 %8 5 %
7 6 % 7 6 %7 0 %
O perationalrisk
I nvestm entrisk
Technology/data security
C ounterpartyrisk
M ark etrisk
W hile the design and im plem entation of m etrics appears to be progressing well, firms may lack the ability to aggregate the metrics in a centraliz ed repository. This aggregation is necessary f or obtaining an enterprise- wide view of risk and deploying a com m on escalation f ram ework .
As firms continue to define the intersection between the business first Lo , the board, and the functions of risk management,
com pliance and internal audit, this one consistent and overarching them e em erges: the business must have clear ownership and accountability for risk.
F or risk governance to be m ore ef f ective, the risk m anagem ent organiz ation m ust partner closely with the business by establishing the guiding principles, m ethodologies, response m echanism s and governance f ram ework . The risk m anagem ent organiz ation also must advise and consult with the first Lo about the risk culture, awareness, governance, assessm ent and response. S ee page 9 .
Risk executives also expect that adapting to new regulations will continue to be a ma or theme in the foreseeable future. In addition, the increase in com plex entity structures and product of f erings, which trigger m ultiple regulatory exam s f rom disparate regulators, m ak es it difficult to have a consistent approach to deal with regulations. Clearly one size does not fit all. See page 14.
R is k g o v ernanc e: th e w ay f o rw ard
G one are the days when risk m anagem ent was sim ply perf orm ing risk assessm ents. I t is clear f rom our survey results that C RO s and risk m anagem ent groups are gaining stature with and visibility in the organiz ation’ s highest levels, including the C EO and board. I t is also clear that the C - suite and boards are expected to be m ore accountable and able to dem onstrate their direct involvem ent in enabling a m ore robust risk governance f ram ework .
Today’ s risk m anagem ent f unction serves as a trusted, value- add advisor to the lines of business. H owever, it is the lines of business that are responsible f or ef f ectively m anaging k ey risk s by designing and im plem enting robust control environm ents, processes and enabling technologies. All of this will continue to require risk m anagem ent to have greater integration and collaboration across the enterprise.
M ark et transparency and enhanced risk reporting are f ront and center on the regulators’ oversight agendas. F irm s will need to continue to m ak e investm ents in technology and people in order to better supervise their product developm ent, distribution and regulatory compliance and to obtain enhanced financial and performance reporting, including the use of risk m etrics.
G iven these f actors and no regulatory abatem ent in sight, it is no surprise that risk executives put the challenge of adapting to new regulations at the top of their priority list.
• ,
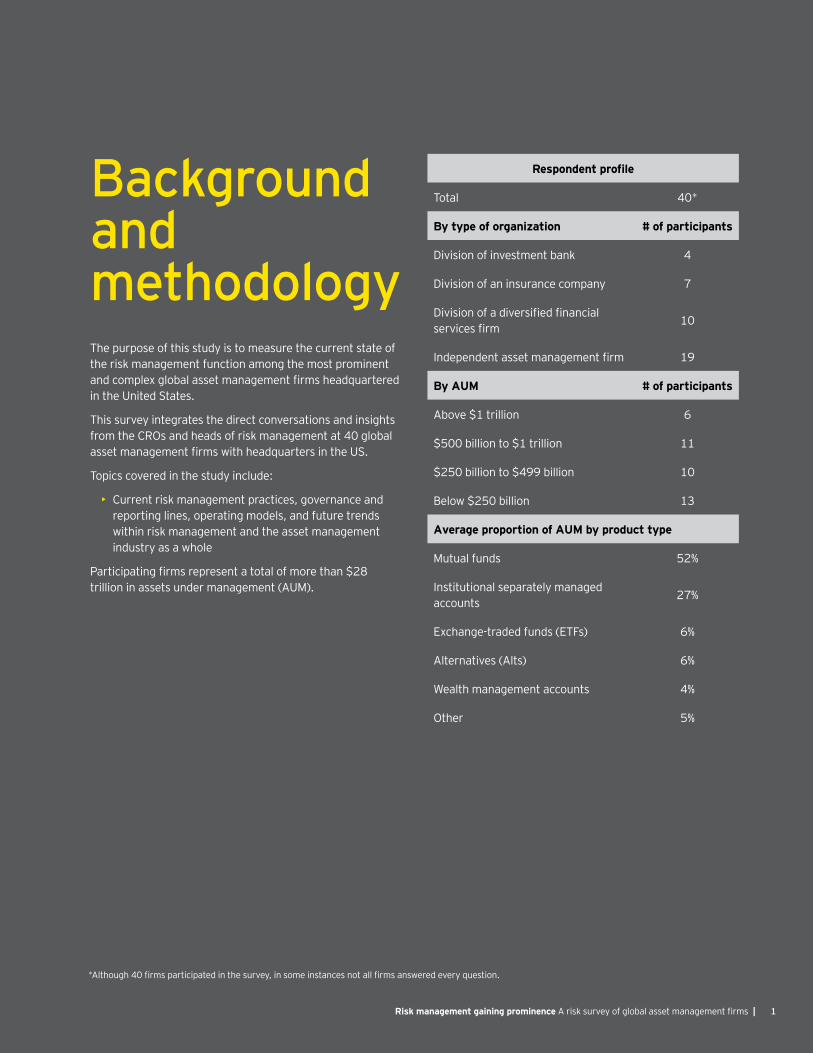
Although 40 firms participated in the survey, in some instances not all firms answered every question.
B ackground and methodology
Respondent profile
Total 4 0 *
B y typ e o f o rg anizatio n # o f p artic ip ants
Division of investm ent bank 4
Division of an insurance com pany 7
ivision of a diversified financial services firm
1 0
Independent asset management firm 1 9
B y A U M # o f p artic ip ants
Above $ 1 trillion 6
$ 5 0 0 billion to $ 1 trillion 1 1
$ 2 5 0 billion to $ 4 9 9 billion 1 0
B elow $ 2 5 0 billion 1 3
A v erag e p ro p o rtio n o f A U M by p ro du c t typ e
M utual f unds 5 2 %
I nstitutional separately m anaged accounts
2 7 %
Exchange- traded f unds ( ETF s) 6
Alternatives ( Alts) 6
W ealth m anagem ent accounts 4 %
O ther 5 %
1R is k manag ement g aining p ro minenc e A risk survey of global asset management firms |
The purpose of this study is to m easure the current state of the risk m anagem ent f unction am ong the m ost prom inent and complex global asset management firms headquartered in the U nited S tates.
This survey integrates the direct conversations and insights f rom the C RO s and heads of risk m anagem ent at 4 0 global asset management firms with headquarters in the US.
Topics covered in the study include:
• C urrent risk m anagem ent practices, governance and reporting lines, operating m odels, and f uture trends within risk m anagem ent and the asset m anagem ent industry as a whole
Participating firms represent a total of more than 2 trillion in assets under m anagem ent ( AU M ) .
2 | R is k manag ement g aining p ro minenc e A risk survey of global asset management firms
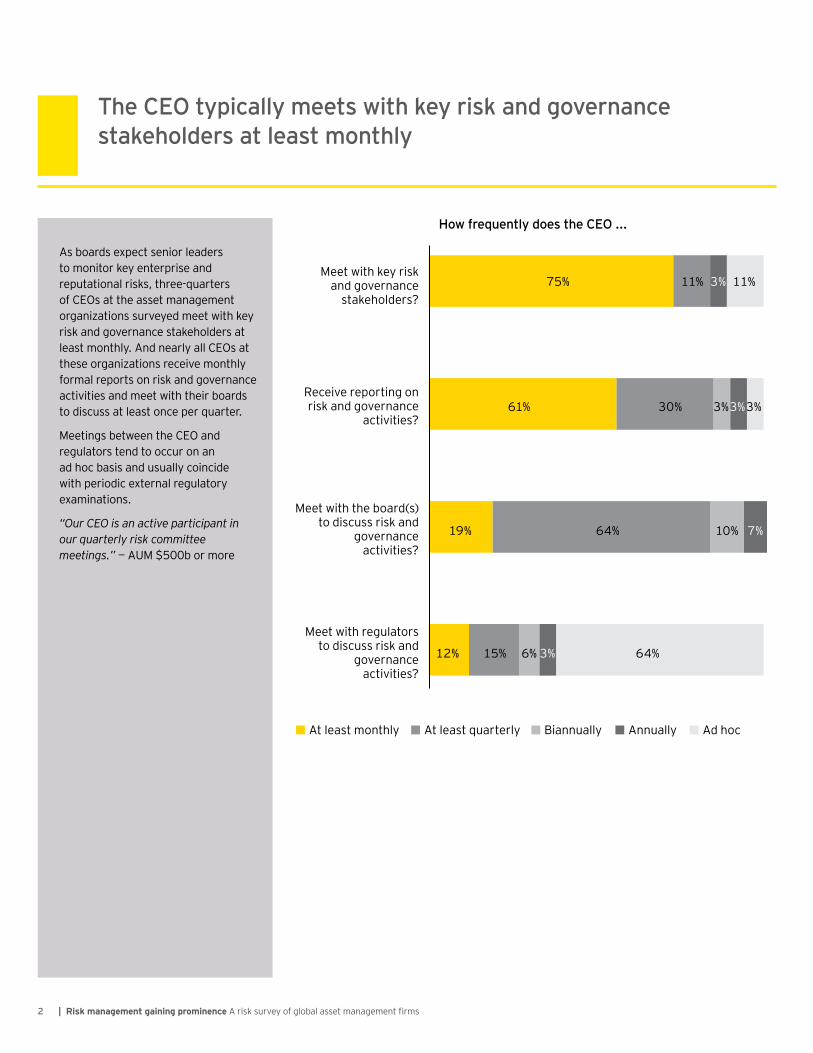
As boards expect senior leaders to m onitor k ey enterprise and reputational risk s, three- quarters of C EO s at the asset m anagem ent organiz ations surveyed m eet with k ey risk and governance stak eholders at least m onthly. And nearly all C EO s at these organiz ations receive m onthly f orm al reports on risk and governance activities and m eet with their boards to discuss at least once per quarter.
M eetings between the C EO and regulators tend to occur on an ad hoc basis and usually coincide with periodic external regulatory exam inations.
“Our CEO is an active participant in our quarterly risk committee meetings.” AUM 500b or more
T he C EO typically meets w ith key risk and governance stakeholders at least monthly
H ow freq uently does the C EO ...
M eet with k ey riskand governance
stak eholders?
Receive reporting onrisk and governance
activities?
M eet with the board( s)to discuss risk and
governanceactivities?
M eet with regulatorsto discuss risk and
governanceactivities?
At least m onthly At least quarterly B iannually Annually Ad hoc
7 5 %
6 1 %
1 9 %
1 2 % 1 5 % 6 % 3 % 6 4 %
6 4 % 1 0 % 7 %
3 0 % 3 % 3 % 3 %
1 1 % 3 % 1 1 %

3R is k manag ement g aining p ro minenc e A risk survey of global asset management firms
The C EO s of m ost asset m anagem ent firms are engaged and involved in the organiz ation’ s risk and governance f ram ework , regardless of the siz e of the firm.
Even in situations where the C EO appears to play a less active role ( i.e., approving the firm’s risk appetite statem ents) , a num ber of survey participants reported that the C EO is indirectly involved, f or exam ple, by delegating to the risk m anagem ent f unction.
“As a global bank-owned investment manager, the risk and governance framework and risk appetite is agreed on the bank group level and then broken down per business unit. The relevant legal entity board will formally approve what is relevant and applicable to them. This is an iterative process.” 500b or more
“Our CEO provides input and is fully aware of our governance framework and risk appetite statements, but does not design or approve them.”
Less than 500b
“The CEO has delegated these responsibilities to the risk management function, but is informed and consulted on all directives.”
500b or more
As firms develop more mature risk and governance program s, it is leading practice f or the C EO to be involved in approving the firm’s risk appetite statem ents. There still seem s to be opportunity, particularly f or smaller firms, for the CEO to be more involved.
L eading practice in the industry is for the C EO to be heavily involved in driving the culture of risk and governance
W hat is the role of the C EO in the risk and governance framew ork?
Establish and/ or approve the com m ittees and
com m ittee charters?
Design and/ or approve the riskand governance f ram ework ?
Approve the firm’ s risk appetite statem ents?
Total AU M $ 5 0 0 b or m ore AU M less than $ 5 0 0 b
6 8 %
7 1 %
6 5 %
6 5 %
6 5 %
6 5 %
4 3 %
5 3 %
3 5 %

4 | R is k manag ement g aining p ro minenc e A risk survey of global asset management firms
The m ore m ature/ centraliz ed an organiz ation’ s risk f unction is, the higher up in the organiz ation the C RO reports. U nderscoring this, half of all asset m anagers surveyed indicated that the C RO / head of risk reports to the CEO. This also parallels the finding that the C EO plays an active role in shaping a firm’s risk and governance f ram ework and aligns with the belief by two- thirds of respondents that the risk f unction has a “ seat at the table and is highly in uential in their organiz ation.
H aving the C RO report to others within the organiz ation ( i.e., the C F O or chief compliance officer CCO could result in the risk f unction having less independence and em powerm ent.
owever, at some large firms, where there could be substantial financial repercussions f rom issues related to risk m anagem ent and governance practices, the C RO has a direct reporting line into the organiz ation’ s CFO, CCO or chief legal officer CLO .
O ver the past three years, there has been a clear shif t away f rom having the C RO report to the C L O or C C O .
owever, for a few smaller firms, the C RO still reports to the C L O , C C O or even the C I O / portf olio m anagers ( P M s) .
“Having our CRO report directly to the CEO sends a clear message that risk has a seat at the table.”
500b or more
T he more centraliz ed risk management is, the higher up in the fi t e e ts
s t e st sen fi e ana e ttee t t e e s fi e or head of risk management has a direct reporting line?
T otal
2 0 1 22 0 1 5
C EO
C F O
C O O
B oard ofdirectors
C hief legalor com pliance
officer
C I O / portf oliom anagers
O ther/don’ t k now
4 5 %
4 3 %
1 5 %
1 0 %
1 0 %
2 5 %
1 4 %
8 %
7 %
5 %
4 %
7 %
0 %
7 %
H ybrid
0
10
20
30
40
50
60
Em bedded C entraliz ed
5 4 %
2 5 %
4 3 %
2 4 %1 5 %
1 0 %5 %5 %
2 5 %
1 5 %1 0 % 8 %
3 %
2 5 %
8 %0 % 0 % 0 % 0 %0 %
2 5 %
C EO C F O C O O B oard ofdirectors
C hief legalor com pliance
officer
C I O / portf oliom anagers
O ther/don’ t k now
W hat is your current risk management operating model?

5R is k manag ement g aining p ro minenc e A risk survey of global asset management firms
There has been a m ark ed shif t toward f orm aliz ing the risk and governance structure, including enhanced integration and coordination. M ore than half of risk executives surveyed report that their firm has or has a plan to have) an initiative in place to f orm aliz e the risk and governance structure, up f rom less than one in five three years ago. This is lik ely a response to the increase in the breadth of risk s that the risk function is focused on, such as firms creating/ of f ering m ore com plex outcom e- oriented strategies that are in dem and by investors and regulators’ laser- f ocused attention on firms’ risk management and governance program s ( in particular where an asset m anager is a division of a bank ) . The prolif eration of liquid Alts, leveraged ETF s, business developm ent com panies ( B DC s) , etc., along with the f ocus on asset gathering through retirem ent platf orm s and m ore com plex distribution arrangem ents, will require risk executives to rethink and formalize their firms’ risk and governance structures.
“It is critical that we more formalize and improve our risk management function as the industry continues to increase in complexity.”
Less than 500b Af ter f orm aliz ation of risk and governance structure, a globally consistent approach is high on risk executives’ lists. H owever, achieving this may be difficult if different regulatory regim es tak e inconsistent approaches. On the other hand, firms seem to have m atured in their m easurem ent of investm ent risk . W hat was their num ber one f ocus only three years ago has now f allen to the bottom of their list of priorities.
Asset managers see the need to further formaliz e their risk and governance structure
W hat are the top initiatives w ithin the risk management function over the nex t tw o years?
2 0 1 2 2 0 1 5
F orm aliz ation of risk andgovernance structure
G lobal im plem entation of riskand governance structure
Enterprise risk
C entraliz ation of riskm anagem ent f unction
O perational risk
Third- party/ vendor risk
I nvestm ent risk
5 6 %
1 8 %
2 2 %
2 2 %
2 0 %
1 7 %
1 8 %
1 7 %
1 4 %
1 4 %
3 2 %
1 1 %
1 6 %
0 %
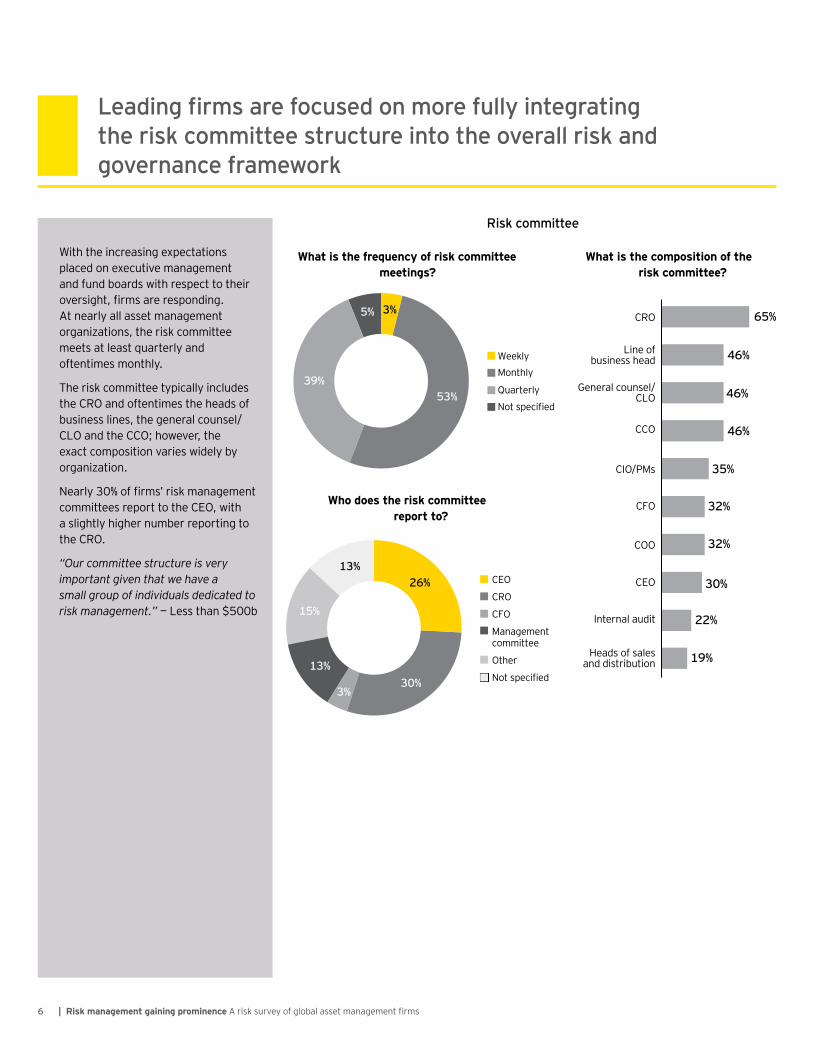
W eek lyM onthly
Q uarterly
Not specified5 3 %
3 %
3 9 %
5 %
C EO
C RO
C F O
M anagem entcom m ittee
O ther
Not specified3 0 %
2 6 %1 3 %
1 5 %
1 3 %
3 %
6 | R is k manag ement g aining p ro minenc e A risk survey of global asset management firms
C RO
L ine ofbusiness head
G eneral counsel/C L O
C C O
C I O / P M s
C F O
C O O
C EO
I nternal audit
H eads of salesand distribution
6 5 %
4 6 %
4 6 %
4 6 %
3 0 %
3 2 %
3 2 %
3 5 %
2 2 %
1 9 %
W ith the increasing expectations placed on executive m anagem ent and f und boards with respect to their oversight, firms are responding. At nearly all asset m anagem ent organiz ations, the risk com m ittee m eets at least quarterly and of tentim es m onthly.
The risk com m ittee typically includes the C RO and of tentim es the heads of business lines, the general counsel/C L O and the C C O ; however, the exact com position varies widely by organiz ation.
Nearly 30 of firms’ risk management com m ittees report to the C EO , with a slightly higher num ber reporting to the C RO .
“Our committee structure is very important given that we have a small group of individuals dedicated to risk management.” Less than 500b
ead n fi s a e sed n e nte at n the risk committee structure into the overall risk and governance framew ork
s ttee
W h o do es th e ris k c o mmittee rep o rt to ?
W h at is th e f req u enc y o f ris k c o mmittee meeting s ?
W h at is th e c o mp o s itio n o f th e ris k c o mmittee?

7R is k manag ement g aining p ro minenc e A risk survey of global asset management firms
Only two in five risk executives are confident in the effectiveness of the com m ittees established as a com ponent of the risk and governance framework. The ma ority, particularly sm aller/ independent asset m anagers, f eel that the ef f ectiveness of com m ittees can be im proved.
Asset m anagers that are part of a larger organiz ation, be it an investm ent bank , insurance com pany or diversified financial services firm, have likely been sub ect to regulatory scrutiny f or a longer period of tim e. Theref ore, they believe that their com m ittees are a m ore ef f ective part of the risk and governance f ram ework .
A num ber of risk executives added that the level of ef f ectiveness varies depending on the com m ittee type. M anagem ent com m ittees are of tentim es m ore established and m ature and are theref ore seen as m ore ef f ective than other com m ittees that are newer.
“Management committee is a 5, but the risk committee is a 4, investment committee is a 3, and compliance committee is somewhat new, so it’s a 3.” Less than 500b
“The structures are there. The committees are empowered, but output has been somewhat ineffective. We have room to grow.”
Less than 500b
O ver half of risk ex ecutives feel that the effectiveness of committees can be improved
O n a scale of 1 to 5 , how effective are the committees in your organiz ation?
5 — H ighly ef f ective 3 to 4 — Needs im provem ent 1 to 2 — Not ef f ective
Total
$ 5 0 0 b or m ore
L ess than $ 5 0 0 b
I ndependent assetmanagement firm
Division oflarger firm
4 0 % 5 7 %
4 7 % 5 3 %
3 5 % 6 0 %
3 3 % 6 7 %
4 7 % 4 7 %
3 %
6 %
5 %

8 | R is k manag ement g aining p ro minenc e A risk survey of global asset management firms
4 to 5 ery well defined 3 — Neutral 1 to 2 Not defined at all
2 0 1 5 7 9 % 2 1 %
2 7 % 2 %7 1 %
9 8 % 9 3 % 9 0 % 8 8 %7 0 %
2 0 1 2
Written policies and procedures
Organizationcharts
Written roles and responsibilities
Escalationprotocols
K I dashboardreporting
4 to 5 ery well defined 3 — Neutral 1 to 2 Not defined at all
0 20 40 60 80 100
2 0 1 5 ( 3 8 ) 7 9 % 2 1 %
2 7 % 2 %7 1 %
0 % 5 0 %
9 8 % 9 3 % 9 0 % 8 8 %7 0 %
1 0 0 %
2 0 1 2 ( 4 4 )
Written policies and procedures
Organizationcharts
Written roles and responsibilities
Escalationprotocols
K I dashboardreporting
T he risk management function has matured over the past three years
O ver the past three years, asset m anagers have continued to f orm aliz e their risk m anagem ent f unctions. Nearly 8 0 % of survey participants reported that their risk management mandate is well defined. M uch of the increase f rom three years ago was driven by smaller firms, who are more confident than they were in the past that their risk m anagem ent mandate is now well defined and at a level on par with the larger firms.
aving a well-defined mandate is critical, given the m yriad of risk s that asset management firms face. As a result, the vast ma ority of the risk executives who noted room for improvement in the definition of their firms’ risk management mandate report that their firms are undertak ing initiatives to m ore clearly develop the m andate.
In addition to having a well-defined risk m anagem ent m andate, at least 9 in 1 0 risk executives said that their organiz ations have written policies and procedures, organiz ation charts, f orm al roles and responsibilities and escalation protocols.
G iven the high dem and f or m etrics, there is lik ely still a m odest gap between the proportion of firms that have K RI dashboards and those that don’t and would benefit from them.
“We have a well-defined risk management mandate supported by robust policies and procedures including roles and responsibilities.”
500b or more
e defined s t e s ana e ent andate
as e ts a a e nan e st t e d es t e fi a e
9R is k manag ement g aining p ro minenc e A risk survey of global asset management firms
4 to 5 ery well defined 3 — Neutral 1 to 2 Not defined at all
2 0 1 5 7 9 % 2 1 %
2 7 % 2 %7 1 %
9 8 % 9 3 % 9 0 % 8 8 %7 0 %
2 0 1 2
Written policies and procedures
Organizationcharts
Written roles and responsibilities
Escalationprotocols
K I dashboardreporting
4 to 5 ery well defined 3 — Neutral 1 to 2 Not defined at all
0 20 40 60 80 100
2 0 1 5 ( 3 8 ) 7 9 % 2 1 %
2 7 % 2 %7 1 %
0 % 5 0 %
9 8 % 9 3 % 9 0 % 8 8 %7 0 %
1 0 0 %
2 0 1 2 ( 4 4 )
Written policies and procedures
Organizationcharts
Written roles and responsibilities
Escalationprotocols
K I dashboardreporting
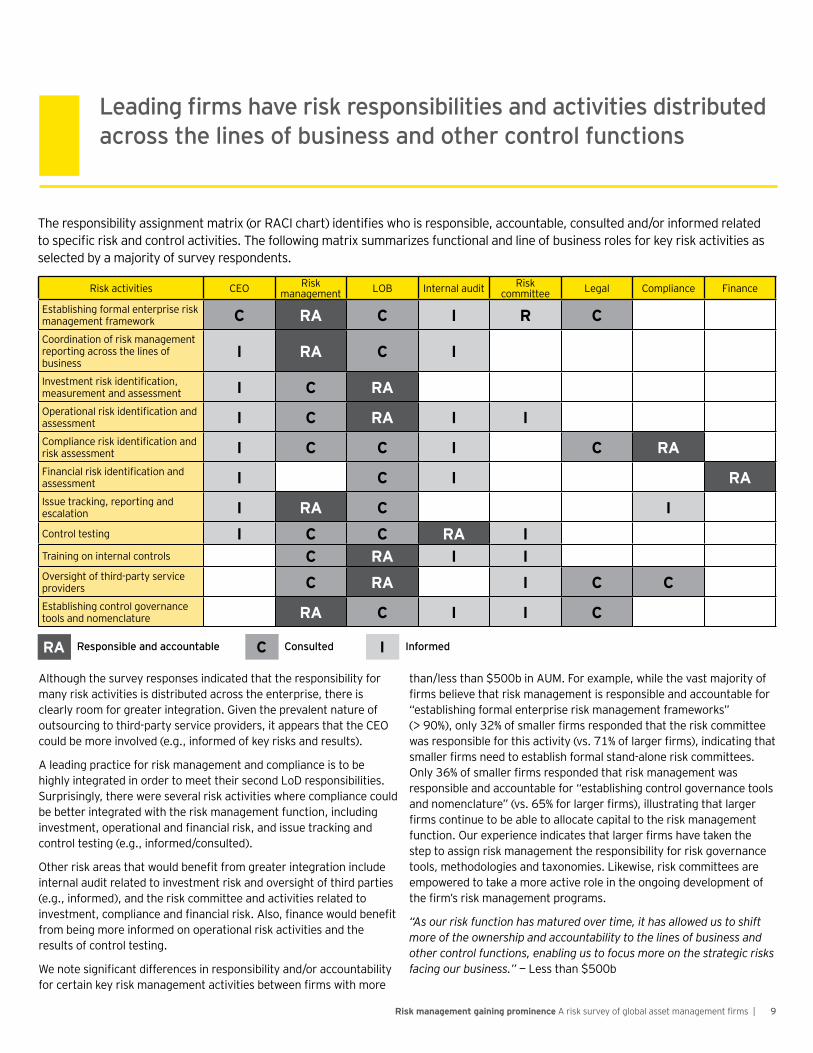
R A C IC onsulted
Although the survey responses indicated that the responsibility f or m any risk activities is distributed across the enterprise, there is clearly room f or greater integration. G iven the prevalent nature of outsourcing to third- party service providers, it appears that the C EO could be m ore involved ( e.g., inf orm ed of k ey risk s and results) .
A leading practice f or risk m anagem ent and com pliance is to be highly integrated in order to m eet their second L oD responsibilities. S urprisingly, there were several risk activities where com pliance could be better integrated with the risk m anagem ent f unction, including investment, operational and financial risk, and issue tracking and control testing ( e.g., inf orm ed/ consulted) .
Other risk areas that would benefit from greater integration include internal audit related to investm ent risk and oversight of third parties ( e.g., inf orm ed) , and the risk com m ittee and activities related to investment, compliance and financial risk. Also, finance would benefit f rom being m ore inf orm ed on operational risk activities and the results of control testing.
We note significant differences in responsibility and or accountability for certain key risk management activities between firms with more
than less than 500b in AUM. For example, while the vast ma ority of firms believe that risk management is responsible and accountable for establishing formal enterprise risk management frameworks 90 , only 32 of smaller firms responded that the risk committee
was responsible for this activity vs. 71 of larger firms , indicating that smaller firms need to establish formal stand-alone risk committees. Only 36 of smaller firms responded that risk management was responsible and accountable f or “ establishing control governance tools and nomenclature vs. 65 for larger firms , illustrating that larger firms continue to be able to allocate capital to the risk management function. Our experience indicates that larger firms have taken the step to assign risk m anagem ent the responsibility f or risk governance tools, m ethodologies and taxonom ies. L ik ewise, risk com m ittees are em powered to tak e a m ore active role in the ongoing developm ent of the firm’s risk management programs.
“As our risk function has matured over time, it has allowed us to shift more of the ownership and accountability to the lines of business and other control functions, enabling us to focus more on the strategic risks facing our business.” Less than 500b
ead n fi s a e s es ns b t es and a t t es d st b ted across the lines of business and other control functions
The responsibility assignment matrix or ACI chart identifies who is responsible, accountable, consulted and or informed related to specific risk and control activities. The following matrix summarizes functional and line of business roles for key risk activities as selected by a ma ority of survey respondents.
Risk activities C EO Risk m anagem ent L O B I nternal audit Risk
com m ittee L egal C om pliance F inance
Establishing f orm al enterprise risk m anagem ent f ram ework C R A C I R CC oordination of risk m anagem ent reporting across the lines of business
I R A C I
Investment risk identification, m easurem ent and assessm ent I C R AOperational risk identification and assessm ent I C R A I ICompliance risk identification and risk assessm ent I C C I C R AFinancial risk identification and assessm ent I C I R AI ssue track ing, reporting and escalation I R A C IC ontrol testing I C C R A ITraining on internal controls C R A I IO versight of third- party service providers C R A I C CEstablishing control governance tools and nom enclature R A C I I C
I nformedes ns b e and a ntab e
1 0 | R is k manag ement g aining p ro minenc e A risk survey of global asset management firms
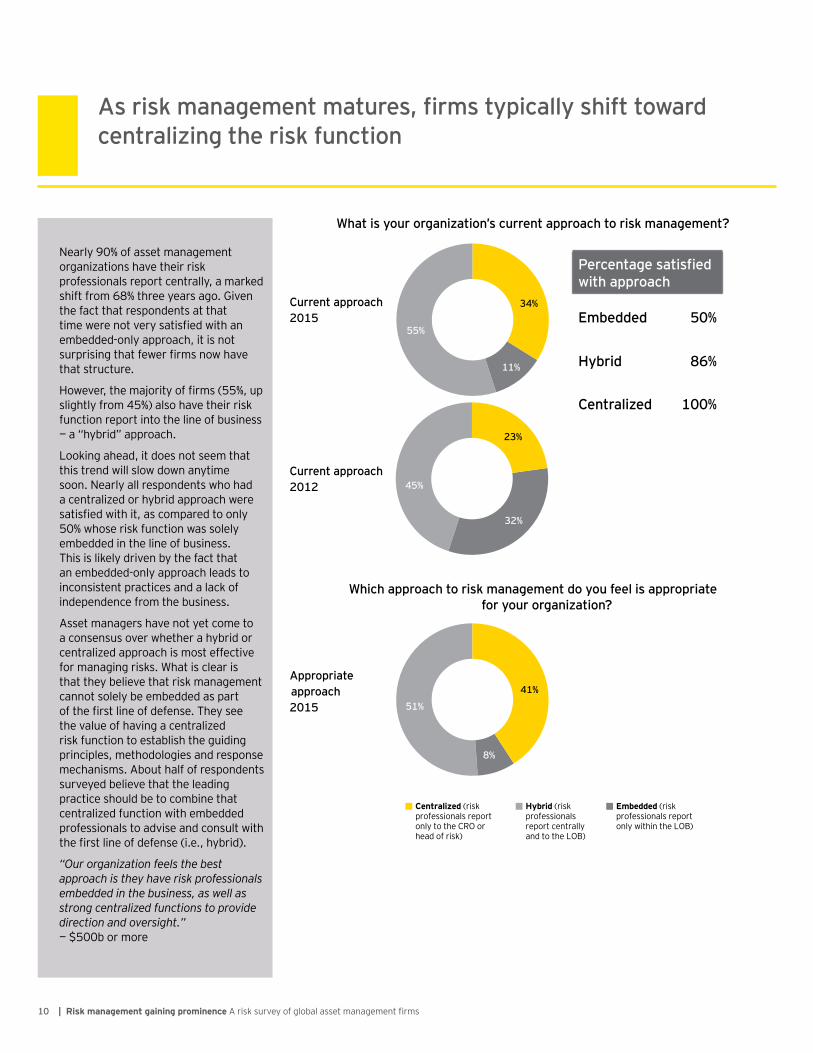
Nearly 9 0 % of asset m anagem ent organiz ations have their risk prof essionals report centrally, a m ark ed shift from 6 three years ago. Given the f act that respondents at that time were not very satisfied with an em bedded- only approach, it is not surprising that fewer firms now have that structure.
owever, the ma ority of firms 55 , up slightly f rom 4 5 % ) also have their risk f unction report into the line of business
a hybrid approach.
L ook ing ahead, it does not seem that this trend will slow down anytim e soon. Nearly all respondents who had a centraliz ed or hybrid approach were satisfied with it, as compared to only 5 0 % whose risk f unction was solely em bedded in the line of business. This is lik ely driven by the f act that an em bedded- only approach leads to inconsistent practices and a lack of independence f rom the business.
Asset m anagers have not yet com e to a consensus over whether a hybrid or centraliz ed approach is m ost ef f ective f or m anaging risk s. W hat is clear is that they believe that risk m anagem ent cannot solely be em bedded as part of the first line of defense. They see the value of having a centraliz ed risk f unction to establish the guiding principles, m ethodologies and response m echanism s. About half of respondents surveyed believe that the leading practice should be to com bine that centraliz ed f unction with em bedded prof essionals to advise and consult with the first line of defense i.e., hybrid .
“Our organization feels the best approach is they have risk professionals embedded in the business, as well as strong centralized functions to provide direction and oversight.”
500b or more
s s ana e ent at es fi s t a s t t a d centraliz ing the risk function
W hat is your organiz ation’ s current approach to risk management?
W hich approach to risk management do you feel is appropriate for your organiz ation?
C urrent approach2 0 1 5
C urrent approach2 0 1 2
Appropriateapproach 2 0 1 5
Centralized ( riskprof essionals reportonly to the C RO orhead of risk )
Embedded ( riskprof essionals report only within the L O B )
Hybrid ( riskprof essionals report centrallyand to the L O B )
3 2 %
2 3 %
4 5 %
1 1 %
3 4 %
5 5 %
8 %
4 1 %
5 1 %
Centralized ( riskprof essionals reportonly to the C RO orhead of risk )
Embedded ( riskprof essionals report only within the L O B )
Hybrid ( riskprof essionals report centrallyand to the L O B )
3 2 %
2 3 %
4 5 %
1 1 %
3 4 %
5 5 %
8 %
4 1 %
5 1 %
e enta e sat sfiedw ith approach
Embedded 5 0 %
H ybrid 8 6 %
C entraliz ed 1 0 0 %

1 1R is k manag ement g aining p ro minenc e A risk survey of global asset management firms
Total
$ 5 0 0 bor m ore
L ess than$ 5 0 0 b
3 — Neutral4 — I m portant 1 to 2 — Not im portant5 — V ery im portant
8 2 % 8 % 1 0 %
8 8 % 6 % 6 %
7 7 % 9 % 1 4 %
Total
$ 5 0 0 bor m ore
L ess than$ 5 0 0 b
3 — Neutral4 — C oordinated 1 to 2 — Not coordinated5 — H ighly coordinated
2 1 % 4 7 % 3 %2 9 %
1 8 % 4 7 % 6 %2 9 %
2 4 % 4 7 % 2 9 %
Total
$ 5 0 0 bor m ore
L ess than$ 5 0 0 b
3 — Neutral4 — I m portant 1 to 2 — Not im portant5 — V ery im portant
8 2 % 8 % 1 0 %
8 8 % 6 % 6 %
7 7 % 9 % 1 4 %
Total
$ 5 0 0 bor m ore
L ess than$ 5 0 0 b
3 — Neutral4 — C oordinated 1 to 2 — Not coordinated5 — H ighly coordinated
2 1 % 4 7 % 3 %2 9 %
1 8 % 4 7 % 6 %2 9 %
2 4 % 4 7 % 2 9 %
Nine out of ten firms reported that coordination am ong f unctions involved in risk and governance is im portant or very im portant. H owever, nearly one- third of risk executives report there is still room to im prove coordination.
This points to the need to clearly define the intersection of the first, second and third lines of def ense. The first line of defense needs to have responsibility f or m itigating business risk s and k eeping the business com pliant. The second line of def ense, in particular risk m anagem ent, should establish the guiding principles, m ethodologies, response m echanism s, governance f ram ework and advice/ consultation with the first line of defense with respect to risk culture, awareness, governance, assessm ent and response.
W hile there is room f or im provem ent, there are also potential barriers to integration. As one risk executive put it, there is a “ … lack of open constructive cooperation or common purpose to safeguard client interest and assets, and risk culture.”
500b or more
T here is a mismatch betw een the importance placed on coordination and the level of coordination that actually ex ists w ithin the organiz ation
C oordination across functions
H ow important is coordination across functions?
W hat is the level of coordination across functions?

1 2 | R is k manag ement g aining p ro minenc e A risk survey of global asset management firms
G iven the high level of im portance placed on coordination, it is surprising that only one-third of firms have a single repository in place where open risk issues, audit findings and com pliance violations are track ed and m ade available to all control f unctions. This is lik ely driven by legacy system s that still exist in organiz ations f or issue capture, escalation, and response and the overall difficulty in m anaging increasingly com plex asset m anagem ent organiz ations. H owever, if a risk executive wants to be able to ef f ectively m onitor and f ollow up on issues, there lik ely needs to be m ore com m unication and transparency, including a single repository to track and report on findings.
As regulatory expectations continue to increase related to aggregated risk m onitoring and centraliz ed issue track ing, it will be im perative f or asset m anagers to invest the resources necessary to create a m ore centraliz ed process and/ or system .
H owever, as one survey respondent points out, “Regulatory compliance for mutual funds sets the bar high for the rest of the organization. This can create inconsistencies on how we document, monitor, report and remediate issues, thus making the feasibility of a centralized reporting process very challenging.”
Less than 500b
T he lack of a single repository for open issues and violations may be hindering effective coordination
s t e e a s n e e s t e e en s ss es a d t find n s and an e violations are maintained and available to all control functions?
I f yes, w hat is used to store this repository?
Yes No Don’ t k now/ NA
6 3 %
3 2 %
5 %
P roprietary application V endor application( Archer, O penP ages,S hareP oint)
Excel
8 %
3 8 %
5 4 %

1 3R is k manag ement g aining p ro minenc e A risk survey of global asset management firms
I t does not seem lik e concerns around risk related to regulations and com pliance will abate anytim e soon. Nearly 8 0 % of risk executives state that this is one of the top risk s facing their firms, up from 50 three years ago. I n addition, third- party outsourcing risk grew significantly as a concern, perhaps driven by guidance issued by various regulators SEC, Office of the Comptroller of the
C urrency ( O C C ) and the C onsum er F inancial P rotection B ureau) .
There has already been an em phasis placed on increased transparency through data collection initiatives ( i.e., S EC ’ s redesigned f orm N- S AR and F orm ADV and the expectation of F I NRA’ s C ARDS ef f ort) , though it rem ains an open question as to whether regulators will require firms to adopt risk m anagem ent program s ( which is currently being considered by the S EC ) . I t is also unclear whether current program s will be “ good enough to satisfy industry regulators. These question m ark s are leaving a halo of uncertainty on the m inds of risk executives.
Rising f arthest up the list of concerns f rom three years ago, technology/data security risk is seen as a top risk by 7 9 % of study participants. The interconnectedness of various points of entry ( including third- party outsourcing, rem ote access, wireless network s and em ail) has increased the potential f or cybersecurity breaches.
“We are concerned with the sheer pace of technological advancements and the risk of not being able to keep up.” — L ess than $ 5 0 0 b
s s e ated t e at n an e and data se t a e become a bigger priority versus three years ago
W hat are the top risks currently facing the organiz ation?
Regulatory/com pliance risk
Technology/data security
O perational risk
S trategic risk
I nvestm ent risk
Reputational risk
Third- partyoutsourcing risk
C ounterparty risk
Enterprise risk
M ark et risk
L iquidity risk
2 0 1 22 0 1 5
6 9 %
4 1 %
4 7 %
3 8 %
4 7 %
3 0 %
1 6 %
8 %
3 7 %
4 1 %
3 7 %
2 0 %
3 4 %
5 0 %
3 4 %
1 1 %
1 1 %
2 7 %
7 9 %
5 0 %
2 7 %
7 9 %
1 4 | R is k manag ement g aining p ro minenc e A risk survey of global asset management firms
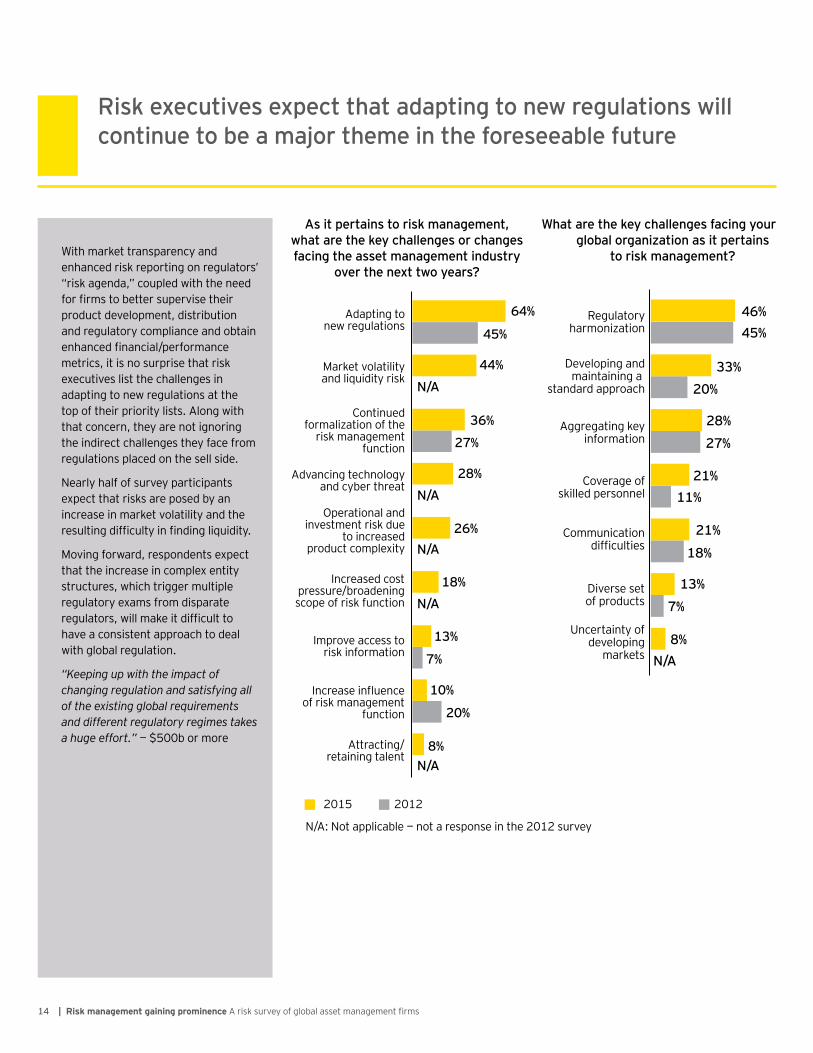
W ith m ark et transparency and enhanced risk reporting on regulators’ risk agenda, coupled with the need
for firms to better supervise their product developm ent, distribution and regulatory com pliance and obtain enhanced financial performance m etrics, it is no surprise that risk executives list the challenges in adapting to new regulations at the top of their priority lists. Along with that concern, they are not ignoring the indirect challenges they f ace f rom regulations placed on the sell side.
Nearly half of survey participants expect that risk s are posed by an increase in m ark et volatility and the resulting difficulty in finding liquidity.
M oving f orward, respondents expect that the increase in com plex entity structures, which trigger m ultiple regulatory exam s f rom disparate regulators, will make it difficult to have a consistent approach to deal with global regulation.
“Keeping up with the impact of changing regulation and satisfying all of the existing global requirements and different regulatory regimes takes a huge effort.” 500b or more
s e e t es e e t t at ada t n t ne e at ns continue to be a maj or theme in the foreseeable future
As it pertains to risk management, w hat are the key challenges or changes facing the asset management industry
over the nex t tw o years?
W hat are the key challenges facing your global organiz ation as it pertains
to risk management?
0 10 20 30 40 50 60 70 802 0 1 2
N/ A: Not applicable — not a response in the 2 0 1 2 survey
2 0 1 5
Adapting tonew regulations
M ark et volatilityand liquidity risk
C ontinuedf orm aliz ation of the
risk m anagem entf unction
Advancing technologyand cyber threat
O perational andinvestm ent risk due
to increasedproduct com plexity
I ncreased costpressure/ broadeningscope of risk f unction
I m prove access torisk inf orm ation
Increase in uenceof risk m anagem ent
f unction
Attracting/retaining talent
6 4 %
4 5 %
4 4 %
2 8 %
1 0 %
2 0 %
1 8 %
2 6 %
8 %
7 %
1 3 %
3 6 %
2 7 %
N / A
N / A
N / A
N / A
N / A
0 10 20 30 40 502 0 1 2 ( 4 4 )2 0 1 5 ( 3 9 )
Regulatoryharm oniz ation
Developing andm aintaining a
standard approach
Aggregating k eyinf orm ation
C overage ofsk illed personnel
C om m unicationdifficulties
Diverse setof products
U ncertainty ofdeveloping
m ark ets
4 6 %4 5 %
3 3 %
2 7 %
N / A
1 3 %
1 1 %2 1 %
7 %
8 %
1 8 %
2 1 %
2 0 %
2 8 %

1 5R is k manag ement g aining p ro minenc e A risk survey of global asset management firms
U nless the breadth of risk categories or areas that risk executives are expected to m onitor abates, it will be difficult for firms to curtail the size of their risk m anagem ent budget without finding efficiencies or accepting an increased num ber of risk f ailures. At least 5 0 % of respondents reported that they have increased their f ocus on each category of risk . This will lik ely put increased pressure on already challenged business m odels, particularly as firms introduce new and m ore com plex products and distribution strategies.
Given recent high-profile data breaches, it is not surprising that nearly all risk executives surveyed m entioned that risk s related to technology and data security have becom e a bigger f ocus over the past three years.
The ever- present specter of regulatory change has also necessitated risk executives to m ak e certain that they could stay in f ront of regulators’ evolving agendas; nearly 9 in 1 0 report that they have increased their f ocus on regulatory/ com pliance risk over the past three years.
“We cannot be a risk function that is all things to everyone. Therefore, we need to make strategic investments.” 500b or more
n ess e fi ent s t ns a e nd b d ets a a e t increase even further given the ex panded focus of the risk management function
Technology/data security
Regulatory/com pliance risk
O perational risk
Third- partyoutsourcing risk
M ark et risk
Reputational risk
I nvestm ent risk
S trategic risk
L iquidity risk
Enterprise risk
C ounterparty risk
Rem ained the sam e DecreasedI ncreased
9 7 %
8 7 %
8 4 %
1 2 %
8 2 %
1 6 %
1 3 %
1 8 %
7 2 % 2 8 %
5 %
3 4 %
4 0 %
6 6 %
6 6 %
3 4 %
3 4 %
8 2 %
6 6 %
7 6 %
5 5 %
3 %
3 %
1 8 %
2 1 %
8 %
O ver the past three years, w here has focus increased, decreased or remained the same?
1 6 | R is k manag ement g aining p ro minenc e A risk survey of global asset management firms
L ess than $ 5 0 0 b$ 5 0 0 b or m oreTotal
6 0 %7 1 %
5 2 %
2 3 %
6 %5 %
2 6 %1 8 %
5 % 8 % 4 %0 %
Executivem anagem ent
L ines ofbusiness
I nternalaudit
C om pliance
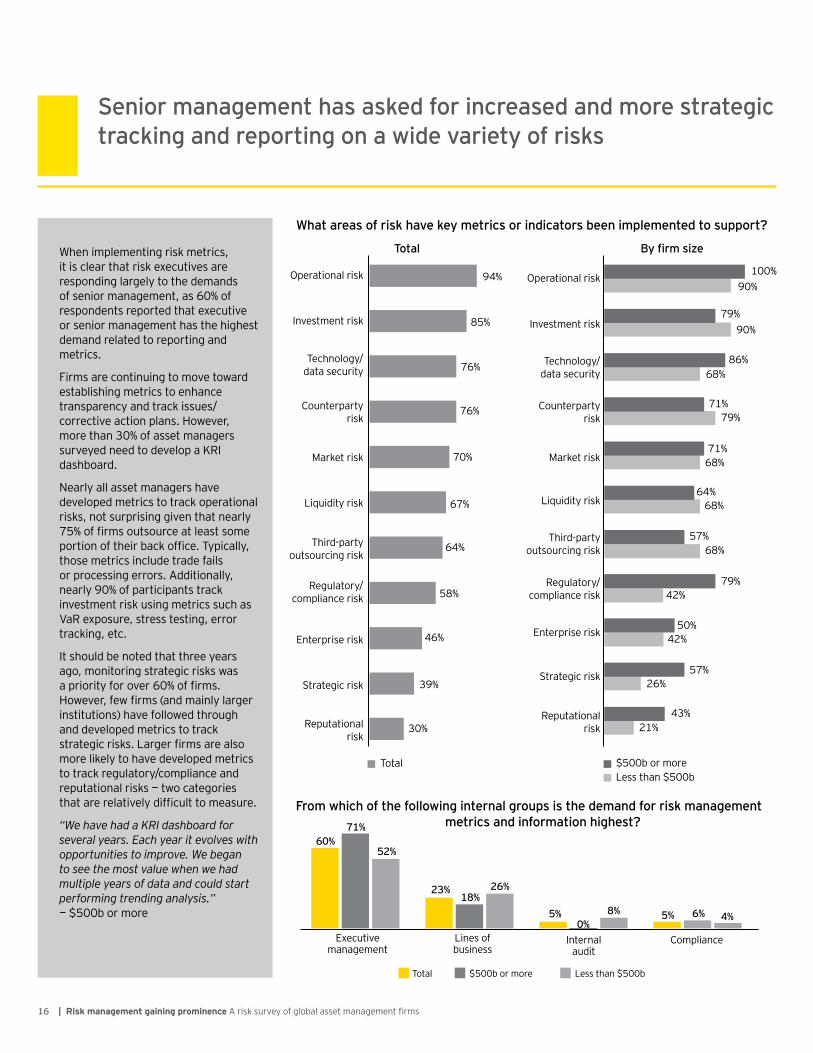
W hen im plem enting risk m etrics, it is clear that risk executives are responding largely to the dem ands of senior management, as 60 of respondents reported that executive or senior m anagem ent has the highest dem and related to reporting and m etrics.
F irm s are continuing to m ove toward establishing m etrics to enhance transparency and track issues/corrective action plans. H owever, m ore than 3 0 % of asset m anagers surveyed need to develop a K RI dashboard.
Nearly all asset m anagers have developed m etrics to track operational risk s, not surprising given that nearly 75 of firms outsource at least some portion of their back office. Typically, those m etrics include trade f ails or processing errors. Additionally, nearly 9 0 % of participants track investm ent risk using m etrics such as V aR exposure, stress testing, error track ing, etc.
I t should be noted that three years ago, m onitoring strategic risk s was a priority for over 60 of firms.
owever, few firms and mainly larger institutions) have f ollowed through and developed m etrics to track strategic risks. Larger firms are also m ore lik ely to have developed m etrics to track regulatory/ com pliance and reputational risks two categories that are relatively difficult to measure.
“We have had a KRI dashboard for several years. Each year it evolves with opportunities to improve. We began to see the most value when we had multiple years of data and could start performing trending analysis.”
500b or more
S enior management has asked for increased and more strategic tracking and reporting on a w ide variety of risks
Total $ 5 0 0 b or m oreL ess than $ 5 0 0 b
9 4 %
7 9 %
1 0 0 %9 0 %
8 6 %
7 1 %
6 4 %
7 9 %
6 8 %
6 8 %
5 7 %
7 9 %
4 2 %5 0 %
2 6 %
4 3 %2 1 %
5 7 %
6 8 %
4 2 %
7 1 %
6 8 %
9 0 %8 5 %
7 6 %
7 6 %
7 0 %
6 7 %
6 4 %
5 8 %
4 6 %
3 9 %
3 0 %
O perational risk
I nvestm ent risk
Technology/data security
C ounterpartyrisk
M ark et risk
L iquidity risk
Third- partyoutsourcing risk
Regulatory/com pliance risk
Enterprise risk
S trategic risk
Reputationalrisk
O perational risk
I nvestm ent risk
Technology/data security
C ounterpartyrisk
M ark et risk
L iquidity risk
Third- partyoutsourcing risk
Regulatory/com pliance risk
Enterprise risk
S trategic risk
Reputationalrisk
W hat areas of risk have key metrics or indicators been implemented to support?
F rom w hich of the follow ing internal groups is the demand for risk management metrics and information highest?
T otal fi s e
1 7R is k manag ement g aining p ro minenc e A risk survey of global asset management firms
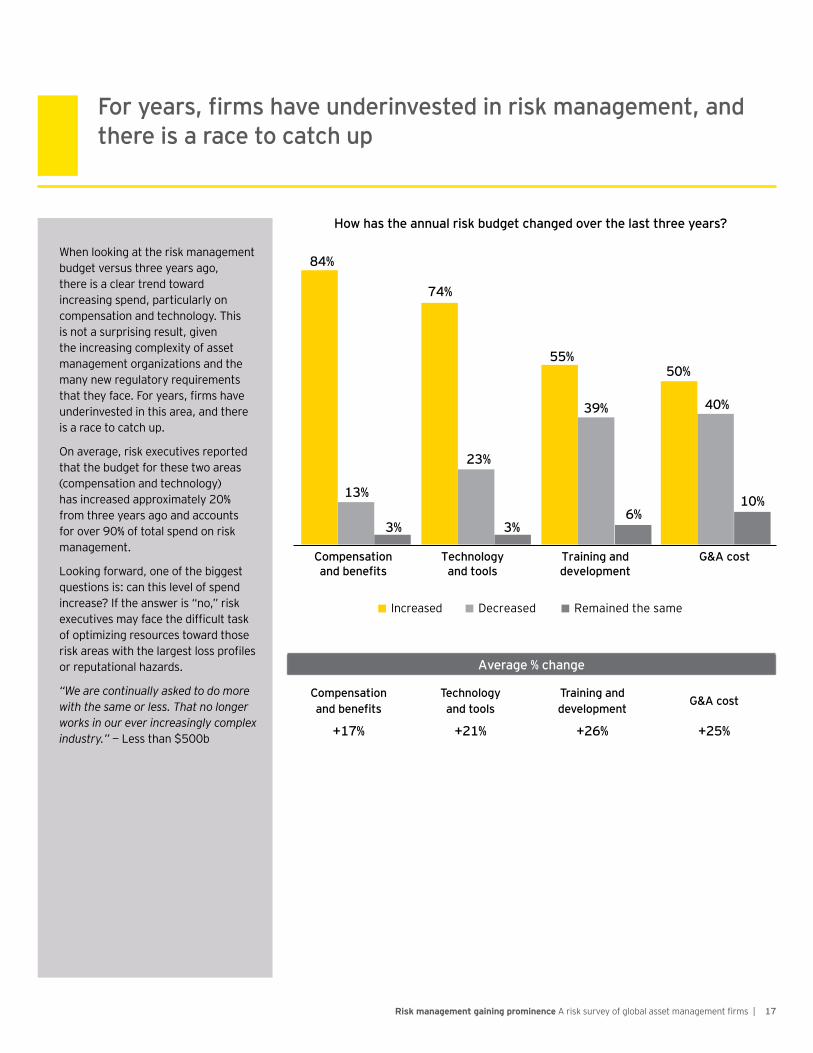
W hen look ing at the risk m anagem ent budget versus three years ago, there is a clear trend toward increasing spend, particularly on com pensation and technology. This is not a surprising result, given the increasing com plexity of asset m anagem ent organiz ations and the m any new regulatory requirem ents that they face. For years, firms have underinvested in this area, and there is a race to catch up.
O n average, risk executives reported that the budget f or these two areas ( com pensation and technology) has increased approxim ately 2 0 % f rom three years ago and accounts f or over 9 0 % of total spend on risk m anagem ent.
L ook ing f orward, one of the biggest questions is: can this level of spend increase If the answer is no, risk executives may face the difficult task of optim iz ing resources toward those risk areas with the largest loss profiles or reputational haz ards.
“We are continually asked to do more with the same or less. That no longer works in our ever increasingly complex industry.” Less than 500b
ea s fi s a e nde n ested n s ana e ent and there is a race to catch up
H ow has the annual risk budget changed over the last three years?
8 4 %
1 3 %
5 5 %5 0 %
4 0 %
3 % 3 %6 %
1 0 %
3 9 %
7 4 %
2 3 %
C ompensationand benefits
T echnologyand tools
T raining anddevelopment
G & A cost
I ncreased Rem ained the sam eDecreased
Average % change
C ompensationand benefits
T echnologyand tools
T raining anddevelopment
G & A cost
+ 1 7 % + 2 1 % + 2 6 % + 2 5 %

1 8 | R is k manag ement g aining p ro minenc e A risk survey of global asset management firms
Notably, slightly m ore risk executives than three years ago believe that the risk m anagem ent f unction is lack ing resources. This is som ewhat surprising given that most firms reported that budgets f or risk m anagem ent continue to rise. H owever, with regulators issuing guidance and better telegraphing their prudential approach to evaluating a firm’s enterprise risk governance f ram ework ( e.g., the O C C ’ s issuance of their heightened standards) , risk executives understand that they will need to f urther expand risk and governance processes, while already short of resources.
Technology is again agged by the largest proportion of risk executives as an area that is underresourced. As regulators increasingly scrutiniz e firms’ data security policies, risk executives recogniz e the need to be m ore f orward- look ing in their capital spend. I ncreasing hum an capital is also high on C RO s’ wish lists in the near term .
“With limited budgets and people, we need to take a holistic view and strategically invest in technology and tools.” 500b or more
“This is no longer a numbers game. We need to make sure that we have the right resources with the right experience to deal with complex issues.” 500b or more
Even w ith budget increases, few er risk ex ecutives say that the risk function is appropriately staffed and resourced
I s your risk management function appropriately staffed and resourced?
I f no, w hat areas do you feel are underresourced?
2 0 1 5 2 0 1 2
Yes
No
4 0 %
6 0 %
Yes
No
3 0 %
7 0 %
2 0 1 22 0 1 5
Technologyand tools
P ersonnel/headcount
Expertise
8 0 %8 7 % 8 5 %
7 7 %
2 7 %
4 6 %
1 9R is k manag ement g aining p ro minenc e A risk survey of global asset management firms
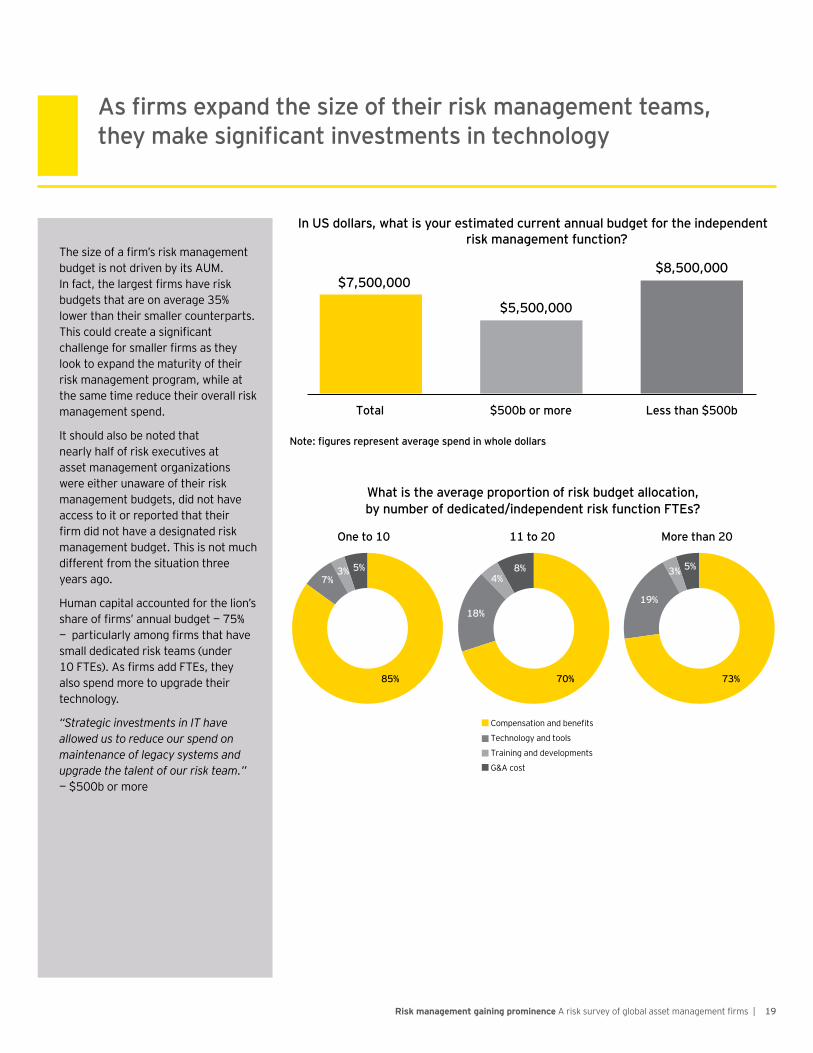
The size of a firm’s risk management budget is not driven by its AU M . In fact, the largest firms have risk budgets that are on average 3 5 % lower than their sm aller counterparts. This could create a significant challenge for smaller firms as they look to expand the m aturity of their risk m anagem ent program , while at the sam e tim e reduce their overall risk m anagem ent spend.
I t should also be noted that nearly half of risk executives at asset m anagem ent organiz ations were either unaware of their risk m anagem ent budgets, did not have access to it or reported that their firm did not have a designated risk m anagem ent budget. This is not m uch dif f erent f rom the situation three years ago.
H um an capital accounted f or the lion’ s share of firms’ annual budget 75
particularly among firms that have sm all dedicated risk team s ( under 10 FTEs . As firms add FTEs, they also spend m ore to upgrade their technology.
“Strategic investments in IT have allowed us to reduce our spend on maintenance of legacy systems and upgrade the talent of our risk team.”
500b or more
s fi s e and t e s e t e s ana e ent tea s t e a e s n fi ant n est ents n te n
Compensation and benefits
Technology and tools
Training and developm ents
G & A cost
8 5 %
7 %3 % 5 %
7 0 % 7 3 %
1 8 %
4 %8 %
1 9 %
3 % 5 %
I n U S dollars, w hat is your estimated current annual budget for the independent risk management function?
O ne to 1 0 1 1 to 2 0 M ore than 2 0
$ 7 , 5 0 0 , 0 0 0
$ 5 , 5 0 0 , 0 0 0
$ 8 , 5 0 0 , 0 0 0
T otal $ 5 0 0 b or more L ess than $ 5 0 0 b
te fi es e esent a e a e s end n e d a s
W hat is the average proportion of risk budget allocation, b n be ded ated nde endent s n t n s
2 0 | R is k manag ement g aining p ro minenc e A risk survey of global asset management firms
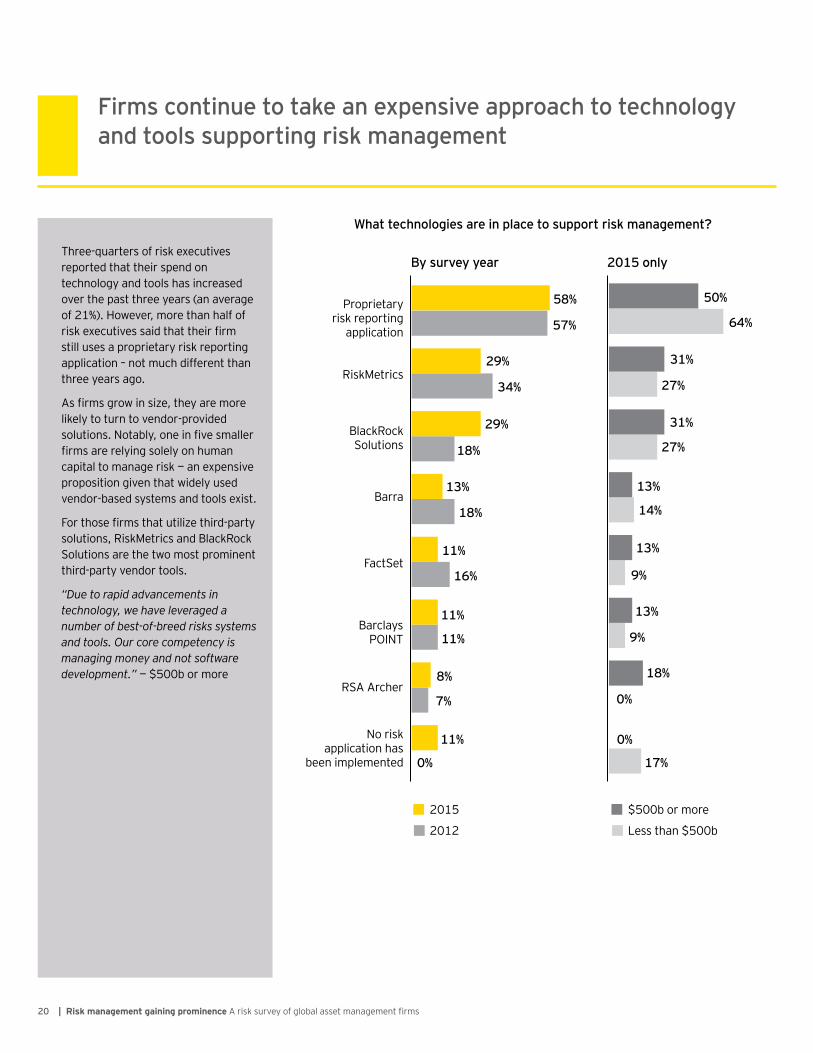
Three- quarters of risk executives reported that their spend on technology and tools has increased over the past three years ( an average of 2 1 % ) . H owever, m ore than half of risk executives said that their firm still uses a proprietary risk reporting application – not m uch dif f erent than three years ago.
As firms grow in size, they are more lik ely to turn to vendor- provided solutions. Notably, one in five smaller firms are relying solely on human capital to manage risk an expensive proposition given that widely used vendor- based system s and tools exist.
For those firms that utilize third-party solutions, Risk M etrics and B lack Rock S olutions are the two m ost prom inent third- party vendor tools.
“Due to rapid advancements in technology, we have leveraged a number of best-of-breed risks systems and tools. Our core competency is managing money and not software development.” 500b or more
F irms continue to take an ex pensive approach to technology and tools supporting risk management
0 10 20 30 40 50 602 0 1 2
2 0 1 5
P roprietaryrisk reporting
application
Risk M etrics
B lack RockS olutions
B arra
F actS et
B arclaysP O I NT
RS A Archer
No riskapplication has
been im plem ented
5 8 %
5 7 %
2 9 %
1 8 %
1 3 %
0 %
8 %
7 %
1 6 %
1 1 %
1 8 %
1 1 %
1 1 %
1 1 %
3 4 %
2 9 %
0 10 20 30 40 50 60 70 80L ess than $ 5 0 0 b
$ 5 0 0 b or m ore
5 0 %
6 4 %
3 1 %
2 7 %
1 3 %
0 %
1 8 %
0 %
9 %
1 3 %
1 4 %
1 7 %
1 3 %
9 %
2 7 %
3 1 %
W hat technologies are in place to support risk management?
B y survey year 2 0 1 5 only
• s
• s
Appendix
T erms and s defin t ns
CA R D S
C om prehensive Autom ated Risk Data S ystem ( C ARDS ) is a rule-based program that would allow F I NRA to collect on a standardiz ed, autom ated and regular basis, account inf orm ation, as well as account activity and security identification information that a firm maintains as part of its book s and records.
Co u nterp arty ris k
C ounterparty risk is the risk of def ault by a trade counterparty that f ails to deliver the shares or cash f or a transaction. This risk is prim arily relevant f or O TC ( over- the- counter) transactions that are conducted with client capital, and theref ore would potentially require the client to be m ade whole.
Cyber ris k
Cyber risk is the risk of theft of financial assets, intellectual property or other sensitive information belonging to firms, their customers or other business partners f rom lack of internal controls or external threats to a firm’s technology architecture. Such theft could create a financial loss, business disruption or damage to a firm’s reputation.
Enterp ris e ris k
Enterprise risk is the uncertainty an enterprise f aces that can im pact the achievem ent of its strategic, operational, reporting or com pliance ob ectives and its ability to manage risk to be within its risk appetite.
Ex c h ang e- traded f u nds ( ET F s )
An ETF portf olio track s stock indexes lik e the NAS DAQ - 1 0 0 I ndex, S & P 5 0 0 , Dow J ones, etc. W hen you purchase shares of an ETF , you are purchasing shares of a portf olio that track s the yield and return of its native index. The m ain dif f erence between ETF s and other types of index f unds is that ETF s don’ t try to outperf orm their corresponding index, but sim ply replicate its perf orm ance. They don’ t try to beat the m ark et, they try to be the m ark et.
F inanc ial I ndu s try R eg u lato ry A u th o rity ( F I N R A )
F I NRA is the largest self - regulatory organiz ation ( S RO ) in the securities industry in the U nited S tates. I t is a m em bership- based organiz ation that creates and enf orces rules f or m em bers based on the f ederal securities laws. S RO s, which are overseen by the S EC , are the f ront line in regulating brok er- dealers. The S EC is responsible f or ensuring f airness f or the individual investor, and F I NRA is responsible for overseeing virtually all US stockbrokers and brokerage firms.
F rau d ris k
F raud risk is the risk of an intentional act or om ission designed to deceive others, resulting in the victim suf f ering a loss and/ or the perpetrator achieving a gain.
G eneral and adminis trativ e ( G & A )
G & A expenditures are related to the day- to- day operations of a business. G & A expenses pertain to operation expenses rather than to expenses that can be directly related to the production of any goods or services. They include rent, utilities, insurance and m anagerial salaries.
I nv es tment ris k
Investment risk is commonly defined as a positive or negative derivation f rom an expected outcom e. Asset m anagers typically regard investm ent risk as a m easure of the expected return given the level of risk tolerance relative to agreed m ark et or internally set benchmarks. Some of these are typically specified within the asset m anager’ s risk appetite, of ten expressed at a corporate as well as at a client level.
K ey ris k indic ato r ( K R I )
A K I is a metric capable of showing that an organization is sub ect to, or has a higher probability of being sub ect to, a risk that exceeds the defined thresholds and may harm the continuity of the activity or pro ect.
L ines o f def ens e
L ines of def ense is a term com m only used to describe how risk and control- related roles, responsibilities and activities are coordinated within an organization e.g., first line of defense the business second line of defense risk and compliance .
2 1R is k manag ement g aining p ro minenc e A risk survey of global asset management firms |
Liquid alternatives (liquid alts)
Liquid alts are alternative investment strategies that are available through investment vehicles such as mutual funds, ETFs, closed-end funds, etc., that provide daily liquidity. These strategies can bet against traditional capital markets, use investments outside those markets, and/or tactically move within and across markets. Although their investment focus may be similar to that of hedge funds, liquid alternatives are also known as 40 Act funds because they were created by the US Congress in 1940.
Liquidity risk
Liquidity risk is the risk that the firm or fund, although solvent, either does not have sufficient available resources to enable it to meet its obligations (i.e., redemptions) as they come due, or can secure them only at excessive costs.
Market risk
Market risk is the risk of loss that can arise from fluctuations in values of, or income from, assets or that can arise from fluctuations in supply and demand affecting market prices and rates.
Operational risk
Operational risk is the risk of loss resulting from inadequate or failed internal processes, people or systems, or from external warrants.
Regulatory and compliance risk
Regulatory and compliance risk is the risk that the company will not meet its regulatory requirements or manage changes in regulatory requirements with respect to new legislation, resulting in investigations, fines or regulatory sanctions.
Reputational risk
Reputational risk is the risk that an organization loses revenue or intrinsic value as a result of an event (real or perceived) that calls into question the organization’s integrity or business capability or the quality of its products and services.
Securities and Exchange Commission (SEC)
The U.S. Securities and Exchange Commission (SEC) is an agency of the United States federal government. It holds primary responsibility for enforcing the federal securities laws, proposing securities rules, and regulating the securities industry, the nation’s stock and options exchanges, and other activities and organizations, including the electronic securities markets in the United States.
Appendix continued
Strategic risk
Strategic risk is the risk that an organization’s objectives for revenue growth, profitability and market position may not be attained due to insufficient planning or capabilities to effectively manage internal and/or external events that impact the achievement of goals.
Technology/data security risk
Technology/data security risk is the potential risk related to the failure, disruption, corruption, manipulation or interruption of an organization’s ability to use its electronic/digital assets and physical assets such as computers, storage, networking and other physical devices, infrastructure and processes to create, process, store, secure and exchange all forms of electronic data. This includes any event, threat or incident that compromises IT in a way that can cause adverse impacts on the organization’s business processes or mission, ranging from inconsequential to catastrophic in scale.
Third-party outsourcing risk
Third-party outsourcing risk is risk associated with the use and management of third parties, including the transfer/exchange of information to/from the vendor as well the external storage of information. In addition, this domain includes the contract requirements and obligations of third parties as well as the monitoring processes, compliance/audit checks, and due diligence over the operations conducted by the third parties.
Value at risk (VaR)
VaR is a statistical technique used to measure and quantify the level of financial risk within a firm or investment portfolio over a specific time frame.
Appendix continued
22 | Risk management gaining prominence A risk survey of global asset management firms

23Risk management gaining prominence A risk survey of global asset management firms |
Alan Fish Partner Americas Advisory Leader Wealth & Asset Management Ernst & Young LLP +1 617 585 0796 [email protected]
Ralph Mittl Principal Americas Risk and Regulatory Leader Wealth & Asset Management Ernst & Young LLP +1 202 327 7188 [email protected]
Daniel Bender Executive Director Wealth & Asset Management Ernst & Young LLP +1 617 425 7301 [email protected]
Contacts
EY | Assurance | Tax | Transactions | AdvisoryAbout EYEY is a global leader in assurance, tax, transaction and advisory services. The insights and quality services we deliver help build trust and confidence in the capital markets and in economies the world over. We develop outstanding leaders who team to deliver on our promises to all of our stakeholders. In so doing, we play a critical role in building a better working world for our people, for our clients and for our communities.
EY refers to the global organization, and may refer to one or more, of the member firms of Ernst & Young Global Limited, each of which is a separate legal entity. Ernst & Young Global Limited, a UK company limited by guarantee, does not provide services to clients. For more information about our organization, please visit ey.com.
Ernst & Young LLP is a client-serving member firm of Ernst & Young Global Limited operating in the US.
EY is a leader in serving the global financial services marketplaceNearly 43,000 EY financial services professionals around the world provide integrated assurance, tax, transaction and advisory services to our asset management, banking, capital markets and insurance clients. In the Americas, EY is the only public accounting organization with a separate business unit dedicated to the financial services marketplace. Created in 2000, the Americas Financial Services Office today includes more than 6,900 professionals at member firms in over 50 locations throughout the US, the Caribbean and Latin America.
EY professionals in our financial services practices worldwide align with key global industry groups, including EY’s Global Wealth & Asset Management Center, Global Banking & Capital Markets Center, Global Insurance Center and Global Private Equity Center, which act as hubs for sharing industry-focused knowledge on current and emerging trends and regulations in order to help our clients address key issues. Our practitioners span many disciplines and provide a well-rounded understanding of business issues and challenges, as well as integrated services to our clients.
With a global presence and industry-focused advice, EY’s financial services professionals provide high-quality assurance, tax, transaction and advisory services, including operations, process improvement, risk and technology, to financial services companies worldwide.
© 2016 Ernst & Young LLP. All Rights Reserved.
1505-1529739NY
EYG no. 00303-161Gbl ED None
This material has been prepared for general informational purposes only and is not intended to be relied upon as accounting, tax or other professional advice. Please refer to your advisors for specific advice.
ey.com