Embed Size (px)
Citation preview

Pascal B. Xavier
Part II
Pascal B. Xavier

Pascal B. Xavier
Part II
Risk Management Tools
Figure 1: Risk Management Tools (NOT Exhaustive)

Pascal B. Xavier
Part II
Fishbone (Ishikawa) Diagram
Figure 2: A Fishbone Diagram
Figure Courtesy of Dutch Renaissance Press
Fishbone diagram is basically a brainstorming tool to list possible root causes.
FMEA is a living document to list things that could go wrong in a product or process, the severity rated, and what actions are put in place to reduce the likelihood of failure. (MIL-STD-1629A)

Pascal B. Xavier
Part II
Decision Tree Analysis
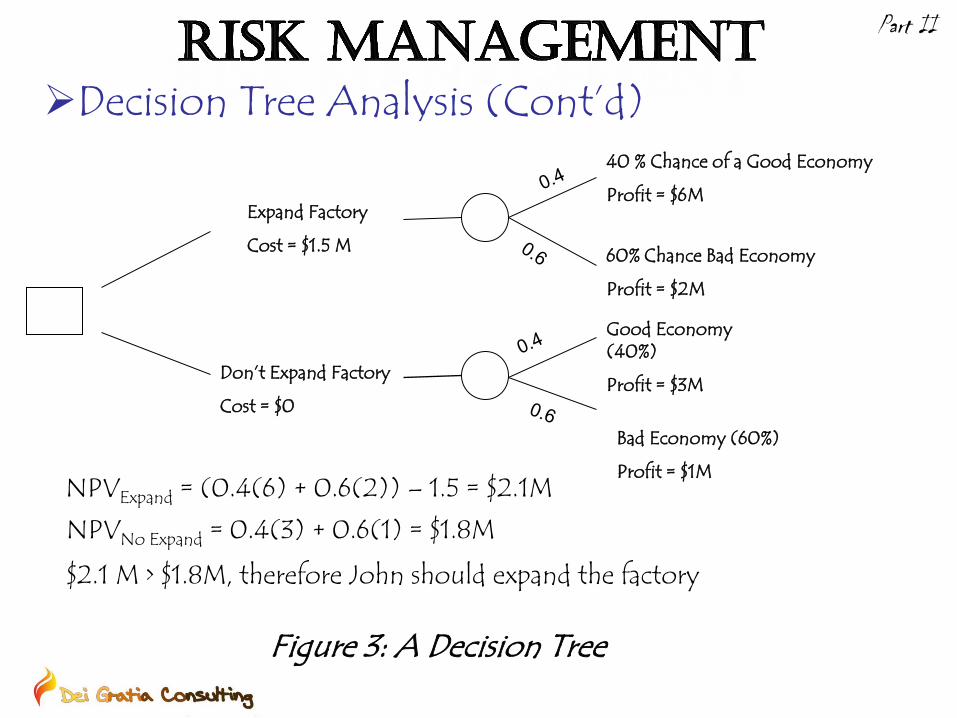
John is a manager of a profitable gadget factory. He is wondering whether or not he should expand his factory this year. The cost to expand the factory is $1.5M. If he expands the factory, he expects to receive $6M if economy is good and $2M if economy is bad.
If he does nothing and the economy stays good and people continue to buy lots of gadgets he expects $3M in revenue; while only $1M if the economy is bad.
He also assumes that there is a 40% chance of a good economy and a 60% chance of a bad economy.
Draw a Decision Tree showing these choices.
Pascal B. Xavier
Part II
Decision Tree Analysis (Cont’d)
Expand Factory
Cost = $1.5 M
Don’t Expand Factory
Cost = $0
40 % Chance of a Good Economy
Profit = $6M
60% Chance Bad Economy
Profit = $2M
Good Economy (40%)
Profit = $3M
Bad Economy (60%)
Profit = $1M NPVExpand = (0.4(6) + 0.6(2)) – 1.5 = $2.1M
NPVNo Expand = 0.4(3) + 0.6(1) = $1.8M
$2.1 M > $1.8M, therefore John should expand the factory
Figure 3: A Decision Tree

Pascal B. Xavier
Part II
SWOT Analysis
Figure 4: Strengths, Weaknesses, Opportunities and Threats
Pascal B. Xavier
Part II
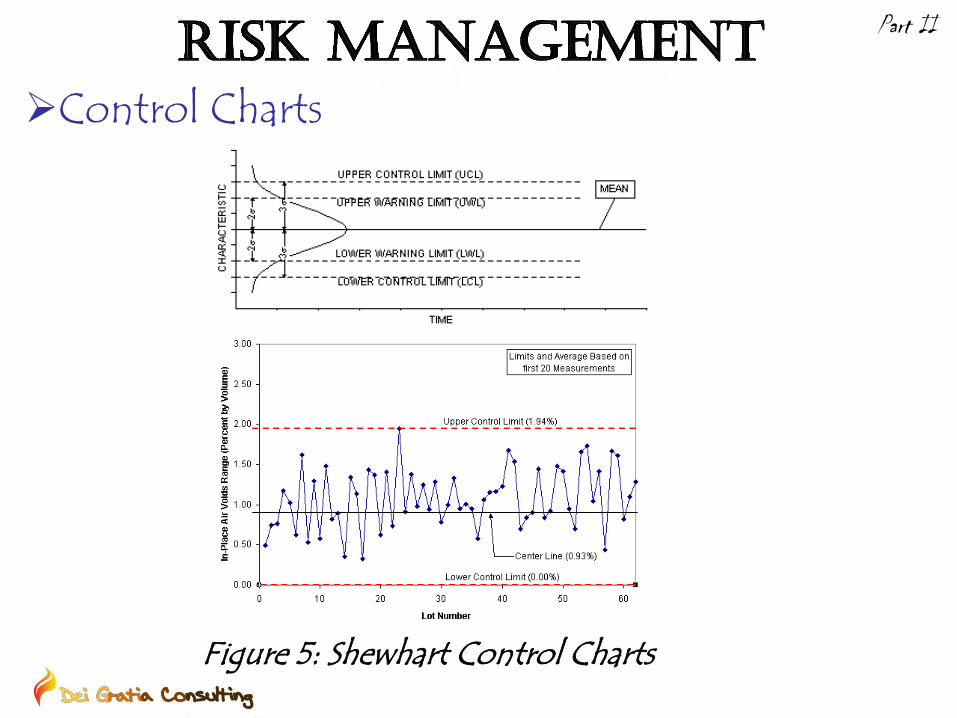
Control Charts
Figure 5: Shewhart Control Charts

Pascal B. Xavier
Part II
Factorial Design of Experiments (DOE)
Figure 6: Design of Experiments
Factor B
Levels b1 b2
a1 20 40
Factor A
a2 50 12
Factor B
Levels b1 b2
a1 20 30
Factor A
a2 40 52

Pascal B. Xavier
Part II
The Risk Matrix Used by the US Department of Defense (DoD) since the 1980s. This is documented in MIL-STD-882D (Standard Practice for System Safety). AS/NZS 4360:2004 has been superseded by ISO 31000:2009. AS 4360 was first published in 1995. AS4360 includes discussion on risk matrices. So the application of risk matrices has been driven also by the standard. The Harvard Business Review uses it too! While it is useful for quick assessments, one must be careful about its application to risk management which includes risk treatment.

Pascal B. Xavier
Part II
The Risk Matrix
Consequences
Likelihood Insignificant (1)
Minor (2)
Moderate (3)
Major (4)
Catastrophic (5)
Certain (5) M H I I I
Likely (4) M M H I I
Possible (3) L M H I I
Unlikely (2) L L M H I
Rare (1) L L M H H
Table 7: Qualitative Risk Analysis Matrix

Pascal B. Xavier
Part II
Table 8: A Simple Example to Illustrate
Risk Identification
Consequence
to Public
Likelihood of O
ccurrence
Risk R
ating
Management or Mitigating Action
Consequence
after Action
Likelihood after A
ction
Residual R
isk R
ating
Hazard: Unbarricaded cliff at the Blue Mountains Risk: Falling Off and Suffering Injury or Death
5 3 I
Remedial Action 1 Install only a safety net at the foot of cliff
3 3 H
Hazard: Unbarricaded cliff at the Blue Mountains Risk: Falling Off and Suffering Injury or Death
5 3 I
Remedial Action 2 Install only a fence at edge of cliff 5 1 H
Hazard: Unbarricaded cliff at the Blue Mountains Risk: Falling Off and Suffering Injury or Death
5 3 I
Remedial Action 3 Install both a fence at edge of cliff and also a safety net at the foot of the cliff
3 1 M

Pascal B. Xavier
Part II
LIKELIHOOD SCORE
Likelihood Descriptor Probability
1 Rare Exceptional Circumstances <1%
2 Unlikely Seldom Occurs 1% to 5%
3 Possible Occasionally Occurs 5% to 20%
4 Likely Often Occurs 20% to 60%
5 Certain Frequently Occurs >85%
MIL-STD-882D attempts to semi-quantify

Pascal B. Xavier
Part II
Table 6: More Detail to the Consequence Definition
CONSEQUENCE SCORE
Score Consequence Cost Program Reputation
Community /
Stakeholder
Response
H&S Environment
1 Insignificant <$10,000 <1 week No Local Media
Coverage Minor Complaint No Injuries
Short Term
Damage
2 Minor $10,000 -
$50,000
1-2
Weeks
Minor Effect on Local
Company
Image/Business
Relationship Mildly
Affected
Formal
Correspondence
written by
Stakeholder
First Aid
Required -
near miss
Limited but
Medium Term
Negative Effects
3 Moderate $50,000-
$250,000
2-4
Weeks
Local Media
Exposure/Business
Relationship Affected
Local Member
Intervention.
Official
Information
Request
Medical
Treatment
Major but
Recoverable
Ecological
Damage
4 Major $250,000-
$1,000,000 >1 Month
Nationwide Media
Exposure/Business
Relationship Greatly
Affected
Ministerial
Involvement
Extensive
Injuries
Heavy Ecological
Damage, Costly
Restoration
5 Catastrophic >$1,000,00
0
>3
Months
Permanent Nationwide
Effect on Company
Image/Significant Impact
on Business
Relationship
Political
Intervention or
Commission of
Enquiry
Fatality
Permanent
Widespread
Ecological
Damage

Pascal B. Xavier
Part II
Presentation and Implementation Issues The context of risk for different categories (financial, political, HR, environmental, stakeholder, etc) may be such that the definition of frequencies (likelihoods) may not be too broad:
Political risk worth millions (defined moderate impact) vs. high environmental risk worth millions (defined high impact) Power outage 5% of the time (defined likely or certain likelihood) vs. trains running late 5% of the time (defined unlikely or possible likelihood)
So do we have scoring matrices for each category?

Pascal B. Xavier
Part II
Presentation and Implementation Issues (Cont’d)
Consequences
Likelihood Insignificant (1)
Minor (2)
Moderate (3)
Major (4)
Catastrophic (5)
Certain (5) 5 10 15 20 25
Likely (4) 4 8 12 16 20
Possible (3) 3 6 9 12 15
Unlikely (2) 2 4 6 8 10
Rare (1) 1 2 3 4 5
Table 9: Multiplication of Row and Column to Give Rating

Pascal B. Xavier
Part II
Presentation and Implementation Issues (Cont’d)
Consequences
Likelihood Insignificant Minor Moderate Major Catastrophic
Certain 11 16 20 23 25
Likely 7 12 17 21 24
Possible 4 8 13 18 22
Unlikely 2 5 9 14 19
Rare 1 3 6 10 15
Table 10: Cells Numbered Progressively Left, Bottom to Top ,Right

Pascal B. Xavier
Part II
Some Inputs into Risk Estimation - Heuristics • "Rule of thumb" applies a broad approach to problem
solving and allows an individual to make an approximation without having to do exhaustive research.
• "Absurdity” is applied when a claim or a belief seems silly, or seems to defy common sense.
• "Common sense" is applied as a practical and prudent approach to a decision where the right and wrong answers seems relatively clear cut.
• "Familiarity” allows someone to approach an issue or problem based on familiarity of the situation.

Pascal B. Xavier
Part II
The Subjectivity of Risk Estimation Contextual factors like health beliefs, religion, ethics,
history, politics, class status, family, etc., form perceptions about risk characteristics and situation e.g. polygamy and its affect on HIV risk.
Semantics (i.e. words with multiple meanings e.g. crash; no meaning e.g. Pennzoil with F-7), determines risk sources, people and circumstances of situation.
Trust and credibility of actors involved in assessing risk is an important aspect of risk analysis. e.g. lawyer risk assessing the need for a medication

Pascal B. Xavier
Part II
The Subjectivity of Risk Estimation (Cont’d) Availability bias e.g. if news readily available about
deaths by lightning, then risk of being struck is regarded as significant (i.e. probability overestimated).
Anchoring effect e.g. if waste is incinerated, the association formed between waste and its toxic nature (i.e. impact overestimated)
Distribution effect of risk over time e.g. road accidents occurring throughout the year i.e. perception of lower probability of occurrence
Assessment bias e.g. low risks overestimated and high risks underestimated.
Pascal B. Xavier
Part II
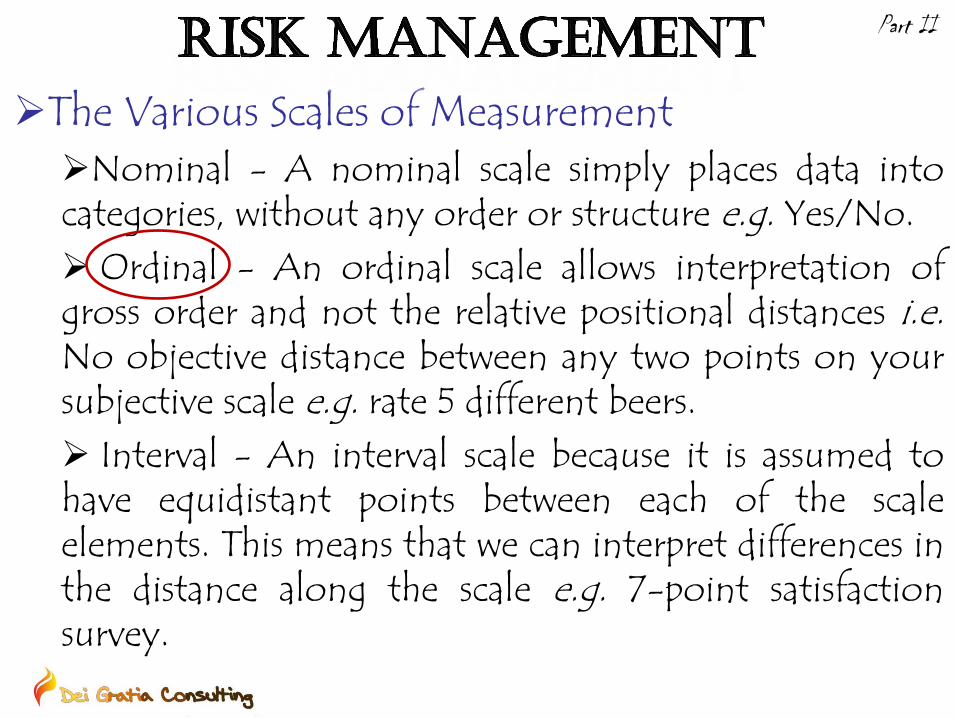
The Various Scales of Measurement Nominal - A nominal scale simply places data into categories, without any order or structure e.g. Yes/No. Ordinal - An ordinal scale allows interpretation of gross order and not the relative positional distances i.e. No objective distance between any two points on your subjective scale e.g. rate 5 different beers. Interval - An interval scale because it is assumed to have equidistant points between each of the scale elements. This means that we can interpret differences in the distance along the scale e.g. 7-point satisfaction survey.
Pascal B. Xavier
Part II
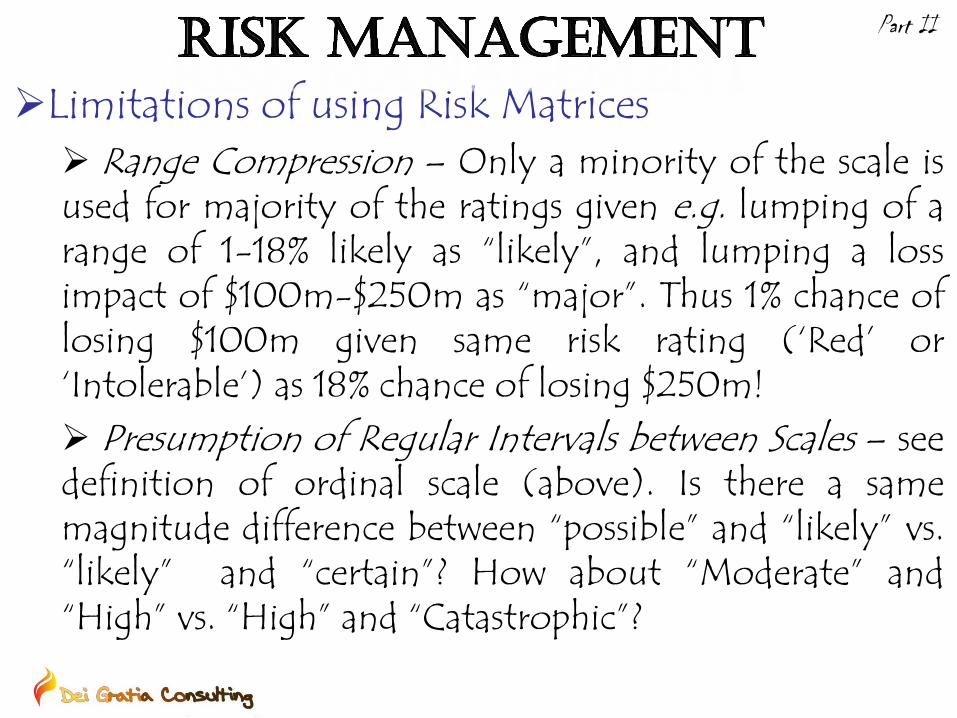
Limitations of using Risk Matrices Range Compression – Only a minority of the scale is used for majority of the ratings given e.g. lumping of a range of 1-18% likely as “likely”, and lumping a loss impact of $100m-$250m as “major”. Thus 1% chance of losing $100m given same risk rating (‘Red’ or ‘Intolerable’) as 18% chance of losing $250m! Presumption of Regular Intervals between Scales – see definition of ordinal scale (above). Is there a same magnitude difference between “possible” and “likely” vs. “likely” and “certain”? How about “Moderate” and “High” vs. “High” and “Catastrophic”?

Pascal B. Xavier
Part II
Limitations of using Risk Matrices (Cont’d) Presumption of independence – The scoring methods do not account for possible correlation [Conrow (2003)] among the various factors and risks i.e. two or more moderate likelihood, moderate impact risks allocated in a risk matrix may show as a much higher risk rating outcome if they happened together. (Monte Carlo analysis include correlation and dependencies) Human cognitive bias - Systematic translations of objective probability and value as judged by human subjects. [Smith, Siefert and Drain (2008) refers to Prospect Theory by Kahneman and Tversky (1979)]

Pascal B. Xavier
Part II
Limitations of using Risk Matrices (Cont’d) Likelihood-Consequence Correlation – For negatively correlated likelihoods and consequences, risk matrices can mistakenly assign qualitatively higher/lower risk ratings to quantitatively smaller/larger risks.
High Likelihood, Low Impact – Risk exaggerated Low Likelihood, High Impact – Risk ignored
Sub-optimal Risk Allocation – Effective allocation of resources for risk mitigating measures cannot be based on risk ratings prescribed by risk matrices. [Cox (2008), pp506-510]

Pascal B. Xavier
Part II
References Anna Korombel and Piotr Tworek (2007), “Qualitative
Risk Analysis as a Stage of Risk Management in Investment Projects: Advantages and Disadvantages of Selectred Methods – Theoretical Approach, Journal of Interdisciplinary Research, pp51-54.
Eric D. Smith, William T. Siefert and David Drain (2008),”Risk Matrix Input Data Biases”, Systems Engineering, 12, 2, pp344-360. Louis Anthony (Tony) Cox, Jr. (2008), “What’s
Wrong with Risk Matrices?”, Risk Analysis, 28, 2, pp497-512
Pascal B. Xavier
Part II
References (Cont’d) Stroie Elena Ramona (2011),”Advantages and
Disadvantages of Quantitative and Qualitative Information Risk Approaches”, Chinese Business Review, 10 (12), pp1106-1110.
Pascal B. Xavier
Part II
Bibliography Edmund H. Conrow (2003), “Effective Risk
Management – Some Keys to Success (2nd Edition)”, Appendix H: Some Characteristics and Limitations of Ordinal Scales in Risk Analyses, American Institute of Aeronautics and Astronautics, pp461-479
Douglas W. Hubbard (2009), “The Failure of Risk Management – Why It Is Broken and How To Fix It”, John Wiley and Sons, pp1-273