Embed Size (px)
Citation preview

Risk Management Report Pillar 3 - 1Q15
1
Risk Management Report - Pillar 3 – 1Q15
RISK MANAGEMENT REPORT PILLAR 3
BANCO DO BRASIL S.A.
1st Quarter 2015

2
Risk Management Report- Pillar 3 – 1Q15
Summary
1. OBJECTIVE ......................................................................................................................... 7 2. INTRODUCTION ................................................................................................................. 8 3. GOVERNANCE ................................................................................................................... 9
3.1 Relevant Risks ................................................................................................................ 9 3.2 Corporate Risk Governance ......................................................................................... 10 3.3 Risk Management Process ........................................................................................... 12 3.4 Reports .......................................................................................................................... 12
4. REGULATION ................................................................................................................... 13 4.1 Basel II .......................................................................................................................... 13
4.1.1 Pillar l - Minimum Capital Requirements .............................................................. 14 4.1.2 Pillar ll - Risk and Capital Supervisory Process ................................................... 14 4.1.3 Pillar lll – Transparency and Market Discipline .................................................... 15
4.2 Basel III ......................................................................................................................... 16 4.3 Basel I in Banco do Brasil ............................................................................................. 17
4.3.1 Market Risk ................................................................................................................... 17 4.3.2 Credit Risk ..................................................................................................................... 17 4.3.3 Operational Risk............................................................................................................ 18
5. PRUDENTIAL CONGLOMERATE .................................................................................... 19 5.1 BALANCE SHEETS .......................................................................................................... 19
5.2 Composition of the Prudential Conglomerate ............................................................... 23 5.3 Composition of the Economic and Financial Consolidation .......................................... 23
6. RISK MANAGEMENT ....................................................................................................... 25 6.1 Credit Risk ..................................................................................................................... 25
6.1.1 Management Objectives ............................................................................................... 25 6.1.2 Credit Policy .................................................................................................................. 27 6.1.3 Management Strategies ................................................................................................ 27 6.1.4 Management Processes ............................................................................................... 28 6.1.5 Communication and Information Processes ................................................................. 29 6.1.5.1 Communication process for internal clients ......................................................... 29 6.1.5.2 Communication process for external clients ........................................................ 30 6.1.6 Measurement Systems ................................................................................................. 30 6.1.6.1 Concentration ....................................................................................................... 30 6.1.6.2 Regulatory Capital Requirement .......................................................................... 30 6.1.7 Mitigation Policy ............................................................................................................ 31 6.1.8 Processes for Monitoring the Effectiveness of Mitigators ............................................. 31 6.1.9 Exposure to Credit Risk ................................................................................................ 31 6.1.10 Acquisition, Sale or Transfer of Financial Assets ................................................. 44 6.1.11 Securities (TVM) operations derived from securitization processes .................... 44 6.1.12 Exposure to counterparty credit risks ................................................................... 45 6.1.13 Mitigating instruments .......................................................................................... 48
6.2 Market and Liquidity Risks ............................................................................................ 50 6.2.1 Management Objectives ............................................................................................... 50 6.2.2 Management Policies and Strategies ........................................................................... 50 6.2.3 Hedge Policies .............................................................................................................. 53 6.2.4 Risk measuring systems and communication and information processes ................... 53 6.2.5 Market Risk Management Structure ............................................................................. 55 6.2.6 Market Risk Management Process ............................................................................... 57 6.2.7 Negotiable Portfolios ..................................................................................................... 59 6.2.8 Non-negotiable Portfolios .............................................................................................. 61 6.2.9 Liquidity Risk Management Structure ........................................................................... 63 6.2.10 Liquidity Risk Management Process .................................................................... 65
6.3 Operational Risk............................................................................................................ 67 6.3.1 Management Objectives ............................................................................................... 67 6.3.2 Operational Risk Policy ................................................................................................. 68 6.3.3 Management Processes and Strategies ....................................................................... 68 6.3.4 Communication and Information Processes ................................................................. 69 6.3.5 Measurement Systems ................................................................................................. 69

3
Risk Management Report- Pillar 3 – 1Q15
6.3.6 Operational Risk Mitigation ........................................................................................... 70 6.3.7 Control of Operational Risk ........................................................................................... 70 6.3.8 Banco do Brasil Related Entities ................................................................................... 71
6.4 Strategy Risk ................................................................................................................. 71 6.4.1 Management Objectives ............................................................................................... 71 6.4.2 Management Model ...................................................................................................... 72 6.4.3 Management Structure ................................................................................................. 72 6.4.4 Management Processes ............................................................................................... 73 6.4.5 Information and Communication Processes ................................................................. 74
6.5 Reputational Risk .......................................................................................................... 74 6.5.1 Management Objectives ............................................................................................... 74 6.5.2 Management Model ...................................................................................................... 74 6.5.3 Management Structure ................................................................................................. 75 6.5.4 Management Processes ............................................................................................... 76 6.5.5 Information and Communication Processes ................................................................. 76
6.6 Environmental Risk ....................................................................................................... 76 6.6.1 Management Objectives ............................................................................................... 76 6.6.2 Management Model ...................................................................................................... 77 6.6.3 Management Structure ................................................................................................. 77 6.6.4 Management Processes ............................................................................................... 78 6.6.5 Environmental Responsibility Policy ............................................................................. 78 6.6.6 Information and Communication Processes ................................................................. 78 6.6.7 Shareholdings ............................................................................................................... 78
7 CAPITAL ............................................................................................................................ 81 7.1 Capital Management ..................................................................................................... 81 7.2 Referential Equity (RE) Details ..................................................................................... 83 7.3 Prudential Adjustments deducted from CET1: .............................................................. 84 7.4 Minimum Reference Equity Required (MRER) ............................................................. 85 7.5 Capital Adequacy Ratio ................................................................................................ 87 7.6 Assessment of Sufficiency and Adequacy of Reference Equity (PR)........................... 87

4
Risk Management Report- Pillar 3 – 1Q15
List of Tables
Table 1 – Capital Minimum Requirement in relation to RWA: ........................................................ 17 Table 2 - Prudential Balance Sheet x Consolidated Balance Sheet: ............................................. 20 Table 3 - Composition of the Prudential Conglomerate ................................................................. 23 Table 4 - Composition of the Economic and Financial Consolidation: ........................................... 24 Table 5 - Concentration of the ten and of the hundred largest customers in relation to the total of transactions with credit granting feature ........................................................................................ 32 Table 6 - Credit risk average exposure .......................................................................................... 32 Table 7 - PJ credit risk exposure by geographic regions ............................................................... 33 Table 8 - PF credit risk exposure by geographic regions ............................................................... 34 Table 9 - Credit risk exposure of the financial conglomerate, by economic sector ........................ 35 Table 10 - Credit risk exposure of the agribusiness portfolio, segregated by economic sector and businesses portfolio (PJ) – 1Q15 ................................................................................................... 36 Table 11 - Credit risk exposure of the agribusiness portfolio, segregated by economic sector and businesses portfolio (PJ) – 4Q14 ................................................................................................... 36 Table 12 - Credit risk exposure of the agribusiness portfolio, segregated by economic sector and businesses portfolio (PJ) – 3Q14 ................................................................................................... 37 Table 13 - Credit risk exposure of PF and PJ portfolios by maturity of the transactions – 1Q15 .. 37 Table 14 - Credit risk exposure of PF and PJ portfolios by maturity of the transactions – 4Q14 .. 38 Table 15 - Credit risk exposure of PF and PJ portfolios by maturity of the transactions – 3Q14 .. 38 Table 16 - Amount of overdue transactions by geographical regions. ........................................... 39 Table 17 - Amount of overdue transactions, segregated by economic sector – 1Q15 .................. 40 Table 18 - Amount of overdue transactions, segregated by economic sector – 4Q14 .................. 41 Table 19 - Amount of overdue transactions, segregated by economic sector – 3Q14 .................. 41 Table 20 – Write-off transactions by economic sector. .................................................................. 42 Table 21 - Total allowances for loan and lease losses in the quarter and variations .................... 43 Table 22 - Credit risk exposure by FPR ......................................................................................... 43 Table 23 - Loss operations assigned, with substantial transfer of risks and benefits .................... 44 Table 24 - Value of the portfolio granted with co-obligation, recorded in the off balance sheet .... 44 Table 25 - Value of the exposures derived from acquiring FIDC and CRI ..................................... 45 Table 26 - Notional value of contracts to be liquidated in clearing house liquidation systems, in which the clearing house acts as central counterparty .................................................................. 47 Table 27 - Notional value of contracts subject to counterparty credit risk in which clearing houses do not act as central counterparty, Segmented in uncollateralized agreements and collateralized agreements. ............................................................................................................. 47 Table 28 - Positive gross value of the respective contracts, including derivatives, loans to settle, assets loans and repurchase agreements, disregarded the positive values related to compensation agreements defined in CMN Resolution 3,263/05. ................................................. 47 Table 29 - The value of collaterals that cumulatively meet the requirements of paragraph VII, Art.9, of Bacen Circular 3,678/13 ................................................................................................... 48 Table 30 - The value of collaterals that cumulatively meet the requirements of paragraph VII, Art.9, of Bacen Circular 3,678/13: .................................................................................................. 48 Table 31 - Collateral coverage. ...................................................................................................... 49 Table 32 - Mitigated value of exposure, weighted by the respective weighting factor ................... 50 Table 33 - Derivative financial instruments in the country and abroad, by market risk factor, with and without a central counterpart – 1Q15 ...................................................................................... 51 Table 34 - Derivative financial instruments in the country and abroad, by market risk factor, with and without a central counterpart – 4Q14 ...................................................................................... 52

5
Risk Management Report- Pillar 3 – 1Q15
Table 35 - Derivative financial instruments in the country and abroad, by market risk factor, with and without a central counterpart – 3Q14 ...................................................................................... 52 Table 36 - Derivative financial instruments in the country and abroad, by market risk factor, with and without a central counterpart – 2Q14 ...................................................................................... 52 Table 37 - Derivative financial instruments in the country and abroad, by market risk factor, with and without a central counterpart – 1Q14 ...................................................................................... 53 Table 38 - Negotiable Portfolio by relevant market risk factor, divided into positions purchased and positions sold. .......................................................................................................................... 61 Table 39 - Impact on the result or on the assessment of the value of the institution due to shocks in interest rates segmented by risk factor – Value at Risk methodology ....................................... 63 Table 40 – Impact on the result or on the assessment of the institution value due to the shocks in interest rates, segmented by risk factor – Economic Value of Equity methodology ...................... 63 Table 41 - Phases of the operational risk management process ................................................... 68 Table 42 - Operational losses monitoring by loss events category................................................ 71 Table 43 - Strategy risk management activities ............................................................................. 71 Table 44 - Reputational Risk management activities ..................................................................... 74 Table 45 – Equity Interests – Non Negotiable Portfolio ................................................................. 80 Table 46 - Reference Equity (RE) Details ...................................................................................... 84 Table 47 – Prudential Adjustments ................................................................................................ 85 Table 48 – Required Minimum Reference Equity .......................................................................... 86 Table 49 – Basel Ratio (Total Capital Ratio) and PR margin ......................................................... 87 Table 50 - Criteria and parameters for classification of the capital condition ................................ 88

6
Risk Management Report- Pillar 3 – 1Q15
List of Figures Figure 1 – Risk Management Governance Structure .................................................................. 11
Figure 2 - Risk Management Structure and Process .................................................................. 12
Figure 3 - Basel II Pillars ............................................................................................................. 13
Figure 4 - Capital allocation Models ............................................................................................ 14
Figure 5 - Pillar III Structure ........................................................................................................ 16
Figure 6 – Credit risk management ............................................................................................. 25
Figure 7 - Credit risk management structure ............................................................................... 29
Figure 8 - Market risk management structure ............................................................................. 56
Figure 9 - Management Process ................................................................................................. 59
Figure 10 - Liquidity Risk Management ....................................................................................... 64
Figure 11 – Strategy Risk Management ...................................................................................... 73
Figure 12 – Reputational Risk Management ............................................................................... 76
Figure 13 – Organizational Structure involved in the capital and risk management ................... 81

7
Risk Management Report- Pillar 3 – 1Q15
1. Objective
The purpose of this report is to inform the interested public about Banco do Brasil`s risk management structures, processes and policies, aligned with Basel ll Pillar lll guidelines, including information related to risk and capital management, the calculation of the amount of Risk Weighted Assets (RWA) and the Reference Equity (PR). The calculation of PR and RWA considers the consolidation scope of the Financial Conglomerate until 12.31.2014, and, as of 01.01.2015, according to the CMN Resolutions 4,192/13 and 4,193/13, of the Prudential Conglomerate1, in accordance with the Financial Institutions Chart of Accounts (Cosif), which covers not only financial institutions, but also consortium managing companies, payment institutions, companies that acquire operations or that direct or indirectly have credit risk and investment funds in which the conglomerate considerably holds risks and benefits.
1 Prudential Regulation Details on the link: http://www.bcb.gov.br/?REGPRUDENCIAL

8
Risk Management Report- Pillar 3 – 1Q15
2. Introduction
Banking system sustainability is indissolubly linked to risk-management and capital policies and mechanisms. The methods of identifying, assessing, controlling, mitigating and monitoring risk safeguard financial institutions in adverse situations and provide support for positive, recurring earnings over time. BB considers essential risk and capital management to the process of decision-making, providing greater stability, better capital allocation and optimization of risk-return ratio. Brazil’s participation in the Basel Committee on Banking Supervision encourages broader, timelier adoption of international prudential standards. Changes in the global financial environment, such as market integration through globalization, the emergence of new transactions and products, increasing technological sophistication, and new regulations, have made financial activities and processes - and their risks – more and more complex. Additionally, the lessons learned from financial disasters reinforce the main need for risk management in the banking industry. Those factors have influenced regulatory agencies and financial institutions to invest in risk management, seeking to strengthen their financial health. In concert with that outlook, BB has invested in the continual improvement of its risk-management process and practices, in line with international market benchmarks, Basel ll Accord and adjustments made by Basel lll Accord. Banco do Brasil remains continuously aligned with the best management practices, among which, the risk management architecture with multidimensional scope whose specificities are described in this report.

9
Risk Management Report- Pillar 3 – 1Q15
3. Governance
3.1 Relevant Risks
Banco do Brasil has a process of identification of risks that will be part of the risks inventory and for the definition of relevant risks. That process is quite important for the risks and capital management, as well as for the business management, since it seeks to identify which risks should be managed by the Institution. The identification of the risks incurred by the Institution is made through the analysis of the business segments that are explored, direct and indirectly, considering the Entities Related to Banco do Brasil.
After the definition of the risks inventory and its corresponding concepts, comes the classification of risks according to their relevance, which is made through a quantitative or qualitative assessment. The quantitative assessment is used for the risks that can be measured. The qualitative assessment is applied for those risks that can`t be measured due to the absence of a methodology or data base. The risks below are part of Banco do Brasil`s Financial Conglomerate Relevant Risks Corporate Range:
Market Risk – defined as a possibility of losses resulting from the the fluctuation of market values of positions held by a financial institution. It includes the risks of the operations that are subject to the variations of exchange, interest rates, share prices and the price of commodities. Liquidity Risk – possibility of imbalances between tradable assets and liabilities - "mismatches" between payments and receipts - which can affect the institution’s payment ability, taking into account the different currencies and settlement terms of its rights and obligations. Banking Book Interest Rate Risk – defined as the risk related to the exposure subject to the variation of the interest rates of the exposures that are not classified in the trading portfolio (Trading Book). Credit Risk – possibility of losses associated with the non-fulfillment by a borrower or a counterparty of their respective financial obligations according to negotiated terms, the devaluation of a loan agreement due to a drop in the borrower’s risk rating, a decline in gains or earnings, benefits granted in renegotiation, and recovery costs. Counterparty Credit Risk – it is a subcategory of credit risk that is understood as a possibility of a certain counterparty not fulfilling its obligations related to settlement of transactions that involve trading financial assets, including those related to the settlement of financial derivatives.

10
Risk Management Report- Pillar 3 – 1Q15
Credit Concentration Risk – it is also a subcategory of credit risk and it is defined as a possibility of credit losses arising from significant exposure to counterparty, a risk factor or groups of counterparties related by common characteristics. Operational Risk – possibility of losses due to failures, deficiencies, or improper internal processes, people and systems or external events. This includes the possibility of losses arising from legal risk. Strategy Risk – possibility of losses arising from adverse changes in the business environment, or use of inappropriate assumptions in decision making. Reputational Risk – possibility of negative perception about the Institution on the part of customers, counterparties, shareholders, investors, government agencies, community or supervisors that can adversely affect the sustainability of the business. Environmental Risk – possibility of losses arising directly or indirectly from: i) social and environmental impacts resulting from administrative and business practices of BB, or people related to its operation; and ii) adverse impacts on the Bank’s operations resulting from conjectural aspects related to social and environmental unsustainability of the modes of production and the existing consumption patterns. Legal Risk - possibility of losses associated with improper or deficient contracts signed by the Institution, as well as sanctions resulting from noncompliance with legal provisions and compensation for damages to third parties resulting from activities engaged in by the institution. Participations Risk – possibility of losses resulting from exposures in the societal participations. Complementary Pension Fund Entities and Private Health Insurance Plan Operators for Employees Risk – possibility of negative impacts derived from exposures registered in the entities sponsored by complementary pension fund and private health insurance plan operators for employees. Model Risk – possibility of losses derived from the inadequate development or use of models, as a result of the inaccuracy or insufficiency of data or the incorrect formulation in its construction.
3.2 Corporate Risk Governance
The risk-governance model adopted by BB involves a superior committee and executive committee structure, with the participation of many units at the Bank, addressing the following issues:
a) separation of duties: business versus risk; b) specific structure for risk management; c) defined management process;

11
Risk Management Report- Pillar 3 – 1Q15
d) decisions in several hierarchical levels; e) clear rules and authority structure; and f) reference to best management practices.
In December/14, the Executive Board approved the reconfiguration of strategic governance bodies. The new setting for the committees related to risk management shall be:
· Credit Risk Executive Committee (CERC); · Market and Liquidity Executive Committee (CERML); · Internal Controls and Operational Risk Executive Committee (CERO); · Global Risk Superior Committee (CSRG).
The figure below represents the governance structure of the Bank’s risk management:
Figure 1 – Risk Management Governance Structure
All decisions related to risk management are made jointly and in accordance with BB’s guidelines and rules. Banco do Brasil’s risk governance is centralized in the Global Risk Superior Committee (CSRG), composed by members of the Executive Board of Directors, whose main purpose is to establish strategies for risk management, appropriate overall risk-exposure limits to capital allocation in light of risks. The Risk Management Board (DIRIS) is responsible for managing credit, market and liquidity risks and the Operational Risk Unit (URO) is responsible for managing the operational risk. These structures are linked to the Office of the Vice-President for Internal Controls and Risk Management, which foster synergy among processes and contribute to a better capital allocation.

12
Risk Management Report- Pillar 3 – 1Q15
The figure below demonstrates the decision-making flow of topics related to risk management:
Figure 2 - Risk Management Structure and Process
Decisions are reported to participating units through documents that objectively express the position taken by the Senior Management, guaranteeing application throughout the Bank. 3.3 Risk Management Process The risk-management process involves a continuous flow of information, abiding by the following phases:
a) Planning: data gathering and analysis phase and preparation of proposals; b) Decision: proposals are assessed and debated in a collegiate way, in
competent levels and communicated to participating areas; c) Execution: the participating units implement the decisions made; and d) Monitoring: checking on the implementation of the resolutions and report to
Executive Committees and CSRG. 3.4 Reports
Risk-management reports support decision-making processes about risk in the Executive Committees, the Global Risk Superior Committee (CSRG), the Executive Board of Directors (CD), and the Board of Directors (CA). The reports produced periodically have managerial qualitative and quantitative information and subsidize the dissemination of information to the market, as the Management Report and the Performance Analysis Report.

13
Risk Management Report- Pillar 3 – 1Q15
4. Regulation
4.1 Basel II
In June 2004, the Basel Committee on Banking Supervision published a document, commonly known as Basel II, with the following objectives:
a) promote financial stability; b) strengthen the capital structure of institutions; c) favor the adoption of best risk-management practices; and d) encourage greater transparency and market discipline.
Basel II proposes a more comprehensive approach in terms of strengthening banking supervision and stimulating greater transparency in disclosing information to the market, based on three major premises:
a) Pillar I - capital requirement for the coverage of credit, market and operational risks;
b) Pillar II - risks and capital supervision; and c) Pillar III - information transparency and market discipline.
The figure 3 represents the Pillars of Basel II:
Figure 3 - Basel II Pillars
14
Risk Management Report- Pillar 3 – 1Q15
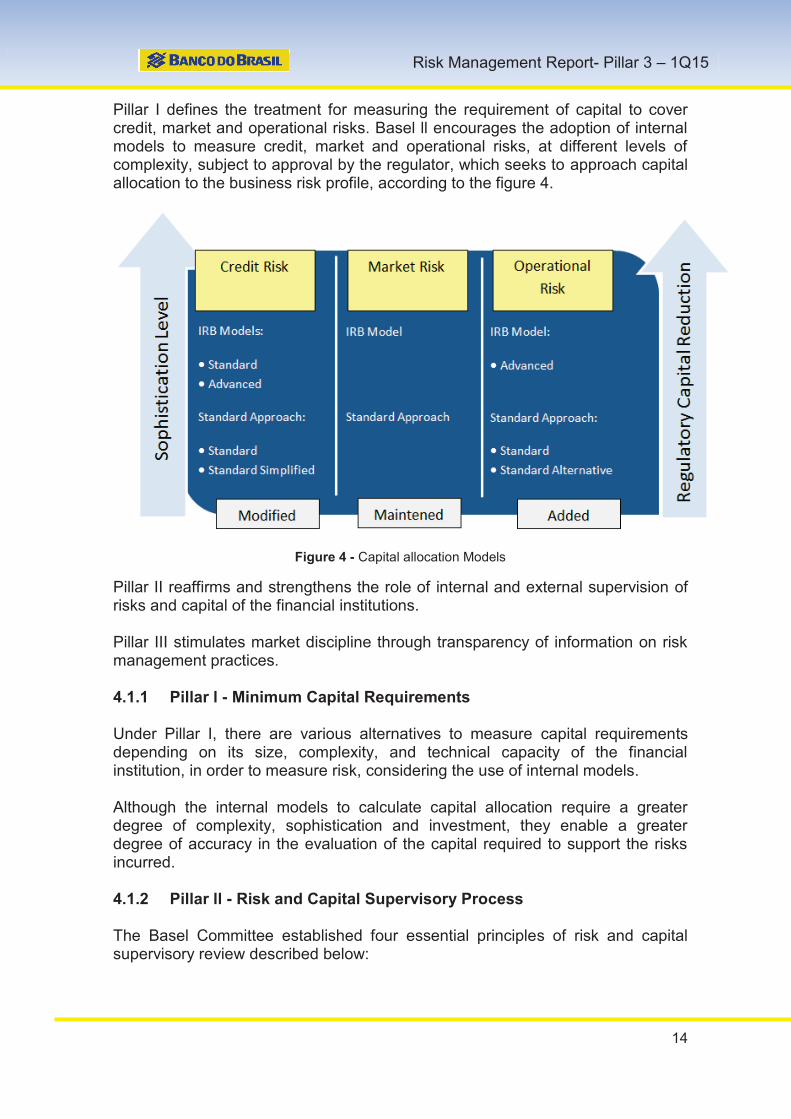
Pillar I defines the treatment for measuring the requirement of capital to cover credit, market and operational risks. Basel ll encourages the adoption of internal models to measure credit, market and operational risks, at different levels of complexity, subject to approval by the regulator, which seeks to approach capital allocation to the business risk profile, according to the figure 4.
Figure 4 - Capital allocation Models
Pillar II reaffirms and strengthens the role of internal and external supervision of risks and capital of the financial institutions. Pillar III stimulates market discipline through transparency of information on risk management practices.
4.1.1 Pillar l - Minimum Capital Requirements Under Pillar I, there are various alternatives to measure capital requirements depending on its size, complexity, and technical capacity of the financial institution, in order to measure risk, considering the use of internal models. Although the internal models to calculate capital allocation require a greater degree of complexity, sophistication and investment, they enable a greater degree of accuracy in the evaluation of the capital required to support the risks incurred. 4.1.2 Pillar ll - Risk and Capital Supervisory Process The Basel Committee established four essential principles of risk and capital supervisory review described below:

15
Risk Management Report- Pillar 3 – 1Q15
1) First Principle: banks must have a process to assess their capital adequacy in relation to their risk profile and have a strategy to maintain adequate levels of capital to cover risks;
2) Second Principle: supervisors should evaluate the banks’ strategies, the
estimates of capital, and the ability of banks to monitor and to guarantee their compliance with minimum capital requirements. The supervisors must take adequate measures just in case they are not satisfied with the result of the process;
3) Third Principle: supervisors expect, and may require, banks to operate
above the minimum capital requirements; and 4) Fourth Principle: supervisors may intervene in advance and require
banks to take prompt actions if their capital level falls below the minimum level.
The main features that reflect a rigorous process to assess capital adequacy should involve:
a) supervision of the Bank’s Senior Management; b) solid assessment of capital needs to tolerate business risks; c) comprehensive assessment of risks; d) monitoring and reporting; and e) review of internal controls.
Pillar II emphasizes the need for a bank to have an adequate volume of capital to tolerate all risks involved in the business. Besides the capital, the regulator also assesses internal controls and capital and risk management processes, which must be sufficient and adequate.
4.1.3 Pillar lll – Transparency and Market Discipline By encouraging information disclosure, Basel II seeks to increase market players’ power of evaluation and action. The purpose of Pillar lll is to complement minimum capital requirements (Pillar I) and the supervisory review process (Pillar II), encouraging participants to exercise market discipline. To guarantee compliance with Pillar lll, Basel II requires supervisors to have a greater number of persuasive instruments, ranging from dialogue with the bank’s management to financial fines, depending on the disclosure deficiency that is shown. It represents the set of information-disclosure requirements which will allow market players to evaluate the essential information in the institution’s structure, capital measurements, risk exposure, risk-management processes, and capital adequacy.

16
Risk Management Report- Pillar 3 – 1Q15
Pillar III is based on four categories/divisions:
a) scope of application - represents the relationship between recommendations and the bank’s structure;
b) capital - demonstrates the bank’s ability to absorb eventual losses; c) risk exposure - displays forms and the risk assessment itself; and d) capital adequacy - enables the judgment of capital adequacy in light of risks
incurred. Figure 5 represents the structure of Pillar III:
Figure 5 - Pillar III Structure
4.2 Basel III On 1st March 2013, the Central Bank of Brazil (Bacen) published the Basel III rules related to the definition of capital and capital requirements. Some of the measures included in the Brazilian regulatory framework stand out:
a) definition of a new methodology for calculating regulatory capital, which increases the capacity to absorb losses and continues to be divided into Tiers I and II, being Tier I composed by the Core Capital and Additional Tier I Capital;
b) definition of a new methodology for calculating the capital requirement maintenance, adopting minimum requirements for Referential Equity, Tier I and Core Capital, and the introduction of the Additional Core Capital;
A gradual implementation of the capital requirement that extends from October 2013 to January 2019 was established, so the transition is made gradually and
17
Risk Management Report- Pillar 3 – 1Q15
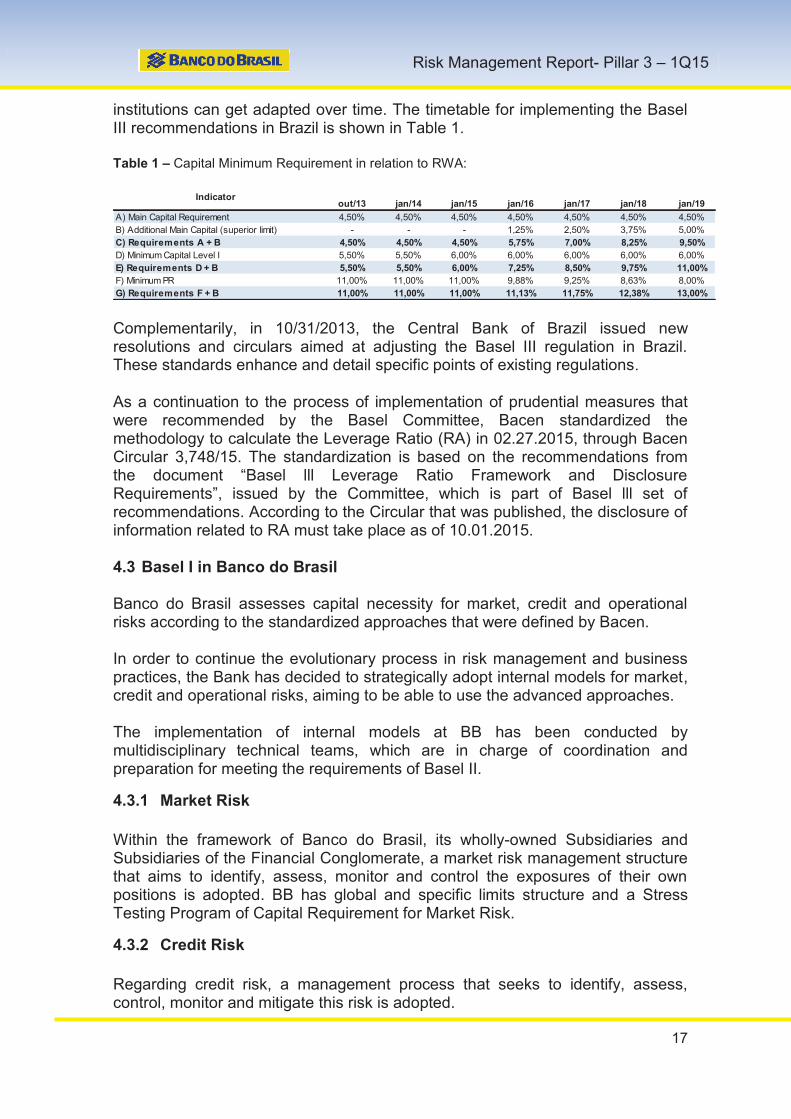
institutions can get adapted over time. The timetable for implementing the Basel III recommendations in Brazil is shown in Table 1.
Table 1 – Capital Minimum Requirement in relation to RWA:
Complementarily, in 10/31/2013, the Central Bank of Brazil issued new resolutions and circulars aimed at adjusting the Basel III regulation in Brazil. These standards enhance and detail specific points of existing regulations.
As a continuation to the process of implementation of prudential measures that were recommended by the Basel Committee, Bacen standardized the methodology to calculate the Leverage Ratio (RA) in 02.27.2015, through Bacen Circular 3,748/15. The standardization is based on the recommendations from the document “Basel lll Leverage Ratio Framework and Disclosure Requirements”, issued by the Committee, which is part of Basel lll set of recommendations. According to the Circular that was published, the disclosure of information related to RA must take place as of 10.01.2015. 4.3 Basel I in Banco do Brasil
Banco do Brasil assesses capital necessity for market, credit and operational risks according to the standardized approaches that were defined by Bacen. In order to continue the evolutionary process in risk management and business practices, the Bank has decided to strategically adopt internal models for market, credit and operational risks, aiming to be able to use the advanced approaches. The implementation of internal models at BB has been conducted by multidisciplinary technical teams, which are in charge of coordination and preparation for meeting the requirements of Basel II.
4.3.1 Market Risk
Within the framework of Banco do Brasil, its wholly-owned Subsidiaries and Subsidiaries of the Financial Conglomerate, a market risk management structure that aims to identify, assess, monitor and control the exposures of their own positions is adopted. BB has global and specific limits structure and a Stress Testing Program of Capital Requirement for Market Risk.
4.3.2 Credit Risk
Regarding credit risk, a management process that seeks to identify, assess, control, monitor and mitigate this risk is adopted.
out/13 jan/14 jan/15 jan/16 jan/17 jan/18 jan/19
A) Main Capital Requirement 4,50% 4,50% 4,50% 4,50% 4,50% 4,50% 4,50%B) Additional Main Capital (superior limit) - - - 1,25% 2,50% 3,75% 5,00%C) Requirements A + B 4,50% 4,50% 4,50% 5,75% 7,00% 8,25% 9,50%
D) Minimum Capital Level I 5,50% 5,50% 6,00% 6,00% 6,00% 6,00% 6,00%E) Requirements D + B 5,50% 5,50% 6,00% 7,25% 8,50% 9,75% 11,00%
F) Minimum PR 11,00% 11,00% 11,00% 9,88% 9,25% 8,63% 8,00%G) Requirements F + B 11,00% 11,00% 11,00% 11,13% 11,75% 12,38% 13,00%
Indicator

18
Risk Management Report- Pillar 3 – 1Q15
BB uses proprietary methodologies to rate clients` risks. Developed according to best market practices, these models (credit score and behavior score) consider both aspects, as registration and historical use of banking products and customer credit with the Bank and the market. Bacen Circular 3,648/13, which dates back to 03.04.2013, establishes minimum requirements for the use of internal ratings based on Basel II approach for credit risk. At the Bank, implementation of the approach is driven by strategic project with the responsibility to build databases, develop models of risk parameters and validation processes, ensuring integration with the management and documentation. The Bank is carrying out the construction of models of risk parameters (probability of default, exposure at the time of default, loss given default and effective maturity) and review of risk mitigators provided in Basel ll.
In order to support the process of managing credit risk, BB has also made significant investments in solutions for information technology (TI), and the new tools have already been installed.
4.3.3 Operational Risk
The Bank has an operational risk management structure that is responsible for prospecting and developing the operational risk management policies and strategies. The management process aims to identify, assess, control, monitor and mitigate the operational risk, which promotes a more effective management and the culture dissemination.
The Bank has a methodology that allows managers to identify operational risks associated to processes under his responsibility, including the identification of the occurrence of faults/inadequacies, assessing the possibility of loss, identification of risk factors, identification of operational risks and their classification. The development of strategies and management instruments are also highlighted, aiming to mitigate the operational risk, which contributes for the continuity and solidity of the organization, among which the operational risk assessment in the Entities Linked to Banco do Brasil S/A is considered; the definition of operational loss limits binding the processes managers, products and services; the verification of the products managerial result considering the operational loss; the implantation of improvements for mitigating external thefts; and the improvement of actions for mitigating electronic fraud losses. Those measures are intended mainly to reduce and prevent events that generate operating loss, besides strengthening the operational risk structure of the Bank.

19
Risk Management Report- Pillar 3 – 1Q15
5. Prudential Conglomerate
The CMN Resolution 4,192, published on 03.01.2013, in its 3rd article, item ll, establishes that, as of 01.01.2014, the calculation of Reference Equity must be made in consolidated bases for institutions that are part of the Prudential Conglomerate. In addition, on 03.01.2013, the CMN Resolution 4,195 was published and it is about the elaboration of Analytical Balance Sheet - Prudential Conglomerate. According to the 1st article of the CMN Resolution 4,195, the financial institutions and other institutions authorized to work by Bacen, except for credit cooperatives, must elaborate the Analytical Balance Sheet in a consolidated way, including data relevant to the entities described as follows, located in Brazil and abroad, on which the Bank has a direct or indirect control:
I. Financial institutions; II. Other institutions authorized to work by Bacen;
III. Consortium managing Companies; IV. Payment institutions that issue or accredit credit cards; V. Societies that acquire credit operations, including real estate loan, or
credit rights like leasing companies, securities companies and corporations of an exclusive object;
VI. Securities, capitalization and reinsurance societies, as well as complementary pension fund entities;
VII. Investment funds in which the entities that are part of the conglomerate, under any form, undertake or substantially have risks and benefits, such as exclusive investment funds, credit rights investment funds and financial investment funds, and
VIII. Other corporate bodies located in Brazil that have a societal participation in the entities quoted in the items I through VI.
The shareholding in which there is a shared control must also be consolidated (proportionally to the participation held by the institution), according to the 3rd article of the CMN Resolution 4,195. 5.1 Balance Sheets
As follows, there is the composition of the Prudential Balance Sheet compared to the Balance Sheet disclosed in the Consolidated Financial Statements, as well as the reference values in the "Attachment 1 - Composition of the Reference Equity".

20
Risk Management Report- Pillar 3 – 1Q15
Table 2 - Prudential Balance Sheet x Consolidated Balance Sheet:
In tho usands o f R eaisR eference in R E P rudential
Eco no mic and
F inancial
A SSET S
C urrent assets and lo ng-term receivables 1,334,170,745 1,501,811,020
C ash and C ash Equivalents 16,158,473 16,536,604
Sho rt- term Interbank Investments 349,471,489 351,658,176
Open market investments 309,058,044 310,652,775
Interbank deposits 40,413,445 41,005,401
Securit ies and D erivat ive F inancial Instruments 113,020,231 235,999,192
Own portfo lio 81,516,310 198,596,900
Funding instruments issued by institution authorized by Banco Central do Brasil ( t ) 18,020 --
Other 81,498,290 --
Subject to repurchase agreements 14,148,545 17,291,266
P ledged in guarantee 14,672,255 16,404,689
Derivative financial instruments 2,683,121 3,754,490
(A llowance for securities losses) -- (48,153)
Interbank acco unts 64,452,659 64,485,914
Payments and receipts pending settlement 3,719,204 3,719,278
Restricted deposits 59,245,252 59,266,005
Banco Central do Brasil deposits 56,612,772 56,633,525
National Treasury - rural credits resources 268,651 268,651
National Housing Finance System 2,363,829 2,363,829
Interbank onlendings 283,403 295,544
Correspondent banks 1,204,800 1,205,087
Interdepartmental A cco unts 196,501 196,501
Internal transfers of funds 196,501 196,501
Lo an Operat io ns 606,367,071 630,530,018
Public sector 39,262,782 66,992,715
Private sector 592,844,412 590,955,810
Loan operations linked to assignment 306,873 306,873
(A llowance for loan pperations) (26,046,996) (27,725,380)
Lease T ransact io ns 336,044 1,012,162
Private sector 647,241 1,054,153
(Unearned income on leasinf transactions) (282,986) --
(A llowance for leasing transactions losses) (28,211) (41,991)
Other R eceivables 183,586,425 197,641,607
Receivables from guarantees honored 202,339 522,197
Foreign exchange portfo lio 20,273,324 21,195,789
Receivables 1,940,048 3,008,124
Securities trading 1,298,541 1,415,617
Specific credits 1,591,775 1,591,775
Insurance, pension plans and capitalization -- 5,389,705
Sundry 160,049,845 166,723,444
Tax credits 28,396,867 --
Resulting from tax losses and negative basis of social contribution on net income (g) 1,427,850 --
Resulting from temporary differences 26,969,017 --
Excess of 10% from Core Capital ( j 1 ) 3,280,709 --
Excess of 15% from Core Capital ( l) 558,709 --
Tax credits resulting from temporary differences not deducted from RE (v) 6,513,057 --
Tax credits resulting from temporary differences for loan losses 16,616,542 --
Actuarial assets related to defined benefit pension funds (h 1 ) 6,499,810 --
Other 125,153,168 --
(A llowance for o ther losses) (1,769,447) (2,205,044)
Other A ssets 581,852 3 ,750,846
Assets not for own use and stock materials 323,776 662,827
(A llowance for impairment) (127,047) (147,038)
Prepaid expenses 385,123 3,235,057
1Q15

21
Risk Management Report- Pillar 3 – 1Q15
P ER M A N EN T A SSET S 35,728,904 21,854,684
Investments 17,435,643 3 ,584,912
Investments in subsidiaries and associated companies 17,226,756 1,807,311
Domestic 16,718,464 1,138,384
Goodwill (e 1 ) 784,708 --
Investments 15,933,756 --
Investments in insurance companies 4,286,469 --
Excess of 15% from Core Capital (k) 338,654 --
Investments not deducted from RE (u) 3,947,815 --
Other Investments 11,647,287 --
Funding instruments issued by institution authorized for Banco Central do Brasil (n) 3,804,661 --
Other 7,842,626 --
Abroad 508,292 668,927
Goodwill (e 2 ) 60,500 --
Other 447,792 --
Other investments 263,182 1,873,349
(Accumulated impairment) (54,295) (95,748)
P ro perty, plant and equipment 7,208,795 7 ,504,117
Land and buildings 6,252,619 6,476,557
Revaluation of land and buildings 144,716 --
Other property, plant and equipment 9,277,341 9,915,844
(Accumulated depreciation) (8,465,881) (8,888,284)
Leased assets ( 1 ) 819,559 - -
Leased assets 931,200 --
(Accumulated depreciation) (111,641) --
Intangible 10,239,221 10,728,629
Intangible assets 17,156,363 17,826,391
Goodwill (e 3 ) 4,961,028 --
Other Intangible assets 12,195,335 --
Constituded from October 1, 2013 ( f 1 ) 6,051,268 --
Constituded before October 1, 2013 ( f 2 ) (o 1 ) 6,144,067 --
(Accumulated amortization) (6,917,142) (7,097,762)
Goodwill Amortization (e 4 ) (2,447,597) --
Other Amortization (4,469,545) --
Intangible assets amortization constituded from October 1, 2013 ( f 3 ) (930,682) --
Intangible assets amortization constituded before October 1, 2013 ( f 4 ) (o 2 ) (3,538,863) --
D eferred 25,686 37,026
Organization and expansion costs (m 1 ) 1,605,810 1,630,006
(Accumulated amortization) (m 2 ) (1,580,124) (1,592,980)
T OT A L A SSET S 1,369,899,649 1,523,665,704 (1) Leasing transact ions were considered based on the f inancial method, and the amounts were reclassif ied from the heading of leased assets to the heading of leasing transact ions, after deduct ion of residual amounts received inadvance.

22
Risk Management Report- Pillar 3 – 1Q15
In tho usands o f R eaisR eference in R E P rudential
Eco no mic and
F inancial
LIA B ILIT IES
C urrent liabilit ies and lo ng-term liabilit ies 1,288,063,367 1,439,633,857
D epo sits 466,404,678 468,005,995
Demand deposits 73,685,265 73,712,090
Savings deposits 144,089,086 144,089,086
Interbank deposits 36,736,128 37,554,005
Time deposits 211,894,199 212,650,814
Securit ies so ld under repurchase agreements 331,549,202 338,906,729
Own portfo lio 46,605,230 54,503,543
Third-party portfo lio 284,943,972 284,059,645
Free movement portfo lio -- 343,541
F unds fro m A cceptance and Issuance o f Securit ies 170,172,264 183,328,583
Funds from real state, mortgage, credit and similar bonds 139,952,996 148,531,086
Funds from debentures 970,022 99
Foreign securities 29,241,111 34,773,173
Certificates of structured operations 8,135 24,225
Interbank acco unts 2,774,239 2 ,774,586
Receipts and payments pending settlement 2,753,421 2,753,768
Correspondent banks 20,818 20,818
Interdepartmental A cco unts 4,118,051 4 ,206,078
Thrid-party funds in transit 4,111,162 4,197,215
Internal transfers of funds 6,889 8,863
B o rro wings 27,791,273 29,156,933
Domestic loans - o ther institutions 1,413,180 1,872,457
Foreign borrowing 26,378,093 27,284,476
D o mestic Onlending - Off ic ial Inst itut io ns 90,686,029 92,614,783
National Treasury 296,690 344,720
BNDES 42,263,854 43,247,174
Caixa Econômica Federal 14,232,878 14,232,878
Finame 33,175,438 34,072,842
Other institutions 717,169 717,169
F o reign Onlending 477 477
Foreign Onlending 477 477
D erivat ive F inancial Instruments 4,301,519 5 ,632,137
Derivative Financial Instruments 4,301,519 5,632,137
Other Liabilit ies 190,265,635 315,007,556
Billing and co llection of taxes and contributions 4,412,615 4,508,918
Foreign exchange portfo lio 17,244,226 17,785,981
Shareholders and statutory distributions 2,137,341 2,159,810
Taxes and social security 18,605,150 24,819,821
Provision for deferred tax liabilities ansing from positive adjustments of benefit pension funds (h 2 ) 324,021 --
Provision for deferred tax liabilities ansing from tax credits ( j 2 ) 1,731,772 --
Other 16,549,357 --
Securities trading 1,038,613 940,540
Technical provisions for insurance, pension plans and capitalization -- 108,981,702
Financial and development funds 12,264,779 12,264,779
Special operations 2,158 2,158
Subordinated debts 49,664,241 52,809,400
In accordance with the CM N Resolution No.4,192/2013 as Tier II 21,075,691 --
In accordance with regulations preceding the CM N Resolution No.4,192/2013 as Tier II (s) (x) 22,600,521 --
Other Subordinated debts 5,988,029 --
Equity and debt hybrid securities 6,268,723 6,268,723
In accordance with regulations preceding the CM N Resolution No.4,192/2013 as Capital M anagement (q) (w) 4,650,730 --
Other 1,617,993 --
Debt instruments eligible as capital 24,776,310 25,001,325
Instruments eligible as capital M anagement (p) 19,484,955 --
Instruments eligible as Tier II ( r) 5,291,355 --
Other liabilities 53,851,479 59,464,399
D EF ER R ED IN C OM E 420,635 433,808
Shareho lder's Equity 81,415,647 83,598,039
C apital (a 1 ) 54,000,000 54,000,000
Local residents 42,971,511 42,971,511
Domiciled abroad 11,028,489 11,028,489
Instrument Qualifying as C ET 1 (a 2 ) 8 ,100,000 8 ,100,000
C apital R eserves (c 1 ) 13,992 13,992
R evaluat io n R eserves (c 2 ) 2 ,788 2 ,788
P ro f it R eserves (b 1 ) 30,015,198 25,393,416
A ccumulated Other C o mprehensive Inco me (c 3 ) (10,174,852) (10,174,852)
R etained earnings/ accumulated lo sses (b 2 ) 2 ,054 4 ,623,836
(T reasury Shares) ( i) (1,629,765) (1,629,765)
N o nco ntro lling Interests (d) 1,086,232 3 ,268,624
T OT A L LIA B ILIT IES 1,369,899,649 1,523,665,704
1Q15

23
Risk Management Report- Pillar 3 – 1Q15
5.2 Composition of the Prudential Conglomerate
The institutions included in the prudential balance sheet consolidation scope are in the table as follows, segregated by business segments:
Table 3 - Composition of the Prudential Conglomerate
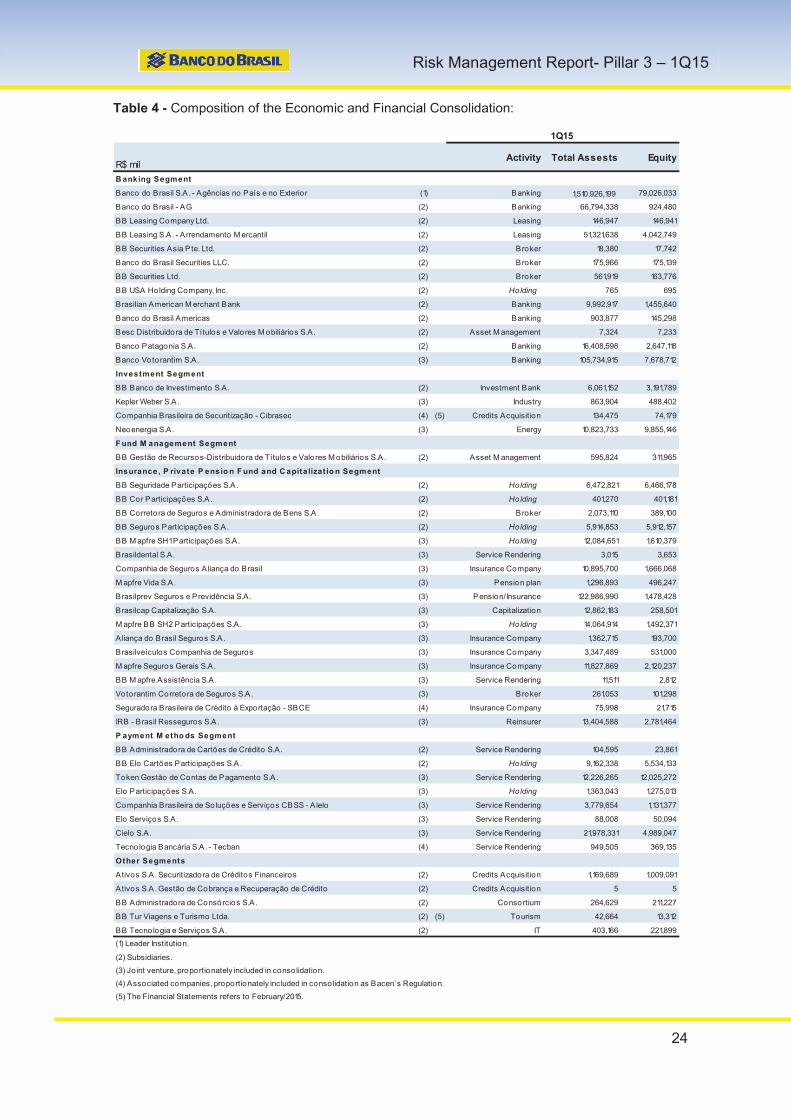
5.3 Composition of the Economic and Financial Consolidation As follows, the institutions included in the scope of consolidation of the economic financial consolidation, segregated by business segments, are shown:
R$ milActivity Total Assests Equity
F inancial Inst itut io ns
Banco do Brasil S.A. - Agências no País e no Exterior (1) Banking 1,510,926,199 79,026,033
Banco do Brasil - AG (2) Banking 66,794,338 924,480
BB Leasing Company Ltd. (2) Leasing 146,947 146,941
BB Leasing S.A. - Arrendamento M ercantil (2) Leasing 51,321,638 4,042,749
BB Securities Asia Pte. Ltd. (2) Broker 18,380 17,742
Banco do Brasil Securities LLC. (2) Broker 175,966 175,139
BB Securities Ltd. (2) Broker 561,919 163,776
BB USA Holding Company, Inc. (2) Holding 765 695
Brasilian American M erchant Bank (2) Banking 9,992,917 1,455,640
Banco do Brasil Americas (2) Banking 903,877 145,298
Besc Distribuidora de Títulos e Valores M obiliários S.A. (2) Asset M anagement 7,324 7,233
Banco Patagonia S.A. (2) Banking 16,408,598 2,647,118
BB Banco de Investimento S.A. (2) Investment Bank 6,061,152 3,191,789 BB Gestão de Recursos-Distribuidora de Títulos e Valores M obiliários S.A.
(2) Asset M anagement 595,824 311,965
C o nso rt ium M anager
BB Administradora de Consórcios S.A. (2) Consortium 264,629 211,227
P ayment Inst itut io ns
BB Administradora de Cartões de Crédito S.A. (2) Service Rendering 104,595 23,861
Companhia Brasileira de Soluções e Serviços CBSS - Alelo (3) Service Rendering 3,779,654 1,131,377
Cielo S.A. (3) Service Rendering 21,978,331 4,989,047
Securit izat io n C o mpanies
Ativos S.A. Securitizadora de Créditos Financeiros (2) Credits Acquisition 1,169,689 1,009,091
Companhia Brasileira de Securitização - Cibrasec (4) Credits Acquisition 134,475 74,179
(4) Associated company proportionately included in consolidation, as Bacen’s Regulation.
1Q15
(1) Leader Institution.
(2) Subsidiaries.
(3) Jo int ventures, proportionately included in consolidation.
24
Risk Management Report- Pillar 3 – 1Q15
Table 4 - Composition of the Economic and Financial Consolidation:
R$ milActivity Total Assests Equity
B anking Segment
Banco do Brasil S.A. - Agências no País e no Exterior (1) Banking 1,510,926,199 79,026,033
Banco do Brasil - AG (2) Banking 66,794,338 924,480
BB Leasing Company Ltd. (2) Leasing 146,947 146,941
BB Leasing S.A. - Arrendamento M ercantil (2) Leasing 51,321,638 4,042,749
BB Securities Asia Pte. Ltd. (2) Broker 18,380 17,742
Banco do Brasil Securities LLC. (2) Broker 175,966 175,139
BB Securities Ltd. (2) Broker 561,919 163,776
BB USA Holding Company, Inc. (2) Holding 765 695
Brasilian American M erchant Bank (2) Banking 9,992,917 1,455,640
Banco do Brasil Americas (2) Banking 903,877 145,298
Besc Distribuidora de Títulos e Valores M obiliários S.A. (2) Asset M anagement 7,324 7,233
Banco Patagonia S.A. (2) Banking 16,408,598 2,647,118
Banco Votorantim S.A. (3) Banking 105,734,915 7,678,712
Investment Segment
BB Banco de Investimento S.A. (2) Investment Bank 6,061,152 3,191,789
Kepler Weber S.A. (3) Industry 863,904 488,402
Companhia Brasileira de Securitização - Cibrasec (4) (5) Credits Acquisition 134,475 74,179
Neoenergia S.A. (3) Energy 10,823,733 9,855,146
F und M anagement Segment
BB Gestão de Recursos-Distribuidora de Títulos e Valores M obiliários S.A. (2) Asset M anagement 595,824 311,965
Insurance, P rivate P ensio n F und and C apitalizat io n Segment
BB Seguridade Participações S.A. (2) Holding 6,472,821 6,466,178
BB Cor Participações S.A. (2) Holding 401,270 401,181
BB Corretora de Seguros e Administradora de Bens S.A. (2) Broker 2,073,110 389,100
BB Seguros Participações S.A. (2) Holding 5,914,853 5,912,157
BB M apfre SH1 Participações S.A. (3) Holding 12,084,651 1,610,379
Brasildental S.A. (3) Service Rendering 3,015 3,653
Companhia de Seguros Aliança do Brasil (3) Insurance Company 10,895,700 1,666,068
M apfre Vida S.A. (3) Pension plan 1,296,893 496,247
Brasilprev Seguros e Previdência S.A. (3) Pension/Insurance 122,986,990 1,478,428
Brasilcap Capitalização S.A. (3) Capitalization 12,862,183 258,501
M apfre BB SH2 Participações S.A. (3) Holding 14,064,914 1,492,371
Aliança do Brasil Seguros S.A. (3) Insurance Company 1,362,715 193,700
Brasilveículos Companhia de Seguros (3) Insurance Company 3,347,489 531,000
M apfre Seguros Gerais S.A. (3) Insurance Company 11,827,869 2,120,237
BB M apfre Assistência S.A. (3) Service Rendering 11,511 2,812
Votorantim Corretora de Seguros S.A. (3) Broker 261,053 101,298
Seguradora Brasileira de Crédito à Exportação - SBCE (4) Insurance Company 75,998 21,715
IRB - Brasil Resseguros S.A. (3) Reinsurer 13,404,588 2,781,464
P ayment M etho ds Segment
BB Administradora de Cartões de Crédito S.A. (2) Service Rendering 104,595 23,861
BB Elo Cartões Participações S.A. (2) Holding 9,162,338 5,534,133
Token Gestão de Contas de Pagamento S.A. (3) Service Rendering 12,226,265 12,025,272
Elo Participações S.A. (3) Holding 1,363,043 1,275,013
Companhia Brasileira de Soluções e Serviços CBSS - A lelo (3) Service Rendering 3,779,654 1,131,377
Elo Serviços S.A. (3) Service Rendering 88,008 50,094
Cielo S.A. (3) Service Rendering 21,978,331 4,989,047
Tecnologia Bancária S.A. - Tecban (4) Service Rendering 949,505 369,135
Other Segments
Ativos S.A. Securitizadora de Créditos Financeiros (2) Credits Acquisition 1,169,689 1,009,091
Ativos S.A. Gestão de Cobrança e Recuperação de Crédito (2) Credits Acquisition 5 5
BB Administradora de Consórcios S.A. (2) Consortium 264,629 211,227
BB Tur Viagens e Turismo Ltda. (2) (5) Tourism 42,664 13,312
BB Tecnologia e Serviços S.A. (2) IT 403,166 221,899
(2) Subsidiaries.
(3) Jo int venture, proportionately included in consolidation.
(4) Associated companies, proportionately included in consolidation as Bacen’s Regulation.
(5) The Financial Statements refers to February/2015.
(1) Leader Institution.
1Q15

25
Risk Management Report- Pillar 3 – 1Q15
6. Risk Management
6.1 Credit Risk
6.1.1 Management Objectives
Banco do Brasil’s Prudential Conglomerate credit risk is managed according to best market practices and follows the banking supervision and regulatory rules. It seeks to identify, assess, control, and mitigate the risk exposures, monitor the management process, contribute to maintain the bank’s health and solvency, and ensure the interests of the shareholders. Credit risk management in the Conglomerate involves Credit Policy, risk appetite and tolerance, strategies, processes, procedures and credit risk management systems, as the figure below:
Figure 6 – Credit risk management
Note: CA = Board of Directors; CSRG = Global Risk Superior Committee; CERC = Credit Risk Executive Committee; DICRE = Credit Board; DIRAO = Asset Restructuring Board; DIRIS = Risk Management Board, URO = Operational Risk Unit.
Management Structure
Operational Procedures
Management Systems
CA
CSRG
CERC
Strategic Level
DICRE
DIRAO
DIRIS
Operational Level

26
Risk Management Report- Pillar 3 – 1Q15
Board of Directors (CA) Banco do Brasil S.A Board of Directors (CA) defines the Bank and its subsidiaries general business. The Board has, in the manner provided by law and the Statute, strategic, guiding, elective and monitoring assignments, not covering operating and executive functions. The composition and management term of the Council is defined by the Bank's bylaws. The Board of Directors shall decide on policies, corporate strategy, investment plan, master plan and the Bank’s general budget. Global Risk Superior Committee – CSRG
Purposes: · to set credit risk management strategy; · to determine global limits to credit risk exposure; · to approve the risk factors that will make up the documents and reports
to be submitted to regulatory agencies and other institutions; · to approve methodologies, criteria and parameters for calculation of
provisions for contingent claims;
Credit Risk Executive Committee– CERC Purposes: To approve:
· the implementation of actions that enable the loan portfolio management; · the loans portfolio risk mitigatory actions and instruments; · contingency plans regarding credit and social and environmental risk
management; · specific limits to credit risk exposures; · models, methodologies, criteria and parameters for credit risk
management; the process of collecting and recovering debts; · to assess the internal validations result and define, whenever necessary,
corrective measures for models of credit risk management;
To analyse and propose to CSRG the:
· credit risk management strategy; · global limits to credit risk exposures;
To monitor the:
· measures implemented to mitigate the risk in the loan portfolio management;
· development of Allowance for Loan and Lease Losses (ALLL), submitting it to the attention of CSRG;
· recommendations and guidelines resolved by the Committee.
27
Risk Management Report- Pillar 3 – 1Q15
In accordance with CMN Decision 3,721/09, the credit risk management structure of Banco do Brasil was approed, composed by Global Risk Superior Committee (CSRG), Credit Risk Executive Committee (CERC), Credit Board (DICRE), Operational Asset Restructuring Board (DIRAO), Risk Management Board (DIRIS) and Operational Risk Unit (URO). That credit risk management structure is compatible with the nature of transactions, the complexity of products and services, and in proportion to the size of the credit-risk exposure incurred by Banco do Brasil. As Diris is the unit of the Bank that is in charge of overall risk management and does not have any ties with the management of third-party resources administration or with the fulfillment of transactions subject to credit risk, the CA pointed out the Director of the Risk Management Board as responsible for BB’s credit risk management before Bacen. 6.1.2 Credit Policy
Banco do Brasil’s credit policy contains strategic guidelines to direct credit-risk management actions in the financial conglomerate. It is approved by the Board of Directors and reviewed every year. It applies to all businesses that involve credit risk and is available to all employees. It is expected that the Subsidiaries, Affiliates and Investment companies define their paths from these guidelines, taking into account the specific needs and legal and regulatory issues to which they are subject. The credit policy is divided into four blocks: General Aspects, Credit Risk taking, Collections and Credit Recovery, and Credit Risk Management. Each block contains a comprehensive set of statements which encompasses all stages of credit-risk management at Banco do Brasil. Some topics addressed in Banco do Brasil’s credit policy are listed below:
· concept of credit risk; · conditions for risk taking;
· separation of duties; · guidelines for collections and credit recovery;
· joint decisions; · capital planning · risk appetite; · allowance and capital levels; · risk limits; · stress tests. · client rating;
6.1.3 Management Strategies
Aligned with the objectives of credit risk management, the Board of Directors (CA) establishes the credit policy and the risk appetite of Banco do Brasil and approves management strategies, which are defined by the Global Risk Superior Committee (CSRG) and operationalized by the Credit Risk Executive Committee (CERC).

28
Risk Management Report- Pillar 3 – 1Q15
The credit-risk management strategies, described below, aim to guide the actions in the operational level, comprising: · approving credit risk management models; · setting goals for timely payment, recovery, maximum loss, and quality of the
loan portfolio; · setting risk and concentration limits; and · keeping appropriate levels of allowances and capital.
6.1.4 Management Processes
According to Banco do Brasil’s credit risk management structure, the Credit (DICRE), Operational Asset Restructuring (DIRAO) and Risk Management (DIRIS) Boards are responsible for implementing strategic decisions approved by the CA, CSRG and CERC, keeping exposure in the risk levels set by the Executive Management. DICRE focuses on clients and operations, whose main products are: registration, marketing studies and information on economic sectors, methodologies (risk, risk components, and credit limits), risk analysis (clients, operations, projects, economic sectors, countries, and projects), validation and monitoring of risk methodology and credit-risk components, study of investment and leasing transactions, economic/financial evaluation and diagnosis of businesses/corporate groups, monitoring the credit portfolio, and producing inputs for pricing credit risk. DIRAO operates in collecting, and recovering troublesome credits, whose main products are: models to rate clients under collections and recovery, collection and recovery strategies, recovery quality indicators, management of collections and recovery channels, debt rescheduling, restructuring transactions, setting negotiating floors and methodologies for dealing with troublesome credits or defaults. DIRIS focuses on managing the credit risk of aggregate positions, whose main products are: policies, risk limits, credit risk models, information on credit risk, indicators of credit portfolio quality, capital allocation as a function of risk, management of the credit portfolio’s risk, controlling of credit risk exposure and stress testing.

29
Risk Management Report- Pillar 3 – 1Q15
Figure 7 summarizes the responsibilities of the Boards:
Figure 7 - Credit risk management structure
The processes and procedures of the credit risk management structure are validated and performed by two internal units at different points in time, a fact that ensures the adequate separation of duties and the independence of work. The Internal Control Board (DICOI) is responsible for validating the financial conglomerate’s risk determination and measurement models and the bank’s internal control system. Internal Audit (AUDIT) periodically evaluates credit risk management processes to verify whether they are consistent with the strategic guidelines, credit policy, and regulatory and internal rules. 6.1.5 Communication and Information Processes
The disclosure of credit risk information is a continual and ongoing process whose premises considered when selecting and disclosing information include best practices, banking laws, users` needs, the bank’s interests, confidentiality, and the relevance of the information. The communication and information on credit risk management is provided to internal and external clients, according to the following processes: 6.1.5.1 Communication process for internal clients
The operational units of the credit risk management structure permanently communicate risk exposure to upper management in order to monitor management actions and decision-making by the Senior Management.

30
Risk Management Report- Pillar 3 – 1Q15
The communication process involves several reports on credit risk management, which are produced periodically and are the result of analysis conducted by professionals from the units. They demonstrate the credit risk of all exposures or in certain portfolios, such as:
a) Presentation of the Bank’s credit portfolio X National Financial System; b) Comparative BB credit portfolio x main competitors; c) Credit Risk Panel; and d) Stress testing.
6.1.5.2 Communication process for external clients
The operational units of the credit risk management structure produce information for external users and send it to the Investor Relations Unit (URI) that, as a practice of transparency, discloses the information to the market, as a transparent governance practice. That allows investors and interested parties to monitor risk-management actions and the evolution of credit risk, and to prove the Bank’s capital adequacy to cover all risks taken. Information for external users is provided on a publicly accessible location, easily found on the bank’s website. The information is published in the following documents: · Performance Analysis Report; · Explanatory Notes to Financial Statements; and · Annual Report.
6.1.6 Measurement Systems
Credit risk is measured in many ways: by default, arrears, portfolio quality, and allowance for doubtful accounts, concentration, and regulatory capital requirements, among others. The quantity and nature of the operations, the diversity and complexity of our products and services, and the volume exposed to credit risk require systematic measurement of credit risk at Banco do Brasil. The Bank has enough databases and corporate system infrastructure to ensure comprehensive measurement of credit risk. Some of these risk measures are highlighted below. 6.1.6.1 Concentration
The Bank has developed and implemented a system to measure and monitor credit risk concentration in businesses. The model is based on the Herfindahl Index. It evaluates concentration based on borrowers` credit risk, and it considers the interrelationship among the various economic sectors that comprise the businesses credit portfolio. 6.1.6.2 Regulatory Capital Requirement
The Bank measures the Regulatory Capital requirement for credit risk through Regulatory Simplified Standardized Approach, whose procedures for calculating

31
Risk Management Report- Pillar 3 – 1Q15
the potion of risk-weighted assets (RWA) regarding exposure to credit risk (RWACPAD) were released by the Bacen through Circular 3,644/13. Those procedures were implemented in a proprietary system that determines the capital requirements quickly and securely, allowing timely verification of the bank’s solvency under the regulator’s rules. The Bank uses Regulatory Capital information to assess the efficiency of capital allocation and planning. 6.1.7 Mitigation Policy
Banco do Brasil adopts a conservative attitude towards credit risk. In conducting any business subject to credit risk, the bank’s general rule is to tie it to a mechanism that provides partial or complete hedging of risk incurred. In managing credit risk on the aggregate level, to keep exposure within the risk levels established by the Senior Management, the Bank has the prerogative to transfer or to share credit risk. The use of credit risk mitigating instruments is stated in the Credit Policy, present in strategic decisions, and formalized in credit rules, reaching all levels of the organization and covering all stages of credit risk management. Credit rules provide clear, comprehensive guidelines for the operational units. Among other aspects, the rules address ratings, requirements, choices, assessments, formalization, control, and reinforcement of guarantees, ensuring the adequacy and sufficiency of the mitigator throughout the transaction cycle.
6.1.8 Processes for Monitoring the Effectiveness of Mitigators
Monitoring the effectiveness of mitigators is part of the Bank’s credit risk management processes. We quote, as an example, monitoring exposures subject to credit risk, the risk ratings of loans, capital management, and credit collection and recovery. The processes of monitoring credit risk exposure and rating loans risks produce important information for verifying the effectiveness of mitigating instruments. The low default ratio in certain segments of the credit portfolio and the lowest level of allowances in certain transactions may mean that the existence of guarantees tied to exposure reducing credit risk and capital requirements for its coverage. 6.1.9 Exposure to Credit Risk
The table below shows the concentration levels of the ten largest customers in relation to total transactions with credit granting feature.

32
Risk Management Report- Pillar 3 – 1Q15
Table 5 - Concentration of the ten and of the hundred largest customers in relation to the total of transactions with credit granting feature
The following table shows credit risk average exposure of individual portfolios (PF) and businesses (PJ):
Table 6 - Credit risk average exposure
The next table presents the credit risk exposure of the businesses portfolio (PJ), segregated by geographic regions in Brazil:
1st to 10th 1st ao 100th
1Q15 11.4% 25.7%
4Q14 10.2% 24.2%
3Q14 10.4% 24.3%
2Q14 9.6% 23.2%
1Q14 10.6% 23.8%
4Q13 10.7% 23.8%
3Q13 10.4% 23.4%
R$ million
Exposure Balance * Average Balance Balance * Average Balance Balance * Average Balance
Individuals
Agribusiness 119,912 39,971 119,414 39,805 112,543 37,514
Mortgage 30,539 10,180 28,645 9,548 25,863 8,621
Payroll Loan 59,863 19,954 58,843 19,614 61,364 20,455
Auto Loans 10,164 3,388 10,608 3,536 23,548 7,849
Credit Cards 67,624 22,541 67,311 22,437 65,504 21,835
Others 49,571 16,524 48,603 16,201 49,792 16,597
Total Individuals 337,674 112,558 333,424 111,141 338,614 112,871
Companies - -
Agribusiness 45,815 15,272 48,038 16,013 48,137 16,046
Investments 93,115 31,038 90,552 30,184 74,201 24,734
Import/Export. 16,530 5,510 16,505 5,502 15,531 5,177
Working Capital 234,454 78,151 229,541 76,514 222,814 74,271
Others 173,047 57,682 165,889 55,296 159,230 53,077
Total Companies 562,960 187,653 550,526 183,509 519,913 173,304
Total 900,634 300,211 883,950 294,650 858,526 286,175
* Includes BB internal portfolio and loans to concede
1Q15 4Q14 3Q14

33
Risk Management Report- Pillar 3 – 1Q15
Table 7 - PJ credit risk exposure by geographic regions
The table below presents the credit risk exposure of the individuals portfolio (PF), segregated by geographic regions in Brazil:
R$ million 1Q15
Region Agribusiness Investments Import/Export. Working Capital Others
Midw est 1,256 23,237 229 17,931 7,161 Northeast 296 4,849 231 17,846 10,465 North 139 3,913 56 6,883 2,555 Southeast 36,932 41,902 13,674 145,677 96,847 South 7,010 13,460 2,332 29,927 13,464 Foreign - 5,936 9 16,190 42,556 Total 45,633 93,297 16,530 234,454 173,047
R$ million 4Q14
Region Agribusiness Investments Import/Export. Working Capital Others
Midw est 1,559 22,600 257 17,960 7,050 Northeast 368 4,735 532 17,965 10,202 North 142 3,989 45 6,877 2,464 Southeast 38,349 40,707 13,249 142,074 96,339 South 7,600 13,376 2,413 30,873 12,992 Foreign - 5,166 9 13,792 36,843 Total 48,018 90,572 16,505 229,541 165,889
3Q14
Region Agribusiness Investments Import/Export. Working Capital Others
Midw est 1,507 9,368 274 13,791 6,472 Northeast 341 4,645 545 17,309 9,648 North 120 3,928 61 6,752 2,245 Southeast 39,381 38,802 12,293 140,750 92,936 South 7,635 13,016 2,357 30,829 12,696 Foreign - 4,443 1 13,383 34,386 Total 48,984 74,201 15,531 222,814 158,383

34
Risk Management Report- Pillar 3 – 1Q15
Table 8 - PF credit risk exposure by geographic regions
The next table shows the behavior of the total credit risk exposure, segregated by economic sector:
R$ million 1Q15
Region Agribusiness Mortgage Payroll Loans Auto Loans Credit Cards Others
Midw est 28,727 5,230 6,182 1,512 9,931 5,542 Northeast 8,022 4,865 14,753 2,342 11,881 8,714 North 6,134 1,041 4,635 851 3,515 2,744 Southeast 37,312 13,921 28,971 3,321 30,118 23,026 South 39,898 5,482 5,322 1,955 12,179 8,356 Foreign - - - - - 1,189 Total 120,094 30,539 59,863 9,982 67,624 49,571
R$ million 4Q14
Region Agribusiness Mortgage Payroll Loans Auto Loans Credit Cards Others
Midw est 28,457 4,865 5,999 1,600 9,871 5,526 Northeast 7,990 4,338 14,377 2,472 11,813 8,542 North 5,882 977 4,526 880 3,502 2,663 Southeast 37,143 13,194 28,730 3,539 30,017 22,610 South 39,962 5,271 5,211 2,097 12,107 8,335 Foreign - - - - - 928 Total 119,434 28,645 58,843 10,588 67,311 48,603
3Q14
Region Agribusiness Mortgage Payroll Loans Auto Loans Credit Cards Others
Midw est 26,710 4,293 10,380 14,602 9,591 5,616 Northeast 7,351 3,712 13,735 2,452 11,392 8,867 North 5,299 886 4,278 866 3,360 2,794 Southeast 35,212 12,097 28,038 3,534 29,353 23,267 South 37,971 4,875 4,933 2,094 11,807 8,517 Foreign - - - - - 731 Total 112,543 25,863 61,364 23,548 65,504 49,792

35
Risk Management Report- Pillar 3 – 1Q15
Table 9 - Credit risk exposure of the financial conglomerate, by economic sector
The table below shows the behavior of the total credit risk exposure of the agribusiness portfolio, segregated by economic sector and businesses portfolio (PJ):
R$ million 1Q15 4Q14 3Q14 2Q14 1Q14
Government 41,646 36,936.54 35,263.89 32,692.00 30,399.91
Agribusiness - Animal Origin 15,138 16,280.05 15,559.52 15,640.14 15,314.02
Agribusiness - Vegetable Origin 40,414 40,731.45 40,749.17 39,864.16 37,272.85
Construction Specif ic Activities 18,631 19,080.51 18,450.92 19,165.45 17,540.88
Automotive 35,084 34,216.31 34,373.04 34,840.16 31,626.47
Beverages 2,124 2,128.32 2,066.47 3,041.44 2,797.29
Wholesale Trade and Industries 10,407 10,606.46 10,033.44 9,996.34 9,453.87
Retail Trade 26,501 25,369.77 24,571.89 24,756.76 23,388.62
Heavy Construction 10,380 10,686.77 9,708.66 9,517.22 8,415.82
Leather and Shoes 4,187 4,234.95 4,161.39 4,031.32 3,944.59
Other Activities 772 729.08 2,338.85 2,251.59 29,908.49
Electrical and Electronic Goods 13,364 14,498.82 14,066.44 13,946.45 13,897.73
Eletricity 41,091 38,773.83 36,766.60 34,531.07 30,481.91
Housing 29,522 29,066.12 27,577.52 26,057.78 24,889.08
Banks and Financial Services 33,528 31,967.43 30,763.38 29,461.63 29,440.73
Agricultural Consumables 13,555 13,309.99 12,291.59 12,163.41 11,870.82
Timber and Furniture 8,985 9,069.02 8,679.12 8,757.31 8,640.61
Metalw orking and Steel 48,520 46,925.59 45,377.34 44,823.00 43,214.02
Pulp and Paper 12,636 12,412.03 12,193.04 12,206.80 11,567.52
Oil and Gas 49,627 46,605.42 47,166.14 46,603.06 38,396.34
Chemicals 14,400 14,257.24 14,075.50 14,554.52 12,978.44
Services 32,029 33,062.15 33,492.63 33,109.17 31,607.32
Telecommunication 10,134 11,055.89 11,044.02 11,191.33 11,272.05
Textile and Garments 15,917 16,548.47 16,212.47 16,231.57 15,578.55
Transport 34,366 31,973.79 30,604.01 29,296.94 27,991.62
Individuals 337,674 333,423.87 320,939.63 316,212.29 301,425.89
Total(1) 900,634 883,950 858,527 844,943 823,315
(1)* Includes BB internal portfolio and loans to concede

36
Risk Management Report- Pillar 3 – 1Q15
Table 10 - Credit risk exposure of the agribusiness portfolio, segregated by economic sector and businesses portfolio (PJ) – 1Q15
Table 11 - Credit risk exposure of the agribusiness portfolio, segregated by economic sector and businesses portfolio (PJ) – 4Q14
1Q15
Agribusiness Investments Import/Export Working Capital Others
R$ million
Government 0.01 9,567.64 - 0.32 - 31,553.27 - 524.52
Agribusiness - Animal Origin 5,276.60 1,334.00 - 1,254.48 - 5,107.86 - 2,165.37
Agribusiness - Vegetable Origin 13,426.01 7,027.82 - 3,721.49 - 10,413.53 - 5,824.97
Construction Specif ic Activities 195.02 3,697.29 - 301.63 - 7,364.33 - 7,072.81
Automotive 250.63 6,289.64 - 3,027.13 - 14,049.54 - 11,467.19
Beverages 124.67 383.05 - 267.08 - 678.54 - 670.19
Wholesale Trade and Industries 977.52 1,229.70 - 156.99 - 5,324.31 - 2,718.09
Retail Trade 1,342.44 2,069.12 - 34.37 - 12,887.16 - 10,168.07
Heavy Construction 1.09 1,113.35 - 18.72 - 3,766.24 - 5,481.03
Leather and Shoes - 333.93 - 346.36 - 2,177.48 - 1,329.50
Other Activities 54.14 4.33 - 2.13 - 21.48 - 690.04
Electrical and Electronic Goods 0.42 1,277.06 - 422.50 - 5,984.25 - 5,680.03
Eletricity 3,799.16 7,623.87 - 29.71 - 17,292.79 - 12,345.88
Housing 21.24 1,128.59 - - - 7,035.54 - 21,336.99
Banks and Financial Services 524.29 517.64 - 8.66 - 2,907.81 - 29,569.60
Agricultural Consumables 2,069.44 1,589.10 - 1,070.92 - 3,966.91 - 4,858.26
Timber and Furniture 859.85 1,363.67 - 228.10 - 4,323.29 - 2,210.31
Metalw orking and Steel 3,523.82 3,254.17 - 3,952.90 - 25,056.05 - 12,733.07
Pulp and Paper 2,558.37 1,175.55 - 330.22 - 5,593.93 - 2,978.39
Oil and Gas 9,298.95 4,235.10 - 541.92 - 21,507.90 - 14,043.00
Chemicals 75.39 1,650.83 - 247.06 - 7,122.98 - 5,303.69
Services 141.21 5,993.00 - 206.24 - 16,588.69 - 9,099.46
Telecommunication - 161.62 - 78.73 - 5,409.73 - 4,484.30
Textile and Garments 552.88 1,456.56 - 146.92 - 8,567.15 - 5,193.57
Transport 592.44 15,133.68 - 135.18 - 6,889.21 - 11,615.82
Total(1) 45,665.59 79,610.32 - 16,529.77 - 231,589.97 - 189,564.15
(1)* Includes BB internal portfolio and loans to concede
4Q14
Agribusiness Investments Import/Export Working Capital Others
R$ million
Government 0.01 9,592.27 0.21 26,899.56 444.49
Agribusiness - Animal Origin 6,047.92 1,324.01 1,414.16 5,454.02 2,039.94
Agribusiness - Vegetable Origin 14,507.84 6,273.99 3,667.74 10,216.38 6,065.50
Construction Specif ic Activities 170.15 3,654.16 362.27 7,627.52 7,266.42
Automotive 359.08 5,700.35 3,264.72 14,297.11 10,595.05
Beverages 127.16 404.99 234.72 706.37 655.08
Wholesale Trade and Industries 1,257.88 1,166.41 183.15 5,520.01 2,479.02
Retail Trade 1,544.95 2,091.82 50.87 12,892.63 8,789.51
Heavy Construction 1.07 1,189.77 18.98 4,171.91 5,305.04
Leather and Shoes - 331.74 378.58 2,255.20 1,269.43
Other Activities 51.73 2.50 1.14 10.87 662.85
Electrical and Electronic Goods 2.69 1,189.29 444.49 6,524.45 6,337.91
Eletricity 3,921.51 7,762.64 23.93 14,620.68 12,445.06
Housing 21.17 877.69 0.26 7,296.73 20,870.27
Banks and Financial Services 623.86 910.88 8.77 2,261.72 28,162.20
Agricultural Consumables 2,239.62 1,532.69 1,071.89 4,097.69 4,368.09
Timber and Furniture 904.27 1,343.98 222.61 4,448.49 2,149.67
Metalw orking and Steel 3,448.61 3,259.57 3,653.42 24,924.98 11,639.00
Pulp and Paper 2,547.76 1,164.18 358.78 5,469.67 2,871.64
Oil and Gas 9,120.58 4,160.00 288.26 20,565.61 12,470.96
Chemicals 85.42 1,641.77 197.44 7,221.71 5,110.90
Services 140.98 6,019.06 202.08 17,473.17 9,226.87
Telecommunication - 162.00 78.93 5,340.31 5,474.65
Textile and Garments 617.95 1,468.42 198.35 8,943.70 5,320.05
Transport 577.32 13,757.20 179.71 6,786.15 10,673.41
Total(1) 48,319.52 76,981.38 16,505.46 226,026.62 182,693.02
(1)* Includes BB internal portfolio and loans to concede

37
Risk Management Report- Pillar 3 – 1Q15
Table 12 - Credit risk exposure of the agribusiness portfolio, segregated by economic sector and businesses portfolio (PJ) – 3Q14
The next table presents the credit risk exposure of individual portfolios (PF) and businesses (PJ), segregated by maturity of the transactions: Table 13 - Credit risk exposure of PF and PJ portfolios by maturity of the transactions – 1Q15
Agribusiness Investments Import/Export Working Capital Others
R$ million
Government 0.01 9,389.43 0.11 25,457.49 416.85
Agribusiness - Animal Origin 5,877.11 1,319.81 1,260.80 5,230.37 1,871.43
Agribusiness - Vegetable Origin 14,687.10 6,167.25 3,705.45 10,015.85 6,173.52
Construction Specif ic Activities 168.85 3,523.19 313.86 7,511.90 6,933.11
Automotive 357.09 5,488.42 3,583.00 14,364.98 10,579.55
Beverages 197.76 398.43 230.63 702.71 536.93
Wholesale Trade and Industries 1,283.11 1,057.45 127.65 5,418.51 2,146.71
Retail Trade 1,580.07 1,983.94 24.44 12,268.63 8,714.82
Heavy Construction 1.33 1,188.84 18.74 3,743.98 4,755.77
Leather and Shoes - 318.65 361.73 2,234.08 1,246.92
Other Activities 603.17 369.75 0.95 1,622.82 30,505.50
Electrical and Electronic Goods 2.62 1,006.05 376.92 6,553.13 6,127.72
Eletricity 3,619.08 7,758.87 19.37 12,964.77 12,404.51
Housing 10.14 844.06 0.26 7,386.64 19,336.42
Banks and Financial Services - - - - -
Agricultural Consumables 2,245.58 1,409.37 938.05 4,021.73 3,676.86
Timber and Furniture 728.78 1,280.81 193.41 4,420.43 2,055.70
Metalw orking and Steel 3,508.22 3,163.33 3,070.66 25,938.83 9,696.29
Pulp and Paper 2,560.10 1,159.83 303.34 5,488.16 2,681.60
Oil and Gas 9,488.78 4,090.30 191.87 20,862.64 12,532.55
Chemicals 139.10 1,593.42 180.24 7,301.75 4,860.99
Services 119.93 6,070.11 200.11 17,588.72 9,513.76
Telecommunication - 151.58 81.92 5,579.96 5,230.56
Textile and Garments 625.49 1,446.34 182.10 8,911.03 5,047.51
Transport 331.42 13,020.35 165.44 7,224.42 9,862.39
Total(1) 48,134.84 74,199.60 15,531.05 222,813.54 176,907.97
3Q14
(1)* Includes BB internal portfolio and loans to concede
R$ mi l l ion
Exposure up to 6 months 6 months to 1 year 1 to 5 years Above 5 years
Agribusiness 19,822 23,010 25,027 52,053
Mortgage 17,917 469 430 48,808
Payroll Loan 433 1,082 30,365 27,983
Auto Loans 19 4 276 30,240
Credit Cards 222 549 9,139 253
Others 10,149 13,004 18,078 8,339
Total Individuals 48,561 38,119 83,316 167,677
Agribusiness 10,891 5,346 17,543 12,036
Investments 59,543 17,077 102,637 55,197
Import/Export. 10,720 4,365 1,445 -
Working Capital 6,287 3,229 27,903 55,695
Others 51,041 13,726 84,038 24,241
Total Companies 138,482 43,742 233,566 147,170
Total 187,043 81,861 316,882 314,847
1Q15

38
Risk Management Report- Pillar 3 – 1Q15
Table 14 - Credit risk exposure of PF and PJ portfolios by maturity of the transactions – 4Q14
Table 15 - Credit risk exposure of PF and PJ portfolios by maturity of the transactions – 3Q14
The table below shows the amount of overdue transactions, gross of allowances and excluded the write-offs, segregated by geographical regions in Brazil:
R$ mi l l ion
Exposure up to 6 months 6 months to 1 year 1 to 5 years Above 5 years
Agribusiness 15,521 26,159 26,949 50,786
Mortgage 16,463 860 170 49,818
Payroll Loan 435 1,115 31,803 25,490
Auto Loans 19 4 270 28,352
Credit Cards 202 645 9,506 254
Others 10,688 11,153 18,883 7,879
Total Individuals 43,329 39,935 87,581 162,579
Agribusiness 11,553 7,359 18,503 10,623
Investments 54,754 17,679 105,157 51,951
Import/Export. 9,811 4,470 2,206 18
Working Capital 5,304 2,987 26,914 55,347
Others 42,294 11,824 85,043 26,728
Total Companies 123,717 44,320 237,823 144,667
Total 167,045 84,255 325,404 307,246
4Q14
R$ mi l l ion
Exposure up to 6 months 6 months to 1 year 1 to 5 years Above 5 years
Agribusiness 20,192 15,436 30,101 46,797
Mortgage 17,262 715 25 47,501
Payroll Loan 422 1,106 34,766 20,365
Auto Loans 83 3 266 25,511
Credit Cards 171 652 9,508 265
Others 12,327 11,136 18,839 7,489
Total Individuals 50,457 29,049 93,504 147,929
Agribusiness 10,616 9,446 16,789 11,278
Investments 56,228 17,699 105,556 48,035
Import/Export. 7,618 5,495 2,418 -
Working Capital 4,419 3,398 26,786 52,576
Others 39,599 16,512 78,721 24,398
Total Companies 118,480 52,551 230,270 136,287
Total 168,937 81,600 323,774 284,216
3Q14

39
Risk Management Report- Pillar 3 – 1Q15
Table 16 - Amount of overdue transactions by geographical regions.
R$ million
Region 15 to 60 days 61 to 90 days 91 to 180 days 181 to 360 days Above 360 days
Midw est 1,206.65 367.21 634.17 783.96 81.23
Northeast 1,290.37 416.23 743.05 1,056.44 91.94
North 465.02 159.73 288.89 376.26 33.74
Southeast 4,023.64 1,443.57 2,580.86 3,292.06 305.67
South 1,334.82 476.02 1,040.45 1,340.67 105.15
Foreign 3,512.46 6.50 16.22 3.97 176.89
TOTAL 11,832.96 2,869.27 5,303.64 6,853.37 794.62
R$ million
Region 15 to 60 days 61 to 90 days 91 to 180 days 181 to 360 days Above 360 days
Midw est 804.45 220.51 604.11 797.53 68.95
Northeast 915.88 307.95 743.87 1,033.54 120.37
North 348.43 100.10 282.96 390.31 35.54
Southeast 2,531.43 993.52 2,336.08 3,641.19 338.66
South 1,205.06 365.53 1,025.63 1,211.71 140.88
Foreign 10.29 0.00 - 0.00 26.86
TOTAL
R$ million
Region 15 to 60 days 61 to 90 days 91 to 180 days 181 to 360 days Above 360 days
Midw est 928.53 236.59 606.30 708.02 53.31
Northeast 994.73 361.02 725.45 993.32 81.98
North 383.45 120.39 278.78 376.23 29.79
Southeast 2,669.92 1,083.31 2,943.35 3,341.27 332.68
South 1,107.81 499.90 1,037.23 1,145.07 170.43
Foreign 0.07 0.02 34.11 0.53 25.89
TOTAL 6,084.51 2,301.23 5,625.21 6,564.45 694.08
1Q15
4Q14
3Q14

40
Risk Management Report- Pillar 3 – 1Q15
Below, the amount of overdue transactions, gross of allowances and excluded the write-offs of the financial group, segregated by economic sector are presented:
Table 17 - Amount of overdue transactions, segregated by economic sector – 1Q15
R$ million 1Q15
Macro-sector 15 to 60 days 61 to 90 days 91 to 180 days 181 to 360 days Above 360 days
Government 2.64 0.58 6.42 8.15 0.53 Agribusiness - Animal Origin 51.81 75.67 34.27 69.28 3.75 Agribusiness - Vegetable Origin 638.70 172.84 70.94 267.43 108.07 Construction Specif ic Activities 294.13 263.38 129.12 180.27 18.32 Automotive 268.34 410.26 125.84 220.96 15.30 Beverages 9.15 22.56 7.97 8.00 1.02 Wholesale Trade and Industries 144.66 136.68 64.61 120.98 4.51 Retail Trade 395.71 484.72 158.34 342.93 19.96 Heavy Construction 179.24 58.21 156.48 85.96 4.89 Leather and Shoes 47.78 69.66 24.49 49.66 3.32 Other Activities 0.70 1.00 0.31 0.28 - Electrical and Electronic Goods 222.82 230.21 69.08 139.64 11.25 Eletricity 41.55 51.90 10.70 3.19 1.02 Housing 289.79 209.83 142.64 186.26 5.45 Banks and Financial Services 2.65 5.66 0.48 3.09 0.05 Agricultural Consumables 78.32 103.94 49.26 54.49 20.91 Timber and Furniture 171.92 174.78 77.06 108.62 14.26 Metalw orking and Steel 303.64 412.33 87.93 203.11 39.71 Pulp and Paper 81.02 99.29 40.17 63.38 2.71 Oil and Gas 3,762.69 192.43 73.69 95.85 6.53 Chemicals 137.46 159.72 68.37 100.07 6.44 Services 617.42 607.37 231.03 373.69 35.49 Telecommunication 29.24 51.97 10.31 24.04 6.17 Textile and Garments 271.36 325.95 117.56 213.91 26.13 Transport 397.01 243.83 144.93 181.69 98.62 Total 8,439.75 4,564.77 1,902.00 3,104.93 454.41
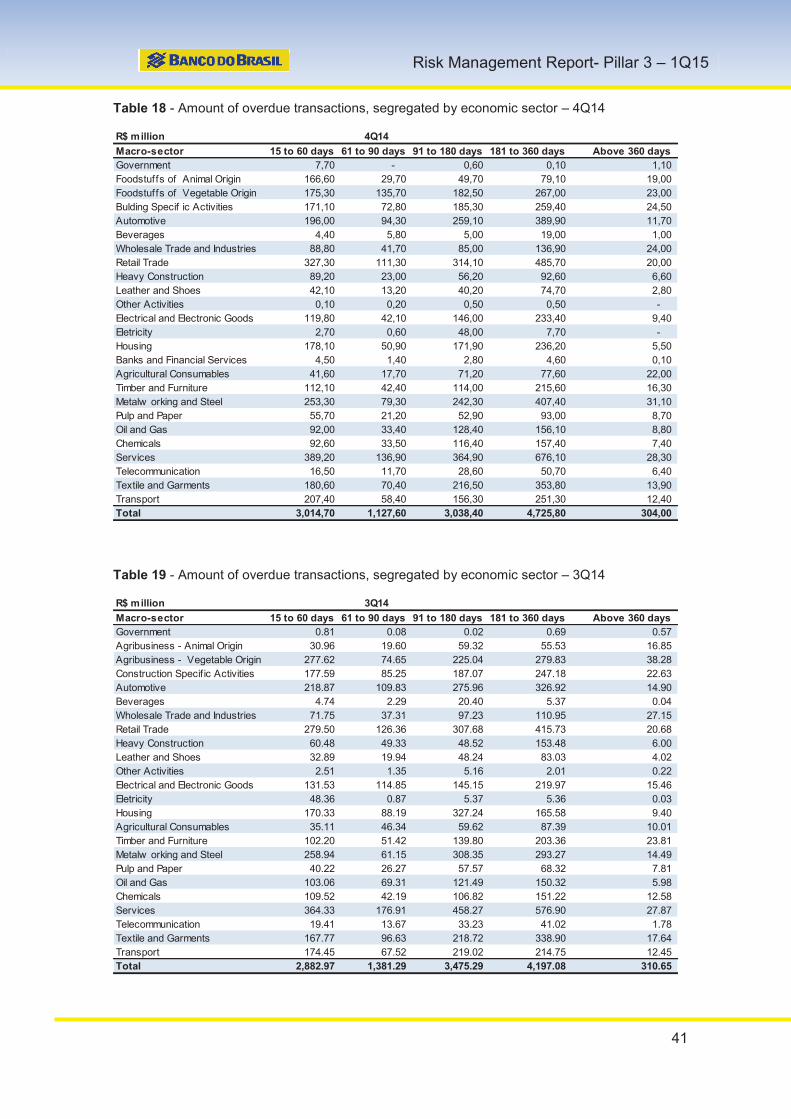
41
Risk Management Report- Pillar 3 – 1Q15
Table 18 - Amount of overdue transactions, segregated by economic sector – 4Q14
Table 19 - Amount of overdue transactions, segregated by economic sector – 3Q14
R$ million 4Q14
Macro-sector 15 to 60 days 61 to 90 days 91 to 180 days 181 to 360 days Above 360 days
Government 7,70 - 0,60 0,10 1,10 Foodstuffs of Animal Origin 166,60 29,70 49,70 79,10 19,00 Foodstuffs of Vegetable Origin 175,30 135,70 182,50 267,00 23,00 Bulding Specif ic Activities 171,10 72,80 185,30 259,40 24,50 Automotive 196,00 94,30 259,10 389,90 11,70 Beverages 4,40 5,80 5,00 19,00 1,00 Wholesale Trade and Industries 88,80 41,70 85,00 136,90 24,00 Retail Trade 327,30 111,30 314,10 485,70 20,00 Heavy Construction 89,20 23,00 56,20 92,60 6,60 Leather and Shoes 42,10 13,20 40,20 74,70 2,80 Other Activities 0,10 0,20 0,50 0,50 - Electrical and Electronic Goods 119,80 42,10 146,00 233,40 9,40 Eletricity 2,70 0,60 48,00 7,70 - Housing 178,10 50,90 171,90 236,20 5,50 Banks and Financial Services 4,50 1,40 2,80 4,60 0,10 Agricultural Consumables 41,60 17,70 71,20 77,60 22,00 Timber and Furniture 112,10 42,40 114,00 215,60 16,30 Metalw orking and Steel 253,30 79,30 242,30 407,40 31,10 Pulp and Paper 55,70 21,20 52,90 93,00 8,70 Oil and Gas 92,00 33,40 128,40 156,10 8,80 Chemicals 92,60 33,50 116,40 157,40 7,40 Services 389,20 136,90 364,90 676,10 28,30 Telecommunication 16,50 11,70 28,60 50,70 6,40 Textile and Garments 180,60 70,40 216,50 353,80 13,90 Transport 207,40 58,40 156,30 251,30 12,40 Total 3,014,70 1,127,60 3,038,40 4,725,80 304,00
R$ million 3Q14
Macro-sector 15 to 60 days 61 to 90 days 91 to 180 days 181 to 360 days Above 360 days
Government 0.81 0.08 0.02 0.69 0.57 Agribusiness - Animal Origin 30.96 19.60 59.32 55.53 16.85 Agribusiness - Vegetable Origin 277.62 74.65 225.04 279.83 38.28 Construction Specif ic Activities 177.59 85.25 187.07 247.18 22.63 Automotive 218.87 109.83 275.96 326.92 14.90 Beverages 4.74 2.29 20.40 5.37 0.04 Wholesale Trade and Industries 71.75 37.31 97.23 110.95 27.15 Retail Trade 279.50 126.36 307.68 415.73 20.68 Heavy Construction 60.48 49.33 48.52 153.48 6.00 Leather and Shoes 32.89 19.94 48.24 83.03 4.02 Other Activities 2.51 1.35 5.16 2.01 0.22 Electrical and Electronic Goods 131.53 114.85 145.15 219.97 15.46 Eletricity 48.36 0.87 5.37 5.36 0.03 Housing 170.33 88.19 327.24 165.58 9.40 Agricultural Consumables 35.11 46.34 59.62 87.39 10.01 Timber and Furniture 102.20 51.42 139.80 203.36 23.81 Metalw orking and Steel 258.94 61.15 308.35 293.27 14.49 Pulp and Paper 40.22 26.27 57.57 68.32 7.81 Oil and Gas 103.06 69.31 121.49 150.32 5.98 Chemicals 109.52 42.19 106.82 151.22 12.58 Services 364.33 176.91 458.27 576.90 27.87 Telecommunication 19.41 13.67 33.23 41.02 1.78 Textile and Garments 167.77 96.63 218.72 338.90 17.64 Transport 174.45 67.52 219.02 214.75 12.45 Total 2,882.97 1,381.29 3,475.29 4,197.08 310.65

42
Risk Management Report- Pillar 3 – 1Q15
The following table shows the flow of write-off transactions, segmented by economic sector:
Table 20 – Write-off transactions by economic sector.
The table below shows the amount of allowances for loan and lease losses, segmented by economic sector and its quarterly variations:
R$ Millions 1Q15 4Q14 3Q14
Economic Sector (Write-off)
Government 0.6 0.22 0.02
Agribusiness - Animal Origin 26.51 22.31 30.29
Agribusiness - Vegetable Origin 236.95 175.78 87.03
Construction Specif ic Activities 176.29 101.88 101.67
Automotive 182.31 146.68 131.95
Beverages 1.08 4.47 6.88
Wholesale Trade and Industries 72.34 53.43 44.70
Retail Trade 232.94 139.71 134.01
Other Activities 7.37 5.50 23.16
Heavy Constructions 76.35 91.21 128.22
Leather and Shoes 38.16 47.33 21.82
Electrical and Electronic Goods 122.01 97.13 83.28
Eletricity 1.96 1.57 0.72
Housing 143.1 69.73 101.86
Agricultural Consumables 37.25 39.19 43.48
Timber and Furniture 125.27 104.85 58.55
Metalw orking and Steel 183.99 114.04 133.87
Pulp and Paper 43.89 31.12 49.25
Oil and Gas 76.49 80.42 62.88
Chemicals 93.34 74.13 57.28
Services 342.75 234.16 217.95
Telecomunication 23.03 13.41 12.24
Textile and Garments 191.94 143.87 152.40
Transport 119.14 89.52 89.57
Total 2555.06 1,881.68 1,773.08
Others
Individuals 1538.07 1,467.92 1,480.96
Total 4093.13 3,349.59 3,254.04

43
Risk Management Report- Pillar 3 – 1Q15
Table 21 - Total allowances for loan and lease losses in the quarter and variations
The behavior of credit risk exposure is presented below, considering settings of Bacen Circular 3,644/13, segmented by Risk-Weighting Factor (FPR), along with the average exposure of the quarters.
Table 22 - Credit risk exposure by FPR
R$ million
Macro-sector over 4Q14 1Q15 4Q14 3Q14 2T14
Government (0.43) 5.60 6.03 4.34 4.09 Agribusiness - Animal Origin 37.15 330.10 292.95 281.24 247.56 Agribusiness - Vegetable Origin 52.89 1,544.68 1,491.79 1,408.85 1,206.84 Construction Specif ic Activities (10.02) 620.59 630.61 573.87 491.61 Automotive 26.56 797.18 770.62 696.13 628.27 Beverages 6.94 44.19 37.25 28.90 32.59 Wholesale Trade and Industries 28.58 379.90 351.32 295.44 267.96 Retail Trade 7.79 910.55 902.76 778.98 679.22 Heavy Construction 129.05 530.02 400.97 334.90 432.08 Leather and Shoes 2.96 141.17 138.21 142.85 128.51 Other Activities 277.98 279.59 1.61 0.67 0.93 Electrical and Electronic Goods (15.27) 488.14 503.41 488.25 453.19 Eletricity 41.20 199.10 157.90 128.52 123.23 Housing 82.91 725.97 643.06 608.62 447.44
Banks and Financial Services 26.66 265.95 239.29 243.26 238.22 Agricultural Consumables 42.70 303.63 260.93 205.09 235.23 Timber and Furniture (16.78) 377.39 394.17 404.67 329.93 Metalw orking and Steel (31.32) 909.85 941.17 781.81 704.45 Pulp and Paper 5.35 206.73 201.38 172.01 168.15 Oil and Gas 60.72 482.26 421.54 377.76 306.86 Chemicals 23.95 345.91 321.96 321.27 436.65 Services 49.75 1,285.70 1,235.95 1,161.81 1,045.94 Telecommunication 9.64 109.71 100.07 83.99 62.26 Textile and Garments 16.17 705.27 689.10 651.36 627.03 Transport 119.66 764.16 644.50 585.47 517.35 TOTAL 974.82 12,753.34 11,778.52 10,566.42 9,815.60
R$ thousand
Exposure by Risk Factor 1Q15(3) 4Q14 3Q14 2Q14 1Q14
0% 318,574 291,704 428,562 401,555 548,414
20% 782,019 682,264 711,291 753,081 1,395,065
35% 25,573,560 24,127,350 21,906,012 19,838,582 17,135,911
50% 13,451,805 11,405,370 10,749,561 6,953,595 4,679,237
75% 265,931,221 265,719,692 259,537,233 163,979,017 163,661,922
85% 210,216,529 200,625,913 191,385,452 170,576,198 187,442,559
100% 147,341,130 143,611,142 139,372,312 208,886,832 186,292,760
150%(2) - - - 39,486,931 35,904,682
300%(2) - - - 6,043,228 5,655,366
Total(1) 663,614,840 624,090,424 624,090,424 616,919,019 602,715,916
Average Exposure in the Quarter (1) 652,610,580 636,882,557 618,049,055 610,841,197 599,097,288
(3) According to CM N Resolution 4,193/2013, since 01.01.2015 the calculation of RWA applies to institutions of the prudential conglomerate.
(1) Includes loans, leasing, commitments after applying the conversion factor, credits to release and guarantees rendered.
(2) Risk weighted factor extinct for loans to individuals since Aug/14, according to BACEN Circular 3,714/2014.

44
Risk Management Report- Pillar 3 – 1Q15
6.1.10 Acquisition, Sale or Transfer of Financial Assets
It is BB’s policy to assign credits from non-performing retail loans, recorded in losses and for which the bank has full risk, after all collection procedures defined in the collections and credit-recovery process have been exhausted, and the selected transactions have reached the savings point, that is, the cost-benefit ratio does not justify keeping the transactions under collections at the commercial bank. Credit assignment is also used punctually to dispose of specific credits, when such an operation is considered a viable alternative for its recovery, even if partial. Below, we show the flow of operations assigned with substantial transfer of risks and benefits. Table 23 - Loss operations assigned, with substantial transfer of risks and benefits
BB has no exposure in the following categories:
a) exposures assigned with no substantial transfer or retention of risks and benefits;
b) exposures assigned with substantial retention of risks and benefits; and c) exposures assigned in the last 12 months with substantial retention of risks
and benefits, which were written off as losses. Below, the value of the portfolio granted with co-obligation is presented, recorded in the off balance sheet, not in the assets. Table 24 - Value of the portfolio granted with co-obligation, recorded in the off balance sheet
6.1.11 Securities (TVM) operations derived from securitization processes
The securities acquired by BB are classified in the following categories: a) category I - securities for trading - securities acquired with the intent of
actively and frequently trading must be registered here; b) category II - securities available for sale - securities that do not fall under
categories I or III must be registered here; and c) category III - securities held to maturity – securities, except non-redeemable
shares, which the institution has the intent and financial capacity to keep in its portfolio until maturity must be registered here.
R$ Thousands 1Q15 4Q14 3Q14 2Q14 1Q14
Operation Quantity (in thousands) - 1,173 - - 1,613
Value - 3,484,849 - - 4,925,119
Observation: The data refers to credit assigments ceded to Átivos S.A. Write-off Portfolio Values
R$ thousands 1Q15
Risk Retention in Loan operations - Operations w ritten off 6,034
Table 22. Value of the porfolio granted with co-obligation, recorded in

45
Risk Management Report- Pillar 3 – 1Q15
As follows, the exposures due to TVM operations derived from securitization processes are shown:
a) types of securities: · Receivables Investment Funds (FIDC) = resource pool that allots most of
its net assets to be applied in receivables. These are the rights and securities representing rights arising from operations carried out in the financial, commercial, industrial and real-estate, mortgage, financial leasing, and service-provision sectors, as well as other financial assets and investment modes admitted under the terms of CVM Instructions Nos. 356/2001 and 444/2006; and
· Real Estate Receivables Certificates (CRI) = these are fixed-income securities backed by real estate credits – counter installments flows of payments to purchase real estate properties or rent - issued by securitization companies.
b) type of credit backing the issue: · FIDC = vehicles financing, company cash flow receivables, debentures,
promissory notes, bank credit certificates, bank credit bill certificates, real estate credit certificates, real estate letters of credit, export and other credit rights credit bills; and
· CRI = real estate loans. c) type of security: · FIDC and CRI = senior quota.
Table 25 - Value of the exposures derived from acquiring FIDC and CRI
6.1.12 Exposure to counterparty credit risks
Banco do Brasil admits assuming counterparty credit risks with clients who have been previously analyzed by the risk calculation methodology, with a credit limit applicable to their profile established, subject to the existence of a sufficient operational margin to cover such operations. In this way, the counterparty credit risk exposures fall in line with other exposures in the customer’s loans on the credit limit assigned to it. These types of operations affect the client’s credit risk according to the estimated value of the counterparty credit risk exposure in the event of a default, applicable credit risk mitigators being taken into consideration, such as the adjacent asset issuer risk, the volatility of the asset, deposited collaterals, the percentage subtracted from the assets used as collateral (haircut), and the rules for additional collateral margin calls, according to the characteristics of the operation performed.
R$ thousand 2Q14 1Q14
FIDC 8 1,693,511 7 1,627,714 7 1,632,210 7 1,628,213 6 1,520,527CRI - category II 11 483,505 11 486,491 10 491 11 500,450 11 539 CRI - category III 3 130,560 3 152,076 3 160 3 149 3 185
TOTAL 22 2,307,577 21 2,266,281 20 2,283,499 21 2,277,501 20 2,244,004
Note: Information includes BB branches in Brazil and abroad (BB-Multiple Bank).
3Q141Q15 4Q14

46
Risk Management Report- Pillar 3 – 1Q15
In operations conducted via Clearing Houses (Clearings), there is a risk transfer, where the value of the operations is reflected in the credit limit of the Clearing House. The approval of operations depends, at least, on the requirement for the collaterals that were indicated in the order of the credit limit and of the ones defined as mandatory by the credit line, considering that the level of demand for collaterals varies according to the client’s credit risk. In collateralization, preference is given:
a) to assets acquired, produced, or processed with the credit; b) to collaterals that offer self-liquidity to the operation; c) to goods that are easily commercialized and non-perishable; d) to goods of the same type, kind and category as the ones to be acquired or
to be held with the credit; and e) to goods that will produce income to pay for the operation.
In order to link goods as a collateral, it is assessed through a technical evaluation or through an opinion of value, whose period of validity is up to twelve months. In the case of personal collateral, the economic-financial situation of guarantors or sureties is analyzed, in addition to direct and indirect liabilities at the Bank, with debts to third parties being considered, especially those related to tax, social security, and labor debts. When accepting a good or right as collateral, the maximum value considered is obtained by applying a percentage on the value of the goods or right, according to the type and kind of goods. In the case of trade bills and checks in custody, the maximum value is obtained by applying the percentage of the advance corresponding to the Annual Liquidity Ratio (ILA) of the client’s portfolio on the value bound as collateral. Goods received as a collateral for loans must be backed until the operation is concluded, or, in the case of funds given as collateral, remain blocked until the operation is concluded. Collaterals linked to loans are registered on a corporate basis, which allows automated control of the linked goods and rights, and the generation of administrative information, such as the collateral sufficiency analysis, and the adequacy analysis. For operations subject to counterparty credit risk, Banco do Brasil follows Bacen Circular 3,068/01, considering such a risk as a parameter when adjusting the market value of such exposures, which affects the profit/loss of the period, or in separated account of the Stockholder’s Equity, subject to the exposure’s classification. Below is the notional value of contracts subject to counterparty credit risk to be liquidated in clearing house liquidation systems, in which clearing houses acts as central counterparty.

47
Risk Management Report- Pillar 3 – 1Q15
Table 26 - Notional value of contracts to be liquidated in clearing house liquidation systems, in which the clearing house acts as central counterparty
In the next table, the notional value of the contracts subject to the counterparty credit risk, in which there’s no work of the clearing houses as central counterparty is shown, segmented in uncollateralized agreements and collateralized agreements
Table 27 - Notional value of contracts subject to counterparty credit risk in which clearing houses do not act as central counterparty, Segmented in uncollateralized agreements and collateralized agreements.
The following table shows the positive gross value of contracts subject to counterparty credit risk, including derivatives, outstanding operations, asset loans and repo transactions, disregarding the positive values from compensation agreements, as set forth in CMN Resolution 3,263/05. Table 28 - Positive gross value of the respective contracts, including derivatives, loans to settle, assets loans and repurchase agreements, disregarded the positive values related to compensation agreements defined in CMN Resolution 3,263/05.
Next, the positive gross collateral received in operations subject to credit risk that cumulatively attends the following requirements, as art.9, section VII, of the Central Bank Circular 3,678/13:
a) be kept or held in custody by the institution itself; b) whose exclusive purpose is to guarantee operations to which they are
linked; c) are subject to movement, exclusively, by order from the depositary
institution; and
R$ thousand
Stock Market Negotiation Counterparty 1Q15 4Q14 3Q14 2Q14 1Q14
Futures Contracts 22,213,959 14,885,592 16,188,412 15,041,532 18,047,792
Purchase commitments B 22,213,959 14,885,592 16,188,412 15,041,532 18,047,792 Options Market 26,966,394 24,583,462 22,456,140 6,331,737 9,221,096
Short Position B 26,966,394 24,583,462 22,456,140 6,331,737 9,221,096
Note: Counterpart = (B) Stock Market
R$ Thousand
Without guarantees 1Q15 4Q14 3Q14 2Q14 1Q14
Forw ard operations (C) and (IF) 10,452,838 10,175,507 6,415,977 6,474,151 11,043,960 "Sw aps" contracts (C) 4,965,180 4,871,047 4,112,682 7,245,134 6,157,882 Other derivative financial instruments 2,127,563 3,739,804 2,039,204 1,571,374 5,016,856 Currency arbitrage (future and prompt settlement) 795,384 1,995,017 197,452 2,195,682 211,575 Inter-bank exchange (future and prompt settlement) - - 1,537,779 192,318 2,251,909 With guarantees 1Q15 4Q14 3Q14 2Q14 1Q14
"Sw aps" contracts (IF) 13,139,259 12,644,330 11,109,988 10,197,816 11,888,051 Inter-bank exchange (future and prompt settlement) 10,434 134,663 77,808 237,082 325,885 Reverse Repo 308,343,131 262,986,803 277,801,724 254,491,820 247,802,314 Repo 319,355,665 291,156,035 304,784,198 279,120,064 269,038,522
Note: Counterpart = (C) Client and (IF) Financial Institution.
R$ Thousand
1Q15 4Q14 3Q14 2Q14 1Q14
Total Gross Positive Value 2,729,977 2,459,855 1,785,758 1,769,856 1,434,942
Derivative Financial Instruments 2,683,121 1,493,161 1,016,301 772,721 1,110,623 Currency arbitrage (future and prompt settlement) 13,170 - 98 6,493 90 Inter-bank exchange (future and prompt settlement) - - 22 381 550 Reverse Repo 23,341 6 9,119 2,057 466 Repo 10,345 3,036,607 1,434,315 1,004,105 658,127
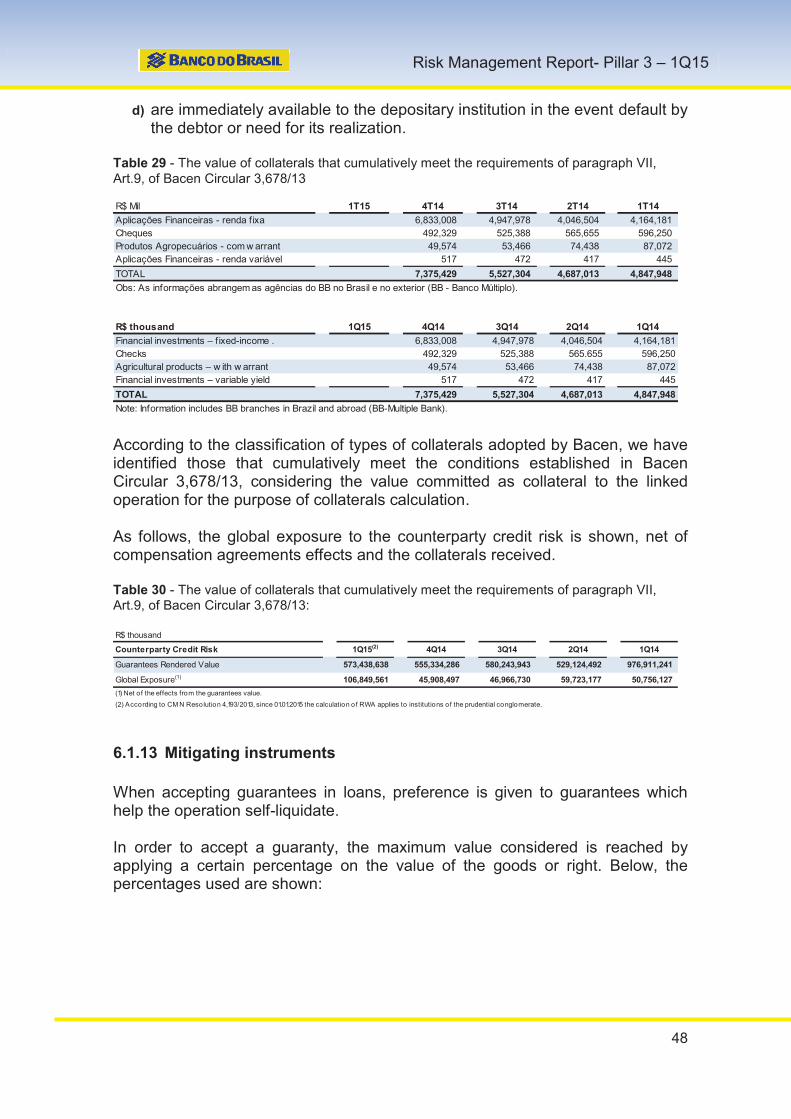
48
Risk Management Report- Pillar 3 – 1Q15
d) are immediately available to the depositary institution in the event default by the debtor or need for its realization.
Table 29 - The value of collaterals that cumulatively meet the requirements of paragraph VII, Art.9, of Bacen Circular 3,678/13
According to the classification of types of collaterals adopted by Bacen, we have identified those that cumulatively meet the conditions established in Bacen Circular 3,678/13, considering the value committed as collateral to the linked operation for the purpose of collaterals calculation. As follows, the global exposure to the counterparty credit risk is shown, net of compensation agreements effects and the collaterals received. Table 30 - The value of collaterals that cumulatively meet the requirements of paragraph VII, Art.9, of Bacen Circular 3,678/13:
6.1.13 Mitigating instruments
When accepting guarantees in loans, preference is given to guarantees which help the operation self-liquidate. In order to accept a guaranty, the maximum value considered is reached by applying a certain percentage on the value of the goods or right. Below, the percentages used are shown:
R$ Mil 1T15 4T14 3T14 2T14 1T14
Aplicações Financeiras - renda fixa 6,833,008 4,947,978 4,046,504 4,164,181 Cheques 492,329 525,388 565,655 596,250 Produtos Agropecuários - com w arrant 49,574 53,466 74,438 87,072 Aplicações Financeiras - renda variável 517 472 417 445
TOTAL 7,375,429 5,527,304 4,687,013 4,847,948
Obs: As informações abrangem as agências do BB no Brasil e no exterior (BB - Banco Múltiplo).
R$ thousand 1Q15 4Q14 3Q14 2Q14 1Q14
Financial investments – f ixed-income . 6,833,008 4,947,978 4,046,504 4,164,181Checks 492,329 525,388 565.655 596,250Agricultural products – w ith w arrant 49,574 53,466 74,438 87,072Financial investments – variable yield 517 472 417 445
TOTAL 7,375,429 5,527,304 4,687,013 4,847,948
Note: Information includes BB branches in Brazil and abroad (BB-Multiple Bank).
R$ thousand
Counterparty Credit Risk 1Q15(2) 4Q14 3Q14 2Q14 1Q14
Guarantees Rendered Value 573,438,638 555,334,286 580,243,943 529,124,492 976,911,241
Global Exposure(1) 106,849,561 45,908,497 46,966,730 59,723,177 50,756,127
(1) Net of the effects from the guarantees value.
(2) According to CM N Resolution 4,193/2013, since 01.01.2015 the calculation of RWA applies to institutions of the prudential conglomerate.

49
Risk Management Report- Pillar 3 – 1Q15
Table 31 - Collateral coverage.
The credit rights guarantees represented by financial investments must be internalized at the Bank and are blocked by the institution. This blockage must remain until the operation is concluded. When the financial investment matures, the Bank may, at its discretion, use it to liquidate the balance of remaining installments, with no notice or notification to the assignor/borrower. Besides credit assignment or credit rights assignment clauses, the credit instrument, for linked mitigators, the credit instrument has a guarantee reinforcement clause to ensure, for the duration of the operation, the coverage percentage agreed on when it was contracted. The fund guarantees, such as the Guarantee Fund for Generation of Employment and Earnings (Funproger), Operations Guarantee Fund (FGO), Investments Guarantee Fund (FGI) and the Endorsement for Micro and Small Enterprises Fund (Fampe) are used as collaterals by Banco do Brasil, mitigating the risks of operations. Overall, the fund guarantees have the following characteristics:
a) maximum coverage percentage limits when using the fund to back operations, according to the type of operation: Investment or Working Capital;
b) target market, according to the billing or the client’s risk; c) whether or not a counter guarantee was given;
Asset Coverage (%)Credit rights - Receipt for bank deposit 100% - Certif icate of bank deposit (1) 100% - Saving deposits 100% - Fixed income investiment founds 100%PledgeAgreement – cash collateral (2) 100% - Standby letter od credit 100% - Others 80%Guerantee Funds - Guarantee Fund for Generation of Employment and Income (Funproger) 100% - Guarantee Fund for Micro and Small Business (Fampe) 100% - Guarantee Fund for Operations (FGO) 100% - Guarantee Fund for Investments (FGI) 100% - Others 100%Guarantee(3) 100%Credit insurance 100%PledgeAgreement – securities (4) 77%Offshore Funds - BB Fund(5) 77%Livestock(6) 70%PledgeAgreement - cashcollateral (7) 70%Others (8)
(7) Celebrated in a dif ferent currency of the operat ions supported and wich have no hedding mechanism.
(8) According to certain characterist ics, real state, vehicle, machinery and equipment can be received with highest percentage of guarantee.
(1)Except the ones possessing swap agreement
(2) In the same currency of the operat ion.
(3) Provided by a banking inst itut ion taht has a credit limit at the bank, with suff icient margin to suport the co-obligat ion.
(4) Contract of deposit / Transfer of Customer funds
(5) Exclusive or retail.
(6) Excpet in Rural Product Notes Transactions (CPR).
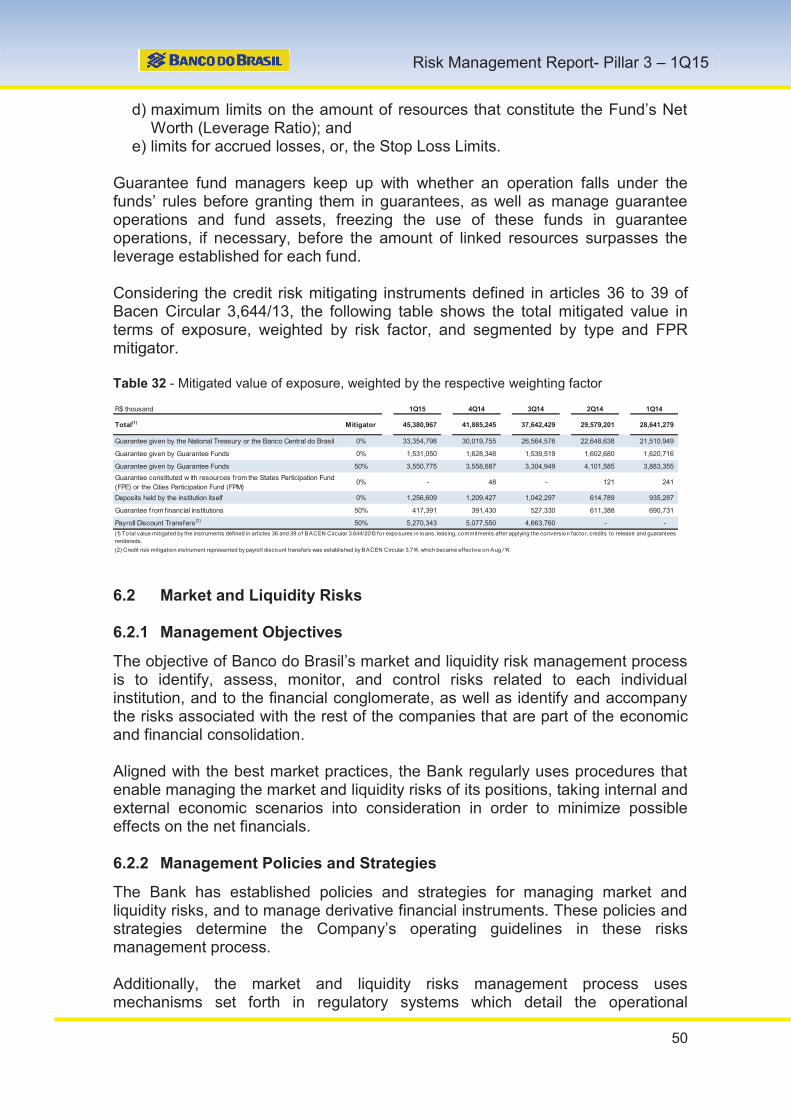
50
Risk Management Report- Pillar 3 – 1Q15
d) maximum limits on the amount of resources that constitute the Fund’s Net Worth (Leverage Ratio); and
e) limits for accrued losses, or, the Stop Loss Limits. Guarantee fund managers keep up with whether an operation falls under the funds’ rules before granting them in guarantees, as well as manage guarantee operations and fund assets, freezing the use of these funds in guarantee operations, if necessary, before the amount of linked resources surpasses the leverage established for each fund. Considering the credit risk mitigating instruments defined in articles 36 to 39 of Bacen Circular 3,644/13, the following table shows the total mitigated value in terms of exposure, weighted by risk factor, and segmented by type and FPR mitigator. Table 32 - Mitigated value of exposure, weighted by the respective weighting factor
6.2 Market and Liquidity Risks
6.2.1 Management Objectives
The objective of Banco do Brasil’s market and liquidity risk management process is to identify, assess, monitor, and control risks related to each individual institution, and to the financial conglomerate, as well as identify and accompany the risks associated with the rest of the companies that are part of the economic and financial consolidation. Aligned with the best market practices, the Bank regularly uses procedures that enable managing the market and liquidity risks of its positions, taking internal and external economic scenarios into consideration in order to minimize possible effects on the net financials. 6.2.2 Management Policies and Strategies
The Bank has established policies and strategies for managing market and liquidity risks, and to manage derivative financial instruments. These policies and strategies determine the Company’s operating guidelines in these risks management process. Additionally, the market and liquidity risks management process uses mechanisms set forth in regulatory systems which detail the operational
R$ thousand 1Q15 4Q14 3Q14 2Q14 1Q14
Total(1) Mitigator 45,380,967 41,885,245 37,642,429 29,579,201 28,641,279
Guarantee given by the National Treasury or the Banco Central do Brasil 0% 33,354,798 30,019,755 26,564,576 22,648,638 21,510,949
Guarantee given by Guarantee Funds 0% 1,531,050 1,628,348 1,539,519 1,602,680 1,620,716
Guarantee given by Guarantee Funds 50% 3,550,775 3,558,687 3,304,949 4,101,585 3,883,355
Guarantee constituted w ith resources from the States Participation Fund (FPE) or the Cities Participation Fund (FPM)
0% - 48 - 121 241
Deposits held by the institution itself 0% 1,256,609 1,209,427 1,042,297 614,789 935,287
Guarantee from financial institutions 50% 417,391 391,430 527,330 611,388 690,731
Payroll Discount Transfers(2) 50% 5,270,343 5,077,550 4,663,760 - -
(1) Total value mitigated by the instruments defined in articles 36 and 39 of BACEN Circular 3.644/2013 for exposures in loans, leasing, commitments after applying the conversion factor, credits to release and guaranteesrendereds.
(2) Credit risk mitigation instrument represented by payro ll discount transfers was established by BACEN Circular 3,714, which became effective on Aug /14.

51
Risk Management Report- Pillar 3 – 1Q15
procedures that are necessary to implement the organizational decisions concerning the Company’s business and activities and to meet legal, as well as regulatory and oversight bodies’ requirements. Finally, it is relevant to mention that, for the market and liquidity risks management, systems are used to guarantee that positions registered in negotiable and non-negotiable portfolios are measured, monitored, and controlled, as are operations aimed at meeting the hedge objectives established.
At the Bank, the derivative financial instruments are used for hedging own positions, meeting the clients` needs and for intentional positions making, considering limits, competence and procedures that were previously established. The tables below represent the total exposure to derivative financial instruments by category of market risk factor, segmented into positions bought and sold in the following way:
I. Derivative financial instrument transactions carried out with a central counterpart, subdivided into those in Brazil and those abroad; and
II. Derivative financial instrument transactions carried out without a central counterpart, subdivided into those in Brazil and those abroad.
Table 33 - Derivative financial instruments in the country and abroad, by market risk factor, with and without a central counterpart – 1Q15
1Q15-R$ thousand
Risk Factor Brazil Abroad Consolidated-BB
Reference
valueCost value
Market
value
Reference
valueCost value
Market
value
Reference
valueCost value Market value
Long position 76,127,357 3,509,888 3,617,359 3,737,836 109,042 160,694 79,865,193 3,618,930 3,778,053
Interest rates Stock market 37,500,498 7,769 -- -- -- -- 37,500,498 7,769 -- Counter 10,410,088 406,220 438,394 -- -- -- 10,410,088 406,220 438,394
Exchange rates Stock market 11,571,856 202,467 301,586 -- -- -- 11,571,856 202,467 301,586 Counter 16,484,483 2,881,788 2,863,966 3,737,836 109,042 160,694 20,222,319 2,990,830 3,024,660
Share price Stock market 92,200 3,634 3,164 -- -- -- 92,200 3,634 3,164 Counter -- -- -- -- -- -- -- -- --
Commodities price Stock market 15,799 -- -- -- -- -- 15,799 -- -- Counter 52,433 8,010 10,249 -- -- -- 52,433 8,010 10,249
Short position 86,566,790 (4,332,824) (4,403,589) 12,263,408 (980,773) (1,212,960) 98,830,198 (5,313,597) (5,616,549)
Interest rates Stock market 58,681,564 (1,320,630) (1,398,732) 865,859 -- -- 59,547,423 (1,320,630) (1,398,732) Counter 3,599,582 (534,596) (527,239) 22,610 -- -- 3,622,192 (534,596) (527,239)
Exchange rates Stock market 11,189,796 (243,315) (580,266) -- -- -- 11,189,796 (243,315) (580,266) Counter 12,686,121 (2,214,286) (1,878,898) 11,374,939 (980,773) (1,212,960) 24,061,060 (3,195,059) (3,091,858)
Share price Stock market 158,144 (2,830) (2,046) -- -- -- 158,144 (2,830) (2,046) Counter -- -- -- -- -- -- -- -- --
Commodities price Stock market 198,522 (3,526) (3,966) -- -- -- 198,522 (3,526) (3,966) Counter 53,061 (13,641) (12,442) -- -- -- 53,061 (13,641) (12,442)
Net position (10,439,433) 7,842,712 8,020,948 (8,525,572) 1,089,815 1,373,654 (18,965,005) 8,932,527 9,394,602
Negotiation
location

52
Risk Management Report- Pillar 3 – 1Q15
Table 34 - Derivative financial instruments in the country and abroad, by market risk factor, with and without a central counterpart – 4Q14
Table 35 - Derivative financial instruments in the country and abroad, by market risk factor, with and without a central counterpart – 3Q14
Table 36 - Derivative financial instruments in the country and abroad, by market risk factor, with and without a central counterpart – 2Q14
4Q14-R$ thousand
Risk Factor Brazil Abroad Consolidated-BB
Reference
valueCost value
Market
value
Reference
valueCost value
Market
value
Reference
valueCost value Market value
Long position 67,229,115 1,909,062 2,116,407 3,670,627 65,687 96,649 70,899,742 1,974,749 2,213,056
Interest rates Stock market 30,784,848 7,769 -- -- -- -- 30,784,848 7,769 -- Counter 9,961,848 293,469 401,076 -- -- -- 9,961,848 293,469 401,076
Exchange rates Stock market 8,418,618 132,529 120,051 -- -- -- 8,418,618 132,529 120,051 Counter 17,741,899 1,460,039 1,566,530 3,670,627 65,687 96,649 21,412,526 1,525,726 1,663,179
Share price Stock market 259,500 9,942 12,253 -- -- -- 259,500 9,942 12,253 Counter -- -- -- -- -- -- -- -- --
Commodities price Stock market 6,088 -- -- -- -- -- 6,088 -- -- Counter 56,314 5,314 16,497 -- -- -- 56,314 5,314 16,497
Short position 78,391,964 (2,789,580) (2,707,014) 10,971,458 (577,070) (730,908) 89,363,422 (3,366,650) (3,437,922)
Interest rates Stock market 56,227,092 (1,498,295) (1,405,061) 712,179 -- -- 56,939,271 (1,498,295) (1,405,061) Counter 3,896,271 (422,179) (473,000) 53,049 -- -- 3,949,320 (422,179) (473,000)
Exchange rates Stock market 6,669,482 (210,401) (297,794) -- -- -- 6,669,482 (210,401) (297,794) Counter 10,918,120 (643,306) (521,854) 10,206,230 (577,070) (730,908) 21,124,350 (1,220,376) (1,252,762)
Share price Stock market 366,350 (7,058) (4,920) -- -- -- 366,350 (7,058) (4,920) Counter -- -- -- -- -- -- -- -- --
Commodities price Stock market 291,342 (4,386) (2,165) -- -- -- 291,342 (4,386) (2,165) Counter 23,307 (3,955) (2,220) -- -- -- 23,307 (3,955) (2,220)
Net position (11,162,849) 4,698,642 4,823,421 (7,300,831) 642,757 827,557 (18,463,680) 5,341,399 5,650,978
Negotiation
location
3Q14-R$ thousand
Risk Factor Brazil Abroad Consolidated-BB
Reference
valueCost value
Market
value
Reference
valueCost value
Market
value
Reference
valueCost value Market value
Long position 59,465,595 1,367,083 1,655,081 2,856,808 55,107 65,564 62,322,403 1,422,190 1,720,645
Interest rates Stock market 27,878,232 6,865 2,498 -- -- -- 27,878,232 6,865 2,498 Counter 5,922,935 325,128 402,450 -- -- -- 5,922,935 325,128 402,450
Exchange rates Stock market 10,353,033 147,947 199,490 -- -- -- 10,353,033 147,947 199,490 Counter 14,846,373 868,228 1,003,314 2,856,808 55,107 65,564 17,703,181 923,335 1,068,878
Share price Stock market 412,650 9,877 14,007 -- -- -- 412,650 9,877 14,007 Counter -- -- -- -- -- -- -- -- --
Commodities price Stock market 637 -- -- -- -- -- 637 -- -- Counter 51,735 9,038 33,322 -- -- -- 51,735 9,038 33,322
Short position 85,897,034 (2,418,634) (2,485,425) 9,684,144 (381,629) (428,410) 95,581,178 (2,800,263) (2,913,835)
Interest rates Stock market 57,141,328 (1,151,851) (1,185,269) 2,080,416 -- -- 59,221,744 (1,151,851) (1,185,269) Counter 8,717,745 (398,153) (480,926) 98,036 -- -- 8,815,781 (398,153) (480,926)
Exchange rates Stock market 7,892,055 (206,050) (278,480) -- -- -- 7,892,055 (206,050) (278,480) Counter 11,285,158 (643,273) (515,974) 7,505,692 (381,629) (428,410) 18,790,850 (1,024,902) (944,384)
Share price Stock market 715,175 (16,251) (20,761) -- -- -- 715,175 (16,251) (20,761) Counter -- -- -- -- -- -- -- -- --
Commodities price Stock market 125,788 (2,666) (1,422) -- -- -- 125,788 (2,666) (1,422) Counter 19,785 (390) (2,593) -- -- -- 19,785 (390) (2,593)
Net position (26,431,439) 3,785,717 4,140,506 (6,827,336) 436,736 493,974 (33,258,775) 4,222,453 4,634,480
Negotiation
location
2Q14-R$ thousand
Risk Factor Brazil Abroad Consolidated-BB
Reference
valueCost value
Market
value
Reference
valueCost value
Market
value
Reference
valueCost value Market value
Long position 41,669,984 1,114,278 1,109,226 5,191,760 144,416 186,465 46,861,744 1,258,694 1,295,691
Interest rates Stock market 12,426,158 1,554 -- -- -- -- 12,426,158 1,554 -- Counter 10,787,342 493,762 518,295 -- -- -- 10,787,342 493,762 518,295
Exchange rates Stock market 8,565,937 60,183 52,465 -- -- -- 8,565,937 60,183 52,465 Counter 9,444,997 539,961 497,746 5,191,760 144,416 186,465 14,636,757 684,377 684,211
Share price Stock market 375,250 10,055 9,756 -- -- -- 375,250 10,055 9,756 Counter -- -- -- -- -- -- -- -- --
Commodities price Stock market 5,924 -- -- -- -- -- 5,924 -- -- Counter 64,376 8,763 30,964 -- -- -- 64,376 8,763 30,964
Short position 62,609,655 (3,667,073) (3,591,035) 4,606,961 (92,310) (178,455) 67,216,616 (3,759,383) (3,769,490)
Interest rates Stock market 42,590,620 (2,422,161) (2,575,680) -- -- -- 42,590,620 (2,422,161) (2,575,680) Counter 9,454,886 (622,300) (575,620) 145,309 -- -- 9,600,195 (622,300) (575,620)
Exchange rates Stock market 4,048,300 (162,939) (153,255) -- -- -- 4,048,300 (162,939) (153,255) Counter 5,854,361 (442,292) (272,090) 4,461,652 (92,310) (178,455) 10,316,013 (534,602) (450,545)
Share price Stock market 557,493 (12,981) (12,275) -- -- -- 557,493 (12,981) (12,275) Counter -- -- -- -- -- -- -- -- --
Commodities price Stock market 91,310 (2,922) (1,303) -- -- -- 91,310 (2,922) (1,303) Counter 12,685 (1,478) (812) -- -- -- 12,685 (1,478) (812)
Net position (20,939,671) 4,781,351 4,700,261 584,799 236,726 364,920 (20,354,872) 5,018,077 5,065,181
Negotiation
location

53
Risk Management Report- Pillar 3 – 1Q15
Table 37 - Derivative financial instruments in the country and abroad, by market risk factor, with and without a central counterpart – 1Q14
6.2.3 Hedge Policies
With respect to hedging policies adopted for market and liquidity risks management, the objectives to be achieved with hedging operations on a consolidated basis are defined, assuring the individual effectiveness of each transaction, subject to the regulations of each jurisdiction. 6.2.4 Risk measuring systems and communication and information
processes
The market risk measuring process makes use of corporate systems and of the Riskwatch application, developed by the Canadian company Algorithmics, The infrastructure of information technology associated with this process is installed in environments located in Brasília (DF) and in Rio de Janeiro (RJ). The main objectives of the Riskwatch application are to:
I. consolidate management information of the Bank, ascertaining and providing information for market and liquidity risk management and for assets and liabilities management; and
II. provide market and liquidity risk measurements (products/cash flows by currency and index), as well as assets and liabilities management.
Riskwatch functions that deserve special emphasis are:
I. calculate market risk indicators, such as Value-at-Risk (parametric and nonparametric), duration, yield, and etc.;
II. elaborate cash flow reports, either consolidated or by product, marked to market or nominal;
III. determine the portfolio sensitivity to the fluctuations in national and international interest rates;
IV. calculate the theoretical result of portfolios after the application of historical and stress scenarios; and
1Q14-R$ thousand
Risk Factor Brazil Abroad Consolidated-BB
Reference
valueCost value
Market
value
Reference
valueCost value
Market
value
Reference
valueCost value Market value
Long position 54,257,817 1,406,794 1,446,900 7,243,028 145,661 158,193 61,500,845 1,552,455 1,605,093
Interest rates Stock market 21,251,690 276,176 234,487 -- -- -- 21,251,690 276,176 234,487 Counter 4,554,770 243,197 293,001 -- -- -- 4,554,770 243,197 293,001
Exchange rates Stock market 13,808,166 139,197 145,509 3,867,815 115,641 123,993 17,675,981 254,838 269,502 Counter 14,350,692 730,127 731,338 3,375,213 30,020 34,200 17,725,905 760,147 765,538
Share price Stock market 214,320 7,760 6,494 -- -- -- 214,320 7,760 6,494 Counter -- -- -- -- -- -- -- -- --
Commodities price Stock market 14,948 68 93 -- -- -- 14,948 68 93 Counter 63,231 10,269 35,978 -- -- -- 63,231 10,269 35,978
Short position 70,729,001 (3,668,528) (3,670,545) 10,489,295 (143,796) (251,790) 81,218,296 (3,812,324) (3,922,335)
Interest rates Stock market 51,159,753 (2,753,411) (2,874,516) -- -- -- 51,159,753 (2,753,411) (2,874,516) Counter 3,013,825 (176,437) (185,442) 223,950 -- -- 3,237,775 (176,437) (185,442)
Exchange rates Stock market 7,182,890 (153,304) (143,725) 3,298,024 (76,684) (179,935) 10,480,914 (229,988) (323,660) Counter 8,885,051 (571,985) (453,796) 6,967,321 (67,112) (71,855) 15,852,372 (639,097) (525,651)
Share price Stock market 314,001 (9,383) (8,447) -- -- -- 314,001 (9,383) (8,447) Counter -- -- -- -- -- -- -- -- --
Commodities price Stock market 157,173 (2,196) (452) -- -- -- 157,173 (2,196) (452) Counter 16,308 (1,812) (4,167) -- -- -- 16,308 (1,812) (4,167)
Net position (16,471,184) 5,075,322 5,117,445 (3,246,267) 289,457 409,983 (19,717,451) 5,364,779 5,527,428
Negotiation
location

54
Risk Management Report- Pillar 3 – 1Q15
V. Elaborate reports on the mismatching of maturities, rates, indexes and currencies.
In the Bank, own positions are segregated in trading portfolio and no trading portfolio. Through a resolution issued by the CSRG, a policy is stipulated for classification of transactions in the trading portfolio. That document defines that, in the sphere of Banco do Brasil, its subsidiaries and controlled companies, operations with own positions carried out with the intention of trading or to hedge the trading portfolio, for which there is the intention of trading them prior to their contractual period, observing normal market conditions, and in cases where they are not nonnegotiable, are classified in the trading portfolio. Transactions with own positions not classified in the trading portfolio are considered components of the non-trading portfolio, the own positions held by companies that are not part of the Bank are not subject to classification in the trading portfolio. For the market risk management process, the Bank makes use of a structure of management groups and books, both for the domestic area and for the international area, with specific objectives and limits of exposure to risks. Regarding the limits of exposure to market risks, the CSRG establishes the following classification criteria: Global limits: applied to the trading and banking book portfolios, to the set of transactions subject to capital requirements and to the interest rate risk in the banking book portfolio (RTJBB) and approved by CSRG, The main metrics used for management are Value-at-Risk, stress and financial volume. Specific limits: applied to the management groups and books of the trading and banking book portfolios or to both portfolios, to the market risk factors of transactions subject to capital requirements and to the market risk factors sensitive to the interest rate risk in the banking book portfolio (risk factors of RTJBB) and approved by the CERML, The main metrics used for management are Value-at-Risk and stress. Operational limits: applied to transactions that make up the management groups and books, enabling the disclosure of the effective risk level of assumed exposures and aiming to ensure compliance with the strategies and the global and specific limits established, They are defined and approved by DIRIS presenting as main metrics the Value-at-Risk and operating bands of exposure to market risks. DIRIS reports the consumption of the specific and operational limits to the managers of the groups and books of the trading and banking book portfolios daily. It reports the consumption of overall limits to the strategic committees monthly, through the market risk management report and Risks Panel.

55
Risk Management Report- Pillar 3 – 1Q15
In case limits are exceeded, DIRIS, responsible for controlling and monitoring the portfolio, issues a document called "Limit Exceeding Form". The managers of groups and books should submit their reasons for exceeding limits and specify the deadline for regularization. In turn, the hierarchical level with the authority to manage the case should issue an opinion on the manager's pronouncement. The team responsible for monitoring the limit is responsible for keeping track of the categorization actions. The communication of the Bank risks to Senior Management occurs at the monthly ordinary meetings of the strategic risk superior committees and executive committees.
6.2.5 Market Risk Management Structure
The CMN Resolution 3,464/07 states the implementation of the market risk management structure, compatible with the nature of operations, the complexity of products and the dimension of the institution's market risk exposure.
The Risk Management Board (Diris), which reports to the Office of the Vice - President for Internal Controls and Risk Management (Vicri), is responsible for managing market risks. The governance model adopted by BB is organized in a superior risk committee and executive committees structure, with the participation of several areas of the institution. All decisions related to risk management are made as a collegiate and in accordance with the guidelines and internal rules.
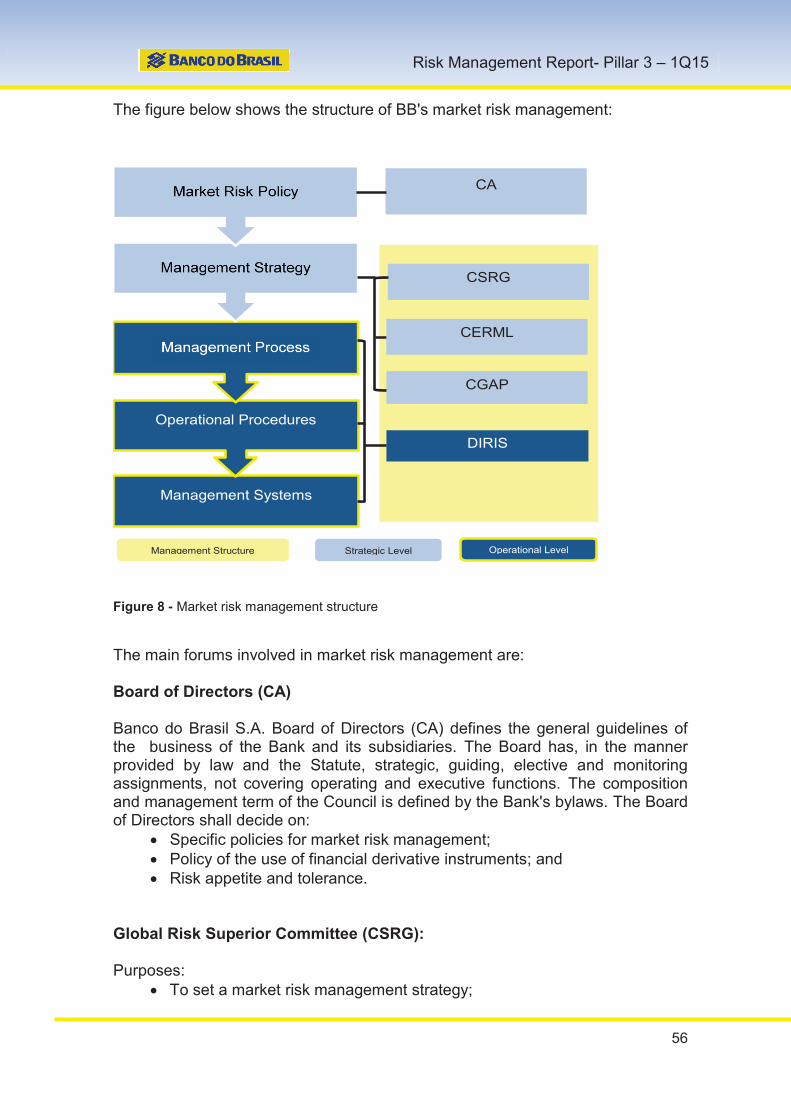
56
Risk Management Report- Pillar 3 – 1Q15
The figure below shows the structure of BB's market risk management:
Figure 8 - Market risk management structure
The main forums involved in market risk management are: Board of Directors (CA) Banco do Brasil S.A. Board of Directors (CA) defines the general guidelines of the business of the Bank and its subsidiaries. The Board has, in the manner provided by law and the Statute, strategic, guiding, elective and monitoring assignments, not covering operating and executive functions. The composition and management term of the Council is defined by the Bank's bylaws. The Board of Directors shall decide on:
· Specific policies for market risk management; · Policy of the use of financial derivative instruments; and · Risk appetite and tolerance.
Global Risk Superior Committee (CSRG): Purposes:
· To set a market risk management strategy;
Operational Procedures
Management Systems
CA
CSRG
DIRIS
Management Structure Strategic Level Operational Level
CERML
CGAP

57
Risk Management Report- Pillar 3 – 1Q15
· To determine global limits to market risk exposure; · To approve the risk factors that will make up the documents and reports
to be submitted to regulatory agencies and other institutions.
Market and Liquidity Risk Executive Committee (CERML): To approve:
· Models, methodologies, criteria and parameters for market, liquidity and actuarial risks;
· Specific limits to market and actuarial risk exposures;
· The contingency plans regarding market, liquidity and actuarial risk management;
· To assess the internal validations results and specify, whenever necessary, corrective measures for models of market, liquidity and actuarial risk management.
To analyse and propose to CSRG:
· The global limits to Market risk exposures;
· The market risk management strategy;
· To monitor the recommendations and guidelines resolved by the Committee.
Asset-Liability and Liquidity Management Superior Committee (CSGAP) Purposes:
· To set assets and liabilities management strategy;
· To set guidelines for treasury operations, subject to the overall limits set by the Global Risk Superior Committee;
· To monitor the recommendations and guidelines resolved by the Committee.
6.2.6 Market Risk Management Process
Banco do Brasil uses statistical and simulation methods to analyze the market risk of its exposures. Among the metrics used in the application of those methods, we highlight the following:
· Sensitivities; · Value at Risk (VaR); and, · Stress.
Sensitivity metrics simulate the effects in the value of exposures resulting from variations in the level of market risk factors. VaR is a metric used to estimate the potential loss under routine market conditions, dimensioned in monetary values daily, under a confidence interval and time frame.

58
Risk Management Report- Pillar 3 – 1Q15
The risk factors used in VaR metrics to measure the market risk of exposures are classified into the following categories:
· interest rates; · exchange rates; · share prices; and, · Commodity prices.
The VaR metrics performance is monthly evaluated by a backtesting process. Finally, BB uses stress metrics resulting from simulations on the behavior of its exposures subject to market risks under extreme conditions, such as financial crises and economic shocks. The objective of stress tests is to calculate the impact of events which are plausible, but very unlikely to occur, on regulatory requirements. Stress tests include exposure simulations, retrospective, based on historical series of shocks to market risk factors, and prospective, based on projections of economic and financial scenarios. The models used to measure market risk and backtesting models are subject to validation process by Dicoi, segregated from areas responsible for the development and for the use of the models. In turn, the independent validation process of models is subjected to independent evaluation, conducted by Internal Auditing (Audit). Therefore, it is seen that Banco do Brasil uses three layers of control over its market risk measurement models, which are the following:
· 1st Layer: development and use of models; · 2nd Layer: validation of models; and, · 3rd Layer: evaluation of model validation.
The process of market risk management involves continuous flow of information, according to the phases in the chapter “Risk Management Process”.
The processes and procedures of the market risk management structure are validated and performed by two internal units at different points in time, a fact that ensures the adequate separation of duties and the independence of work. The Internal Control Board (DICOI) is responsible for validating the financial conglomerate’s risk determination and measurement models and the bank’s internal control system. Internal Audit (AUDIT) periodically evaluates credit risk management processes to verify whether they are consistent with the strategic guidelines, market policy, and regulatory and internal rules.

59
Risk Management Report- Pillar 3 – 1Q15
The next figure illustrates the process of market risk management:
Figure 9 - Management Process
6.2.7 Negotiable Portfolios
In the Bank`s market risk management process, the own positions are divided into Negotiable Portfolios and Non-negotiable Portfolios. Through a Resolution issued by the Global Risk Superior Committee (CSRG), a policy for the classification of operations in the negotiable portfolio is stipulated. That document defines the Negotiable Portfolio, in Banco do Brasil, its Wholly-Owned Subsidiaries and the ones that are Financial Conglomerate Controlled, which covers all operations in own positions carried out with the intent of negotiation, or destined to the hedge of the negotiable portfolio, for which there is the intention

60
Risk Management Report- Pillar 3 – 1Q15
of being negotiated before their contractual deadline, given normal market conditions, and which are not non-negotiable. The Negotiable Portfolio is divided into groups and books, always observing the internal rules, approved by the Market and Liquidity Risk Executive Committee (CERML) and by the Global Risk Superior Committee (CSRG), which establish the objectives, the composition, the financial limits and market risk limits for each group or book. The main types of limits used for the market risk management are: Value at Risk (VaR) and stress tests. In the case of the Negotiable Book VaR limits aiming to evidence the level of the market risk that is generated by the exposures and the corresponding impact on the capital requirement for its coverage, the VaR and Stressed VaR metrics are considered. For measuring the VaR of the Negotiable Portfolio, Banco do Brasil adopts the Historical Simulation technique, and the following parameters: a) Total VaR: (VaR + Stressed VaR) x Multiplier, where:
i. VaR: the potential expected loss considering a series of 252 daily shocks (business days), a confidence level of 99% and a holding period of 10 business days (Central Bank of Brazil, Circular 3,568);
ii. Stressed VaR: the potential expected loss considering a series of daily shocks under stress scenarios within 12 month periods starting at January 2nd, 2004, a confidence level of 99% and a holding period of 10 business days (Central Bank of Brazil, Circular 3,568); and
iii. Multiplier: M, as defined by Central Bank of Brazil, Circular 3,568.
The following table shows the total value of the Negotiable Portfolio by relevant market risk factor, divided into positions purchased and positions sold:

61
Risk Management Report- Pillar 3 – 1Q15
Table 38 - Negotiable Portfolio by relevant market risk factor, divided into positions purchased and positions sold.
6.2.8 Non-negotiable Portfolios
The Financial Conglomerate own position operations not classified under the Negotiable Portfolio are considered components of the Non-negotiable Portfolio. It`s noticeable that the own positions held by the companies that are not a part of the Financial Conglomerate cannot be classified under the Negotiable Portfolio. In accordance with best market practices and the requirements of regulators, the Bank sets policies for managing market risk, including interest rate risk transactions classified in the non-negotiable portfolio. These policies are in accordance with the strategic guidelines of the institution and the general objectives of the management process and predict:
· Control of exposures by setting limits; · Portfolio management considering the best risk-return relationship and the
internal and external scenarios; · Performing operations to reduce the risks arising from changes in market
value or cash flows of the assets and liabilities; · Management of foreign exchange exposure to minimize the effects on the
outcome of the institution; · Assessment of impacts on exposures during the creation or modification
of products and services; and · Performing monthly stress testing of interest rate exposures.
The Non Negotiable Portfolio (Banking Book) is divided into groups and book, observing the internal rules approved by the Market and Liquidity Risk Executive
R$ Thousand
Risk Factor 1T15 4Q14 3Q14 2Q14 1Q13
Prefixed
purchased 3,016,353 6,178,207 6,280,065 6,636,749 6,388,385
sold 3,769,088 4,481,286 4,409,145 5,658,426 5,177,751
CDI/TMS/FACP
purchased 473,412 1,117,235 1,114,054 1,745,948 2,154,030
sold - - - - -
Price index
purchased 702,552 33,489 31,184 30,046 76,843
sold - - - - -
Foreign currency /gold
purchased 3,374,230 2,322,212 2,442,896 1,885,589 2,027,831
sold 783,873 117,211 681,667 167,339 573,048
Shares
purchased 387 - - - -
sold - - - - -
Note: Patagônia Bank included.

62
Risk Management Report- Pillar 3 – 1Q15
Committee (CERML) and by the Global Risk Superior Committee (CSRG), which establish the objectives, the composition, the financial limits and the market risk limits for each group or book. As of January 2015, Banco do Brasil started using the Economic Value of Equity (EVE) metric, to substitute Value at Risk – VaR, in order to calculate banking book interest rate risk, although it is going to observe both metrics through October 2016. EVE consists in estimating the variation of the economic value of assets, liabilities and derivative instruments of the Institution, comparing the value that was obtained through the use of a domestic interest rate shock scenario and the value that was calculated in the current rates scenario. Among other aspects, it is relevant to highlight that the EVE calculating metric:
· Includes all the operations that are sensitive to the variation of interest rates and uses risk measuring techniques and financial concepts that are widely accepted;
· Considers data relevant to rates, deadlines, prices, optionalities and other information that was adequately specified;
· Requires the definition of adequate premises to turn positions into cash flows;
· Measures the sensitivity to changes in the temporal structure of interest rates, between different rate structures and premises;
· Is integrated in the daily practices of risk management;
· Allows the simulation of market extreme conditions (stress tests);
· Enables stimulating the Reference Equity (PR) compatible to the risks according to the 3rd Article of the CMN Resolution 3,490/07.
In order to deal with the products that do not have a defined maturity, Banco do Brasil adopts statistical and econometric methods, from the literature to analyze temporal series, more specifically the methods called ARIMA (Autoregressive, Integrated and Moving Averages). Such methods assume the hypothesis that a retrospective behavior of the variations that are observed in the balances are important information for the prediction of the future behavior of the cash flow bailouts (random variable of interest) of the balances of funding products that are under a reference. So, those methods assume as feasible the possibility of future occurrence of fluctuations of balances (financial amount of partial bailouts) with a range that is similar to the ones that are observed in the historical series. The tables below show the impact on the result or on the value assessment of the institution due to shocks in interest rates segmented by risk factors:

63
Risk Management Report- Pillar 3 – 1Q15
Table 39 - Impact on the result or on the assessment of the value of the institution due to shocks in interest rates segmented by risk factor – Value at Risk methodology
Table 40 – Impact on the result or on the assessment of the institution value due to the shocks in interest rates, segmented by risk factor – Economic Value of Equity methodology
6.2.9 Liquidity Risk Management Structure
CMN Resolution 4,090/12 addresses the implementation of liquidity risk management structure, observing the operations nature, the complexity of products and the Institution´s dimension of market risk exposure.
The Risk Management Board (Diris), subordinated to the Vice - Presidency of Internal Controls and Risk Management, is responsible for the liquidity risk management of Banco do Brasil SA.
The risk governance model adopted by BB is organized in risk superior committee and executive committees structure, with the participation of several areas of the Institution.
All the decisions related to risk management are made as a collegiate and in accordance with the guidelines and internal rules.
R$ Thousand Hypothetical result
Risk Factor-Interest Rate 1Q15 4Q14 3Q14 2Q14 1Q14 4Q13
Prefixed 3,646,601 4,879,369 4,742,499 4,766,177 3,861,375 4,272,092 US$ Dollar 1,834,959 1,542,784 1,440,947 1,488,860 1,403,451 1,092,351 Euro 74,861 163,563 150,631 156,037 166,808 169,212 Sw iss Franc 28,589 20,897 22,915 27,757 40,359 49,054 Yen 3,665 50,458 41,372 49,122 43,979 46,344 Pound Sterling 2,333 86,469 85,852 82,969 82,603 62,816 TR 2,120,624 2,497,374 2,380,884 1,891,203 2,280,397 2,492,555 TJLP 28,492 31,123 27,510 28,761 30,396 25,841 TBF 1,370 1,348 1,335 470 506 525 IPCA 39,869 34,185 21,693 32,979 62,570 73,165 IGP-M 77,641 75,909 79,534 74,494 76,124 75,833 INPC 127,280 119,880 118,614 115,807 115,926 131,799 Others 308,889 256,075 290,160 249,811 330,020 524,442
R$ thousandHypothetical
Results (EVE)
Risk Factor-
Interest Rate 1T15
Prefixed - 4,686,437
US Dollar 24,002
Euro 197
TR 2,403,545
TJLP - 26,039
TBF 1,739
INPC - 160,491
Other 37,019-

64
Risk Management Report- Pillar 3 – 1Q15
Liquidity risk management held by the Bank in Diris is applied to the following managerial visions:
· Banco do Brasil’s National Currency Liquidity; · Banco do Brasil’s Foreign Currency Liquidity; and · Liquidity of each Liquidity Center and Banco do Brasil’s branches abroad.
The figure below shows Banco do Brasil S.A. liquidity risk management structure:
Figure 10 - Liquidity Risk Management
The main forums involved in the management of liquidity risk with their respective purposes are described below: Board of Directors (CA) Banco do Brasil S.A. Board of Directors defines the general business of the Bank and its subsidiaries. The Board has, in the manner provided by law and the Statute, strategic, guiding, elective and monitoring assignments, not covering operating and executive functions. The composition and management term of the Council is defined by the Bank's bylaws. The Board of Directors shall decide on:
· Specific policies for the management of liquidity risk; and · Risk appetite and tolerance.
Operational Procedures
Management Systems
CA
CSRG
DIRIS
Management Structure Strategic Level Operational Level
CERML
CGAP

65
Risk Management Report- Pillar 3 – 1Q15
Global Risk Superior Committee (CSRG): Purposes:
· To set liquidity risk management strategy; · To determine global limits to liquidity risk exposure; · To decide on minimum reserves of liquidity and liquidity contingency
plans; · To approve the risk factors that will make up the documents and reports
to be submitted to regulatory agencies and other institutions;
Market and Liquidity Risk Executive Committee (CERML): To approve:
· Models, methodologies, criteria and parameters for liquidity risks;
· The contingency plans regarding liquidity risk management; · To assess the internal validations results and specify, whenever
necessary, corrective measures for models of liquidity risk management;
To analyse and propose to CSRG: · The minimum reserve and the global limits to liquidity risks;
· The contingency plans for liquidity;
· The liquidity risk management strategy;
· To monitor the recommendations and guidelines resolved by the Committee.
Asset-Liability and Liquidity Management Superior Committee (CSGAP) Purposes:
· To set liquidity management strategy;
· To set guidelines for treasury operations, subject to the overall limits set by the Global Risk Superior Committee;
· To set guidelines for liquidity management of the Conglomerate;
· To monitor the recommendations and guidelines resolved by the Committee.
6.2.10 Liquidity Risk Management Process
Banco do Brasil maintains liquidity levels suitable to the Institution’s commitments in Brazil and abroad, as a result of its broad and diversified base of depositors, the quality of its assets, the capillarity of its network of external offices and of its access to international capital markets. The strict liquidity risk control is in line with the Liquidity and Market Risks Policy established for the Conglomerate, meeting the requirements of national banking oversight, as well as of the other countries in which the Bank operates.

66
Risk Management Report- Pillar 3 – 1Q15
The process of managing liquidity risk involves continuous flow of information, following the steps listed in the section of the risk management process. Banco do Brasil’s liquidity risk management segregates the liquidity in Reais from the liquidity in Foreign Currencies. So, the following instruments are used:
· Liquidity Forecasts; · Stress test; · Liquidity Risk Limits; and, · Liquidity Contingency Plan.
The liquidity risk management instruments are regularly monitored and reported to the institutions’ Strategic Committees. The Liquidity Forecasts allow a prospective assessment of the effect of the mismatching between fundings and investments, in order to identify situations that could compromise the liquidity of the Institution, taking into account both budgetary planning and market conditions. Periodically, Liquidity Forecasts are assessed under alternative and stress scenarios. If the result of any of these liquidity forecast scenarios remain below the adopted liquidity level limit, then the previously established Contingency Measures Potential is put into effect, in order to recover the Institutions’ liquidity. Furthermore, Banco do Brasil uses the following metrics for Liquidity Risk limits:
· Liquidity Reserve (RL);
· Liquidity Cushion; and
· Availability of Free Resources Indicator (DRL).
Liquidity Reserve is the metric used in short-term liquidity risk management. It is the minimum level of high liquidity assets the Bank must maintain, compatible with the risk exposure arising from the nature of its operations and market conditions. The Liquidity Reserve methodology is used as a parameter to identify a liquidity contingency and to activate the Liquidity Contingency Plan, being monitored daily. The Liquidity Cushion limit aims to monitor the daily observed liquidity under stressed conditions, as a complement to the liquidity monitoring observed and projected in market normal conditions, given by the definition and Liquidity Reserve methodology. The Availability of Free Resources indicator (DRL), used in planning and in the execution of its annual budget, is intended to ensure a balance between funding and and the investment of resources in the commercial portfolio and ensure liquidity financing with stable resources. The DRL limit used to guide the execution and planning of the budget, according to the funding and investment goals, is defined annually by the Global Risk Superior Committee (CSRG), and its monitoring occurs on a monthly basis.

67
Risk Management Report- Pillar 3 – 1Q15
The Liquidity Contingency Plan, on its turn, establishes procedures and responsibilities to be adopted on liquidity stress situations. In that case, one or more contingency measures may be adopted so that the institution can assure its payment capacity. The potential of liquidity contingency measures is verified monthly. The processes and procedures of the liquidity risk management structure are validated and performed by two internal units at different points in time, a fact that ensures the adequate separation of duties and the independence of work. The Internal Control Board (DICOI) is responsible for validating the financial conglomerate risk measurement models and the Bank’s internal control system. Internal Audit (AUDIT) periodically evaluates credit risk management processes to verify whether they are consistent with the strategic guidelines, liquidity policy, and regulatory and internal rules.
6.3 Operational Risk
6.3.1 Management Objectives
The operational risk management at BB aims to identify, assess, mitigate, control and monitor the exposure to operational risks inherent to the Bank’s processes, business, products and services. The functions and activities related to the management of that risk was centralized in the Operational Risk Unit (URO), whereas the Risk Management Board (Diris) is responsible for the calculation of the values of capital allocation to cover risks. The responsible for Banco do Brasil`s operational risk management before the Central Bank of Brazil is the Vice President of Internal Controls and Risk Management. The Internal Controls Board (Dicoi) is responsible for the 2nd layer of control that includes, among other activities, control and compliance assessment and risk management models validation. The Board of Directors remains responsible for the disclosed information. Internal Audit is responsible for verifying operational risk management and its structure. In order to fulfill strategies and policies set up for and meeting the regulatory requirements, activities relating to phases of management, are summarized in the following table:

68
Risk Management Report- Pillar 3 – 1Q15
Table 41 - Phases of the operational risk management process
Management Phases Summary of Activities
Identification It consists of identifying and clarifying the operational risk events which tha Bank is exposed to, indicating incidence areas, causes and potential finance impacts associated to the Organization`s processes, products and services.
Assessment It is the quantification of the operational risk exposure with the objective of assessing the impact in the Bank business. It also consists of the qualitative assessment of the identified risks, analizing their probability of happening and their impact, determining the risk tolerance level.
Control It consists of registering the behavior of operational risks, limits indicators and operational loss events, as well as of implementing mechanisms to ensure that the limits and operational risk indicators remain within the desired levels.
Mitigation It consists of creating and implementing mechanisms to modify the risk, with the objective to reduce the operational losses by removing the cause of the risk, changing of the probability of occurrence or the changing of the risk events consequences.
Monitoring
The action aims to identify the deficiencies of the operational risk management process, so the detected weaknesses are reported to the High Administration. It is the feedback phase of the operational risk management process, in which it is possible to detect weaknesses in the previous phases.
6.3.2 Operational Risk Policy
The Operational Risk Policy reviewed and approved annually by the Board of Directors (CA) contains guidance for the Bank’s units, intended to ensure the effectiveness of the operational risk management model and it is expected that the Subsidiaries, Affiliates and investments Companies define their directions based on these guidelines, considering the specific needs, legal and regulatory issues to which they are subject. The Bank also has other policies that make up the list of policies associated to the management of operational risk, such as the Prevention and Combat against Money Laundering and Terrorism Financing; Business Continuity Management; Relationships with Suppliers; Legal Risk; and Information Security.
6.3.3 Management Processes and Strategies
Banco do Brasil performs the operational risk management conservatively, segregating the functions of risk management, in compliance with the standards and guidelines for supervision and bank regulation. The current Corporate Strategy and Master Plan of the Bank, approved by the Board of Directors (CA), has defined indicators and targets linked to corporate objectives, in order to reduce operational losses.

69
Risk Management Report- Pillar 3 – 1Q15
Strategic management takes place in the Global Risk Superior Committee (CSRG), composed by the President and Vice - Presidents, whose purpose is to establish guidelines, as well as to define global limits to risk exposure. Banco do Brasil defines Global Operational Loss Limit, which is based on the maximum amount of losses for the period of one year. That limit is in line with the strategy of reducing operational losses and with the values established in the institution's budget. The Bank also uses Specific Limits of Operational Losses with the definition of the managers of products, services and channels in order to involve several areas in the operational risk mitigation. In order to speed up the management process, issues related to operational risk are deliberated in the Executive Committee of Internal Controls and Operational Risk (CERO). The proposition/adoption of measures to keep the risk parameters (exposure, limits etc.) are also among the assignments of CERO within the maximum exposure defined by the CSRG. The Bank also has a Forum called “Legal Risk Preventive Technical Forum” - subordinated to CERO - with the aim of contributing with the reduction of operational losses by identifying, evaluating and proposing mitigating actions, within the legal service. It mainly aims to identify the main causes of litigation, jurisprudence and decisions that may impact the Bank and evaluate action plans for the treatment of risks and control their effectiveness in mitigation.
6.3.4 Communication and Information Processes
Monthly, the position of global and specific limits is reported to the members of CSRG and CERO. The behavior of operational losses, mitigation actions, as well as the main operational risks are detailed. Monthly, the operational losses position, as well as the lawsuits and the specific limits of their areas are communicated to the managers of processes, products and services. Those reports are designed to allow the identification of operational risks and their causes for generating proposals for mitigating actions. Regarding the risk culture dissemination, the internal controls and operational risk certification is continuously revised, as well as the courses related to operational risk management. Those trainings are available on Corporate University (UniBB) website for the whole staff of the Institution.
6.3.5 Measurement Systems
The Bank uses a model based on the Alternative Standardized Approach (ASA) to calculate capital for operational risk.

70
Risk Management Report- Pillar 3 – 1Q15
The capital portion value for operational risk corresponds to the Referential Equity (PR) consumption with capital for operational risk. This metric monitoring is defined by strategic committees - CSRG and CERO. As for the management of the provision for contingent demands, the Bank uses a methodology based on statistical techniques, which ensures greater stability and accuracy in estimating disbursement to cover losses with lawsuits.
6.3.6 Operational Risk Mitigation
The Units that manage processes, products, and services, based on the operational risks highlighted in the risk identification step and the decisions issued by the CSRG or CERO, must develop and implement action plans and instruments to mitigate that risk. The action plans are registered in a specific tool that allows the monitoring and the reporting of the implemented measures. The Bank also acts in the analysis of security incidents - physical and virtual channels - with continuous monitoring, seeking to inhibit attacks and retrieve values. Actions are developed to mitigate operational losses with electronic fraud and measures are developed to suppress criminal activities related to external theft. Aiming to prevent, correct or inhibit weaknesses or deficiencies, which may generate risks, the Bank may issue Technical Risk Recommendation (RTR), so that the manager presents an action plan, aimed at mitigating operational risk, and strengthening the culture of risk management.
6.3.7 Control of Operational Risk
The Bank monitors the behavior of the risks, limits, indicators and operational loss events in order to ensure that the values remain within the desired levels.
The following table presents the monitoring of the operating losses of the Bank held by categories of risk events, in percentage terms. It is noteworthy that the Bank considers the constitutions / reversals of provisions - especially for contingent liabilities - total calculated in operational losses for the categories: Labor Issues, Business Failures and Failures in Processes:

71
Risk Management Report- Pillar 3 – 1Q15
Table 42 - Operational losses monitoring by loss events category.
6.3.8 Banco do Brasil Related Entities
The Bank uses procedures to evaluate the operational risk management of the entities, issuing guidelines for adequacy of the adopted business model. Aspects, such as structure, policies, instruments and operational risk management process are evaluated as well as the assessment of impact and probability of losses.
Additionally, the Bank measures the regulatory capital requirement for operational risk of financial companies, ensuring the adequacy of capital to cover this risk under the Prudential Conglomerate.
6.4 Strategy Risk
6.4.1 Management Objectives
The strategy risk management at BB aims to identify, assess, control, mitigate and monitor the risk associated to adverse changes in the business environment or the use of inadequate premises in decision making.
The table below shows a summary of the management activities listed in the previous paragraph:
Table 43 - Strategy risk management activities
Management Activities Summary of Activities
Identify It consists of recognizing and classifying the strategy risk which the Bank is subject to.
Assess It consists of dimensioning, in a quantitative and qualitative way, the potencial effect of the strategy risk, which enables to determine the risk tolerance level.
Control It is the register and report of the behavior of strategic variables to guarantee the maintenance of the exposure according to the established tolerance level.
Mitigate It consists of creating and implementing mechanisms to reduce the impact of adverse changes.
Monitor It consists of verifying the adequacy and effectiveness of a strategy risk management model.
1Q15 4Q14 3Q14 2Q14 1Q14*
Business Failures 81.9% 68.3% 52.3% 55.9% 56.1%Labor Issues 3.5% 13.1% 29.9% 24.0% 29.8%External Fraud and Theft 8.7% 8.8% 11.8% 17.2% 11.7%Processes Failures 5.4% 8.2% 5.1% 1.4% 1.4%Internal Fraud 0.3% 0.8% 0.6% 1.2% 0.5%Damage to Physical Assets 0.2% 0.5% 0.2% 0.2% 0.4%Systems Failures 0.0% 0.4% 0.0% 0.0% 0.1%Disruption of Activities 0.0% 0.0% 0.0% 0.0% 0.0%Total 100.0% 100.0% 100.0% 100.0%
*1st quarter/2014: not considered the extraordinary effects in provisions.

72
Risk Management Report- Pillar 3 – 1Q15
6.4.2 Management Model
In the strategy risk management model, the superior and executive risk committees aim to guarantee the sustainable feedback, by deliberating on the issues related to that risk.
The Boards involved provide the necessary information for management, so the risk area can identify exposure, by guiding decisions in a risk situation.
The Bank`s way of acting is based on the policies and processes approved by the Senior Management and the risk report and control is made periodically and the results are communicated to the competent instance.
6.4.3 Management Structure
The strategy risk management structure segregates the risk management process from the Strategy management corporate processes at Banco do Brasil, by evidencing the responsibility of the areas involved, aiming to guarantee the sustainable feedback to shareholders, in risk conditions.
The Risk Management Board, subordinated to the Vice-Presidency of Internal Controls and Risk Management (Vicri), is responsible for the strategy risk management, acting to identify, assess, control, mitigate and monitor the risk.
The Brand Strategy Board (Direm), assisted by the risk area, coordinates the process with the Bank Strategic Units, aiming to mitigate the impacts of adverse changes that affect Banco do Brasil`s Corporate Strategy.
The Controllership Board (Dirco) provides the necessary information to the risk area periodically, so the consumption of limits and strategy risk control are ascertained.
The other strategic, operational and tactical units of the Bank work on mitigating actions, in their corresponding acting spheres in order to minimize adverse impacts, aiming to reduce Strategy risks.
The risks governance model adopted by BB involves a superior and executive committees structure, with the participation of several areas in the Institution.

73
Risk Management Report- Pillar 3 – 1Q15
Figure 11 – Strategy Risk Management
The forums involved in the strategy risk management are:
· Board of Directors (CA);
· Global Risk Superior Committee (CSRG);
· Executive Committee of Internal Controls and Operational Risk (CERO).
6.4.4 Management Processes
For the development of the Corporate Strategy, the Bank adopts as a practice the analysis of macroeconomic scenarios and of the financial industry aiming to improve the assessment of the opportunities and threats in the Market and mitigate erroneous strategic decisions risks.
Diris periodically monitors indicators that reflect the level of strategy risk incurred by the institution, as well as works on the control by means of previously established tolerance levels in order to guarantee that the risk remains within the desired level. The objective of that process is to promote the proactive management in decision taking.
Risk Policy
Management Strategies
Management Processes
Operational Procedures
Management Systems
CA
CSRG
CERO
Diris
Direm
UGE
Dirco
Management Structure Strategic Level Operational Level

74
Risk Management Report- Pillar 3 – 1Q15
6.4.5 Information and Communication Processes
The communication of the risks incurred by the Bank to the Senior Management takes place in the monthly ordinary meetings of the superior and executive strategic risk committees. The values ascertained for the indicators and the situation regarding the risk limits are reported in the committees.
6.5 Reputational Risk
6.5.1 Management Objectives
The reputational risk management at BB aims to identify, assess, control, mitigate and monitor the risk that comes from the negative perception about the institution on the stakeholders` part and which can adversely affect the business sustainability.
The following table shows a summary of the management actions listed in the previous paragraph.
Table 44 - Reputational Risk management activities
Management Activities Summary of Activities
Identify It consists of recognizing and classifying the reputational risk which the Bank is subject to.
Assess It consists of dimensioning, in a quantitative and qualitative way, the potencial effect of the reputational risk, which enables to determine the risk tolerance level.
Control It is the register and report of the behavior of reputational variables to guarantee the maintenance of the exposure according to the established tolerance level.
Mitigate It consists of creating and implementing mechanisms to reduce the impact of adverse changes.
Monitor It consists of verifying the adequacy and effectiveness of a reputational risk management model.
6.5.2 Management Model
In the reputational risk management model, the superior and executive risk committees aim to guarantee the sustainable feedback, by deliberating on the issues related to that risk.
The Boards involved provide the necessary information for management, so the risk area can identify exposure, by guiding decisions in a risk situation.
The Bank`s way of acting is based on the policies and processes approved by the Senior Management and the risk report and control is made periodically and the results are communicated to the competent instance.

75
Risk Management Report- Pillar 3 – 1Q15
6.5.3 Management Structure
The reputational risk management structure segregates the risk management process from the Strategy management corporate processes at Banco do Brasil, by evidencing the responsibility of the areas involved, aiming to guarantee the sustainable feedback to shareholders, in risk conditions.
Diris, subordinated to the Vice-Presidency of Internal Controls and Risk Management (Vicri), is responsible for the reputational risk management, acting to identify, assess, control, mitigate and monitor the risk.
The Brand Strategy Board (Direm), assisted by the risk area, coordinates the process with the Bank Strategic Units, aiming to mitigate the impacts of adverse changes that affect Banco do Brasil`s reputation. In addition, it periodically provides the values of the indicators of the brand management and satisfaction level for the risk area to ascertain the limits consumption and control the risk.
The Press Unit provides the indicators related to the communication and promotion for the risk area to ascertain the consumption of the limits and to control the reputational risk.
The External Ombudsman informs Bacen Ranking, the quantity indicators and the solution of the complaints at the Ombudsman to send them to the risk area for ascertaining the consumption of the limits and controlling the risk.
The other strategic, operational and tactical units of the Bank work on mitigating actions, in their corresponding acting spheres in order to minimize adverse impacts, aiming to reduce Reputational risk.
The risks governance model adopted by BB involves a superior and executive committees structure, with the participation of several areas in the Institution.

76
Risk Management Report- Pillar 3 – 1Q15
Figure 12 – Reputational Risk Management
The forums involved in the reputational risk management are the same ones for the strategy risk: Board of Directors, Global Risk Superior Committee and Executive Committee for Internal Controls and Operational Risk.
6.5.4 Management Processes
Diris periodically monitors indicators that reflect the level of reputational risk incurred by the institution, as well as works on the control by means of previously established tolerance levels in order to guarantee that the risk remains within the desired level. The objective of that process is to promote the proactive management in decision taking.
6.5.5 Information and Communication Processes
The communication of the risks incurred by the Bank to the Senior Management takes place in the monthly ordinary meetings of the superior and executive strategic risk committees. The values ascertained for the indicators and the situation regarding the risk limits are reported in the committees.
6.6 Environmental Risk
6.6.1 Management Objectives
The environmental risk management at BB aims to identify, classify,assess, control, mitigate and monitor the risk that comes from the exposure to the environmental harms generated by Banco do Brasil`s activities.

77
Risk Management Report- Pillar 3 – 1Q15
6.6.2 Management Model
In the environmental risk management model, the superior and executive risk committees aim to guarantee the sustainable feedback, by deliberating on the issues related to that risk.
The Boards involved provide the necessary information for management, so the risk area can identify exposure, by guiding decisions in a risk situation.
The Bank`s way of acting is based on the policies and processes approved by the Senior Management and the risk report and control is made periodically and the results are communicated to the competent instance.
6.6.3 Management Structure
The proposed risk management structure segregates the corporate risk management processes that can cause environmental harm to the Bank activities, by evidencing the responsibility of the areas involved in the environmental risk management.
The Bank instituted the concepts, and management activities for the environmental risk, by evidencing the responsibility of management, as described below:
Diris develops assessment models, assists the development of identification methodologies, controls the exposure and verifies the adequacy of the management process, the latter along with Direm;
The Sustainable Development Unit (UDS) – develops identification models, assesses events, assists in the risk mitigation and verifies the adequacy of the management process, the latter along with Diris;
Other Strategic Units – identifies events, mitigates and verifies the adequacy of the identification instruments and the mitigation of the risks.
Furthermore, the Bank structured an area with activities related to environmental risk in the Credit Board, whose assignments cover the development of environmental risk analysis methodology for credit, norms and legal requirements monitoring and the elaboration of sectorial guidelines.
In addition, the creation of the Environmental Management in Agribusiness Division, in the Agribusiness Board, assists in the management of the processes related to the environmental responsibility, once it aims to assist in environmental issues linked to the agribusiness market, propose adjustments in products and services to address attributes that derive from environmental responsibility, among others.
The Bank also has a Supplying Plan Division, Eco - efficiency and Suppliers` Development, in the Business and Operations Support Board, which aims to follow and elaborate a Supply Plan of Goods, Materials and Engineering Services, coordinate and follow the fulfillment of steady investment projects that are being implemented by the Bank, develop strategies for the development of suppliers, develop strategies for the execution of programs and actions related to eco – efficiency, among others.
78
Risk Management Report- Pillar 3 – 1Q15
The other strategic, operational and tactical Units of the Bank work on mitigating actions, in their corresponding acting spheres in order to minimize adverse impacts, aiming to reduce Environmental risk.
The risks governance model adopted by BB involves a superior and executive committees structure, with the participation of several areas in the Institution.
The forums involved in the environmental risk management are:
· Board of Directors;
· Global Risk Superior Committee.
·
6.6.4 Management Processes
The Bank has processes that contribute for the implementation of environmental responsibility actions. Some examples are: Dow Jones Sustainability Index, 21 Agenda, the Stakeholders` Panel, the Sustainability for Executives Forum, the Equator Principles and the IFC Performance Standards.
6.6.5 Environmental Responsibility Policy
In compliance with CMN Resolution 4,327, dated 04.25.2014 and the SARB Regulation n.14, dated 08.28.2014 (FEBRABAN Self – regulation), the environmental responsibility policy permeates activities related to the risk management.
The Bank adopts a risk management structure that aims to identify, classify, assess, monitor, mitigate and control the environmental risk. The Bank also has an environmental responsibility governance structure and environmental risk management which is compatible to its size, business type, the complexity of the products and services, and the relations established with the interested public.
6.6.6 Information and Communication Processes
The communication of the risks incurred by the Bank to the Senior Management takes place in the superior and executive risk strategic committees monthly ordinary meetings.
6.6.7 Shareholdings
Banco do Brasil S.A. has a wide diversity of businesses, products, services and clients. Because of the organizational nature, strategic option or legal and regulatory requirements, the operationalization of its businesses and processes is distributed between the Multiple Bank and its Related Entities (ELBB), located in Brazil and abroad, under several organizational and judicial forms.
In the regulatory field, the National Monetary Board (CMN) issued the Resolution 4,388, dated 12.18.2014, which changes provisions in the credit risk Resolution

79
Risk Management Report- Pillar 3 – 1Q15
3,721/09, operational risk Resolution 3,380/06, liquidity Resolution 4,090/12 and market risk Resolution 3,464/07. According to the current norm, the risk management structure must be:
a) In relation to the Prudential Conglomerate:
i. identify, assess, measure, control and mitigate the credit risk;
ii. identify, assess, monitor, control and mitigate the operational risk;
iii. identify, assess, monitor and control the market and liquidity risks.
b) Identify and follow the market, liquidity, credit and operational risks of the companies controlled by the ones that are part of the Prudential Conglomerate.
In addition, by means of the Resolution 3,988/11, CMN established that the capital management structure must cover all the Financial Conglomerate institutions and also consider the possible impacts on its capital, derived from the risks associated to the other companies that are part of the Financial – Economic Consolidation.
As it is the Institution that leads the Financial – Economic Consolidation, Banco do Brasil is responsible for ensuring the effectiveness and the integrity of that entrepreneurial model, by establishing corporate governance mechanisms that are able to promote the alignment of Banco do Brasil`s Related Entities (ELBB).
In February / 2013, the Board of Directors (CD) approved the referential model of attributions for the Organizational Units. Among other aspects, the responsibilities of the Units are defined, in relation to the Bank`s Related Entities, as follows:
a) Advising; b) Following and Control; c) Service Providing; d) Governance.
The risk management area is responsible for the roles of advising, following and controlling and risk management service providing, whereas the Entities Management Unit is responsible for the Governance.
In June / 13, the CD approved the Guiding Process on Risk Management for the ELBB, which consists of the companies` risk assessment model. Identification and assessment procedures were developed based on two dimensions: qualitative and quantitative.
In qualitative terms, the form covers aspects related to the companies` risk management process, such as:
a) Risk appetite; b) The existence of policies and strategies applied to the risk management; c) Organizational structure; d) Processes, procedures and systems; e) Concepts, criteria, models and methodologies, metrics, indicators,
parameters and limits applied to the risk management; f) Report instruments; g) The existence of strategic committees for following and deliberating on

80
Risk Management Report- Pillar 3 – 1Q15
thre risks incurred; h) Segregation among the areas that are responsible for the business
management and risk management.
The quantitative assessment uses methodologies of measuring the risks incurred.
After the assessments of the companies, the risk management areas indicate the companies` level of exposure to the risks, the identified weaknesses, guidance about the risk management process, among other aspects. The process is complemented with the guidance from the Bank representatives at the ELBB, on the adoption of measures to reduce the risks incurred, which is made by the corresponding governance areas.
Below, the societal participations that are not classified in the negotiable portfolio are related, segregated by business segments, according to the article 14 in Bacen Circular 3,678/13:
Table 45 – Equity Interests – Non Negotiable Portfolio
R$ milActivity
% of Total
Shares
Book Value of
Equity
Interests
Value of Capital
Requirement (1) (2)
Segmento B ancário
Banco Votorantim S.A. (3) Banking 50.00% 3,804,661 -
Segmento Invest imento s
Kepler Weber S.A. (3) Industry 17.46% 85,275 9,080
Neoenergia S.A. (3) Energy 11.99% 1,166,259 128,288
Segmento Seguro s, P revidência e C apitalização
BB Seguridade Participações S.A. (4) Holding 66.25% 4,283,843 1,122,213
Seguradora Brasileira de Crédito à Exportação - SBCE (5) Insurance Company 12.09% 2,625 688
Segmento M eio s de P agamento
Cateno Gestão de Contas de Pagamento S.A. (3) (7) Service Rendering 50.13% 3,954,735 435,021
Cielo USA Inc. (3) (7) Service Rendering 28.75% 276,673 30,434
Tecnologia Bancária S.A. - Tecban (5) (7) Service Rendering 13.53% 49,759 5,473
Outro s Segmento s
Ativos S.A. Gestão de Cobrança e Recuperação de Crédito (4) Credits Acquisition 100.00% 5 1
BB Tur Viagens e Turismo Ltda. (4) Tourism 100.00% 13,312 1,464
BB Tecnologia e Serviços S.A. (4) IT 99.97% 220,754 24,283
Cadam S.A. (5) M ining 21.64% 19,342 1,683
Cia Hidromineral Piratuba (5) Tourism 15.44% 2,624 289
Estruturadora Brasileira de Projetos - EBP (5) Project Development 11.11% 6,573 723
Provisão para Investimentos (6) (6,770)
(2) According to Resolution CM N No. 4,192/2013, the value of the investment in Banco Votorantim S.A. is deducted from the Reference Equity, with no capital requirement.
(4) Subsidiaries, evaluated by the equity method.
(6) Unrealized, but acknowledged losses, referring to companies Cadam S.A. and Kepler Weber S.A., whose value is computed in the calculation of Common Equity.
1Q15
(1) Value for the minimum capital requirement for equity interests registered in the fixed assets and included in the calculation of risk-weighted assets regarding exposure to credit risk
(RWA CPAD) under Central Bank Circular No. 3,644/2013.
(3) Jo int venture, evaluated by the equity method.
(5) Associated companies, evaluated by the equity method.
(7) Companies which are not classified as “ Payment Institutions” .

81
Risk Management Report- Pillar 3 – 1Q15
7 Capital
7.1 Capital Management Banco do Brasil`s capital management consists of a continuous process of planning, assessment, control and monitoring of the capital which is necessary to cover the relevant risks of the company and bear the capital requirements that are considered in the strategic planning and budget, aiming to optimize its allocation and structure. The capital management process permeates several areas, in the Institution`s many levels of governance, which comprises the Board of Directors, the Executive Board, the Strategic Committees, Boards and Units and the Capital Forum.
Figure 13 – Organizational Structure involved in the capital and risk management
Banco do Brasil defined the Accounting Unit, the Risk management areas, the Controlling and Finance Boards as members of its capital management structure. In January / 2012, BB`s indicated the Director of Controlling to be responsible for the capital management before Bacen.
CA
CD
CSRG
CEGC
CA Board of DirectorsCOAUD Auditing CommitteeCD Executive Board of DirectorsCSRG Global Risk Superior Committee
CERML Market and Liquidity Risks Executive CommitteeCERC Credit Risk Executive CommitteeCERO Internal Controls and Operational Risk Executive
Committee
COAUD
CERCCERML CERO
Capital Forum

82
Risk Management Report- Pillar 3 – 1Q15
The areas that were defined in the capital management structure are collective or individually responsible for:
· Identification of relevant risks; · Assessment of the capital required to bear them; · Projection of risk and capital indicators; · Calculation of the Referential Equity (PR); · Elaboration of the capital plan and contingency plan and; · Evaluating capital sources and its restoration. · ICAAP, Stress Tests, and Managerial Reports, and · Capital Management Policy.
In December 2014, the Board of Directors, aligned with good governance practices, approved the establishment of a specific committee for capital management process named Capital Management Executive Committee, which has as main purposes:
a) To approve models, methodologies, criteria and parameters for capital management;
b) To define the scenarios to be used in the capital management process; c) To analyse and propose to CSRG the:
i. Capital management strategy; ii. Capital allocation regarding risks; iii. Adoption of the measures in the capital contingency plan; iv. Assess capital stress testing results; v. To monitor capital contingency plan and measures; vi. To monitor Internal Capital Adequacy Assessment Process (ICAAP); vii. To monitor the recommendations and guidelines resolved by
Committee.
For Capital Management, BB calculates the Core Capital Ratio (ICP), Tier 1 Capital Ratio, Capital Adequacy Ratio (IB). The Prudential Capital Adequacy Ratio (IBP) that represents the Bank's directive to keep the IB two points above the minimum regulatory in order to sustain the risk of interest rate transactions not included in the trading book (RBAN parcel) and to serve as a prudential margin to face the other risks that are not considered in Pillar I.
The CMN Resolution 3,988/11 also established the need for Internal Capital Adequacy Assessment Process (ICAAP), which the Risk Management Board (DIRIS) is responsible for. At BB, the Internal Controls Board, independent area of capital management structure, is responsible for the validation of the ICAAP. The Internal Audit annually evaluates the process of capital management.
BB constituted a technical forum for capital management, named Capital Forum, which has members from the Units of the capital management structure. The Forum meets monthly, and has as main activities the preparation of the capital structure projections, the analysis of the main variations and trends of the

83
Risk Management Report- Pillar 3 – 1Q15
Institution’s IB, and the impacts of changes in the regulatory and business environment.
Banco do Brasil also periodically prepares managerial reports on capital adequacy for intervening areas and strategic committees, such as the Executive Committee of Risks (Operational, Market and Liquidity, and Credit), the Capital Management Executive Committee, the Global Risk Superior Committee, the Executive Board and the Board of Directors.
Banco do Brasil`s capital management structure enables the monitoring and the control of the capital held by the Institution, the assessment of capital necessity to cover the risks the institution is subject to and the planning of goals and capital necessity, considering the strategic objectives of the Institution. So, BB adopts a prospective position, anticipating the capital necessity derived from changes in the market conditions.
7.2 Referential Equity (RE) Details
On 10.01.2013, the National Monetary Board (CMN) approved changes in the rules for defining and determining the RE of financial institutions by means of CMN Resolution No. 4,192/2013 (and other rules related to the regulatory capital), included in the regulatory scope of Basel III. The new rules adopted address the following issues:
a) new methodology for calculating regulatory capital, which continues to be divided into Tier I and II. Tier I consists of the Core Capital (net of Regulatory Adjustments) and Additional Tier I Capital;
b) new methodology for calculating the capital requirement maintenance, adopting minimum requirements for Referential Equity, Tier I and Core Capital, and the introduction of the Additional Core Capital.
On August 28, 2014, the Capital and Debt Hybrid Instrument, in the amount of R$ 8,100,000 thousand which composed the Additional Tier 1 Capital was authorized by Banco Central do Brasil to compose the Common Equity Tier 1 Capital of the Bank. According to Bacen Circular 3,726/2014, the calculation of the Regulatory Equity (RE) and the amount of Risk-Weighted Assets (RWA) must be elaborated based on Prudential Conglomerate as of January 2015, according to CMN Resolution No. 4,192/2013. The calculations based on the Financial Conglomerate, however, must be made until 12.31.2017.

84
Risk Management Report- Pillar 3 – 1Q15
Table 46 - Reference Equity (RE) Details
7.3 Prudential Adjustments deducted from CET1:
The prudential adjustments are deductions from the Core Capital of elements that can compromise its quality due to their low liquidity, difficult assessment or reliance on future profits to be realized. As of January 2015, the deduction percentage of prudential adjustments below came to be of 40%:
a) Goodwill; b) Intangible assets constituted as of October 2013; c) Actuarial assets related to defined benefit pension funds net of deferred
tax liabilities; d) Non-controllers` participation; e) Direct or indirect investments, greater than 10% of the capital of
unconsolidated entities similar to financial institutions, and insurance companies, reinsurance companies, capitalization companies and open pension entities (superior investments);
f) Tax credits resulting from temporary differences that rely on the generation of future taxable profits or revenues for its realization;
g) Tax credits resulting from tax loss of excess depreciation;
1Q15
R$ thousands Prudential
RE - Referential Equity 128,704,988
Tier I 91,297,640
Common Equity Tier 1 Capital 69,739,142
Shareholders' Equity 73,315,647
Instrument Qualifying as Common Equity Tier 1 Capital 8,100,000
Regulatory adjustments (11,676,505)
Additional Tier 1 Capital 21,558,498
Hybrid instruments authorized in accordance w ith CMN Resolution No. 4,192/2013 19,484,955
Hybrid instruments authorized in accordance w ith regulations preceding the CMN Resolution No. º 4,192/2013 (1) 2,073,543
Tier II 37,407,348
Subordinated Debt Qualifying as Capital 37,425,368
Subordinated Debt authorized in accordance w ith CMN Resolution No. 4,192/2013 - Financial Bills 5,291,355
Subordinate Debt authorized in accordance w ith regulations preceding the CMN Resolution No. 4,192/2013 32,134,013
Funds obtained from the FCO (2) 21,075,691
Funds raised in Financial Bills (3) 5,726,800
Funds obtained abroad (3) 4,200,719
Funds obtained from the CD (3) 1,130,803
Deduction from Tier II (18,020)
Funding instruments issued by f inancial institution (18,020)
(1) The Instruments authorized by Bacen to compose the Referential Equity according to CMN Resolution No. 3,444/2007 and do not fulf ill the
requirements established by CMN Resolution No. 4,192/2013 are reduced by 10% per year from 2013 to 2022. This reduction is applied on
the values that composed the RE on December 31, 2012.
(2) According to CMN Resolution No. 4,192/2013, balances of the FCO are eligible to compose the RE.
(3) It w as considered the balance of subordinated debt instruments that composed the RE in December 31, 2012, applying on it the decay of
30% in 2015 and 20% in 2014, as determined by CMN Resolution No. 4,192/2013.

85
Risk Management Report- Pillar 3 – 1Q15
h) Tax credits resulting from tax losses and negative basis of social contribution on net income.
According to CMN Resolution No. 4,192/2013, those deductions will be gradually implemented, 20% per year, from 2014 to 2018, with the exception of deferred assets and funding instruments issued by institutions authorized to operate by Banco Central do Brasil (Bacen) which are already being fully implemented since October 2013. Table 47 – Prudential Adjustments
For further information on the composition of the Reference Equity (PR), see the “Attachment 1 – Composition of the Reference Equity”. 7.4 Minimum Reference Equity Required (MRER) The Minimum Reference Equity Required (MRER) is the equity required (capital volume required) of institutions, financial conglomerates, and other institutions authorized to operate by Bacen, to face the risks to which they are exposed due to the activities they are involved in, and it is definied by CMN Resolution 4,193/13. The MRER, corresponds to the application of the factor "F" to the amount of RWA, with:
· 11% of RWA, from 10.01.2013 to 12.31.2015;
· 9.875% from RWA 01.01.2016 to 12.31.2016,
· 9.25% of RWA from 01.01.2017 to 31.12.2017;
· 8.625% of RWA from 01.01.2018 to 31.12.2018; and
· 8% of the RWA from 01.01.2019.
R$ thousands 1Q15
Funding instruments issued by f inancial institutions (1) (2) (3,804,661)
Actuarial assets related to defined benefit pension funds net of deferred tax liabilities (3) (4) (2,470,316)
Intangible assets constituted after October 2013 (3) (2,048,234)
Goodw ill (3) (5) (1,343,455)
Tax credits resulting from temporary differences that rely on the generation of future taxable profits or revenues for its realization (amount above 10% threshold) (3) (619,575)
Tax credits resulting from tax losses and negative base for social contribution on net income (3) (499,011)
Non-controlling interests (3) (434,493)
Signif icant investments and tax credits resulting from temporary differences that rely on the generation of future taxable profits or revenues for their realization (amount exceeding the 15% threshold) (3) (358,945)
Tax credits resulting from tax loss of excess depreciation (3) (72,129)
Deferred assets (2) (25,686)
Total (11,676,505)
(5) The base value for calculating the goodw ill is composed of: R$ 845,207 thousand in the investment line and R$ 2,513,431 thousand in the intangible assets line(Notes 14 - Investments and 16 - Intangible Assets, of the financial statements of Banco do Brasil). The value in Intangible assets refers to the goodw ill paid for theacquisition of Banco Nossa Caixa, merged in November/2009.
(1) Refers to the investment in Banco Votorantim.
(2) Regulatory Adjustments that are being fully computed since October, 2013, in accordance w ith CMN Resolution No. 4,192/2013.
(3) Regulatory Adjustments subject to phase-in, according to the CMN Resolution No. 4,192/2013.
(4) See notes 27.e – Benefits for Employee and 25.d - Taxes, of the f inancial statements of Banco do Brasil.

86
Risk Management Report- Pillar 3 – 1Q15
In determining the amount of risk-weighted assets, we consider the sum of the following portions:
I. RWACPAD concerning credit risk exposures subject to the calculation of capital requirements under the standardized approach;
II. RWAMPAD concerning market risk exposures subject to the calculation of capital requirements under the standardized approach, and,
III. RWAOPAD on the calculation of the capital requirement for operational risk under the standardized approach.
The scope of consolidation used as a basis for the verification of operational limits considers the Financial Conglomerate, from 10.01.2013 thru 12.31.2014, and the Prudential Conglomerate, defined by the CMN Resolution 4,280/13, as of 01.01.2015. The tables below show the MRER segregated by Credit Risk, Market Risk and Operational Risk: Table 48 – Required Minimum Reference Equity
R$ thousand 1Q15 4Q14 3Q14 2Q14 1Q14
RWACPAD 753,727,844 734,716,021 720,363,896 782,472,612 763,068,276
2% 2,567 392 7,283 1,908 2,250
20% 3,619,422 7,534,545 6,681,196 9,159,634 9,288,966
35% 8,950,746 8,444,573 7,667,104 6,943,504 5,997,569
50% 18,151,121 17,044,092 18,082,035 17,435,975 16,070,332
75% 202,964,292 203,654,427 197,795,100 129,523,956 130,667,437
85% 176,222,367 152,691,687 146,237,834 133,804,526 148,006,249
100% 310,393,134 314,009,607 312,533,013 380,274,980 352,982,079
150% - - - 59,166,606 53,815,658
250% 26,152,178 26,638,381 26,832,880 23,268,750 23,820,150
300% 2,570,130 3,518,881 3,483,891 21,721,836 20,910,092
1.250% 3,535,806 602,206 687,353 875,477 870,032
1,166,079 577,231 356,206 295,461 637,463
RWAOPAD 30,116,897 39,712,004 39,712,004 36,578,814 36,578,814
Asset Management 634,230 1,115,551 1,115,551 1,130,176 1,130,176
Commercial 18,201,214 15,860,595 15,860,595 13,457,208 13,457,208
Retail Brokerage 21,222 44,602 44,602 44,065 44,065
Corporate Finance 3,975,398- 1,907,520- 1,907,520- 845,308- 845,308-
Trading and Sales 1,748,490 10,229,334 10,229,334 9,939,540 9,939,540
Payments and Settlements 2,609,070 4,557,642 4,557,642 4,291,040 4,291,040
Financial Agent Services 674,985 986,798 986,798 972,638 972,638
Retail 10,203,084 8,825,002 8,825,002 7,589,455 7,589,455
RWAMPAD 19,584,874 11,545,497 11,317,920 12,534,491 11,727,133
299,507 286,542 801,713 166,518 169,344
3,280,390 2,863,103 2,931,659 2,017,763 2,022,121
480,401 38,541 39,935 42,448 38,905
- - - - -
- - - - -
36,011 26,883 15,319 8,203 3,968
15,488,565 8,330,427 7,529,293 10,299,558 9,492,795
Risk Weighted Assets (RWA) (1) 803,429,614 785,973,521 771,393,819 831,585,917 811,374,223
Minimum Referential Equity Requirement (MRER) (2) 88,377,258 86,457,087 84,853,320 91,474,451 89,251,164
(1) According to CM N Resolution 4,193/2013, since 01.01.2015 the calculation of RWA applies to institutions of the prudential conglomerate.
(2) According to CM N Resolution 4,193/2013, corresponds to the application of the factor "F" to the amount of RWA, with "F" equals to 11%of RWA, from 10.01.2013 to 12.31.2015; 9.875% from RWA 01.01.2016 to
12.31.2016, 9.25% of RWA from 01.01.2017 to 31.12.2017; 8.625% of RWA from 01.01.2018 to 31.12.2018, and 8% of the RWA from 01.01.2019.
Op
era
tio
nal R
isk
Mark
et
Ris
k
Prefixed interest rate, in reais - RWAJUR[1]
Foreign currency coupons - RWAJUR[2]
Price index coupons - RWAJUR[3]
Interest rate coupons - RWAJUR[4]
Share price fluctuations - RWAACS
Commodity price fluctuations - RWACOM
Exchange rate fluctuations - RWACAM
Cre
dit
Ris
k
Credit Value Adjustment (CVA)

87
Risk Management Report- Pillar 3 – 1Q15
7.5 Capital Adequacy Ratio In compliance with the recommendations of the Basel Committee on Banking Supervision, Bacen established operational limits to be observed by financial institutions, among which the Total Capital Ratio (IB), the Core Capital Ratio (ICP) and the Tier 1 Capital Ratio stand out. The Capital Adequacy Ratio was determined according to the criteria established by CMN Resolutions n. º 4,192/2013 and n. º 4,193/2013, which refer to the calculation of the Referential Equity (RE) and Minimum Reference Equity Required (MRER) in relation to Risk Weighted Assets (RWA), respectively. Bacen has determined that financial institutions must permanently maintain, a Referential Equity (PR) value higher than the MRER value. Complementarily, CMN Resolution 4,193/13 established minimum requirements for core capital (4.5% of RWA) and Tier I (5.5% of RWA until 12.31.2014 and 6%, as of 01.01.2015). The following tables show the evolution of the ratio (IB), Core Capital Index (PCI), Tier I Capital Ratio (ICN1), the RBAN portion and the margin of compatibility of PR:
Table 49 – Basel Ratio (Total Capital Ratio) and PR margin
7.6 Assessment of Sufficiency and Adequacy of Reference Equity (PR)
Banco do Brasil annually prepares/reviews its capital planning considering a minimum time horizon of 36 months and linking the matter to the business and economic guidelines from its Corporate Strategy, aiming to ensure that its capital is sufficient to support, beyond relevant risks, the business growth. The Capital Plan is submitted to technical forums for analysis and approved by the Board of Officers and the Board of Directors. The Capital Plan aims to guarantee that the strategy adopted is appropriate to ensure the solvency ratios of the institution, without compromising the results. For that purpose, projections for PR and RWA are elaborated, incorporating the impacts of Basel III full implementation in Brazil.
1Q15 4Q14 3Q14 2Q14 1Q14
Referential Equity (RE) (R$ thousand) (1) 128,704,988 126,588,485 123,713,046 118,042,870 112,293,282
Tier I (R$ thousand) 91,297,640 89,538,218 88,810,291 84,276,305 80,571,363
Core Capital (R$ thousand) 69,739,142 71,035,684 71,554,347 62,049,999 63,520,399
Minimum Referential Equity Requirements (MRER) (R$ thousand) (2) 88,377,258 86,457,087 84,853,320 91,474,451 89,251,164
Risk Weighted Assets (RWA) (R$ thousand) (3) 803,429,614 785,973,521 771,393,819 831,585,917 811,374,223
Capital Adequacy Ratio 16.02% 16.11% 16.04% 14.19% 13.84%
Tier I Ratio 11.36% 11.39% 11.51% 10.93% 9.69%
Core Capital Ratio 8.68% 9.04% 9.28% 8.04% 7.64%
2,480,502 3,459,809 3,324,429 3,333,193 2,669,626
Compatibility Margin of RE (RE - MRER - RBAN) (R$ thousand) 37,847,229 36,671,589 35,535,297 23,235,225 20,372,491
(2) According to CM N Resolution 4,193/2013, corresponds to the application of the factor "F" to the amount of RWA, with "F" equal to 11%of RWA, from 10.01.2013 to 12.31.2015; 9.875% from RWA01.01.2016 to 12.31.2016, 9.25% of RWA from 01.01.2017 to 31.12.2017; 8.625% of RWA from 01.01.2018 to 31.12.2018, and 8% of the RWA from 01.01.2019.
(3) According to CM N Resolution 4,193/2013, since 01.01.2015 the calculation of RWA applies to institutions of the prudential conglomerate.
Interest rate risk of operations not classified under
negotiable portfolio (RBAN) (R$ thousand)
(1) According to CM N Resolution 4,192/2013.

88
Risk Management Report- Pillar 3 – 1Q15
The monitoring of the Capital Plan is performed monthly by the Capital Forum and reported to the Senior Management. In that monitoring, projections and needs of realignment of the strategy are evaluated, taking into account the amounts realized, regulatory changes and business expectations. In that context, the Bank assesses the projections based on the limits of each indicator and the deadline for any breach, as shown below: Table 50 - Criteria and parameters for classification of the capital condition
Capital Index Period of noncompliance (months)
0 to 6 7 to 12 13 to 18 19 to 24 25 to 30 From 31st month Common Equity Tier 1 Index CRITICAL ALERT
SURVAILLANCE
Tier 1 Index CRITICAL ALERT SURVAILLANCE Basel Prudential Index CRITICAL ALERT SURVAILLANCE
According to table above, the projections indicate that when extrapolating Basel Prudential Index (IBP) - currently at 13% - or another indicator of capital, the Company will have enough time to promote strategic changes to prevent the extrapolation of the same. The capital control conditions are monthly reported by Diris, at the regular meetings of strategic risk committees related to the capital management structure (CERC and CSRG), containing, when necessary, suggestions of capital contingency measures to be adopted.