Embed Size (px)
Citation preview

1 Risk Report 2012Spar Nord Bank
RISK REPORT 2012
2 Risk Report 2012Spar Nord Bank
RISK REPORT
RISK REPORT 2012
Preface
2012 in overview
Risk management
Capital management and solvency need (the ICAAP result)
Basel III - CRD IV
3
4
6
10
15
Credit risk
Market risk
Liquidity risk
Operational risk
17
33
38
41
3 Risk Report 2012Spar Nord Bank
PREFACE
The objective of this report is to present an overview of the Spar Nord Group’s risk and capital management practices.
The report has been prepared in accordance with the legal disclo-sure requirements in the Danish Executive Order on Capital Adequa-cy and describes the various types of balance sheet and off-balance-sheet risks to which the Group is exposed. In addition, the report includes an account of the Group’s risk and capital management and the composition of the capital base and the associated risks.
The rules regarding the capital adequacy requirements of credit in-stitutions are laid down in the EU’s Capital Requirements Directive (CRD). This Directive originates from the Basel II rules, with Pillar 3 setting the rules for the disclosure of capital adequacy and risk management. The Spar Nord Group complies with the Danish Fi-nancial Business Act and the Danish Financial Supervisory Author-ity’s Executive Order on Capital Adequacy, which are both based on the CRD.
The Bank’s disclosure of information on the risk and capital man-agement practices pursuant to Pillar 3 relate to Spar Nord Bank A/S, CVR no. 13737584, and all its fully consolidated subsidiaries (“Spar Nord”). As a result of the decision to phase out the Group’s leasing activities, information about the continuing activities will be included in selected areas. This report for the Spar Nord Group is available at www.sparnord.dk/ir. In addition, the Annual Report of Spar Nord discloses information about the Group’s risks and risk management.
Reporting pursuant to the disclosure requirements in Pillar 3 takes place annually in connection with the presentation of the financial statements, while the solvency need ratio (the ICAAP result) is pub-lished quarterly.
Further disclosures regarding risk, liquidity and financial resources are given in the Spar Nord Annual Report in accordance with re-quirements laid down in the International Financial Reporting Standards, IFRS.
4 Risk Report 2012Spar Nord Bank
2012 IN OVERVIEW
Contrary to widely held expectations at the beginning of the year, last year’s trends in the Danish economy in many ways resembled those of the three previous years. In a year when the Americans went to the ballot polls and Europeans continued their struggle with the debt crisis, developments in the international economy were governed by political events for most of 2012, events that severely tested consumer confidence and confidence in the business sec-tor for long stretches of the year. Thus, for Denmark 2012 was yet another year tainted by slow growth in consumption, investments and employment – and on the upside a low interest level and robust exports.
Globally, central banks continued to stimulate the economy through a lenient monetary policy and low interest rates. Nationalbanken, Denmark’s central bank, was no exception, taking advantage of the strong Danish currency to lower interest rate levels to below the Eu-ropean average. The yield on short Danish government bonds was negative for most of the second half of the year, and the yield on short mortgage-credit bonds closed the year at around 0.5%. De-spite moderately rising jobless rates and general uncertainty, the low interest rates helped keep Danish housing prices relatively stab-le following a decline of about 20% since their peak in 2007.
DANMARK WAS WELL PREPAREDDenmark has fared so well as to make international investors con-sider Denmark a safe haven primarily because, unlike many other European countries, Denmark was well equipped to tackle the crisis that hit the global economy in 2008. Fundamentally, major parts of the Danish economy have healthy balances and structures – as il-lustrated by the fact that Denmark is one of only 12 countries in total still receiving the highest credit rating from all the major credit rating agencies four years after the global financial crisis struck.
That Denmark remains in the throes of the crisis hinges on the fact that, like so many other countries in the pre-crisis years, Denmark experienced a housing and credit bubble that subsequently pushed the economy into a lower gear. Denmark’s most important export markets, Germany, Sweden and Norway, have not been similarly affected, which has helped stabilize the Danish economy. On the downside, major parts of Europe are suffering from a historically deep crisis, which of course dampens optimism in a small, open economy like Denmark’s.
ANOTHER LOST GROWTH YEAR After dropping by 5.7% in 2009, one of the sharpest dips in recent times, Danish economic activity has been largely unchanged since mid-2010. In 2012, two conflicting trends affected the economy. Firstly, consumption, measured in terms of retail sales, continued its downward spiral and is now at its lowest level since 2004, de-spite the fact that more than DKK 25 billion of early retirement al-lowances has been repaid. Secondly, exports have bounced back to pre-crisis levels. At the same time, the level of investment activity in 2012 was slow, and the employment rate continued to decline. Thus, 2012 became yet another lost growth year, or, as Danish Minister for Economic Affairs and the Interior Margrethe Vestager predicted: 2012 will become an annus horribilis.
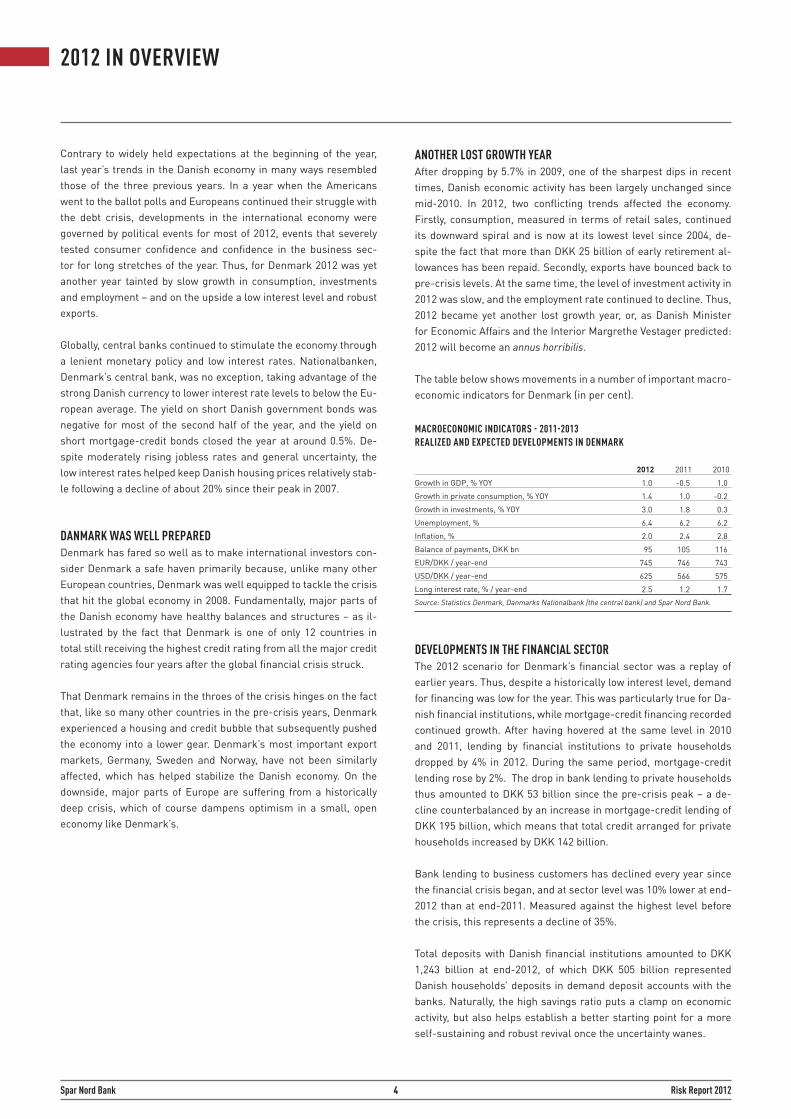
The table below shows movements in a number of important macro-economic indicators for Denmark (in per cent).
DEVELOPMENTS IN THE FINANCIAL SECTOR The 2012 scenario for Denmark’s financial sector was a replay of earlier years. Thus, despite a historically low interest level, demand for financing was low for the year. This was particularly true for Da-nish financial institutions, while mortgage-credit financing recorded continued growth. After having hovered at the same level in 2010 and 2011, lending by financial institutions to private households dropped by 4% in 2012. During the same period, mortgage-credit lending rose by 2%. The drop in bank lending to private households thus amounted to DKK 53 billion since the pre-crisis peak – a de-cline counterbalanced by an increase in mortgage-credit lending of DKK 195 billion, which means that total credit arranged for private households increased by DKK 142 billion.
Bank lending to business customers has declined every year since the financial crisis began, and at sector level was 10% lower at end-2012 than at end-2011. Measured against the highest level before the crisis, this represents a decline of 35%.
Total deposits with Danish financial institutions amounted to DKK 1,243 billion at end-2012, of which DKK 505 billion represented Danish households’ deposits in demand deposit accounts with the banks. Naturally, the high savings ratio puts a clamp on economic activity, but also helps establish a better starting point for a more self-sustaining and robust revival once the uncertainty wanes.
MACROECONOMIC INDICATORS - 2011-2013REALIZED AND EXPECTED DEVELOPMENTS IN DENMARK
1.0 -0.5 1.0
1.4 1.0 -0.2
3.0 1.8 0.3
6.4 6.2 6.2
2.0 2.4 2.8
95 105 116
745 746 743
625 566 575
2.5 1.2 1.7
Growth in GDP, % YOY
Growth in private consumption, % YOY
Growth in investments, % YOY
Unemployment, %
Inflation, %
Balance of payments, DKK bn
EUR/DKK / year-end
USD/DKK / year-end
Long interest rate, % / year-end
201020112012
Source: Statistics Denmark, Danmarks Nationalbank (the central bank) and Spar Nord Bank.
5 Risk Report 2012Spar Nord Bank
2012 IN OVERVIEW
MERGER WITH SPARBANK The year’s single most strategic event for Spar Nord was the merger with Sparbank, announced in September and implemented in No-vember.
The objective of the merger was to create a bank with nationwide coverage and a strong market position in the North, Central and West Jutland regions as well as in a number of major cities elsewhere in Denmark. A bank firmly positioned in terms of capital strength and funding and therefore possessing an excellent platform for taking on the competition in both the retail and business customer segments.
Moreover, the merger is intended to exploit the potential for enhanc-ing efficiency and boosting earning capacity expected to come from serving a higher number of customers on the same production and support platform. Finally, a key element in the process has been the fact that this merger is between two banks sharing many features in terms of customer focus, products, IT platform, corporate culture and values. The merger means that Spar Nord has taken over 23 branches serving about 60,000 customers, with total loans and ad-vances of DKK 6.5 billion and total deposits of DKK 8.6 billion.
LIQUIDITYAfter a cumbersome 2011, 2012 proved a slightly brighter year in the international funding market, partly due to a substantial increase in the number of long-term unsecured funding issuances.
In terms of liquidity, 2012 also proved somewhat brighter than the previous year for Spar Nord. Thanks to the phase-out of the leasing activities initiated in 2011 and the rise in deposit volume, around midyear the Bank’s excess coverage on the liquidity side had al-ready grown large enough to make the Bank independent of funding from the international capital markets. For this reason, Manage-ment chose in May to terminate the Bank’s rating cooperation with Moody’s.
At the end of 2012, Spar Nord had an excess coverage relative to the Bank’s strategic target of DKK 14.8 billion, which represents an improvement of DKK 10.9 billion since end-2011.
CREDIT RATINGThe Spar Nord Group’s total loans, advances and guarantees before offsetting of impairment and discount on exposures taken over from Sparbank amounted to DKK 47.6 billion at end-2012 compared with DKK 43.7 billion at end-2011. Retail customers account for 36.5% of total loans and guarantees, with business customers accounting for 63.5%.
Loans, advances and guarantees relating to continuing activities (excl. leasing activities) amounted to DKK 43.3 billion at end-2012 compared to DKK 36.4 billion at end-2011. Of this amount, DKK 9.8 billion of loans, advances and guarantees has been taken over in connection with the Sparbank merger. In total, 40.0% of loans, ad-vances and guarantees in the continuing activities are attributable to retail customers and 60.0% to business customers.
The bleak economic figures and the more specific guidelines issued by the Danish Financial Supervisory Authority impacted developments in loan impairment losses in 2012. Thus, the overall impact on the consolidated operating profit amounted to DKK 661.8 million, equal to 1.5% of average loans, advances and guarantees. Impairment losses on the continuing activities amounted to DKK 593.6 million.
CAPITAL At end-2012, Spar Nord’s solvency need ratio was calculated at 10.0%, which is 1.2 percentage points up on end-2011. At end-2012, the solvency ratio stood at 15.5%, equal to a capital excess coverage of 5.5 percentage points, corresponding to DKK 2.5 billion. One of the factors giving rise to the increase on 2011 is that at end-2012 Spar Nord switched to the so-called 8+ method, see the guidelines issued by the Danish Financial Supervisory Authority regarding this issue.
During the year under review, Spar Nord completed capital increas-es with total net proceeds of DKK 1,099 million, floated a subordi-nated loan in the amount of DKK 400 million, and redeemed hybrid capital issued by Sparbank in the amount of DKK 480 million, and subordinated loans amounting to DKK 608 million at the loans’ first maturity dates.
Spar Nord’s Common Equity (Tier 1) ratio stood at 12.1% at end-2012.
6 Risk Report 2012Spar Nord Bank
RISK MANAGEMENT
Risk assumption is pivotal to banking, and risk management is an important focus area across the Spar Nord organization. The vari-ous types of risk that the Group assumes and the initiatives taken to manage and monitor developments are reviewed in the following sections.
The most important categories of risks are as follows:
Credit risk: The risk that results from borrowers or other coun-terparties defaulting on their payment obligations, including the risks attaching to customers encountering financial difficulties, large facilities, concentration risks and risks attaching to grant-ed, unutilized credit lines. Credit risks also include settlement and counterparty risks. Market risk: Market risk is an umbrella heading for the risk of loss caused by fluctuations in exchange rates or prices on finan-cial instruments. Liquidity risk: The risk of loss that results because the Group’s funding costs increase, the Group is cut off from entering into new transactions on account of unavailable funding, or because the Group ultimately becomes unable to meet its obligations as and when they fall due on account of lack of funding. Operational risk: The risk of loss that results from deficient, inexpedient or erroneous internal procedures, human or sys-tem errors and similar issues, or losses incurred as a result of external events, including legal risks, strategic risks and image risks.
RISK PROFILE The risks assumed by Spar Nord and its proclivity for assuming risks within the individual risk groups are rooted in the Group’s general strategic goals, set by the Board of Directors. As a supplement, specific risk policies have been introduced, laying down the general guidelines for handling and managing risks. These policies are re-viewed and approved by the Board of Directors at least once a year.
The goal is to ensure coherence between the Bank’s vision, mission and strategy, and that at all times the Bank has a risk profile that bears an appropriate relation to its capital base.
In light of the general risk policies and the risk profile, specific in-structions have been prepared for the most important areas of risk.
DELEGATION OF RESPONSIBILITY The Group has a two-tier management structure with an Executive Board and a Board of Directors. The Board of Directors has formu-lated a set of written guidelines governing the Executive Board’s actions in the risk area, clearly defining the areas of responsibil-ity for each level of management. The Board of Directors lays down general policies, while the Executive Board is responsible for the day-to-day management of the Group.
The Board of Directors is responsible for ensuring that the Group has an appropriate organization and that risk policies and limits are established for all important types of risk. In addition, all major credit facilities must be submitted to the Board of Directors for ap-proval. The Board of Directors also makes decisions regarding gen-eral principles for handling and monitoring risks. Regular reporting to the Board of Directors is undertaken with a view to enabling the Board of Directors to check whether the total risk policies and the pre-defined limits are complied with.
The Board of Directors has set up an audit committee charged with monitoring and controlling accounting and auditing matters and undertaking the preparatory work concerning the Board of Direc-tors’ processing of accounting and auditing issues. The committee is composed of three members, one of whom is a member with special expertise in auditing and accounting matters, as required by statute, and who is also impartial.
The Board of Directors oversees the activities of the Group’s Internal Audit Department, which reports to both the Board of Directors and the Executive Board. The Internal Audit Department bases its activi-ties on the annual plan adopted by the Board of Directors. These in-clude test examinations of business procedures and internal control systems in key areas subject to risk, including in connection with preparing the financial statements.
The Group’s independent auditors are elected at the Annual General Meeting for one year at a time. The focus of the auditing team is dis-cussed once a year between the Board of Directors and the auditors based on the recommendations of the audit committee.
The Executive Board is responsible for the day-to-day manage-ment of the Group. To this end, the Executive Board issues specific instructions for the Group’s risks and its risk management proce-dures. The Executive Board reports regularly to the Board of Direc-tors on the Group’s risk exposure.
The Executive Board has appointed a number of committees and working parties that contribute to the Group’s risk governance in specific areas, and which prepare cases and themes for processing by the Executive Board and Board of Directors.
•
•
•
•
7 Risk Report 2012Spar Nord Bank
RISK MANAGEMENT
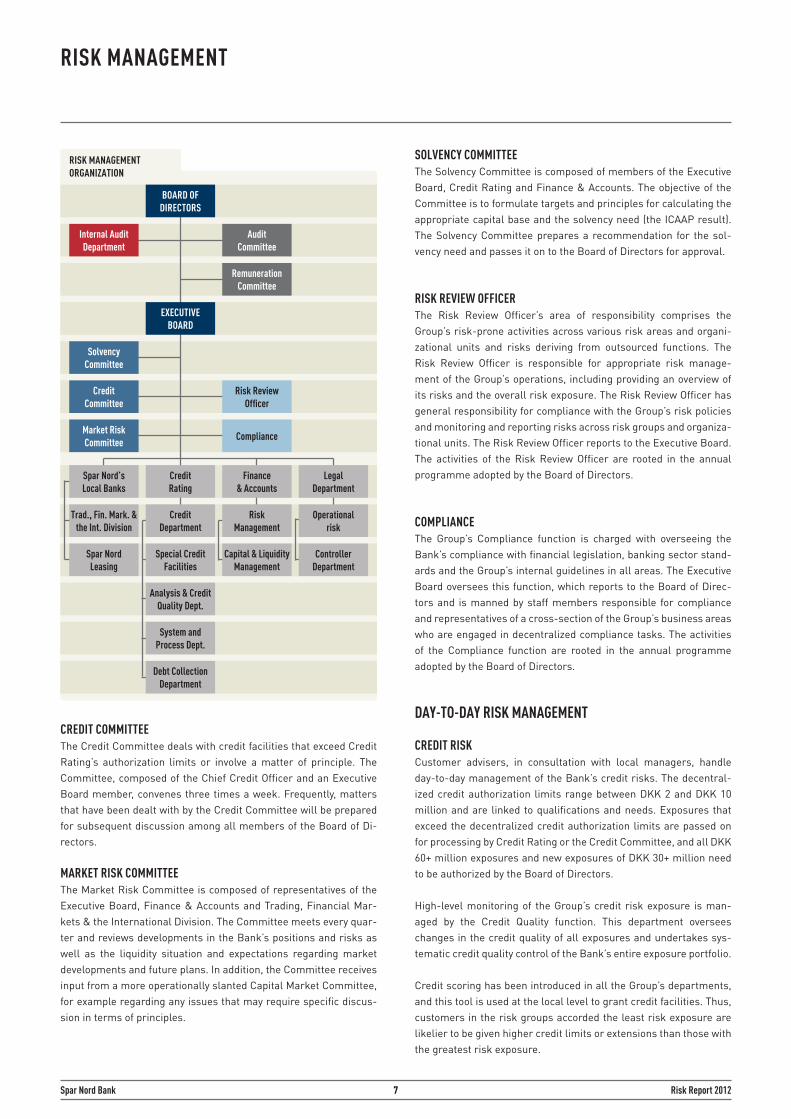
CREDIT COMMITTEEThe Credit Committee deals with credit facilities that exceed Credit Rating’s authorization limits or involve a matter of principle. The Committee, composed of the Chief Credit Officer and an Executive Board member, convenes three times a week. Frequently, matters that have been dealt with by the Credit Committee will be prepared for subsequent discussion among all members of the Board of Di-rectors.
MARKET RISK COMMITTEE The Market Risk Committee is composed of representatives of the Executive Board, Finance & Accounts and Trading, Financial Mar-kets & the International Division. The Committee meets every quar-ter and reviews developments in the Bank’s positions and risks as well as the liquidity situation and expectations regarding market developments and future plans. In addition, the Committee receives input from a more operationally slanted Capital Market Committee, for example regarding any issues that may require specific discus-sion in terms of principles.
SOLVENCY COMMITTEE The Solvency Committee is composed of members of the Executive Board, Credit Rating and Finance & Accounts. The objective of the Committee is to formulate targets and principles for calculating the appropriate capital base and the solvency need (the ICAAP result). The Solvency Committee prepares a recommendation for the sol-vency need and passes it on to the Board of Directors for approval.
RISK REVIEW OFFICER The Risk Review Officer’s area of responsibility comprises the Group’s risk-prone activities across various risk areas and organi-zational units and risks deriving from outsourced functions. The Risk Review Officer is responsible for appropriate risk manage-ment of the Group’s operations, including providing an overview of its risks and the overall risk exposure. The Risk Review Officer has general responsibility for compliance with the Group’s risk policies and monitoring and reporting risks across risk groups and organiza-tional units. The Risk Review Officer reports to the Executive Board. The activities of the Risk Review Officer are rooted in the annual programme adopted by the Board of Directors.
COMPLIANCEThe Group’s Compliance function is charged with overseeing the Bank’s compliance with financial legislation, banking sector stand-ards and the Group’s internal guidelines in all areas. The Executive Board oversees this function, which reports to the Board of Direc-tors and is manned by staff members responsible for compliance and representatives of a cross-section of the Group’s business areas who are engaged in decentralized compliance tasks. The activities of the Compliance function are rooted in the annual programme adopted by the Board of Directors.
DAY-TO-DAY RISK MANAGEMENT
CREDIT RISK Customer advisers, in consultation with local managers, handle day-to-day management of the Bank’s credit risks. The decentral-ized credit authorization limits range between DKK 2 and DKK 10 million and are linked to qualifications and needs. Exposures that exceed the decentralized credit authorization limits are passed on for processing by Credit Rating or the Credit Committee, and all DKK 60+ million exposures and new exposures of DKK 30+ million need to be authorized by the Board of Directors.
High-level monitoring of the Group’s credit risk exposure is man-aged by the Credit Quality function. This department oversees changes in the credit quality of all exposures and undertakes sys-tematic credit quality control of the Bank’s entire exposure portfolio. Credit scoring has been introduced in all the Group’s departments, and this tool is used at the local level to grant credit facilities. Thus, customers in the risk groups accorded the least risk exposure are likelier to be given higher credit limits or extensions than those with the greatest risk exposure.
BOARD OF DIRECTORS
EXECUTIVE BOARD
Spar Nord’sLocal Banks
Trad., Fin. Mark. & the Int. Division
Credit Rating
CreditDepartment
Internal Audit Department
Audit Committee
RISK MANAGEMENT ORGANIZATION
Remuneration Committee
SolvencyCommittee
Special Credit Facilities
CreditCommittee
Risk Review Officer
Finance & Accounts
LegalDepartment
Analysis & Credit Quality Dept.
System and Process Dept.
Market RiskCommittee
Compliance
Risk Management
Spar NordLeasing
Capital & Liquidity Management
Operationalrisk
ControllerDepartment
Debt Collection Department
8 Risk Report 2012Spar Nord Bank
RISK MANAGEMENT
Risk and settlement lines to financial counterparties are author-ized by the Credit Committee. Exposures that exceed the authority of the Credit Committee are authorized by the Board of Directors. The credit organization is in charge of overall monitoring of lines, and all lines are assessed at least once a year, and in doing so the point of departure will be the financial statements of the financial counterparty.
MARKET RISK Spar Nord’s Board of Directors lays down the overall policies, frameworks and principles, and the Finance & Accounts Depart-ment is responsible for monitoring and checking that the Group’s market risk does not exceed the boundaries of the instruction limits.
For its management of market risks, the Bank has established a three-tier instruction hierarchy. The first level, the Board of Direc-tors, defines the Group’s market risk framework. At the second tier-level, the Executive Board delegates limits to the other units of the Group, with Trading, Financial Markets & the International Division being the distinctly largest unit. At the third and last tier, the respon-sible officers at Trading, Financial Markets & the International Divi-sion are granted the limits within which they may operate.
LIQUIDITY RISK Liquidity management is divided into short-term and long-term li-quidity management. Management of short-term liquidity is placed with Trading, Financial Markets & the International Division, while management of long-term liquidity is the responsibility of the Fi-nance & Accounts Department.
Managing the Group’s general liquidity is subject to a number of control mechanisms. A fixed target for the day-to-day liquidity buffer coupled with a stress test is used for determining short-term liquid-ity requirements. Long-term liquidity is managed by focusing on strategic liquidity and using stress tests.
OPERATIONAL RISK Operational risks are managed via business procedures and other policy manuals, IT systems and control measures. Responsibility for risk management in this connection lies with the responsible units. In connection with projects, a risk assessment report must be prepared, specifying risks, potential consequences and initiatives to limit such risks. Spar Nord’s security policy, including IT security policy, is reviewed annually and approved by the Board of Directors.
CONTINGENCY PLANS The Group has contingency plans for dealing with critical areas like capital and liquidity. In addition, the Group has contingency plans for dealing with situations involving long-term IT outage.
REPORTINGSubstantial resources are deployed to ensure appropriate risk re-porting on an ongoing basis, including follow-up on legislative and managerial risk frameworks. Reporting to the Bank’s Management and relevant stakeholders is performed according to fixed guide-lines.
The Board of Directors receives continual reports covering all im-portant risk areas.
9 Risk Report 2012Spar Nord Bank
ANNUAL REPORTING
The Executive Board’s risk review An overall risk review of the Bank’s risk-prone activities across risk areas and organizational units. The risk review must be the basis for and support the Board of Director’s overall manage-ment of the company, including in connection with the Board of Director’s definition of the Bank’s risk appetite, approval of poli-cies and guidelines and in connection with the Bank’s organiza-tion and use of IT systems.
Risk policies Review of the Bank’s risk policies in the individual risk areas (credit risk, market risk, etc.) and an assessment of the need for making adjustments.
Solvency need (the ICAAP result) Assessment of the Group’s risk profile and calculation of the adequate capital base. Extended version of the report prepared quarterly, including a process review and assessment of param-eters used.
Operational risk Review of the Group’s operational risks and measures to coun-ter such risks.
Asset review Detailed review and analysis of the Bank’s assets, including a specific and detailed review of individual exposures and an analysis and assessment of future trends for important lines of business or asset areas.
Statement from Compliance Statement regarding the activities of the Compliance function and the Bank’s general compliance.
Budget Business and strategic risks are highlighted in connection with the preparation of the Bank’s budget.
QUARTERLY REPORTING
Solvency need (the ICAAP result) Assessment of the risk profile and calculation of the adequate capital base. The report contains conclusions reached in the Bank’s stress test and an assessment of the capital needs in respect of the individual risks.
Credit quality report Detailed analysis of trends in exposures, impairment and losses, including portfolio analyses broken down by rating cat-egories, volume, geography, etc. Follow-up on all unauthorized overdrafts above DKK 1 million (monthly).
Credit-weak exposures Report on all credit-weak exposures larger than DKK 25 million, reviewed individually.
Large exposures Overview of exposures amounting to 10% or more of the Bank’s capital base and the sum of such exposures, and the percentage that this sum represents of the capital base.
Market risk Review and analysis of the Bank’s current interest, equity and foreign-exchange risks, including the historical trend in utiliza-tion of the framework and instructions fixed by the Board of Di-rectors (monthly).
Liquidity risk Review and analysis of the Bank’s short- and long-term liquid-ity risks, including the Bank’s liquidity stress test and trends in the historical utilization of the framework and instructions laid down by legislation and by the Board of Directors (monthly).
Capital In-depth analysis of the Bank’s capital situation, including de-velopments in risk-weighted items and the capital base.
IT risk Review and follow-up on the Bank’s IT security and stability on the Bank’s IT systems, including follow-up on outsourced devel-opment projects.
Reporting from the Risk Review Officer Follow-up on the Bank’s risk appetite, and annual plan for the Risk Review Officer.
Reporting from Compliance Forecast Review of the most significant compliance controls and status on ongoing tasks.
Forecast The forecast is updated regularly with a view to ensuring ongo-ing follow-up on the business risks and projections for profits, balance sheet, liquidity and capital matters.
RISK MANAGEMENT
10 Risk Report 2012Spar Nord Bank
CAPITAL MANAGEMENT AND SOLVENCY NEED (THE ICAAP RESULT)
CAPITAL MANAGEMENT AND SOLVENCY NEED (THE ICAAP RESULT) CAPITAL GOAL Spar Nord is licensed to carry on banking and consequently subject to a specific capital requirement based on the Danish capital ad-equacy rules, which govern both the Parent Company and the Group.
Spar Nord’s capital management system is intended to manage the Group’s total capital relative to the risk profile policy pursued by the Group. The Group’s capital targets are intended to ensure that it will at all times live up to the capital adequacy rules that require a minimum capital ratio of 8% of the calculated risks in the so-called Pillar 1 defined in Basel II, plus any additional capital requirements intended to cover all relevant risks, including risks not sufficiently covered under Pillar 1. This includes for instance business risks and special credit risks.
The Group has adopted a number of policies and instructions in-tended to ensure that the Group will at all times have adequate capital and liquidity available to comply with statutory requirements and to support future activities and growth. Part of the objective of instructions and the goal-setting process is to enable the Bank to withstand cyclical downturns, unexpectedly heavy credit losses and major adverse changes in the value of its market-risk-related posi-tions.
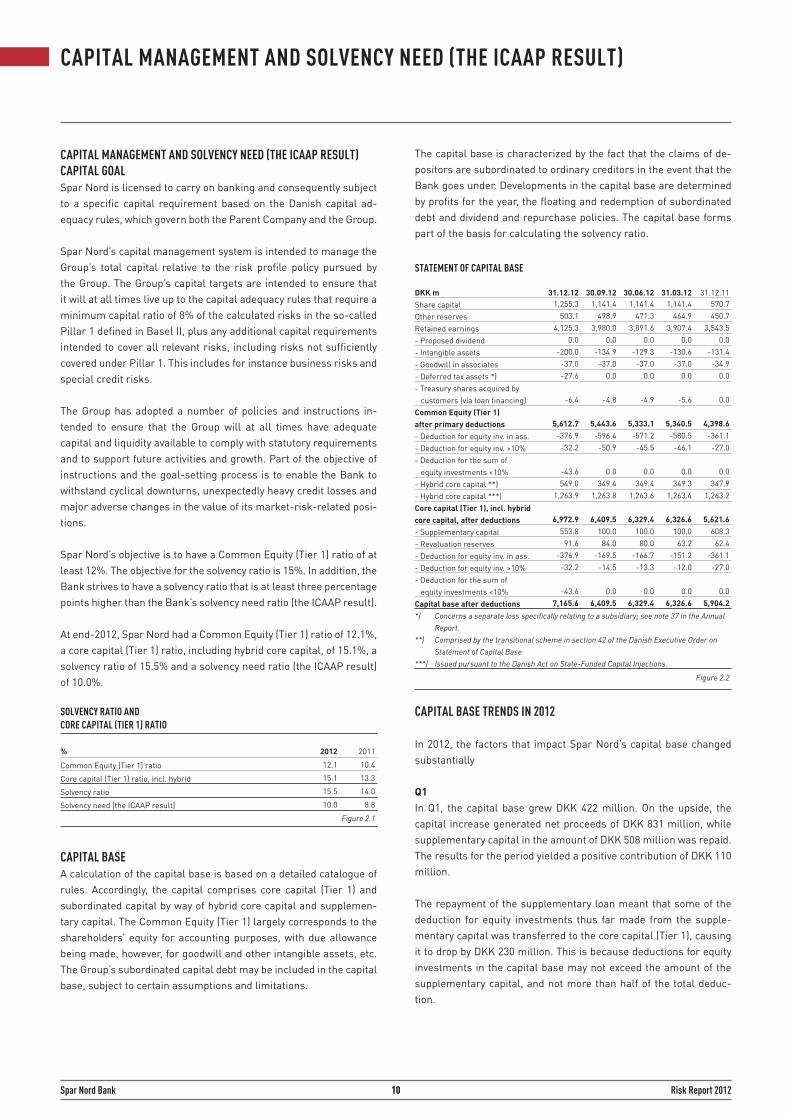
Spar Nord’s objective is to have a Common Equity (Tier 1) ratio of at least 12%. The objective for the solvency ratio is 15%. In addition, the Bank strives to have a solvency ratio that is at least three percentage points higher than the Bank’s solvency need ratio (the ICAAP result).
At end-2012, Spar Nord had a Common Equity (Tier 1) ratio of 12.1%, a core capital (Tier 1) ratio, including hybrid core capital, of 15.1%, a solvency ratio of 15.5% and a solvency need ratio (the ICAAP result) of 10.0%.
CAPITAL BASE A calculation of the capital base is based on a detailed catalogue of rules. Accordingly, the capital comprises core capital (Tier 1) and subordinated capital by way of hybrid core capital and supplemen-tary capital. The Common Equity (Tier 1) largely corresponds to the shareholders’ equity for accounting purposes, with due allowance being made, however, for goodwill and other intangible assets, etc. The Group’s subordinated capital debt may be included in the capital base, subject to certain assumptions and limitations.
The capital base is characterized by the fact that the claims of de-positors are subordinated to ordinary creditors in the event that the Bank goes under. Developments in the capital base are determined by profits for the year, the floating and redemption of subordinated debt and dividend and repurchase policies. The capital base forms part of the basis for calculating the solvency ratio.
CAPITAL BASE TRENDS IN 2012
In 2012, the factors that impact Spar Nord’s capital base changed substantially
Q1In Q1, the capital base grew DKK 422 million. On the upside, the capital increase generated net proceeds of DKK 831 million, while supplementary capital in the amount of DKK 508 million was repaid. The results for the period yielded a positive contribution of DKK 110 million.
The repayment of the supplementary loan meant that some of the deduction for equity investments thus far made from the supple-mentary capital was transferred to the core capital (Tier 1), causing it to drop by DKK 230 million. This is because deductions for equity investments in the capital base may not exceed the amount of the supplementary capital, and not more than half of the total deduc-tion.
SOLVENCY RATIO AND CORE CAPITAL (TIER 1) RATIO
Common Equity (Tier 1) ratio
Core capital (Tier 1) ratio, incl. hybrid
Solvency ratio
Solvency need (the ICAAP result)
20112012
12.1 10.4
15.1 13.3
15.5 14.0
10.0 8.8
%
Figure 2.1
STATEMENT OF CAPITAL BASE
Share capitalOther reservesRetained earnings- Proposed dividend- Intangible assets- Goodwill in associates- Deferred tax assets *)- Treasury shares acquired by customers (via loan financing)Common Equity (Tier 1) after primary deductions- Deduction for equity inv. in ass.- Deduction for equity inv. >10%- Deduction for the sum of equity investments <10%- Hybrid core capital **)- Hybrid core capital ***)Core capital (Tier 1), incl. hybrid core capital, after deductions- Supplementary capital- Revaluation reserves- Deduction for equity inv. in ass.- Deduction for equity inv. >10%- Deduction for the sum of equity investments <10%Capital base after deductions*) Concerns a separate loss specifically relating to a subsidiary; see note 37 in the Annual Report. **) Comprised by the transitional scheme in section 42 of the Danish Executive Order on Statement of Capital Base ***) Issued pursuant to the Danish Act on State-Funded Capital Injections.
31.12.1131.03.12 1,255.3 1,141.4 1,141.4 1,141.4 570.7 503.1 498.9 471.3 464.9 450.7 4,125.3 3,980.0 3,891.6 3,907.4 3,543.5 0.0 0.0 0.0 0.0 0.0 -200.0 -134.9 -129.3 -130.6 -131.4 -37.0 -37.0 -37.0 -37.0 -34.9 -27.6 0.0 0.0 0.0 0.0
-6.4 -4.8 -4.9 -5.6 0.0
5,612.7 5,443.6 5,333.1 5,340.5 4,398.6 -376.9 -596.4 -571.2 -580.5 -361.1 -32.2 -50.9 -45.5 -46.1 -27.0
-43.6 0.0 0.0 0.0 0.0 549.0 349.4 349.4 349.3 347.9 1,263.9 1,263.8 1,263.6 1,263.4 1,263.2
6,972.9 6,409.5 6,329.4 6,326.6 5,621.6 553.8 100.0 100.0 100.0 608.3 91.6 84.0 80.0 63.2 62.4 -376.9 -169.5 -166.7 -151.2 -361.1 -32.2 -14.5 -13.3 -12.0 -27.0
-43.6 0.0 0.0 0.0 0.0 7,165.6 6,409.5 6,329.4 6,326.6 5,904.2
DKK m
Figure 2.2
30.06.1230.09.1231.12.12
11 Risk Report 2012Spar Nord Bank
CAPITAL MANAGEMENT AND SOLVENCY NEED (THE ICAAP RESULT)
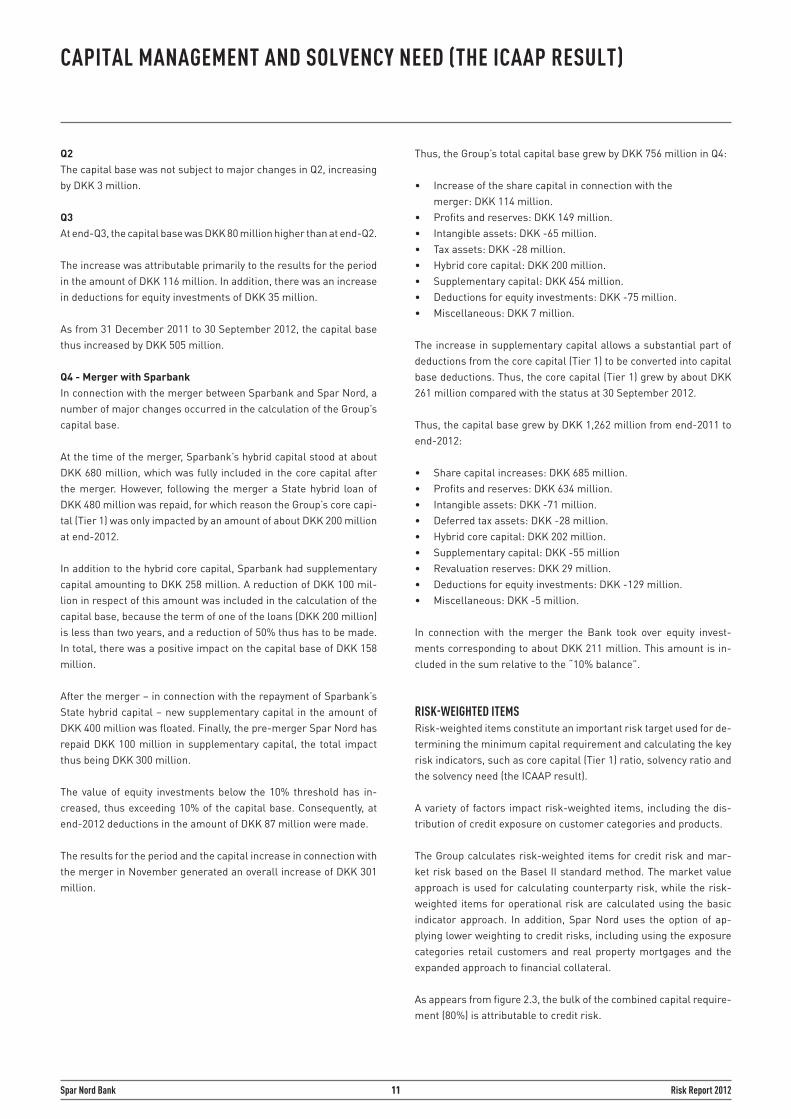
Q2The capital base was not subject to major changes in Q2, increasing by DKK 3 million.
Q3At end-Q3, the capital base was DKK 80 million higher than at end-Q2. The increase was attributable primarily to the results for the period in the amount of DKK 116 million. In addition, there was an increase in deductions for equity investments of DKK 35 million.
As from 31 December 2011 to 30 September 2012, the capital base thus increased by DKK 505 million.
Q4 - Merger with Sparbank In connection with the merger between Sparbank and Spar Nord, a number of major changes occurred in the calculation of the Group’s capital base.
At the time of the merger, Sparbank’s hybrid capital stood at about DKK 680 million, which was fully included in the core capital after the merger. However, following the merger a State hybrid loan of DKK 480 million was repaid, for which reason the Group’s core capi-tal (Tier 1) was only impacted by an amount of about DKK 200 million at end-2012.
In addition to the hybrid core capital, Sparbank had supplementary capital amounting to DKK 258 million. A reduction of DKK 100 mil-lion in respect of this amount was included in the calculation of the capital base, because the term of one of the loans (DKK 200 million) is less than two years, and a reduction of 50% thus has to be made. In total, there was a positive impact on the capital base of DKK 158 million.
After the merger – in connection with the repayment of Sparbank’s State hybrid capital – new supplementary capital in the amount of DKK 400 million was floated. Finally, the pre-merger Spar Nord has repaid DKK 100 million in supplementary capital, the total impact thus being DKK 300 million.
The value of equity investments below the 10% threshold has in-creased, thus exceeding 10% of the capital base. Consequently, at end-2012 deductions in the amount of DKK 87 million were made.
The results for the period and the capital increase in connection with the merger in November generated an overall increase of DKK 301 million.
Thus, the Group’s total capital base grew by DKK 756 million in Q4:
• Increase of the share capital in connection with the merger: DKK 114 million. • Profits and reserves: DKK 149 million. • Intangible assets: DKK -65 million. • Tax assets: DKK -28 million. • Hybrid core capital: DKK 200 million. • Supplementary capital: DKK 454 million. • Deductions for equity investments: DKK -75 million. • Miscellaneous: DKK 7 million.
The increase in supplementary capital allows a substantial part of deductions from the core capital (Tier 1) to be converted into capital base deductions. Thus, the core capital (Tier 1) grew by about DKK 261 million compared with the status at 30 September 2012.
Thus, the capital base grew by DKK 1,262 million from end-2011 to end-2012: • Share capital increases: DKK 685 million. • Profits and reserves: DKK 634 million. • Intangible assets: DKK -71 million. • Deferred tax assets: DKK -28 million. • Hybrid core capital: DKK 202 million. • Supplementary capital: DKK -55 million • Revaluation reserves: DKK 29 million. • Deductions for equity investments: DKK -129 million. • Miscellaneous: DKK -5 million.
In connection with the merger the Bank took over equity invest-ments corresponding to about DKK 211 million. This amount is in-cluded in the sum relative to the “10% balance”.
RISK-WEIGHTED ITEMS Risk-weighted items constitute an important risk target used for de-termining the minimum capital requirement and calculating the key risk indicators, such as core capital (Tier 1) ratio, solvency ratio and the solvency need (the ICAAP result).
A variety of factors impact risk-weighted items, including the dis-tribution of credit exposure on customer categories and products.
The Group calculates risk-weighted items for credit risk and mar-ket risk based on the Basel II standard method. The market value approach is used for calculating counterparty risk, while the risk-weighted items for operational risk are calculated using the basic indicator approach. In addition, Spar Nord uses the option of ap-plying lower weighting to credit risks, including using the exposure categories retail customers and real property mortgages and the expanded approach to financial collateral.
As appears from figure 2.3, the bulk of the combined capital require-ment (80%) is attributable to credit risk.
12 Risk Report 2012Spar Nord Bank
CAPITAL MANAGEMENT AND SOLVENCY NEED (THE ICAAP RESULT)
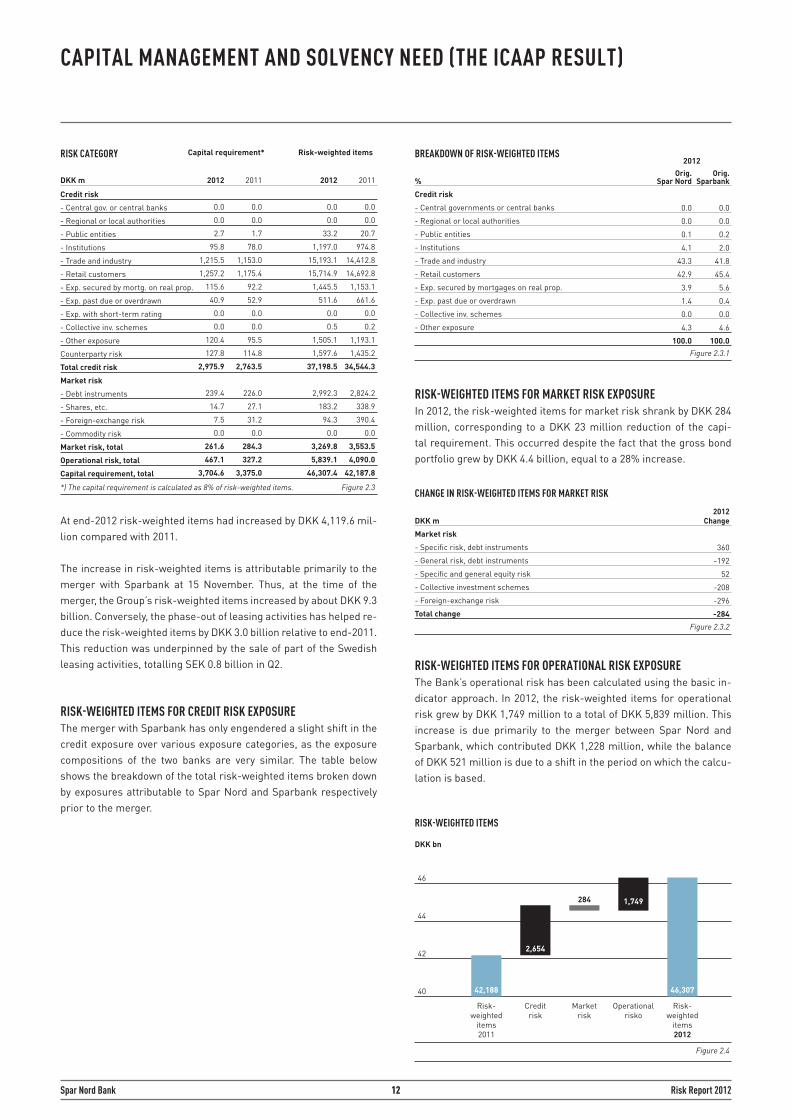
At end-2012 risk-weighted items had increased by DKK 4,119.6 mil-lion compared with 2011.
The increase in risk-weighted items is attributable primarily to the merger with Sparbank at 15 November. Thus, at the time of the merger, the Group’s risk-weighted items increased by about DKK 9.3 billion. Conversely, the phase-out of leasing activities has helped re-duce the risk-weighted items by DKK 3.0 billion relative to end-2011. This reduction was underpinned by the sale of part of the Swedish leasing activities, totalling SEK 0.8 billion in Q2.
RISK-WEIGHTED ITEMS FOR CREDIT RISK EXPOSURE The merger with Sparbank has only engendered a slight shift in the credit exposure over various exposure categories, as the exposure compositions of the two banks are very similar. The table below shows the breakdown of the total risk-weighted items broken down by exposures attributable to Spar Nord and Sparbank respectively prior to the merger.
RISK-WEIGHTED ITEMS FOR MARKET RISK EXPOSURE In 2012, the risk-weighted items for market risk shrank by DKK 284 million, corresponding to a DKK 23 million reduction of the capi-tal requirement. This occurred despite the fact that the gross bond portfolio grew by DKK 4.4 billion, equal to a 28% increase.
RISK-WEIGHTED ITEMS FOR OPERATIONAL RISK EXPOSURE The Bank’s operational risk has been calculated using the basic in-dicator approach. In 2012, the risk-weighted items for operational risk grew by DKK 1,749 million to a total of DKK 5,839 million. This increase is due primarily to the merger between Spar Nord and Sparbank, which contributed DKK 1,228 million, while the balance of DKK 521 million is due to a shift in the period on which the calcu-lation is based.
RISK CATEGORY
Credit risk
- Central gov. or central banks
- Regional or local authorities
- Public entities
- Institutions
- Trade and industry
- Retail customers
- Exp. secured by mortg. on real prop.
- Exp. past due or overdrawn
- Exp. with short-term rating
- Collective inv. schemes
- Other exposure
Counterparty risk
Total credit risk
Market risk
- Debt instruments
- Shares, etc.
- Foreign-exchange risk
- Commodity risk
Market risk, total
Operational risk, total
Capital requirement, total
20112012DKK m
0.0 0.0 0.0 0.0
0.0 0.0 0.0 0.0
2.7 1.7 33.2 20.7
95.8 78.0 1,197.0 974.8
1,215.5 1,153.0 15,193.1 14,412.8
1,257.2 1,175.4 15,714.9 14,692.8
115.6 92.2 1,445.5 1,153.1
40.9 52.9 511.6 661.6
0.0 0.0 0.0 0.0
0.0 0.0 0.5 0.2
120.4 95.5 1,505.1 1,193.1
127.8 114.8 1,597.6 1,435.2
2,975.9 2,763.5 37,198.5 34,544.3
239.4 226.0 2,992.3 2,824.2
14.7 27.1 183.2 338.9
7.5 31.2 94.3 390.4
0.0 0.0 0.0 0.0
261.6 284.3 3,269.8 3,553.5
467.1 327.2 5,839.1 4,090.0
3,704.6 3,375.0 46,307.4 42,187.8
20112012
Capital requirement* Risk-weighted items
*) The capital requirement is calculated as 8% of risk-weighted items. Figure 2.3
BREAKDOWN OF RISK-WEIGHTED ITEMS
Credit risk
- Central governments or central banks
- Regional or local authorities
- Public entities
- Institutions
- Trade and industry
- Retail customers
- Exp. secured by mortgages on real prop.
- Exp. past due or overdrawn
- Collective inv. schemes
- Other exposure
Orig.Sparbank
Orig.Spar Nord%
0.0 0.0
0.0 0.0
0.1 0.2
4.1 2.0
43.3 41.8
42.9 45.4
3.9 5.6
1.4 0.4
0.0 0.0
4.3 4.6
100.0 100.0
2012
Figure 2.3.1
CHANGE IN RISK-WEIGHTED ITEMS FOR MARKET RISK
Market risk
- Specific risk, debt instruments
- General risk, debt instruments
- Specific and general equity risk
- Collective investment schemes
- Foreign-exchange risk
Total change
2012ChangeDKK m
360
-192
52
-208
-296
-284
Figure 2.3.2
RISK-WEIGHTED ITEMS
42,188
2,654
284
46,307
DKK bn
46
44
42
40
Risk-weighted
items 2011
Credit risk
Market risk
Operational risko
Risk-weighted
items 2012
Figure 2.4
1,749
13 Risk Report 2012Spar Nord Bank
CAPITAL MANAGEMENT AND SOLVENCY NEED (THE ICAAP RESULT)
SOLVENCY NEED (THE ICAAP RESULT) Towards the end of 2012, amendments to the Danish Financial Busi-ness Act were introduced, the effect being that the solvency need ratio (the ICAAP result) (the Pillar 2 capital requirement) was rede-fined so as to serve as an add-on to the 8% requirement. To follow up on the amendments, the Danish Financial Supervisory Authority is-sued new guidelines specifying the requirements as to an adequate capital base and the solvency need ratio (the ICAAP Result), based on the 8+ method.
The 8+ method is based on the statutory minimum requirement of 8.0% of the risk-weighted items (Pillar 1) plus adds-on for risks and matters not fully reflected in the calculation of risk-weighted items. In other words, ordinary risks are assumed to be covered by the 8% requirement, and, consequently a position has to be taken as to the extent to which an institution has additional risks that necessitate an add-on to the solvency need ratio (the ICAAP result) (Pillar 2).
In the guidelines issued by the Danish Financial Supervisory Author-ity, benchmarks have been introduced within a number risk areas determining when the Authority basically finds that Pillar 1 is in-sufficient, and that an add-on to the solvency need ratio (the ICAAP result) is needed. In addition, to the extent possible methods have been introduced for calculating the amount of the add-on within the individual risk areas.
Based on the guidelines issued by the Danish Financial Supervisory Authority, the Board of Directors determines the Bank’s adequate capital base and solvency need after recommendation from the Sol-vency Committee.
In addition, the Board of Directors discusses and approves the cal-culation method for the Bank’s solvency need once a year.
The reviews are based on recommendations prepared by the Bank’s Solvency Committee (the Executive Board, Credit Rating and Fi-nance & Accounts).
The Bank’s calculation method follows the guidelines issued by the Danish Financial Supervisory Authority and is based on an assess-ment of the Bank’s risks within the following seven key areas, of which the first six are directly addressed in the guidelines:
1. Earnings 2. Lending growth 3. Credit risks - Credit risk attaching to large customers in financial trouble - Concentration risk: Individual customers - Concentration risks: Lines of business - Concentration, collateral - Concentration, geography - Concentration, retail/business - Other credit risks 4. Market risks - Interest-rate risk - Equity market risk - Foreign-exchange risk 5. Liquidity risks 6 Operational risks 7. Other risks - The Bank’s business profile - Capital procurement - Strategic risks - Reputation risks - Properties - Other
The impact of the individual areas on the capital need has been calculated directly using the methods designated by the Danish Fi-nancial Supervisory Authority in its guidelines, and by making sup-plementary calculations. Management has made an estimate in a few risk areas.
In the Bank’s opinion, the risk factors included in the model cover all the risk areas required by legislation to be taken into consideration by Management in determining the solvency need and the risks that the Management finds the Bank has assumed.
At end-2012, the adequate capital base has been calculated at DKK 4.6. billion, thus representing an increase of DKK 0.9 billion rela-tive to the calculation at end-2011, when the calculation was based on the so-called probability model. The increase is attributable pri-marily to the merger with Sparbank and the consequent increase in business volume. To this should be added that the new 8+ calcula-tion method is assessed to have resulted in a slight increase in the capital need.
The Group’s risk-weighted items rose from DKK 42.2 billion at end-2011 to DKK 46.3 billion at end-2012, for which reason the solvency need ratio rose from 8.8% at end-2011 to 10.0% at end-2012.
14 Risk Report 2012Spar Nord Bank
CAPITAL MANAGEMENT AND SOLVENCY NEED (THE ICAAP RESULT)
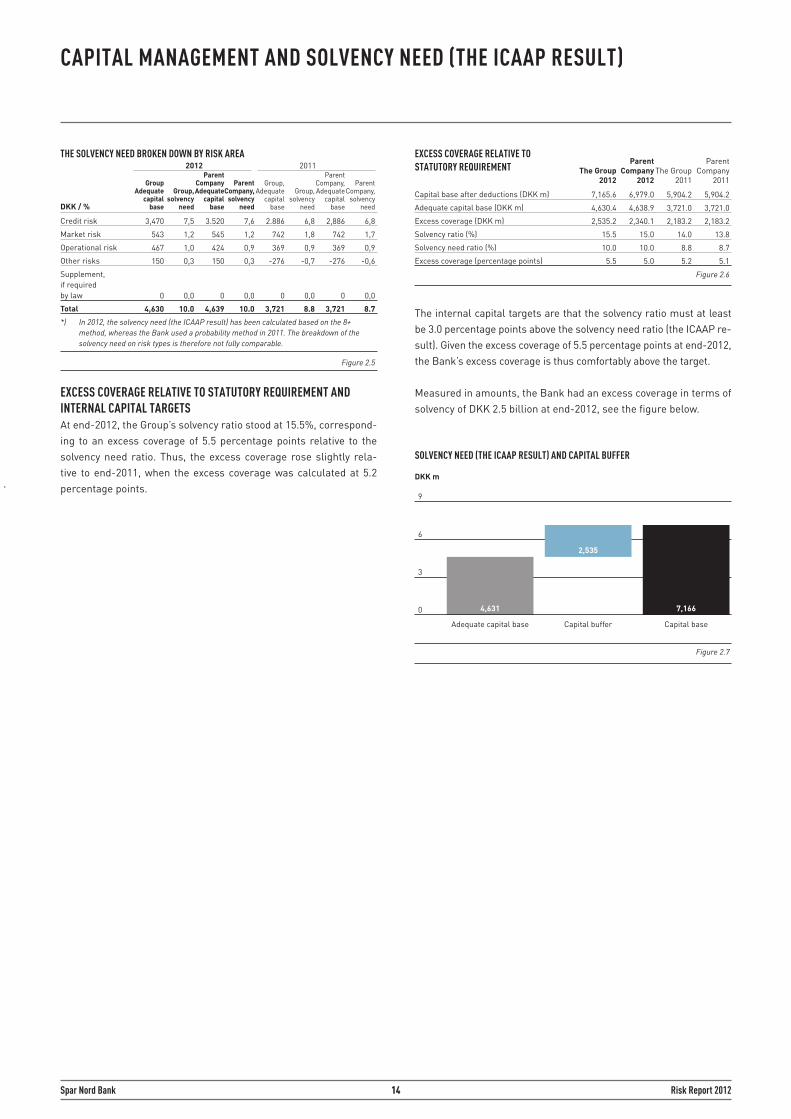
EXCESS COVERAGE RELATIVE TO STATUTORY REQUIREMENT AND INTERNAL CAPITAL TARGETS At end-2012, the Group’s solvency ratio stood at 15.5%, correspond-ing to an excess coverage of 5.5 percentage points relative to the solvency need ratio. Thus, the excess coverage rose slightly rela-tive to end-2011, when the excess coverage was calculated at 5.2 percentage points.
The internal capital targets are that the solvency ratio must at least be 3.0 percentage points above the solvency need ratio (the ICAAP re-sult). Given the excess coverage of 5.5 percentage points at end-2012, the Bank’s excess coverage is thus comfortably above the target.
Measured in amounts, the Bank had an excess coverage in terms of solvency of DKK 2.5 billion at end-2012, see the figure below.
EXCESS COVERAGE RELATIVE TO STATUTORY REQUIREMENT
Capital base after deductions (DKK m)
Adequate capital base (DKK m)
Excess coverage (DKK m)
Solvency ratio (%)
Solvency need ratio (%)
Excess coverage (percentage points)
Parent Company
2011The Group
2011
7,165.6 6,979.0 5,904.2 5,904.2
4,630.4 4,638.9 3,721.0 3,721.0
2,535.2 2,340.1 2,183.2 2,183.2
15.5 15.0 14.0 13.8
10.0 10.0 8.8 8.7
5.5 5.0 5.2 5.1
Figure 2.6
Parent Company
2012The Group
2012
SOLVENCY NEED (THE ICAAP RESULT) AND CAPITAL BUFFER
4,631
2,535
DKK m
9
6
3
0
Adequate capital base Capital buffer Capital base
Figure 2.7
7,166
3,470 7,5 3.520 7,6 2.886 6,8 2,886 6,8
543 1,2 545 1,2 742 1,8 742 1,7
467 1,0 424 0,9 369 0,9 369 0,9
150 0,3 150 0,3 -276 -0,7 -276 -0,6
0 0,0 0 0,0 0 0,0 0 0,0
4,630 10.0 4,639 10.0 3,721 8.8 3,721 8.7
THE SOLVENCY NEED BROKEN DOWN BY RISK AREA
Credit risk
Market risk
Operational risk
Other risks
Supplement, if requiredby law
Total
Parent Company,
solvency need
Parent Company, Adequate
capital baseDKK / %
Group, solvency
need
Group, Adequate
capital base
2012 2011
Figure 2.5
Parent Company,
solvency need
ParentCompany Adequate
capital base
Group, solvency
need
GroupAdequate
capital base
*) In 2012, the solvency need (the ICAAP result) has been calculated based on the 8+ method, whereas the Bank used a probability method in 2011. The breakdown of the solvency need on risk types is therefore not fully comparable.
15 Risk Report 2012Spar Nord Bank
BASEL III - CRD IV
THE IMPORTANCE OF FUTURE RULES ON CAPITAL AND LIQUIDITY REQUIREMENTSOn 20 July 2011, the European Commission announced a proposal for revising the Capital Requirement Directive, now frequently re-ferred to as the CRR/CRD IV package. A new directive and regula-tion were proposed, intended to make the EU financial sector more robust in light of experience gained from the financial crisis.
The CRR/CRD IV package is based on the recommendations of the Basel committee, the Basel III standards from December 2010, and contains a wide array of elements for regulating credit institutions, including a definition of the capital of credit institutions and require-ments as to size and quality, requirements as to capital buffers and counterparty risks, and limitations regarding leveraged loans and the introduction of new liquidity regulations. In addition, the propos-al contains a number of elements intended to create more uniform bank regulations across the EU. Finally, the proposal contains ele-ments relating to corporate governance and a tightening of require-ments as to the sanction options available to the Danish Financial Supervisory Authority when dealing with non-compliant institutions. The rules expected to be included in the CRD regulation will apply in Denmark, and this section therefore focuses mainly on how the Bank complies with the CRD IV requirements.
CORE CAPITAL (TIER 1) ADJUSTED FOR CRD IVThe proposed regulation is intended to introduce requirements as to more capital and a sounder capital structure, which will make credit institutions better able to absorb losses without becoming insolvent. The more stringent requirements as to quality and scope of Com-mon Equity (Tier 1) is a focal element of the proposed amendment, which will establish a number of objective criteria that the individual capital instruments must meet in order to be included in the indi-vidual categories of capital requirements (Common Equity (Tier 1), hybrid core capital and supplementary capital).
The forthcoming CRD IV regulation means a sharp tightening of the minimum capital requirements for financial institutions. The mini-mum capital requirement for Common Equity (Tier 1) will be gradu-ally lifted from the existing 2% of risk-weighted assets to 4.5% in 2015. At the same time, the requirement as to core capital will be increased, with the core capital consisting of Common Equity (Tier 1) and other capital types without maturity dates, which are subor-dinated to the claims of all the Bank’s creditors. In future, the core capital must amount to at least 6% of risk-weighted assets com-pared with the existing requirement of 4%.
On the basis of the proposals, Spar Nord estimates that the Group’s Common Equity (Tier 1) in per cent of risk-weighted items, amount-ing to 12.1% at 31 December 2012, will be reduced by about 1.6 per-centage points when calculated using the fully implemented CRD IV rules. The anticipated reduction will primarily be attributable to new capital add-ons for counterparty risk and the fact that the calcula-tion base for calculating deductions is moved from the capital base to the Common Equity (Tier 1).
BUFFERS UNDER CRD IVIn addition to the above-mentioned tightened requirements as to the Group’s Common Equity (Tier 1), there will be new requirements as to:
• A capital conservation buffer of 2.5% of risk-weighted assets• A countercyclical capital buffer fixed by the Danish Financial Supervisory Authority at between 0 - 2.5% of risk-weighted assets.• The Danish Financial Supervisory Authority will be given the option of setting up an additional capital requirement by way of a so-called systemic risk buffer, which may represent 0–3% plus an add-on to the risk-weighted assets, if deemed necessary.
A common feature of all buffers is that only the Common Equity (Tier 1) may be used for meeting the capital requirement.
If a financial institution fails to meet the capital requirements as to buffers, the financial institution would be restricted from the option of making dividend payments and other distributions. The CRD IV guidelines tighten up the definition of the capital that may be in-cluded as core capital (Tier 1) and mean stricter rules for calculating risk-weighted items.
DEFINITION OF INSTRUMENTS THAT MAY BE INCLUDED IN THE CAPITAL BASE UNDER CRD IVA chief objective of CRD IV is to strengthen the quality of the in-struments (over and above the shareholder’s equity) that may be included in the capital base. Thus, CRD IV contains stricter criteria for including instruments in the core capital (Tier 1) and the supple-mentary capital. In relation to the definition of core capital (Tier 1) and supplementary capital, the only instruments that may be includ-ed are those that financial institutions have no incentive to redeem, such as instruments with interest escalation clauses. Under CRD IV, instruments that no longer comply with the requirements regard-ing inclusion in the core capital (Tier 1) or supplementary capital must be phased out over a ten-year period from 1 January 2013. In addition, instruments with an inherent redemption incentive must be phased out as and when they expire. Existing State-funded injec-tions, including State hybrid loans, may be included in the capital base until the end of 2017.
There are moderate incentives for redeeming the Bank’s existing hybrid core capital, for which reason the transitional rules are ex-pected to apply to these instruments.
The issued supplementary capital of DKK 58 million acquired in con-nection with the merger with Sparbank and the most recent issue of supplementary capital in the amount of DKK 400 million have been established on terms and conditions that live up to the requirements for inclusion in the capital base under CRD IV.

16 Risk Report 2012Spar Nord Bank
BASEL III - CRD IV
LEVERAGE RATIOCRD IV introduces rules on calculating the so-called leverage ra-tio. As opposed to the applicable rules for calculating risk-weighted items, the leverage ratio disregards the fact that various activities affecting financial institutions’ balance sheets have diverse degrees of risk. Basel III contains a requirement to the effect that the core capital (Tier 1) must represent at least 3% of the total exposure. Ac-cording to CRD IV, the impact of the leverage ratio determined would be monitored with a view to making it a binding Pillar 1 criterion in 2018. Spar Nord estimates that its leverage ratio at end-2012 was 7.8% adjusted for CRD IV requirements when the rules and regula-tions have been fully phased in.
The table below gives details on the Bank’s leverage ratio accord-ing to CRD IV, calculated as of December 2011 and December 2012:
LIQUIDITYThe final wording of the liquidity requirements for financial institu-tions at EU level has yet to be clarified. If the liquidity requirements introduced in Denmark are based on Basel III, the proposed restric-tions on including specially covered bonds in the liquidity buffer will require that Spar Nord make substantial changes to its financing structure and the composition of the liquidity buffer.
Pursuant to Basel III, specially covered bonds, including mortgage-credit bonds and other so-called level 2 assets, may only amount to maximum 40% of the liquidity buffer in a financial institution’s Liquidity Coverage Ratio, whereas government bonds and other so-called level 1 assets must represent at least 60%. The proposed requirement fundamentally differs from the existing structure of the Danish bond market, where mortgage-credit bonds account for about 80% of the Danish bond market.
According to CRD IV it will be possible to include specially covered bonds as level 1 assets if such bonds can pass the liquidity test. EBA will prepare draft technical standards that may form the basis for defining level 1 and level 2 assets. Given the existing uncertainty re-garding which assets that qualify as level 1 assets and level 2 assets under CRD IV, it is assessed that Spar Nord will meet the LCR ratio and NSFR ratio requirements after making certain adjustments.
THE BANK’S LEVERAGE RATIO UNDER CRD IV
Exposure value, assets
Intangible assets
Adjusted exposure value, assets
Guarantees and other obligating agreements
Loan offers and revocable credit exposures
Total adjusted exposure
Core capital (Tier 1), CRD IV fully phased-in
Leverage ratio - %
20112012
54,064.8 51,760.8
-237.0 -166.3
53,827.8 51,594.5
6,363.7 4,358.6
4,098.4 4,688.0
64,289.9 60,641.1
5,044.8 3,920.0
7.8 6.5
DKK m / %
Figure 3.1
17 Risk Report 2012Spar Nord Bank
CREDIT RISK
Credit risk is the risk of loss as a result of borrowers or other coun-terparties defaulting on their payment obligations, including the risks attaching to customers having financial difficulties, risks re-lating to large exposures, concentration risks and risks attaching to granted, unutilized credit lines. Credit risks also include settlement and counterparty risks. Settlement risk is the risk arising when pay-ments are settled, for instance payments for currency transactions and trading in financial instruments, including derivatives. The risk arises when the Group forwards payments before it has attained full assurance that the counterparty has met all his obligations. Coun-terparty risk is the risk of loss as a result of a customer’s default of OTC derivatives and securities financing instruments.
CREDIT POLICY Spar Nord’s overall credit risk is controlled on the basis of the Group’s credit policy, which the Board of Directors determines in conjunction with the overarching policies and frameworks for the Group’s risk assumption. The pivotal objective of Spar Nord’s credit policy is to ensure that earnings and risks are balanced, and that the assumption of risk is always quantified.
It is the Group’s policy that all credit must be granted on the basis of insight into the customers’ financial position and that creditwor-thiness – the customer’s ability and will to meet current and future obligations – is a key parameter in all customer relations.
Spar Nord aims to develop long-term relationships with customers and does not want to use risk appetite as a competitive parameter. Spar Nord only wants to conclude transactions that conform to good banking practice and do not jeopardize the Group’s reputation and professional profile.
As a basic rule, the Group does not grant loans and credit facilities based on collateral alone. Thus, the customer should show the will and have the ability to repay loans without the Group having to real-ize the collateral.
In its endeavours to ensure sound risk diversification of its credit exposure, Spar Nord has introduced a number of internal targets. The Group does not want to be exposed to individual customers or lines of business that might solely and separately jeopardize the Bank’s independence. Consequently, Spar Nord has introduced a cap on credit facilities at DKK 400 million, of which the unsecured share of credit exposure may not exceed DKK 150 million in respect of any facility.
Exposures to financial institutions under supervision are not com-prised by this restriction.
In determining the amount of exposure, due provision is made for the so-called ‘particularly secure claims’, which are defined in the Danish Financial Supervisory Authority’s Executive Order on Large Exposures. Thus, the statutory limitations apply to trading partners in the financial sector with an external credit rating at investment grade level, and a DKK 600 million cap has been fixed internally for other trading partners in the financial sector.
The sum of large exposures calculated pursuant to the calculation methodology used in the Danish Financial Supervisory Authority’s Diamond Test Model amounts to 16.6%.
In addition, the Group has introduced some trade and industry limi-tations. One of them is a long-term objective specifying that agricul-tural facilities may not exceed 10% of the Group’s loans, advances and guarantees, and that property exposures must amount to a lower share of the Group’s loans, advances and guarantees than the average for Danish financial institutions. Spar Nord also strives to maintain the share of retail customers at a level that is higher than the sector average and which amounts to more than 30% of the Group’s total loans, advances and guarantees.
Finally, in its credit policy the Bank has decided that it wants insight into any exposures that its customers may have to other financial institutions.
CREDIT MANAGEMENT AND CREDIT RISK MONITORING The credit facility process at Spar Nord is centrally managed. The decentralized credit authorization limits range between DKK 2 and DKK 10 million for existing customers. As concerns new customers, the facility authorization rights are typically half of that for existing customers. The powers of authority in the credit area are governed by two factors: The individual local managers’ ability and need and the wish that a certain share of authorizations from the local banks is to be dealt with by Credit Rating.
Customer advisers, in consultation with local managers, handle day-to-day management of the Bank’s credit risks. If a credit facil-ity exceeds the local loan approval limits, it will be passed on and dealt with by Credit Rating, the Credit Committee (General Manager, Credit Rating and an Executive Board member) or the Board of Di-rectors.
Credit Rating may authorize facilities up to DKK 20 million for exist-ing customers and DKK 15 million for new customers. The Credit Committee may authorize all facilities up to DKK 60 million, and up to DKK 30 million for new facilities. All facilities exceeding DKK 60 million and all new facilities exceeding DKK 30 million are subject to approval by the Board of Directors.
Overall monitoring of the Group’s credit risk exposure is managed by the Credit Quality Department. This department oversees chang-es in the credit quality of all exposures and undertakes a systematic credit quality control of the entire exposure portfolio.
The Credit Quality Department reviews all new retail customer fa-cilities above DKK 100,000 and all new business customer facilities above DKK 300,000. New customers with weak credit quality are registered on an ongoing basis.
The Group has developed IT tools for controlling and monitoring credit risks. The Bank’s credit analysis system is used for monitor-ing purposes, and key data regarding credit facilities and custom-ers’ financial affairs are recorded in it. This is done to detect danger signals at an early stage as well as to monitor changes in the credit quality of portfolios and organizational units.
18 Risk Report 2012Spar Nord Bank
CREDIT RISK
Every month a statistically-based scoring of both retail and busi-ness customers is performed. Credit scoring has been introduced in all the Bank’s departments, and these tools are used at the local level to grant credit facilities. Thus, customers in the risk groups ac-corded the least risk exposure are likelier to be given higher credit limits or extensions than those with the greatest risk exposure. In addition, the systems are used for managing overdrafts and for pric-ing purposes.
CREDIT SCORING Customers are classified according to risk as an element in the Group’s credit application processing. Business customers are categorized into 11 risk groups. Two risk groups are reserved for loan default customers, defined as exposures that are subject to writedowns, impairment or for which interest accruals have been suspended. The other borrowing customers are classified into cat-egories 1 to 9 based on various scoring models. These models are used to measure the probability that the customer will default within the next 12 months.
The model applied to business customers employs four compo-nents: An accounting component used to risk-classify the customer based on his most recent financial statements. A behavioural com-ponent that classifies the customer based on his account behaviour and credit authorization history. A component based on a business profile, with the classification of the customer being based on a qualitative assessment of significant key areas, such as manage-ment, market, etc. The fourth component is a cyclical element that is used to adjust the classification based on cyclical trends.
For retail customers, the model is exclusively based on a behav-ioural component and a cyclical component.
New retail customers are risk-classified according to an applica-tion scoring model that is based on classical credit key ratios, such as assets, pay, disposable income, etc. This model is based on a combination of a statistical and an expert model. After six months, customers are subjected to a behavioural score scrutiny, and the results obtained using the two models are co-weighted in the tran-sitional period until the twelfth month, after which the behavioural score is used as the primary source.
New business customers are classified based on the accounting component, the business profile and the cyclical component until the sixth month, at which time the behavioural component is also applied.
Moreover, Spar Nord applies a qualitative risk classification, credit watchlists, in which the Spar Nord adviser flags any credit facility showing signs of default risk. For retail customers, these signs of default risk may for instance be divorce, unemployment, etc., and for business customers they could be marketing difficulties, the loss of key employees or suppliers, etc.
If a customer is flagged in the credit-watchlist and is not in default, the customer will be downgraded by one rating category; it should be noted that a customer flagged in the credit-watchlist does not qualify for rating in the best categories (one and two).
Public-sector customers and financial customers are not risk-clas-sified.
CREDIT EXPOSURE The Group’s total credit exposure comprises lending and trading ac-tivities, such as trading in bonds and other financial instruments.
The table below shows the Group’s total credit exposure (carrying amount) as at 31 December 2012 and 2011:
The Bank’s impairment allowance account, DKK 1,330 million, and the discount on the exposures taken over in connection with the merger, DKK 1,412 million, are amounts that reflect a reduction of the carrying amount of the Bank’s exposures relative to their con-tractual nominal amount. Even though these value adjustments are handled differently in the presentation of the Bank’s assets in the financial statements, they have the same impact on the assessment of the risk attaching to the exposure in the ongoing credit process-ing routines.
2012 – A GENERAL OVERVIEW 2012 saw a satisfactory trend in the lending portfolio’s diversifica-tion in terms of lines of business. The retail customer share rose from 32.2% to 36.5%, the agricultural share shrank from 12.0% to 10.0%, while building & construction and real property remained at the same level at end-2012 as at end-2011.
The credit quality of the business customer portfolio improved slightly over the year, while the credit quality of the retail customer portfolio remained at an unchanged level.
THE GROUP’S CREDIT EXPOSURE (CARRYING AMOUNT), INCL. DISCOUNT ON EXPOSURES TAKEN OVER, PROVISIONS AND FAIR-VALUE ADJUSTMENTS
Repo loans
Loans and advances at amortized cost
Loans and advances
Contingent liabilities
Credit exposure to loans, advances and guarantees, net
Impairment of loans, advances and guarantees
Discount on exposures taken over
Credit exposure to loans, advances and guarantees, gross
Demand deposits with central banks
Repo loans to credit institutions and central banks
Receivables from credit institutions and central banks
Demand deposits and receivables from credit inst. and central banks
Credit exposure (carrying amount) on lending activities
Positive market values
Credit exposure, assets in the trading portfolio
Credit exposure, other financial investment assets
Credit exposure (carrying amount)
20112012
115.5 393.3
38,942.4 38,308.9
39,057.9 38,702.2
5,767.1 3,837.7
44,825.0 42,539.9
1,330.0 1,142.8
1,411.7 0.0
47,566.7 43,682.7
2,341.2 641.0
1,730.5 818.9
2,246.6 1,609.4
6,318.3 3,069.3
51,143.3 45,609.2
2,067.6 1,837.5
20,410.1 16,543.8
1,041.6 917.8
74.662,6 64.908,2
DKK m
Figure 4.1
IMPAIRMENT ACOUNT AND DISCOUNT
The Group
Continuing activities
Impairment balance/discount
Discount on exposures taken over
1,330.0 1,411.7 2,741.7
1,171.1 1,353.6 2,524.7
DKK m
Figure 4.2
Impairment account
19 Risk Report 2012Spar Nord Bank
CREDIT RISK
The portfolio of retail and business customers taken over from Sparbank is expected - apart from the special liquidation portfolio of DKK 1.9 billion handled by the Special Credits Department - to have a credit quality that is in line with the pre-merger Spar Nord.
Prior to the merger a particularly thorough due diligence was car-ried out, including a review of all exposures of more than DKK 5 mil-lion, and a total of 72% of Sparbank’s loans and advances have been scrutinized on an individual basis. In this light, fair value adjust-ments of DKK 434 million have been made, and the portfolio taken over is assessed to have a suitable impairment coverage.
At the same time, geographical diversification in the credit exposure was much larger in 2012, as the share of the portfolio attributable to North Jutland Region shrank from 52.3% to 37.3%. The largest increase occurred in Region Mid Jutland, which rose to a share of 24.4%, up from 13.3% at the end of 2011.
LOANS, ADVANCES AND GUARANTEES The Group’s total loans, advances and guarantees before offsetting of impairment losses and discount on exposures taken over amount-ed to DKK 47.6 billion at end-2012 compared with DKK 43.7 billion at end-2011. Retail customers account for 36.5% of total loans and guarantees, with business customers accounting for 63.5%.
Loans, advances and guarantees relating to continuing activities (excl. leasing activities) amounted to DKK 43.3 billion at end-2012 compared to DKK 36.4 billion at end-2011. Of this amount, DKK 9.8 billion of loans, advances and guarantees has been taken over in connection with the Sparbank merger. In total, 40.0% of loans, ad-vances and guarantees in the continuing activities are attributable to retail customers and 60.0% to business customers.
Customers are categorized into four groups as part of the ongo-ing risk monitoring: Retail customers at Spar Nord’s Local Banks, business customers at Spar Nord’s Local Banks, financial custom-ers and leasing activities. In this Risk Report, loans, advances and guarantees taken over are grouped together in a separate category,
but they will be transferred to the other groups as soon as possible in 2013.
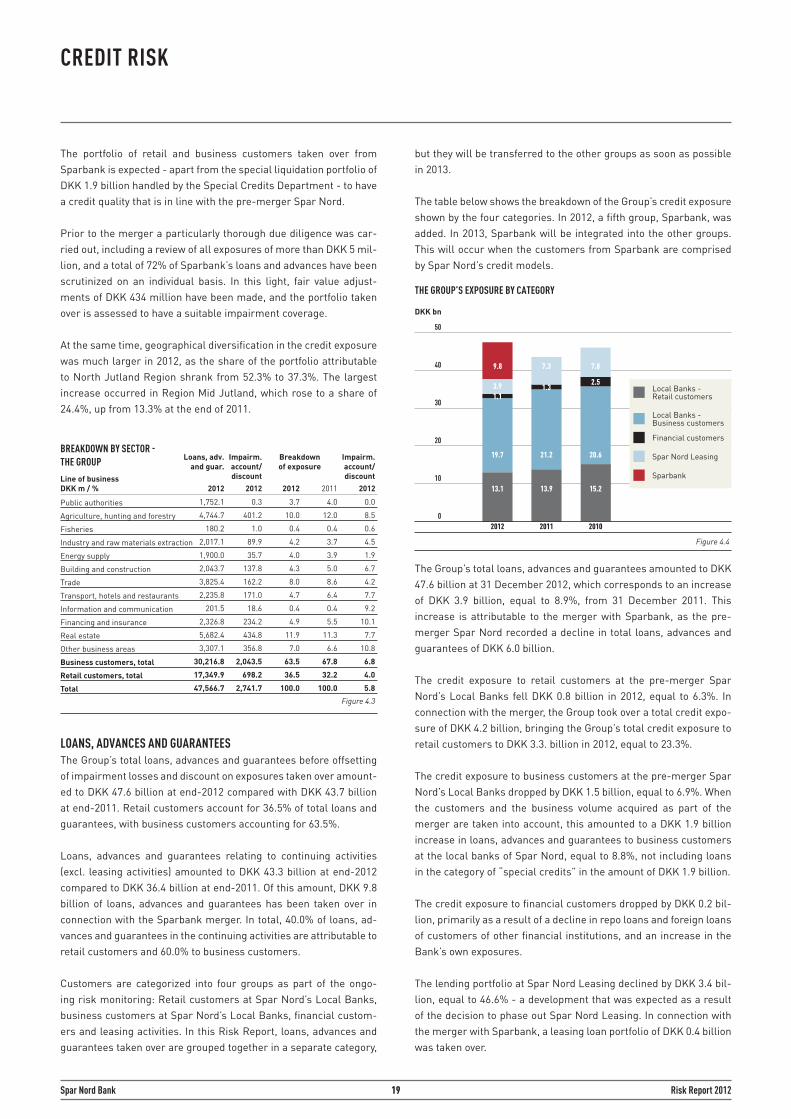
The table below shows the breakdown of the Group’s credit exposure shown by the four categories. In 2012, a fifth group, Sparbank, was added. In 2013, Sparbank will be integrated into the other groups. This will occur when the customers from Sparbank are comprised by Spar Nord’s credit models.
The Group’s total loans, advances and guarantees amounted to DKK 47.6 billion at 31 December 2012, which corresponds to an increase of DKK 3.9 billion, equal to 8.9%, from 31 December 2011. This increase is attributable to the merger with Sparbank, as the pre-merger Spar Nord recorded a decline in total loans, advances and guarantees of DKK 6.0 billion.
The credit exposure to retail customers at the pre-merger Spar Nord’s Local Banks fell DKK 0.8 billion in 2012, equal to 6.3%. In connection with the merger, the Group took over a total credit expo-sure of DKK 4.2 billion, bringing the Group’s total credit exposure to retail customers to DKK 3.3. billion in 2012, equal to 23.3%.
The credit exposure to business customers at the pre-merger Spar Nord’s Local Banks dropped by DKK 1.5 billion, equal to 6.9%. When the customers and the business volume acquired as part of the merger are taken into account, this amounted to a DKK 1.9 billion increase in loans, advances and guarantees to business customers at the local banks of Spar Nord, equal to 8.8%, not including loans in the category of “special credits” in the amount of DKK 1.9 billion.
The credit exposure to financial customers dropped by DKK 0.2 bil-lion, primarily as a result of a decline in repo loans and foreign loans of customers of other financial institutions, and an increase in the Bank’s own exposures.
The lending portfolio at Spar Nord Leasing declined by DKK 3.4 bil-lion, equal to 46.6% - a development that was expected as a result of the decision to phase out Spar Nord Leasing. In connection with the merger with Sparbank, a leasing loan portfolio of DKK 0.4 billion was taken over.
BREAKDOWN BY SECTOR -THE GROUP
Public authorities
Agriculture, hunting and forestry
Fisheries
Industry and raw materials extraction
Energy supply
Building and construction
Trade
Transport, hotels and restaurants
Information and communication
Financing and insurance
Real estate
Other business areas
Business customers, total
Retail customers, total
Total
2012
Impairm. account/discountLine of business
DKK m / %
1,752.1 0.3 3.7 4.0 0.0
4,744.7 401.2 10.0 12.0 8.5
180.2 1.0 0.4 0.4 0.6
2,017.1 89.9 4.2 3.7 4.5
1,900.0 35.7 4.0 3.9 1.9
2,043.7 137.8 4.3 5.0 6.7
3,825.4 162.2 8.0 8.6 4.2
2,235.8 171.0 4.7 6.4 7.7
201.5 18.6 0.4 0.4 9.2
2,326.8 234.2 4.9 5.5 10.1
5,682.4 434.8 11.9 11.3 7.7
3,307.1 356.8 7.0 6.6 10.8
30,216.8 2,043.5 63.5 67.8 6.8
17,349.9 698.2 36.5 32.2 4.0
47,566.7 2,741.7 100.0 100.0 5.8
20122012
Figure 4.3
Impairm. account/discount
2011
Breakdown of exposure
2012
Loans, adv.and guar.
Figure 4.4
THE GROUP’S EXPOSURE BY CATEGORY
DKK bn
50
40
30
20
10
0201020112012
20.6
15.2
2.5
7.8
21.2
1.3
7.3
13.913.1
19.7
1.13.9
9.8
Local Banks - Business customers
Spar Nord Leasing
Local Banks - Retail customers
Sparbank
Financial customers
20 Risk Report 2012Spar Nord Bank
CREDIT RISK
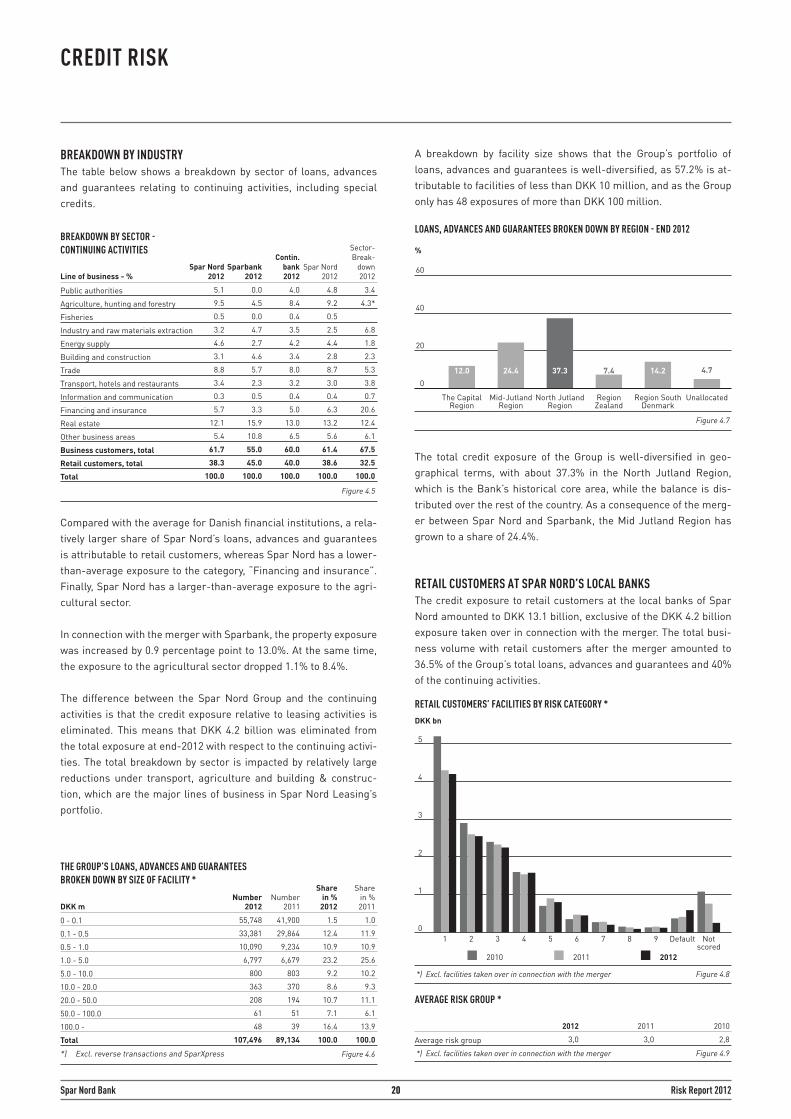
BREAKDOWN BY INDUSTRY The table below shows a breakdown by sector of loans, advances and guarantees relating to continuing activities, including special credits.
Compared with the average for Danish financial institutions, a rela-tively larger share of Spar Nord’s loans, advances and guarantees is attributable to retail customers, whereas Spar Nord has a lower-than-average exposure to the category, “Financing and insurance”. Finally, Spar Nord has a larger-than-average exposure to the agri-cultural sector. In connection with the merger with Sparbank, the property exposure was increased by 0.9 percentage point to 13.0%. At the same time, the exposure to the agricultural sector dropped 1.1% to 8.4%.
The difference between the Spar Nord Group and the continuing activities is that the credit exposure relative to leasing activities is eliminated. This means that DKK 4.2 billion was eliminated from the total exposure at end-2012 with respect to the continuing activi-ties. The total breakdown by sector is impacted by relatively large reductions under transport, agriculture and building & construc-tion, which are the major lines of business in Spar Nord Leasing’s portfolio.
A breakdown by facility size shows that the Group’s portfolio of loans, advances and guarantees is well-diversified, as 57.2% is at-tributable to facilities of less than DKK 10 million, and as the Group only has 48 exposures of more than DKK 100 million.
The total credit exposure of the Group is well-diversified in geo-graphical terms, with about 37.3% in the North Jutland Region, which is the Bank’s historical core area, while the balance is dis-tributed over the rest of the country. As a consequence of the merg-er between Spar Nord and Sparbank, the Mid Jutland Region has grown to a share of 24.4%.
RETAIL CUSTOMERS AT SPAR NORD’S LOCAL BANKS The credit exposure to retail customers at the local banks of Spar Nord amounted to DKK 13.1 billion, exclusive of the DKK 4.2 billion exposure taken over in connection with the merger. The total busi-ness volume with retail customers after the merger amounted to 36.5% of the Group’s total loans, advances and guarantees and 40% of the continuing activities.
AVERAGE RISK GROUP *
Average risk group
2010
3,0 3,0 2,8
20112012
*) Excl. facilities taken over in connection with the merger Figure 4.9
BREAKDOWN BY SECTOR - CONTINUING ACTIVITIES
Public authorities
Agriculture, hunting and forestry
Fisheries
Industry and raw materials extraction
Energy supply
Building and construction
Trade
Transport, hotels and restaurants
Information and communication
Financing and insurance
Real estate
Other business areas
Business customers, total
Retail customers, total
Total
5.1 0.0 4.0 4.8 3.4
9.5 4.5 8.4 9.2 4.3*
0.5 0.0 0.4 0.5
3.2 4.7 3.5 2.5 6.8
4.6 2.7 4.2 4.4 1.8
3.1 4.6 3.4 2.8 2.3
8.8 5.7 8.0 8.7 5.3
3.4 2.3 3.2 3.0 3.8
0.3 0.5 0.4 0.4 0.7
5.7 3.3 5.0 6.3 20.6
12.1 15.9 13.0 13.2 12.4
5.4 10.8 6.5 5.6 6.1
61.7 55.0 60.0 61.4 67.5
38.3 45.0 40.0 38.6 32.5
100.0 100.0 100.0 100.0 100.0
Spar Nord 2012Line of business - %
Sparbank 2012
Spar Nord2012
Figure 4.5
Contin. bank2012
Sector-Break-
down 2012
THE GROUP’S LOANS, ADVANCES AND GUARANTEES BROKEN DOWN BY SIZE OF FACILITY *
0 - 0.1
0.1 - 0.5
0.5 - 1.0
1.0 - 5.0
5.0 - 10.0
10.0 - 20.0
20.0 - 50.0
50.0 - 100.0
100.0 -
Total
DKK mNumber
2011
55,748 41,900 1.5 1.0
33,381 29,864 12.4 11.9
10,090 9,234 10.9 10.9
6,797 6,679 23.2 25.6
800 803 9.2 10.2
363 370 8.6 9.3
208 194 10.7 11.1
61 51 7.1 6.1
48 39 16.4 13.9
107,496 89,134 100.0 100.0
Sharein %
2012Number
2012
Sharein %2011
Figure 4.6*) Excl. reverse transactions and SparXpress
LOANS, ADVANCES AND GUARANTEES BROKEN DOWN BY REGION - END 2012
12.0 14.2
%
60
40
20
0
The Capital Region
Mid-Jutland Region
North Jutland Region
RegionZealand
Region South Denmark
7.4
Figure 4.7
24.4 37.3 4.7
Unallocated
RETAIL CUSTOMERS’ FACILITIES BY RISK CATEGORY *
2010 2011 2012
DKK bn
5
4
3
2
1
09
*) Excl. facilities taken over in connection with the merger Figure 4.8
87654321 Default Notscored
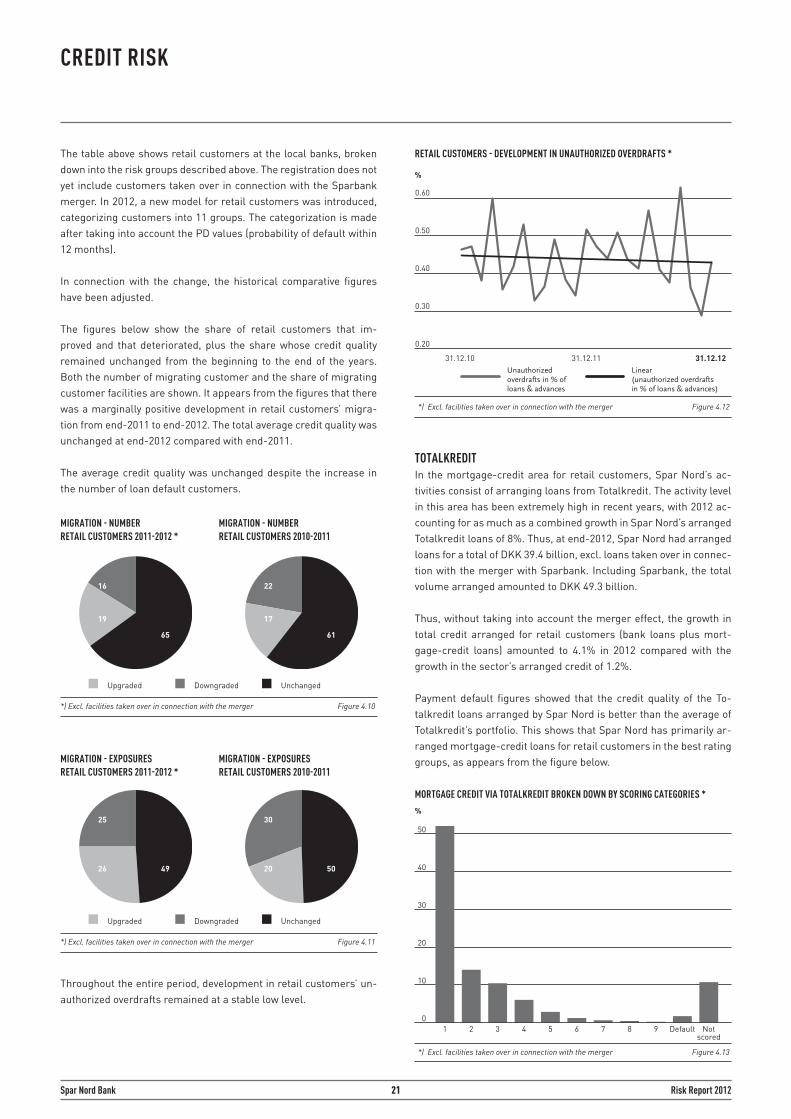
21 Risk Report 2012Spar Nord Bank
CREDIT RISK
The table above shows retail customers at the local banks, broken down into the risk groups described above. The registration does not yet include customers taken over in connection with the Sparbank merger. In 2012, a new model for retail customers was introduced, categorizing customers into 11 groups. The categorization is made after taking into account the PD values (probability of default within 12 months).
In connection with the change, the historical comparative figures have been adjusted.
The figures below show the share of retail customers that im-proved and that deteriorated, plus the share whose credit quality remained unchanged from the beginning to the end of the years. Both the number of migrating customer and the share of migrating customer facilities are shown. It appears from the figures that there was a marginally positive development in retail customers’ migra-tion from end-2011 to end-2012. The total average credit quality was unchanged at end-2012 compared with end-2011.
The average credit quality was unchanged despite the increase in the number of loan default customers.
Throughout the entire period, development in retail customers’ un-authorized overdrafts remained at a stable low level.
TOTALKREDIT In the mortgage-credit area for retail customers, Spar Nord’s ac-tivities consist of arranging loans from Totalkredit. The activity level in this area has been extremely high in recent years, with 2012 ac-counting for as much as a combined growth in Spar Nord’s arranged Totalkredit loans of 8%. Thus, at end-2012, Spar Nord had arranged loans for a total of DKK 39.4 billion, excl. loans taken over in connec-tion with the merger with Sparbank. Including Sparbank, the total volume arranged amounted to DKK 49.3 billion.
Thus, without taking into account the merger effect, the growth in total credit arranged for retail customers (bank loans plus mort-gage-credit loans) amounted to 4.1% in 2012 compared with the growth in the sector’s arranged credit of 1.2%.
Payment default figures showed that the credit quality of the To-talkredit loans arranged by Spar Nord is better than the average of Totalkredit’s portfolio. This shows that Spar Nord has primarily ar-ranged mortgage-credit loans for retail customers in the best rating groups, as appears from the figure below.
MIGRATION - NUMBERRETAIL CUSTOMERS 2011-2012 *
*) Excl. facilities taken over in connection with the merger Figure 4.10
MIGRATION - NUMBERRETAIL CUSTOMERS 2010-2011
Upgraded Downgraded Unchanged
65
16
19
MIGRATION - EXPOSURESRETAIL CUSTOMERS 2011-2012 *
*) Excl. facilities taken over in connection with the merger Figure 4.11
MIGRATION - EXPOSURESRETAIL CUSTOMERS 2010-2011
Upgraded Downgraded Unchanged
25
26 49
61
22
17
30
20 50
RETAIL CUSTOMERS - DEVELOPMENT IN UNAUTHORIZED OVERDRAFTS *
%
0.60
0.50
0.40
0.30
0.20
*) Excl. facilities taken over in connection with the merger Figure 4.12
31.12.10 31.12.12Unauthorized overdrafts in % of loans & advances
Linear (unauthorized overdrafts in % of loans & advances)
31.12.11
MORTGAGE CREDIT VIA TOTALKREDIT BROKEN DOWN BY SCORING CATEGORIES *
%
50
40
30
20
10
09
*) Excl. facilities taken over in connection with the merger Figure 4.13
87654321 Default Not scored
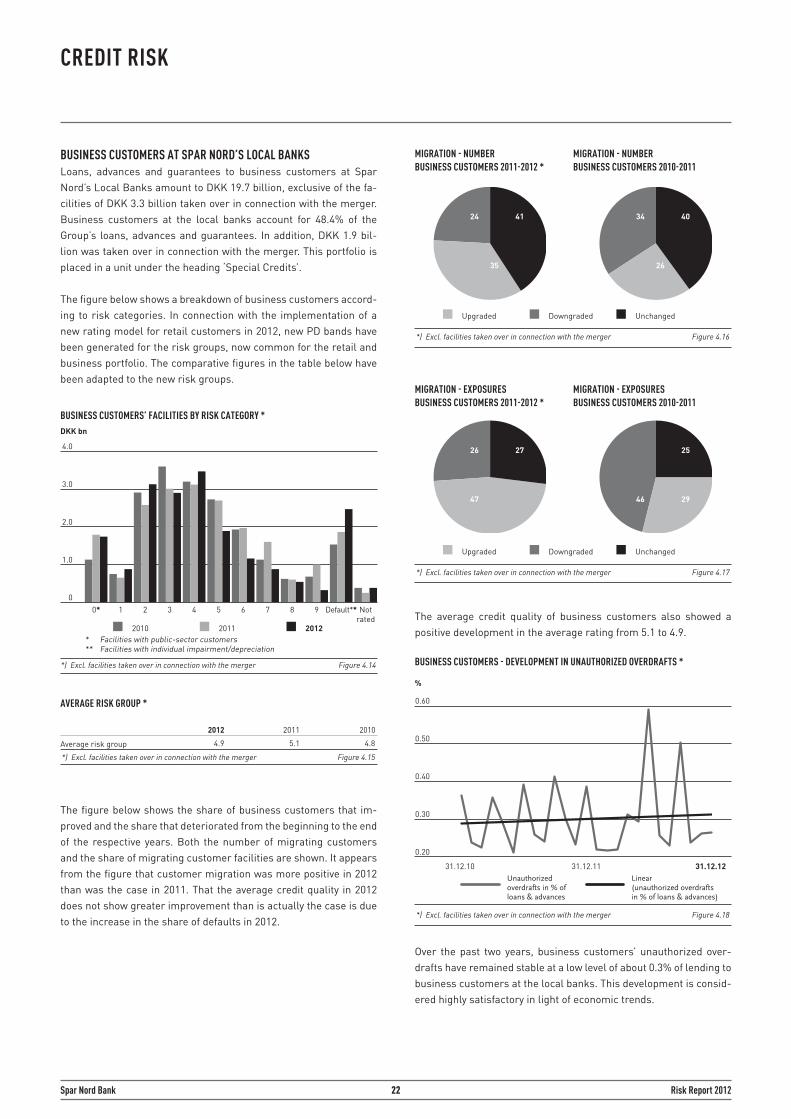
22 Risk Report 2012Spar Nord Bank
CREDIT RISK
BUSINESS CUSTOMERS AT SPAR NORD’S LOCAL BANKS Loans, advances and guarantees to business customers at Spar Nord’s Local Banks amount to DKK 19.7 billion, exclusive of the fa-cilities of DKK 3.3 billion taken over in connection with the merger. Business customers at the local banks account for 48.4% of the Group’s loans, advances and guarantees. In addition, DKK 1.9 bil-lion was taken over in connection with the merger. This portfolio is placed in a unit under the heading ‘Special Credits’.
The figure below shows a breakdown of business customers accord-ing to risk categories. In connection with the implementation of a new rating model for retail customers in 2012, new PD bands have been generated for the risk groups, now common for the retail and business portfolio. The comparative figures in the table below have been adapted to the new risk groups.
The figure below shows the share of business customers that im-proved and the share that deteriorated from the beginning to the end of the respective years. Both the number of migrating customers and the share of migrating customer facilities are shown. It appears from the figure that customer migration was more positive in 2012 than was the case in 2011. That the average credit quality in 2012 does not show greater improvement than is actually the case is due to the increase in the share of defaults in 2012.
The average credit quality of business customers also showed a positive development in the average rating from 5.1 to 4.9.
Over the past two years, business customers’ unauthorized over-drafts have remained stable at a low level of about 0.3% of lending to business customers at the local banks. This development is consid-ered highly satisfactory in light of economic trends.
BUSINESS CUSTOMERS’ FACILITIES BY RISK CATEGORY *DKK bn
4.0
3.0
2.0
1.0
0
2010 2011 2012
Notrated
Default**98765431 2
*) Excl. facilities taken over in connection with the merger Figure 4.14
0*
* Facilities with public-sector customers** Facilities with individual impairment/depreciation
AVERAGE RISK GROUP *
Average risk group
2010
4.9 5.1 4.8
20112012
*) Excl. facilities taken over in connection with the merger Figure 4.15
MIGRATION - NUMBERBUSINESS CUSTOMERS 2011-2012 *
*) Excl. facilities taken over in connection with the merger Figure 4.16
MIGRATION - NUMBERBUSINESS CUSTOMERS 2010-2011
Upgraded Downgraded Unchanged
35
24 41
MIGRATION - EXPOSURESBUSINESS CUSTOMERS 2011-2012 *
*) Excl. facilities taken over in connection with the merger Figure 4.17
MIGRATION - EXPOSURESBUSINESS CUSTOMERS 2010-2011
Upgraded Downgraded Unchanged
27
47
26
26
34 40
25
46 29
BUSINESS CUSTOMERS - DEVELOPMENT IN UNAUTHORIZED OVERDRAFTS *
%
0.60
0.50
0.40
0.30
0.20
*) Excl. facilities taken over in connection with the merger Figure 4.18
31.12.10 31.12.12Unauthorized overdrafts in % of loans & advances
Linear (unauthorized overdrafts in % of loans & advances)
31.12.11
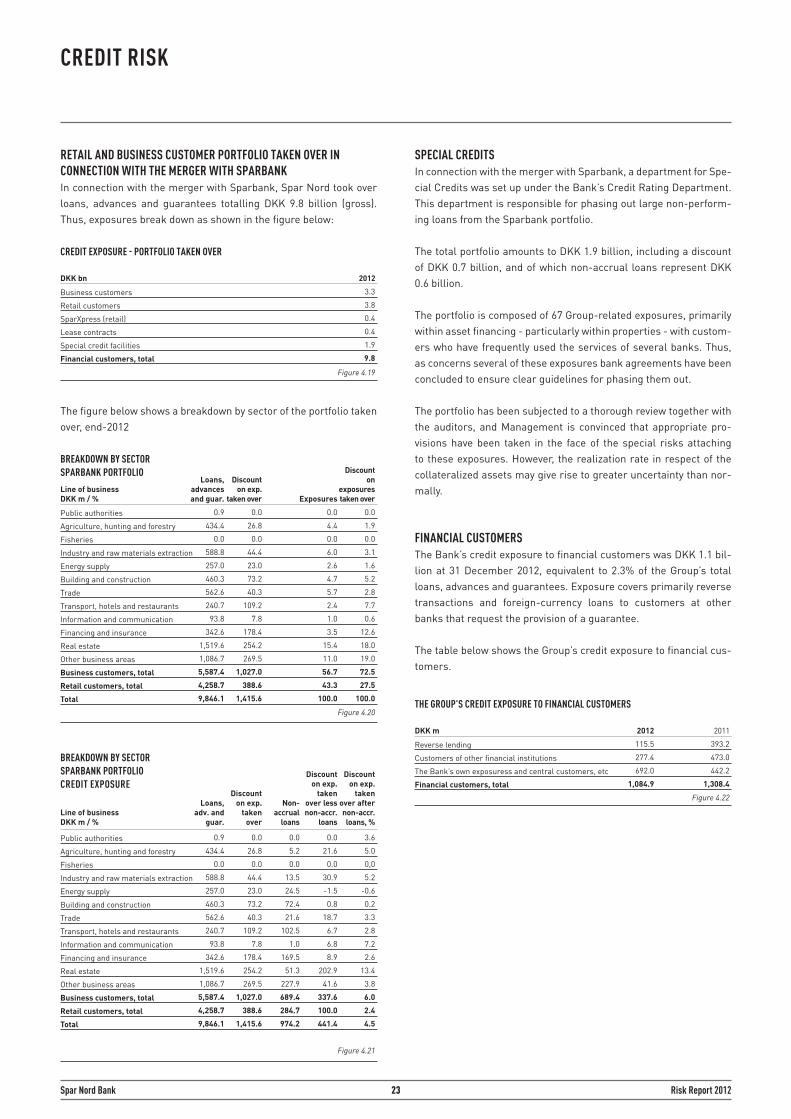
23 Risk Report 2012Spar Nord Bank
CREDIT RISK
RETAIL AND BUSINESS CUSTOMER PORTFOLIO TAKEN OVER IN CONNECTION WITH THE MERGER WITH SPARBANK In connection with the merger with Sparbank, Spar Nord took over loans, advances and guarantees totalling DKK 9.8 billion (gross). Thus, exposures break down as shown in the figure below:
The figure below shows a breakdown by sector of the portfolio taken over, end-2012
SPECIAL CREDITS In connection with the merger with Sparbank, a department for Spe-cial Credits was set up under the Bank’s Credit Rating Department. This department is responsible for phasing out large non-perform-ing loans from the Sparbank portfolio.
The total portfolio amounts to DKK 1.9 billion, including a discount of DKK 0.7 billion, and of which non-accrual loans represent DKK 0.6 billion.
The portfolio is composed of 67 Group-related exposures, primarily within asset financing - particularly within properties - with custom-ers who have frequently used the services of several banks. Thus, as concerns several of these exposures bank agreements have been concluded to ensure clear guidelines for phasing them out.
The portfolio has been subjected to a thorough review together with the auditors, and Management is convinced that appropriate pro-visions have been taken in the face of the special risks attaching to these exposures. However, the realization rate in respect of the collateralized assets may give rise to greater uncertainty than nor-mally.
FINANCIAL CUSTOMERS The Bank’s credit exposure to financial customers was DKK 1.1 bil-lion at 31 December 2012, equivalent to 2.3% of the Group’s total loans, advances and guarantees. Exposure covers primarily reverse transactions and foreign-currency loans to customers at other banks that request the provision of a guarantee.
The table below shows the Group’s credit exposure to financial cus-tomers.
CREDIT EXPOSURE - PORTFOLIO TAKEN OVER
Business customers
Retail customers
SparXpress (retail)
Lease contracts
Special credit facilities
Financial customers, total
2012DKK bn
3.3
3.8
0.4
0.4
1.9
9.8
Figure 4.19
BREAKDOWN BY SECTORSPARBANK PORTFOLIO
Public authorities
Agriculture, hunting and forestry
Fisheries
Industry and raw materials extraction
Energy supply
Building and construction
Trade
Transport, hotels and restaurants
Information and communication
Financing and insurance
Real estate
Other business areas
Business customers, total
Retail customers, total
Total
Loans, advancesand guar.
Line of businessDKK m / %
0.9 0.0 0.0 0.0
434.4 26.8 4.4 1.9
0.0 0.0 0.0 0.0
588.8 44.4 6.0 3.1
257.0 23.0 2.6 1.6
460.3 73.2 4.7 5.2
562.6 40.3 5.7 2.8
240.7 109.2 2.4 7.7
93.8 7.8 1.0 0.6
342.6 178.4 3.5 12.6
1,519.6 254.2 15.4 18.0
1,086.7 269.5 11.0 19.0
5,587.4 1,027.0 56.7 72.5
4,258.7 388.6 43.3 27.5
9,846.1 1,415.6 100.0 100.0
Figure 4.20
Discounton exp.
taken over Exposures
Discounton
exposures taken over
BREAKDOWN BY SECTORSPARBANK PORTFOLIOCREDIT EXPOSURE
Public authorities
Agriculture, hunting and forestry
Fisheries
Industry and raw materials extraction
Energy supply
Building and construction
Trade
Transport, hotels and restaurants
Information and communication
Financing and insurance
Real estate
Other business areas
Business customers, total
Retail customers, total
Total
Line of businessDKK m / %
0.9 0.0 0.0 0.0 3.6
434.4 26.8 5.2 21.6 5.0
0.0 0.0 0.0 0.0 0,0
588.8 44.4 13.5 30.9 5.2
257.0 23.0 24.5 -1.5 -0.6
460.3 73.2 72.4 0.8 0.2
562.6 40.3 21.6 18.7 3.3
240.7 109.2 102.5 6.7 2.8
93.8 7.8 1.0 6.8 7.2
342.6 178.4 169.5 8.9 2.6
1,519.6 254.2 51.3 202.9 13.4
1,086.7 269.5 227.9 41.6 3.8
5,587.4 1,027.0 689.4 337.6 6.0
4,258.7 388.6 284.7 100.0 2.4
9,846.1 1,415.6 974.2 441.4 4.5
Discounton exp.
taken over
Loans, adv. and
guar.
Figure 4.21
Discounton exp.
taken over less non-accr.
loans
Discounton exp.
taken over after non-accr. loans, %
Non-accrual
loans
THE GROUP’S CREDIT EXPOSURE TO FINANCIAL CUSTOMERS
Reverse lending
Customers of other financial institutions
The Bank’s own exposuress and central customers, etc
Financial customers, total
2011DKK m
115.5 393.2
277.4 473.0
692.0 442.2
1,084.9 1,308.4
2012
Figure 4.22
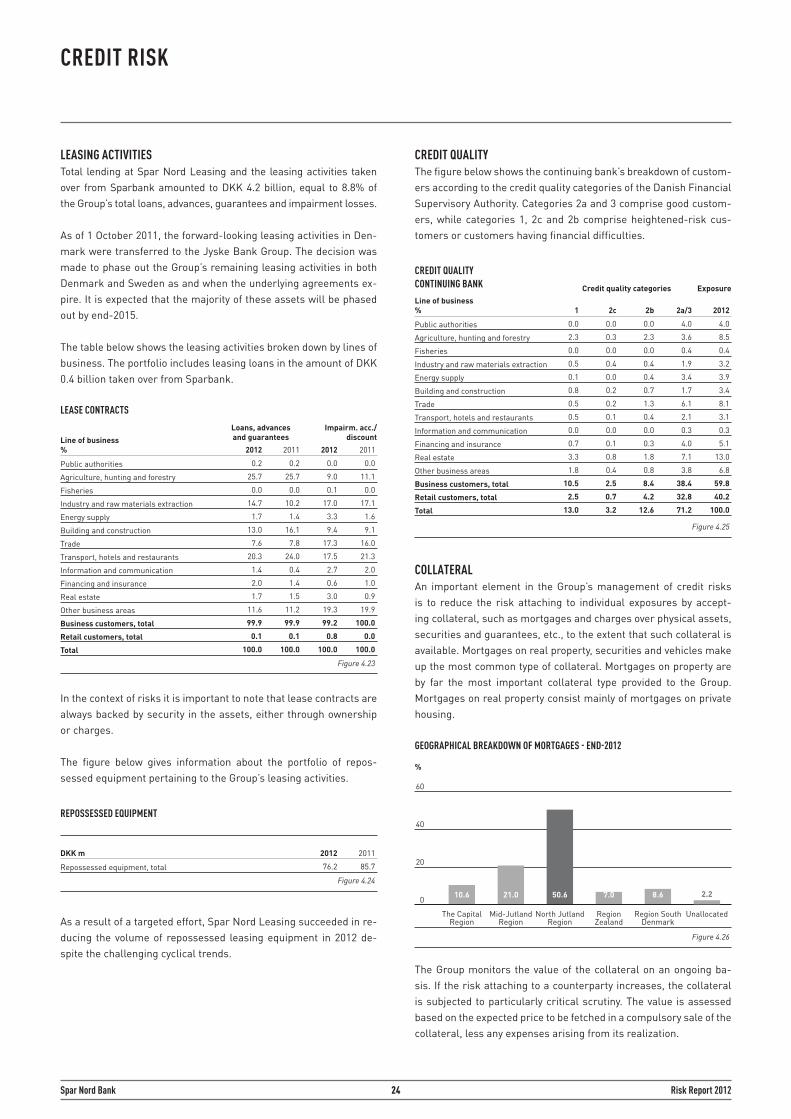
24 Risk Report 2012Spar Nord Bank
0.2 0.2 0.0 0.0
25.7 25.7 9.0 11.1
0.0 0.0 0.1 0.0
14.7 10.2 17.0 17.1
1.7 1.4 3.3 1.6
13.0 16.1 9.4 9.1
7.6 7.8 17.3 16.0
20.3 24.0 17.5 21.3
1.4 0.4 2.7 2.0
2.0 1.4 0.6 1.0
1.7 1.5 3.0 0.9
11.6 11.2 19.3 19.9
99.9 99.9 99.2 100.0
0.1 0.1 0.8 0.0
100.0 100.0 100.0 100.0
LEASE CONTRACTS
Public authorities
Agriculture, hunting and forestry
Fisheries
Industry and raw materials extraction
Energy supply
Building and construction
Trade
Transport, hotels and restaurants
Information and communication
Financing and insurance
Real estate
Other business areas
Business customers, total
Retail customers, total
Total
2011
Loans, advances and guaranteesLine of business
% 20112012
Figure 4.23
Impairm. acc./discount
2012
CREDIT RISK
LEASING ACTIVITIES Total lending at Spar Nord Leasing and the leasing activities taken over from Sparbank amounted to DKK 4.2 billion, equal to 8.8% of the Group’s total loans, advances, guarantees and impairment losses.
As of 1 October 2011, the forward-looking leasing activities in Den-mark were transferred to the Jyske Bank Group. The decision was made to phase out the Group’s remaining leasing activities in both Denmark and Sweden as and when the underlying agreements ex-pire. It is expected that the majority of these assets will be phased out by end-2015.
The table below shows the leasing activities broken down by lines of business. The portfolio includes leasing loans in the amount of DKK 0.4 billion taken over from Sparbank.
In the context of risks it is important to note that lease contracts are always backed by security in the assets, either through ownership or charges.
The figure below gives information about the portfolio of repos-sessed equipment pertaining to the Group’s leasing activities.
As a result of a targeted effort, Spar Nord Leasing succeeded in re-ducing the volume of repossessed leasing equipment in 2012 de-spite the challenging cyclical trends.
CREDIT QUALITY The figure below shows the continuing bank’s breakdown of custom-ers according to the credit quality categories of the Danish Financial Supervisory Authority. Categories 2a and 3 comprise good custom-ers, while categories 1, 2c and 2b comprise heightened-risk cus-tomers or customers having financial difficulties.
COLLATERAL An important element in the Group’s management of credit risks is to reduce the risk attaching to individual exposures by accept-ing collateral, such as mortgages and charges over physical assets, securities and guarantees, etc., to the extent that such collateral is available. Mortgages on real property, securities and vehicles make up the most common type of collateral. Mortgages on property are by far the most important collateral type provided to the Group. Mortgages on real property consist mainly of mortgages on private housing.
The Group monitors the value of the collateral on an ongoing ba-sis. If the risk attaching to a counterparty increases, the collateral is subjected to particularly critical scrutiny. The value is assessed based on the expected price to be fetched in a compulsory sale of the collateral, less any expenses arising from its realization.
REPOSSESSED EQUIPMENT
Repossessed equipment, total
20112012
76.2 85.7
DKK m
Figure 4.24
CREDIT QUALITYCONTINUING BANK
Public authorities
Agriculture, hunting and forestry
Fisheries
Industry and raw materials extraction
Energy supply
Building and construction
Trade
Transport, hotels and restaurants
Information and communication
Financing and insurance
Real estate
Other business areas
Business customers, total
Retail customers, total
Total
2012
Credit quality categoriesLine of business%
0.0 0.0 0.0 4.0 4.0
2.3 0.3 2.3 3.6 8.5
0.0 0.0 0.0 0.4 0.4
0.5 0.4 0.4 1.9 3.2
0.1 0.0 0.4 3.4 3.9
0.8 0.2 0.7 1.7 3.4
0.5 0.2 1.3 6.1 8.1
0.5 0.1 0.4 2.1 3.1
0.0 0.0 0.0 0.3 0.3
0.7 0.1 0.3 4.0 5.1
3.3 0.8 1.8 7.1 13.0
1.8 0.4 0.8 3.8 6.8
10.5 2.5 8.4 38.4 59.8
2.5 0.7 4.2 32.8 40.2
13.0 3.2 12.6 71.2 100.0
2b2c
Figure 4.25
Exposure
2a/31
GEOGRAPHICAL BREAKDOWN OF MORTGAGES - END-2012
10.6 8.6
%
60
40
20
0
The Capital Region
Mid-Jutland Region
North Jutland Region
Region Zealand
Region South Denmark
7.0
Figure 4.26
21.0 50.6 2.2
Unallocated
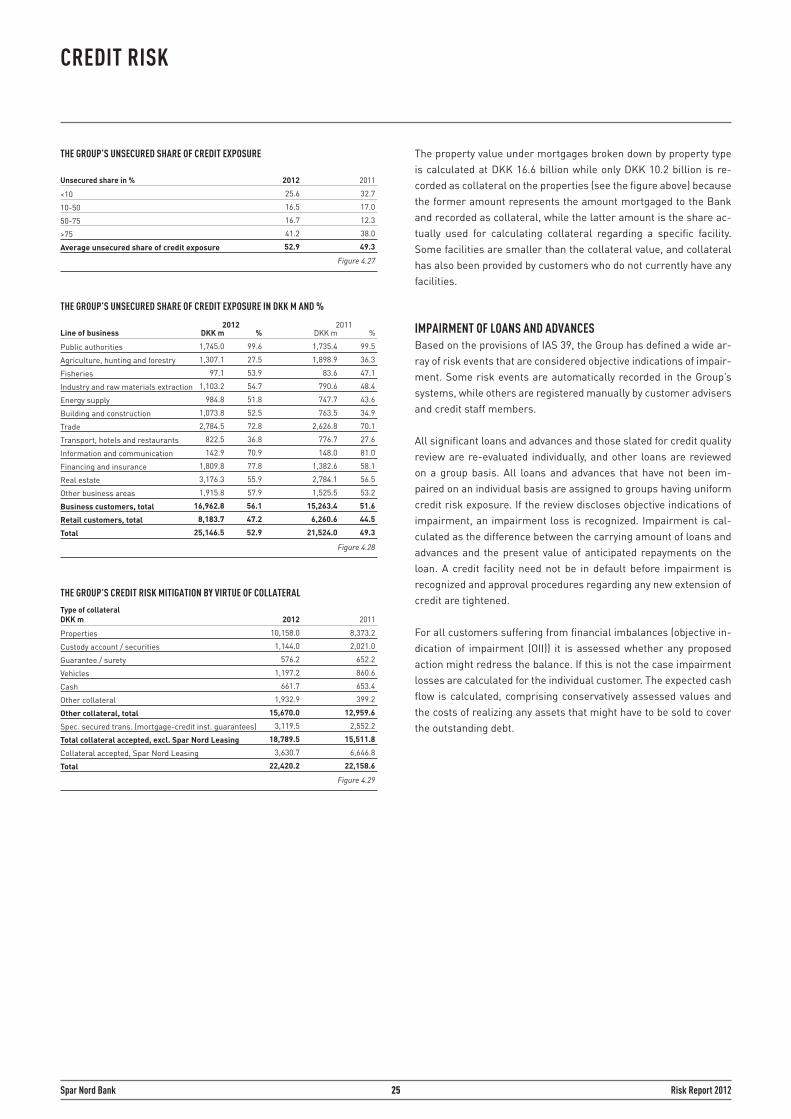
25 Risk Report 2012Spar Nord Bank
CREDIT RISK
The property value under mortgages broken down by property type is calculated at DKK 16.6 billion while only DKK 10.2 billion is re-corded as collateral on the properties (see the figure above) because the former amount represents the amount mortgaged to the Bank and recorded as collateral, while the latter amount is the share ac-tually used for calculating collateral regarding a specific facility. Some facilities are smaller than the collateral value, and collateral has also been provided by customers who do not currently have any facilities.
IMPAIRMENT OF LOANS AND ADVANCES Based on the provisions of IAS 39, the Group has defined a wide ar-ray of risk events that are considered objective indications of impair-ment. Some risk events are automatically recorded in the Group’s systems, while others are registered manually by customer advisers and credit staff members.
All significant loans and advances and those slated for credit quality review are re-evaluated individually, and other loans are reviewed on a group basis. All loans and advances that have not been im-paired on an individual basis are assigned to groups having uniform credit risk exposure. If the review discloses objective indications of impairment, an impairment loss is recognized. Impairment is cal-culated as the difference between the carrying amount of loans and advances and the present value of anticipated repayments on the loan. A credit facility need not be in default before impairment is recognized and approval procedures regarding any new extension of credit are tightened.
For all customers suffering from financial imbalances (objective in-dication of impairment (OII)) it is assessed whether any proposed action might redress the balance. If this is not the case impairment losses are calculated for the individual customer. The expected cash flow is calculated, comprising conservatively assessed values and the costs of realizing any assets that might have to be sold to cover the outstanding debt.
THE GROUP’S UNSECURED SHARE OF CREDIT EXPOSURE
<10
10-50
50-75
>75
Average unsecured share of credit exposure
2011
25.6 32.7
16.5 17.0
16.7 12.3
41.2 38.0
52.9 49.3
2012
Figure 4.27
Unsecured share in %
THE GROUP’S UNSECURED SHARE OF CREDIT EXPOSURE IN DKK M AND %
Public authorities
Agriculture, hunting and forestry
Fisheries
Industry and raw materials extraction
Energy supply
Building and construction
Trade
Transport, hotels and restaurants
Information and communication
Financing and insurance
Real estate
Other business areas
Business customers, total
Retail customers, total
Total
%DKK mLine of business
1,745.0 99.6 1,735.4 99.5
1,307.1 27.5 1,898.9 36.3
97.1 53.9 83.6 47.1
1,103.2 54.7 790.6 48.4
984.8 51.8 747.7 43.6
1,073.8 52.5 763.5 34.9
2,784.5 72.8 2,626.8 70.1
822.5 36.8 776.7 27.6
142.9 70.9 148.0 81.0
1,809.8 77.8 1,382.6 58.1
3,176.3 55.9 2,784.1 56.5
1,915.8 57.9 1,525.5 53.2
16,962.8 56.1 15,263.4 51.6
8,183.7 47.2 6,260.6 44.5
25,146.5 52.9 21,524.0 49.3
%DKK m
Figure 4.28
2012 2011
20112012
THE GROUP’S CREDIT RISK MITIGATION BY VIRTUE OF COLLATERAL
Properties
Custody account / securities
Guarantee / surety
Vehicles
Cash
Other collateral
Other collateral, total
Spec. secured trans. (mortgage-credit inst. guarantees)
Total collateral accepted, excl. Spar Nord Leasing
Collateral accepted, Spar Nord Leasing
Total
10,158.0 8,373.2
1,144.0 2,021.0
576.2 652.2
1,197.2 860.6
661.7 653.4
1,932.9 399.2
15,670.0 12,959.6
3,119.5 2,552.2
18,789.5 15,511.8
3,630.7 6,646.8
22,420.2 22,158.6
Figure 4.29
Type of collateral DKK m
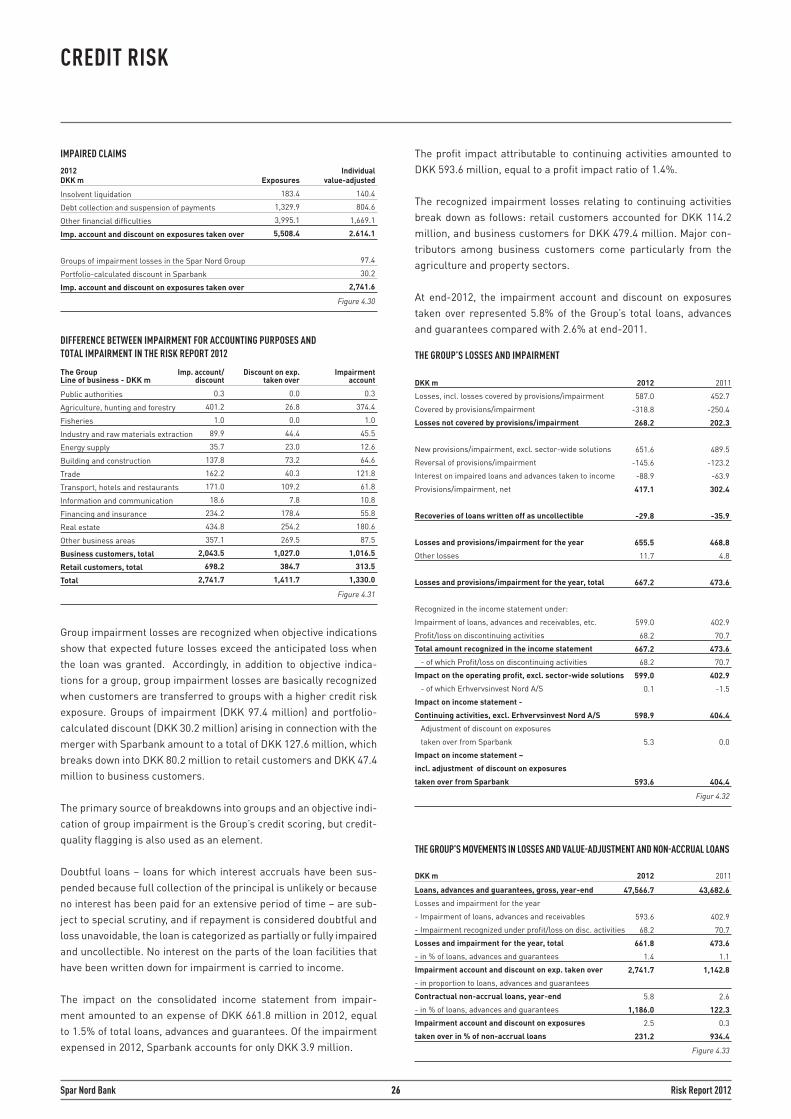
26 Risk Report 2012Spar Nord Bank
CREDIT RISK
Group impairment losses are recognized when objective indications show that expected future losses exceed the anticipated loss when the loan was granted. Accordingly, in addition to objective indica-tions for a group, group impairment losses are basically recognized when customers are transferred to groups with a higher credit risk exposure. Groups of impairment (DKK 97.4 million) and portfolio-calculated discount (DKK 30.2 million) arising in connection with the merger with Sparbank amount to a total of DKK 127.6 million, which breaks down into DKK 80.2 million to retail customers and DKK 47.4 million to business customers.
The primary source of breakdowns into groups and an objective indi-cation of group impairment is the Group’s credit scoring, but credit-quality flagging is also used as an element.
Doubtful loans – loans for which interest accruals have been sus-pended because full collection of the principal is unlikely or because no interest has been paid for an extensive period of time – are sub-ject to special scrutiny, and if repayment is considered doubtful and loss unavoidable, the loan is categorized as partially or fully impaired and uncollectible. No interest on the parts of the loan facilities that have been written down for impairment is carried to income.
The impact on the consolidated income statement from impair-ment amounted to an expense of DKK 661.8 million in 2012, equal to 1.5% of total loans, advances and guarantees. Of the impairment expensed in 2012, Sparbank accounts for only DKK 3.9 million.
The profit impact attributable to continuing activities amounted to DKK 593.6 million, equal to a profit impact ratio of 1.4%.
The recognized impairment losses relating to continuing activities break down as follows: retail customers accounted for DKK 114.2 million, and business customers for DKK 479.4 million. Major con-tributors among business customers come particularly from the agriculture and property sectors.
At end-2012, the impairment account and discount on exposures taken over represented 5.8% of the Group’s total loans, advances and guarantees compared with 2.6% at end-2011.
Figur 4.32
THE GROUP’S LOSSES AND IMPAIRMENT
Losses, incl. losses covered by provisions/impairment
Covered by provisions/impairment
Losses not covered by provisions/impairment
New provisions/impairment, excl. sector-wide solutions
Reversal of provisions/impairment
Interest on impaired loans and advances taken to income
Provisions/impairment, net
Recoveries of loans written off as uncollectible
Losses and provisions/impairment for the year
Other losses
Losses and provisions/impairment for the year, total
Recognized in the income statement under:
Impairment of loans, advances and receivables, etc.
Profit/loss on discontinuing activities
Total amount recognized in the income statement
- of which Profit/loss on discontinuing activities
Impact on the operating profit, excl. sector-wide solutions
- of which Erhvervsinvest Nord A/S
Impact on income statement -
Continuing activities, excl. Erhvervsinvest Nord A/S
Adjustment of discount on exposures
taken over from Sparbank
Impact on income statement –
incl. adjustment of discount on exposures
taken over from Sparbank
2011
587.0 452.7
-318.8 -250.4
268.2 202.3
651.6 489.5
-145.6 -123.2
-88.9 -63.9
417.1 302.4
-29.8 -35.9
655.5 468.8
11.7 4.8
667.2 473.6
599.0 402.9
68.2 70.7
667.2 473.6
68.2 70.7
599.0 402.9
0.1 -1.5
598.9 404.4
5.3 0.0
593.6 404.4
2012 DKK m
IMPAIRED CLAIMS
Insolvent liquidation
Debt collection and suspension of payments
Other financial difficulties
Imp. account and discount on exposures taken over
Groups of impairment losses in the Spar Nord Group
Portfolio-calculated discount in Sparbank
Imp. account and discount on exposures taken over
Individualvalue-adjusted
183.4 140.4
1,329.9 804.6
3,995.1 1,669.1
5,508.4 2.614.1
97.4
30.2
2,741.6
Exposures
Figure 4.30
2012DKK m
DIFFERENCE BETWEEN IMPAIRMENT FOR ACCOUNTING PURPOSES AND TOTAL IMPAIRMENT IN THE RISK REPORT 2012
Public authorities
Agriculture, hunting and forestry
Fisheries
Industry and raw materials extraction
Energy supply
Building and construction
Trade
Transport, hotels and restaurants
Information and communication
Financing and insurance
Real estate
Other business areas
Business customers, total
Retail customers, total
Total
Impairmentaccount
The GroupLine of business - DKK m
0.3 0.0 0.3
401.2 26.8 374.4
1.0 0.0 1.0
89.9 44.4 45.5
35.7 23.0 12.6
137.8 73.2 64.6
162.2 40.3 121.8
171.0 109.2 61.8
18.6 7.8 10.8
234.2 178.4 55.8
434.8 254.2 180.6
357.1 269.5 87.5
2,043.5 1,027.0 1,016.5
698.2 384.7 313.5
2,741.7 1,411.7 1,330.0
Discount on exp. taken over
Imp. account/discount
Figure 4.31
THE GROUP’S MOVEMENTS IN LOSSES AND VALUE-ADJUSTMENT AND NON-ACCRUAL LOANS
Loans, advances and guarantees, gross, year-end
Losses and impairment for the year
- Impairment of loans, advances and receivables
- Impairment recognized under profit/loss on disc. activities
Losses and impairment for the year, total
- in % of loans, advances and guarantees
Impairment account and discount on exp. taken over
- in proportion to loans, advances and guarantees
Contractual non-accrual loans, year-end
- in % of loans, advances and guarantees
Impairment account and discount on exposures
taken over in % of non-accrual loans
2011
47,566.7 43,682.6
593.6 402.9
68.2 70.7
661.8 473.6
1.4 1.1
2,741.7 1,142.8
5.8 2.6
1,186.0 122.3
2.5 0.3
231.2 934.4
2012
Figure 4.33
DKK m
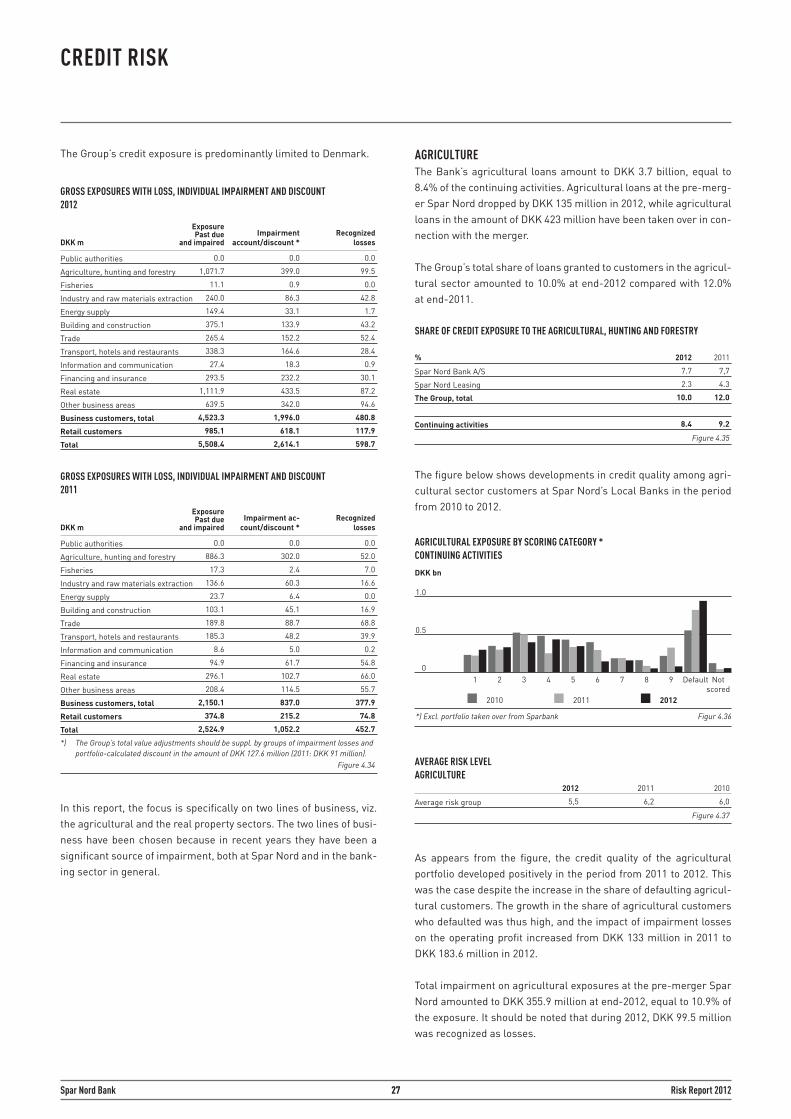
27 Risk Report 2012Spar Nord Bank
CREDIT RISK
The Group’s credit exposure is predominantly limited to Denmark.
In this report, the focus is specifically on two lines of business, viz. the agricultural and the real property sectors. The two lines of busi-ness have been chosen because in recent years they have been a significant source of impairment, both at Spar Nord and in the bank-ing sector in general.
AGRICULTUREThe Bank’s agricultural loans amount to DKK 3.7 billion, equal to 8.4% of the continuing activities. Agricultural loans at the pre-merg-er Spar Nord dropped by DKK 135 million in 2012, while agricultural loans in the amount of DKK 423 million have been taken over in con-nection with the merger.
The Group’s total share of loans granted to customers in the agricul-tural sector amounted to 10.0% at end-2012 compared with 12.0% at end-2011.
The figure below shows developments in credit quality among agri-cultural sector customers at Spar Nord’s Local Banks in the period from 2010 to 2012.
As appears from the figure, the credit quality of the agricultural portfolio developed positively in the period from 2011 to 2012. This was the case despite the increase in the share of defaulting agricul-tural customers. The growth in the share of agricultural customers who defaulted was thus high, and the impact of impairment losses on the operating profit increased from DKK 133 million in 2011 to DKK 183.6 million in 2012.
Total impairment on agricultural exposures at the pre-merger Spar Nord amounted to DKK 355.9 million at end-2012, equal to 10.9% of the exposure. It should be noted that during 2012, DKK 99.5 million was recognized as losses.
AVERAGE RISK LEVELAGRICULTURE
Average risk group
2010
5,5 6,2 6,0
20112012
Figure 4.37
GROSS EXPOSURES WITH LOSS, INDIVIDUAL IMPAIRMENT AND DISCOUNT2012
Public authorities
Agriculture, hunting and forestry
Fisheries
Industry and raw materials extraction
Energy supply
Building and construction
Trade
Transport, hotels and restaurants
Information and communication
Financing and insurance
Real estate
Other business areas
Business customers, total
Retail customers
Total
Recognized losses
0.0 0.0 0.0
1,071.7 399.0 99.5
11.1 0.9 0.0
240.0 86.3 42.8
149.4 33.1 1.7
375.1 133.9 43.2
265.4 152.2 52.4
338.3 164.6 28.4
27.4 18.3 0.9
293.5 232.2 30.1
1,111.9 433.5 87.2
639.5 342.0 94.6
4,523.3 1,996.0 480.8
985.1 618.1 117.9
5,508.4 2,614.1 598.7
Impairment account/discount *
ExposurePast due
and impaired DKK m
GROSS EXPOSURES WITH LOSS, INDIVIDUAL IMPAIRMENT AND DISCOUNT2011
Public authorities
Agriculture, hunting and forestry
Fisheries
Industry and raw materials extraction
Energy supply
Building and construction
Trade
Transport, hotels and restaurants
Information and communication
Financing and insurance
Real estate
Other business areas
Business customers, total
Retail customers
Total
Recognized losses
0.0 0.0 0.0
886.3 302.0 52.0
17.3 2.4 7.0
136.6 60.3 16.6
23.7 6.4 0.0
103.1 45.1 16.9
189.8 88.7 68.8
185.3 48.2 39.9
8.6 5.0 0.2
94.9 61.7 54.8
296.1 102.7 66.0
208.4 114.5 55.7
2,150.1 837.0 377.9
374.8 215.2 74.8
2,524.9 1,052.2 452.7
Impairment ac-count/discount *
ExposurePast due
and impaired
Figure 4.34
DKK m
*) The Group’s total value adjustments should be suppl. by groups of impairment losses and portfolio-calculated discount in the amount of DKK 127.6 million (2011: DKK 91 million).
SHARE OF CREDIT EXPOSURE TO THE AGRICULTURAL, HUNTING AND FORESTRY
Spar Nord Bank A/S
Spar Nord Leasing
The Group, total
Continuing activities
2011%
7.7 7,7
2.3 4.3
10.0 12.0
8.4 9.2
Figure 4.35
2012
*) Excl. portfolio taken over from Sparbank Figur 4.36
AGRICULTURAL EXPOSURE BY SCORING CATEGORY *CONTINUING ACTIVITIES
DKK bn
1.0
0.5
0
2010 2011 2012
Not scored
Default98765431 2
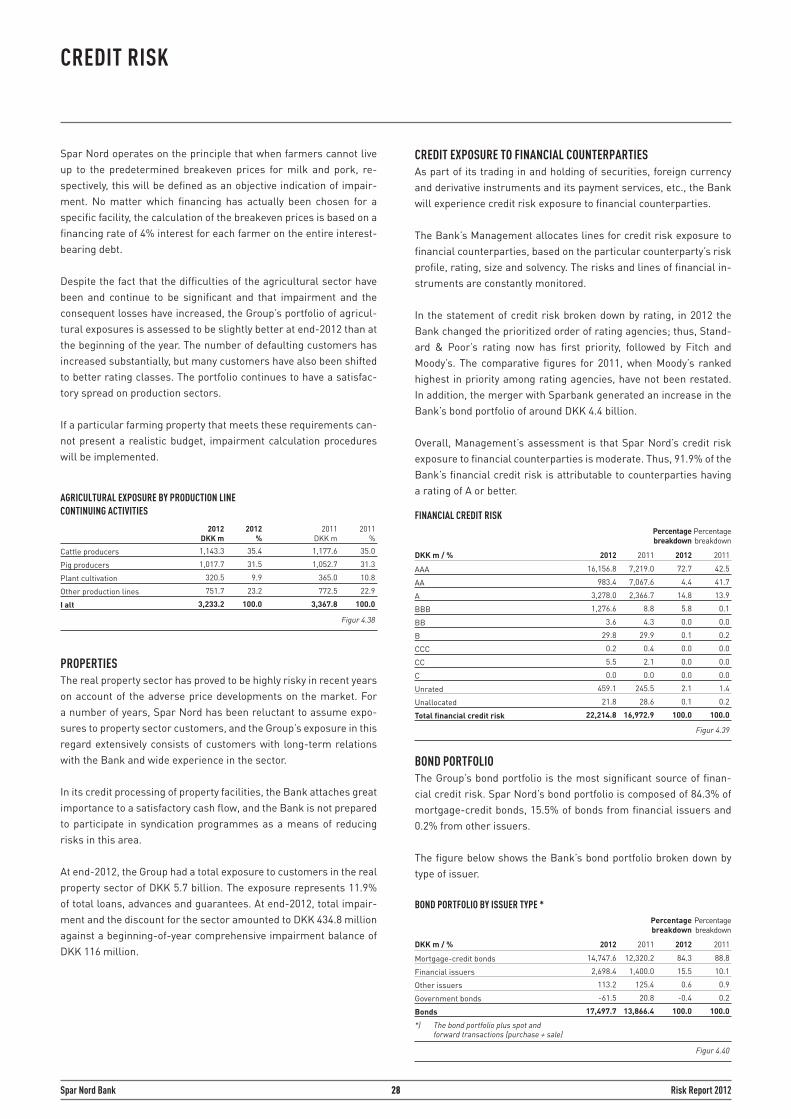
28 Risk Report 2012Spar Nord Bank
CREDIT RISK
Spar Nord operates on the principle that when farmers cannot live up to the predetermined breakeven prices for milk and pork, re-spectively, this will be defined as an objective indication of impair-ment. No matter which financing has actually been chosen for a specific facility, the calculation of the breakeven prices is based on a financing rate of 4% interest for each farmer on the entire interest-bearing debt.
Despite the fact that the difficulties of the agricultural sector have been and continue to be significant and that impairment and the consequent losses have increased, the Group’s portfolio of agricul-tural exposures is assessed to be slightly better at end-2012 than at the beginning of the year. The number of defaulting customers has increased substantially, but many customers have also been shifted to better rating classes. The portfolio continues to have a satisfac-tory spread on production sectors.
If a particular farming property that meets these requirements can-not present a realistic budget, impairment calculation procedures will be implemented.
PROPERTIESThe real property sector has proved to be highly risky in recent years on account of the adverse price developments on the market. For a number of years, Spar Nord has been reluctant to assume expo-sures to property sector customers, and the Group’s exposure in this regard extensively consists of customers with long-term relations with the Bank and wide experience in the sector.
In its credit processing of property facilities, the Bank attaches great importance to a satisfactory cash flow, and the Bank is not prepared to participate in syndication programmes as a means of reducing risks in this area.
At end-2012, the Group had a total exposure to customers in the real property sector of DKK 5.7 billion. The exposure represents 11.9% of total loans, advances and guarantees. At end-2012, total impair-ment and the discount for the sector amounted to DKK 434.8 million against a beginning-of-year comprehensive impairment balance of DKK 116 million.
CREDIT EXPOSURE TO FINANCIAL COUNTERPARTIES As part of its trading in and holding of securities, foreign currency and derivative instruments and its payment services, etc., the Bank will experience credit risk exposure to financial counterparties.
The Bank’s Management allocates lines for credit risk exposure to financial counterparties, based on the particular counterparty’s risk profile, rating, size and solvency. The risks and lines of financial in-struments are constantly monitored.
In the statement of credit risk broken down by rating, in 2012 the Bank changed the prioritized order of rating agencies; thus, Stand-ard & Poor’s rating now has first priority, followed by Fitch and Moody’s. The comparative figures for 2011, when Moody’s ranked highest in priority among rating agencies, have not been restated. In addition, the merger with Sparbank generated an increase in the Bank’s bond portfolio of around DKK 4.4 billion.
Overall, Management’s assessment is that Spar Nord’s credit risk exposure to financial counterparties is moderate. Thus, 91.9% of the Bank’s financial credit risk is attributable to counterparties having a rating of A or better.
BOND PORTFOLIO The Group’s bond portfolio is the most significant source of finan-cial credit risk. Spar Nord’s bond portfolio is composed of 84.3% of mortgage-credit bonds, 15.5% of bonds from financial issuers and 0.2% from other issuers.
The figure below shows the Bank’s bond portfolio broken down by type of issuer.
FINANCIAL CREDIT RISK
AAA
AA
A
BBB
BB
B
CCC
CC
C
Unrated
Unallocated
Total financial credit risk
16,156.8 7,219.0 72.7 42.5
983.4 7,067.6 4.4 41.7
3,278.0 2,366.7 14.8 13.9
1,276.6 8.8 5.8 0.1
3.6 4.3 0.0 0.0
29.8 29.9 0.1 0.2
0.2 0.4 0.0 0.0
5.5 2.1 0.0 0.0
0.0 0.0 0.0 0.0
459.1 245.5 2.1 1.4
21.8 28.6 0.1 0.2
22,214.8 16,972.9 100.0 100.0
2011
Percentage breakdown
DKK m / % 20112012
Figur 4.39
Percentage breakdown
2012
BOND PORTFOLIO BY ISSUER TYPE *
Mortgage-credit bonds
Financial issuers
Other issuers
Government bonds
Bonds
*) The bond portfolio plus spot and forward transactions (purchase + sale)
14,747.6 12,320.2 84.3 88.8
2,698.4 1,400.0 15.5 10.1
113.2 125.4 0.6 0.9
-61.5 20.8 -0.4 0.2
17,497.7 13,866.4 100.0 100.0
2011
Percentagebreakdown
DKK m / % 20112012
Figur 4.40
Percentagebreakdown
2012
AGRICULTURAL EXPOSURE BY PRODUCTION LINECONTINUING ACTIVITIES
Cattle producers
Pig producers
Plant cultivation
Other production lines
I alt
2011%
1,143.3 35.4 1,177.6 35.0
1,017.7 31.5 1,052.7 31.3
320.5 9.9 365.0 10.8
751.7 23.2 772.5 22.9
3,233.2 100.0 3,367.8 100.0
Figur 4.38
2011DKK m
2012%
2012DKK m
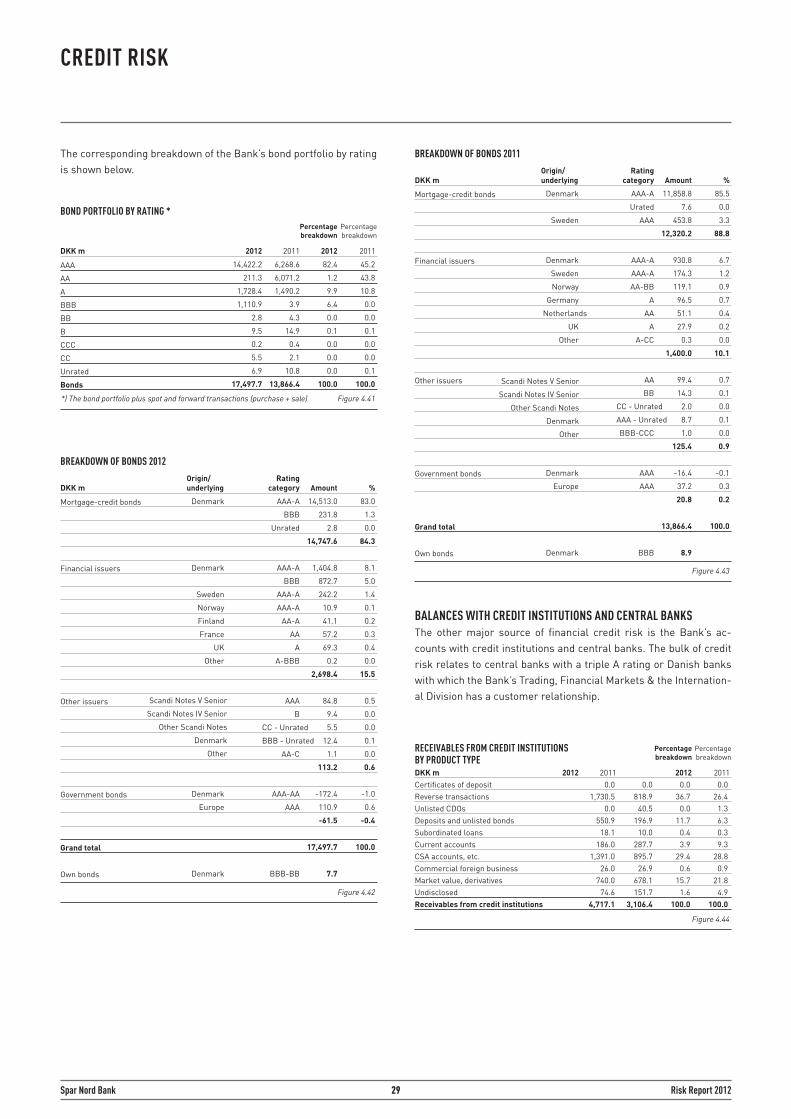
29 Risk Report 2012Spar Nord Bank
CREDIT RISK
The corresponding breakdown of the Bank’s bond portfolio by rating is shown below.
BALANCES WITH CREDIT INSTITUTIONS AND CENTRAL BANKS The other major source of financial credit risk is the Bank’s ac-counts with credit institutions and central banks. The bulk of credit risk relates to central banks with a triple A rating or Danish banks with which the Bank’s Trading, Financial Markets & the Internation-al Division has a customer relationship.
14,422.2 6,268.6 82.4 45.2
211.3 6,071.2 1.2 43.8
1,728.4 1,490.2 9.9 10.8
1,110.9 3.9 6.4 0.0
2.8 4.3 0.0 0.0
9.5 14.9 0.1 0.1
0.2 0.4 0.0 0.0
5.5 2.1 0.0 0.0
6.9 10.8 0.0 0.1
17,497.7 13,866.4 100.0 100.0
BOND PORTFOLIO BY RATING *
AAA
AA
A
BBB
BB
B
CCC
CC
Unrated
Bonds
2011
Percentagebreakdown
DKK m 20112012
*) The bond portfolio plus spot and forward transactions (purchase + sale) Figure 4.41
Percentagebreakdown
2012
BREAKDOWN OF BONDS 2012
Mortgage-credit bonds
Financial issuers
Other issuers
Government bonds
Grand total
Own bonds
%DKK m
Denmark AAA-A 14,513.0 83.0
BBB 231.8 1.3
Unrated 2.8 0.0
14,747.6 84.3
Denmark AAA-A 1,404.8 8.1
BBB 872.7 5.0
Sweden AAA-A 242.2 1.4
Norway AAA-A 10.9 0.1
Finland AA-A 41.1 0.2
France AA 57.2 0.3
UK A 69.3 0.4
Other A-BBB 0.2 0.0
2,698.4 15.5
AAA 84.8 0.5
B 9.4 0.0
CC - Unrated 5.5 0.0
BBB - Unrated 12.4 0.1
AA-C 1.1 0.0
113.2 0.6
Denmark AAA-AA -172.4 -1.0
Europe AAA 110.9 0.6
-61.5 -0.4
17,497.7 100.0
Denmark BBB-BB 7.7
Ratingcategory
Origin/underlying
Figure 4.42
Amount
Scandi Notes V Senior
Scandi Notes IV Senior
Other Scandi Notes
Denmark
Other
BREAKDOWN OF BONDS 2011
Mortgage-credit bonds
Financial issuers
Other issuers
Government bonds
Grand total
Own bonds
%DKK m
Denmark AAA-A 11,858.8 85.5
Urated 7.6 0.0
Sweden AAA 453.8 3.3
12,320.2 88.8
Denmark AAA-A 930.8 6.7
Sweden AAA-A 174.3 1.2
Norway AA-BB 119.1 0.9
Germany A 96.5 0.7
Netherlands AA 51.1 0.4
UK A 27.9 0.2
Other A-CC 0.3 0.0
1,400.0 10.1
AA 99.4 0.7
BB 14.3 0.1
CC - Unrated 2.0 0.0
AAA - Unrated 8.7 0.1
BBB-CCC 1.0 0.0
125.4 0.9
Denmark AAA -16.4 -0.1
Europe AAA 37.2 0.3
20.8 0.2
13,866.4 100.0
Denmark BBB 8.9
Ratingcategory
Origin/underlying
Figure 4.43
Amount
Scandi Notes V Senior
Scandi Notes IV Senior
Other Scandi Notes
Denmark
Other
RECEIVABLES FROM CREDIT INSTITUTIONSBY PRODUCT TYPE
Certificates of deposit Reverse transactionsUnlisted CDOsDeposits and unlisted bondsSubordinated loansCurrent accountsCSA accounts, etc.Commercial foreign businessMarket value, derivativesUndisclosedReceivables from credit institutions
0.0 0.0 0.0 0.0 1,730.5 818.9 36.7 26.4 0.0 40.5 0.0 1.3 550.9 196.9 11.7 6.3 18.1 10.0 0.4 0.3 186.0 287.7 3.9 9.3 1,391.0 895.7 29.4 28.8 26.0 26.9 0.6 0.9 740.0 678.1 15.7 21.8 74.6 151.7 1.6 4.9 4,717.1 3,106.4 100.0 100.0
2011DKK m 20112012
Figure 4.44
Percentage breakdown
2012
Percentage breakdown

30 Risk Report 2012Spar Nord Bank
CREDIT RISK
86.1% of Spar Nord’s balances with credit institutions concerns banks with a rating of an A or higher. Of the total DKK 4.7 billion balance with credit institutions, 36.8% is attributable to institutions with an AAA rating, 16.4% to institutions with an AA rating, and 32.9% to institutions with an A rating. Balances with unrated credit institutions are attributable primarily to Danish financial institutions that perform their clearing through Spar Nord.
COUNTERPARTY RISK FOR FINANCIAL COUNTERPARTIES AND INSTITUTIONAL CUSTOMERS Counterparty risk is the risk of loss because a financial counter-party or an institutional customer defaults on its obligations under a financial contract. In addition, settlement risks may arise when fi-nancial contracts are concluded and settled, as principals in various currencies are not necessarily exchanged at the same time or secu-rities are not received simultaneously with the appropriate payment.
In terms of solvency, the counterparty risk has been determined ac-cording to the market-value approach. The counterparty risk, in terms of solvency, has been calculated as a gross amount of DKK 2,813 mil-lion at 31 December 2012. The positive market value for accounting purposes amounted to DKK 2,068 million. The difference between the market value for accounting purposes and the solvency value is attributable to the add-on of potential future credit exposure and ac-crued interest, which are both included in the solvency calculation.
Utilization of lines with respect to financial contracts is calculated on a gross basis as weighted principals of all transactions conclud-ed, to which is added the sum of all positive market values, whereas negative market values are not offset. The size of principal weighting for the individual financial transactions is calculated based on the volatility of the interest rate and the currency, and due consideration is paid to the term to maturity of the specific financial transaction.
The Group’s business procedures specify the maximum term to ma-turity for the individual financial transactions, and compliance is fol-lowed up on a daily basis, as is compliance with the authorized lines.
In connection with authorizing and coding lines, a check is per-formed to verify whether the coded lines accord with the authoriza-tion details, and Spar Nord additionally has a controller department that conducts random sampling of compliance as concerns authori-zation of lines, routines and business procedures.
Before lines are granted to financial counterparties and institutional customers, a thorough credit assessment is made of the financial counterparties/institutional customers based on the financial state-
ments of the individual credit institution/institutional customer. As concerns foreign and major Danish credit institutions, attention is also paid to how the credit institutions are rated by international rat-ing agencies, such as Standard & Poors, Fitch or Moody’s.
The Group cooperates with a number of small Danish credit insti-tutions, as the Bank supplies services within clearing, securities and foreign-exchange transactions. Spar Nord has developed a rat-ing model to assess such credit institutions. This model is used to calculate the score/rating of the individual credit institution based on specific key ratios. Together with the financial statements of the individual credit institutions, this model forms the basis for recom-mending and authorizing lines.
To the extent possible, Spar Nord Bank enters into framework, net-ting and collateral agreements as a buffer against the counterparty risk.
As concerns small Danish credit institutions, such agreements will be based on the framework agreement prepared by the Dan-ish Bankers’ Association for forex and securities transactions, and when assessed to be necessary, also a collateral agreement, ac-cording to which it is agreed that if the net market value of the con-cluded financial contracts exceeds an individually fixed maximum for each credit institution, appropriate collateral must be furnished, in most cases by way of cash deposits.
For foreign and large Danish credit institutions and institutional customers, netting and framework agreements will be based on the international ISDA Master Agreements, often with associated Credit Support Annexes (CSA), according to which it is agreed that if the net market value of the concluded financial contracts exceeds an individually fixed maximum for each agreement, then collateral will have to be exchanged, most frequently by way of cash deposits in EUR or DKK.
In addition, when deemed appropriate, Global Master Repurchase Agreements (GMRA) and Global Master Securities Lending Agree-ments (GMSLA) will be concluded to secure repo/reverse transac-tions and share loan transactions.
Both Danish and foreign collateral agreements are followed up on a daily basis, as are exchanges of collateral in step with fluctuations in the market values of the transactions concluded. In addition, to the widest extent possible the Group settles transactions via CLS, VP or Euroclear, which serves to minimize settlement risks as much as possible.
The table below shows developments in the number of authorized lines from 2011 to 2012:
Just as compliance with authorized lines is controlled daily, ongo-ing controls are performed to check whether authorized lines are being utilized, and if not, the lines are either withdrawn or the limit reduced to current requirements.
DEVELOPMENT IN NUMBER OF AUTHORIZED LINES
Number of authorized lines to credit institutions, total
Of which, the local financial institutions in Denmark
Lines to institutional customers
End-2011
128 129
46 53
8 7
End-2012
Figur 4.46
1,734.6 950.4 36.8 30.6 772.1 996.4 16.4 32.0 1,549.6 876.4 32.9 28.2 165.7 4.9 3.5 0.2 0.8 0.0 0.0 0.0 20.3 15.0 0.4 0.5 0.0 0.0 0.0 0.0 0.0 0.0 0.0 0.0 0.0 0.0 0.0 0.0 452.2 234.7 9.6 7.6 21.8 28.6 0.4 0.9 4,717.1 3,106.4 100.0 100.0
RECEIVABLES FROM CREDIT INSTITUTIONSBY RATING
AAAAAABBBBBBCCCCCCUnratedUnallocated
Receivables from credit institutions
2011DKK m 20112012
Figure 4.45
Percentage breakdown
2012
Percentage breakdown
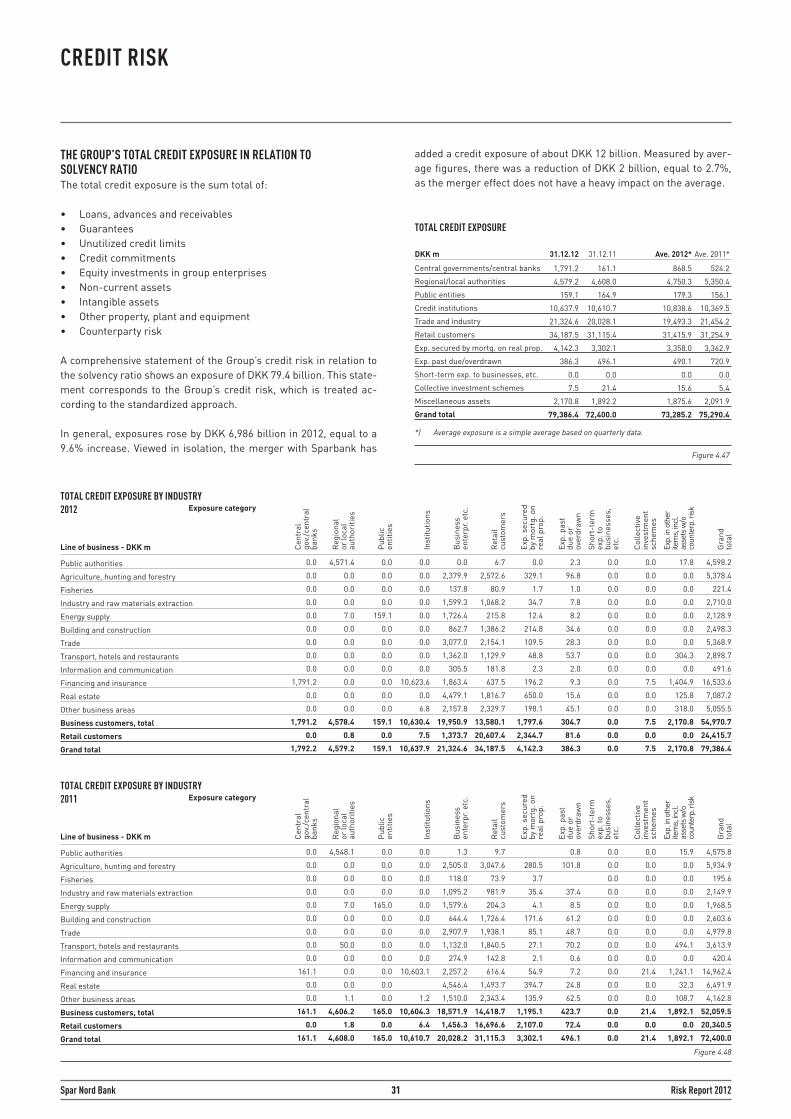
31 Risk Report 2012Spar Nord Bank
CREDIT RISK
THE GROUP’S TOTAL CREDIT EXPOSURE IN RELATION TO SOLVENCY RATIO The total credit exposure is the sum total of:
• Loans, advances and receivables • Guarantees • Unutilized credit limits • Credit commitments • Equity investments in group enterprises • Non-current assets • Intangible assets • Other property, plant and equipment • Counterparty risk
A comprehensive statement of the Group’s credit risk in relation to the solvency ratio shows an exposure of DKK 79.4 billion. This state-ment corresponds to the Group’s credit risk, which is treated ac-cording to the standardized approach.
In general, exposures rose by DKK 6,986 billion in 2012, equal to a 9.6% increase. Viewed in isolation, the merger with Sparbank has
added a credit exposure of about DKK 12 billion. Measured by aver-age figures, there was a reduction of DKK 2 billion, equal to 2.7%, as the merger effect does not have a heavy impact on the average.
TOTAL CREDIT EXPOSURE
Central governments/central banks
Regional/local authorities
Public entities
Credit institutions
Trade and industry
Retail customers
Exp. secured by mortg. on real prop.
Exp. past due/overdrawn
Short-term exp. to businesses, etc.
Collective investment schemes
Miscellaneous assets
Grand total
Ave. 2011*Ave. 2012*DKK m
1,791.2 161.1 868.5 524.2
4,579.2 4,608.0 4,750.3 5,350.4
159.1 164.9 179.3 156.1
10,637.9 10,610.7 10,838.6 10,369.5
21,324.6 20,028.1 19,493.3 21,454.2
34,187.5 31,115.4 31,415.9 31,254.9
4,142.3 3,302.1 3,358.0 3,362.9
386.3 496.1 490.1 720.9
0.0 0.0 0.0 0.0
7.5 21.4 15.6 5.4
2,170.8 1,892.2 1,875.6 2,091.9
79,386.4 72,400.0 73,285.2 75,290.4
31.12.1131.12.12
Figure 4.47
*) Average exposure is a simple average based on quarterly data.
TOTAL CREDIT EXPOSURE BY INDUSTRY2012
Public authorities
Agriculture, hunting and forestry
Fisheries
Industry and raw materials extraction
Energy supply
Building and construction
Trade
Transport, hotels and restaurants
Information and communication
Financing and insurance
Real estate
Other business areas
Business customers, total
Retail customers
Grand total
Line of business - DKK m
0.0 4,571.4 0.0 0.0 0.0 6.7 0.0 2.3 0.0 0.0 17.8 4,598.2
0.0 0.0 0.0 0.0 2,379.9 2,572.6 329.1 96.8 0.0 0.0 0.0 5,378.4
0.0 0.0 0.0 0.0 137.8 80.9 1.7 1.0 0.0 0.0 0.0 221.4
0.0 0.0 0.0 0.0 1,599.3 1,068.2 34.7 7.8 0.0 0.0 0.0 2,710.0
0.0 7.0 159.1 0.0 1,726.4 215.8 12.4 8.2 0.0 0.0 0.0 2,128.9
0.0 0.0 0.0 0.0 862.7 1,386.2 214.8 34.6 0.0 0.0 0.0 2,498.3
0.0 0.0 0.0 0.0 3,077.0 2,154.1 109.5 28.3 0.0 0.0 0.0 5,368.9
0.0 0.0 0.0 0.0 1,362.0 1,129.9 48.8 53.7 0.0 0.0 304.3 2,898.7
0.0 0.0 0.0 0.0 305.5 181.8 2.3 2.0 0.0 0.0 0.0 491.6
1,791.2 0.0 0.0 10,623.6 1,863.4 637.5 196.2 9.3 0.0 7.5 1,404.9 16,533.6
0.0 0.0 0.0 0.0 4,479.1 1,816.7 650.0 15.6 0.0 0.0 125.8 7,087.2
0.0 0.0 0.0 6.8 2,157.8 2,329.7 198.1 45.1 0.0 0.0 318.0 5,055.5
1,791.2 4,578.4 159.1 10,630.4 19,950.9 13,580.1 1,797.6 304.7 0.0 7.5 2,170.8 54,970.7
0.0 0.8 0.0 7.5 1,373.7 20,607.4 2,344.7 81.6 0.0 0.0 0.0 24,415.7
1,792.2 4,579.2 159.1 10,637.9 21,324.6 34,187.5 4,142.3 386.3 0.0 7.5 2,170.8 79,386.4
Cent
ral
gov.
/cen
tral
ba
nks
Reg
iona
l or
loca
l au
thor
ities
Publ
ic
entit
ies
Inst
itutio
ns
Bus
ines
sen
terp
r. et
c.
Ret
ail
cust
omer
s
Exp.
sec
ured
by
mor
tg. o
n re
al p
rop.
Exp.
pas
t du
e or
ov
erdr
awn
Shor
t-te
rm
exp.
to
busi
ness
es,
etc.
Colle
ctiv
e in
vest
men
t sc
hem
es
Exp.
in o
ther
ite
ms,
incl
. as
sets
w/o
co
unte
rp. r
isk
Gra
nd
tota
l
Exposure category
Figure 4.48
TOTAL CREDIT EXPOSURE BY INDUSTRY2011
Public authorities
Agriculture, hunting and forestry
Fisheries
Industry and raw materials extraction
Energy supply
Building and construction
Trade
Transport, hotels and restaurants
Information and communication
Financing and insurance
Real estate
Other business areas
Business customers, total
Retail customers
Grand total
Line of business - DKK m
0.0 4,548.1 0.0 0.0 1.3 9.7 0.8 0.0 0.0 15.9 4,575.8
0.0 0.0 0.0 0.0 2,505.0 3,047.6 280.5 101.8 0.0 0.0 0.0 5,934.9
0.0 0.0 0.0 0.0 118.0 73.9 3.7 0.0 0.0 0.0 195.6
0.0 0.0 0.0 0.0 1,095.2 981.9 35.4 37.4 0.0 0.0 0.0 2,149.9
0.0 7.0 165.0 0.0 1,579.6 204.3 4.1 8.5 0.0 0.0 0.0 1,968.5
0.0 0.0 0.0 0.0 644.4 1,726.4 171.6 61.2 0.0 0.0 0.0 2,603.6
0.0 0.0 0.0 0.0 2,907.9 1,938.1 85.1 48.7 0.0 0.0 0.0 4,979.8
0.0 50.0 0.0 0.0 1,132.0 1,840.5 27.1 70.2 0.0 0.0 494.1 3,613.9
0.0 0.0 0.0 0.0 274.9 142.8 2.1 0.6 0.0 0.0 0.0 420.4
161.1 0.0 0.0 10,603.1 2,257.2 616.4 54.9 7.2 0.0 21.4 1,241.1 14,962.4
0.0 0.0 0.0 4,546.4 1,493.7 394.7 24.8 0.0 0.0 32.3 6,491.9
0.0 1.1 0.0 1.2 1,510.0 2,343.4 135.9 62.5 0.0 0.0 108.7 4,162.8
161.1 4,606.2 165.0 10,604.3 18,571.9 14,418.7 1,195.1 423.7 0.0 21.4 1,892.1 52,059.5
0.0 1.8 0.0 6.4 1,456.3 16,696.6 2,107.0 72.4 0.0 0.0 0.0 20,340.5
161.1 4,608.0 165.0 10,610.7 20,028.2 31,115.3 3,302.1 496.1 0.0 21.4 1,892.1 72,400.0
Exposure category
Cent
ral
gov.
/cen
tral
ba
nks
Reg
iona
l or
loca
l au
thor
ities
Publ
ic
entit
ies
Inst
itutio
ns
Bus
ines
sen
terp
r. et
c.
Ret
ail
cust
omer
s
Exp.
sec
ured
by
mor
tg. o
n re
al p
rop.
Exp.
pas
t du
e or
ov
erdr
awn
Shor
t-te
rm
exp.
to
busi
ness
es,
etc.
Colle
ctiv
e in
vest
men
t sc
hem
es
Exp.
in o
ther
ite
ms,
incl
. as
sets
w/o
co
unte
rp. r
isk
Gra
nd
tota
l
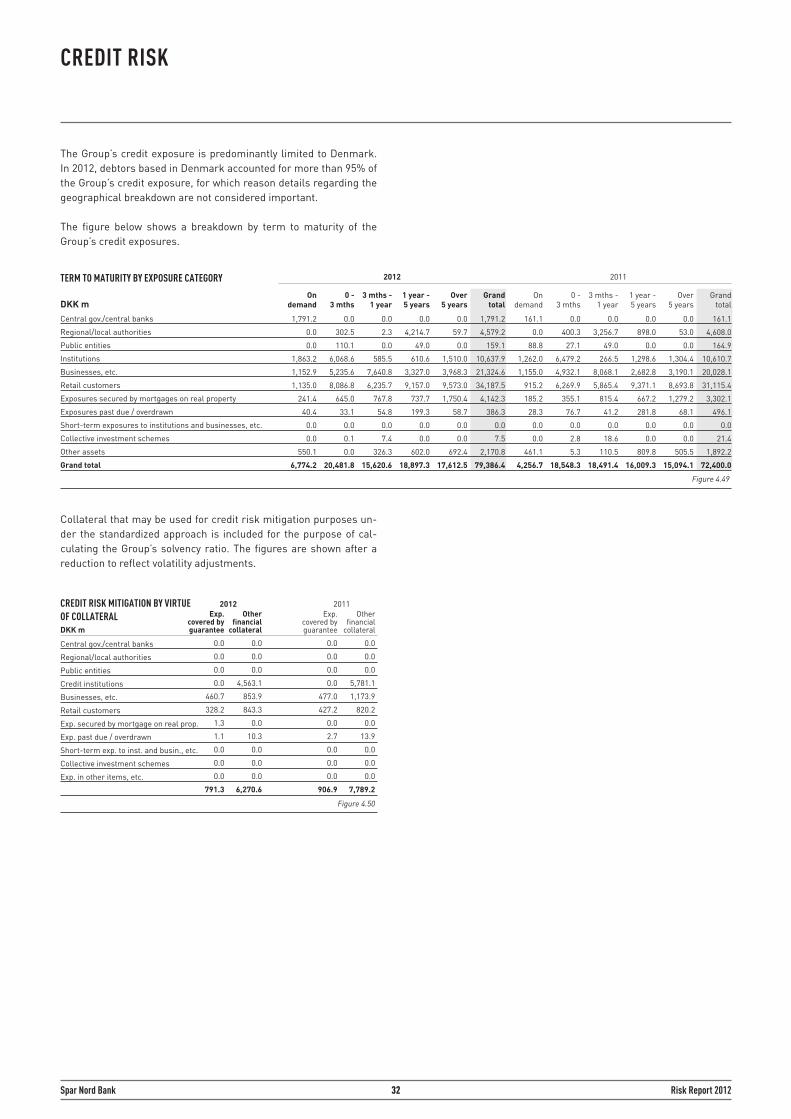
32 Risk Report 2012Spar Nord Bank
The Group’s credit exposure is predominantly limited to Denmark. In 2012, debtors based in Denmark accounted for more than 95% of the Group’s credit exposure, for which reason details regarding the geographical breakdown are not considered important.
The figure below shows a breakdown by term to maturity of the Group’s credit exposures.
Collateral that may be used for credit risk mitigation purposes un-der the standardized approach is included for the purpose of cal-culating the Group’s solvency ratio. The figures are shown after a reduction to reflect volatility adjustments.
CREDIT RISK
2012 2011TERM TO MATURITY BY EXPOSURE CATEGORY
Central gov./central banks
Regional/local authorities
Public entities
Institutions
Businesses, etc.
Retail customers
Exposures secured by mortgages on real property
Exposures past due / overdrawn
Short-term exposures to institutions and businesses, etc.
Collective investment schemes
Other assets
Grand total
DKK m 1,791.2 0.0 0.0 0.0 0.0 1,791.2 161.1 0.0 0.0 0.0 0.0 161.1
0.0 302.5 2.3 4,214.7 59.7 4,579.2 0.0 400.3 3,256.7 898.0 53.0 4,608.0
0.0 110.1 0.0 49.0 0.0 159.1 88.8 27.1 49.0 0.0 0.0 164.9
1,863.2 6,068.6 585.5 610.6 1,510.0 10,637.9 1,262.0 6,479.2 266.5 1,298.6 1,304.4 10,610.7
1,152.9 5,235.6 7,640.8 3,327.0 3,968.3 21,324.6 1,155.0 4,932.1 8,068.1 2,682.8 3,190.1 20,028.1
1,135.0 8,086.8 6,235.7 9,157.0 9,573.0 34,187.5 915.2 6,269.9 5,865.4 9,371.1 8,693.8 31,115.4
241.4 645.0 767.8 737.7 1,750.4 4,142.3 185.2 355.1 815.4 667.2 1,279.2 3,302.1
40.4 33.1 54.8 199.3 58.7 386.3 28.3 76.7 41.2 281.8 68.1 496.1
0.0 0.0 0.0 0.0 0.0 0.0 0.0 0.0 0.0 0.0 0.0 0.0
0.0 0.1 7.4 0.0 0.0 7.5 0.0 2.8 18.6 0.0 0.0 21.4
550.1 0.0 326.3 602.0 692.4 2,170.8 461.1 5.3 110.5 809.8 505.5 1,892.2
6,774.2 20,481.8 15,620.6 18,897.3 17,612.5 79,386.4 4,256.7 18,548.3 18,491.4 16,009.3 15,094.1 72,400.0
On demand
0 - 3 mths
3 mths - 1 year
1 year - 5 years
Over 5 years
Grandtotal
On demand
0 - 3 mths
3 mths - 1 year
1 year - 5 years
Over 5 years
Grand total
Figure 4.49
CREDIT RISK MITIGATION BY VIRTUE OF COLLATERAL
Central gov./central banks
Regional/local authorities
Public entities
Credit institutions
Businesses, etc.
Retail customers
Exp. secured by mortgage on real prop.
Exp. past due / overdrawn
Short-term exp. to inst. and busin., etc.
Collective investment schemes
Exp. in other items, etc.
Other financial
collateral
Exp. covered by guaranteeDKK m
0.0 0.0 0.0 0.0
0.0 0.0 0.0 0.0
0.0 0.0 0.0 0.0
0.0 4,563.1 0.0 5,781.1
460.7 853.9 477.0 1,173.9
328.2 843.3 427.2 820.2
1.3 0.0 0.0 0.0
1.1 10.3 2.7 13.9
0.0 0.0 0.0 0.0
0.0 0.0 0.0 0.0
0.0 0.0 0.0 0.0
791.3 6,270.6 906.9 7,789.2
Other financial
collateral
Exp. covered by guarantee
Figure 4.50
2012 2011

33 Risk Report 2012Spar Nord Bank
MARKET RISK
Market risk is an umbrella heading for the risk of loss caused by fluctuations in exchange rates or prices for financial instruments.Market risks can be broken down into:
• Interest-rate risk • Foreign-exchange risk • Equity market risk • Commodity risk • Option risk • Risks related to own properties
Spar Nord deals and takes positions in products that hold a number of market-based risks. Most of the Bank’s activities regarding trad-ing and position-taking include relatively simple products, of which interest-based products are the most traded ones. The Bank also deals and takes positions in listed shares and foreign-exchange in-struments, whereas trading in commodities is very limited.
MARKET RISK POLICY AND PLATFORM As discussed in the section “Risk management”, Spar Nord’s Board of Directors determines the overarching policies, frameworks and principles for risk governance. Some of the policies are concerned with identifying and estimating various types of market risk. The frameworks support the general proclivity to assume risks and indi-cate specific limits on the extent of risk the Bank is ready to assume. The principles establish the methodology to be used in calculating the various risk targets. The Board of Directors receives continuous reporting on risk developments and the utilization of allocated risk limits.
For its management of market risks, the Bank has established a three-tier instruction hierarchy. At the first tier-level, the Board of Directors issues the definition of the limits for the Spar Nord Group to the Executive Board. At the second tier-level, the Executive Board delegates limits to the other entities of the Group, with the Trading, Financial Markets & the International Division being the distinctly largest entity. At the third and last tier, the responsible officers of Trading, Financial Markets & the International Division are granted the limits within which they may enter into commitments.
MONITORING AND REPORTING The Finance & Accounts Department is responsible for estimating, monitoring, controlling and reporting market risks. Market risk is calculated for the following purposes:
• Regular reporting to the Executive Board and the Board of Directors • Reporting of regulatory capital for use by the Danish Financial Supervisory Authority • Daily follow-up on individual business units
Market risks are controlled and monitored through an integrated risk management system, with day-to-day follow-up action taken with respect to all market risk categories for all units subject to in-structions, and any failure to comply with instructions is reported upstream in the hierarchy.
To ensure independence, the Finance & Accounts Department has no position-taking authority. All trades are thus settled by Spar Nord’s Back Office Department according to the guidelines issued by the Danish Financial Supervisory Authority regarding functional separation.
DEVELOPMENTS IN MARKET RISK In 2012, the net bond portfolio grew by DKK 3,631 million, and shares in the trading portfolio went up by DKK 38.2 million. The Group’s portfolio of shares outside the trading portfolio (primarily shares in associates and shares in strategic trading partners in the financial sector) increased by DKK 351.5 million in 2012 to a total exposure of DKK 2,034.4 million.
The interest-rate risk increased from DKK -28.6 million at end-2011 to DKK -75.7 million at end-2012, which was due primarily to a high-er adverse interest-rate risk in DKK. The interest-rate risk in Spar Nord at end-2012 is broken down by an interest-rate risk in the trad-ing portfolio of DKK 53.6 million and an interest-rate risk outside the trading portfolio of DKK -129.3 million.
Moreover, the foreign-exchange risk at end-2012 was reduced com-pared to end 2011.
TYPES OF MARKET RISK Below follows a more detailed introduction to Spar Nord’s work on the various types of market risks and its exposure to them.
INTEREST-RATE RISK The interest-rate risk is the risk of loss due to fluctuating interest rates. The majority of Spar Nord’s interest-rate risks derive from activities involving ordinary banking transactions, such as deposits and lending, as well as trading and position-taking in interest-re-lated products. Most of these activities incorporate simple interest-rate products such as interest swaps, bonds, futures and standard interest-rate options.
The Group’s interest-rate risk is calculated on the basis of the target duration and agreed cash flow. For managing the Group’s portfolio of convertible Danish mortgage-credit bonds, the Bank uses model-based key risk indicators that provide for the inherent option ele-ment. As concerns interest-rate options, the above-mentioned key indicators are supplemented by the most important risk factors ex-pressing sensitivity of the option premium based on the underlying parameters.
The interest-rate risk is assessed on a daily basis and decisions are made in light of expectations for the macroeconomic situation and market developments. The Bank converts the interest-rate risk in foreign currencies into Danish kroner and offsets the negative inter-est-rate risk against the positive one to calculate the net interest-rate risk.
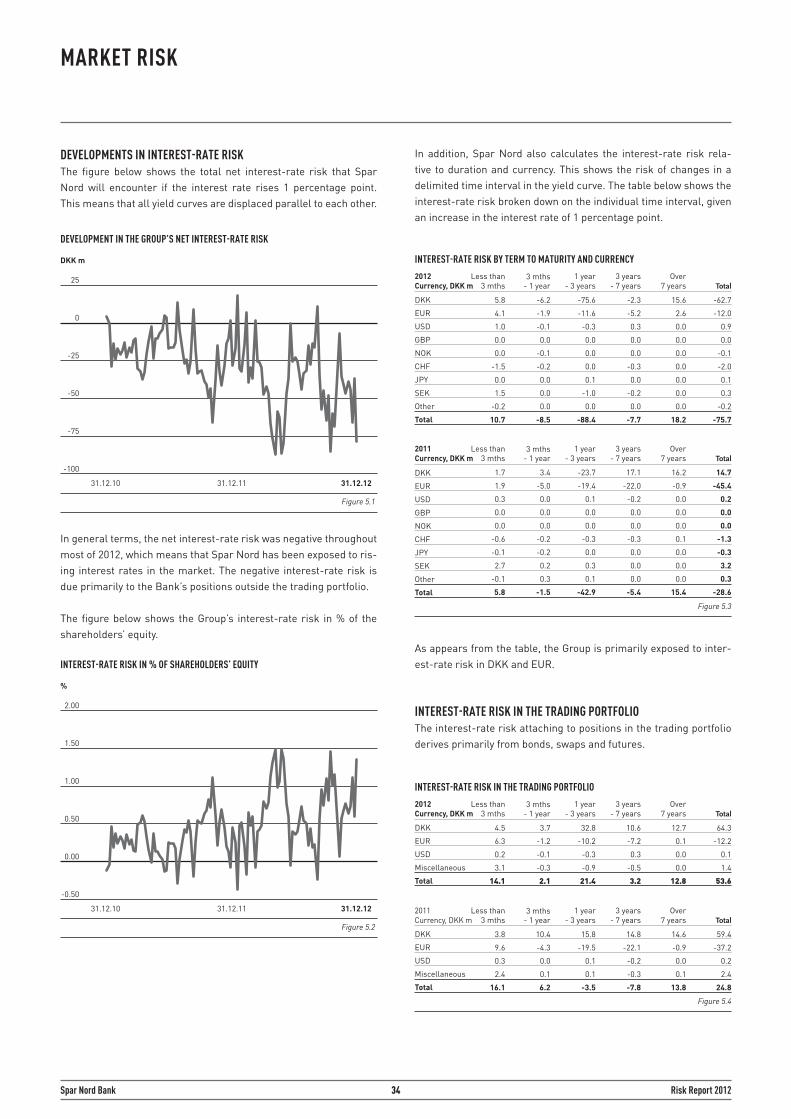
34 Risk Report 2012Spar Nord Bank
MARKET RISK
DEVELOPMENTS IN INTEREST-RATE RISK The figure below shows the total net interest-rate risk that Spar Nord will encounter if the interest rate rises 1 percentage point. This means that all yield curves are displaced parallel to each other.
In general terms, the net interest-rate risk was negative throughout most of 2012, which means that Spar Nord has been exposed to ris-ing interest rates in the market. The negative interest-rate risk is due primarily to the Bank’s positions outside the trading portfolio. The figure below shows the Group’s interest-rate risk in % of the shareholders’ equity.
In addition, Spar Nord also calculates the interest-rate risk rela-tive to duration and currency. This shows the risk of changes in a delimited time interval in the yield curve. The table below shows the interest-rate risk broken down on the individual time interval, given an increase in the interest rate of 1 percentage point.
As appears from the table, the Group is primarily exposed to inter-est-rate risk in DKK and EUR.
INTEREST-RATE RISK IN THE TRADING PORTFOLIO The interest-rate risk attaching to positions in the trading portfolio derives primarily from bonds, swaps and futures.
DEVELOPMENT IN THE GROUP’S NET INTEREST-RATE RISK
DKK m
25
0
-25
-50
-75
-100
31.12.10 31.12.12
Figure 5.1
31.12.11
INTEREST-RATE RISK IN % OF SHAREHOLDERS’ EQUITY
%
2.00
1.50
1.00
0.50
0.00
-0.50
31.12.10 31.12.12
Figure 5.2
31.12.11
Total
5.8 -6.2 -75.6 -2.3 15.6 -62.7
4.1 -1.9 -11.6 -5.2 2.6 -12.0
1.0 -0.1 -0.3 0.3 0.0 0.9
0.0 0.0 0.0 0.0 0.0 0.0
0.0 -0.1 0.0 0.0 0.0 -0.1
-1.5 -0.2 0.0 -0.3 0.0 -2.0
0.0 0.0 0.1 0.0 0.0 0.1
1.5 0.0 -1.0 -0.2 0.0 0.3
-0.2 0.0 0.0 0.0 0.0 -0.2
10.7 -8.5 -88.4 -7.7 18.2 -75.7
1 year- 3 years
3 years- 7 years
Over7 years
3 mths- 1 year
Less than3 mths
1.7 3.4 -23.7 17.1 16.2 14.7
1.9 -5.0 -19.4 -22.0 -0.9 -45.4
0.3 0.0 0.1 -0.2 0.0 0.2
0.0 0.0 0.0 0.0 0.0 0.0
0.0 0.0 0.0 0.0 0.0 0.0
-0.6 -0.2 -0.3 -0.3 0.1 -1.3
-0.1 -0.2 0.0 0.0 0.0 -0.3
2.7 0.2 0.3 0.0 0.0 3.2
-0.1 0.3 0.1 0.0 0.0 0.3
5.8 -1.5 -42.9 -5.4 15.4 -28.6
INTEREST-RATE RISK BY TERM TO MATURITY AND CURRENCY
DKK
EUR
USD
GBP
NOK
CHF
JPY
SEK
Other
Total
DKK
EUR
USD
GBP
NOK
CHF
JPY
SEK
Other
Total
Figure 5.3
2012Currency, DKK m
2011Currency, DKK m Total
1 year- 3 years
3 years- 7 years
Over7 years
3 mths- 1 year
Less than3 mths
Total
4.5 3.7 32.8 10.6 12.7 64.3
6.3 -1.2 -10.2 -7.2 0.1 -12.2
0.2 -0.1 -0.3 0.3 0.0 0.1
3.1 -0.3 -0.9 -0.5 0.0 1.4
14.1 2.1 21.4 3.2 12.8 53.6
1 year- 3 years
3 years- 7 years
Over7 years
3 mths- 1 year
Less than3 mths
3.8 10.4 15.8 14.8 14.6 59.4
9.6 -4.3 -19.5 -22.1 -0.9 -37.2
0.3 0.0 0.1 -0.2 0.0 0.2
2.4 0.1 0.1 -0.3 0.1 2.4
16.1 6.2 -3.5 -7.8 13.8 24.8
INTEREST-RATE RISK IN THE TRADING PORTFOLIO
DKK
EUR
USD
Miscellaneous
Total
DKK
EUR
USD
Miscellaneous
Total
Figure 5.4
2012Currency, DKK m
2011Currency, DKK m Total
1 year- 3 years
3 years- 7 years
Over7 years
3 mths- 1 year
Less than3 mths
35 Risk Report 2012Spar Nord Bank
MARKET RISK
As appears from Figure 5.4, the interest-rate risk attaching to the trading portfolio amounted to DKK 53.6 million at end-2012, up DKK 28.8 million on end-2011. The increase is due primarily to the growth in the bond portfolio as a result of the merger between Spar Nord and Sparbank. In addition, it appears that the interest-rate risk is primarily denominated in DKK.
INTEREST-RATE RISK OUTSIDE THE TRADING PORTFOLIO The interest-rate risk attaching to positions outside the trading portfolio derives primarily from fixed-interest deposits and lending from ordinary banking transactions and interest-rate risk related to the Bank’s funding.
The table shows the net interest-rate risk outside the trading port-folio, given an increase in the interest rate of 1 percentage point broken down by term to maturity and currency. Since end-2011, the interest-rate risk has changed from DKK -53.4 million to DKK -129.3 million at end-2012. This change is primarily caused by an increase in fixed-interest deposits, for one thing due to the merger with Sparbank.
FOREIGN-EXCHANGE RISK The foreign-exchange risk is the risk of loss on positions in curren-cies due to exchange-rate fluctuations. Foreign-exchange positions are included in the calculation of the Delta-adjusted position.
Spar Nord Bank calculates the foreign-exchange risk in three ways. The first calculation is based on the assumption that all exchange rates develop unfavourably for the Bank by 2%. The second calcula-tion is based on foreign-exchange indicator 1 according to the Capital Adequacy Order issued by the Danish Financial Supervisory Author-ity. This indicator is computed based on the sum of all currencies in which the Bank is in a net payable position (short position) and all the currencies in which the Bank is in a net receivable position (long position). Foreign-exchange indicator 1 is calculated by correlating the numerically highest value of the two sums to the Bank’s core capital (Tier 1) after deductions. Thirdly, foreign-exchange indicator 2 denotes that if the Bank does not change foreign-exchange posi-tions the next ten days, there is 1% probability that the Group will incur a loss that exceeds the value of the indicator.
The table below shows foreign-exchange indicator 1, foreign-ex-change indicator 1 compared with the core capital (Tier 1), foreign-exchange indicator 2 compared with the core capital (Tier 1), and the foreign-exchange risk broken down on the individual currencies.
As appears from Figure 5.6, the foreign-exchange risk was DKK 3.0 million lower than at end-2011, amounting to DKK -2.3 million at end-2012. Since end-2011, the foreign-exchange risk has dropped for all currencies.
EQUITY MARKET RISK The equity market risk is the risk of loss due to fluctuating equity prices. Equity positions are calculated as the net value of long and short equity positions and equity-related instruments. The calcula-tion of equity positions is broken down by positions in the trading portfolio and outside the trading portfolio.
SHARES IN THE TRADING PORTFOLIO The shares and equities in the trading portfolio have been acquired with a view to trading. This includes shares acquired through the wholly-owned subsidiary Erhvervsinvest Nord A/S.
Total
1.3 -9.9 -108.4 -12.9 2.9 -128.5
-2.2 -0.7 -1.4 2.0 2.5 1.8
-2.5 0.0 0.0 0.0 0.0 -2.6
-3.4 -10.6 -109.8 -10.9 5.4 -129.3
1 year- 3 years
3 years- 7 years
Over7 years
3 mths- 1 year
Less than3 mths
-2.1 -7.0 -39.5 2.3 1.6 -44.7
-7.7 -0.7 0.1 0.1 0.0 -8.2
-0.5 0.0 0.0 0.0 0.0 -0.5
-10.3 -7.7 -39.4 2.4 1.6 -53.4
INTEREST-RATE RISK OUTSIDE THE TRADING PORTFOLIO
DKK
EUR
Miscellaneous
Total
DKK
EUR
Miscellaneous
Total
Figure 5.5
2012Currency, DKK m
2011Currency, DKK m Total
1 year- 3 years
3 years- 7 years
Over7 years
3 mths- 1 year
Less than3 mths
FOREIGN-EXCHANGE RISK
Foreign-exchange indicator 1 in DKK m
Foreign-exchange indicator 1 in % of core capital(Tier 1) incl. hybrid capital, after deductions
Foreign-exchange indicator 1 in % of core capital(Tier 1) incl. hybrid capital, after deductions
Foreign-exchange risk broken down by currency in DKK m
EUR
SEK
USD
CHF
Other currencies
Foreign-exchange risk, total
End-2011
-0.1 -1.1
-1.8 -2.4
-0.1 -0.2
-0.2 -1.0
-0.1 -0.6
-2.3 -5.3
End-2012
Figure 5.6
94.3 390.4
1.4 6.9
0.0 0.1
36 Risk Report 2012Spar Nord Bank
MARKET RISK
It appears from the figure below that the holding of shares in the trading portfolio increased from DKK 122.6 million at end-2011 to DKK 160.8 million at end-2012.
SHARES OUTSIDE THE TRADING PORTFOLIO A salient feature of equities and shares outside the trading portfolio is that they have not been acquired with a view to trading. In addi-tion, Spar Nord makes a distinction between shares and equities in associates and equity investments in strategic partners.
Shares in associates include Nørresundby Bank A/S, in which Spar Nord has a 50.2% interest.
Equity investments in strategic partners in the financial sector are shares in companies whose purpose is to support financial institu-tions’ transactions in the fields of mortgage credit, payment ser-vices, unit trusts, etc. Spar Nord has no plans to sell its shares and equities in this portfolio, as participation in the companies in ques-tion is considered a prerequisite for the Bank’s operations.
In several of the sector companies, the shares are reallocated such that the ownership interest of the banks will reflect the business volume of the relevant institution with the sector company. Typi-cally, this reallocation is made based on the net asset value of the sector company in question. In light of this, Spar Nord adjusts the recognized value of these shares when new information is available that warrants a change of valuation. In other sector companies, the shares are not reallocated, but instead measured based on a recog-nized valuation method. The adjustments of the values of the shares in these companies are also recognized in the income statement.
The holding of shares outside the trading portfolio rose from DKK 351.5 million to DKK 2,034.4 million at end-2012. This increase is due mainly to the merger between Spar Nord and Sparbank.
COMMODITY RISK Spar Nord only accepts commodity risks on its own books to a very limited extent. The acceptance of such risks occurs in connection with hedging transactions on behalf of the Bank’s customers. The commodity exposure is calculated as a gross exposure, with setoffs only being made with respect to contracts having the same underly-ing commodity, the same maturity date, etc.
OPTION RISK Spar Nord uses derivates to hedge and manage the Group’s risks. These include options and products that contain an integral option. The Bank’s option risks stem primarily from interest and currency options and positions in mortgage-credit bonds.
Option risks are calculated by computing the positions’ Delta, Gam-ma, Vega and Theta risks.
SENSITIVITY ANALYSIS The figure below shows how the consolidated income statement will be impacted if the interest rate increases, if share prices drop and if all exchange rates move adversely.
It appears from the table that the shareholders’ equity will decrease 0.7% if the interest rate rises by 1 percentage point. In addition, it can be seen that a 10% drop in share prices will result in a 0.2% loss of shareholders’ equity. Lastly, it can be seen that the share-holders’ equity will be reduced by 0.0% if foreign-exchange rates shift adversely by 2%. It is an assumption that the portfolios remain unchanged.
EQUITY RISK IN THE TRADING PORTFOLIO
Listed shares in the trading portfolio
Unlisted shares in the trading portfolio
Total shares in the trading portfolio
End-2011
119.5 82.0
41.3 40.6
160.8 122.6
End-2012
Figure 5.7
DKK m
EQUITY RISK OUTSIDE THE TRADING PORTFOLIO
Shares in credit and financing institutions
Shares in unit trust man. companies
Shares in pension institutions
Shares in data supplier *)
Shares in payment services business
Other shares
Shares in strategic partners, total
Realized gains
Unrealized gains
Total associates
Shares outside the trading portfolio, total
End-2011
684.2 458.4
90.5 53.3
20.1 16.1
0.0 174.8
182.7 161.4
64.1 53.8
1,041.6 917.8
0.0 0.6
5.8 14.4
992.8 765.1
2,034.4 1,682.9
End-2012
Figure 5.8
DKK m
*) Reclassified to associates.
Return on equity
-0.7 -0.4 -40.2 -18.6
0.7 0.4 40.2 18.6
-0.2 -0.2 -12.1 -9.2
0.0 -0.1 -1.7 -4.0
SENSITIVITY ANALYSIS *)
Interest increase of 1 percentage point
Interest decrease of 1 percentage point
Share price decrease of 10 %
Exchange-rate fluctuation of 2%
in unfavourable direction
*) The sensitivity information shows the impact of isolated changes on the interest rates, share prices and exchange rates. The impact on operating profit and the impact on shareholders’ equity have been calculated after tax.
Impact on operating profit
End-2011
DKK m
End-2012
DKK m
End-2011
%
End-2012
%
Figure 5.9
37 Risk Report 2012Spar Nord Bank
MARKET RISK
SPAR NORD’S OWN PROPERTIES Properties are recognized at cost upon acquisition and subsequently measured at fair value. The fair value is calculated on the basis of current market data according to an asset return model that in-cludes the property’s rental income, operating expenses, as well as management and maintenance.
Operating expenses and maintenance costs are calculated on the basis of the condition of the individual property, construction year, materials used, etc. The fair value of the property is determined based on the calculated return on its operation and the individu-ally determined rate of return. The return rate is fixed on the basis of the location of the individual property, potential use, the state of maintenance, etc.
The fair value of the individual property is reassessed at least once a year based on the current letting market and the interest level. An external valuation is obtained from a real estate agent to support the calculation of fair value, including the rental rates and rates of return used. In 2012, positive value adjustments totalling DKK 9.1 million were made on corporate properties, such adjustments being recognized directly in shareholders’ equity under other comprehen-sive income. Impairment losses totalling DKK 9.2 million have been recognized under depreciation and impairment in the income state-ment. Reference is made to the Bank’s Annual Report for a more detailed description of the accounting treatment of properties.
The figure below shows the rates of return on the Bank’s properties.
The most important assumptions when calculating the fair value of investment and corporate properties are the required rate of return and rent level.
Everything else being equal, an increase of the required rate of re-turn of 0.5 percentage point will reduce the fair value by DKK 50.9 million (2011: DKK 28.6 million).
YIELD/RETURN
5.75-7 %
7-8 %
8-9%
9-14.5 %
Grand total
Year-endvalue
15 291.9 10 140.9
23 301.8 26 321.2
21 155.6 15 40.4
12 31.0 3 2.6
71 780.3 54 505.1
No. of properties
Figure 5.10
Year-endvalue
No. of properties
2012 2011
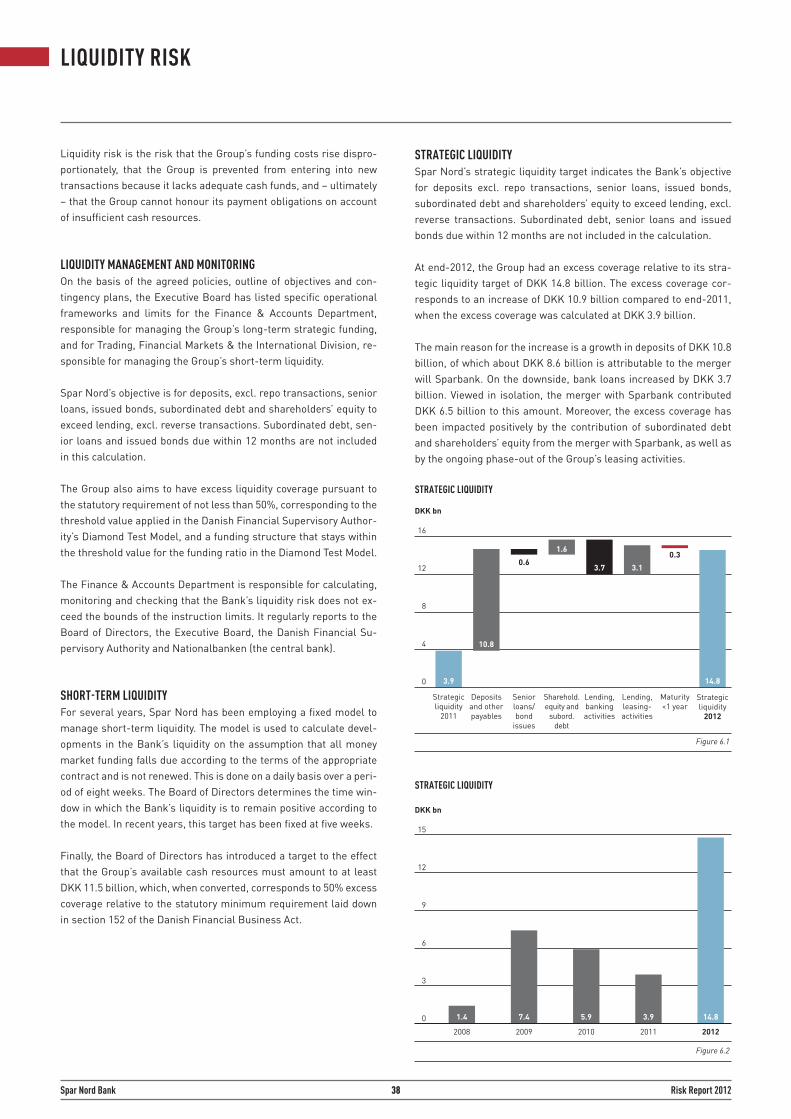
38 Risk Report 2012Spar Nord Bank
LIQUIDITY RISK
Liquidity risk is the risk that the Group’s funding costs rise dispro-portionately, that the Group is prevented from entering into new transactions because it lacks adequate cash funds, and – ultimately – that the Group cannot honour its payment obligations on account of insufficient cash resources.
LIQUIDITY MANAGEMENT AND MONITORING On the basis of the agreed policies, outline of objectives and con-tingency plans, the Executive Board has listed specific operational frameworks and limits for the Finance & Accounts Department, responsible for managing the Group’s long-term strategic funding, and for Trading, Financial Markets & the International Division, re-sponsible for managing the Group’s short-term liquidity.
Spar Nord’s objective is for deposits, excl. repo transactions, senior loans, issued bonds, subordinated debt and shareholders’ equity to exceed lending, excl. reverse transactions. Subordinated debt, sen-ior loans and issued bonds due within 12 months are not included in this calculation.
The Group also aims to have excess liquidity coverage pursuant to the statutory requirement of not less than 50%, corresponding to the threshold value applied in the Danish Financial Supervisory Author-ity’s Diamond Test Model, and a funding structure that stays within the threshold value for the funding ratio in the Diamond Test Model.
The Finance & Accounts Department is responsible for calculating, monitoring and checking that the Bank’s liquidity risk does not ex-ceed the bounds of the instruction limits. It regularly reports to the Board of Directors, the Executive Board, the Danish Financial Su-pervisory Authority and Nationalbanken (the central bank).
SHORT-TERM LIQUIDITY For several years, Spar Nord has been employing a fixed model to manage short-term liquidity. The model is used to calculate devel-opments in the Bank’s liquidity on the assumption that all money market funding falls due according to the terms of the appropriate contract and is not renewed. This is done on a daily basis over a peri-od of eight weeks. The Board of Directors determines the time win-dow in which the Bank’s liquidity is to remain positive according to the model. In recent years, this target has been fixed at five weeks.
Finally, the Board of Directors has introduced a target to the effect that the Group’s available cash resources must amount to at least DKK 11.5 billion, which, when converted, corresponds to 50% excess coverage relative to the statutory minimum requirement laid down in section 152 of the Danish Financial Business Act.
STRATEGIC LIQUIDITY Spar Nord’s strategic liquidity target indicates the Bank’s objective for deposits excl. repo transactions, senior loans, issued bonds, subordinated debt and shareholders’ equity to exceed lending, excl. reverse transactions. Subordinated debt, senior loans and issued bonds due within 12 months are not included in the calculation.
At end-2012, the Group had an excess coverage relative to its stra-tegic liquidity target of DKK 14.8 billion. The excess coverage cor-responds to an increase of DKK 10.9 billion compared to end-2011, when the excess coverage was calculated at DKK 3.9 billion.
The main reason for the increase is a growth in deposits of DKK 10.8 billion, of which about DKK 8.6 billion is attributable to the merger will Sparbank. On the downside, bank loans increased by DKK 3.7 billion. Viewed in isolation, the merger with Sparbank contributed DKK 6.5 billion to this amount. Moreover, the excess coverage has been impacted positively by the contribution of subordinated debt and shareholders’ equity from the merger with Sparbank, as well as by the ongoing phase-out of the Group’s leasing activities.
Figure 6.1
STRATEGIC LIQUIDITY
3.9
0.6
14.8
DKK bn
16
12
8
4
0
Deposits and other payables
Senior loans/bond
issues
Sharehold. equity and
subord.debt
Lending, banking activities
Maturity <1 year
Strategicliquidity
2012
Strategicliquidity
2011
10.8
Lending, leasing-activities
3.7 3.1
1.60.3
1.4 5.9
DKK bn
15
12
9
6
3
0
2008 2009 2010 2011 2012
7.4
Figure 6.2
14.83.9
STRATEGIC LIQUIDITY
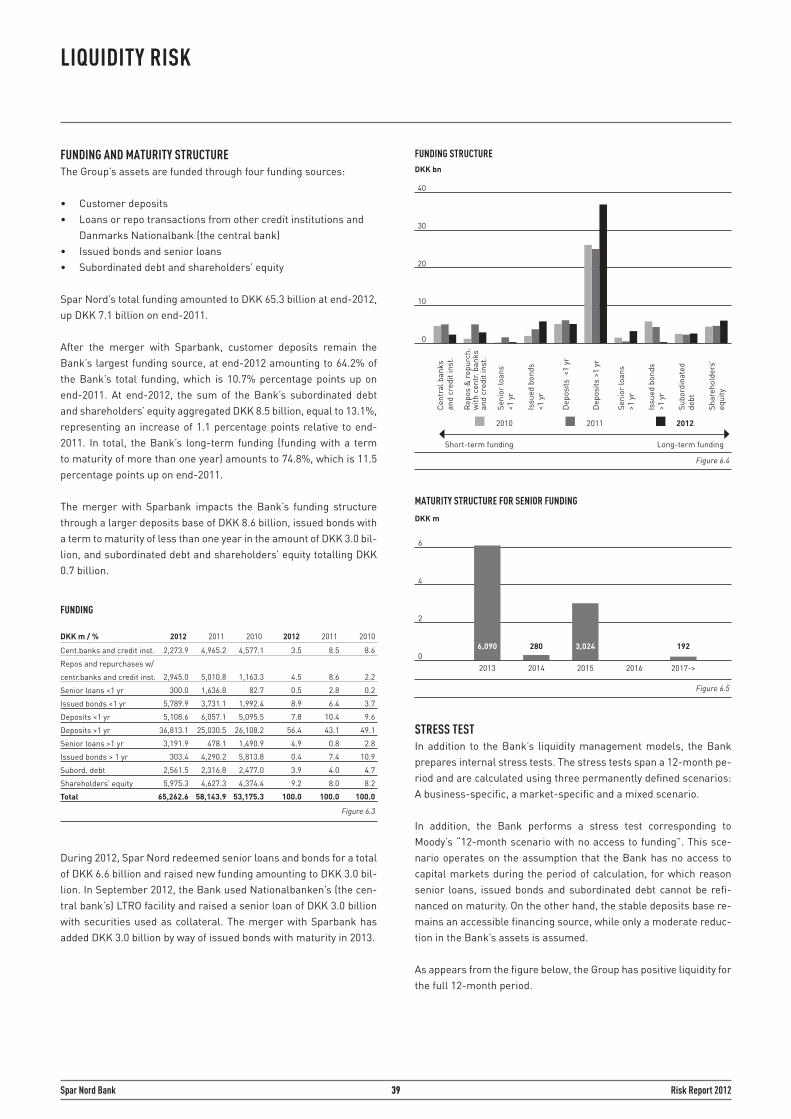
39 Risk Report 2012Spar Nord Bank
LIQUIDITY RISK
FUNDING AND MATURITY STRUCTURE The Group’s assets are funded through four funding sources:
• Customer deposits • Loans or repo transactions from other credit institutions and Danmarks Nationalbank (the central bank) • Issued bonds and senior loans • Subordinated debt and shareholders’ equity
Spar Nord’s total funding amounted to DKK 65.3 billion at end-2012, up DKK 7.1 billion on end-2011.
After the merger with Sparbank, customer deposits remain the Bank’s largest funding source, at end-2012 amounting to 64.2% of the Bank’s total funding, which is 10.7% percentage points up on end-2011. At end-2012, the sum of the Bank’s subordinated debt and shareholders’ equity aggregated DKK 8.5 billion, equal to 13.1%, representing an increase of 1.1 percentage points relative to end-2011. In total, the Bank’s long-term funding (funding with a term to maturity of more than one year) amounts to 74.8%, which is 11.5 percentage points up on end-2011.
The merger with Sparbank impacts the Bank’s funding structure through a larger deposits base of DKK 8.6 billion, issued bonds with a term to maturity of less than one year in the amount of DKK 3.0 bil-lion, and subordinated debt and shareholders’ equity totalling DKK 0.7 billion.
During 2012, Spar Nord redeemed senior loans and bonds for a total of DKK 6.6 billion and raised new funding amounting to DKK 3.0 bil-lion. In September 2012, the Bank used Nationalbanken’s (the cen-tral bank’s) LTRO facility and raised a senior loan of DKK 3.0 billion with securities used as collateral. The merger with Sparbank has added DKK 3.0 billion by way of issued bonds with maturity in 2013.
STRESS TEST In addition to the Bank’s liquidity management models, the Bank prepares internal stress tests. The stress tests span a 12-month pe-riod and are calculated using three permanently defined scenarios: A business-specific, a market-specific and a mixed scenario.
In addition, the Bank performs a stress test corresponding to Moody’s “12-month scenario with no access to funding”. This sce-nario operates on the assumption that the Bank has no access to capital markets during the period of calculation, for which reason senior loans, issued bonds and subordinated debt cannot be refi-nanced on maturity. On the other hand, the stable deposits base re-mains an accessible financing source, while only a moderate reduc-tion in the Bank’s assets is assumed.
As appears from the figure below, the Group has positive liquidity for the full 12-month period.
FUNDING
Cent.banks and credit inst.
Repos and repurchases w/
centr.banks and credit inst.
Senior loans <1 yr
Issued bonds <1 yr
Deposits <1 yr
Deposits >1 yr
Senior loans >1 yr
Issued bonds > 1 yr
Subord. debt
Shareholders’ equity
Total
20102011DKK m / % 201220102011
Figure 6.3
2,273.9 4,965.2 4,577.1 3.5 8.5 8.6
2,945.0 5,010.8 1,163.3 4.5 8.6 2.2
300.0 1,636.8 82.7 0.5 2.8 0.2
5,789.9 3,731.1 1,992.4 8.9 6.4 3.7
5,108.6 6,057.1 5,095.5 7.8 10.4 9.6
36,813.1 25,030.5 26,108.2 56.4 43.1 49.1
3,191.9 478.1 1,490.9 4.9 0.8 2.8
303.4 4,290.2 5,813.8 0.4 7.4 10.9
2,561.5 2,316.8 2,477.0 3.9 4.0 4.7
5,975.3 4,627.3 4,374.4 9.2 8.0 8.2
65,262.6 58,143.9 53,175.3 100.0 100.0 100.0
2012
FUNDING STRUCTURE
2010 2012
DKK bn
40
30
20
10
0
Figure 6.4
Cent
ral b
anks
an
d cr
edit
inst
.
Rep
os &
repu
rch.
w
ith c
entr.
ban
ks
and
cred
it in
st.
Seni
or lo
ans
<1 y
r
Issu
ed b
onds
<1
yr
Dep
osits
<1
yr
Dep
osits
>1
yr
Seni
or lo
ans
>1 y
r
Issu
ed b
onds
>1
yr
Subo
rdin
ated
de
bt
Shar
ehol
ders
’ eq
uity
Short-term funding Long-term funding
2011
MATURITY STRUCTURE FOR SENIOR FUNDING
6,090 280
DKK m
6
4
2
02013 2014 2015 2016
Figure 6.5
3,024
2017->
192
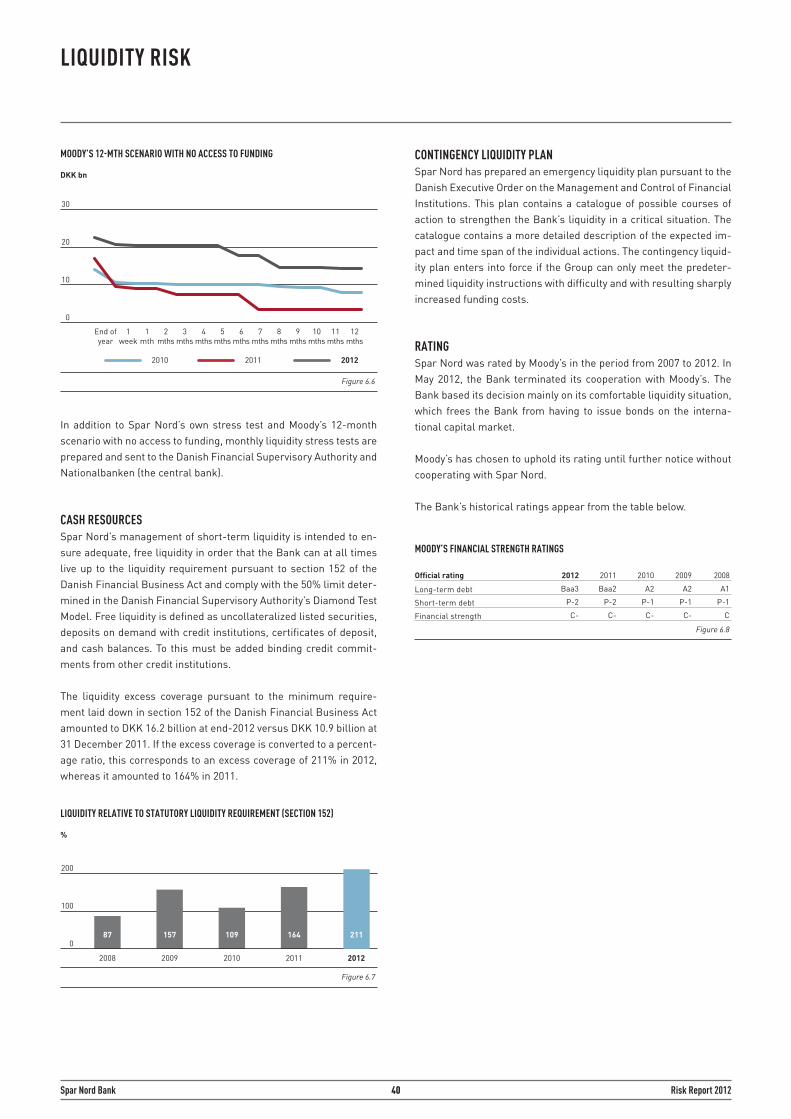
40 Risk Report 2012Spar Nord Bank
LIQUIDITY RISK
In addition to Spar Nord’s own stress test and Moody’s 12-month scenario with no access to funding, monthly liquidity stress tests are prepared and sent to the Danish Financial Supervisory Authority and Nationalbanken (the central bank).
CASH RESOURCES Spar Nord’s management of short-term liquidity is intended to en-sure adequate, free liquidity in order that the Bank can at all times live up to the liquidity requirement pursuant to section 152 of the Danish Financial Business Act and comply with the 50% limit deter-mined in the Danish Financial Supervisory Authority’s Diamond Test Model. Free liquidity is defined as uncollateralized listed securities, deposits on demand with credit institutions, certificates of deposit, and cash balances. To this must be added binding credit commit-ments from other credit institutions.
The liquidity excess coverage pursuant to the minimum require-ment laid down in section 152 of the Danish Financial Business Act amounted to DKK 16.2 billion at end-2012 versus DKK 10.9 billion at 31 December 2011. If the excess coverage is converted to a percent-age ratio, this corresponds to an excess coverage of 211% in 2012, whereas it amounted to 164% in 2011.
CONTINGENCY LIQUIDITY PLAN Spar Nord has prepared an emergency liquidity plan pursuant to the Danish Executive Order on the Management and Control of Financial Institutions. This plan contains a catalogue of possible courses of action to strengthen the Bank’s liquidity in a critical situation. The catalogue contains a more detailed description of the expected im-pact and time span of the individual actions. The contingency liquid-ity plan enters into force if the Group can only meet the predeter-mined liquidity instructions with difficulty and with resulting sharply increased funding costs.
RATINGSpar Nord was rated by Moody’s in the period from 2007 to 2012. In May 2012, the Bank terminated its cooperation with Moody’s. The Bank based its decision mainly on its comfortable liquidity situation, which frees the Bank from having to issue bonds on the interna-tional capital market.
Moody’s has chosen to uphold its rating until further notice without cooperating with Spar Nord.
The Bank’s historical ratings appear from the table below.
MOODY’S 12-MTH SCENARIO WITH NO ACCESS TO FUNDING
DKK bn
30
20
10
0
Figure 6.6
2010 2012 2011
End of year
1week
5mths
6mths
7mths
8mths
9mths
10mths
11mths
12mths
1mth
2mths
3mths
4mths
LIQUIDITY RELATIVE TO STATUTORY LIQUIDITY REQUIREMENT (SECTION 152)
87 157 164
%
200
100
0
2008 2009 2010 2011 2012
109
Figure 6.7
211
MOODY’S FINANCIAL STRENGTH RATINGS
Long-term debt
Short-term debt
Financial strength
2008
Baa3 Baa2 A2 A2 A1
P-2 P-2 P-1 P-1 P-1
C- C- C- C- C
2010
Figure 6.8
Official rating 200920112012
41 Risk Report 2012Spar Nord Bank
Operational risk is understood as the risk of loss that results from inefficient or deficient internal procedures, from human or systemic errors or from external events, including legal risks (i.e. the risk that an incomplete or incorrect legal assessment affects the Group adversely).
All activities in the organization are subject to operational risks.
CONTROL AND IDENTIFICATION Operational risk is managed across the Group through a compre-hensive system of business procedures and control measures de-veloped to ensure an optimum process environment. Efforts to mi-nimize operational risks include separating the execution and the control of activities.
Responsibility for dealing with risks lies with the unit responsible for the relevant business activities, the risk owners.
Spar Nord’s Board of Directors has introduced a policy for opera-tional risk, the aim of which is to provide an overview of the Group’s operational risks, minimize the number of errors and thus reduce the Group’s losses incurred from operational errors.
Throughout the Group, events that result in a loss of more than DKK 5,000 are recorded and categorized, and identified risks are recor-ded on an ongoing basis, followed up by reporting to the Risk Review Officer and the Executive Board.
The Legal Department is charged with handling operational risks, a responsibility that includes the role as risk facilitator.
COMPLIANCE Operational risks include compliance risks, which means the risk that the Bank is not being operated according to legal and statutory requirements, standards in the market and good business ethics.
Spar Nord has an independent compliance function charged with assisting Management in ensuring that the Group complies with ap-plicable legislation, market standards and internal rules and proce-dures. This serves to identify and reduce the risk that sanctions are imposed on the Bank, that its reputation is compromised, or that the Bank or its customers suffer significant financial losses.
The Compliance Department regularly reviews critical business procedures with a view to assessing risks and making recommen-dations to limit individual risks.
The Compliance function, managed by a Head of Compliance (a law graduate), who reports to both the Board of Directors and the Executive Board. This function is manned by representatives from a cross-section of the Bank’s business areas. An overall policy and annual programme for the Function’s activity have been approved by the Board of Directors.
FRAUD In view of the regular reporting provided to the Bank’s Board of Di-rectors and Executive Board, it is Management’s opinion that the Bank has a satisfactory level of measures to counter the risk of being exposed to fraud.
IT SECURITY Information and information systems are vital to Spar Nord, and IT security is therefore decisive for the Bank’s credibility and continued existence. An IT security function has been established, and Spar Nord’s Executive Board and Board of Directors regularly check on IT security.
Spar Nord bases its activity in the IT security area on regulatory re-quirements as well as considerations regarding day-to-day opera-tions. All IT installations running at Spar Nord and its service provi-ders must operate according to documented running schedules and guidelines. Operation must be safe and stable, a requirement ensu-red through the highest possible degree of automation and continual capacity adjustments. For service providers, this must be ensured by means of written agreements. The Bank’s IT security work inclu-des the preparation of emergency plans and recovery procedures aimed to ensure that operation continues at a satisfactory level in the case of extraordinary events.
CAPITAL NEED The capital needed to cover Spar Nord’s operational risks is calcu-lated using the basic indicator approach. In 2012, the operational risk amounted to 12.6% of total risk-weighted assets, totalling DKK 5,839.1 million at end-2012, which results in a capital need of DKK 467.1 million.
OPERATIONAL RISK

42 Risk Report 2012Spar Nord Bank
Spar Nord Bank A/SSkelagervej 15
P.O. Box 162DK-9100 Aalborg
Tel. +45 9634 4000Fax +45 9634 4560
[email protected] CVR no. 13737584