Embed Size (px)
Citation preview
SPAR NORD BANK RISK REPORT 2015 1
2015RISK REPORT
SPAR NORD BANK RISK REPORT 2015 2
0. CONTENTS
1. PREFACE
2. BUSINESS MODEL2.1 Vision
2.2 Strategy plan
2.3 Customers
2.4 Distribution
3. RISK MANAGEMENT3.1 Risk statements
3.2 Categories of risk
3.3 Risk profile
3.4 Delegation of responsibility
3.5 Day-to-day risk management
4. CAPITAL MANAGEMENT AND SOLVENCY NEED4.1 Capital policy
4.2 Management, monitoring and reporting
4.3 Developments in 2015
4.4 Own funds
4.5 Total risk exposure
4.6 Individual solvency need
4.7 Capital buffer
4.8 Leverage ratio
4.9 The importance of future rules on capital requirements
5. LIQUIDITY RISK5.1 Liquidity policy
5.2 Management, monitoring and reporting
5.3 Developments in 2015
5.4 Short-term liquidity
5.5 Cash resources
5.6 Stress tests
5.7 Strategic liquidity
5.8 Funding and maturity structure
5.9 Contingency liquidity plan
5.10 Encumbered assets
5.11 Future legislation regarding liquidity
3
4
4
4
4
4
5
5
5
5
5
7
9
9
9
9
10
10
11
12
13
13
14
14
14
14
14
15
15
16
16
17
17
17
6. CREDIT RISK6.1 Credit policy
6.2 Management, monitoring and reporting
6.3 Developments in 2015
6.4 Credit exposure
6.5 Loans, advances and guarantees
6.6 Credit quality
6.7 Security
6.8 Impairment of loans and advances
6.9 Credit risk exposure to financial counterparties
6.10 Counterparty risk
6.11 ECAI
6.12 Spar Nord’s total credit exposure
7. MARKET RISK7.1 Market risk policy
7.2 Management, monitoring and reporting
7.3 Developments in 2015
7.4 Interest-rate risk
7.5 Foreign-exchange risk
7.6 Equity risk
7.7 Commodity risk
7.8 Option risk
7.9 Sensitivity analysis
7.10 Spar Nord’s own properties
8. OPERATIONAL RISK 8.1 Operational risk policy
8.2 Management, monitoring and reporting
8.3 Fraud
8.4 IT security
8.5 Capital needs
8.6 Compliance
9. APPENDICES
18
18
18
19
19
19
24
24
25
29
29
30
31
32
32
32
32
32
35
35
35
36
36
36
37
37
37
37
37
37
37
38

SPAR NORD BANK RISK REPORT 2015 3
1. PREFACE
The objective of this report is to give an overview of Spar Nord’s risks, capital structure, plus capital and risk management practices.
The report has been prepared in accordance with the legal disclo-sure requirements in articles 431 to 455 of the Capital Requirements Regulation (CRR), and the Executive Order on Calculation of Risk Exposures, Own Funds and Solvency Need.
The risk report gives a description of the various types of balance-sheet and off-balance-sheet risks to which Spar Nord is exposed. The report also includes an account of Spar Nord’s risk and capital management methodologies and the composition of the capital base and the associated risks.
The rules regarding the capital adequacy of credit institutions are laid down in European Parliament and Council Directive 2013/36/EU (CRD) and Regulation no. 575/2013 (CRR), including the associ-ated delegated regulations and guidelines. The rules originate from the Basel III rules and set the rules for the disclosure of capital ad-equacy requirements and risk management.
Spar Nord’s disclosure of information on the risk and capital man-agement practices pursuant to the regulatory framework relates to Spar Nord Bank A/S, CVR no. 13737584 and its fully consolidated subsidiary (“Spar Nord”). The comparative figures regarding the Parent Company (the “Bank”) have been adjusted as a result of the merger with Spar Nord Leasing as of 1 January 2015.
This report for Spar Nord is available at www.sparnord.com/riskre-ports. In addition, the Annual Report of Spar Nord discloses infor-mation about Spar Nord’s risks and risk management.
Reporting pursuant to the disclosure requirements is an annual ex-ercise conducted in connection with the presentation of the financial statements, while the individual solvency need ratio is published quarterly.
In Spar Nord’s opinion, the published information will give market participants a true and fair view of Spar Nord’s risk profile. Should any events cause the published information to no longer be true and fair, Spar Nord will publish supplementary information so as to en-sure that the market participants can form a true and fair view of Spar Nord’s risk profile.
Additional references regarding the disclosure obligations appear from Appendix A.

SPAR NORD BANK RISK REPORT 2015 4
2. BUSINESS MODEL
Founded in Aalborg, Denmark, in 1824, Spar Nord has historically been rooted in northern Jutland, and it continues to be a market leader in this region. In the period from 2002 to 2010, Spar Nord es-tablished and acquired 27 local banks outside northern Jutland, and in 2012 Spar Nord merged with Sparbank, which had 23 branches; thus, today Spar Nord has a nationwide distributive network with 70 local banks, with 1,538 employees serving about 395,000 customers.
Spar Nord offers all types of financial services, consultancy and products and has a business focus on retail customers and small and medium-sized businesses in the local areas in which Spar Nord is represented.
Spar Nord consists of the two earnings units, Spar Nord’s Local Banks and Trading, Financial Markets & the International Division, and a number of administrative staff functions and support divisions at the Aalborg headquarters.
2.1 VISIONThis is Spar Nord’s vision: By giving our branches a great deal of local autonomy, we intend to create Denmark’s most attractive banking chain. For the benefit of our customers, employees and shareholders.�
Spar Nord’s ambition is to signal that the Bank is run as a nation-wide chain of individual businesses with extensive decision-making powers in areas such as customer service, marketing, physical loca-tion and human relations. Local decision-making powers are limited only in respect of credit-granting.
2.2 STRATEGY PLANSpar Nord’s strategic roadmap for 2014-16 is described in the strat-egy plan, AN UNCOMPLICATED BANK. The strategy plan is a natural extension of the geographical expansion undertaken by Spar Nord in the period from 2002 to 2010 and focuses on generating growth in customer numbers, business volume and earnings, among other target issues.
In concrete terms, three strategic action areas have been formu-lated for the period 2014-16, each with three strategic goals.
Under the heading, ”Customers and business volume”, Spar Nord has the goal of attracting new retail and business customers and of increasing the average business volume.
Under the heading, ”Internal processes”, it is a defined goal that at least 65% of a customer adviser’s time should be devoted to serv-ing customers, and that process and system improvements should result in 30 minutes’ more customer time per day per adviser. Fi-nally, a goal has been formulated to the effect that employees’ use of standard systems should be increased.
Under the heading, ”Financial aspects”, Spar Nord has a goal of im-proving the cost ratio to 55 and of maintaining the impairment ratio in the top third. Finally, Spar Nord’s goal is for the return on equity to reach at least 10% after tax.
2.3 CUSTOMERSSpar Nord’s target groups are retail customers and small and me- dium-sized businesses in the local areas where the Bank has a presence. Leasing products are offered to business customers in addition to traditional bank financing options.
Finally, via the SparXpres concept taken over from Sparbank and continued after the merger, Spar Nord offers services such as con-sumer financing via retail stores, gift voucher solutions via shop-ping centres and trade associations and direct loans via the website, sparxpres.dk.
For its retail customers, Spar Nord gives priority to full-service cus-tomers in the sense that for financially sound customers, Spar Nord aims to be a banker to the entire family and cater to the full range of a family’s banking needs.
In its day-to-day operations, Spar Nord is focused on retaining exist-ing full-service customers, turning existing part-service customers into full-service customers and attracting new customers with good potential.
On the business customer side, Spar Nord focuses on sound busi-nesses across industrial sectors. In other words, it is largely the structure of the local business community and local focus that de-termine the distribution of branches in the individual banking areas.
Spar Nord has a credit exposure characterized by a higher-than-average exposure to retail customers and a good sector diversifica-tion in the business customer portfolio.
2.4 DISTRIBUTIONThe 70 local banks throughout Denmark constitute the backbone of Spar Nord’s distribution network. Spar Nord gives very high priority to personalized advisory services in the physical branches, supple-menting them with self-service solutions such as well-functioning online banking and mobile platforms.
Trading, Financial Markets & the International Division serves cus-tomers from Spar Nord’s local banks as well as large retail custom-ers and institutional clients in the field of equities, bonds, interest & forex, asset management and international transactions.

SPAR NORD BANK RISK REPORT 2015 5
3. RISK MANAGEMENT
Risk assumption is pivotal to banking, and risk management is an im-portant focus area at Spar Nord. The various types of risk that Spar Nord assumes and the initiatives taken to manage and monitor devel-opments are reviewed in the following sections.
3.1 RISK STATEMENTSOn 10 February 2016, Spar Nord’s Board of Directors and Executive Board approved Spar Nord’s 2015 Risk Report.
The Board of Directors finds that Spar Nord’s risk management com-plies with applicable rules and standards, is appropriate and effective, and is in accordance with Spar Nord’s business model. In addition, in the opinion of the Board of Directors Spar Nord’s risk management systems are appropriate, given Spar Nord’s risk appetite and strategy, such that the going concern concept is thereby ensured.
We find that the description of Spar Nord’s general risk profile in con-nection with business strategy, business model and key ratios pro-vides a fair representation of Spar Nord’s risk management, including of the adopted risk profile and risk appetite.
The Board of Directors’ assessment is based on the business model and strategy adopted by it, and materials and reports submitted to it by the Executive Board, Internal Audit, Spar Nord’s Risk Review Of-ficer and Compliance Officer.
The core of Spar Nord’s strategy, vision and fundamental values is that Spar Nord wants to be a strong and attractive bank for retail cus-tomers and small and medium-sized businesses in the local areas in which Spar Nord is represented. Spar Nord strives for profitable earn-ings based on a pricing of Spar Nord’s products that reflects the risk and capital tie-up that Spar Nord assumes. Spar Nord wants to main-tain suitable and robust own funds that support the business model at all times, based on an overall assessment of the business volume with customers and counterparties.
The Board of Directors’ scrutiny of Spar Nord’s business model and policies shows that the general requirements in the individual risk ar-eas are appropriately reflected in policies and specified limits, includ-ing in the Board of Directors’ guidelines to the Executive Board, and powers passed on to other organizational units. The specified limits are believed to be defined so that they are transparent and control-lable.
In addition, the scrutiny shows that the actual risks are within the lim-its laid down in the individual policies and powers passed on, and in this light the Board of Directors finds that there is a correlation be-tween business model, policies, guidelines and the actual risks within the individual areas.
More information and key ratios regarding Spar Nord’s risk profile can be found in this risk report and the risk sections of the annual report.
3.2 CATEGORIES OF RISKSpar Nord’s most important categories of risks are as follows:• Credit risk: The risk of loss that results from borrowers or other
counterparties defaulting on their payment obligations, including the risks attaching to customers encountering financial difficul-ties, large exposures, concentration risks and risks attaching to granted, unutilized exposures. Credit risks also include settle-ment and counterparty risks.
• Market risk: Market risk is an umbrella heading for the risk of loss caused by fluctuations in exchange rates or prices for finan-cial instruments.
• Liquidity risk: The risk of loss that results because Spar Nord’s funding costs increase, Spar Nord is cut off from entering into new transactions on account of unavailable funding, or because Spar Nord ultimately becomes unable to meet its obligations as and when they fall due on account of liquidity shortage.
• Operational risk: The risk of loss that results from deficient, in-expedient or erroneous internal procedures, human or system errors or external events, including legal risks, strategic risks and image risks.
3.3 RISK PROFILEThe risks assumed by Spar Nord and its proclivity for assuming risks with respect to the individual risk types are rooted in Spar Nord’s gen-eral strategic goals, set by the Board of Directors. As a supplement, specific risk policies have been introduced, laying down the general guidelines for handling and managing risks. These policies are re-viewed and approved by the Board of Directors at least once a year.
The goal is to ensure coherence between Spar Nord’s vision, mission and strategy, and that at all times Spar Nord has a risk profile that bears an appropriate relation to its capital and liquidity situation.
In light of the general risk policies and the risk profile, specific guide-lines have been prepared for the most important areas of risk.
3.4 DELEGATION OF RESPONSIBILITYSpar Nord has a two-tier management structure, with the Board of Directors having drafted written guidelines for the Executive Board, specifying clearly the areas of responsibility and scope of action for each management tier. The Board of Directors lays down general policies, while the Executive Board is responsible for the day-to-day management of Spar Nord. Spar Nord’s management structure re-flects statutory requirements for listed Danish companies and the provisions of the Danish Financial Business Act.
The Board of Directors is responsible for ensuring that Spar Nord has an appropriate organization and that risk policies and limits are es-tablished for all important risk categories. In addition, all major credit facilities must be submitted to the Board of Directors for approval. The Board of Directors also makes decisions regarding general prin-ciples for handling and monitoring risks. Regular reporting to the Board of Directors is undertaken with a view to enabling the Board of Directors to check whether the total risk policies and the pre-defined limits are complied with.
The Board of Directors has set up an audit committee tasked with monitoring and controlling accounting and auditing matters and un-dertaking the preparatory work concerning the Board of Directors’ processing of accounting and auditing issues. The committee is com-posed of three Directors, one of whom is a member with special ex-

SPAR NORD BANK RISK REPORT 2015 6
3. RISK MANAGEMENT
EXECUTIVE BOARD
Spar Nord’sLocal Banks
Trad., Fin. Mark. & the Int. Division
Credit Rating
CreditDepartment
Audit Committee
Nomination and Remuneration Comm.
SolvencyCommittee
Special Credit Facilities
CreditCommittee
Risk managementfunction
Finance & Accounts
LegalDepartment
Analysis & Credit Quality Dept.
System and Process Dept.
Market RiskCommittee
Compliance
Market Risk
Capital & Liquidity Risk
OperationalRisk
CreditControlling
Debt Collection Department
Internal Audit Department
Risk Committee
THE RISK MANAGEMENT ORGANIZATION
BOARD OF DIRECTORS
IT SecurityCommittee
pertise in auditing and accounting matters, as required by statute, and who is also disinterested. In 2015, the committee held six meetings.
Spar Nord’s Internal Audit Department submits reports to both the Board of Directors and the Executive Board and answers to the Board of Directors. The Internal Audit Department bases its activities on the annual plan adopted by the Board of Directors. These activities in-clude test examinations of business procedures and internal control systems in key areas subject to risk, including in connection with pre-paring the financial statements.
Spar Nord’s independent auditors are elected at the Annual General Meeting for one year at a time. The focus of the auditing team is sub-ject to review by the Board of Directors once a year based on the rec-ommendations of the audit committee.
The Board of Directors has set up a nomination and remuneration committee with three Directors, of whom one has been elected by the employees in compliance with legislation. The nomination and re-muneration committee is charged with undertaking the preparatory work concerning the Board of Directors’ evaluation and nomination process and the processing of issues regarding remuneration and risks in this connection. In 2015, the committee held three meetings.
Spar Nord has set up a risk committee composed of three members of the Board of Directors. During 2015, the risk committee held four meetings. The risk committee plays an advisory role in determining Spar Nord’s risk appetite and regularly assesses Spar Nord’s risk profile.
In addition, the risk committee plays an advisory role in connection with the review and assessment of the appropriateness and efficiency of Spar Nord’s policies, guidelines and systems.
The Executive Board is responsible for the day-to-day management of Spar Nord. To this end, the Executive Board passes on specific in-structions for the Group’s risks and its risk management procedures. The Executive Board reports regularly to the Board of Directors on the Group’s risk exposure.
The Executive Board has appointed a number of committees and working parties that contribute to Spar Nord’s risk governance in spe-cific areas, and which prepare cases and themes for processing by the Executive Board and Board of Directors.
3.4.1 CREDIT COMMITTEEThe Credit Committee deals with credit facilities that exceed Cred-it Rating’s authorization limits or involve a matter of principle. The Committee, composed of an Executive Board member and the Chief Credit Officer, convenes three times a week. Frequently, matters that have been dealt with by the Credit Committee will be prepared for subsequent discussion among all members of the Board of Directors.
3.4.2 MARKET RISK COMMITTEEThe Market Risk Committee is composed of representatives of the Executive Board, Finance & Accounts and Trading, Financial Markets & the International Division. The Committee meets every quarter and reviews developments in Spar Nord’s positions and risks as well as the liquidity situation and expectations regarding market develop-ments and future plans. In addition, the Committee receives input from a more operationally slanted Capital Market Committee, for ex-ample regarding any issues that may require specific discussion in terms of principles.
3.4.3 SOLVENCY COMMITTEEThe Solvency Committee is composed of members of the Executive Board, Credit Rating and Finance & Accounts. The objective of the Committee is to formulate targets and principles for calculating ade-quate own funds and the individual solvency need. The Solvency Com-mittee prepares a recommendation for the individual solvency need ratio and passes it on to the Board of Directors for approval.

SPAR NORD BANK RISK REPORT 2015 7
3. RISK MANAGEMENT
3.4.4 IT SECURITY COMMITTEEThe IT security committee at Spar Nord is composed of a member of the Executive Board, the head of the IT department, the IT security of-ficer and selected heads of business areas. The committee is tasked with advising and dealing with any issues that may arise in relation to the IT security policy, IT security rules and procedures and the IT con-tingency plan. The IT security committee holds quarterly meetings.
3.4.5 THE RISK MANAGEMENT FUNCTIONA risk management function has been put in place, and a Risk Review Officer with specific responsibility for the function has been appointed to head it. The risk management function’s area of responsibility com-prises Spar Nord’s risk-prone activities across various risk areas and organizational units and risks deriving from outsourced functions. The function is responsible for appropriate risk management of Spar Nord’s operations, including providing an overview of its risks and the overall risk exposure. The Risk Review Officer is responsible to the Executive Board and submits reports to the Board of Directors, and assists the Board of Directors’ risk committee in its work. The ac-tivities of the risk management function are rooted in the annual plan adopted by the Board of Directors.
3.4.6 COMPLIANCESpar Nord’s compliance function is charged with overseeing Spar Nord’s compliance with financial legislation, banking sector stand-ards and Spar Nord’s internal guidelines in all areas. This function, which answers to the Executive Board, submits reports to the Board of Directors and is manned by staff members responsible for compli-ance and representatives of a cross-section of Spar Nord’s business areas who are engaged in decentralized compliance tasks. The activi-ties of the compliance function are rooted in the annual plan adopted by the Board of Directors.
3.5 DAY-TO-DAY RISK MANAGEMENTBelow follows a review of day-to-day management of Spar Nord’s credit risk, market risk, liquidity risk, operational risk, contingency plans and reporting.
3.5.1 CREDIT RISKCustomer advisers, in consultation with local managers, handle day-to-day management of Spar Nord’s credit risks. The decentralized credit authorization limit is maximized at DKK 10 million and is linked to qualifications and needs. Exposures that exceed the decentral-ized credit authorization limits are passed on for processing at Credit Rating or the Credit Committee, and all DKK 60+ million exposures and new exposures of DKK 30+ million need to be authorized by the Board of Directors.
High-level monitoring of Spar Nord’s credit risk exposure is man-aged by the Credit Quality function. This department oversees chang-es in the credit quality of all exposures and undertakes systematic credit quality control of Spar Nord’s entire exposure portfolio. Rating systems have been introduced in all Spar Nord’s departments, and this tool is used at the local level to grant credit facilities. Thus, cus-tomers in the rating groups accorded the least risk exposure are like-lier to be given higher credit limits or extensions than customers in the weaker rating groups.
Risk and settlement lines to financial counterparties are authorized based on a three-tier instruction hierarchy consisting of the Board of Directors, the Credit Committee and the Senior Vice President of Trading, Financial Markets & the International Division, with the facil-ity authorization rights adapted to the individual tier. The follow-up on lines will be performed by Finance & Accounts, which ensures func-tional separation. All lines are subject to regular review by Trading, Financial Markets & the International Division, among other things based on the financial statements or rating of the financial counter-party. As a minimum, credit lines authorized by the Board of Directors are reviewed every year, and other exposures are reviewed every three years, as a minimum.
3.5.2 MARKET RISKSpar Nord’s Board of Directors lays down the overall policies, frame-works and principles, and the Finance & Accounts Department is re-sponsible for monitoring and checking that Spar Nord’s market risk does not exceed the boundaries of the instruction limits.
For its management of market risks, Spar Nord has established a three-tier instruction hierarchy. The first level, the Board of Directors, defines Spar Nord’s market risk framework. At the second tier-lev-el, the Executive Board delegates limits to the other entities of Spar Nord, with the Trading, Financial Markets & the International Division being the distinctly largest entity. At the third and last tier, the execu-tives of Trading, Financial Markets & the International Division are granted the limits within which they may operate.
3.5.3 LIQUIDITY RISKLiquidity management is divided into short-term and long-term li-quidity management. Management of short-term liquidity is placed with Trading, Financial Markets & the International Division, while management of long-term liquidity is the responsibility of the Finance & Accounts Department.
Managing Spar Nord’s general liquidity is subject to a number of control mechanisms. A fixed goal for the day-to-day cash resources coupled with stress tests are used for short-term liquidity require-ments. Long-term liquidity is managed by focusing on strategic liquidity and also by using stress tests.
3.5.4 OPERATIONAL RISKOperational risks are managed via business procedures and other policy manuals, IT systems and control measures. Responsibility for risk management in this connection lies with the responsible units. Risk assessments are to be prepared regarding individual projects, focusing on risks, potential consequences and initiatives to limit such risks. Spar Nord’s security policy, including IT security policy, is re-viewed annually and approved by the Board of Directors.
3.5.5 CONTINGENCY PLANSSpar Nord has contingency plans for dealing with critical areas like capital and liquidity. In addition, Spar Nord has contingency plans for dealing with situations involving long-term IT outage.

SPAR NORD BANK RISK REPORT 2015 8
3. RISK MANAGEMENT
ANNUAL REPORTING/APPROVAL
Asset review Detailed review and analysis of Spar Nord’s assets, including a specific review of individual exposures and an analysis and as-sessment of future trends for important lines of business or asset areas.
Operational risk Review of Spar Nord’s operational risks and measures to counter such risks.
Risk policies and guidelines Review of Spar Nord’s risk policies and guidelines in the indivi-dual risk areas (credit risk, market risk, etc.) and an assessment of the need for making adjustments.
Individual solvency need Assessment of Spar Nord’s risk profile and calculation of adequa-te own funds. Extended version of the report prepared quarterly, including a process review and assessment of parameters used.
Calculation and assessment of liquidity position and liquidity risks Combined calculation and assessment of Spar Nord’s liquidity position and liquidity risks. The assessment supports Spar Nord’s liquidity management and is an element in the statement of the individual solvency need.
The Executive Board’s risk review An overall risk review of Spar Nord’s risk-prone activities across risk areas and organizational units. The risk review must be the basis for and support the Board of Directors’ overall management of the company, including in connection with the Board of Direc-tors’ definition of Spar Nord’s risk appetite, approval of policies and guidelines and in connection with Spar Nord’s organization and use of IT systems.
Statement from the risk management function The risk management function’s statement to the Board of Direc-tors about Spar Nord’s risk management. The statement forms part of the Board of Directors’ overall assessment basis in con-nection with the Executive Board’s risk statement.
Statement from the compliance function Statement regarding the activities of the compliance function and Spar Nord’s general compliance.
Turnaround planComprehensive plan to deal with a crisis in which Spar Nord ne-eds to implement initiatives to counter the crisis. The plan form parts of the ongoing risk management and supports the Board of Directors’ high-level management of the business activities and the associated risks. The plan is submitted to the Danish Finan-cial Supervisory Authority once a year.
QUARTERLY REPORTING/APPROVAL
Credit quality report Detailed analysis of trends in exposures, impairment and losses, including portfolio analyses broken down by rating categories, volu-me, geography, etc. Follow-up on all unauthorized overdrafts above DKK 1 million (monthly).
Credit-weak exposures Report on all credit-weak exposures larger than DKK 25 million, re-viewed individually.
Large exposures Overview of exposures amounting to 10% or more of Spar Nord’s own funds and the sum of such exposures, and the percentage that this sum represents of the own funds.
Market risk Review and analysis of e.g. Spar Nord’s current interest, equity and foreign-exchange risks, including the historical trend in utilization of the frameworks and instructions fixed by the Board of Directors (monthly).
Liquidity risk Review and analysis of Spar Nord’s short- and long-term liquidity risks, including Spar Nord’s liquidity stress test and trends in the historical utilization of the frameworks and instructions laid down by legislation and by the Board of Directors (monthly).
Individual solvency need Assessment of the risk profile and calculation of adequate own funds. The report contains conclusions reached in Spar Nord’s stress test and an assessment of the capital needs in respect of the individual risks.
Capital Analysis of Spar Nord’s capital structure, including trends in total risk exposure and own funds.
IT risk Review and follow-up on Spar Nord’s IT security and stability of Spar Nord’s IT systems, including follow-up on outsourced development projects.
Reporting from the risk management function Follow-up on Spar Nord’s risk appetite, and follow-up on the annual plan (semi-annually).
Reporting from the compliance function Review of the most significant compliance controls and status on ongoing tasks.
Forecast The forecast is updated regularly with a view to ensuring ongoing follow-up on the business results and projections for profits, ba-lance sheet, liquidity and capital matters.
3.5.6 REPORTINGSubstantial resources are deployed to ensure appropriate risk report-ing on an ongoing basis, including follow-up on legislative and man-agerial risk frameworks.
Reporting to Spar Nord’s Management and relevant stakeholders is performed according to fixed guidelines. The Board of Directors re-ceives continual reports covering all important risk areas.

SPAR NORD BANK RISK REPORT 2015 9
4. CAPITAL MANAGEMENT AND INDIVIDUAL SOLVENCY NEED
4. CAPITAL MANAGEMENT AND SOLVENCY NEEDSpar Nord is licensed to carry on banking and consequently sub-ject to Danish and European legislative provisions that lay down the overall capital requirements which govern both the Parent Company and the Group.
4.1 CAPITAL POLICY Spar Nord has adopted a number of policies and guidelines intend-ed to ensure that Spar Nord will at all times have adequate capital available. Part of the objective of these guidelines and the policy goals is to enable Spar Nord to withstand cyclical downturns, unex-pectedly heavy credit losses and major adverse changes in the value of its market-risk-related positions.
4.2 MANAGEMENT, MONITORING AND REPORTING Spar Nord’s capital management system is intended to manage Spar Nord’s total capital relative to the risk profile policy defined. Spar Nord’s capital adequacy targets are intended to ensure that Spar Nord will at all times have adequate capital and liquidity avail-able to comply with statutory requirements and to support future activities and growth.
Spar Nord’s capital adequacy targets are intended to ensure that it will always live up to CRR, which prescribes requirements as to a total capital ratio of at least 8%.
Pursuant to the Danish Financial Business Act it is an additional re-quirement that a financial institution must comply with a combined capital buffer requirement and calculate the individual solvency need. The individual solvency need is used to express an additional capital requirement that will cover all relevant risks, including risks that are not appropriately covered by the 8% minimum capital ratio. This includes, for instance, business risks and special credit risks.
Spar Nord’s objective is to have a Common Equity Tier 1 (CET1) ratio of 12% and a total capital ratio of 15.5%. In addition, it is Spar Nord’s goal to have an excess coverage of at least one percentage point relative to the regulatory requirements from time to time applicable.
4.3 DEVELOPMENTS IN 2015At end-2015, Spar Nord had a Common Equity Tier 1 (CET1) ratio of 14.4%, a core capital (Tier 1) ratio, including Additional Tier 1 (AT1) capital, of 14.9%, a total capital ratio of 17.0% and an individual sol-vency need ratio of 9.5%.
4.4 OWN FUNDSUltimately, own funds are composed of Common Equity Tier 1 (CET1), Additional Tier 1 (AT1) and Tier 2 capital (T2).
Own funds are characterized by the fact that the contributors of capital, including shareholders and holders of the recognized sub-ordinated debt, rank junior to ordinary creditors if Spar Nord goes bankrupt.
4.4.1 ISSUED CAPITAL INSTRUMENTS Spar Nord’s issued Additional Tier 1 (AT1) capital and Tier 2 capital (T2) have been contributed on terms that meet the requirements for inclusion in own funds under CRR.
Spar Nord has issued one loan by way of Additional Tier 1 (AT1) capi-tal with a principal of DKK 400 million, and two loans issued as Tier 2 capital (T2) for DKK 400 million and DKK 700 million, respectively.
4.4.2 DEVELOPMENTS IN OWN FUNDS IN 2015In 2015, own funds grew by DKK 536.5 million. The increase was positively impacted by the profits for the year and a reduction in de-ductions for equity investments in the financial sector. In contrast, own funds were negatively impacted by the proposed dividend and extraordinary dividend deriving from the sale of the shareholding in Nørresundby Bank.
Post-tax profits for the year contributed positively by DKK 896.8 mil-lion, of which DKK 216.8 million is attributable to the divestment of the shareholding in Nørresundby Bank. The reduction in equity investments in the financial sector results in an increase of DKK 343.7 million, which is also primarily attributable to the sale of the shareholding in Nørresundby Bank.
CAPITAL RATIOS
Common Equity Tier 1 (CET1) ratio
Core capital (Tier 1) ratio, incl. Additional Tier 1 (AT1) capital
Total capital ratio
Individual solvency need ratio
20142015
14.4 13.0
14.9 13.3
17.0 15.0
9.5 9.7
%
Figure 4.1
STATEMENT OF OWN FUNDS
Share capitalOther reservesRetained earningsRevaluation reserves- Proposed dividend- Intangible assets- Goodwill in associates- Deduction for equity investments in associates- Deduction for equity investments >10%- Deduction for the sum of equity investments <10%- Deferred tax assets *)- Additional value adjustments- Difference in valuation and change in value of liabilities and hedging instruments- Adjustment, permitted holding of treasury shares- Treasury shares acquired by customers via loan financing
Common Equity Tier 1 (CET1) capital after regulatory adjustments- Deduction for equity inv. in associates- Deduction for equity inv. >10%- Deduction for the sum of equity investments <10%
Difference in valuation and change in value of liabilities and hedging instruments- Additional Tier 1 (AT1) capitalTier 1 capital (T1)- Tier 2 capital (T2)- Deduction for equity inv. in ass.- Deduction for equity inv. >10%- Deduction for the sum of equity investments <10%Total capital (CT)
*) Concerns a separate loss spec. rel. to a subsidiary; see note 37 in the Annual Report.
2014
1,255.3 1,255.3 23.2 571.4 6,099.9 5,116.9 96.3 89.4 -376.6 -200.8 -175.0 -182.8 -37.0 -37.0 0.0 -60.3 0.0 -5.1 -161.1 -83.9 -6.0 -19.4 -22.0 -26.2 0.0 -9.6 -21.5 -20.5 -2.2 -3.5 6,673.3 6,383.9 0.0 -120.6 0.0 -10.2 -120.8 -167.8 0.0 0.0 393.0 430.7 6,945.5 6,516.0 1,078.0 1,148.8 0.0 -120.6 0.0 -10.2 -120.8 -167.8 7,902.7 7,366.2
DKK m 2015
Figure 4.2

SPAR NORD BANK RISK REPORT 2015 10
Deductions have been made for proposed dividend in the amount of DKK 376.6 million, equal to DKK 3 per share. The extraordinary dividend distributed as a result of the gain on the sale of the share-holding in Nørresundby Bank resulted in a reduction of DKK 251.1 million, equal to DKK 2 per share.
In addition, two loans totalling DKK 550 million, issued in 2015 as Additional Tier 1 (AT1) capital, have been redeemed. These two loans did not qualify pursuant to CRR, and consequently only 80% of the issued capital was included in own funds at end-2014, and 70% was included at the beginning of 2015. Subsequently, a new loan of DKK 400 million, qualifying as Additional Tier 1 (AT1) capital pursuant to CRR, was floated in 2015. The conversion had a positive impact of DKK 15 million in 2015, despite the fact that the total principal of the issued Additional Tier 1 (AT1) capital was reduced by DKK 150 million.
Moreover, Tier 2 capital (T2) has been redeemed, which results in a negative impact of DKK 58.0 million.
4.5 TOTAL RISK EXPOSUREThe total risk exposure constitutes an important target used for determining the minimum capital requirement and calculating the key risk indicators, such as Spar Nord’s total capital ratio and the individual solvency need.
A variety of factors impact the total risk exposure, including the dis-tribution of credit exposures on customer categories and products. Spar Nord calculates the total risk exposure for credit risk and mar-ket risk using the Basel II standard approach. The market-value ap-proach is used for calculating counterparty risk, while the exposure to operational risk is calculated using the basic indicator approach. In addition, Spar Nord uses the comprehensive approach for finan-cial collateral.
As appears from figure 4.3, the bulk of the combined capital require-ment (78.6%) is attributable to credit risk.
In 2015, the total risk exposure dropped by DKK 2,504.6 million; thus, at end-2015 it stood at DKK 46,499.9 million.
In 2015, the total risk exposure for credit risk declined by DKK 2,904.1 million, corresponding to a DKK 232.3 million reduction of the capital requirement. The reduction in the total risk exposure for credit risk is attributable to a reduction in the exposure categories corporates, retail, high-risk, equity and counterparty risks, regard-ing which there was a decline in credit exposure.
The calculated counterparty risk has been added to the tightened capital requirement related to OTC transactions with financial coun-terparties (CVA), representing a risk exposure of DKK 220.0 million (2014: DKK 327.1 million).
In 2015, the total risk exposure for market risk increased to DKK 4,162.6 million. The increase reflects primarily a rise in debt instru-ments of DKK 226.9 million, which is mainly caused by an increase in the gross interest-rate risk. The equity risk and the foreign-ex-change risk have been reduced by a total of DKK 99.0 million.
In 2015, the total risk exposure for operational risk increased by DKK 71.2 million to a total of DKK 5,787.2 million.
The figure below shows the changes in total risk exposure from 2014 to 2015.
4.6 INDIVIDUAL SOLVENCY NEED Spar Nord uses the so-called 8+ model that the Danish Financial Supervisory Authority stipulates in its guidelines. The 8+ method is based on the statutory minimum capital requirement of 8% of the total risk exposure (Pillar 1) plus adds-on for risks and matters not fully reflected in the calculation of the total risk exposure. In other words, ordinary risks are assumed to be covered by the 8% require-ment, and, consequently a position has to be taken on the extent to which an institution has additional risks that necessitate an add-on to the internally calculated solvency need ratio (Pillar 2).
4. CAPITAL MANAGEMENT AND INDIVIDUAL SOLVENCY NEED
TOTAL RISK EXPOSURE
Credit risk
- Central gov. or central banks
- Regional or local authorities
- Public-sector entities
- Institutions
- Corporates
- Retail
- Exp. secured by mortg. on imm. prop.
- Exp. in default
- High-risk exposures
- Exp. with short-term rating
- Exp. in units or CIU
- Equity exposure
- Other exposures
- Counterparty risk
Credit risk, total
Market risk
- Debt instruments
- Shares, etc.
- Foreign-exchange risk
- Commodity risk
Market risk, total
Operational risk, total
Total
20142015DKK m
0.0 0.0 0.0 0.0
0.0 0.0 0.0 0.0
0.5 0.6 5.9 7.1
55.2 65.0 690.4 812.1
1,036.7 1,068.4 12,958.7 13,354.9
1,098.6 1,181.2 13,732.2 14,765.7
129.9 96.2 1,623.9 1,202.2
153.0 143.2 1,912.3 1,789.7
67.3 99.2 840.8 1,239.6
0.1 22.1 1.5 276.4
0.5 0.6 6.4 8.3
143.6 182.6 1,795.3 2,282.0
99.4 105.9 1,243.1 1,324.4
139.2 191.3 1,739.6 2,391.8
2,924.0 3,156.3 36,550.1 39,454.2
292.0 273.8 3,649.5 3,422.6
21.9 18.6 274.2 232.5
18.9 14.3 236.1 178.8
0.2 0.0 2.8 0.4
333.0 306.7 4,162.6 3,834.3
463.0 457.4 5,787.2 5,716.0
3,720.0 3,920.4 46,499.9 49,004.5
20142015
Capital requirement*) Risk exposure
*) The capital requirement is calculated as 8% of the risk exposure Figure 4.3
DKK m
50,000
47,000
44,000
41,000
CHANGE IN TOTAL RISK EXPOSURE
49,005
328 712,904
46,500
Riskexposure
2014
Creditrisk
Marketrisk
Operationalrisk
Figure 4.4
Risk exposure
2015

SPAR NORD BANK RISK REPORT 2015 11
In the guidelines issued by the Danish Financial Supervisory Aut-hority, benchmarks have been introduced within a number of risk areas determining when the Authority basically finds that Pillar 1 is insufficient, and that an add-on to the individual solvency need ratio is required. In addition, to the extent possible methods have been introduced for calculating the amount of the add-on within the individual risk areas.
Based on the guidelines issued by the Danish Financial Supervisory Authority, the Board of Directors determines Spar Nord’s adequate own funds and individual solvency need upon the recommendation of the Solvency Committee.
Spar Nord’s calculation method follows the guidelines issued by the Danish Financial Supervisory Authority and is based on an assess-ment of risks within the following nine key areas, of which the first eight are directly addressed in the guidelines:
1. Earnings 2. Lending growth 3. Credit risks - Credit risk attaching to large customers having financial
difficulties - Concentration risk: Individual customers - Concentration risks: Lines of business - Concentration, collateral - Concentration, geography - Concentration, retail/business - Other credit risks 4. Market risks - Interest-rate risk - Equity risk - Foreign-exchange risk 5. Liquidity risks 6. Operational risks 7. Leverage8. Regulatory maturity of capital instruments9. Other risks - The Bank’s business profile - Strategic risks - Reputation risks - Properties - Other
The impact of the individual areas on the capital need has been calculated directly using the methods designated by the Danish Fi-nancial Supervisory Authority in its guidelines, and by making sup-plementary calculations. Management has made an estimate in a few risk areas.
In Spar Nord’s opinion, the risk factors included in the model cover all the risk areas required by legislation to be taken into considera-tion by Spar Nord’s Management in determining the solvency need and the risks that the Management finds Spar Nord has assumed. At end-2015, Spar Nord’s adequate own funds were calculated at DKK 4,438.0 million, which is DKK 326.8 million down on end-2014.
Spar Nord’s total risk exposure dropped from DKK 49.0 billion at end-2014 to DKK 46.5 billion at end-2015, while the solvency need ratio calculated in per cent has been reduced from 9.7 to 9.5.
4. CAPITAL MANAGEMENT AND INDIVIDUAL SOLVENCY NEED
4.7 CAPITAL BUFFER By virtue of the implementation of the Capital Requirements Direc-tive, CRD IV, into the Danish Financial Business Act, Danish finan-cial institutions are obligated to comply with several buffer require-ments. A common feature of all buffers is that only the Common Equity Tier 1 (CET1) may be used for meeting the capital require-ment.
If a financial institution fails to meet the capital requirement as to buffers, the financial institution will be restricted from the option of making dividend payments and other distributions.
The combined capital buffer requirement is the sum of the total Common Equity Tier 1 (CET1) that is necessary for complying with the requirement as to a capital conservation buffer, an institution-specific counter-cyclical capital buffer and a systemic buffer.
3,453.0 7.4 3,550.6 7.5
422.0 0.9 423.1 0.9
463.0 1.0 435.6 0.9
100.0 0.2 100.0 0.2
0.0 0.0 0.0 0.0
4,438.0 9.5 4,509.3 9.5
CAPITAL REQUIREMENT BROKEN DOWN BY RISK AREA 2015
Credit risk
Market risk
Operational risk
Other risks
Supplement, if requiredby law
Total
The BankCapital
requirementDKK m / %
The BankAdequate own
funds
Figure 4.5
Spar NordCapital
requirement
Spar NordAdequate own
funds
3,784.3 7.7 3,885.6 7.7
409.1 0.8 409.6 0.8
457.3 0.9 457.8 0.9
114.1 0.3 114.1 0.3
0.0 0.0 0.0 0.0
4,764.8 9.7 4,867.1 9.7
CAPITAL REQUIREMENT BROKEN DOWN BY RISK AREA 2014
Credit risk
Market risk
Operational risk
Other risks
Supplement, if requiredby law
Total
The BankCapital
requirementDKK m / %
The BankAdequate own
funds
Spar NordCapital
requirement
Spar NordAdequate own
funds
PHASE-IN OF BUFFER REQUIREMENTS 2015-2019
4
2
0
2015 2016 2017 2018 2019
Figure 4.6
5
3
1
Capital conservation buffer Counter-cyclical buffer
%

SPAR NORD BANK RISK REPORT 2015 12
4. CAPITAL MANAGEMENT AND INDIVIDUAL SOLVENCY NEED
In 2015, the capital conservation buffer in Denmark was 0%. At 1 January 2016, the capital conservation buffer amounted to 0.625% of the total risk exposure. When the capital conservation buffer has been fully phased in on 1 January 2019, the requirement as to a ca-pital conservation buffer will amount to 2.5% of the total risk expo-sure.
The Danish Minister for Business and Growth and other regulatory bodies in the EU/EEA area may fix the institution-specific counter-cyclical capital buffer if the credit growth results in a society-wide buildup of risks. Basically, the institution-specific counter-cyclical capital buffer may amount to somewhere between 0% and 2.5% of the total risk exposure when the rules have been fully phased in by 2019.
The Danish Minister for Business and Growth may fix a systemic buffer to counteract and limit long-term non-cyclical systemic or macro-prudential risks that are not comprised by CRR. Initially, the rules have been used to fix systemic buffers for the so-called SIFI institutions. Spar Nord is not a SIFI institution.
Based on the geographical distribution of Spar Nord’s credit risks, the capital requirement for the counter-cyclical buffer at end-2015 has been calculated in the figure below.
The geographical spread of credit exposures that are relevant for calculating the counter-cyclical buffer is as follows:
In 2016, Spar Nord expects only to meet the counter-cyclical buf-fer requirement for exposures in Norway and Sweden, which will amount to less than 0.1%.
Capital requirements for systemic risks are not expected, for which reason the combined buffer requirement in 2016 is also expected to be less than 0.725%. The standard layout to be used for publishing information regarding the requirement as to compliance with the requirement as to a counter-cyclical capital buffer appears from Ap-pendix E.
4.7.1 EXCESS COVERAGE RELATIVE TO STATUTORY REQUIREMENT AND CAPITAL TARGETS At end-2015, Spar Nord’s total capital ratio stood at 17.0%, corre-sponding to an excess coverage of 7.5 percentage points relative to the total capital requirement. (End-2014: 5.3 percentage points).
Given the excess coverage of 7.5 percentage points at end-2015, Spar Nord’s excess coverage is thus comfortably above the target.
In monetary terms, Spar Nord had an excess coverage in terms of capital of DKK 3.5 billion at end-2015, see the figure below.
COUNTER-CYCLICAL BUFFER
Total risk exposure, DKK m
Institution-specific counter-cyclical buffer rate, %
Institution-specific counter-cyclical buffer req., DKK m
The Bank
46,499.9 47,391.2
0.0 0.0
2.2 2.2
Figure 4.7
Spar Nord
CREDIT EXPOSURE, GEOGRAPHICAL
%
Denmark
Great Britain
Germany
Sweden
Finland
Luxembourg
Norway
Spain
Switzerland
France
USA
Other countries
The Bank
95.9 96.0
1.0 1.0
0.6 0.5
0.3 0.3
0.4 0.4
0.4 0.4
0.2 0.2
0.1 0.1
0.2 0.2
0.2 0.2
0.1 0.1
0.6 0.6
Figure 4.8
Spar Nord
EXCESS COVERAGE RELATIVE TO STATUTORY REQUIREMENT
Total capital (CT) (DKK m)
Adequate own funds (DKK m)
Combined buffer requirement (DKK m)
Total capital requirement (DKK m)
Excess coverage (DKK m)
Total capital ratio (%)
Individual solvency need ratio (%)
Combined buffer requirement (%)
Total capital requirement (%)
Excess coverage (percentage points)
The Bank2014
Spar Nord2014
7,902.7 7,966.5 7,366.2 7,447.8
4,438.0 4,509.3 4,764.8 4,867.1
2.2 2.2 0.0 0.0
4,440.2 4,511.5 4,764.8 4,867.1
3,462.5 3,455.0 2,601.4 2,580.7
17.0 16.8 15.0 14.8
9.5 9.5 9.7 9.7
0.0 0.0 0.0 0.0
9.5 9.5 9.7 9.7
7.5 7.3 5.3 5.1
Figure 4.9
The Bank2015
Spar Nord2015
CAPITAL REQUIREMENT AND EXCESS COVERAGE
4,438
3,463
DKK m
Adequate own funds
Combined bufferrequirement
Excesscoverage
Total capital
Figure 4.10
7,903
8,000
6,000
4,000
2,000
2
SPAR NORD BANK RISK REPORT 2015 13
4. CAPITAL MANAGEMENT AND INDIVIDUAL SOLVENCY NEED
4.8 LEVERAGE RATIO CRD IV has introduced requirements as to the calculation of the le-verage ratio. The leverage ratio is calculated based on an institu-tion’s capital measure (core capital) divided by the institution’s total exposure measure. Spar Nord has put in place procedures that are intended to identify indicators of and address excess leverage risk and to ensure identification, management and monitoring of the in-stitution’s leverage risk. Consequently, Spar Nord has introduced a threshold value for the leverage ratio, which has been fixed by the Board of Directors. In addition to introducing a threshold value and procedures for calculating the leverage ratio, Spar Nord has intro-duced guidelines defining the initiatives that might need to be taken if the leverage ratio drops below the threshold value. In addition, methodologies have been developed to measure risks connected with excess leverage and methodologies designed for assessing material changes in leverage ratio.
Risk of excessive leverage means the risk resulting from an institu-tion’s vulnerability due to leverage or contingent leverage that may require unintended corrective measures in its business plan, includ-ing distressed selling of assets which might result in losses or in valuation adjustments to its remaining assets.
As yet, the final leverage target has not yet been determined legis-latively, but currently a provisional target of 3% has been set, equal to a maximum leverage of 33 times the shareholders’ equity. Spar Nord complied with this target with a solid margin, as Spar Nord’s leverage ratio was calculated at 8.0% at end-2015. This calculation was made based on the calculated own funds in section 4.4.2, which complies with the rules for a transitional scheme pursuant to CRR.
4.9 THE IMPORTANCE OF FUTURE RULES ON CAPITAL REQUIREMENTS The CRD IV/CRR package is the cornerstone of the European re-gulation of credit institutions and investment firms, and in 2014 it superseded the existing directives regarding the pursuit of business as a credit institution or investment firm and the national imple-mentation thereof by the Member States.
As a result of transitional rules, the full impact of CRR/CRD IV has not yet materialized. In Spar Nord’s estimate, the Common Equity Tier 1 (CET1) ratio would be 13.9% at 31 December 2015 if the CRR rules had been fully phased in. This corresponds to a reduction of 0.5% compared with the 14.4% that has been calculated based on the transitional rules to CRR. In 2016, the transitional rules will tighten up the rules regarding deductions for equity investments. Accordingly, Spar Nord’s Common Equity Tier 1 (CET1) ratio will be reduced by 0.2% in 2016. Only the impact resulting from the rules, when viewed in isolation, has been taken into account.
Over the past few years, many directives and regulations have been adopted and implemented. As EU legislation is composed of three levels (levels 1-3), there are still about 275 delegated legislative acts, of which most relate to CRR/CRD IV and MIFID/MIFIR.
In light of the many regulatory initiatives taken after the start of the financial crisis in 2008, the EU Commission has launched a review of the overall impact of the financial regulations, including CRR/CRD IV. The review’s target is to identify unintended, unnecessary admi-nistrative burdens, inconsistencies and unintended consequences.
The Basel Committee is currently conducting a comprehensive re-view of the material that forms the basis of Basel III. At this time of writing there are new draft rules in the following areas:
• Review of the Credit Valuation Adjustment (CVA) risk framework • Revisions to the standardized approach for credit risk• The standardized approach for measuring counterparty credit risk • Operational risk – Revisions to the simpler approaches • Fundamental review of the trading book
Basel’s new standard (Basel IV) is expected to be ready at the end of 2016 or at the beginning of 2017.
Given the many reviews that are in progress, coupled with a number of follow-up works targeting CRR/CRD IV, such as
• the introduction of leverage requirements, if deemed necessary• a review of macroprudential tools
there is a likelihood that the CRR/CRD IV will be revised. According to the Danish Ministry for Business and Growth, proposals for new EU legislation (CRD V) will be put forward in 2017.

SPAR NORD BANK RISK REPORT 2015 14
5. LIQUIDITY RISK
5. LIQUIDITY RISKSpar Nord is generally exposed to liquidity risks when lending, inve-stment and funding activities result in a cash flow mismatch. Liqui-dity risk means that Spar Nord cannot meet its payment obligations at the same time as meeting the statutory liquidity requirements. Moreover, a liquidity risk exists if the lack of financing/funding pre-vents Spar Nord from adhering to the adopted business model, or if Spar Nord’s costs for procurement of liquidity rise disproportio-nately.
5.1 LIQUIDITY POLICYThe policy determines Spar Nord’s overall risk profile for liquidity risks and financing structure, as well as the overall organizational delegation of responsibilities in the liquidity area with a view to pro-fitably supporting Spar Nord’s business model.
The aim of the liquidity policy is to ensure that Spar Nord has a li-quidity risk that at all times bears a natural relation to its overall risk profile. In addition, the liquidity policy is intended to ensure that Spar Nord continuously handles and manages its liquidity on the ba-sis of appropriate and updated procedures, is capable of meeting its payment obligations as and when due, complying with applicable legislation and supporting future activities and growth.
5.2 MANAGEMENT, MONITORING AND REPORTING On the basis of the policies, objectives and contingency plans set up by the Board of Directors, the Executive Board has defined operatio-nal frameworks and specific limits for Trading, Financial Markets & the International Division, which is responsible for managing Spar Nord’s short-term liquidity, and for the Finance & Accounts Depart-ment, which is responsible for managing Spar Nord’s long-term funding.
Spar Nord calculates Spar Nord’s strategic liquidity as deposits excl. repo transactions, senior loans, issued bonds, subordinated debt and shareholders’ equity less loans and advances, excl. reverse transactions. Subordinated debt, senior loans and issued bonds due within 12 months are not included in the calculation of strategic li-quidity.
In its liquidity policy, Spar Nord aims to have excess liquidity cove-rage pursuant to the statutory requirement in section 152 of the Da-nish Financial Business Act of minimum 50% calculated in relation to own liquidity. This means that Spar Nord’s objective in terms of excess coverage is exclusive of assets linked to pooled schemes. In addition, Spar Nord’s objective is that as a minimum LCR should amount to 100% pursuant to the LCR Regulation. In addition, Spar Nord’s objective is to stay below the threshold value for Funding Ra-tio in the Diamond Test Model.
The Finance & Accounts Department is responsible for calculating, monitoring and checking that Spar Nord’s liquidity risk does not ex-ceed the instruction limits. It regularly reports to the Board of Di-rectors, the Executive Board and the Danish Financial Supervisory Authority.
5.3 DEVELOPMENTS IN 2015Spar Nord’s liquidity situation improved significantly throughout 2015. Thus, Spar Nord’s strategic liquidity increased by DKK 4.5 bil-lion compared with end-2014. Correspondingly, Spar Nord’s excess liquidity coverage according to section 152 of the Danish Financial Business Act has been increased by 110 percentage points. LCR en-tered into final effect as of 1 October 2015, and at end-2015 Spar Nord’s LCR ratio was calculated at 145%. Thus, Spar Nord’s excess liquidity coverage at end-2015 had greatly improved compared with 2014 and is adequate seen over both the short and long term.
Short-term Liquidity Management of funding Long-term liquidity liquidity management stress test sources and needs management
Liquidity management at Spar Nord
Figure 5.1
Objective Ensuring that in the Ensuring that in the Ensuring that Spar Nord Ensuring that Spar Nord Ensuring that Spar Nord short operational term, short term (30 days), Spar becomes aware in due has a diversified and has hedged any Spar Nord will be capable Nord has appropriate time of future liquidity balanced funding long-term mismatch of meeting its high-quality liquid assets and refinancing risks. structure. between deposits obligations at all times. to withstand a tough and lending. stress scenario. Stress test are Ensuring that Spar Nord Ensuring compliance prepared for maintains control of Ensuring compliance with appropriate liquidity Ensuring compliance a 12-month term. future funding needs, with the Funding Ratio requirements, with the Liquidity broken down on set up by the Danish see section 152 of the Coverage Ratio (LCR), funding sources. Financial Supervisory Danish Financial see CRR. Authority and Business Act. NSFR.
Management tool Decentralized Decentralized Central Central Central instruction target instruction target instruction target instruction target instruction target
Monitoring/control Markets Markets Funding Funding Funding
Recipient Executive Board/ Executive Board/ Executive Board/ Executive Board/ Executive Board/ Board of Directors Board of Directors Board of Directors Board of Directors Board of Directors
Model GAP analysis GAP analysis/ GAP analysis/ GAP analysis/ GAP analysis Simulation tool Projection Projection
Ratios/model for Cash resources Liquidity Coverage Ratio Liquidity Liquidity Strategic follow-up 5 week-rule 30 day-rule stress test projection liquidity

SPAR NORD BANK RISK REPORT 2015 15
5. LIQUIDITY RISK
5.4 SHORT-TERM LIQUIDITYFor several years, Spar Nord has been employing a fixed model to manage short-term liquidity. The model is used to calculate de-velopments in Spar Nord’s liquidity on the assumption that all mo-ney market funding falls due according to the terms of the appro-priate contract and is not renewed. This is done on a daily basis over a period of eight weeks. The Board of Directors determines the time window in which Spar Nord’s liquidity is to remain positive according to the model.
5.5 CASH RESOURCESAt 1 October 2015, the new LCR requirement entered into force, but section 152 of the Danish Financial Business Act will remain in force until phased out. Thus, two different statements of the cash resour-ce buffer are to be prepared and filed.
5.5.1 CASH RESOURCE BUFFER PURSUANT TO SECTION 152 Spar Nord’s management of short-term liquidity is intended to en-sure adequate, free liquidity in order that Spar Nord can at all ti-mes live up to the minimum excess liquidity coverage pursuant to section 152 of the Danish Financial Business Act and observe the 50% threshold value determined in the Diamond Test Model. Free liquidity is defined as uncollateralized highly liquid investment se-curities, deposits on demand with credit institutions, certificates of deposit, and cash balances. The excess liquidity coverage pursuant to the minimum require-ment laid down in section 152 of the Danish Financial Business Act amounted to DKK 22.8 billion at end-2015 versus DKK 14.9 billion at end-2014. If the excess coverage is converted to a percentage ratio, this corresponds to a liquidity coverage ratio (LCR) of 296% in 2015, whereas it amounted to 186% in 2014.
5.5.2 LIQUIDITY RESOURCE BUFFER PURSUANT TO LCR In preparation for the entry into force of LCR as of 1 October 2015, Spar Nord adapted the short-term liquidity management procedu-res to prepare for compliance with the LCR rules. At end-2015, LCR was thus included as part of Spar Nord’s short-term liquidity ma-nagement, which is handled by Spar Nord’s liquidity management function.
At end-2015, LCR was calculated at 145%, which is comfortably above Spar Nord’s target LCR of at least 100%. The excess coverage of 45 percentage points corresponds to DKK 5.0 billion in excess li-quidity.
The cash resource buffer pursuant to LCR basically consists of so-vereign claims (Level 1A assets) and high-liquidity mortgage-credit bonds with a particularly high credit quality (Level 1B assets).
5.6 STRESS TESTSIn addition to Spar Nord’s liquidity management models, Spar Nord prepares internal stress tests. The stress tests span a 12-month pe-riod and are calculated using three permanently defined scenarios: A business-specific, a market-specific and a mixed scenario.
In addition, Spar Nord performs a stress test corresponding to Moo-dy’s “12-month scenario with no access to funding”. This scenario operates on the assumption that Spar Nord has no access to capital markets during the period of calculation, for which reason senior loans, issued bonds and subordinated debt cannot be refinanced on maturity. On the other hand, the stable deposits base remains an accessible financing source, while only a moderate reduction in Spar Nord’s assets is assumed.
300
200
100
0
LIQUIDITY RELATIVE TO STATUTORY LIQUIDITY REQUIREMENT (SECTION 152)
164
%
2011 2012 2013 2014 2015
Figure 5.2
231 186211 296
142 158
LIQUIDITY COVERAGE RATIO (LCR)%
200
150
100
50
0
2015 Q2 2015 Q3 2015 Q4
Figure 5.3
145
LIQUIDITY COVERAGE RATIO
Cash resources
Liquidity requirement
LCR (%)
2015DKK bn
Figure 5.4
15.9
10.9
145

SPAR NORD BANK RISK REPORT 2015 16
5. LIQUIDITY RISK
As appears from the figure below, Spar Nord has positive liquidity for the full 12-month period.
In addition to Spar Nord’s own stress tests and Moody’s 12-month scenario with no access to funding, monthly liquidity stress tests are prepared and submitted to the Danish Financial Supervisory Authority.
5.7 STRATEGIC LIQUIDITYSpar Nord’s strategic liquidity is used to measure the long-term li-quidity position.
At end-2015, Spar Nord had strategic liquidity of DKK 19.5 billion. This corresponds to an increase of DKK 4.5 billion compared to end-2014, when the strategic liquidity was calculated at DKK 15.0 billion.
The increase in strategic liquidity is mainly attributable to an in- crease in bank deposits of DKK 2.2 billion and a decline in bank loans of DKK 1.8 billion. In 2014, maturing subordinated debt in the amount of DKK 0.6 billion was recognized. Spar Nord refinanced the matured capital in mid-2015, for which reason strategic liquidity at end-2015 was positively impacted by the floating of DKK 0.4 billion by way of Additional Tier 1 (AT1) capital. Finally, leasing activities increased by DKK 0.2 billion, while consolidation contributed posi-tively by DKK 0.4 billion.
FUNDING
Central banks and credit institutions
Repos & repurchases with centr. banks
and credit inst.
Senior loans <1 year
Issued bonds <1 year
Deposits <1 yr
Deposits >1 yr
Senior loans >1 yr
Issued bonds >1 yr
Sum of AT1 and T2 capital
Shareholders’ equity, excl. AT1 capital
Total
20142015DKK m / % 2015
Figure 5.8
1,478.4 1,672.5 2.6 2.7
2,197.5 8,596.0 3.8 14.0
0.0 0.0 0.0 0.0
0.0 22.6 0.0 0.0
3,511.2 5,567.4 6.1 9.1
41,225.1 36,668.4 71.8 59.8
63.6 68.9 0.1 0.1
0.0 0.0 0.0 0.0
1,501.1 1,708.3 2.6 2.8
7,474.7 7,033.0 13.0 11.5
57,451.6 61,337.1 100.0 100.0
2014
22.5
15.0
7.5
0
MOODY’S 12-MTH SCENARIO WITH NO ACCESS TO FUNDING
DKK bn
End ofyear
Figure 5.5
1week
5mths.
6mths.
7mths.
8mths.
9mths.
10mths.
11mths.
12mths.
1mth.
2mths.
3mths.
4mths.
2015 2014 201310
15
20
25
20
15
10
5
0
Figure 5.6
DEVELOPMENT IN STRATEGIC LIQUIDITY
15.0
-0.1
19,5
DKK bn
Deposits, banking activities
Senior loans/bond
issues
Sharehold. equity and
subord.debt
Lending, banking activities
Maturity <1 year
Strategicliquidity
2015
Strategicliquidity
2014
2.2
Lending, leasing-activities
1.8 -0.20.2
0.6
20
16
12
8
4
0
DKK bn
2011 2012 2013 2014 2015
Figure 5.7
3.9
STRATEGIC LIQUIDITY
17.3 15.0 19.514.8
5.8 FUNDING AND MATURITY STRUCTURESpar Nord’s operations are predominantly funded through four fun-ding sources:
• Customer deposits• Loans or repo transactions from other credit institutions and Danmarks Nationalbank (the central bank)• Issued bonds and senior loans• Subordinated debt and shareholders’ equity
Overall, Spar Nord’s funding at end-2015 declined by DKK 3.9 bil-lion compared with 2014. The most important change in Spar Nord’s funding structure is a sharp reduction in repos and repurchases and an increase in deposits. Customers’ deposits still constitute Spar Nord’s largest funding source, amounting to 77.9% of Spar Nord’s total funding at end-2015, which is 9 percentage points higher than at end-2014.
In total, Spar Nord’s long-term funding (funding with a term to ma-turity of more than one year) amounts to 87.5%, which is 13.3 per-centage points up on end-2014.

SPAR NORD BANK RISK REPORT 2015 17
5. LIQUIDITY RISK
5.9 CONTINGENCY LIQUIDITY PLANSpar Nord has prepared an emergency liquidity plan pursuant to the Danish Executive Order on Management of and Control with Finan-cial Institutions. This plan contains a catalogue of possible courses of action to strengthen Spar Nord’s liquidity in a critical situation. The catalogue contains a more detailed description of the expected impact and time span of the individual actions.
The contingency liquidity plan enters into force if Spar Nord can only meet the predetermined liquidity instructions with difficulty and with resulting sharply increased funding costs.
5.10 ENCUMBERED ASSETSSince end-2014, Spar Nord has reported data regarding encumbe-red assets to the Danish Financial Supervisory Authority. Assets en-cumbrance may constitute a funding risk if the institution has many encumbered assets relative to its balance sheet, as the institution’s potential for providing funding via additional asset encumbrance is diminished. This may also have a negative impact on the potential for procuring unsecured financing given the deterioration in the po-sition of this type of creditors.
As part of its business model, Spar Nord has been active in the mo-ney and derivatives market for many years. One of the results is that there will be assets that have been encumbered.
Triggered by activities in the money market:
• Repo and reverse-repo transactions• Repurchase transactions with Danmarks Nationalbank• Securities lending
Triggered by activities in the derivatives market:
• CSA collateral for the market value of derivative transactions • Offsetting, cf. netting agreements
Collateralization for clearing purposes is also part of Spar Nord’s pledging procedures:
• Collateral furnished with clearing systems• Assets placed in facilities with central banks• Margins posted and default funds with CCPs
The primary collateral received derives from reverse-repo transac-tions. Spar Nord’s total encumbered assets amount to an average of 8.5% of the assets plus collateral received that can form the ba-sis for pledging/mortgaging. The published information about Spar Nord’s encumbered assets and collateral received has been calcu-lated based on median values for 2015.
The specifications regarding encumbered assets are contained in Appendix G.
5.11 FUTURE LEGISLATION REGARDING LIQUIDITYThe EU Commission has still not published a final set of rules governing NSFR, but they are expected to enter into final effect as of 1 January 2018. NSFR seeks to ensure stable funding profiles for the individual banks, the focus being the connection between the maturity of assets and funding. The NSFR ratio is to be calculated for a 12-month horizon. The EBA has introduced extended reporting metrics regarding li-quidity reporting – Additional Liquidity Monitoring Metrics (ALMM) – which need to be reported on a monthly basis for Spar Nord. In general, this new reporting standard seeks to identify the liquidity risks of a financial institution that are not included under LCR and NSFR. The entry into force of Additional Liquidity Monitoring Metrics has still not been finally determined.
FUNDING STRUCTURE
2015
DKK bn
40
30
20
10
0
Figure 5.9
Cent
ral b
anks
an
d cr
edit
inst
.
Rep
os &
repu
rch.
w
ith c
entr.
ban
ks
and
cred
it in
st.
Seni
or lo
ans
<1 y
r
Issu
ed b
onds
<1
yr
Dep
osits
<1
yr
Dep
osits
>1
yr
Seni
or lo
ans
>1 y
r
Issu
ed b
onds
>1
yr
Sum
of A
T1 a
nd
T2 c
apita
l
Shar
ehol
ders
’ eq
uity
exc
l. AT
1 ca
pita
l
Short-term funding Long-term funding
2014

SPAR NORD BANK RISK REPORT 2015 18
6. CREDIT RISK
6. CREDIT RISKCredit risk is the risk of loss as a result of borrowers or other counter-parties defaulting on their payment obligations, including the risks attaching to customers having financial difficulties, risks relating to large exposures, concentration risks and risks attaching to granted, unutilized credit lines. Credit risks also include settlement and counterparty risks. Settlement risk is the risk arising when payments are settled, for instance payments for currency transactions and tra-ding in financial instruments, including derivatives. The risk arises when Spar Nord transfers payments before it has attained full assur-ance that the counterparty has met all its obligations. Counterparty risk is the risk of loss as a result of a customer’s default of OTC deri-vatives and securities financing instruments.
6.1 CREDIT POLICY Spar Nord’s overall credit risk is controlled on the basis of Spar Nord’s credit policy, which the Board of Directors determines in conjunction with the overarching policies and frameworks for Spar Nord’s risk as-sumption. The pivotal objective of Spar Nord’s credit policy is to en-sure that earnings and risks are balanced, and that the assumption of risk is always quantified.
It is Spar Nord’s policy that all credit must be granted on the basis of insight into the customer’s financial position and that creditworthi-ness – the customer’s ability and will to meet current and future obli-gations – is a key parameter in all customer relations.
Spar Nord aims to develop long-term relationships with customers and does not want to use risk appetite as a competitive parameter. Spar Nord only wants to conclude transactions that conform to good banking practice and do not jeopardize Spar Nord’s reputation and professional profile.
As a basic rule, Spar Nord does not grant loans and credit facilities based on collateral alone. Thus, the customer should show the will and have the ability to repay loans without Spar Nord having to realize the collateral.
In its endeavours to ensure sound risk diversification of its credit exposure, Spar Nord has introduced a number of internal targets. Spar Nord does not want to be exposed to individual customers or lines of business that might solely and separately jeopardize Spar Nord’s independence. Consequently, Spar Nord has introduced a cap on customer exposures at DKK 500 million, of which the unsecured share of credit exposure may not exceed DKK 175 million in respect of any facility.
Exposures to financial institutions under supervision and repo and re-verse transactions are not comprised by this restriction. In determining the amount of exposure, generally accepted credit risk adjustments are made, as appears from the section regarding Large exposures in the CRR Regulation. The statutory limitations apply to trading partners in the financial sector with an external credit rating at investment grade level, and a DKK 700 million cap has been fixed internally for other trading partners in the financial sector.
Spar Nord has set targets for the industry diversification of loans, ad-vances and guarantees, which means that brackets have been fixed for the desired share of total exposure that significant industries may represent.
Finally, in its credit policy Spar Nord has decided that it wants insight into any exposures that its customers may have to other financial in-stitutions.
6.2 MANAGEMENT, MONITORING AND REPORTING The credit facility process at Spar Nord is centrally managed. Decen-tralized facility authorization rights are maximized at DKK 10 million for existing customers.
As concerns new customers, the facility authorization right is typi-cally half of that for existing customers. The powers of authority in the credit area are governed by two factors: The individual local mana-gers’ ability and need and the wish that a certain share of authorizati-ons from the local banks is to be dealt with by Credit Rating.
Customer advisers, in consultation with local managers, handle day-to-day management of Spar Nord’s credit risks. If an exposure ex-ceeds the local loan approval limits, it will be passed on and dealt with by Credit Rating, the Credit Committee (Chief Credit Officer and an Executive Board member) or the Board of Directors. Credit Rating may authorize exposures up to DKK 40 million for existing customers and DKK 15 million for new customers. The Credit Committee may authorize all facilities up to DKK 60 million, and up to DKK 30 million for new customers. All credit facilities in excess of DKK 60 million and all credit facilities exceeding DKK 30 million for new customers must be authorized by the Board of Directors.
Overall monitoring of Spar Nord’s credit risk exposure is managed by the Credit Quality Department. This department oversees changes in the credit quality of all exposures and undertakes systematic credit quality control of the entire credit portfolio.
The Credit Quality Department reviews all new exposures above DKK 100,000 and business customer exposures above DKK 300,000. New customers with weak credit quality are registered on an ongoing ba-sis.
Spar Nord has developed IT tools for controlling and monitoring credit risks. Spar Nord’s credit analysis system is used for monitoring pur-poses, and key data regarding credit exposures and customers’ finan-cial affairs are recorded in it. This is done to detect danger signals at an early stage as well as to monitor changes in the credit quality of portfolios and organizational units.
Every month a statistically-based rating of both retail and business customers is performed. Rating systems are used at the local level to grant credit facilities. Thus, customers in the rating groups accorded the least risk exposure are likelier to be given higher credit limits or extensions than those with the greatest risk exposure. In addition, the systems are used for managing overdrafts and for pricing purposes.
Line of business
Agricultural customers
Real estate
Financing and insurance
Industry and raw materials development
Trade
Energy supply
Retail customers
Share of total exposure* (%)
5 - 10
10 - 15
5 - 10
5 - 10
5 - 15
4 - 8
30 - 40
* Excl. reverse transactions Figure 6.1
TARGETS FOR INDUSTRY DIVERSIFICATION

SPAR NORD BANK RISK REPORT 2015 19
As an element in Spar Nord’s credit processing, all non-defaulting customers are risk classified according to the probability that the in-dividual customer defaults within the next 12 months.
Customers are divided into groups 1 to 9, with group 9 containing customers subject to the highest risk. The probability of default is es-timated statistically by means of Spar Nord’s rating systems which are based on various models for the different customer segments. The model applied to business customers employs three compo-nents: An accounting component used to risk-classify the customer based on his most recent financial statements. A behavioural compo-nent that classifies the customer based on his account behaviour and credit authorization history. The third component is a cyclical element that is used to adjust the classification based on cyclical trends.
New business customers are classified based on the accounting com-ponent and the cyclical component until the sixth month, at which time the behavioural component is also applied.
For retail customers, the model is exclusively based on a behavioural component and a cyclical component.
New retail customers are risk-classified according to an application scoring model that is based on classical credit performance indica-tors, such as assets, pay, disposable income, etc. This model is ba-sed on a combination of a statistical and an expert model. After six months, customers are subjected to a behavioural scoring scrutiny, and the results obtained using the two models are co-weighted in the transitional period until the twelfth month, after which the rating is based on the behavioural component exclusively.
Moreover, Spar Nord applies a qualitative risk classification, credit watchlists, in which the Spar Nord adviser flags any credit facility showing signs of default risk. For retail customers, these signs of de-fault risk may for instance be divorce, unemployment, etc., and for business customers they could be marketing difficulties, the loss of key employees or suppliers, etc.
If a retail customer is flagged in the credit-watchlist and is not in de-fault, the customer will be downgraded by one rating group; it should be noted that a customer flagged in the credit-watchlist does not qua-lify for rating in the best rating groups (1 and 2).
In 2015, Spar Nord introduced a new rating approach for business customers that rates flagged customers and non-flagged customers on the basis of two different models. However, both models are based on the same components. The new rating approach has also been ap-plied to the comparative figures for 2013 and 2014.
6.3 DEVELOPMENTS IN 2015 In 2015, Spar Nord generally saw satisfactory growth in the lending portfolio. In the past three years, the credit quality of retail customers has remained at a stable, satisfactory level, while the credit quality of business customers has showed improvement during the same period. The only exception is the credit quality for agricultural loans, which took a negative turn due to the difficult situation experienced by the agricultural sector. Also in 2015 the agricultural portfolio showed a decline in credit quality.
As opposed to previous years, Spar Nord did not take over any loan portfolios in 2015.
In both the retail and business customer segments, bank lending de-clined in 2015. For both customer categories the decline is attribu-table to such customers having made major repayments on existing loans and credits. The intake of new borrowers was high in 2015, par-ticularly among business customers, and growth in lending volume to new retail customers was also above the 2014 level.
6.4 CREDIT EXPOSURE The Group’s total credit exposure is attributable to lending activities and to trading activities involving bonds, financial instruments, etc.
The table below shows Spar Nord’s total credit exposure (carrying amount) as at 31 December 2015 and 31 December 2014.
Spar Nord’s impairment account and discount on exposures taken over amounted to a total of DKK 1,987.5 million at 31 December 2015.
6.5 LOANS, ADVANCES AND GUARANTEES Spar Nord’s total loans, advances and guarantees before offsetting of impairment losses and discount on exposures taken over amounted to DKK 49.6 billion at end-2015 compared with DKK 48.3 billion at end-2014, equal to 3% growth on 2014. This growth is attributable to two areas, reverse loans and leasing loans, which account for a DKK 3.7 billion increase and a DKK 0.1 billion increase, respectively. At the same time, guarantees dropped by DKK 0.7 billion, business lending by DKK 0.9 billion, and lending to public-sector customers by DKK 0.7 million. Lending to retail customers fell by DKK 0.2 billion.
6. CREDIT RISK
Figure 6.2
THE GROUP’S CREDIT EXPOSURE (CARRYING AMOUNT), INCL. DISCOUNT ON EXPOSURES TAKEN OVER, PROVISIONS AND FAIR-VALUE ADJUSTMENTS
Reverse transactions with customersLoans and advances at amortized costLoans and advances, totalGuarantee commitmentsCredit exposure to loans, advances and guarantees, net Impairment of loans, advances and guaranteesDiscount on exposures taken over Credit exposure to loans, advances and guarantees, gross Demand deposits with central banksReverse transactions with credit institutions and central banksReceivables from credit institutions and central banksDemand deposits and receivables from credit inst. and central banks
Credit exposure (carrying amount) on lending activities Positive market valuesCredit exposure, assets in the trading portfolioCredit exposure, other financial investment assetsEquity investments in associatesCredit exposure (carrying amount)
20142015DKK m 4,155.1 463.8 33,884.2 35,483.8 38,039.3 35,947.6 9,585.2 10,239.9 47,624.5 46,187.5 1,826.0 1,845.0 161.5 293.3 49,612.0 48,325.8 610.4 985.7 1,340.6 1,797.3 1,400.7 2,173.3 3,351.7 4,956.3 50,976.2 51,143.8 1,423.6 2,005.3 16,195.9 20,353.9 1,516.0 1,296.9 82.4 941.3 70,194.1 75,741.2
IMPAIRMENT ACCOUNT AND DISCOUNT ON LOANS, ADVANCES AND GUARANTEES
Impairment balance/discount
Discount on exposures taken over
Impairment account
Spar Nord
20142015DKK m 201420152014
Figure 6.3
2015
1,826.0 1,845.0 161.5 293.4 1,987.5 2,138.4
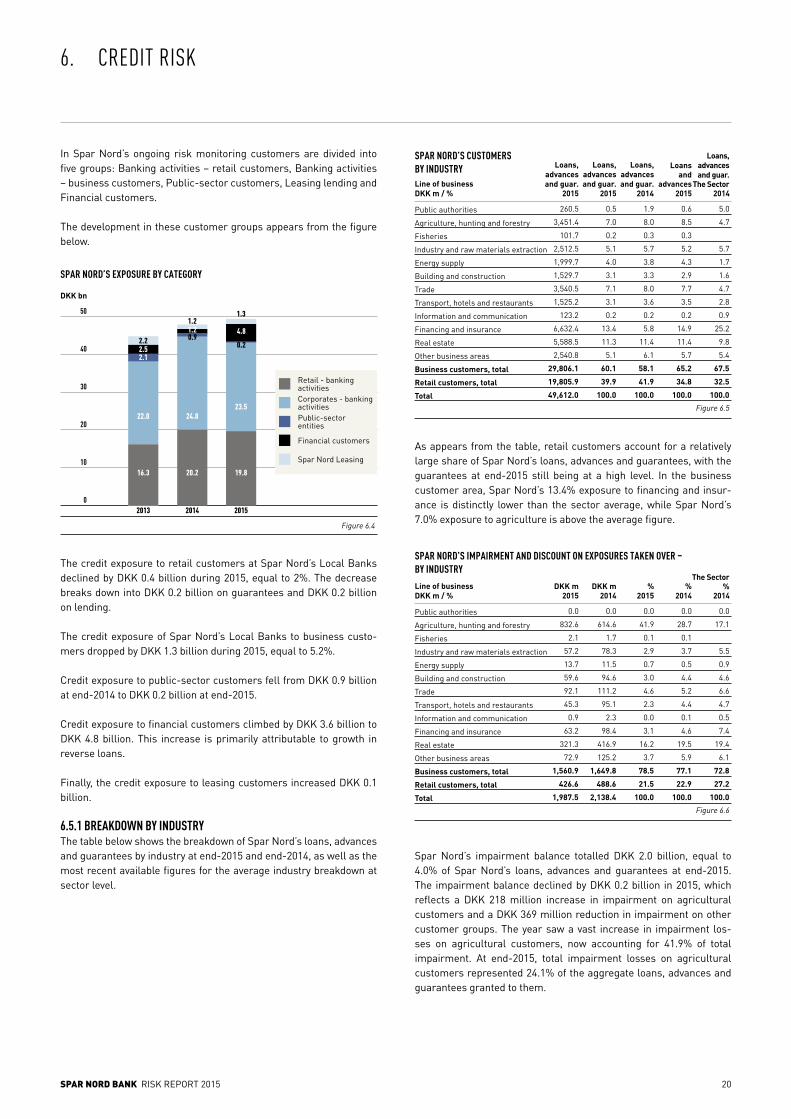
SPAR NORD BANK RISK REPORT 2015 20
6. CREDIT RISK
In Spar Nord’s ongoing risk monitoring customers are divided into five groups: Banking activities – retail customers, Banking activities – business customers, Public-sector customers, Leasing lending and Financial customers.
The development in these customer groups appears from the figure below.
The credit exposure to retail customers at Spar Nord’s Local Banks declined by DKK 0.4 billion during 2015, equal to 2%. The decrease breaks down into DKK 0.2 billion on guarantees and DKK 0.2 billion on lending.
The credit exposure of Spar Nord’s Local Banks to business custo-mers dropped by DKK 1.3 billion during 2015, equal to 5.2%.
Credit exposure to public-sector customers fell from DKK 0.9 billion at end-2014 to DKK 0.2 billion at end-2015.
Credit exposure to financial customers climbed by DKK 3.6 billion to DKK 4.8 billion. This increase is primarily attributable to growth in reverse loans.
Finally, the credit exposure to leasing customers increased DKK 0.1 billion.
6.5.1 BREAKDOWN BY INDUSTRY The table below shows the breakdown of Spar Nord’s loans, advances and guarantees by industry at end-2015 and end-2014, as well as the most recent available figures for the average industry breakdown at sector level.
As appears from the table, retail customers account for a relatively large share of Spar Nord’s loans, advances and guarantees, with the guarantees at end-2015 still being at a high level. In the business customer area, Spar Nord’s 13.4% exposure to financing and insur-ance is distinctly lower than the sector average, while Spar Nord’s 7.0% exposure to agriculture is above the average figure.
Spar Nord’s impairment balance totalled DKK 2.0 billion, equal to 4.0% of Spar Nord’s loans, advances and guarantees at end-2015. The impairment balance declined by DKK 0.2 billion in 2015, which reflects a DKK 218 million increase in impairment on agricultural customers and a DKK 369 million reduction in impairment on other customer groups. The year saw a vast increase in impairment los-ses on agricultural customers, now accounting for 41.9% of total impairment. At end-2015, total impairment losses on agricultural customers represented 24.1% of the aggregate loans, advances and guarantees granted to them.
SPAR NORD’S CUSTOMERS BY INDUSTRY
Public authorities
Agriculture, hunting and forestry
Fisheries
Industry and raw materials extraction
Energy supply
Building and construction
Trade
Transport, hotels and restaurants
Information and communication
Financing and insurance
Real estate
Other business areas
Business customers, total
Retail customers, total
Total
2014Line of businessDKK m / %
260.5 0.5 1.9 0.6 5.0
3,451.4 7.0 8.0 8.5 4.7
101.7 0.2 0.3 0.3
2,512.5 5.1 5.7 5.2 5.7
1,999.7 4.0 3.8 4.3 1.7
1,529.7 3.1 3.3 2.9 1.6
3,540.5 7.1 8.0 7.7 4.7
1,525.2 3.1 3.6 3.5 2.8
123.2 0.2 0.2 0.2 0.9
6,632.4 13.4 5.8 14.9 25.2
5,588.5 11.3 11.4 11.4 9.8
2,540.8 5.1 6.1 5.7 5.4
29,806.1 60.1 58.1 65.2 67.5
19,805.9 39.9 41.9 34.8 32.5
49,612.0 100.0 100.0 100.0 100.0
20142015
Figure 6.5
Loans, advancesand guar.
The Sector20152015
Loans, advancesand guar.
Loans, advancesand guar.
Loans and
advances
Loans, advancesand guar.
0.0 0.0 0.0 0.0 0.0
832.6 614.6 41.9 28.7 17.1
2.1 1.7 0.1 0.1
57.2 78.3 2.9 3.7 5.5
13.7 11.5 0.7 0.5 0.9
59.6 94.6 3.0 4.4 4.6
92.1 111.2 4.6 5.2 6.6
45.3 95.1 2.3 4.4 4.7
0.9 2.3 0.0 0.1 0.5
63.2 98.4 3.1 4.6 7.4
321.3 416.9 16.2 19.5 19.4
72.9 125.2 3.7 5.9 6.1
1,560.9 1,649.8 78.5 77.1 72.8
426.6 488.6 21.5 22.9 27.2
1,987.5 2,138.4 100.0 100.0 100.0
SPAR NORD’S IMPAIRMENT AND DISCOUNT ON EXPOSURES TAKEN OVER – BY INDUSTRY
2015
Public authorities
Agriculture, hunting and forestry
Fisheries
Industry and raw materials extraction
Energy supply
Building and construction
Trade
Transport, hotels and restaurants
Information and communication
Financing and insurance
Real estate
Other business areas
Business customers, total
Retail customers, total
Total
2014DKK mLine of business
DKK m / % 20152014
Figure 6.6
The Sector%
2014DKK m % %
Figure 6.4
SPAR NORD’S EXPOSURE BY CATEGORY
DKK bn
50
40
30
20
10
0
Corporates - banking activities
Financial customers
Spar Nord Leasing
Retail - banking activities
Public-sector entities
2014
20.2
24.8
1.21.20.9
2013
16.3
22.0
2.52.2
2.1
2015
23.5
4.8
1.3
19.8
0.2

SPAR NORD BANK RISK REPORT 2015 21
As concerns size of exposures, Spar Nord’s credit portfolio is consi-dered to be well-diversified, for one thing because 58.3% of the total exposure is attributable to exposures that are less than DKK 10 mil-lion each, and because Spar Nord only has 46 exposures that exceed DKK 100 million.
Spar Nord’s credit portfolio is also considered to have an excellent geographical spread. At end-2015, the traditional core area, northern Jutland, accounted for 38.7% of Spar Nord’s total loans, advances and guarantees, while the balance is spread over the other regions in the country.
6.5.2 RETAIL CUSTOMERS AT SPAR NORD’S LOCAL BANKS The total credit exposure to retail customers at Spar Nord’s Local Banks amounted to DKK 19.8 billion at end-2015 compared with DKK 20.2 billion at end-2014. The credit exposure to retail customers amounts to 39.9% of Spar Nord’s total credit exposure. As appears from the figure below, the credit quality of retail customers’ facilities has remained at an unchanged average in the past three years.
The slight improvement recorded in credit quality in 2014 was follow-ed by a minor decline in 2015.
The figures below show the share of retail customers who migrated into better rating groups, the share of retail customers with unchang-ed credit quality and the share of retail customers who migrated into higher-risk rating groups during 2015 and 2014.
As appears from the figures, development during the year was posi-tive in the migration towards better rating groups in terms of custo-mer number, whereas in terms of size of exposure, retail customers migrated the opposite way.
6. CREDIT RISK
LOANS, ADVANCES AND GUARANTEES BROKEN DOWN BY SIZE OF EXPOSURE *)
0 - 0.1
0.1 - 0.5
0.5 - 1.0
1.0 - 5.0
5.0 - 10.0
10.0 - 20.0
20.0 - 50.0
50.0 - 100.0
100.0 -
Total
DKK mNumber
2014
51,827 53,357 1.5 1.4
34,920 32,813 12.3 11.1
11,490 10,375 11.9 10.3
6,985 7,800 23.7 25.5
851 827 8.9 8.8
406 403 8.9 8.4
233 246 11.5 12.1
73 69 8.3 7.5
46 47 13.0 14.9
106,831 105,937 100.0 100.0
Sharein %
2015Number
2015
Sharein %
2014
Figure 6.7*) Excl. reverse transactions and SparXpres
AVERAGE RISK GROUP *)
Average risk category
2015
2.8 2.7 2.8
20142013
Figure 6.10
*) Exposure after impairment
LOANS, ADVANCES AND GUARANTEES BROKEN DOWN BY REGION - END-2015
14,1 12,5
%
60
40
20
0
The Capital Region
Mid-Jutland Region
North Jutland Region
RegionZealand
RegionSouth Denmark
8,624,4 38,7 1,7
Unallocated
LOANS, ADVANCES AND GUARANTEES BROKEN DOWN BY REGION - END-2014 *)
13,4 13,4
Pct.
60
40
20
0
The Capital Region
Mid-Jutland Region
North Jutland Region
RegionZealand
RegionSouth Denmark
8,2
Figure 6.8
24,0 39,5 1,5
Unallocated
*) Excl. reverse transactions and SparXpres
EXPOSURES TO RETAIL CUSTOMERS BY RISK GROUP *)
2013 2014 2015
%
40
30
20
10
0987654321 Default Not
rated
Figure 6.9
*) Excl. SparXpres

SPAR NORD BANK RISK REPORT 2015 22
6. CREDIT RISK
The stable development seen in the retail customer portfolio is cor-roborated by the trend in retail customers’ unauthorized overdrafts. Retail customers’ unauthorized overdrafts have remained at a stable, low level in recent years, averaging 0.5%.
6.5.3 BUSINESS CUSTOMERS (WITHOUT AGRICULTURE AND LEASING) AT SPAR NORD’S LOCAL BANKS The total credit exposure to business customers at Spar Nord’s Local Banks amounted to DKK 23.5 billion at end-2015 compared with DKK 24.8 billion at end-2014.
Spar Nord’s total exposure to public-sector customers declined to DKK 0.2 billion in 2015.
The credit exposure to business customers accounts for 47.4% of Spar Nord’s total credit exposure.
As appears from the figure below, the average credit quality of busi-ness customers has improved in recent years, which was also the case in 2015.
In 2015, a new model for rating business customers was introduced. This model was also applied to 2014 and 2013 in the figures below.
The figures below show the share of business customers who mi-grated into better rating groups during 2015 and 2014, as well as the share of business customers with unchanged credit quality and the share of business customers who migrated into higher-risk rating groups.
As appears from the figures, development was negative during the year, as migration towards better rating groups was smaller than mi-gration the opposite way, both in terms of customer number and size of exposure.
AVERAGE RATING GROUP *)
Average rating group
2015
4.5 4.1 4.0
20142013
Figure 6.15
*) Exposure after impairment
MIGRATION - NUMBERRETAIL CUSTOMERS 2014-2015
MIGRATION - NUMBERRETAIL CUSTOMERS 2013-2014
Upgraded Downgraded Unchanged
60
19
21
MIGRATION - EXPOSURESRETAIL CUSTOMERS 2014-2015
Figure 6.12
MIGRATION - EXPOSURESRETAIL CUSTOMERS 2013-2014
Upgraded Downgraded Unchanged
25
22 53
60
19
21
24
22 54
Figure 6.11
0,2
0,4
0,6
0,8
1,0
0.2
0.4
0.6
0.8
1.0
31.12.13 31.12.14
Linear(unauthorized overdrafts in % of loans & advances
Unauthorized overdrafts in % of loans and advances
31.12.15
%
RETAIL CUSTOMERS - LOCAL BANKS - DEVELOPMENT IN UNAUTHORIZED OVERDRAFTS/EXP. PAST DUE
Figure 6.13
Figure 6.14
EXPOSURES TO BUSINESS CUSTOMERS BY RATING GROUP *)%
25
20
15
10
5
0
2013 2014 2015
Notrated
Default98765431 2
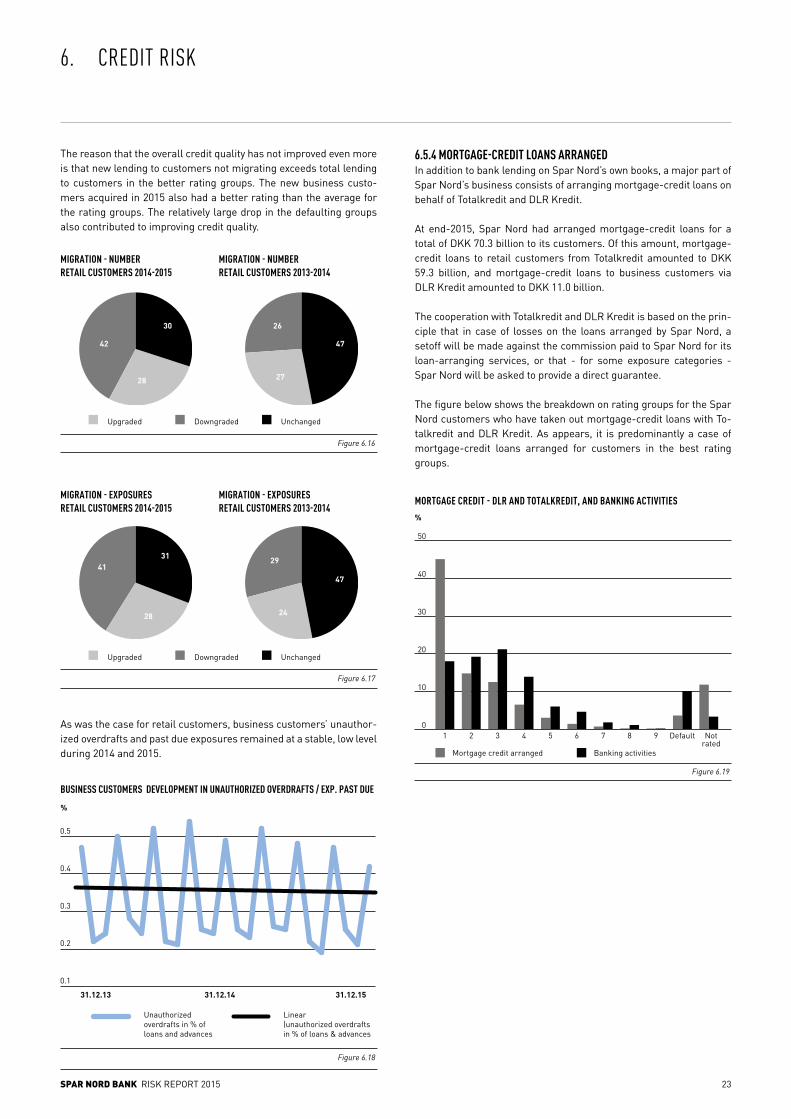
SPAR NORD BANK RISK REPORT 2015 23
6. CREDIT RISK
The reason that the overall credit quality has not improved even more is that new lending to customers not migrating exceeds total lending to customers in the better rating groups. The new business custo-mers acquired in 2015 also had a better rating than the average for the rating groups. The relatively large drop in the defaulting groups also contributed to improving credit quality.
As was the case for retail customers, business customers’ unauthor-ized overdrafts and past due exposures remained at a stable, low level during 2014 and 2015.
6.5.4 MORTGAGE-CREDIT LOANS ARRANGED In addition to bank lending on Spar Nord’s own books, a major part of Spar Nord’s business consists of arranging mortgage-credit loans on behalf of Totalkredit and DLR Kredit.
At end-2015, Spar Nord had arranged mortgage-credit loans for a total of DKK 70.3 billion to its customers. Of this amount, mortgage-credit loans to retail customers from Totalkredit amounted to DKK 59.3 billion, and mortgage-credit loans to business customers via DLR Kredit amounted to DKK 11.0 billion.
The cooperation with Totalkredit and DLR Kredit is based on the prin-ciple that in case of losses on the loans arranged by Spar Nord, a setoff will be made against the commission paid to Spar Nord for its loan-arranging services, or that - for some exposure categories - Spar Nord will be asked to provide a direct guarantee.
The figure below shows the breakdown on rating groups for the Spar Nord customers who have taken out mortgage-credit loans with To-talkredit and DLR Kredit. As appears, it is predominantly a case of mortgage-credit loans arranged for customers in the best rating groups.
Figure 6.18
0,1
0,2
0,3
0,4
0,5
0,6
0.1
0.2
0.3
0.4
0.5
31.12.13 31.12.14
Linear(unauthorized overdraftsin % of loans & advances
Unauthorizedoverdrafts in % ofloans and advances
31.12.15
%
BUSINESS CUSTOMERS DEVELOPMENT IN UNAUTHORIZED OVERDRAFTS / EXP. PAST DUE
MIGRATION - NUMBERRETAIL CUSTOMERS 2014-2015
MIGRATION - NUMBERRETAIL CUSTOMERS 2013-2014
Upgraded Downgraded Unchanged
28
42
30
MIGRATION - EXPOSURESRETAIL CUSTOMERS 2014-2015
MIGRATION - EXPOSURESRETAIL CUSTOMERS 2013-2014
Upgraded Downgraded Unchanged
31
28
41
27
26
47
29
24
47
Figure 6.16
Figure 6.17
50
40
30
20
10
0
MORTGAGE CREDIT - DLR AND TOTALKREDIT, AND BANKING ACTIVITIES
%
987654321 Default Notrated
Figure 6.19
Mortgage credit arranged Banking activities

SPAR NORD BANK RISK REPORT 2015 24
6.5.5 FINANCIAL CUSTOMERS Spar Nord’s credit exposure to financial customers was DKK 4.8 billi-on at 31 December 2015, equivalent to 9.6% of Spar Nord’s total loans and advances. The exposure consists primarily of reverse transac-tions of DKK 4.2 billion and own liabilities.
The table below shows Spar Nord’s credit exposure to financial custo-mers.
6.5.6 LEASING ACTIVITIES Spar Nord’s total credit exposure in the leasing area amounted to DKK 1.3 billion at end-2015, equal to 2.6% of total loans, advances and guarantees.
The table below shows the breakdown by industry of Spar Nord’s lea-sing loans.
In the context of risks, it is important to note that leasing lending is always backed by security in the assets, either through charges or ownership.
The table below shows developments in the volume of repossessed leasing equipment.
6.6 CREDIT QUALITY The figure below shows a breakdown of Spar Nord’s customers by the credit quality categories used by the Danish Financial Supervisory Authority. Categories 2a and 3 comprise good customers, while ca-tegories 1, 2c and 2b comprise heightened-risk customers or custo-mers having financial difficulties.
6.7 SECURITY An important element in Spar Nord’s management of credit risks is to reduce the risk attaching to individual exposures by accepting colla-teral, such as mortgages and charges over physical assets, securities and guarantees, etc. Mortgages on real property and charges over se-curities and vehicles make up the most common type of collateral, of which mortgages on real property are by far the most important col-lateral type provided to Spar Nord. Mortgages on real property consist mainly of mortgages on private housing.
A growth of DKK 3.7 billion in reverse lending in 2015 reduced the average unsecured share by 7.5 percentage points.
6. CREDIT RISK
SPAR NORD’S CREDIT EXPOSURE TO FINANCIAL CUSTOMERS
Reverse lending
Customers of other financial institutions
Spar Nord’s own exposures and central customers, etc
Financial customers, total
2014DKK m
4,155.1 463.8
12.2 58.1
596.2 704.5
4,763.5 1,226.4
2015
Figure 6.20
0.1 0.2 0.0 0.0
21.8 24.6 18.0 14.1
0.0 0.0 0.0 0.1
17.8 16.6 29.5 27.1
1.4 1.5 4.9 3.2
11.0 7.4 3.3 3.7
6.5 6.1 13.1 17.5
16.8 10.9 13.4 12.9
1.7 1.2 0.0 0.0
8.4 18.2 0.4 0.3
0.7 1.0 0.5 0.2
10.9 9.2 10.9 16.9
97.1 96.9 94.0 96.0
2.9 3.1 6.0 4.0
100.0 100.0 100.0 100.0
LEASE CONTRACTS
Public authorities
Agriculture, hunting and forestry
Fisheries
Industry and raw materials extraction
Energy supply
Building and construction
Trade
Transport, hotels and restaurants
Information and communication
Financing and insurance
Real estate
Other business areas
Business customers, total
Retail customers, total
Total
2014
Loans, advances and guaranteesLine of business
% 20142015
Figure 6.21
Impairm. acc./discount
2015
REPOSSESSED EQUIPMENT
Repossessed equipment, total
20142015
1.7 5.3
DKK m
Figure 6.22
CREDIT QUALITY2015
Public authorities
Agriculture, hunting and forestry
Fisheries
Industry and raw materials extraction
Energy supply
Building and construction
Trade
Transport, hotels and restaurants
Information and communication
Financing and insurance
Real estate
Other business areas
Business customers, total
Retail customers, total
Total
Credit quality categoriesLine of business%
0.0 0.0 0.0 0.5 0.5
4.3 0.2 0.2 2.3 7.0
0.0 0.0 0.1 0.1 0.2
0.7 0.0 0.4 4.0 5.1
0.1 0.0 0.3 3.6 4.0
0.6 0.1 0.2 2.2 3.1
0.9 0.1 0.6 5.5 7.1
0.5 0.0 0.2 2.4 3.1
0.0 0.0 0.0 0.2 0.2
0.6 0.0 0.2 12.6 13.4
2.7 0.2 0.7 7.7 11.3
0.4 0.1 0.3 4.3 5.1
10.8 0.7 3.2 45.4 60.1
2.1 0.1 3.1 34.6 39.9
12.9 0.8 6.3 80.0 100.0
2b2c Exposure2a/31
Figure 6.23
CREDIT QUALITY2014
Public authorities
Agriculture, hunting and forestry
Fisheries
Industry and raw materials extraction
Energy supply
Building and construction
Trade
Transport, hotels and restaurants
Information and communication
Financing and insurance
Real estate
Other business areas
Business customers, total
Retail customers, total
Total
Credit quality categoriesLine of business%
0.0 0.0 0.0 1.9 1.9
4.4 0.0 0.4 3.2 8.0
0.1 0.0 0.2 0.1 0.4
0.7 0.0 0.6 4.4 5.7
0.3 0.0 0.2 3.4 3.9
0.8 0.0 0.3 2.1 3.2
0.8 0.0 0.5 6.6 7.9
0.9 0.0 0.3 2.4 3.6
0.0 0.0 0.0 0.2 0.2
0.5 0.0 0.2 5.0 5.7
3.5 0.1 1.1 6.7 11.4
0.8 0.0 0.5 4.8 6.1
12.8 0.1 4.3 40.8 58.0
2.2 0.2 3.6 36.0 42.0
15.0 0.3 7.9 76.8 100.0
2b2c Exposure2a/31

SPAR NORD BANK RISK REPORT 2015 25
6. CREDIT RISK
On an ongoing basis, Spar Nord monitors the value of the collateral received. If the risk attaching to a counterparty increases, the col-lateral is subjected to a particularly critical scrutiny. The value is as-sessed based on the expected price to be fetched in a compulsory sale of the collateral less any expenses arising from its realization.
The property value under mortgages broken down by property type is calculated at DKK 22.4 billion, while only DKK 13.8 billion is recorded as security on the properties in the figure below. This is because the former amount represents the amount mortgaged to Spar Nord and recorded as collateral received, while the latter amount is the share actually used for calculating collateral regarding a specific exposure. Some exposures are smaller than the collateral value, and collateral has also been provided by customers to whom Spar Nord currently has no exposure.
In 2015, Spar Nord adjusted the mortgageable values of real prop-erty in accordance with the Danish Financial Supervisory Authority’s guidelines. As Spar Nord previously applied a more conservative valuation, this has contributed to the general decline in unsecured shares of credit exposure. But the decline in average unsecured shares is mainly attributable to the DKK 3.7 billion increase in reverse transactions, which singly reduces the unsecured share by 7.5 per-centage points.
6.8 IMPAIRMENT OF LOANS AND ADVANCES Based on the provisions of IAS 39, Spar Nord has defined an array of risk events that are considered objective evidence of impairment. Some risk events are automatically recorded in Spar Nord’s systems, while others are registered manually by customer advisers and credit staff members.
All significant loans and advances and credit-flagged exposures are re-evaluated individually. Credit-flagged lending exposures of less than DKK 250,000 are automatically reviewed using an algorithm ba-sed on the customer’s financial key figures and Spar Nord’s rating systems. All loans and advances that have not been impaired on an individual basis are assigned to groups having uniform credit risk ex-posure. If the review discloses objective evidence of impairment, an impairment loss is recognized. Impairment losses are calculated as the difference between the expected loss on the loan at the date of establishment and the present value of expected future losses on the loan. An exposure need not be in default before impairment is recog-nized and approval procedures regarding any new extension of credit are tightened.
Impairment losses are calculated individually as concerns all custo-mers suffering from financial imbalances (objective evidence of im-pairment (OEI)). The expected cash flow is calculated, comprising conservatively assessed values and realizable costs for any assets that might have to be sold to cover the outstanding debt.
MORTGAGES BROKEN DOWN BY PROPERTY TYPE
Private housing
Summer cottages
Offices and businesses
Agriculture
Other
Total
DKK m
54.3 12,166.2
4.1 922.5
15.6 3,498.1
12.9 2,874.1
13.1 2,934.6
100.0 22,395.5
%2015
Figure 6.25
SPAR NORD’S UNSECURED SHARE OF CREDIT EXPOSURE
<10
10-50
50-75
>75
Average unsecured share of credit exposure
2014
38.7 30.0
21.5 20.0
10.7 12.2
29.1 37.8
41.3 50.4
2015
Figure 6.26
Unsecured shares in %
Figure 6.27
SPAR NORD’S UNSECURED SHARE OF CREDIT EXPOSURE IN DKK M AND %
Public authorities
Agriculture, hunting and forestry
Fisheries
Industry and raw materials extraction
Energy supply
Building and construction
Trade
Transport, hotels and restaurants
Information and communication
Financing and insurance
Real estate
Other business areas
Business customers, total
Retail customers, total
Total
Line of business
259.9 99.7 925.2 99.8
1,130.6 32.7 1,176.6 30.5
53.8 52.9 64.9 50.4
882.4 35.1 1,351.2 49.4
636.7 31.8 811.0 43.8
629.9 41.2 767.7 48.9
1,766.7 49.9 2,482.4 64.0
486.9 31.9 754.2 43.5
61.5 49.9 73.6 64.3
1,671.4 26.6 1,630.1 58.5
2,634.9 47.2 2,928.1 53.0
1,389.4 54.2 1,932.0 65.9
11,604.1 38.9 14,897.0 53.1
8,900.4 44.9 9,454.2 46.8
20,504.5 41.3 24,351.2 50.4
2015%
2014%
2014DKK m
2015DKK m
20142015
SPAR NORD’S CREDIT RISK MITIGATION BY VIRTUE OF COLLATERAL
Properties
Custody accounts /securities
Guarantees /sureties
Vehicles
Cash
Other collateral
Other collateral, total
Spec. secured trans. (mortgage-credit inst. guarantees)
Total collateral accepted, excl. Spar Nord Leasing
Collateral accepted, Spar Nord Leasing
Total
13,779.5 11,376.7
5,043.5 1,475.5
370.7 294.6
708.8 718.6
511.1 629.8
3,690.0 2,670.8
24,103.6 17,166.0
3,785.9 5,706.0
27,889.5 22,872.0
1,218.0 1,102.6
29,107.5 23,974.6
Figure 6.28
Type of collateral DKK m
GEOGRAPHICAL BREAKDOWN OF MORTGAGES - END-2015
14.0 11.6
%
60
40
20
0
The Capital Region
Mid-Jutland Region
North Jutland Region
Region Zealand
Region South Denmark
9.2
Figure 6.24
20.3 42.0 2.9
Unallocated
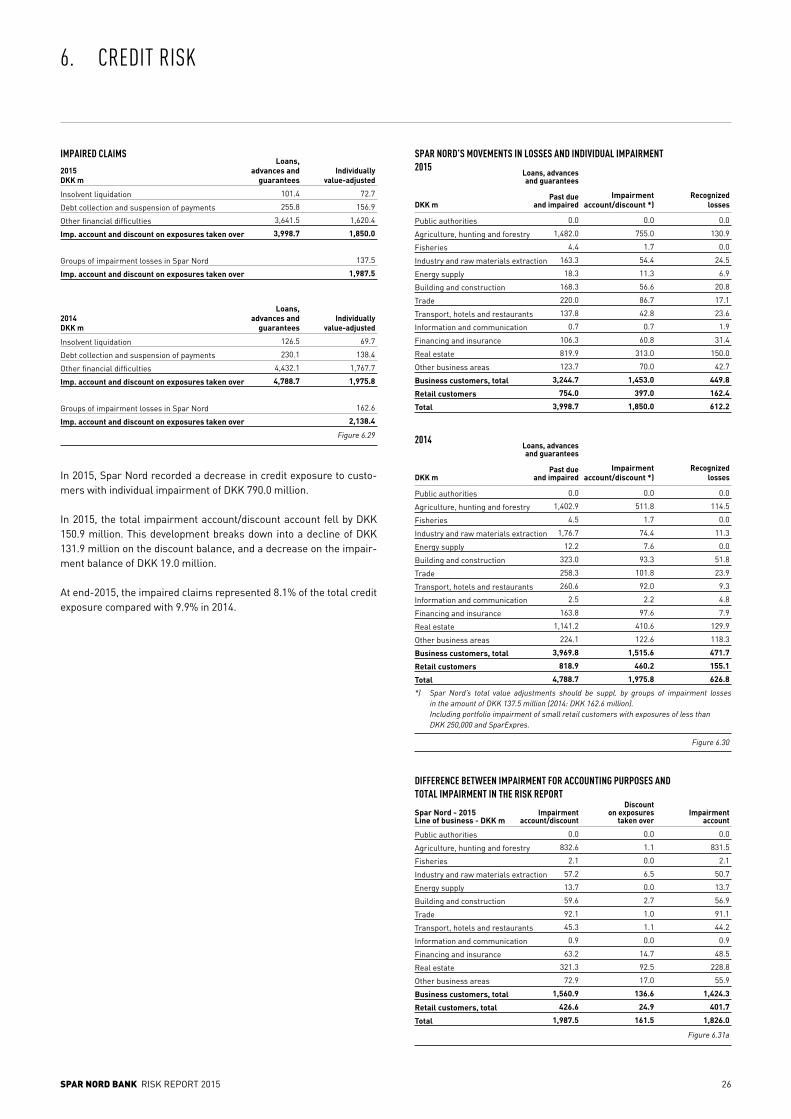
SPAR NORD BANK RISK REPORT 2015 26
6. CREDIT RISK
In 2015, Spar Nord recorded a decrease in credit exposure to custo-mers with individual impairment of DKK 790.0 million.
In 2015, the total impairment account/discount account fell by DKK 150.9 million. This development breaks down into a decline of DKK 131.9 million on the discount balance, and a decrease on the impair-ment balance of DKK 19.0 million.
At end-2015, the impaired claims represented 8.1% of the total credit exposure compared with 9.9% in 2014.
Figure 6.29
IMPAIRED CLAIMS
Insolvent liquidation
Debt collection and suspension of payments
Other financial difficulties
Imp. account and discount on exposures taken over
Groups of impairment losses in Spar Nord
Imp. account and discount on exposures taken over
Individuallyvalue-adjusted
101.4 72.7
255.8 156.9
3,641.5 1,620.4
3,998.7 1,850.0
137.5
1,987.5
Loans, advances and
guarantees2015DKK m
Insolvent liquidation
Debt collection and suspension of payments
Other financial difficulties
Imp. account and discount on exposures taken over
Groups of impairment losses in Spar Nord
Imp. account and discount on exposures taken over
Individuallyvalue-adjusted
126.5 69.7
230.1 138.4
4,432.1 1,767.7
4,788.7 1,975.8
162.6
2,138.4
Loans, advances and
guarantees2014DKK m
0.0 0.0 0.0
832.6 1.1 831.5
2.1 0.0 2.1
57.2 6.5 50.7
13.7 0.0 13.7
59.6 2.7 56.9
92.1 1.0 91.1
45.3 1.1 44.2
0.9 0.0 0.9
63.2 14.7 48.5
321.3 92.5 228.8
72.9 17.0 55.9
1,560.9 136.6 1,424.3
426.6 24.9 401.7
1,987.5 161.5 1,826.0
DIFFERENCE BETWEEN IMPAIRMENT FOR ACCOUNTING PURPOSES AND TOTAL IMPAIRMENT IN THE RISK REPORT
Public authorities
Agriculture, hunting and forestry
Fisheries
Industry and raw materials extraction
Energy supply
Building and construction
Trade
Transport, hotels and restaurants
Information and communication
Financing and insurance
Real estate
Other business areas
Business customers, total
Retail customers, total
Total
Spar Nord - 2015Line of business - DKK m
Impairment account/discount
Discounton exposures
taken overImpairment
account
Figure 6.31a
SPAR NORD’S MOVEMENTS IN LOSSES AND INDIVIDUAL IMPAIRMENT2015
Public authorities
Agriculture, hunting and forestry
Fisheries
Industry and raw materials extraction
Energy supply
Building and construction
Trade
Transport, hotels and restaurants
Information and communication
Financing and insurance
Real estate
Other business areas
Business customers, total
Retail customers
Total
Recognized losses
0.0 0.0 0.0
1,482.0 755.0 130.9
4.4 1.7 0.0
163.3 54.4 24.5
18.3 11.3 6.9
168.3 56.6 20.8
220.0 86.7 17.1
137.8 42.8 23.6
0.7 0.7 1.9
106.3 60.8 31.4
819.9 313.0 150.0
123.7 70.0 42.7
3,244.7 1,453.0 449.8
754.0 397.0 162.4
3,998.7 1,850.0 612.2
Impairment account/discount *)
Loans, advances and guarantees
Past due and impaired
DKK m
2014
Public authorities
Agriculture, hunting and forestry
Fisheries
Industry and raw materials extraction
Energy supply
Building and construction
Trade
Transport, hotels and restaurants
Information and communication
Financing and insurance
Real estate
Other business areas
Business customers, total
Retail customers
Total
Recognized losses
0.0 0.0 0.0
1,402.9 511.8 114.5
4.5 1.7 0.0
1,76.7 74.4 11.3
12.2 7.6 0.0
323.0 93.3 51.8
258.3 101.8 23.9
260.6 92.0 9.3
2.5 2.2 4.8
163.8 97.6 7.9
1,141.2 410.6 129.9
224.1 122.6 118.3
3,969.8 1,515.6 471.7
818.9 460.2 155.1
4,788.7 1,975.8 626.8
Impairment account/discount *)
Loans, advances and guarantees
Past due and impaired
Figure 6.30
DKK m
*) Spar Nord’s total value adjustments should be suppl. by groups of impairment losses in the amount of DKK 137.5 million (2014: DKK 162.6 million). Including portfolio impairment of small retail customers with exposures of less than DKK 250,000 and SparExpres.

SPAR NORD BANK RISK REPORT 2015 27
6. CREDIT RISK
Group impairment losses are recognized when objective evidence show that expected future losses exceed the loss anticipated when the loan was granted. Accordingly, in addition to objective evidence for a group, group impairment losses are basically recognized when customers are transferred to groups with a higher credit risk expo-sure.
Total group impairment losses of DKK 137.5 million break down into losses of DKK 29.5 million on retail customers and DKK 108.0 million on business customers, of which DKK 77.6 million is attributable to agricultural customers.
Spar Nord’s rating systems constitute the primary source of the breakdown into groups and the recognition of OEI by group.
Doubtful loans – loans for which interest accruals have been suspen-ded because full collection of the principal is unlikely or because no interest has been paid for an extensive period of time – are subject to special scrutiny, and if repayment is considered doubtful and loss unavoidable, the loan is categorized as partially or fully impaired and uncollectible. No interest is recognized on the part of exposures that has been written down for impairment.
Exposures for which interest accrual has been suspended dropped from DKK 522.5 million to DKK 514.2 million during the year.
ForbearanceA loan facility is defined as being subject to forbearance if the condi-tions regarding interest payments and/or repayments have been re-laxed on account of the borrower’s financial difficulties, or if the loan has been refinanced on more lenient terms.
At Spar Nord, forbearance is considered an objective evidence of im-pairment (OEI), and the terms are deemed to have been relaxed if business customers with OEI are granted an interest rate of less than 3%. For retail customers, the terms are considered to have been re-laxed if they are granted an interest rate of less than 3.5%. Moreover, repayment terms are considered to be relaxed for retail customers if the term to maturity exceeds 20 years. The terms of a home loan will typically have been fixed prior to any OEI and will therefore not be included for the purpose of identifying facilities with relaxed terms, regardless of whether the above criteria have been met.
Non-performing loans (NPL) are defined as the category of exposu-res that are in default (in terms of the Basel criteria) and/or impaired, i.e. exposures towards customers whose balances have been written off, written down or are overdue by 90 days.
The table below shows a breakdown of loans and advances for which the terms have been relaxed.
The impact on Spar Nord’s profits from impairment amounted to an expense of DKK 315.6 million in 2015, equal to 0.6% of total loans, advances and guarantees.
The impact on profits breaks down into DKK 43.2 million attributable to retail customers, equal to a profit impact ratio of 0.2%, and DKK 310.4 million in respect of agricultural customers, equal to a profit impact ratio of 9.0%. The profit impact attributable to business custo-mers, excluding the agricultural sector, amounted to DKK -38.0 mil-lion, equal to a profit impact ratio of -0.1%.
At end-2015, the impairment and discount account amounted to DKK 1,987.5 million, equal to 4.0% of loans, advances and guarantees, compared with 4.4% at end-2014.
Figure 6.33
SPAR NORD’S LOSSES AND IMPAIRMENT ON LOANS, ADVANCES AND GUARANTEES
Losses, incl. losses covered by provisions/impairment
and impairment losses taken over
Covered by provisions/impairment and impairment
losses taken over
Losses not covered by provisions/impairment
New provisions/impairment, excl. sector-wide solutions
Reversal of provisions/impairment
Interest on impaired loans and advances taken to income
Provisions/impairment, net
Recoveries of loans written off as uncollectible
Losses and provisions/impairment for the year
Other losses
Losses and provisions/impairment for the year, total
Total amount recognized in the income statement
Adjustment of discount on exposures
taken over from Sparbank
Impact on income statement
2014
614.2 625.7
-448.8 -443.4
165.4 182.3
655.2 785.6
-299.5 -211.8
-83.4 -92.2
272.3 481.6
-67.2 -66.2
370.5 597.7
2.9 5.2
373.4 602.9
373.4 602.9
57.8 109.8
315.6 493.1
2015 DKK m
0.0 0.0 0.0
614.6 3.8 610.8
1.7 0.0 1.7
78.3 14.3 64.0
11.5 0.0 11.5
94.6 3.5 91.1
111.2 3.2 108.0
95.1 12.9 82.2
2.3 0.0 2.3
98.4 18.9 79.5
416.9 116.9 300.0
125.2 46.0 79.2
1,649.8 219.5 1,430.3
488.6 73.9 414.7
2,138.4 293.4 1,845.0
DIFFERENCE BETWEEN IMPAIRMENT FOR ACCOUNTING PURPOSES AND TOTAL IMPAIRMENT IN THE RISK REPORT
Public authorities
Agriculture, hunting and forestry
Fisheries
Industry and raw materials extraction
Energy supply
Building and construction
Trade
Transport, hotels and restaurants
Information and communication
Financing and insurance
Real estate
Other business areas
Business customers, total
Retail customers, total
Total
Spar Nord - 2014Line of business - DKK m
Impairment account/discount
Discounton exposures
taken overImpairment
account
Figure 6.31b
LOANS AND ADVANCES SUBJECT TO FORBEARANCEDKK m
Non-performing
Performing
Total
Business Agricultural Retail customers customers customers Total
582.2 524.8 244.2 1351.2
123.2 26.6 22.8 172.6
705.4 551.4 267.0 1523.8
Figure 6.32
Figure 6.34
20142015 DKK m
SPAR NORD’S MOVEMENTS IN LOSSES AND VALUE ADJUSTMENTSAND NON-ACCRUAL LOANS
Loans, advances and guarantees, gross, year-end
Losses and impairment for the year, total
- in % of loans, advances and guarantees
Impairment account and discount on exposures
taken over
- in % of loans, advances and guarantees
Contractual non-accrual loans, year-end
- in % of loans, advances and guarantees
Impairment account and discount on exposures
taken over in % of non-accrual loans
49,612.0 48,325.8
315.6 493.1
0.6 1.0
1,987.5 2,138.4
4.0 4.4
514.2 522.5
1.0 1.1
386.5 409.3

SPAR NORD BANK RISK REPORT 2015 28
6.8.1 AGRICULTURE Loans, advances and guarantees to agricultural customers amount to DKK 3.5 billion, equal to 7.0% of Spar Nord’s total loans, advances and guarantees. Of this amount, leasing loans account for DKK 0.3 billion and guarantees for DKK 0.1 billion.
Total loans, advances and guarantees to agricultural customers fell by DKK 0.4 billion, or 10%, in 2015. Guarantees account for the largest decline of DKK 0.3 billion.
The figure below shows developments in credit quality among agri-cultural customers at Spar Nord’s Local Banks in the period from 2013 to 2015. In 2015, a new model for the rating of agricultural custo-mers was introduced.
The model was used for the entire period from 2013 to 2015.
As appears from the figures, the average credit quality deteriorated in 2014 and 2015.
The impact on profits from impairment of agricultural loans amounted to DKK 310.4 million in 2015 compared with DKK 238.3 million in 2014.
The impairment losses relate both to pig producers, who will be ad-versely impacted by the declining settlement prices propelled by the trade crisis between the EU and Russia, among other factors, and milk producers, who are also impacted by declining settlement pri-ces.
In concrete terms, a substantial share of Spar Nord’s agricultural ex-posures subject to OEI is expected to suffer a negative cash flow in 2016, and some customers are also expected to encounter difficulties paying off their loans.
Spar Nord’s total impairment of agricultural loans amounted to DKK 832.6 million at end-2015, equal to 24.1% of Spar Nord’s total loans, advances and guarantees to the industry.
The figures below show Spar Nord’s agricultural loans and impair-ment related to agricultural exposures, broken down by production lines.
Spar Nord pursues the principle that if agricultural customers fail to deliver positive returns at the breakeven prices fixed by Spar Nord of DKK 9.50/kg (without supplementary payment) for pork, and DKK 2.20/kg (without supplementary payment) for milk, this is defined as OEI. Breakeven prices are calculated based on financing at a 4% average interest rate for all the interest-bearing debt, regardless of the concrete financing chosen for a specific exposure. If realistic bud-gets cannot be drawn up on these conditions, the exposure will be subjected to an impairment calculation. Spar Nord anticipates that in 2016 the settlement prices for milk and pork will be on a par with the prices fetched in 2015.
Spar Nord’s calculation of collateral values of agricultural properties is in accordance with the Danish Financial Supervisory Authority’s most recent guidelines, i.e. that the land values in Spar Nord’s mar-ket area ranges between DKK 125,000 and DKK 160,000 per hectare.
Farm buildings are assessed in relation to their age, condition, etc. Farm buildings are measured at their fair value, which means that obsolete buildings are measured at DKK 0.
Other agricultural assets such as livestock, stocks, equipment, etc. are recognized at 80% of their carrying amount.
A 5% haircut is applied to all of the above-mentioned values.
6. CREDIT RISK
AGRICULTURAL EXPOSURE BY PRODUCTION LINE
Cattle producers
Pig producers
Plant cultivation
Mink farmers
Leasing
Other production lines
Total
Percent-age
impaired2015DKK m / %
379.0 139.9 33.3 55.3
358.9 131.5 39.8 59.7
58.2 38.9 11.0 48.8
8.5 5.0 9.2 34.1
5.3 -4.1 1.9 47.7
22.7 -0.8 4.4 57.8
832.6 310.4 24.1 56.2
Figure 6.38
Impairment ratio on
exposure
Impair-ment for the year
Impair-ment
balance
AGRICULTURAL EXPOSURE BY PRODUCTION LINE
Cattle producers
Pig producers
Plant cultivation
Mink farmers
Leasing
Other production lines
Total
Shareimpaired
2015DKK m
1.136,9 685,9 60,3
900,9 601,5 66,8
531,0 119,3 22,5
92,2 24,9 27,0
278,3 11,1 4,0
512,0 39,3 7,7
3.451,3 1.482,0 42,9
Figure 6.37
Of which impaired
Loans,advances and
guarantees
AVERAGE RISK LEVELAGRICULTURE *)
Average rating group
2015
5.8 6.0 6.6
20142013
Figure 6.36*) Excl. leasing (exposure after impairment)
Figure 6.35
AGRICULTURAL EXPOSURE BY RATING GROUP *)
%
40
30
20
10
0
2013 2014 2015
Notrated
Default98765431 2
*) Excl. leasing

SPAR NORD BANK RISK REPORT 2015 29
6. CREDIT RISK
6.9 CREDIT EXPOSURE TO FINANCIAL COUNTERPARTIES As part of its trading in and holding of securities, foreign currency and derivative instruments and its payment services, etc., Spar Nord will experience credit risk exposure to financial counterparties.
Spar Nord’s Management allocates lines for credit risk exposure to financial counterparties, based on the particular counterparty’s risk profile, rating, size and solvency. The risks and lines of financial in-struments are monitored on a day-to-day basis.
A major source of financial credit risk is Spar Nord’s balances with credit institutions. The credit risk relates to international credit insti-tutions, for which Spar Nord has provided cash collateral for finan-cial transactions, or Danish credit institutions with which Spar Nord’s Trading, Financial Markets & the International Division has customer relations.
90.9% of Spar Nord’s receivables from credit institutions concerns banks with an A rating or higher. Of the total exposures to credit insti-tutions in the amount of DKK 3.2 billion, 42.3% is attributable to ex-posures with an AAA rating. Balances with unrated credit institutions are attributable primarily to Danish credit institutions.
6.10 COUNTERPARTY RISK Counterparty risk is the risk of loss because a financial counterparty or an institutional customer defaults on its obligations under a finan-cial contract. In addition, settlement risks may arise when financial contracts are concluded and settled, as principals in various curren-cies are not necessarily exchanged at the same time or securities are not received simultaneously with the appropriate payment.
Utilization of lines with respect to financial contracts is calculated on a gross basis as weighted principals of all transactions concluded, to which is added the sum of all positive market values, whereas negati-ve market values are not offset. The size of principal weighting for the individual financial transactions is calculated based on the volatility of the interest rate and the currency, and due consideration is paid to the term to maturity of the specific financial transaction.
Spar Nord’s business procedures specify the maximum term to ma-turity for the individual financial transactions, and compliance is fol-lowed up on a daily basis, as is compliance with the authorized lines.
In connection with authorizing and coding lines, a check is performed to verify whether the coded lines accord with the authorization details, and Spar Nord additionally has a controller department that conducts random sampling of compliance as concerns authorization of lines, procedures and business procedures.
In regulatory terms, counterparty risk is calculated according to the market-value approach without netting. The difference between the value for accounting purposes and the regulatory value is attributable to the add-on of potential future credit exposure that is included in the regulatory calculation.
0.0 0.0 0.0 0.0 1,340.6 1,797.3 42.3 38.2 50.0 550.0 1.6 11.7 6.5 5.9 0.2 0.1 303.7 113.6 9.6 2.4 1,020.2 1,473.5 32.2 31.5 20.3 20.7 0.6 0.4 427.3 729.2 13.5 15.5 0.0 9.6 0.0 0.2 3,168.6 4,699.8 100.0 100.0
RECEIVABLES FROM CREDIT INSTITUTIONSBY PRODUCT TYPE
Certificates of deposit Reverse transactionsDeposits and unlisted bondsSubordinated loansCurrent accountsCSA accounts, etc.Commercial foreign businessMarket value, derivativesUndisclosed
Receivables from credit institutions
2014
Percentage breakdown
DKK m 20142015
Figure 6.39
Percentage breakdown
2015
1,340.6 1,797.3 42.3 38.3 628.7 691.7 19.9 14.7 909.4 1,806.7 28.7 38.4 173.8 221.0 5.5 4.7 1.5 1.4 0.0 0.0 0.0 0.0 0.0 0.0 0.0 0.0 0.0 0.0 0.0 0.0 0.0 0.0 0.0 0.0 0.0 0.0 114.2 166.8 3.6 3.6 0.4 14.9 0.0 0.3 3,168.6 4,699.8 100.0 100.0
RECEIVABLES FROM CREDIT INSTITUTIONSBY RATING
AAAAAABBBBBBCCCCCCUnratedUnallocated
Receivables from credit institutions
2014DKK m 20142015
Figure 6.40
Percentage breakdown
2015
Percentage breakdown
2014 1,423.6 2,005.3
387.9 555.3
1,035.7 1,450.0
0.0 33.0
1,035.7 1,417.0
2015
Figure 6.41
COUNTERPARTY RISK - ACCOUNTING EXPOSURE
Derivatives with positive market value
Netting
Exposure after netting
Collateral received
Exposure after netting and collateral
DKK m
COUNTERPARTY RISK - REGULATORY EXPOSURE
Retail
Corporates
Institutions
Regional or local authorities
High-risk exposures
Exp. in default
Total
2014
447.8 490.3
849.4 947.5
964.4 1,861.1
43.8 51.8
11.8 4.2
30.6 37.5
2,347.8 3,392.4
2015
Figure 6.42
DKK m

SPAR NORD BANK RISK REPORT 2015 30
6. CREDIT RISK
6.10.1 COUNTERPARTY RISK AGAINST CUSTOMERS Customers’ trading in financial instruments forms part of the autho-rization of credit for the individual customer. When agreements are concluded regarding financial contracts, such contracts will be mo-nitored on an ongoing basis by Spar Nord’s monitoring system. The credit responsibility for such transactions is decentralized in accord-ance with the credit authorization powers of the respective customer advisers. Such transactions are made at central level, and part of the follow-up/monitoring also takes place at central level. The utilization of the authorized financial lines is monitored on a day-to-day basis.
6.10.2 COUNTERPARTY RISK AGAINST FINANCIAL AND INSTITUTIONAL CUSTOMERS Before lines are granted to financial counterparties and institutional customers, a thorough credit assessment is made of the financial counterparties/institutional customers based on the financial state-ments of the individual credit institution/institutional customer. As concerns foreign and major Danish credit institutions, attention is also paid to how the credit institutions are rated by international ra-ting bureaus, such as Standard & Poor’s, Fitch or Moody’s.
6.10.3 FRAMEWORK AND COLLATERAL AGREEMENTS To mitigate counterparty risk, Spar Nord makes framework, netting and collateral agreements to the extent possible. As concerns small Danish credit institutions, such agreements will be based on the fra-mework agreement prepared by the Danish Bankers’ Association for forex and securities transactions, and when assessed to be neces-sary, also a collateral agreement, according to which it is agreed that if the net market value of the concluded financial contracts exceeds an individually fixed maximum for each credit institution, appropriate collateral must be furnished, in most cases by way of cash deposits.
For foreign and large Danish credit institutions and institutional customers, netting and framework agreements will be based on the international ISDA Master Agreements, often with associated agre-ements, viz. Credit Support Annexes (CSA), according to which it is agreed that if the net market value of the concluded financial con-tracts exceeds an individually fixed maximum for each agreement, then collateral will have to be exchanged, most frequently by way of cash deposits in EUR or DKK.
In addition, when deemed appropriate, Global Master Repurchase Ag-reements (GMRA) and Global Master Securities Lending Agreements (GMSLA) will be concluded to secure repo/reverse transactions and share loan transactions.
Both Danish and foreign collateral agreements are followed up on a daily basis, as are exchanges of collateral in step with fluctuations in the market values of the transactions concluded. In addition, to the widest extent possible Spar Nord settles transactions via CLS, VP or Euroclear, which serves to minimize settlement risks as much as pos-sible.
Spar Nord Bank is an indirect member of London Clearing House via selected clearing brokers, and expects to regularly clear a large share of the clearing-approved transactions.
6.11 ECAISpar Nord has appointed Standard & Poor’s Ratings Services as the supplier of credit rating information for countries, counterparties and issuances.
Rating information is used as an integral part of the dataflow at Skandinavisk Data Center (SDC), which receives external credit ra-tings from Standard & Poor’s Ratings Services via SIX Financial. An IT update of credit rating from Standard & Poor’s Ratings Services is undertaken on an ongoing basis.
The conversion of credit rating classes to credit quality steps is based on the conversion table issued by the Committee of European Banking Supervisors (CEBS). The individual credit quality steps are associated with the weighting to be used for the exposures on the individual credit quality steps when calculating the total risk exposure according to the standard approach for credit risks pursuant to Articles 111-134 of the CRR.
The table below shows the mapping used by Standard & Poor’s Ra-tings Services for credit quality steps.
The value of the exposures before and after weighting with credit qua-lity steps, see the tables above.
1
2
3
4
5
6
Central gov.
%Credit quality steps
AAA to AA- 20 20 0
A+ to A- 50 50 20
BBB+ to BBB- 50 100 50
BB+ to BB- 100 100 100
B+ to B- 100 150 100
CCC+ under 150 150 100
Institu-tions
%
*) Credit Classes (Long-term) Figure 6.43
Business and CIU
%S&P’s *)
1
2
3
4
Business%Credit quality steps
A-1+ to A-1 20 20
A-2 50 50
A-3 100 100
Under A-3 100 150
**) Credit Classes (Short-term) Figure 6.44
Institutions%S&P’s **)
ECAI EXPOSURE BEFORE DEDUCTIONS
Institutions
Exp. with short-term rating
Exp. in units or CIU
Other exposures
Total
Exposure after ECAI
risk weightingDKK m
1,895.4 710.0
0.0 0.0
4.2 6.3
0.0 0.0
1,899.6 716.3
Exposure
Figure 6.45
ECAI EXPOSURE AFTER DEDUCTIONS
Institutions
Exp. with short-term rating
Exp. in units or CIU
Other exposures
Total
Exposure after ECAI
risk weightingDKK m
1,895.4 710.0
0.0 0.0
2.7 4.0
0.0 0.0
1,898.1 713.9
Exposure
Figure 6.46
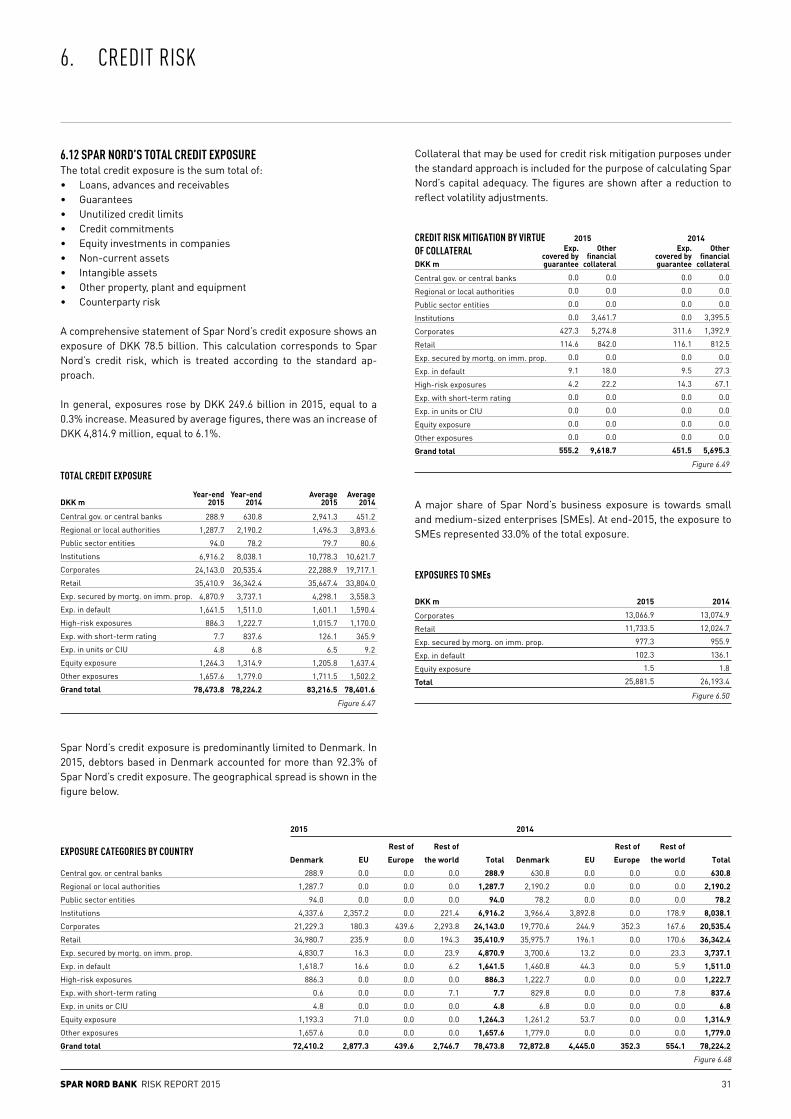
SPAR NORD BANK RISK REPORT 2015 31
6. CREDIT RISK
6.12 SPAR NORD’S TOTAL CREDIT EXPOSURE The total credit exposure is the sum total of:• Loans, advances and receivables• Guarantees• Unutilized credit limits• Credit commitments• Equity investments in companies• Non-current assets• Intangible assets• Other property, plant and equipment• Counterparty risk
A comprehensive statement of Spar Nord’s credit exposure shows an exposure of DKK 78.5 billion. This calculation corresponds to Spar Nord’s credit risk, which is treated according to the standard ap-proach.
In general, exposures rose by DKK 249.6 billion in 2015, equal to a 0.3% increase. Measured by average figures, there was an increase of DKK 4,814.9 million, equal to 6.1%.
Spar Nord’s credit exposure is predominantly limited to Denmark. In 2015, debtors based in Denmark accounted for more than 92.3% of Spar Nord’s credit exposure. The geographical spread is shown in the figure below.
Collateral that may be used for credit risk mitigation purposes under the standard approach is included for the purpose of calculating Spar Nord’s capital adequacy. The figures are shown after a reduction to reflect volatility adjustments.
A major share of Spar Nord’s business exposure is towards small and medium-sized enterprises (SMEs). At end-2015, the exposure to SMEs represented 33.0% of the total exposure.
TOTAL CREDIT EXPOSURE
Central gov. or central banks
Regional or local authorities
Public sector entities
Institutions
Corporates
Retail
Exp. secured by mortg. on imm. prop.
Exp. in default
High-risk exposures
Exp. with short-term rating
Exp. in units or CIU
Equity exposure
Other exposures
Grand total
Average 2014
Average 2015DKK m
288.9 630.8 2,941.3 451.2
1,287.7 2,190.2 1,496.3 3,893.6
94.0 78.2 79.7 80.6
6,916.2 8,038.1 10,778.3 10,621.7
24,143.0 20,535.4 22,288.9 19,717.1
35,410.9 36,342.4 35,667.4 33,804.0
4,870.9 3,737.1 4,298.1 3,558.3
1,641.5 1,511.0 1,601.1 1,590.4
886.3 1,222.7 1,015.7 1,170.0
7.7 837.6 126.1 365.9
4.8 6.8 6.5 9.2
1,264.3 1,314.9 1,205.8 1,637.4
1,657.6 1,779.0 1,711.5 1,502.2
78,473.8 78,224.2 83,216.5 78,401.6
Year-end2014
Year-end2015
Figure 6.47
EXPOSURES TO SMEs
Corporates
Retail
Exp. secured by morg. on imm. prop.
Exp. in default
Equity exposure
Total
2014DKK m
13,066.9 13,074.9
11,733.5 12,024.7
977.3 955.9
102.3 136.1
1.5 1.8
25,881.5 26,193.4
2015
Figure 6.50
CREDIT RISK MITIGATION BY VIRTUE OF COLLATERAL
Central gov. or central banks
Regional or local authorities
Public sector entities
Institutions
Corporates
Retail
Exp. secured by mortg. on imm. prop.
Exp. in default
High-risk exposures
Exp. with short-term rating
Exp. in units or CIU
Equity exposure
Other exposures
Grand total
Other financial
collateral
Exp. covered by guaranteeDKK m
0.0 0.0 0.0 0.0
0.0 0.0 0.0 0.0
0.0 0.0 0.0 0.0
0.0 3,461.7 0.0 3,395.5
427.3 5,274.8 311.6 1,392.9
114.6 842.0 116.1 812.5
0.0 0.0 0.0 0.0
9.1 18.0 9.5 27.3
4.2 22.2 14.3 67.1
0.0 0.0 0.0 0.0
0.0 0.0 0.0 0.0
0.0 0.0 0.0 0.0
0.0 0.0 0.0 0.0
555.2 9,618.7 451.5 5,695.3
Other financial
collateral
Exp. covered by guarantee
Figure 6.49
2015 2014
EXPOSURE CATEGORIES BY COUNTRY
Central gov. or central banks
Regional or local authorities
Public sector entities
Institutions
Corporates
Retail
Exp. secured by mortg. on imm. prop.
Exp. in default
High-risk exposures
Exp. with short-term rating
Exp. in units or CIU
Equity exposure
Other exposures
Grand total
Rest of Rest of Rest of Rest of
Denmark EU Europe the world Total Denmark EU Europe the world Total
288.9 0.0 0.0 0.0 288.9 630.8 0.0 0.0 0.0 630.8
1,287.7 0.0 0.0 0.0 1,287.7 2,190.2 0.0 0.0 0.0 2,190.2
94.0 0.0 0.0 0.0 94.0 78.2 0.0 0.0 0.0 78.2
4,337.6 2,357.2 0.0 221.4 6,916.2 3,966.4 3,892.8 0.0 178.9 8,038.1
21,229.3 180.3 439.6 2,293.8 24,143.0 19,770.6 244.9 352.3 167.6 20,535.4
34,980.7 235.9 0.0 194.3 35,410.9 35,975.7 196.1 0.0 170.6 36,342.4
4,830.7 16.3 0.0 23.9 4,870.9 3,700.6 13.2 0.0 23.3 3,737.1
1,618.7 16.6 0.0 6.2 1,641.5 1,460.8 44.3 0.0 5.9 1,511.0
886.3 0.0 0.0 0.0 886.3 1,222.7 0.0 0.0 0.0 1,222.7
0.6 0.0 0.0 7.1 7.7 829.8 0.0 0.0 7.8 837.6
4.8 0.0 0.0 0.0 4.8 6.8 0.0 0.0 0.0 6.8
1,193.3 71.0 0.0 0.0 1,264.3 1,261.2 53.7 0.0 0.0 1,314.9
1,657.6 0.0 0.0 0.0 1,657.6 1,779.0 0.0 0.0 0.0 1,779.0
72,410.2 2,877.3 439.6 2,746.7 78,473.8 72,872.8 4,445.0 352.3 554.1 78,224.2
2015 2014
Figure 6.48

SPAR NORD BANK RISK REPORT 2015 32
7. MARKET RISK
Market risk is an umbrella heading for the risk of loss caused by fluctuations in exchange rates or prices for financial instruments.
Market risks can be broken down into:• Interest-rate risk• Foreign-exchange risk• Equity risk• Commodity risk• Option risk• Risks relating to own properties
Spar Nord deals and takes positions in products that hold a num-ber of market-based risks. Most of Spar Nord’s activities regarding trading and position-taking comprise relatively simple products, of which interest-based products are the most traded ones. Spar Nord also deals and takes positions in listed shares and foreign-exchange instruments, whereas trading in commodities is very limited.
7.1 MARKET RISK POLICY As discussed in section 3. Risk management, Spar Nord’s Board of Directors determines the overarching policies, frameworks and principles for risk governance. Some of the policies are concerned with identifying and estimating various types of market risk. The frameworks support the general proclivity to assume risks and indicate specific limits on the extent of risk Spar Nord is ready to assume. The principles establish the methods to be used in cal-culating the various risk targets. The Board of Directors receives continuous reporting on risk developments and the utilization of al-located risk limits.
For its management of market risks, Spar Nord has established a three-tier instruction hierarchy. At the first tier-level, the Board of Directors defines the limits for Spar Nord, which delegates tasks and powers to the Executive Board. At the second tier-level, the Ex-ecutive Board delegates limits to the other entities of Spar Nord, with the Trading, Financial Markets & the International Division be-ing the distinctly largest entity. At the third and last tier, the execu-tives of Trading, Financial Markets & the International Division are granted the limits within which they may operate.
7.2 MANAGEMENT, MONITORING AND REPORTING The Finance & Accounts Department is responsible for estimating, monitoring, controlling and reporting market risks. Market risk is calculated for the following purposes:
• Daily follow-up on individual business units• Regular reporting to the Executive Board and the Board of Directors• Reporting of regulatory capital
Market risks are controlled and monitored through an integrated risk management system, with day-to-day follow-up action taken with respect to all market risk categories for all units subject to in-structions, and any failure to comply with instructions is reported upstream in the hierarchy.
7.3 DEVELOPMENTS IN 2015 The net portfolio of bonds was reduced by DKK 2.1 billion in 2015. The reduction of bonds with financial issuers and the increase of government bonds stem from changes in asset distribution as a re-sult of LCR. In addition, the portfolio on mortgage-credit bonds was reduced as a result of market transactions relating to anticipated market return.
Shares outside the trading portfolio were reduced by DKK 639.8 mil-lion in 2015, which relates to the sale of the shareholding in Nør-resundby Bank.
In 2015, the net interest-rate risk was largely positive with an av-erage of around DKK 60-70 million. Compared with end-2014, the net interest-rate risk increased from DKK 40.1 million to DKK 109.1 million at end-2015, which was primarily caused by an increase of the net interest-rate risk in the trading portfolio. The interest-rate risk outside the trading portfolio remained at a comparatively stable level in 2015.
In addition, there was slight decrease in the foreign-exchange risk in 2015 compared with 2014.
7.4 INTEREST-RATE RISK The interest-rate risk is the risk of loss due to fluctuating interest rates. The majority of Spar Nord’s interest-rate risks derive from activities involving ordinary banking transactions, such as deposits and lending, as well as trading and position-taking in interest-re-lated products. Most of these activities incorporate simple interest-rate products such as interest swaps, bonds, futures and standard interest-rate options.
Spar Nord’s interest-rate risk both inside and outside the trading portfolio is calculated on the basis of the target duration and agreed cash flow. For managing Spar Nord’s portfolio of convertible Dan-ish mortgage-credit bonds, Spar Nord uses model-based key risk indicators that provide for the inherent option element. As concerns interest-rate options, the above-mentioned key indicators are sup-plemented by the most important risk factors expressing sensitivity of the option premium upon changes in the underlying parameters.
The interest-rate risk is assessed on a daily basis and decisions are made in light of expectations for the macroeconomic situation and market developments. Spar Nord converts the interest-rate risk in foreign currencies into Danish kroner and offsets the negative inter-est-rate risk against the positive one to calculate the net interest-rate risk.

SPAR NORD BANK RISK REPORT 2015 33
7. MARKET RISK
7.4.1 DEVELOPMENTS IN INTEREST-RATE RISK The figure below shows the total net interest-rate risk that Spar Nord will encounter if the interest rate rises 1 percentage point. This means that all yield curves are displaced parallel to each other.
In general terms, the net interest-rate risk was positive through-out most of 2015, which means that Spar Nord was exposed to an interest-rate drop in the market.
The figure below shows the impact of Spar Nord’s interest-rate risk on the shareholders’ equity in per cent when the yield curves are displaced upwards in parallel by 1 percentage point. A positive in-terest-rate risk will have a negative impact on shareholders’ equity.
In addition, Spar Nord calculates the interest-rate risk relative to duration and currency. This shows the risk of changes in a delimited time interval in the yield curve. The table below shows the interest-rate risk broken down on the individual time intervals, given an in-crease in the interest rate of 1 percentage point.
As appears from the table, at end-2015 Spar Nord was primarily ex-posed to interest-rate risks in DKK.
7.4.2 INTEREST-RATE RISK IN THE TRADING PORTFOLIO The interest-rate risk attaching to positions in the trading portfolio derives primarily from bonds, swaps and futures.
As appears from figure 7.4, the interest-rate risk attaching to the trading portfolio amounted to DKK 125.4 million at end-2015, up DKK 75.5 million on end-2014.
INTEREST-RATE RISK BY TERM TO MATURITY AND CURRENCY
DKK
EUR
USD
GBP
NOK
CHF
JPY
SEK
Other
Total
DKK
EUR
USD
GBP
NOK
CHF
JPY
SEK
Other
Total
Total
7.0 21.2 5.5 19.0 46.8 99.5
0.6 6.1 -6.7 -5.0 10.5 5.5
-0.2 -1.0 0.1 4.1 0.6 3.6
0.0 0.1 0.1 0.3 0.0 0.5
-0.1 0.0 0.0 0.1 0.0 0.0
0.1 -0.4 -0.3 0.0 0.0 -0.6
0.0 0.0 0.0 0.0 0.0 0.0
0.3 -0.1 0.7 -0.3 0.0 0.6
0.0 0.0 0.0 0.0 0.0 0.0
7.7 25.9 -0.6 18.2 57.9 109.1
1 year- 3 years
3 years- 7 years
Over7 years
3 mths- 1 year
Less than3 mths
10.2 11.1 14.9 14.0 -34.4 15.8
-1.0 1.4 -5.3 14.3 11.7 21.1
2.6 -0.5 0.5 0.6 0.7 3.9
0.0 0.0 0.1 0.5 0.0 0.6
-0.3 -0.1 0.0 0.0 0.1 -0.3
-1.2 0.2 -3.9 3.3 0.0 -1.6
0.0 -0.2 -0.3 0.0 -0.1 -0.6
0.0 0.1 0.6 0.6 0.0 1.3
0.0 -0.1 0.0 0.0 0.0 -0.1
10.3 11.9 6.6 33.3 -22.0 40.1
Figure 7.3
2015Currency, DKK m
2014Currency, DKK m Total
1 year- 3 years
3 years- 7 years
Over7 years
3 mths- 1 year
Less than3 mths
Total
11.3 28.5 17.4 15.1 41.8 114.1
1.5 6.0 -6.7 -5.2 10.5 6.1
-0.3 0.1 0.3 4.1 0.6 4.8
0.2 -0.3 0.5 0.0 0.0 0.4
12.7 34.3 11.5 14.0 52.9 125.4
1 year- 3 years
3 years- 7 years
Over7 years
3 mths- 1 year
Less than3 mths
19.4 30.0 28.6 0.5 -50.3 28.2
-1.7 1.3 -5.5 13.8 11.9 19.8
1.9 -0.5 0.5 0.6 0.6 3.1
-2.1 -0.1 -3.5 4.5 0.0 -1.2
17.5 30.7 20.1 19.4 -37.8 49.9
INTEREST-RATE RISK IN THE TRADING PORTFOLIO
DKK
EUR
USD
Other
Total
DKK
EUR
USD
Other
Total
Figure 7.4
2015Currency, DKK m
2014Currency, DKK m Total
1 year- 3 years
3 years- 7 years
Over7 years
3 mths- 1 year
Less than3 mths
IMPACT OF THE INTEREST-RATE RISK ON SHAREHOLDERS’ EQUITY EXCL. ADDITIONAL TIER 1 CAPITAL%
3.0
2.0
1.0
0
-1.0
-2.0
-3.031.12.13 31.12.15
Figure 7.2
31.12.14
DEVELOPMENT IN SPAR NORD’S NET INTEREST-RATE RISK
DKK m
150
100
50
0
-50
-100
-15031.12.13 31.12.15
Figure 7.1
31.12.14

SPAR NORD BANK RISK REPORT 2015 34
7.4.3 INTEREST-RATE RISK OUTSIDE THE TRADING PORTFOLIO The interest-rate risk attaching to positions outside the trading portfolio derives primarily from fixed-interest deposits and lending from ordinary banking transactions and interest-rate risk related to Spar Nord’s funding, incl. subordinated debt.
The table shows the net interest-rate risk outside the trading port-folio, given an increase in the interest rate of 1 percentage point broken down by term to maturity and currency. From end-2014, to end-2015, the interest-rate risk changed from DKK -9.8 million to DKK -16.3 million.
7.4.4 BOND PORTFOLIO Spar Nord’s bond portfolio is composed of 86.0% mortgage-credit bonds, 10.2% bonds from financial issuers, 1.8% from other issuers and 2.0% government bonds.
The overall reduction in the bond portfolio of DKK 2.1 billion resulted from mortgage-credit bonds worth a total of DKK 1.7 billion being sold, while bonds from financial issuers dropped by DKK 0.8 billion and government bonds increased by a total of DKK 0.4 billion.
At end-2015, 89.0% of the Spar Nord’s bond portfolio had an AA rating or better.
7. MARKET RISK
INTEREST-RATE RISK OUTSIDE THE TRADING PORTFOLIO
DKK
EUR
Other
Total
DKK
EUR
Other
Total
Total
-4.3 -7.3 -11.8 3.9 5.0 -14.5
-0.9 0.0 0.1 0.3 0.0 -0.5
0.1 -1.1 -0.3 0.0 0.0 -1.3
-5.1 -8.4 -12.0 4.2 5.0 -16.3
1 year- 3 years
3 years- 7 years
Over7 years
3 mths- 1 year
Less than3 mths
-9.2 -18.9 -13.6 13.5 15.8 -12.4
0.7 0.0 0.1 0.4 0.1 1.3
1.3 0.0 0.0 0.0 0.0 1.3
-7.2 -18.9 -13.5 13.9 15.9 -9.8
Figure 7.5
2015Currency, DKK m
2014Currency, DKK m Total
1 year- 3 years
3 years- 7 years
Over7 years
3 mths- 1 year
Less than3 mths
BOND PORTFOLIO BY ISSUER TYPE *)
Mortgage-credit bonds
Financial issuers
Other issuers
Government bonds
Bonds
*) The bond portfolio plus spot and forward transactions (purchase + sale)
14,319.4 15,981.6 86.0 85.3
1,700.0 2,538.2 10.2 13.5
303.1 291.2 1.8 1.6
328.3 -70.0 2.0 -0.4
16,650.8 18,741.0 100.0 100.0
2014
Percentagebreakdown
DKK m 20142015
Figure 7.6
2015
DKK m
14,502.9 15,474.1 87.1 82.6
316.1 464.1 1.9 2.5
624.9 1,472.2 3.7 7.9
1,017.0 1,132.7 6.1 6.0
60.3 75.3 0.4 0.4
16.9 26.8 0.1 0.1
0.8 0.7 0.0 0.0
0.0 0.0 0.0 0.0
0.0 0.0 0.0 0.0
111.9 95.1 0.7 0.5
0.0 0.0 0.0 0.0
16,650.8 18,741.0 100.0 100.0
BOND PORTFOLIO BY RATING *)
AAA
AA
A
BBB
BB
B
CCC
CC
C
Unrated
Unallocated
Bonds
2014
Percentagebreakdown
20142015
*) The bond portfolio plus spot and forward transactions (purchase + sale) Figure 7.7
2015
BREAKDOWN OF BONDS
Mortgage-credit bonds
Financial issuers
Other issuers
Government bonds
Grand total
Own bonds
%2015DKK m
Denmark AAA 14,134.5 84.9
BBB 175.7 1.0
Unrated 9.2 0.1
14,319.4 86.0
Denmark AAA-A 835.6 5.0
BBB 728.8 4.4
Sweden AA-BBB 13.1 0.1
Norway AA-BB 7.5 0.0
Finland A 86.0 0.5
Luxembourg AAA 26.2 0.2
Germany AAA 2.3 0.0
Others AA-Unrated 0.5 0.0
1,700.0 10.2
Denmark BBB-Unrated 114.9 0.7
Others AAA-Unrated 188.2 1.1
303.1 1.8
Denmark AAA-AA 328.1 2.0
Europe AAA 0.2 0.0
328.3 2.0
16,650.8 100.0
Denmark Unrated 14.6
Ratingcategory
Origin/underlying Amount
Mortgage-credit bonds
Financial issuers
Other issuers
Government bonds
Grand total
Own bonds
%2014DKK m
Denmark AAA 15,171.2 81.0
BBB 31.2 0.2
Unrated 3.7 0.0
Sweden AAA-AA 775.5 4.1
15,981.6 85.3
Denmark AAA-A 1,295.3 6.9
BBB 1,008.3 5.4
Sweden AA-BBB 38.8 0.2
Norway AA-BB 100.8 0.5
Finland AA-A 86.5 0.5
Netherlands AA 0.2 0.0
UK A 7.9 0.0
Other AAA-AA 0.4 0.0
2,538.2 13.5
Denmark BBB-Unrated 89.3 0.5
Others AAA-Unrated 201.9 1.1
291.2 1.6
Denmark AAA-AA -70.8 -0.4
Europe AAA 0.8 0.0
-70.0 -0.4
18,741.0 100.0
Denmark Unrated 6.8
Ratingcategory
Origin/underlying Amount
Figure 7.8

SPAR NORD BANK RISK REPORT 2015 35
7. MARKET RISK
7.5 FOREIGN-EXCHANGE RISK The foreign-exchange risk is the risk of loss on positions in curren-cies due to exchange-rate fluctuations. Foreign-exchange options are included in the calculation of the Delta-adjusted position.
The foreign-exchange risk is illustrated by the table below. The cal-culation is based on the assumption that all exchange rates develop unfavourably for Spar Nord by 2%.
As appears from figure 7.9, the foreign-exchange risk was reduced by DKK 3.4 million compared with end-2014, thus amounting to DKK -6.2 million at end-2015. The change was primarily caused by changes in the EUR position.
7.6 EQUITY RISK The equity risk is the risk of loss due to fluctuating equity prices. Equity positions are calculated as the net value of long and short equity positions and equity-related instruments.
The calculation of equity positions is broken down by positions in the trading portfolio and outside the trading portfolio.
7.6.1 SHARES IN THE TRADING PORTFOLIO The shares and equities in the trading portfolio have been acquired with a view to trading.
It appears from the figure below that the holding of shares in the trading portfolio increased from DKK 119.9 million at end-2014 to DKK 142.3 million at end-2015.
7.6.2 SHARES OUTSIDE THE TRADING PORTFOLIO A salient feature of equities and shares outside the trading portfolio is that they have not been acquired with a view to trading. In addi-tion, Spar Nord makes a distinction between shares and equities in associates and equity investments in strategic partners.
Shares in strategic partners in the financial sector are shares in companies whose purpose is to support financial institutions’ trans-actions in the fields of mortgage credit, payment services, unit trusts, etc. Participation in the companies in question is considered a prerequisite for Spar Nord’s operations.
In several of the sector companies, the shares are reallocated such that the ownership interest of the banks will reflect the business volume of the relevant institution with the sector company.
Typically, this reallocation is made based on the net asset value of the sector company in question. In light of this, Spar Nord adjusts the recognized value of these shares when new information is avail-able that warrants a change of valuation at fair value. In other sector companies, the shares are not reallocated, but are measured based on a fair value corresponding to the net asset value or another rec-ognized valuation method (such as discounting of cash flows). The adjustments to the values of the shares in these companies are also recognized in the income statement.
Shares in associates dropped substantially in 2015 as a result of Spar Nord’s sale of its shareholding in Nørresundby Bank.
The total holding of shares outside the trading portfolio dropped by DKK 639.8 million to DKK 1,598.4 million at end-2015.
7.7 COMMODITY RISK Spar Nord only accepts commodity risks to a very limited extent. The commodity exposure is calculated as a gross exposure, with setoffs only being made with respect to contracts having the same underly-ing commodity, the same maturity date, etc.
Figure 7.9
FOREIGN-EXCHANGE RISK
DKK m
EUR
SEK
USD
GBP
CHF
NOK
JPY
Other currencies
Foreign-exchange risk, total
2014
-2.3 -5.8
-0.5 -0.8
-1.9 -1.9
-0.5 -0.1
-0.2 -0.1
-0.3 -0.1
-0.2 -0.7
-0.3 -0.1
-6.2 -9.6
2015
The foreign-exchange risk is illustrated in a scenario where all exchange rates move unfavourably for Spar Nord by 2%.
EQUITY RISK IN THE TRADING PORTFOLIO
Listed shares in the trading portfolio
Unlisted shares in the trading portfolio
Total shares in the trading portfolio
2014
131.8 106.7
10.5 13.2
142.3 119.9
2015
Figure 7.10
DKK m
EQUITY RISK OUTSIDE THE TRADING PORTFOLIO
Shares in credit and financing inst itutions
Shares in unit trust man. companies
Shares in pension institutions
Shares in data supplier
Shares in payment services business
Other shares
Shares in strategic partners, total
Realized gains *)
Unrealized gains
Total associates
Shares outside the trading portfolio, total
2014
1,109.2 890.3
82.1 81.4
2.1 2.2
233.9 226.9
5.1 5.1
83.6 91.0
1,516.0 1,296.9
245.8 182.1
69.3 52.6
82.4 941.3
1,598.4 2,238.2
2015
Figure 7.11
DKK m
*) Of which the gain on the sale of the shareholding in Nørresundby Bank in 2015 represents DKK 225.6 million, which is recognized under market-value adjustments. In 2014, the gain on the sale of the shareholding in Nets amounted to DKK 178.0 million.

SPAR NORD BANK RISK REPORT 2015 36
7. MARKET RISK
7.8 OPTION RISK Spar Nord uses derivates to hedge and manage Spar Nord’s risks. These include options and products that contain an integral option. Spar Nord’s option risks stem primarily from interest and currency options and positions in convertible mortgage-credit bonds.
Option risks are calculated by computing the positions’ Delta, Gam-ma, Vega and Theta risks.
7.9 SENSITIVITY ANALYSIS The figure below shows how Spar Nord’s income statement will be impacted if the interest rate changes, if share prices drop or if all exchange rates move adversely.
It appears from the table that the shareholders’ equity will decrease 1.3% if the interest rate rises by 1 percentage point. In addition, it can be seen that a 10% drop in share prices will result in a 0.1% loss of shareholders’ equity. Lastly, it can be seen that the share-holders’ equity will be reduced by 0.1% if foreign-exchange rates shift adversely by 2%. It is an assumption that the portfolios remain unchanged.
7.10 SPAR NORD’S OWN PROPERTIES Properties are recognized at cost upon acquisition and subsequently measured at fair value. The fair value is calculated on the basis of current market data according to an asset return model that in-cludes the property’s rental income, operating expenses, as well as management and maintenance.
Operating expenses and maintenance costs are calculated on the basis of the condition of the individual property, construction year, materials used, etc. The fair value of the property is determined based on the calculated return on its operation and the individually determined rate of return. The rate of return is fixed on the basis of the location of the individual property, potential use, the state of maintenance, etc.
The fair value of the individual property is reassessed at least once a year based on the current letting market and the interest level. An external valuation is obtained from a real estate agent to support the calculation of fair value, including the rental rates and rates of return used.
In 2015, positive value adjustments totalling DKK 6.9 million were made on corporate properties, such adjustments being recognized directly in shareholders’ equity under other comprehensive income. Impairment losses totalling DKK 3.5 million (net) have been re-versed and recognized under depreciation, amortization and impair-ment in the income statement. Reference is made to Spar Nord’s Annual Report for a more detailed description of the accounting treatment of properties.
The figure below shows the rates of return on Spar Nord’s proper-ties in per cent.
The most important assumptions when calculating the fair value of investment and corporate properties are the required rate of return and rental level.
Everything else being equal, an increase of the required rate of re-turn of 0.5 percentage point will reduce the fair value by DKK 45.4 million (2014: DKK 44.9 million).
Everything else being equal, a reduction of the rental level by 5% will reduce the fair value by DKK 30.8 million (2014: DKK 30.1 million).
Impact on equity
-1.3 -0.5 -95.9 -37.7
1.3 0.5 95.9 37.7
-0.1 -0.1 -10.9 -9.1
-0.1 -0.1 -4.7 -7.2
SENSITIVITY ANALYSIS *)
Interest increase of 1 percentage point
Interest decrease of 1 percentage point
Share price decrease of 10%
Exchange-rate fluctuation of 2%
in unfavourable direction
*) The sensitivity information shows the impact of isolated changes in interest rates and prices of shares in the trading portfolio, while the impact of changes in exchange rates is shown for positions both in and outside the trading portfolio. The impact on the operating profit and the impact on shareholders’ equity have been calculated after tax.
Impact on operating profit
2014DKK m
2015DKK m
2014%
2015%
Figure 7.12
YIELD/RETURN
5.75-7%
7-8%
8-9%
9-14.5%
Grand total
Year-endvalue
12 239.0 12 232.4
18 292.2 18 292.4
18 157.0 17 156.5
5 3.4 5 3.7
53 691.6 52 685.0
No. of properties
Figure 7.13
Year-endvalue
No. of properties
2015 2014
SPAR NORD BANK RISK REPORT 2015 37
8. OPERATIONAL RISK
8. OPERATIONAL RISK Operational risk is understood as the risk of loss that results from inefficient or deficient internal procedures, from human or systemic errors or from external events, including legal risks.
All activities in the organization are subject to operational risks.
8.1 OPERATIONAL RISK POLICY Spar Nord’s Board of Directors has introduced a policy for opera-tional risk, the aim of which is to provide an overview of Spar Nord’s operational risks, minimize the number of errors and thus reduce Spar Nord’s losses incurred from operational errors.
8.2 MANAGEMENT, MONITORING AND REPORTING Operational risk is managed across Spar Nord through a compre-hensive system of business procedures and control measures de-veloped to ensure an optimum process environment. Efforts to mi-nimize operational risks include separating the execution and the control of activities.
Responsibility for dealing with risks lies with the unit responsible for the relevant business activities, the risk owners.
Throughout Spar Nord, events that result in a loss of more than DKK 10,000 are recorded and categorized, and identified risks are recor-ded on an ongoing basis, followed up by reporting to the Risk Review Officer, the Executive Board and the Board of Directors.
The Legal Department is charged with handling operational risks, a responsibility that includes the role as risk facilitator.
8.3 FRAUD In view of the regular reporting provided to Spar Nord’s Board of Directors and Executive Board, it is Management’s opinion that Spar Nord has a satisfactory level of measures to counter the risk of being exposed to fraud.
8.4 IT SECURITY Information and information systems are important to Spar Nord, and IT security is therefore decisive for Spar Nord’s credibility and continued existence. An IT security function has been established, and Spar Nord’s Executive Board and Board of Directors regularly check on IT security.
Spar Nord bases its activity in the IT security area on regulatory re-quirements as well as considerations regarding day-to-day opera-tions. All IT installations running at Spar Nord and its service provi-ders must operate according to documented running schedules and guidelines. Operation must be safe and stable, a requirement ensu-red through the highest possible degree of automation and continual capacity adjustments. For service providers, this must be ensured by means of written agreements. Spar Nord’s IT security work in-cludes the preparation of emergency plans and recovery procedures aimed to ensure continued operation at a satisfactory level, in the case of extraordinary events.
8.5 CAPITAL NEEDS The capital needed to cover Spar Nord’s operational risks is calcu-lated using the basic indicator approach. In 2015, the operational risk amounted to 12.4% of total risk exposure, ending at DKK 5,787.2 million, which results in a capital need of DKK 463.0 million.
8.6 COMPLIANCE Operational risks include compliance risk, which means the risk that Spar Nord is not being operated according to legal and statutory requirements, standards in the market and good business ethics.
Spar Nord has an independent compliance function charged with assisting Management in ensuring that Spar Nord complies with applicable legislation, market standards and internal rules and pro-cedures. This serves to identify and reduce the risk that sanctions are imposed on Spar Nord, that its reputation is compromised, or that Spar Nord or its customers suffer significant financial losses.
The compliance function is managed by a head of compliance (a law graduate), who answers to the Executive Board and submits reports to the Board of Directors. An overall policy and annual plan for the function’s activities have been approved by the Board of Directors.
The compliance function regularly reviews critical business proce-dures with a view to assessing risks and making recommendations to limit individual risks.

SPAR NORD BANK RISK REPORT 2015 38
9. APPENDIX
A. REFERENCES REGARDING DISCLOSURE OBLIGATIONS 39
B. BALANCE SHEET RECONCILIATION METHODOLOGY 40
C. CAPITAL INSTRUMENTS’ MAIN FEATURES TEMPLATE 41
D. TRANSITIONAL OWN FUNDS DISCLOSURE TEMPLATE 43
E. GEOGRAPHICAL DISTRIBUTION OF CREDIT EXPOSURES RELEVANT FOR THE CALCULATION OF THE COUNTERCYCLICAL CAPITAL BUFFER 47
F. CRR LEVERAGE RATIO - DISCLOSURE TEMPLATE 48
G. ASSET ENCUMBRANCE 50
H. TERM TO MATURITY BY EXPOSURE CATEGORY 51

SPAR NORD BANK RISK REPORT 2015 39
A. REFERENCES REGARDING DISCLOSURE OBLIGATIONS
Topic
Announcement of information regarding management systems
Risk management, including strategy, risk appetite, responsibility and processesRemuneration policy
Location of information
2015 Annual Report, pp 25 - 33 https://www.sparnord.com/reports
2015 Annual Report, pp 21 - 24 https://www.sparnord.com/reports https://www.sparnord.com/remunerationpolicy
SPAR NORD’S DISCLOSURE OBLIGATIONS

SPAR NORD BANK RISK REPORT 2015 40
B. BALANCE SHEET RECONCILIATION METHODOLOGY DISCLOSURE ACCORDING TO ARTICLE 2 IN COMMISSION IMPLEMENTING REGULATION (EU) NO. 1423/2013
BALANCE SHEET RECONCILIATION METHODOLOGYDisclosure according to Article 2 in Commission implementing regulation (EU) No 1423/2013
Capital base
DKK million
Shareholders’ equity according to balance sheet
Regulation according to limit for holdings own capital instruments
Provision for dividend
Deduction tier 1 capital included in equity
Indirect holdings of own capital instruments
Additional value adjustments
Goodwill
Tax - Goodwill
Deferred tax assets
Intangible assets
Tax - Intangible assets
Deduction insignificant capital shares - CET1
Common equity tier 1 capital
Tier 1 capital
Deduction insignificant capital shares - Tier 1
Total tier 1 capital
Tier 2 instruments
Deduction insignificant capital shares - Tier 2
Total tier 2 capital
Total capital base
31.12.15
7,874
-21
-377
-399
-2
-22
-196
27
-6
-56
12
-161
6,673
393
-121
6,945
1,078
-121
957
7,903

SPAR NORD BANK RISK REPORT 2015 41
C. CAPITAL INSTRUMENTS’ MAIN FEATURES TEMPLATE DISCLOSURE ACCORDING TO ARTICLE 3 IN COMMISSION IMPLEMENTING REGULATION (EU) NO. 1423/2013
CAPITAL INSTRUMENTS’ MAIN FEATURES TEMPLATE (1)1 Issuer Spar Nord Bank A/S Spar Nord Bank A/S Spar Nord Bank A/S
2
Unique identifier (eg CUSIP, ISIN or Bloomberg identifier for private placement DK0030362512 DK0030330311 DK0030307681
3 Governing law(s) of the instrument Danish Danish Danish
Regulatory treatment
4 Transitional CRR rules Additional Tier 1 Tier 2 Tier 2
5 Post-transitional CRR rules Additional Tier 1 Tier 2 Tier 2
6Eligible at solo/(sub-)consolidated/solo & (sub-)consolidated Solo & Consolidated Solo & Consolidated Solo & Consolidated
7Instrument type (types to be specified by each jurisdiction)
Additional Tier 1 as published in Regulation (EU) No 575/2013 article 51, 52
Tier 2 as published in Regulation (EU) No 575/2013 article 63
Tier 2 as published in Regulation (EU) No 575/2013 article 63
8
Amount recognised in regulatory capital (currency in million, as of most recent reporting date) DKK 393m DKK 696m DKK 397m
9 Nominal amount of instrument DKK 400m DKK 700m DKK 400m
9a Issue price 100 per cent 100 per cent 100 per cent
9b Redemption price 100 per cent of Nominal amount 100 per cent of Nominal amount 100 per cent of Nominal amount
10 Accounting classification Liability - amortised cost Liability - amortised cost Liability - fair value option
11 Original date of issuance 10/Jun/15 18/Dec/13 28/Nov/12
12 Perpeptual or dated Perpetual Dated Dated
13 Original maturity date No maturity 18/Dec/23 28/Nov/22
14Issuer call subjet to prior supervisory approval Yes Yes Yes
15Optional call date, contingent call dates, and redemption amount
10-Jun-20 100 per cent of Nominal amount In addition Tax/Regulatory call
18-Dec-18 100 per cent of Nominal amount In addition Tax/Regulatory call
28-Nov-17 100 per cent of Nominal amount In addition Tax/Regulatory call
16 Subsequent call dates, if applicable10-Dec and 10-Jun each year after first call date
18-Mar, 18-Jun, 18-Sep and 18-Dec each year after first call date
28-Nov each year after first call date
Coupons / dividends
17 Fixed or floating dividend/coupon Fixed to floating Floating Fixed to floating
18 Coupon rate and any related index
Fixed 6.052 per cent per annum, until first call date, thereafter Floating Cibor 6-month +5.40 per cent per annum Floating Cibor 3-month +3.90 per cent per annum
Fixed 6,0425 per cent per annum to call date (equivalent to DKK 5Y-Swap Rate +5 per cent per annum), thereafter floating CIBOR 3-month + 5.0 per cent per annum
19 Existence of a dividend stopper No No No
20aFully discretionary, partially discretion-ary or mandatory (in terms of timing Fully discretionary Mandatory Partially discretionary
20bFully discretionary, partially discretion-ary or mandatory (in terms of amount) Fully discretionary Mandatory Partially discretionary
21Existence of step up or other incentive to redeem No No No
22 Noncumulative or cumulative Non cumulative Non cumulative Cumulative
23 Convertible or non-convertible Non-convertible Non-convertible Non-convertible
24 If convertible, conversion trigger (s) N/A N/A N/A
25 If convertible, fully or partially N/A N/A N/A
26 If convertible, conversion rate N/A N/A N/A
27If convertible, mandatory or optional conversion N/A N/A N/A
28If convertible, specifiy instrument type convertible into N/A N/A N/A
29If convertible, specifiy issuer of instru-ment it converts into N/A N/A N/A
30 Write-down features Yes Yes Yes

SPAR NORD BANK RISK REPORT 2015 42
CAPITAL INSTRUMENTS’ MAIN FEATURES TEMPLATE (1)1 Issuer Spar Nord Bank A/S Spar Nord Bank A/S Spar Nord Bank A/S
2
Unique identifier (eg CUSIP, ISIN or Bloomberg identifier for private placement DK0030362512 DK0030330311 DK0030307681
3 Governing law(s) of the instrument Danish Danish Danish
Regulatory treatment
4 Transitional CRR rules Additional Tier 1 Tier 2 Tier 2
5 Post-transitional CRR rules Additional Tier 1 Tier 2 Tier 2
6Eligible at solo/(sub-)consolidated/solo & (sub-)consolidated Solo & Consolidated Solo & Consolidated Solo & Consolidated
7Instrument type (types to be specified by each jurisdiction)
Additional Tier 1 as published in Regulation (EU) No 575/2013 article 51, 52
Tier 2 as published in Regulation (EU) No 575/2013 article 63
Tier 2 as published in Regulation (EU) No 575/2013 article 63
8
Amount recognised in regulatory capital (currency in million, as of most recent reporting date) DKK 393m DKK 696m DKK 397m
9 Nominal amount of instrument DKK 400m DKK 700m DKK 400m
9a Issue price 100 per cent 100 per cent 100 per cent
9b Redemption price 100 per cent of Nominal amount 100 per cent of Nominal amount 100 per cent of Nominal amount
C. CAPITAL INSTRUMENTS’ MAIN FEATURES TEMPLATE DISCLOSURE ACCORDING TO ARTICLE 3 IN COMMISSION IMPLEMENTING REGULATION (EU) NO. 1423/2013

SPAR NORD BANK RISK REPORT 2015 43
D. TRANSITIONAL OWN FUNDS DISCLOSURE TEMPLATE DISCLOSURE ACCORDING TO ARTICLE 5 IN COMMISSION IMPLEMENTING REGULATION (EU) NO. 1423/2013
Common Equity Tier 1 capital: instruments and reserves (1)
31 december 2015 DKKm
(B) REGULATION (EU) No 575/2013 ARTICLE REFERENCE
(C) AMOUNTS SUBJECT TO PRE-REGULA-TION (EU) No 575/2013 TREATMENT OR PRESCRIBED RESIDUAL AMOUNT OF
1 Capital instruments and the related share premium accounts 1.255 26 (1), 27, 28, 29, EBA list 26 (3) N/A
of which: Instrument type 1 N/A EBA list 26 (3) N/A
of which: Instrument type 2 N/A EBA list 26 (3) N/A
of which: Instrument type 3 N/A EBA list 26 (3) N/A
2 Retained earnings 5.117 26 (1) (c) N/A
3 Accumulated other comprehensive income (and any other reserves) 119 26 (1) N/A
3a Funds for general banking risk N/A 26 (1) (f) N/A
4Amount of qualifying items referred to in Article 484 (3) and the related share premium accounts subject to phase out from CET1 N/A 486 (2) N/A
Public sector capital injections grandfathered until 1 january 2018 N/A 483 (2) N/A
5 Minority interests (amount allowed in consolidated CET1) N/A 84, 479, 480 N/A
5aIndependently reviewed interim profits net of any foreseeable charge or dividend 615 26 (2) N/A
6 Common Equity Tier 1 (CET1) capital before regulatory adjustments 7.107 N/A
Common Equity Tier 1 (CET1) capital: regulatory adjustments
7 Additional value adjustments (negative amount) -22 34, 105 N/A
8 Intangible assets (net of related tax liability) (negative amount) -212 36 (1) (b), 37, 472 (4) N/A
9 Empty set in the EU N/A N/A
10
Deferred tax assets that rely on future profitability excluding those arising from temporary difference (net of related tax liability where the conditions in Article 38 (3) are met) (negative amount) -6 36 (1) (c), 38, 472 (5) N/A
11 Fair value reserves related to gains or losses on cash flow hedges N/A 33 (a) N/A
12 Negative amounts resulting from the calculation of expected loss amounts N/A 36 (1) (d), 40, 159, 472 (6) N/A
13 Any increase in equity that results from securitised assets (negative amount) N/A 32 (1) N/A
14Gains or losses on liabilities valued at fair value resulting from changes in own credit standing N/A 33 (1) (b) (c) N/A
15 Defined-benefit pension fund assets (negative amount) N/A 36 (1) (e), 41, 472 (7) N/A
16Direct and indirect holdings by an institution of own CET1 instruments (nega-tive amount) -32 36 (1) (f), 42, 472 (8) N/A
17
Direct, indirect and synthetic holdings of the CET1 instruments of financial sector entities where those entities have reciprocal cross holdings with the institution designed to inflate artificially the own funds of the institution (negatvie amount) N/A 36 (1) (g), 44, 472 (9) N/A
18
Direct, indirect and synthetic holdings of the CET1 instruments of financial sector entities where the institution does not have a significant investment in those entities (amount above 10% threshold and net of eligible short posi-tions) (negative amount) -161
36 (1) (h), 43, 45, 46, 49 (2) (3), 79, 472 (10) N/A
19
Direct, indirect and synthetic holdings of the CET1 instruments of financial sector entities where the institution has a significant investment in those entities (amount above 10% threshold and net of eligible short positions) (negative amount) N/A
36 (1) (i), 43, 45, 47, 48 (1) (b), 49 (1) to (3), 79, 470, 472 (11) N/A
20 Empty set in the EU N/A N/A
20aExposure amount of the following items which qualify for a RW of 1250%, where the institution opts for the deduction alternative N/A 36 (1) (k) N/A
20b of which: qualifying holdings outside the financial sector (negative amount) N/A 36 (1) (k) (i), 89 to 91 N/A
20c of which: securitisation positions (negative amount) N/A
36 (1) (k) (ii) 243 (1) (b) 244 (1) (b) 258 N/A
20d of which: free deliveries (negative amount) N/A 36 (1) (k) (iii), 379 (3) N/A
21
Deferred tax assets arising from temporary difference (amount above 10 % threshold , net of related tax liability where the conditions in Article 38 (3) are met) (negative amount) N/A
36 (1) (c), 38, 48 (1) (a), 470, 472 (5) N/A
22 Amount exceeding the 15% threshold (negative amount) N/A 48 (1) N/A
23
of which: direct and indirect holdings by the institution of the CET1 instru-ments of financial sector entities where the institution has a significant investment in those entities N/A 36 (1) (i), 48 (1) (b), 470, 472 (11) N/A
24 Empty set in the EU N/A N/A
25 of which: deferred tax assets arising from temporary difference N/A36 (1) (c), 38, 48 (1) (a), 470, 472 (5) N/A
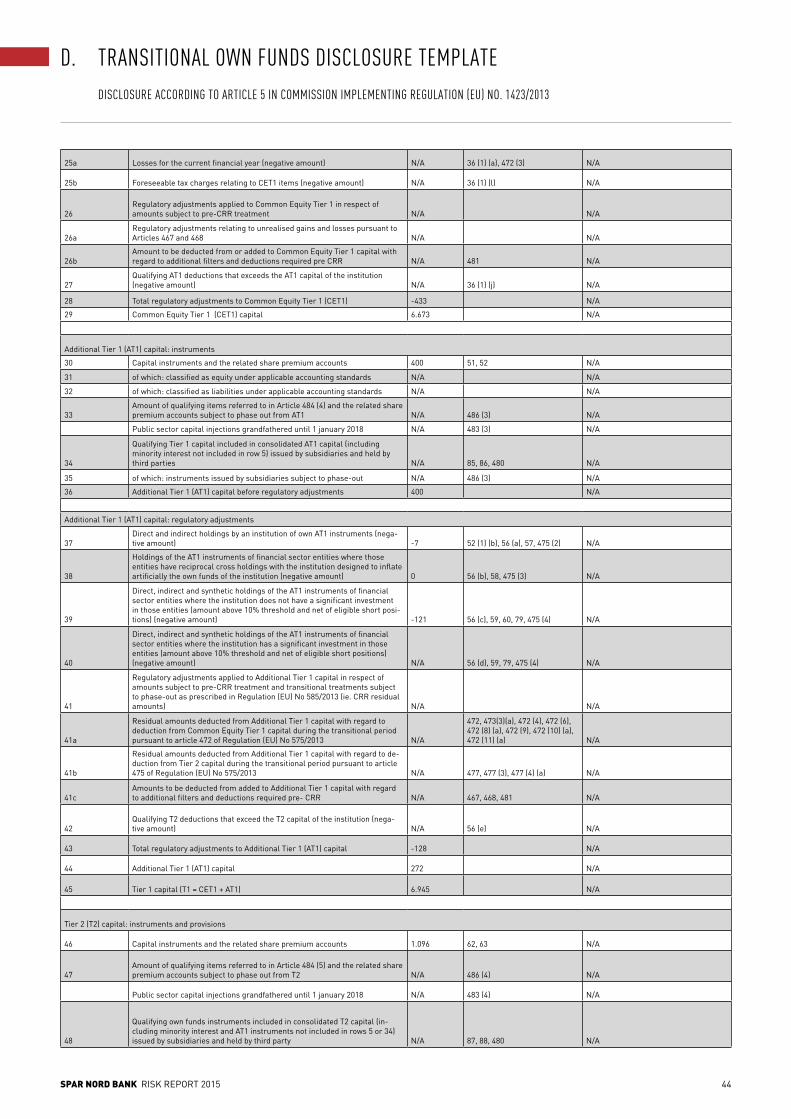
SPAR NORD BANK RISK REPORT 2015 44
25a Losses for the current financial year (negative amount) N/A 36 (1) (a), 472 (3) N/A
25b Foreseeable tax charges relating to CET1 items (negative amount) N/A 36 (1) (l) N/A
26Regulatory adjustments applied to Common Equity Tier 1 in respect of amounts subject to pre-CRR treatment N/A N/A
26aRegulatory adjustments relating to unrealised gains and losses pursuant to Articles 467 and 468 N/A N/A
26bAmount to be deducted from or added to Common Equity Tier 1 capital with regard to additional filters and deductions required pre CRR N/A 481 N/A
27Qualifying AT1 deductions that exceeds the AT1 capital of the institution (negative amount) N/A 36 (1) (j) N/A
28 Total regulatory adjustments to Common Equity Tier 1 (CET1) -433 N/A
29 Common Equity Tier 1 (CET1) capital 6.673 N/A
Additional Tier 1 (AT1) capital: instruments
30 Capital instruments and the related share premium accounts 400 51, 52 N/A
31 of which: classified as equity under applicable accounting standards N/A N/A
32 of which: classified as liabilities under applicable accounting standards N/A N/A
33Amount of qualifying items referred to in Article 484 (4) and the related share premium accounts subject to phase out from AT1 N/A 486 (3) N/A
Public sector capital injections grandfathered until 1 january 2018 N/A 483 (3) N/A
34
Qualifying Tier 1 capital included in consolidated AT1 capital (including minority interest not included in row 5) issued by subsidiaries and held by third parties N/A 85, 86, 480 N/A
35 of which: instruments issued by subsidiaries subject to phase-out N/A 486 (3) N/A
36 Additional Tier 1 (AT1) capital before regulatory adjustments 400 N/A
Additional Tier 1 (AT1) capital: regulatory adjustments
37Direct and indirect holdings by an institution of own AT1 instruments (nega-tive amount) -7 52 (1) (b), 56 (a), 57, 475 (2) N/A
38
Holdings of the AT1 instruments of financial sector entities where those entities have reciprocal cross holdings with the institution designed to inflate artificially the own funds of the institution (negative amount) 0 56 (b), 58, 475 (3) N/A
39
Direct, indirect and synthetic holdings of the AT1 instruments of financial sector entities where the institution does not have a significant investment in those entities (amount above 10% threshold and net of eligible short posi-tions) (negative amount) -121 56 (c), 59, 60, 79, 475 (4) N/A
40
Direct, indirect and synthetic holdings of the AT1 instruments of financial sector entities where the institution has a significant investment in those entities (amount above 10% threshold and net of eligible short positions) (negative amount) N/A 56 (d), 59, 79, 475 (4) N/A
41
Regulatory adjustments applied to Additional Tier 1 capital in respect of amounts subject to pre-CRR treatment and transitional treatments subject to phase-out as prescribed in Regulation (EU) No 585/2013 (ie. CRR residual amounts) N/A N/A
41a
Residual amounts deducted from Additional Tier 1 capital with regard to deduction from Common Equity Tier 1 capital during the transitional period pursuant to article 472 of Regulation (EU) No 575/2013 N/A
472, 473(3)(a), 472 (4), 472 (6), 472 (8) (a), 472 (9), 472 (10) (a), 472 (11) (a) N/A
41b
Residual amounts deducted from Additional Tier 1 capital with regard to de-duction from Tier 2 capital during the transitional period pursuant to article 475 of Regulation (EU) No 575/2013 N/A 477, 477 (3), 477 (4) (a) N/A
41cAmounts to be deducted from added to Additional Tier 1 capital with regard to additional filters and deductions required pre- CRR N/A 467, 468, 481 N/A
42Qualifying T2 deductions that exceed the T2 capital of the institution (nega-tive amount) N/A 56 (e) N/A
43 Total regulatory adjustments to Additional Tier 1 (AT1) capital -128 N/A
44 Additional Tier 1 (AT1) capital 272 N/A
45 Tier 1 capital (T1 = CET1 + AT1) 6.945 N/A
Tier 2 (T2) capital: instruments and provisions
46 Capital instruments and the related share premium accounts 1.096 62, 63 N/A
47Amount of qualifying items referred to in Article 484 (5) and the related share premium accounts subject to phase out from T2 N/A 486 (4) N/A
Public sector capital injections grandfathered until 1 january 2018 N/A 483 (4) N/A
48
Qualifying own funds instruments included in consolidated T2 capital (in-cluding minority interest and AT1 instruments not included in rows 5 or 34) issued by subsidiaries and held by third party N/A 87, 88, 480 N/A
D. TRANSITIONAL OWN FUNDS DISCLOSURE TEMPLATE DISCLOSURE ACCORDING TO ARTICLE 5 IN COMMISSION IMPLEMENTING REGULATION (EU) NO. 1423/2013

SPAR NORD BANK RISK REPORT 2015 45
49 of which: instruments issued by subsidiaries subject to phase-out N/A 486 (4) N/A
50 Credit risk adjustments N/A 62 (c) & (d) N/A
51 Tier 2 (T2) capital before regulatory adjustment 1.096 N/A
Tier 2 (T2) capital: regulatory adjustments
52Direct and indirect holdings by an institution of own T2 instruments and subordinated loans (negative amount) -18 63 (b) (i), 66 (a), 67, 477 (2) N/A
53
Holdings of the T2 instruments and subordinated loans of financial sector entities where those entities have reciprocal cross holdings with the institu-tions designed to inflate artificially the own funds of the institution (negative amount) N/A 66 (b), 68, 477 (3) N/A
54
Direct, indirect and synthetic holdings of the T2 instruments and subordi-nated loans of financial sector entities where the institution does not have a significant investment in those entities (amount above 10 % threshold and net of eligible short positions) (negative amount) -121 66 (c), 69, 70, 79, 477 (4) N/A
55
Direct, indirect and synthetic holdings of the T2 instruments and subordi-nated loans of financial sector entities where the institution has a significant investment in those entities (net of eligible short positions) (negative amounts) N/A 66 (d), 69, 79, 477 (4) N/A
56
Regulatory adjustments applied to tier 2 in respect of amounts subject to pre-CRR treatment and transitional treatments subject to phase out as prescribed in Regulation (EU) No 575/2013 (i.e. CRR residual amounts) N/A N/A
56a
Residual amounts deducted from Tier 2 capital with regard to deduction from Common Equity Tier 1 capital during the transitional period pursuant to article 472 of Regulation (EU) No 575/2013 N/A
472, 472(3)(a), 472 (4), 472 (6), 472 (8), 472 (9), 472 (10) (a), 472 (11) (a) N/A
56b
Residual amounts deducted from Tier 2 capital with regard to deduction from Additional Tier 1 capital during the transitional period pursuant to article 475 of Regulation (EU) No 575/2013 N/A
475, 475 (2) (a), 475 (3), 475 (4) (a) N/A
56cAmounts to be deducted from or added to Tier 2 capital with regard to ad-ditional filters and deductions required pre- CRR N/A 467, 468, 481 N/A
57 Total regulatory adjustments to Tier 2 (T2) capital -139 N/A
58 Tier 2 (T2) capital 957 N/A
59 Total capital (TC = T1 + T2) 7.903 N/A
60 Total risk-weighted assets 46.500 N/A
Capital ratios and buffers
61 Common Equity Tier 1 (as a percentage of total risk exposure amount 14,4% 92 (2) (a), 465 N/A
62 Tier 1 (as a percentage of total risk exposure amount 14,9% 92 (2) (b), 465 N/A
63 Total capital (as a percentage of total risk exposure amount 17,0% 92 (2) (c) N/A
64
Institution specific buffer requirement (CET1 requirement in accordance with article 92 (1) (a) plus capital conservation and countercyclical buffer require-ments plus a systemic risk buffer, plus systemically important institution buffer expressed as a percentage of total risk exposure amount) 0,0 CRD 128, 129, 140 N/A
65 of which: capital conservation buffer requirement 0,0 N/A
66 of which: countercyclical buffer requirement 0,0 N/A
67 of which: systemic risk buffer requirement 0,0 N/A
67aof which: Global Systemically Important Institution (G-SII) or Other Systemi-cally Important Institution (O-SII) buffer
Not yet im-plemented CRD 131 N/A
68Common Equity Tier 1 available to meet buffers (as a percentage of risk exposure amount) 9,9 CRD 128 N/A
69 [non-relevant in EU regulation] N/A N/A
70 [non-relevant in EU regulation] N/A N/A
D. TRANSITIONAL OWN FUNDS DISCLOSURE TEMPLATE DISCLOSURE ACCORDING TO ARTICLE 5 IN COMMISSION IMPLEMENTING REGULATION (EU) NO. 1423/2013
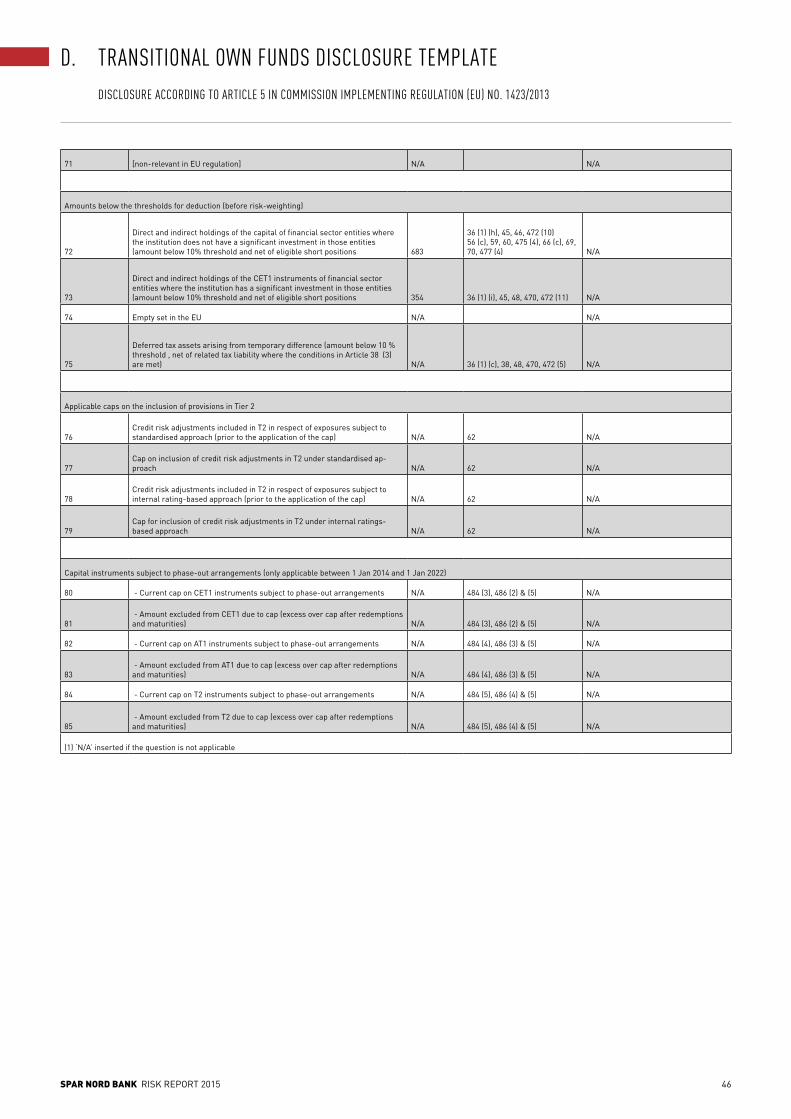
SPAR NORD BANK RISK REPORT 2015 46
71 [non-relevant in EU regulation] N/A N/A
Amounts below the thresholds for deduction (before risk-weighting)
72
Direct and indirect holdings of the capital of financial sector entities where the institution does not have a significant investment in those entities (amount below 10% threshold and net of eligible short positions 683
36 (1) (h), 45, 46, 472 (10) 56 (c), 59, 60, 475 (4), 66 (c), 69, 70, 477 (4) N/A
73
Direct and indirect holdings of the CET1 instruments of financial sector entities where the institution has a significant investment in those entities (amount below 10% threshold and net of eligible short positions 354 36 (1) (i), 45, 48, 470, 472 (11) N/A
74 Empty set in the EU N/A N/A
75
Deferred tax assets arising from temporary difference (amount below 10 % threshold , net of related tax liability where the conditions in Article 38 (3) are met) N/A 36 (1) (c), 38, 48, 470, 472 (5) N/A
Applicable caps on the inclusion of provisions in Tier 2
76Credit risk adjustments included in T2 in respect of exposures subject to standardised approach (prior to the application of the cap) N/A 62 N/A
77Cap on inclusion of credit risk adjustments in T2 under standardised ap-proach N/A 62 N/A
78Credit risk adjustments included in T2 in respect of exposures subject to internal rating-based approach (prior to the application of the cap) N/A 62 N/A
79Cap for inclusion of credit risk adjustments in T2 under internal ratings-based approach N/A 62 N/A
Capital instruments subject to phase-out arrangements (only applicable between 1 Jan 2014 and 1 Jan 2022)
80 - Current cap on CET1 instruments subject to phase-out arrangements N/A 484 (3), 486 (2) & (5) N/A
81 - Amount excluded from CET1 due to cap (excess over cap after redemptions and maturities) N/A 484 (3), 486 (2) & (5) N/A
82 - Current cap on AT1 instruments subject to phase-out arrangements N/A 484 (4), 486 (3) & (5) N/A
83 - Amount excluded from AT1 due to cap (excess over cap after redemptions and maturities) N/A 484 (4), 486 (3) & (5) N/A
84 - Current cap on T2 instruments subject to phase-out arrangements N/A 484 (5), 486 (4) & (5) N/A
85 - Amount excluded from T2 due to cap (excess over cap after redemptions and maturities) N/A 484 (5), 486 (4) & (5) N/A
(1) ‘N/A’ inserted if the question is not applicable
D. TRANSITIONAL OWN FUNDS DISCLOSURE TEMPLATE DISCLOSURE ACCORDING TO ARTICLE 5 IN COMMISSION IMPLEMENTING REGULATION (EU) NO. 1423/2013

SPAR NORD BANK RISK REPORT 2015 47
E. GEOGRAPHICAL DISTRIBUTION OF CREDIT EXPOSURES RELEVANT FOR THE CALCULATION OF THE COUNTERCYCLICAL CAPITAL BUFFER
Breakdown by country:
General credit expo-sures
Trading book exposure Securitisation exposure Own funds requirements Own funds require-ment weights
Coun-tercyc-lical capital buffer rate
Exposure value for SA
Expo-sure value IRB
Sum of long and short posi-tion of trading book
Value of trading book exposure for internal models
Exposure value for SA
Expo-sure value for IRB
Of which: General credit exposures
Of which: Trading book exposures
Of which: Securi-tisation expo-sures
Total
010 020 030 040 050 060 070 080 090 100 110 120010 Denmark 35,193,360,835 19,962,443,367 2,815,468,867 139,866,729 2,955,335,596 0.96 0%
United Kingdom
140,196,858 1,068,996,117 11,215,749 20,541,322 31,757,071 0.01 0%
Germany 146,646,212 153,676,678 11,731,697 5,312,494 17,044,191 0.01 0%Sweden 92,655,017 40,316,247 7,412,401 2,117,866 9,530,267 0.00 1%Finland 144,018,233 6,230,154 11,521,459 468,458 11,989,917 0.00 0%Luxembourg 136,543,068 6,030,301 10,923,445 474,630 11,398,075 0.00 0%Norway 29,740,815 41,469,523 2,379,265 2,989,844 5,369,110 0.00 1%Spain 82,665,304 4,762,646 6,613,224 47,626 6,660,851 0.00 0%Switzerland 64,425,792 13,319,595 5,154,063 1,002,582 6,156,645 0.00 0%France 28,967,580 5,830,719 2,317,406 439,035 2,756,441 0.00 0%USA 30,970,674 92,853,328 2,477,654 1,872,933 4,350,587 0.00 0%Other countries 239,918,211 7,295,605 19,193,457 583,648 19,777,105 0.01 0%
020 36,330,108,599 21,403,224,281 2,906,408,688 175,717,169 3,082,125,857 1
AMOUNT OF INSTITUTION-SPECIFIC COUNTERCYCLICAL CAPITAL BUFFER010
010 Total risk exposure amount 46,499,884,796020 Institution specific countercyclical buffer rate 0.00%030 Institution specific countercyclical buffer requirement 2,247,862
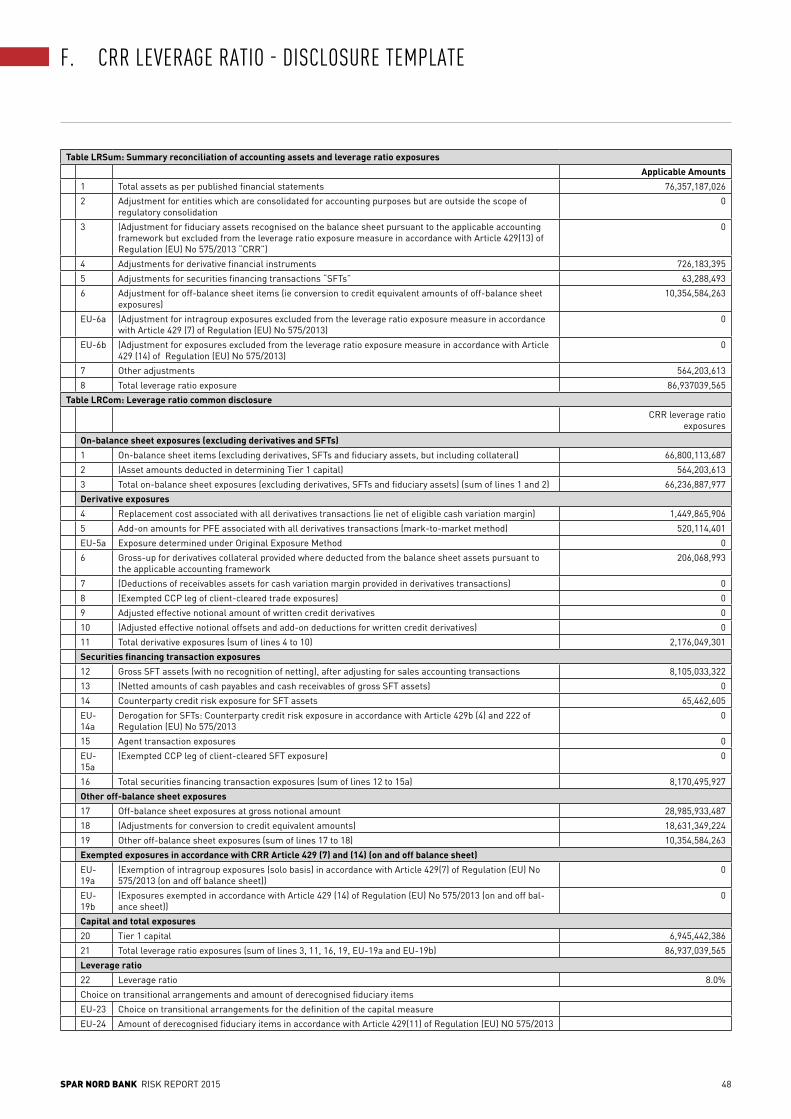
SPAR NORD BANK RISK REPORT 2015 48
Table LRSum: Summary reconciliation of accounting assets and leverage ratio exposuresApplicable Amounts
1 Total assets as per published financial statements 76,357,187,0262 Adjustment for entities which are consolidated for accounting purposes but are outside the scope of
regulatory consolidation0
3 (Adjustment for fiduciary assets recognised on the balance sheet pursuant to the applicable accounting framework but excluded from the leverage ratio exposure measure in accordance with Article 429(13) of Regulation (EU) No 575/2013 “CRR”)
0
4 Adjustments for derivative financial instruments 726,183,3955 Adjustments for securities financing transactions “SFTs” 63,288,4936 Adjustment for off-balance sheet items (ie conversion to credit equivalent amounts of off-balance sheet
exposures)10,354,584,263
EU-6a (Adjustment for intragroup exposures excluded from the leverage ratio exposure measure in accordance with Article 429 (7) of Regulation (EU) No 575/2013)
0
EU-6b (Adjustment for exposures excluded from the leverage ratio exposure measure in accordance with Article 429 (14) of Regulation (EU) No 575/2013)
0
7 Other adjustments 564,203,6138 Total leverage ratio exposure 86,937039,565
Table LRCom: Leverage ratio common disclosureCRR leverage ratio
exposuresOn-balance sheet exposures (excluding derivatives and SFTs)1 On-balance sheet items (excluding derivatives, SFTs and fiduciary assets, but including collateral) 66,800,113,6872 (Asset amounts deducted in determining Tier 1 capital) 564,203,6133 Total on-balance sheet exposures (excluding derivatives, SFTs and fiduciary assets) (sum of lines 1 and 2) 66,236,887,977Derivative exposures4 Replacement cost associated with all derivatives transactions (ie net of eligible cash variation margin) 1,449,865,9065 Add-on amounts for PFE associated with all derivatives transactions (mark-to-market method) 520,114,401EU-5a Exposure determined under Original Exposure Method 06 Gross-up for derivatives collateral provided where deducted from the balance sheet assets pursuant to
the applicable accounting framework206,068,993
7 (Deductions of receivables assets for cash variation margin provided in derivatives transactions) 08 (Exempted CCP leg of client-cleared trade exposures) 09 Adjusted effective notional amount of written credit derivatives 010 (Adjusted effective notional offsets and add-on deductions for written credit derivatives) 011 Total derivative exposures (sum of lines 4 to 10) 2,176,049,301Securities financing transaction exposures12 Gross SFT assets (with no recognition of netting), after adjusting for sales accounting transactions 8,105,033,32213 (Netted amounts of cash payables and cash receivables of gross SFT assets) 014 Counterparty credit risk exposure for SFT assets 65,462,605EU-14a
Derogation for SFTs: Counterparty credit risk exposure in accordance with Article 429b (4) and 222 of Regulation (EU) No 575/2013
0
15 Agent transaction exposures 0EU-15a
(Exempted CCP leg of client-cleared SFT exposure) 0
16 Total securities financing transaction exposures (sum of lines 12 to 15a) 8,170,495,927Other off-balance sheet exposures17 Off-balance sheet exposures at gross notional amount 28,985,933,48718 (Adjustments for conversion to credit equivalent amounts) 18,631,349,22419 Other off-balance sheet exposures (sum of lines 17 to 18) 10,354,584,263Exempted exposures in accordance with CRR Article 429 (7) and (14) (on and off balance sheet)EU-19a
(Exemption of intragroup exposures (solo basis) in accordance with Article 429(7) of Regulation (EU) No 575/2013 (on and off balance sheet))
0
EU-19b
(Exposures exempted in accordance with Article 429 (14) of Regulation (EU) No 575/2013 (on and off bal-ance sheet))
0
Capital and total exposures20 Tier 1 capital 6,945,442,38621 Total leverage ratio exposures (sum of lines 3, 11, 16, 19, EU-19a and EU-19b) 86,937,039,565Leverage ratio22 Leverage ratio 8.0%Choice on transitional arrangements and amount of derecognised fiduciary itemsEU-23 Choice on transitional arrangements for the definition of the capital measureEU-24 Amount of derecognised fiduciary items in accordance with Article 429(11) of Regulation (EU) NO 575/2013
F. CRR LEVERAGE RATIO - DISCLOSURE TEMPLATE
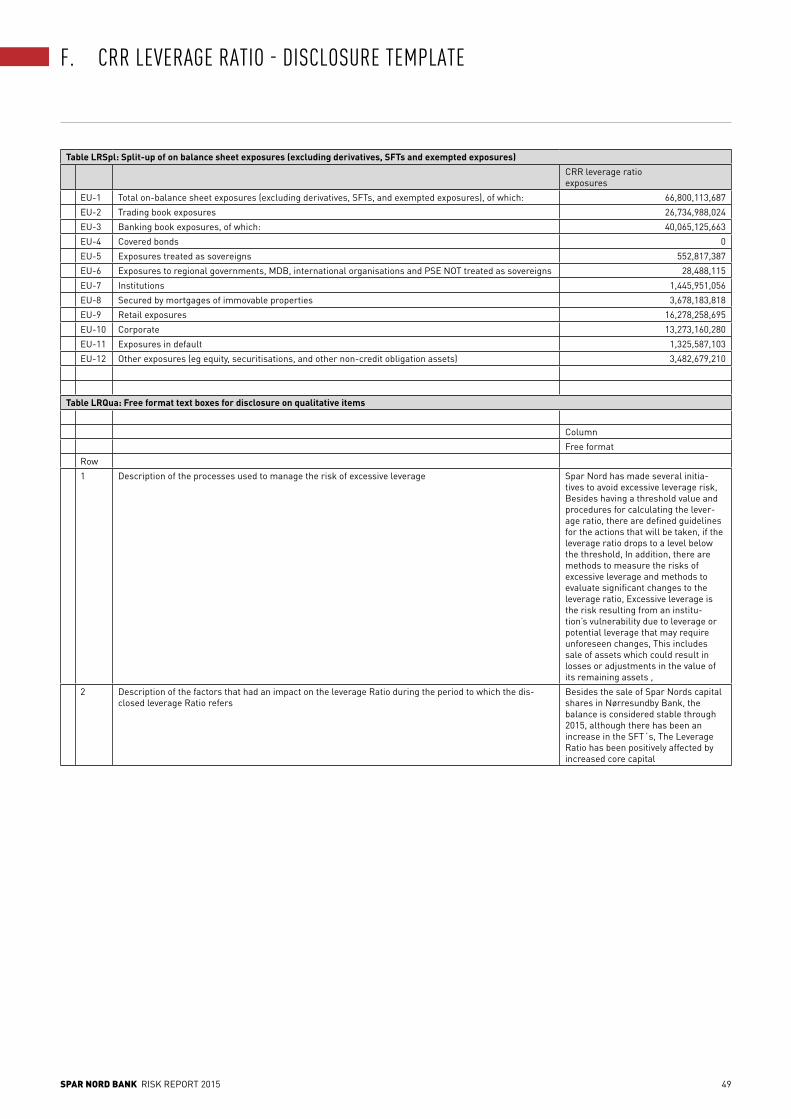
SPAR NORD BANK RISK REPORT 2015 49
Table LRSpl: Split-up of on balance sheet exposures (excluding derivatives, SFTs and exempted exposures)CRR leverage ratio exposures
EU-1 Total on-balance sheet exposures (excluding derivatives, SFTs, and exempted exposures), of which: 66,800,113,687EU-2 Trading book exposures 26,734,988,024EU-3 Banking book exposures, of which: 40,065,125,663EU-4 Covered bonds 0EU-5 Exposures treated as sovereigns 552,817,387EU-6 Exposures to regional governments, MDB, international organisations and PSE NOT treated as sovereigns 28,488,115EU-7 Institutions 1,445,951,056EU-8 Secured by mortgages of immovable properties 3,678,183,818EU-9 Retail exposures 16,278,258,695EU-10 Corporate 13,273,160,280EU-11 Exposures in default 1,325,587,103EU-12 Other exposures (eg equity, securitisations, and other non-credit obligation assets) 3,482,679,210
Table LRQua: Free format text boxes for disclosure on qualitative items
ColumnFree format
Row1 Description of the processes used to manage the risk of excessive leverage Spar Nord has made several initia-
tives to avoid excessive leverage risk, Besides having a threshold value and procedures for calculating the lever-age ratio, there are defined guidelines for the actions that will be taken, if the leverage ratio drops to a level below the threshold, In addition, there are methods to measure the risks of excessive leverage and methods to evaluate significant changes to the leverage ratio, Excessive leverage is the risk resulting from an institu-tion’s vulnerability due to leverage or potential leverage that may require unforeseen changes, This includes sale of assets which could result in losses or adjustments in the value of its remaining assets ,
2 Description of the factors that had an impact on the leverage Ratio during the period to which the dis-closed leverage Ratio refers
Besides the sale of Spar Nords capital shares in Nørresundby Bank, the balance is considered stable through 2015, although there has been an increase in the SFT´s, The Leverage Ratio has been positively affected by increased core capital
F. CRR LEVERAGE RATIO - DISCLOSURE TEMPLATE

SPAR NORD BANK RISK REPORT 2015 50
G. ASSET ENCUMBRANCE
Carrying amount of encumbered assets
Fair value of encumbered assets
Carrying amount of non-encumbered assets
Fair value of non-encumbered assets
010 040 060 090
010 Assets of the reporting institution 6,956 71,626
030 Equity instruments 0 0 1,567 1,567
040 Debt securities 5,093 5,093 11,678 11,678
120 Other assets 1,864 58,380
Matching liabilities, contingent liabilities or securities lent
Assets, collateral received and own debt securities issued other than covered bonds and ABSs encumbered
010 030
010 Carrying amount of selected financial li-abilities 7,064 7,103
Fair value of encumbered collateral received or own debt securities issued
Fair value of collateral received or own debt securities issued avail-able for encumbrance
010 040
130 Collateral received by the reporting institution
147 4.235
150 Equity instruments 0 19
160 Debt securities 147 4.199
230 Other collateral received 0 18
240 Own debt securities issued other than own covered bonds or ABSs 0 0

SPAR NORD BANK RISK REPORT 2015 51
H. TERM TO MATURITY BY EXPOSURE CATEGORY
TERM TO MATURITY BY EXPOSURE CATEGORY
2015 2014
On demand
0 - 3 mths
3 mths - 1 years
1 - 5 years
over 5 years
Grand total
On demand
0 - 3 mths
3 mths - 1 years
1 - 5 years
over 5 years
Grand total
Central gov. or central banks
288.9 0.0 0.0 0.0 0.0 288.9 630.8 0.0 0.0 0.0 0.0 630.8
Regional or local authorities
209.8 113.8 300.0 600.0 64.1 1,287.7 473.0 25.9 817.1 801.1 73.1 2,190.2
Public sector entities 0.0 0.0 71.5 16.3 6.2 94.0 0.0 0.0 0.0 71.3 6.9 78.2
Institutions
593.2 3,838.0 1,645.9 443.3 395.8 6,916.2 469.0 4,443.2 1,964.6 412.2 749.1 8,038.1
Corporates 1,982.4 7,503.1 7,971.0 2,955.6 3,730.9 24,143.0 2,120.9 3,712.1 7,943.1 2,688.6 4,070.7 20,535.4
Retail 1,447.4 6,027.5 7,816.7 9,935.4 10,183.9 35,410.9 1,461.9 5,533.2 7,120.4 12,198.6 10,028.3 36,342.4
Exp. secured by mortg. on imm. prop.
66.6 390.6 634.3 722.0 3,057.4 4,870.9 6.3 477.7 618.7 744.3 1,890.1 3,737.1
Exp. in defaults
43.5 362.4 430.9 455.1 349.6 1,641.5 50.3 618.2 225.3 382.1 235.1 1,511.0
High-risk exposures 242.9 154.9 246.9 161.2 80.4 886.3 244.3 412.3 410.8 83.4 71.9 1,222.7
Exp. with short-term rating
7.1 0.6 0.0 0.0 0.0 7.7 0.0 835.8 0.0 0.0 1.8 837.6
Exp. in units or CIU 0.0 0.0 0.5 0.0 4.3 4.8 0.0 0.0 1.0 0.0 5.8 6.8
Equity exposure 0.0 0.3 0.0 1.2 1,262.8 1,264.3 0.0 0.1 0.3 9.8 1,304.7 1,314.9
Other exposures 0.0 323.4 126.6 94.8 1,112.8 1,657.6 10.7 362.0 130.9 115.3 1,160.1 1,779.0
Grand total 4,881.8 18,714.6 19,244.3 15,384.9 20,248.2 78,473.8 5,467.2 16,420.5 19,232.2 17,506.7 19,597.6 78,224.2
TOTAL CREDIT EXPOSURE BY INDUSTRY
2015 Exposure category
Line of business - DKK m Central gov. or central banks
Regional or local authori-ties
Public sector entities
Institutions
Corpo-rates
Retail Exp. se-cured by mortg. on imm. prop.
Exp. in defaults
High-risk expo-sures
Exp. with short-term rating
Exp. in units or CIU
Equity exposure
Other expo-sures
Grand total
Public authorities 0.0 1,252.7 1.3 0.0 158.6 635.2 24.7 2.1 0.0 0.0 0.0 0.0 0.0 2,074.6
Agriculture. hunting and forestry
0.0 0.0 0.0 0.0 1,532.5 1,701.9 245.2 109.4 77.7 0.0 0.0 0.0 0.0 3,666.7
Fisheries 0.0 0.0 0.0 0.0 53.0 74.0 2.1 2.6 0.0 0.0 0.0 0.0 0.0 131.7
Industry and raw materials extraction
0.0 0.0 0.0 0.0 2,287.5 1,450.9 26.0 42.5 1.9 0.0 0.0 0.0 0.0 3,808.8
Energy supply 0.0 35.0 88.7 0.0 2,007.6 295.0 5.6 62.7 13.8 0.0 0.0 0.0 0.0 2,508.4
Building and construction
0.0 0.0 0.0 0.0 840.8 1,176.1 98.9 75.3 408.5 0.0 0.0 0.0 0.0 2,599.6
Trade 0.0 0.0 0.0 0.0 2,944.4 2,174.2 96.6 90.0 3.7 0.0 0.0 1.2 0.0 5,310.1
Transport. hotels and restaurants
0.0 0.0 0.0 0.0 1,262.4 759.8 46.7 78.6 35.8 0.0 0.0 0.0 0.0 2,183.3
Information and communication
0.0 0.0 0.0 0.0 80.0 192.7 7.3 5.1 0.0 0.0 0.0 0.0 0.0 285.1
Financing and insur-ance
288.9 0.0 0.0 6,546.1 4,816.6 791.7 145.7 51.9 12.4 7.7 4.8 1,262.8 1,291.4 15,220.0
Real estate 0.0 0.0 0.0 0.0 3,823.1 2,014.2 350.5 786.2 280.4 0.0 0.0 0.0 32.2 7,286.6
Other business areas 0.0 0.0 4.0 0.0 2,000.6 1,838.9 79.2 66.9 23.7 0.0 0.0 0.3 334.0 4,347.6
Business customers. total
288.9 1,287.7 94.0 6,546.1 21,807.1 13,104.6 1,128.5 1,373.3 857.9 7.7 4.8 1,264.3 1,657.6 49,422.5
Retail customers 0.0 0.0 0.0 370.1 2,335.9 22,306.3 3,742.4 268.2 28.4 0.0 0.0 0.0 0.0 29,051.3
Grand total 288.9 1,287.7 94.0 6,916.2 24,143.0 35,410.9 4,870.9 1,641.5 886.3 7.7 4.8 1,264.3 1,657.6 78,473.8

SPAR NORD BANK RISK REPORT 2015 52
2014 Exposure category
Line of business - DKK m Central gov. or central banks
Regional or local authori-ties
Public sector entities
Institutions
Corpo-rates
Retail Exp. se-cured by mortg. on imm. prop.
Exp. in defaults
High-risk expo-sures
Exp. with short-term rating
Exp. in units or CIU
Equity exposure
Other expo-sures
Grand total
Public authorities 0.0 2,153.0 1.2 0.0 124.8 897.0 17.3 2.6 0.0 0.0 0.0 0.0 0.0 3,195.9
Agriculture. hunting and forestry
0.0 0.0 0.0 0.0 1,808.0 1,914.2 249.2 93.3 82.1 226.7 0.0 0.0 0.0 4,373.5
Fisheries 0.0 0.0 0.0 0.0 80.6 69.3 3.2 3.1 0.0 0.0 0.0 0.0 0.0 156.2
Industry and raw materials extraction
0.0 0.0 0.0 0.0 2,577.8 1,264.6 29.1 67.3 8.0 2.2 0.0 0.0 0.0 3,949.0
Energy supply 0.0 37.2 72.9 0.0 1,777.4 371.0 16.9 72.6 10.2 0.5 0.0 0.0 0.0 2,358.7
Building and con-struction
0.0 0.0 0.0 0.0 746.8 1,077.0 69.5 85.8 657.3 4.9 0.0 0.0 0.0 2,641.3
Trade 0.0 0.0 0.0 0.0 2,953.9 2,200.9 113.3 77.9 4.1 56.4 0.0 1.5 0.0 5,408.0
Transport. hotels and restaurants
0.0 0.0 0.0 0.0 1,449.4 666.3 48.1 13.2 35.0 2.6 0.0 0.0 0.0 2,214.6
Information and communication
0.0 0.0 0.0 0.0 59.5 196.6 6.6 2.4 0.0 0.2 0.0 0.0 0.0 265.3
Financing and insurance
630.8 0.0 0.0 7,739.9 2,669.8 593.1 135.4 82.6 25.8 512.0 6.8 1,313.4 1,411.6 15,121.2
Real estate 0.0 0.0 0.0 0.3 3,578.8 2,180.3 337.2 680.2 326.4 14.1 0.0 0.0 0.0 7,117.3
Other business areas 0.0 0.0 4.1 0.0 1,500.4 1,879.6 88.7 83.4 42.2 1.5 0.0 0.0 367.4 3,967.3
Business customers. total
630.8 2,190.2 78.2 7,740.2 19,327.2 13,309.9 1,114.5 1,264.4 1,191.1 821.1 6.8 1,314.9 1,779.0 50,768.3
Retail customers 0.0 0.0 0.0 297.9 1,208.2 23,032.5 2,622.6 246.6 31.6 16.5 0.0 0.0 0.0 27,455.9
Grand total 630.8 2,190.2 78.2 8,038.1 20,535.4 36,342.4 3,737.1 1,511.0 1,222.7 837.6 6.8 1,314.9 1,779.0 78,224.2
H. TERM TO MATURITY BY EXPOSURE CATEGORY

SPAR NORD BANK RISK REPORT 2015 53
Spar Nord Bank A/SSpar Nord Bank A/SSkelagervej 15Skelagervej 15
P. O. Box 162P. O. Box 1629100 Aalborg9100 Aalborg
Tel. + 45 96 34 40 00Tel. + 45 96 34 40 00Fax + 45 96 34 45 60Fax + 45 96 34 45 60
[email protected]@sparnord.dk CVR. no. 13737584CVR. no. 13737584
The Risk Report has been prepared in a Danish and The Risk Report has been prepared in a Danish and an English version. In case of discrepancy between the an English version. In case of discrepancy between the Danish-language original text and the English-language Danish-language original text and the English-language translation, the Danish text shall prevail.translation, the Danish text shall prevail.