Embed Size (px)
Citation preview

1
Risking of prospects and segments

2
Probability concept• Fundamental rules
–Probability = 1- Risk P=1.0 means 100% certainty
P=0.0 means 0% certainty
1.0 0.0
0.9 0.1
0.8 0.2
0.7 0.3
0.6 0.4
0.5 0.5
0.4 0.5
0.3 0.7
0.2 0.8
0.1 0.9
0.0 1.0RISK
PROBABILITY

3
Probability concept• Multiplication rule.
P=Pa x Pb x Pc x Pd.
Used when estimating the probability of discovery for mapped prospect.
Prospect probability is a product of several independent factors (such as reservoir, trap, charge and retention).
4
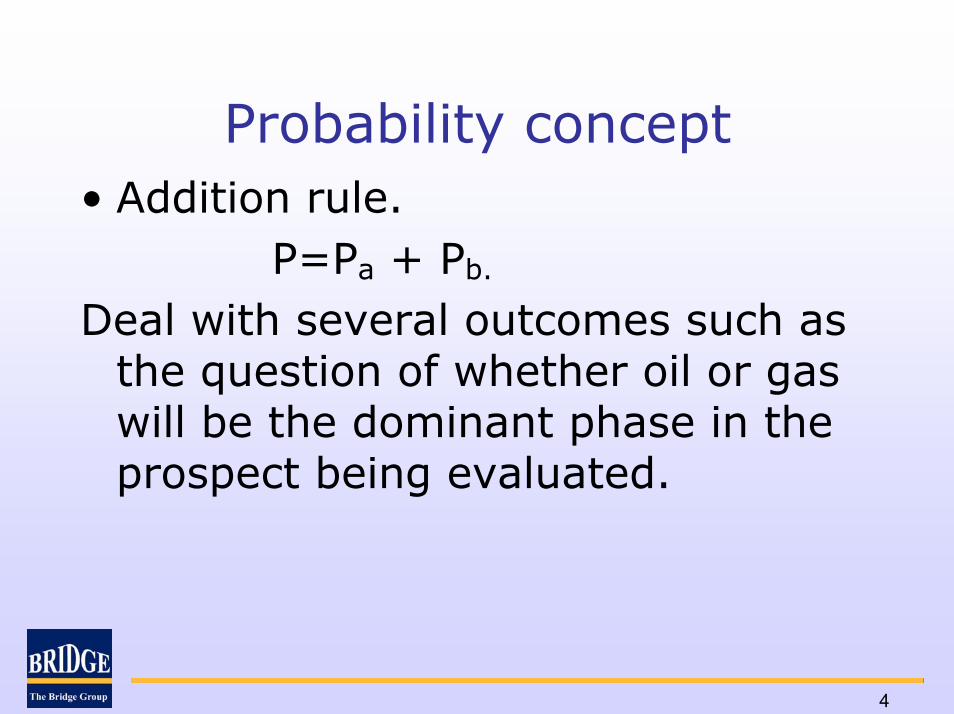
Probability concept• Addition rule.
P=Pa + Pb.
Deal with several outcomes such as the question of whether oil or gas will be the dominant phase in the prospect being evaluated.

5
Probability concept• Combination rule.
(1-P)=(1-Pa) x (1-Pb).
Deals with interdependency between prospects.

6
Risk model• Estimate the probability of making
a discovery–Make the volume estimates less
wrong (White, 1993)
• Establish risking guidelines prior to assessment–To provide consistency–Attempts to promote objectivity

7
Risk levels• Split into prospect level and play
level.– Play attributes assumed to be common to
all prospects in the play are grouped in theplay level.
– Prospect risk factors are assumed to be unique for each prospect and estimatesvary from prospect to prospect.

8
Play and Prospect risk
Retention after accumulation
Migration into the structure
Presence of effective sealTiming of structuring
Presence of structurePresence of mature source rock
Prospect risk factorsPlay risk factors
Presence of effective porosityPresence of reservoir facies
Risk Model

9
Probability of discovery
• The estimated prospect probabilityis not the probability of making a discovery but:
The probability of finding at leastthe minimum quantity of HC estimated in our resourceassessment.
CCOP-REP Vung Tau 1996

10
Probability of discovery
• The product of major probabilityfactors Pdisc = Pplay x Pprospect
where Pplay = Preservoir facies x Pmature source x Ptiming
and Pprospect= Pporosity x Pgeometry x Pseal x Pmigration x Pretention.
• Probability factors are evaluated withrespect to presence and effectiveness.

11
Probability of regionallydistributed reservoir facies
0.0 - 0.2Reservoir unit not present in the play area
0.2 - 0.4Presence is based on analog model
0.4 - 0.6Regional distribution of the unit is probable
0.6 - 0.8Found in at least one well; convincing seismic data clearly indicate a regional distribution of the unit
0.8 -1.0Found in all wells in the play area; facies modeling and seismic data clearly indicates presence of the reservoir unit in between wells
Quantitative probability range
Technical tests criteria
• Describes the probability that a regionally distributed facies that constitute the reservoir interval in the mapped prospects and unmapped resources exist.

12
Probability of sufficientmature source rock
0.0 - 0.2Presence of mature source rock is probable
0.2 - 0.4Presence is based on analog model
0.4 - 0.6Wells in play have HC shows/well samples show presence of source rock & geochemical modeling predicts mature source rock
0.6 - 0.8Found in at least one well; convincing seismic data clearly indicate a regional distribution of the unit
0.8 -1.0Commercial production in play area, wells tested moveable HC
Quantitative probability range
Technical tests criteria
• Describes the probability that a sufficient mature source rock exists.

13
Source rock evaluation
• Best done through basin modeling• Factors to be examined
– Quality of potential source rock– Type of hydrocarbon generated– Areal and spatial distribution of mature
source rock within play area– Poin in time for onset and end of oil
generation– Volume of hydrocarbon generated

14
Probability of timing ofstructuring
• Describes the probability that the structures have been present before the end of the hydrocarbon generation.
0.0 - 0.2Unambiguous data suggest that the trap was not in existecen priori to the end of HC generation.
0.2 - 0.4Unconvincing data indicate that the trap was not present prior to the end of the HC generation
0.4 - 0.6Based on the available data, it is equally probable that the trap was in existence prior to the end of the HC generation.
0.6 - 0.8Convincing data indicate trap existed before migration
0.8 -1.0Unambiguous data suggest trap existed before start of migration
Quantitative probability range
Technical tests criteria

15
Probability of the effectiveporosity
0.0 - 0.2Reservoir rock has parameters lower than the minimum
0.2 - 0.4Adequate reservoir parameters may exist in trend
0.4 - 0.6Existence of effective reservoir parameters is equally probable
0.6 - 0.8Lateral continuity is probable as indicated by seismic, well, and/or outcrop data
0.8 -1.0Identical reservoir rock parameters are found in field or discovery in immediate vicinity
Quantitative probability range
Technical tests criteria
• Describes the probability of the existence of an effective reservoir facies with reservoir parameters equal to or higher than the minimum estimate

16
Probability ofstructure/geometric body
0.0 - 0.2Identical structure proven absent
0.2 - 0.4Structure poorly defined by seismic
0.4 - 0.6A firm conclusion cannot be drawn
0.6 - 0.8Convincing data indicates probable structure
0.8 -1.0Identical structure in immediate vicinity tested successfully
Quantitative probability range
Technical tests criteria
• Describes the existence of the mapped structural/geometrical body with a bulk rock volume equal or larger than the minimum value used in the analysis.
17
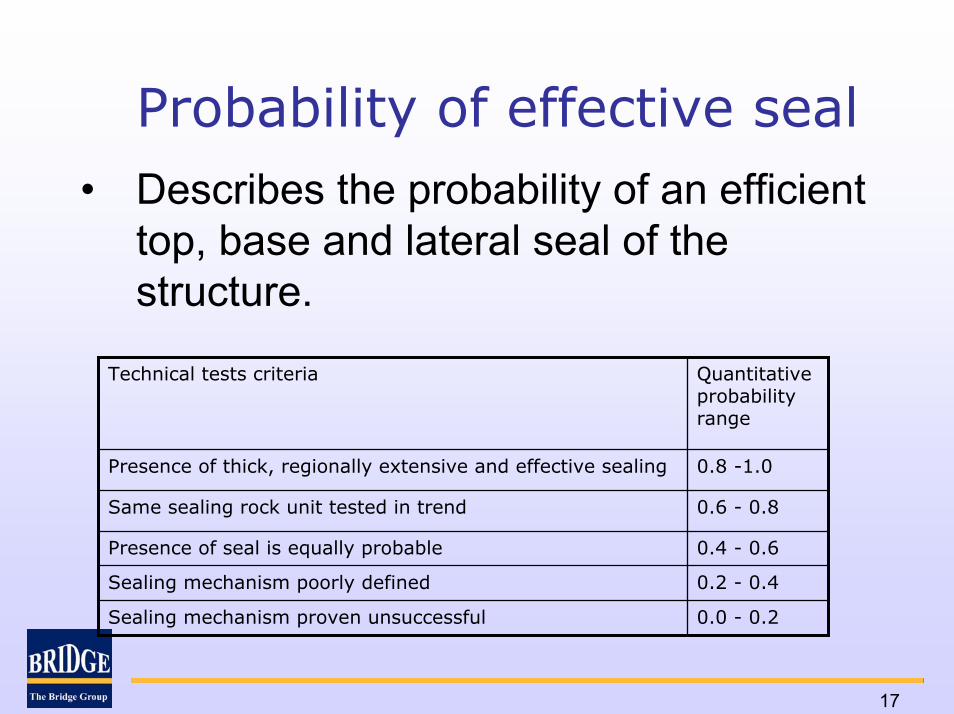
Probability of effective seal
0.0 - 0.2Sealing mechanism proven unsuccessful
0.2 - 0.4Sealing mechanism poorly defined
0.4 - 0.6Presence of seal is equally probable
0.6 - 0.8Same sealing rock unit tested in trend
0.8 -1.0Presence of thick, regionally extensive and effective sealing
Quantitative probability range
Technical tests criteria
• Describes the probability of an efficient top, base and lateral seal of the structure.

18
Probability of migration
0.0 - 0.2Trap is not within a migration pathway
0.2 - 0.4Migration path is complicated and tortuous
0.4 - 0.6Available data indicate that it is equally probable that HC have migrated into the trap
0.6 - 0.8Trap is situated within a migration pathway
0.8 -1.0Unambiguous data verify that HC migrated into similar traps
Quantitative probability range
Technical tests criteria
• Describes the probability of efficient migration of hydrocarbons from the source to the mapped structure.

19
Probability of retention afteraccumulation
• Evaluates reactivation of faults, regional uplift and tilting after accumulation
0.0 - 0.2Trap has experienced disturbances by tectonic movements
0.2 - 0.4Sealing mechanism after accumulation is poorly defined
0.4 - 0.6Equally probable that the trap has been or has not been affected by tectonic movements after accumulation
0.6 - 0.8Overlying sediments were eroded after accumulation
0.8 -1.0No indication of tectonic movement after accumulation
Quantitative probability range
Technical tests criteria

20
Definition of terms• Marginal probability
– The chance that at least one field of at leastminimum size exists in the play. This chancereflects the regional, play-specific risks within the play
• Conditional probability– The chance that the prospect would hold a
field of at least the minimum size oncondition that the play were regionallysuccessful
– (D.A. White, 1993)
21
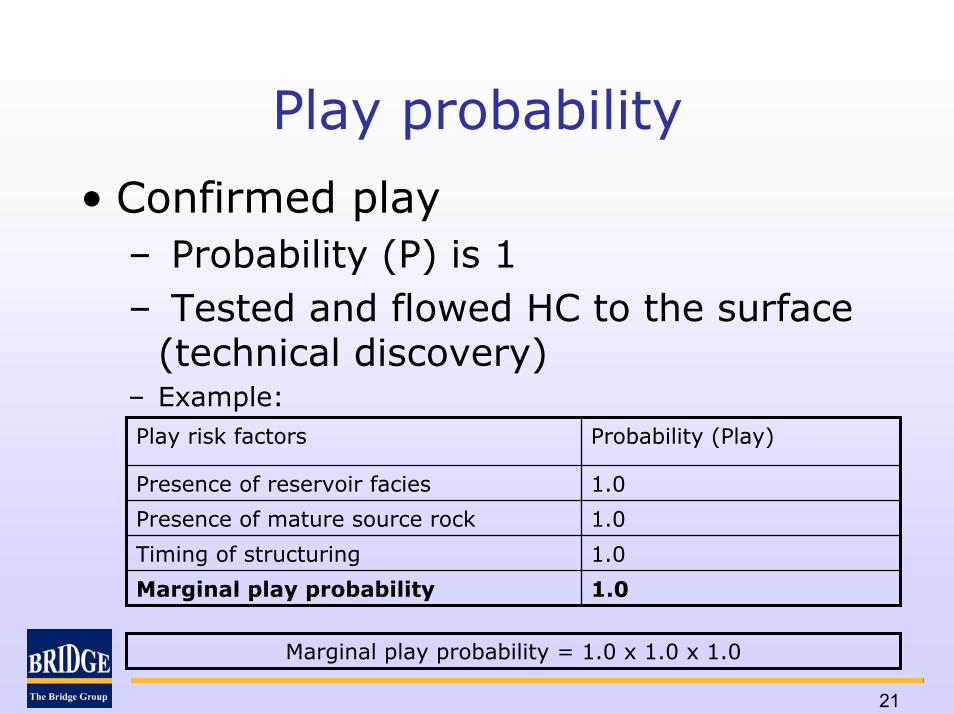
Play probability
• Confirmed play– Probability (P) is 1– Tested and flowed HC to the surface
(technical discovery)– Example:
1.0Marginal play probability
1.0Timing of structuring
1.0Presence of reservoir facies
1.0Presence of mature source rock
Probability (Play)Play risk factors
Marginal play probability = 1.0 x 1.0 x 1.0

22
Play probability
• Unconfirmed play–Probability is between 0 and 1–Play is not drilled yet or play has no
technical discovery– Example:
0.9Marginal play probability
1.0Timing of structuring
1.0Presence of reservoir facies
0.9Presence of mature source rock
Probability (Play)Play risk factors
Marginal play probability = 1.0 x 0.9 x 1.0

23
Prospect probability• Conditional probability
– The chance that the prospect will be an accumulation on the condition that the play is favorable to hydrocarbon accumulation (GeoX)
0.512Conditional prospect probability
1.0Retention after accumulation
0.8Migration into the structure
1.0Presence of effective seal
0.8Presence of effective porosity
0.8Presence of structure
Probability (Prospect|Play)Prospect risk factors
Conditional prospect probability = 0.8 x 0.8 x 1.0 x 0.8 x 1.0

24
Other terms for probability ofdiscovery
• Probability of success• Chance of success• Overall prospect chance• Unconditional probability (GeoX)

25
Unconditional probability• Probability of success = Pplay * Pprospect
0.54Dry hole risk
0.46Unconditional probability
0.9Marginal play probability
0.512Conditional prospect probability
ProbabilityPROSPECT WHOSE PLAY IS NOT CONFIRMED
0.488Dry hole risk
0.512Unconditional probability
1.0Marginal play probability
0.512Conditional prospect probability
ProbabilityPROSPECT WHOSE PLAY IS CONFIRMED
Unconditional probability = 0.9 x 0.512Unconditional probability = 1.0 x 0.512
Dry hole risk = 1 – 0.512 Dry hole risk = 1 – 0.46

26
Risk dependency -a probability perspective
Would your estimate ofA2 COS change if youknew the outcome ofdrilling the A1 segment?
If YES, then you implythat there is risk dependency between A1
A1A230% COS
20% COSand A2.
Copyright © 2004 GeoKnowledge
27
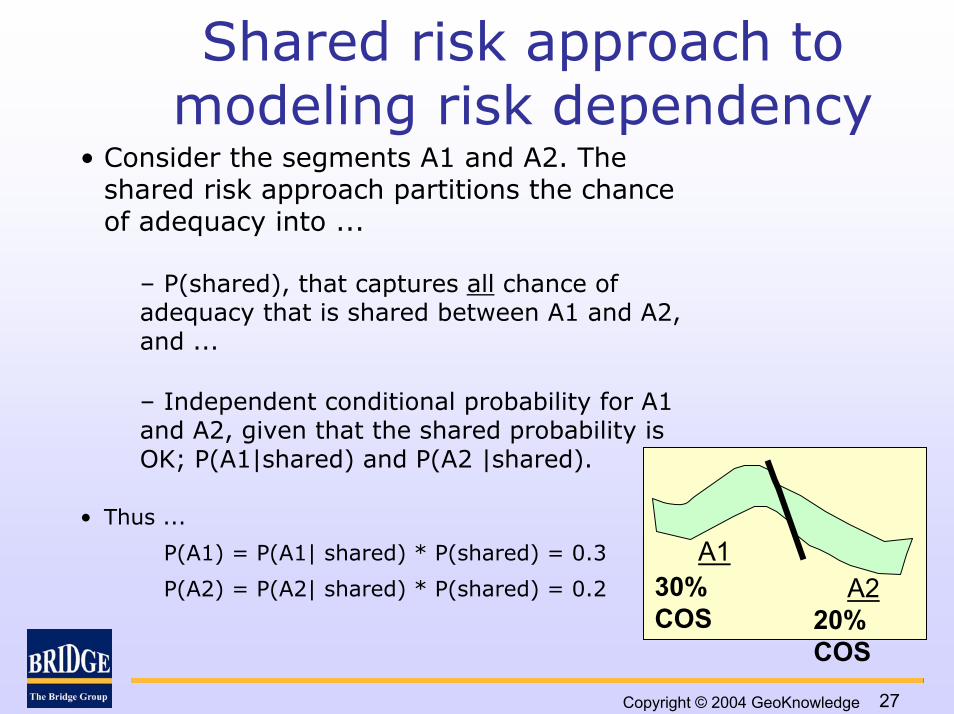
Shared risk approach to modeling risk dependency
• Consider the segments A1 and A2. The shared risk approach partitions the chanceof adequacy into ...
– P(shared), that captures all chance ofadequacy that is shared between A1 and A2, and ...
– Independent conditional probability for A1 and A2, given that the shared probability is OK; P(A1|shared) and P(A2 |shared).
• Thus ...
P(A1) = P(A1| shared) * P(shared) = 0.3
P(A2) = P(A2| shared) * P(shared) = 0.2
A1A230%
COS 20% COS
Copyright © 2004 GeoKnowledge

28
Geological interpretation of risk dependency
FULL dependency example, proven play
Geologic Setting:• Deepwater fan in a proven play.
• There is a 30% chance that thereservoir was deposited at A.
• If the reservoir is proven at A, thenthe chance at B will improve to 67%.
• The reservoir cannot be deposited at B without also being deposited at A.
A B
.30 .20
.10
.70 .50
al DecreasingReservoir COA DistalProxim
• What is probability that sand reached A? 30%• What is the probability that sand reached B, given that
it reached A? .2/.3 = 67%
Shared Shared Probability Independent ProbabilityShared x IndependentSegment Risk P(shared) P(segment | shared)P(segment)
A 1.00.30B .67.20
1 - .70 = .30.70
Copyright © 2004 GeoKnowledge

29
Geological interpretation of risk dependency
PARTIAL dependency example, proven play
• What is probability that the system was deposited? 50% (must be riskedseparately)
• Given that it was deposited, what is the chance that it is present in A? .3/.5 = 60%
• Given that it was deposited, what is the chance that it is present in B? .2/.5 = 40%
Geologic Setting:• Channel system in a proven play.
• There is a 50% chance that the channel wasdeposited in this area.
• It is more likely to be at A (Channel axis) thanat B (channel margin).
• Due to the sinuosity of the channel, it couldhave been deposited at B without beingdeposited at A. Or it could have beendeposited in the area, but at neither A nor B.
*Total reservoir COA
Chance the channel was deposited = 50%
BA
.20*
.30* Axis
Margin
Shared Shared Probability Independent ProbabilityShared x IndependentSegment Risk P(shared) P(segment | shared)P(segment)
A .60.30B .40.201 - .50 = .50.50
Copyright © 2004 GeoKnowledge

30
Geological interpretation of risk
dependency– FULL INDEPENDENCE example
.20
.30 BA
Geologic Setting:• Two independent sand systems: Miocenechannel and Pliocene fan.
• There is a 20% chance that the channel wasdeposited at B.
• There is a 30% chance that the fan wasdeposited at A.
• Structure formed in the Pleistocene.
• What is chance that the fan was depositedat A? 30%
• What is the chance that the channel wasdeposited at B? 20%Shared Shared Probability Independent ProbabilityShared x Independent
Segment Risk P(shared) P(segment | shared)P(segment)A .30.30B .20.200 1 - 0 = 1.00
Copyright © 2004 GeoKnowledge
31
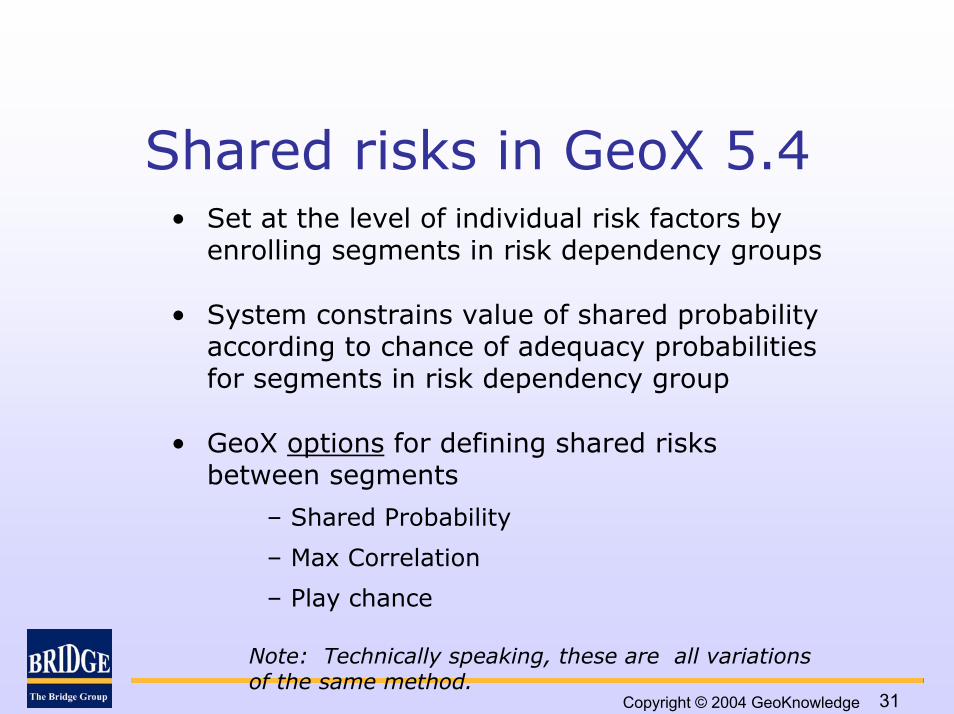
Shared risks in GeoX 5.4• Set at the level of individual risk factors by
enrolling segments in risk dependency groups
• System constrains value of shared probabilityaccording to chance of adequacy probabilitiesfor segments in risk dependency group
• GeoX options for defining shared risks between segments
– Shared Probability
– Max Correlation
– Play chance
Note: Technically speaking, these are all variations of the same method.
Copyright © 2004 GeoKnowledge

32
Organization and Flow


![[PPT]Facies and Facies Models - UCSC Directory of individual …mclapham/eart120/slides/Facies... · Web viewWhat is a facies? A sedimentary unit with consistent characteristics (lithology,](https://img.pdfslide.net/doc/110x75/5aef4a8a7f8b9a8c308bc665/pptfacies-and-facies-models-ucsc-directory-of-individual-mclaphameart120slidesfaciesweb.jpg)