Embed Size (px)
Citation preview
August 6, 2003 18:4 Geophysical Journal International gji2016
Geophys. J. Int. (2003) 154, 891–902
Ritter Island Volcano—lateral collapse and the tsunami of 1888
Steven N. Ward1 and Simon Day2
1Institute of Geophysics and Planetary Physics, University of California, Santa Cruz, CA 95064, USA. E-mail: [email protected] Hazard Research Centre, Department of Earth Sciences, University College, London, Gower Street, London WC1E 6BT.E-mail: [email protected]
Accepted 2003 April 9. Received 2003 April 7; in original form 2002 September 8
S U M M A R YIn the early morning of 1888 March 13, roughly 5 km3 of Ritter Island Volcano fell violentlyinto the sea northeast of New Guinea. This event, the largest lateral collapse of an island volcanoto be recorded in historical time, flung devastating tsunami tens of metres high on to adjacentshores. Several hundred kilometres away, observers on New Guinea chronicled 3 min periodwaves up to 8 m high, that lasted for as long as 3 h. These accounts represent the best availablefirst-hand information on tsunami generated by a major volcano lateral collapse. In this article,we simulate the Ritter Island landslide as constrained by a 1985 sonar survey of its debrisfield and compare predicted tsunami with historical observations. The best agreement occursfor landslides travelling at 40 m s−1, but velocities up to 80 m s−1 cannot be excluded. TheRitter Island debris dropped little more than 800 m vertically and moved slowly compared withlandslides that descend into deeper water. Basal friction block models predict that slides withshorter falls should attain lower peak velocities and that 40+ m s−1 is perfectly compatiblewith the geometry and runout extent of the Ritter Island landslide. The consensus betweentheory and observation for the Ritter Island waves increases our confidence in the existence ofmega-tsunami produced by oceanic volcano collapses two to three orders of magnitude largerin scale.
Key words: landslides, tsunami, volcano collapse.
1 T H E L A RG E S T I S L A N D V O L C A N OC O L L A P S E I N H I S T O R I C A L R E C O R D S :A T E M P L AT E F O R M E G A - S L I D E S ?
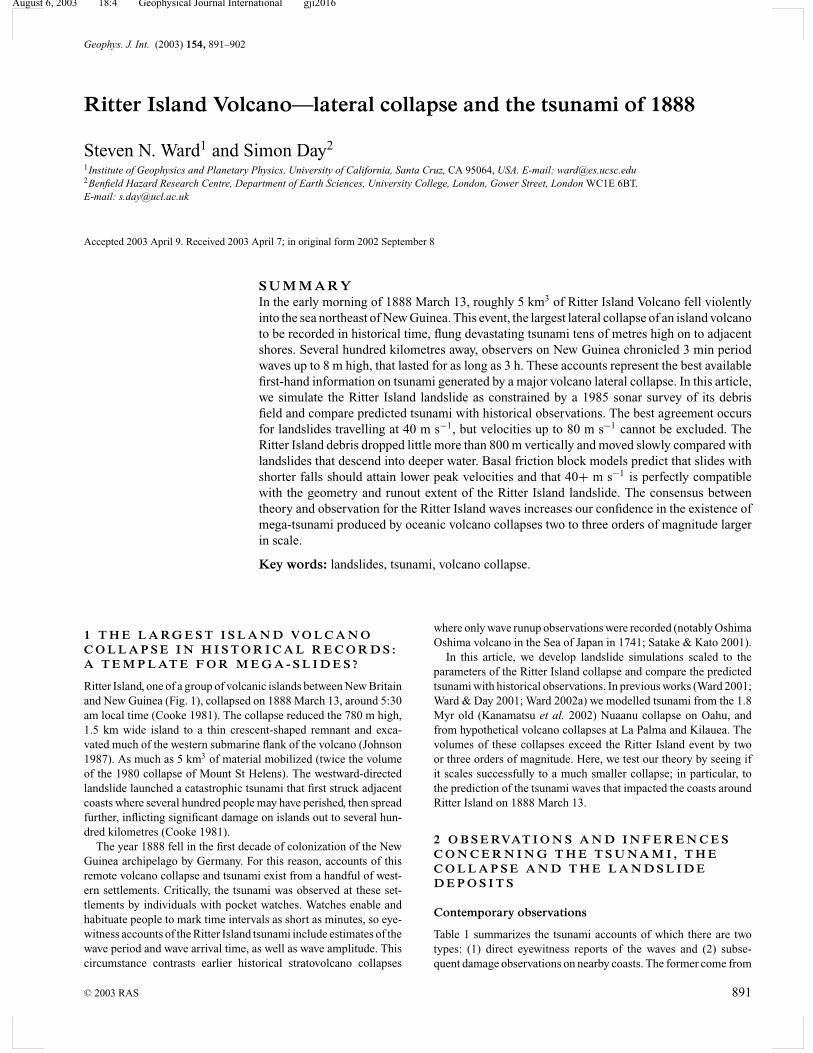
Ritter Island, one of a group of volcanic islands between New Britainand New Guinea (Fig. 1), collapsed on 1888 March 13, around 5:30am local time (Cooke 1981). The collapse reduced the 780 m high,1.5 km wide island to a thin crescent-shaped remnant and exca-vated much of the western submarine flank of the volcano (Johnson1987). As much as 5 km3 of material mobilized (twice the volumeof the 1980 collapse of Mount St Helens). The westward-directedlandslide launched a catastrophic tsunami that first struck adjacentcoasts where several hundred people may have perished, then spreadfurther, inflicting significant damage on islands out to several hun-dred kilometres (Cooke 1981).
The year 1888 fell in the first decade of colonization of the NewGuinea archipelago by Germany. For this reason, accounts of thisremote volcano collapse and tsunami exist from a handful of west-ern settlements. Critically, the tsunami was observed at these set-tlements by individuals with pocket watches. Watches enable andhabituate people to mark time intervals as short as minutes, so eye-witness accounts of the Ritter Island tsunami include estimates of thewave period and wave arrival time, as well as wave amplitude. Thiscircumstance contrasts earlier historical stratovolcano collapses
where only wave runup observations were recorded (notably OshimaOshima volcano in the Sea of Japan in 1741; Satake & Kato 2001).
In this article, we develop landslide simulations scaled to theparameters of the Ritter Island collapse and compare the predictedtsunami with historical observations. In previous works (Ward 2001;Ward & Day 2001; Ward 2002a) we modelled tsunami from the 1.8Myr old (Kanamatsu et al. 2002) Nuaanu collapse on Oahu, andfrom hypothetical volcano collapses at La Palma and Kilauea. Thevolumes of these collapses exceed the Ritter Island event by twoor three orders of magnitude. Here, we test our theory by seeing ifit scales successfully to a much smaller collapse; in particular, tothe prediction of the tsunami waves that impacted the coasts aroundRitter Island on 1888 March 13.
2 O B S E RVAT I O N S A N D I N F E R E N C E SC O N C E R N I N G T H E T S U N A M I , T H EC O L L A P S E A N D T H E L A N D S L I D ED E P O S I T S
Contemporary observations
Table 1 summarizes the tsunami accounts of which there are twotypes: (1) direct eyewitness reports of the waves and (2) subse-quent damage observations on nearby coasts. The former come from
C© 2003 RAS 891
August 6, 2003 18:4 Geophysical Journal International gji2016
892 S. N. Ward and S. Day
Table 1. Summary of direct eyewitness reports and subsequent observations of damage (see Cooke 1981, for a more complete version). Locations are indicatedin Fig. 1.
Location and type Time of first wave arrival; Observed wave periods Wave amplitudes or runups/inundationsof observations duration of wave arrivals
Finschafen (E) Soon after 6.30 am; 30 min of 3–4 min Initial drawdown 1.5–2 mstrong irregular waves in 2 min
Kelana (E) 6.30 am; 1 h of observed strong waves 3 min Runup of first wave 8 m; runup of(20 waves in total) fourth wave 10 m
Hatzfeldhafen (E) 6.40 am; 2.5 h of strong wave motions. 3–4 min Initial rise >2 m above high tide; peakwave height (8 am) 7–8 m
Umboi I., N & E coasts (D) — — Coastal zone stripped to ca. 15 m a.s.l.
Sakar I. (D) — — Coastal zone stripped to ca. 15 m a.s.l.New Britain (east coast Before 6 am — Destruction and tsunami deposits extending
of Dampier Strait) (D)* c. 1 km inland and flood-marks on trees toMatupi, Rabaul (E) 8.15 am; 3 h of observed waves 12–15 m a.s.l. 4.5 m maximum runup
(E = eyewitness; D = subsequent damage report; a.s.l = above sea level).∗Survivors of an expedition caught by the tsunami on this coast reported the arrival of the tsunami before daybreak.
PAPUA NEW GUINEA
AUSTRALIA
South Pacific
Coral Sea
Ritter Island Environs
Ritter Island
Sakar I.Tolokiwa I.
Umboi I.New Britain
Hatzfeld- hafen
KelanaFinschafen
Rabaul
Manus I.
BISMARCK SEAMatupi
NEW
GUINEA
146 E 149 E
0 400 km
3 S
5 S Dampier Strait
Figure 1. Location of New Britain/New Guinea area (inset). Principal is-lands and tsunami observation points (squares) are marked.
mission sites of Hatzfeldhafen, Kelana and Finschafen on NewGuinea (Fig. 1) while the latter come from the islands of Um-boi and Sakar and the western end of New Britain. By and large,the observed waves at the mission sites reached 8 m height. Noneof these locations, however, had a direct ‘line of sight’ to RitterIsland so the observed waves must have reflected or diffractedaround intervening islands. These are not efficient processes, sounobstructed sites at the same distance should have seen largerwaves.
The subsequent damage observations include those made imme-diately after the collapse during the search for a German expeditioncaught by the tsunami on New Britain, and observations made 1or 2 years later of the coasts of Sakar and Umboi from the decksof ships at sea. The direct onshore observations in New Britainaccurately fix both inundation height (∼15 m) and inundation dis-tance (∼1 km) there. However, the heights (∼15 m) of the zones ofcomplete vegetation stripping on Sakar and Umboi as seen from off-shore probably understate the true limits because palms and othertrees along tropical coasts can withstand several metres of inun-dation by turbulent bores (e.g. the 1998 Sissano tsunami, Kawata
et al. 1999; McSaveney et al. 2000; Davies et al. 2003). The trueinundation heights on Sakar and Umboi Islands may have exceeded20 m.
Other aspects apparent from the eyewitness accounts are the shortperiod of tsunami waves and the long duration of the tsunami as awhole. Observers at Hatzfeldhafen and Kelana emphasized a 3–4 min period, whereas typical earthquake-generated tsunami have10–15 min wave periods. At Finschafen too, the initial wave cycletook about 4 min, although later motion was described as ‘irregu-lar’. All eyewitnesses reported a large number of waves with rapidsea surface movements lasting longer at more distant sites (30 minat Finschafen, 1 h at Kelana, 2.5 h at Hatzfeldhafen and nearly 3 hat Matupi). We believe that the collapse itself produced the short-period waves. If they were artefacts of local harbour resonance forinstance, the frequencies would differ between sites. The short waveperiod means that wave dispersion effects will be crucial in mod-elling tsunami of the event. A characteristic feature of dispersion,the stretching out of the tsunami with time as different frequencycomponents travel at different speeds, seems manifest in the obser-vation that tsunami duration increased with distance. Recognizingthe Ritter Island tsunami waves to be short period also bears on theinterpretation of the subsequent damage. Many of the coasts thatsuffered runup damage lie flat with fringing reefs. Penetration in-land and up slope for 3–4 min waves may be limited more by therapid onset of backwash as the next wave trough arrives than by theactual height of the wave crests.
The eyewitness accounts also underscore the lack of explosive ac-tivity accompanying the collapse of the volcano. Although residentsnoted sounds of explosions and saw an ‘almost imperceptible’ ashfall at Finschafen (Cooke 1981), explosive activity was very minorcompared with the eruption at Krakatoa in 1883. Johnson (1987)associated the accounts of explosions at Ritter Island with phreaticactivity caused by explosive decompression of a hydrothermal sys-tem or a small magma body as the summit of the volcano slid away.Such explosions could not have contributed much to the tsunami,so sea wave generation models for the Ritter Island collapse canbe simpler than for the Krakatoa eruption (Simkin & Fiske 1983).Tsunami there may have been produced by complex episodes ofcaldera collapse, lateral collapses of the caldera walls and massivepyroclastic flows entering the sea (Latter 1981; Self & Rampino1981).
C© 2003 RAS, GJI, 154, 891–902
August 6, 2003 18:4 Geophysical Journal International gji2016
Ritter island collapse tsunami 893
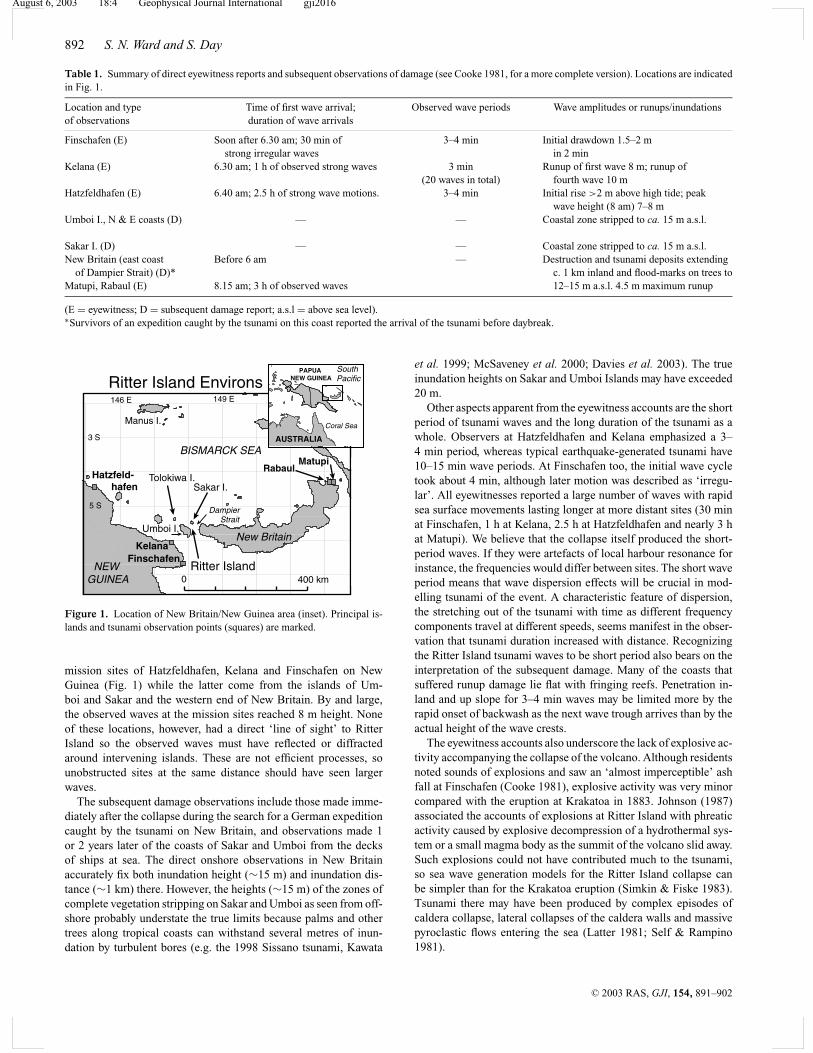
Figure 2. Geometry of the present-day collapse scar at Ritter Island (afterJohnson 1987) showing the toreva blocks in the mouth of the horseshoe-shaped collapse scar and the elongated conical shape of the remaining flanksof the Ritter Island volcano.
Subsequent observations
Nearly a century after the Ritter Island collapse, R.W. Johnson sur-veyed the scar and the proximal part of the landslide using a com-mercial single-beam echo sounder mounted on a schooner borrowedfrom an archaeological research project (Johnson 1987). His survey(Fig. 2) identified a submerged WNW-facing amphitheatre 3.5 kmwide and more than 4 km from mouth to headwall, the arcuatecrest of which forms the western side of Ritter Island itself. At themouth of the collapse scar, the survey located flat-topped mounds upto 2 km long, rising hundreds of metres above the surrounding seafloor. Johnson interpreted these as slide blocks or torevas. The depthlimitations of the echo sounder prevented mapping of the distal partof the collapse, but deposits there must be extensive because littleof the 4–5 km3 of slide material estimated by Johnson remains withinthe area surveyed.
The collapse scar and collapse deposit geometries:observations and inferences
Early visitors to the region described pre-collapse Ritter Island as no-tably steep, rising as much as 780 m above sea level while being lessthan 1.5 km wide (Cooke 1981). Its topography was not recordedin detail, however, and nothing is known concerning pre-collapsesubmarine topography anywhere around the Island. Extrapolationof pre-collapse profiles from the broadly conical slopes that remainto the north and south reveals a 500–600 m depth difference betweenthe pre-collapse surface and the present-day floor of the amphithe-atre along its axis. This height difference probably corresponds tothe maximum thickness of the slide at its centre. The collapse scarhas been partly filled with the products of later eruptions (notablyin 1972 and 1974, Cooke 1981), so the initial depth of the scar floorand the actual thickness of the landslide may have been greater. A∼500 m slide thickness is also indicated by the height of the largesttoreva in the mouth of the collapse scar above its surrounding. Evenallowing for the thinning of the slide mass toward the sides of thescar, we find it difficult to reduce the volume of the landslide be-low Johnson’s 4–5 km3 maximum. Although the distal part of the
debris deposit was not mapped by Johnson, analogies can be drawnwith the completely mapped avalanches at Oshima Oshima (Satake& Kato 2001) and other subaerial stratovolcanoes (Ui et al. 1986;Siebert et al. 1987). We suggest that 4–5 km3 of the Island’s debrisforms a deposit that extends down the axis of the channel betweenUmboi and Sakar Islands as far as 20 km from Ritter, and has awidth of about 5 km (shaded area, Fig. 2).
Inferred kinematic history of the collapse
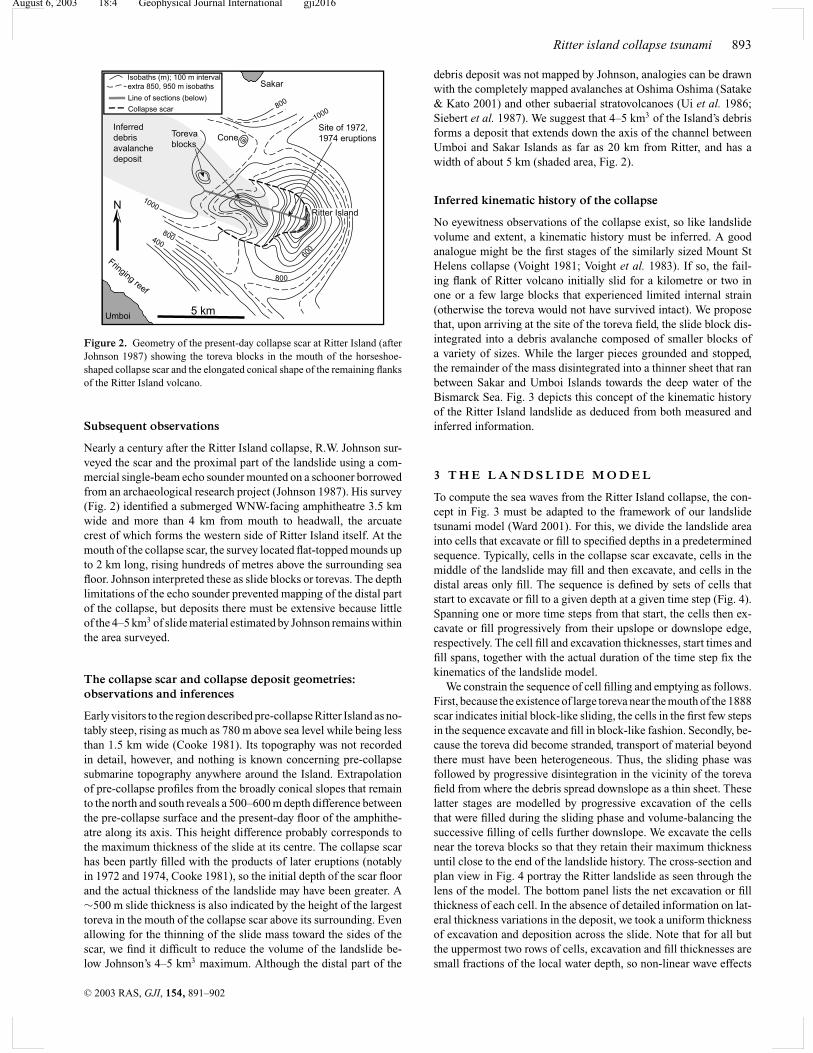
No eyewitness observations of the collapse exist, so like landslidevolume and extent, a kinematic history must be inferred. A goodanalogue might be the first stages of the similarly sized Mount StHelens collapse (Voight 1981; Voight et al. 1983). If so, the fail-ing flank of Ritter volcano initially slid for a kilometre or two inone or a few large blocks that experienced limited internal strain(otherwise the toreva would not have survived intact). We proposethat, upon arriving at the site of the toreva field, the slide block dis-integrated into a debris avalanche composed of smaller blocks ofa variety of sizes. While the larger pieces grounded and stopped,the remainder of the mass disintegrated into a thinner sheet that ranbetween Sakar and Umboi Islands towards the deep water of theBismarck Sea. Fig. 3 depicts this concept of the kinematic historyof the Ritter Island landslide as deduced from both measured andinferred information.
3 T H E L A N D S L I D E M O D E L
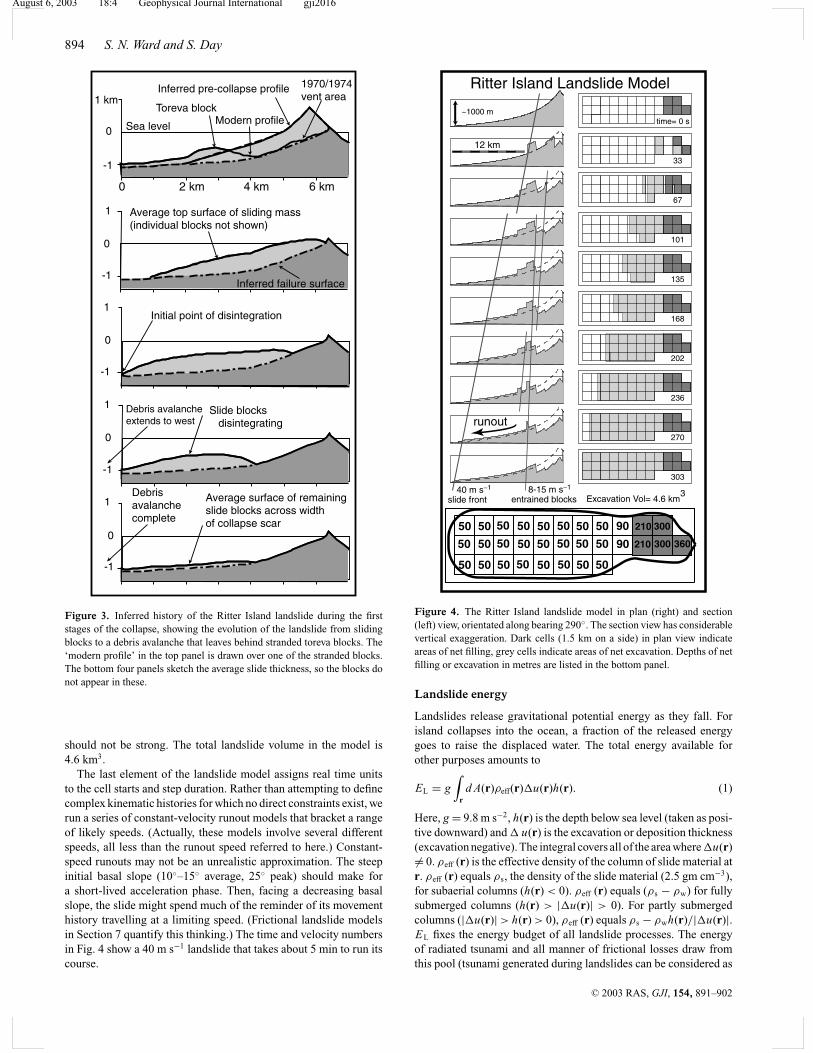
To compute the sea waves from the Ritter Island collapse, the con-cept in Fig. 3 must be adapted to the framework of our landslidetsunami model (Ward 2001). For this, we divide the landslide areainto cells that excavate or fill to specified depths in a predeterminedsequence. Typically, cells in the collapse scar excavate, cells in themiddle of the landslide may fill and then excavate, and cells in thedistal areas only fill. The sequence is defined by sets of cells thatstart to excavate or fill to a given depth at a given time step (Fig. 4).Spanning one or more time steps from that start, the cells then ex-cavate or fill progressively from their upslope or downslope edge,respectively. The cell fill and excavation thicknesses, start times andfill spans, together with the actual duration of the time step fix thekinematics of the landslide model.
We constrain the sequence of cell filling and emptying as follows.First, because the existence of large toreva near the mouth of the 1888scar indicates initial block-like sliding, the cells in the first few stepsin the sequence excavate and fill in block-like fashion. Secondly, be-cause the toreva did become stranded, transport of material beyondthere must have been heterogeneous. Thus, the sliding phase wasfollowed by progressive disintegration in the vicinity of the torevafield from where the debris spread downslope as a thin sheet. Theselatter stages are modelled by progressive excavation of the cellsthat were filled during the sliding phase and volume-balancing thesuccessive filling of cells further downslope. We excavate the cellsnear the toreva blocks so that they retain their maximum thicknessuntil close to the end of the landslide history. The cross-section andplan view in Fig. 4 portray the Ritter landslide as seen through thelens of the model. The bottom panel lists the net excavation or fillthickness of each cell. In the absence of detailed information on lat-eral thickness variations in the deposit, we took a uniform thicknessof excavation and deposition across the slide. Note that for all butthe uppermost two rows of cells, excavation and fill thicknesses aresmall fractions of the local water depth, so non-linear wave effects
C© 2003 RAS, GJI, 154, 891–902
August 6, 2003 18:4 Geophysical Journal International gji2016
894 S. N. Ward and S. Day
Inferred pre-collapse profile 1970/1974vent area
Modern profile
Inferred failure surface
Sea level0
1 km
-1
Toreva block
0 2 km 4 km 6 km
0
1
-1
Average top surface of sliding mass(individual blocks not shown)
0
1
-1
Initial point of disintegration
0
1
-1
Slide blocks disintegrating
Debris avalanche extends to west
0
1
-1
Average surface of remainingslide blocks across widthof collapse scar
Debrisavalanche complete
Figure 3. Inferred history of the Ritter Island landslide during the firststages of the collapse, showing the evolution of the landslide from slidingblocks to a debris avalanche that leaves behind stranded toreva blocks. The‘modern profile’ in the top panel is drawn over one of the stranded blocks.The bottom four panels sketch the average slide thickness, so the blocks donot appear in these.
should not be strong. The total landslide volume in the model is4.6 km3.
The last element of the landslide model assigns real time unitsto the cell starts and step duration. Rather than attempting to definecomplex kinematic histories for which no direct constraints exist, werun a series of constant-velocity runout models that bracket a rangeof likely speeds. (Actually, these models involve several differentspeeds, all less than the runout speed referred to here.) Constant-speed runouts may not be an unrealistic approximation. The steepinitial basal slope (10◦–15◦ average, 25◦ peak) should make fora short-lived acceleration phase. Then, facing a decreasing basalslope, the slide might spend much of the reminder of its movementhistory travelling at a limiting speed. (Frictional landslide modelsin Section 7 quantify this thinking.) The time and velocity numbersin Fig. 4 show a 40 m s−1 landslide that takes about 5 min to run itscourse.
Excavation Vol= 4.6 km340 m s−1
slide front
12 km
Ritter Island Landslide Model
50
50
50
50
50
50
50
50
50
50
50
50
50
50
50
50
50
50
50
50
50
50
50
50
90
90
210
210
300
300
360
time= 0 s
33
67
101
135
168
202
236
270
303
~1000 m
runout
8-15 m s−1
entrained blocks
Figure 4. The Ritter Island landslide model in plan (right) and section(left) view, orientated along bearing 290◦. The section view has considerablevertical exaggeration. Dark cells (1.5 km on a side) in plan view indicateareas of net filling, grey cells indicate areas of net excavation. Depths of netfilling or excavation in metres are listed in the bottom panel.
Landslide energy
Landslides release gravitational potential energy as they fall. Forisland collapses into the ocean, a fraction of the released energygoes to raise the displaced water. The total energy available forother purposes amounts to
EL = g
∫r
d A(r)ρeff(r)�u(r)h(r). (1)
Here, g = 9.8 m s−2, h(r) is the depth below sea level (taken as posi-tive downward) and � u(r) is the excavation or deposition thickness(excavation negative). The integral covers all of the area where�u(r)= 0. ρeff (r) is the effective density of the column of slide material atr. ρeff (r) equals ρs, the density of the slide material (2.5 gm cm−3),for subaerial columns (h(r) < 0). ρeff (r) equals (ρs − ρw) for fullysubmerged columns (h(r) > |�u(r)| > 0). For partly submergedcolumns (|�u(r)| > h(r) > 0), ρeff (r) equals ρs − ρwh(r)/|�u(r)|.EL fixes the energy budget of all landslide processes. The energyof radiated tsunami and all manner of frictional losses draw fromthis pool (tsunami generated during landslides can be considered as
C© 2003 RAS, GJI, 154, 891–902
August 6, 2003 18:4 Geophysical Journal International gji2016
Ritter island collapse tsunami 895
a frictional loss). Note that EL depends only on the initial and finalstate of the slide, not its entire kinematic history. The Ritter Islandcollapse model released 2.0 × 10¹⁶ J of available energy.
4 T H E T S U N A M I M O D E L
Having specified the Ritter Island landslide model, we calculatethe induced tsunami using the theory of Ward (2001) that viewslandslide sources as equivalent vertical displacements of the seafloor. Under this theory in a uniform ocean of depth h, a verticalbottom disturbance ubot
z (r, t) starting at t = 0 stimulates surfacetsunami waveforms (vertical component) at observation point r of
usurfz (r, t) =
∫ ∞
0
dωk(ω)
2πu(ω) cosh(k(ω)h)
∫A(t)
dr0 J0(k(ω)|r − r0|)
×∫ t
0dt0ubot
z (r0, t0) cos[ω(t − t0)]. (2)
In eq. (2), k is the wavenumber, ω is the frequency ω(k) =√gk tanh(kh), dr0 = dx0 dy0, a dot represents ∂/∂t and J 0(x) is the
cylindrical Bessel function of order zero. The second integral coversthe landslide area A(t). Linear tsunami theory, eq. (2), is fully 3-D,and neither depth-averaged nor restricted to long or short waves. Theseafloor displacement function ubot
z (r0, t) takes any shape, thickness,slide velocity, slide direction and time history needed to replicatelandslide kinematics.
To help evaluate the last two integrals in eq. (2), we divide thelandslide region into N square cells as described in the previoussection and place in them, one or more simple slides. A simple slidehas a constant excavation or fill thickness �u, and a step functiontime dependence. At t0 = 0, the simple slide starts along the upslopewidth of the cell centred at r0 and runs down at velocity vr. If theobservation point is not too close to the cell, and t > L/vr, theneq. (2) becomes in a non-uniform depth ocean,
usurfz (r, t) ≈ �uL2
2π
×∑
all N cells
∫ ∞
0dω
k0(ω)J0(ωT (ω, r, r0)) cos[ωt + X (ω, θ )]
u0(ω) cosh[(k0(ω)h(r0)]
× sin X (ω, θ )
X (ω, θ )
sin Y (ω, θ )
Y (ω, θ )G(r, r0)SL(ω, r, r0), (3)
where X (ω , θ ) = L(k0(ω) cos θ − ω/vr)/2; Y (ω, θ ) = W (k0(ω)sin θ )/2, and θ is the angle between the slide direction and the ob-servation point. k0(ω) and u0(ω) are the wavenumber and groupvelocity now specific to frequency ω in water of depth h(r0). Eq. (3)supposes that within each cell h(r0) is constant, but it does vary fromcell to cell over the slide region. The new terms T (ω, r, r0), G(r, r0)and SL (ω, r, r0) in eq. (3) account for changes in traveltime, andwave height due to geometrical spreading and shoaling in oceansof variable depth. These terms are ray-theory-based and their func-tional form can be found in Ward (2001). In overview, the processof generating landslide tsunami involves computing the integral (3),appropriately shifted in space and time to match each ‘fill’ or ‘ex-cavation’, for all N cells in the model for every observation point ofinterest.
The principal advantages of this approach to landslide tsunamicalculation are that: (1) detailed and time-evolving slide historiescan be accommodated (not just initial sea surface ‘lumps’) and (2)full account of frequency dispersion is taken. Tsunami producedby kilometre-scale landslides, such as the Ritter Island event, havedominant wave periods (Ward 2002b) of 100–300 s. Dispersion
is strong at these periods, and by spreading out wave energy, itlimits tsunami damage especially at larger distances. Long-wave orshallow-water techniques developed to model longer-period tsunamifrom earthquakes or mega-scale landslides (e.g. Aida 1978; Satake1987; Johnson & Satake 1996; Satake et al. 2002) ignore dispersion.While frequency-dependent dispersion may be negligible at waveperiods >1000 s, long-wave techniques are not credible for mod-elling shorter-period tsunami such as those produced by Ritter-sizedvolcano collapses.
The principal disadvantage of the present approach is that wecalculate T (ω, r, r0), G(r, r0) and SL(ω, r, r0) using single rays. Indoing so, locations affected by tsunami must have a line of sight tosome part of the landslide. Without wave diffraction and reflection,many places lie in artificial shadows. For landslides that locate nearadjacent islands, this disadvantage is especially evident. In fact, allof the eyewitness reports of the Ritter Island tsunami come fromsites on the coast of New Guinea that lie in ray shadows. To makecomparisons in Section 6, we resort to ‘proxy’ locations near theobservation sites that have some view of the slide.
Tsunami envelope
Contouring tsunami height can make for nearly unreadable regionalmaps due to the small distances that separate successive waves. In-stead we plot E surf
z (r, t), the tsunami envelope. The envelope actslike a sheet draped over the oscillating wave train. It tracks the evolv-ing amplitude of the train without the distraction of many swings insign. The envelope
E surfz (r, t) =
{[usurf
z (r, t)]2 + [
H surfz (r, t)
]2}1/2
(4)
has units of metres. H surfz (r, t), the Hilbert transform of usurf
z (r, t),is obtained by replacing cos ωt by sin ωt in eq. (3).
Tsunami energy
Linear wave theory determines the total tsunami wave energy at anytime as
ET(t) = 1
2ρwg
∫r
d A(r )[E surf
z (r, t)]2
. (5)
The tsunami energy peaks towards the end of the landslide move-ment. Unlike the landslide energy EL, the tsunami energy dependson the entire kinematic history of the landslide. The ratio ET/EL
quantifies the tsunami generation efficiency of each landslide.
5 C O M PA R I S O N W I T H DA M A G EO B S E RVAT I O N S
Close-in damage comparisons
To compare model predictions with after-the-fact damage observa-tions, we use maps of the wave envelope. Fig. 5 shows predictedtsunami envelopes at 2–11 min after the start of the 40 m s−1 land-slide of Fig. 4. Despite having given just 8 per cent of its gravitationalenergy to the tsunami, this landslide pushed waves up to several tensof metres off the coasts of Sakar and Umboi. Although these valuessubstantially exceed the 15 m elevation of the devastation zones seenthere, we argue that waves of the predicted size would be requiredimmediately offshore to produce the observed damage. First, theseshort-period waves would lose a lot of energy offshore crashing onto and transiting fringing reefs. Damage accounts on the west coast
C© 2003 RAS, GJI, 154, 891–902
August 6, 2003 18:4 Geophysical Journal International gji2016
896 S. N. Ward and S. Day
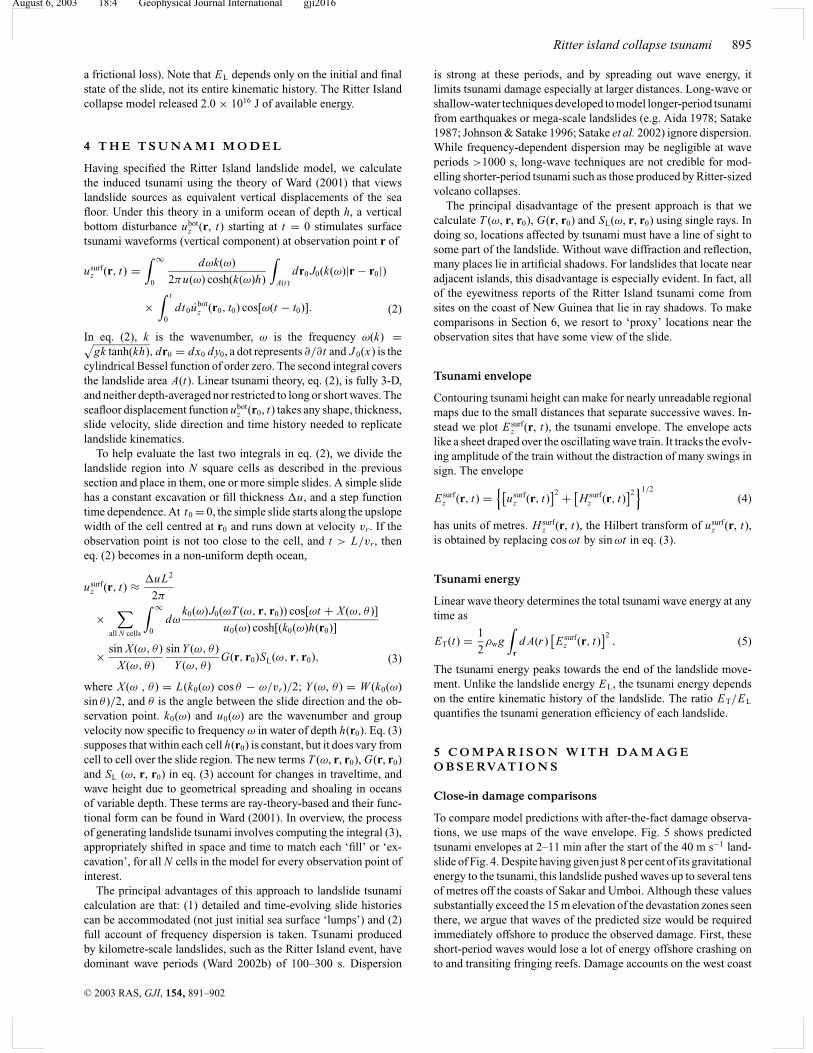
Figure 5. Tsunami envelope heights predicted for the Ritter Island collapseat 2, 5, 8 and 11 min after initiation of the 40 m s−1 event. Note that thestrongest waves are directed northwestward toward Tolokiwa Island. Thenumbers list wave height in metres at selected locations (yellow dots).
of New Britain do note an abundance of ripped-up coral clasts andother debris from offshore (Cooke 1981), so considerable energymust have been lost to seabed erosion before the wave beached.Secondly, the coastal topography is generally shallowly inclinedand heavily vegetated. Resistance of the forest trees and the lim-ited time during which each wave crest had to surge inland beforedrainback, minimize the zones of devastation. Finally, the inlandand upslope limit of the zone of devastation as perceived from thesea, from where the observations of Sakar and Umboi islands were
made (Cooke 1981), probably understate actual inundation heights,which may have been in excess of 20 m.
In contrast to the reports from Sakar and Umboi, damage on thecoast of New Britain was examined close up during the rescue ofsurvivors from an expedition that the tsunami almost wiped out. Thegroup measured a 12–15 m elevation of inundation there directlyfrom tidemarks on standing trees. Fig. 5 predicts somewhat larger,20 m waves offshore New Britain, but we do not consider this asignificant discrepancy. The difference attributes to the short waveperiods and the loss of wave energy on the offshore reefs and incoastal trees.
We infer, along with Johnson (1987) that damage to the west ofRitter Island was greater than to the east on the coast of New Britain.Our tsunami models focus wave energy in the direction of landslidemotion and reproduce this damage pattern. The bright colours inFig. 5 highlight the wave amplification toward the northwest whereislands as far away as Tolokiwa suffer more than the closer westerncoast of New Britain.
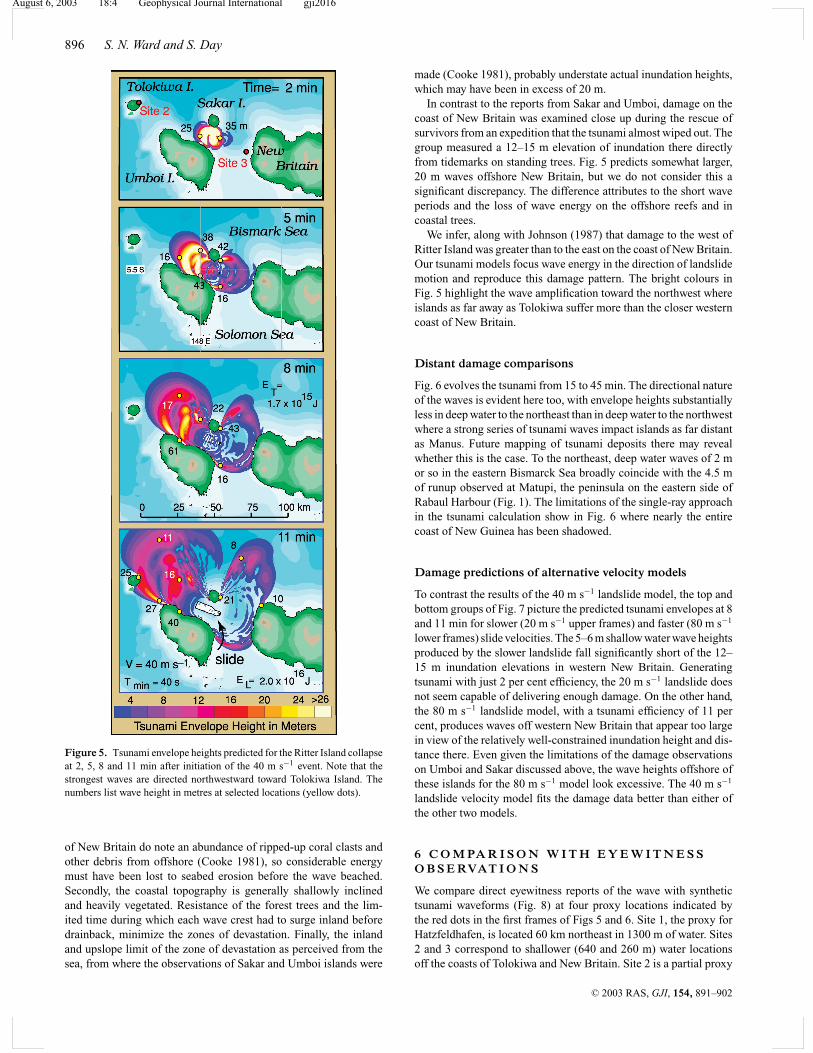
Distant damage comparisons
Fig. 6 evolves the tsunami from 15 to 45 min. The directional natureof the waves is evident here too, with envelope heights substantiallyless in deep water to the northeast than in deep water to the northwestwhere a strong series of tsunami waves impact islands as far distantas Manus. Future mapping of tsunami deposits there may revealwhether this is the case. To the northeast, deep water waves of 2 mor so in the eastern Bismarck Sea broadly coincide with the 4.5 mof runup observed at Matupi, the peninsula on the eastern side ofRabaul Harbour (Fig. 1). The limitations of the single-ray approachin the tsunami calculation show in Fig. 6 where nearly the entirecoast of New Guinea has been shadowed.
Damage predictions of alternative velocity models
To contrast the results of the 40 m s−1 landslide model, the top andbottom groups of Fig. 7 picture the predicted tsunami envelopes at 8and 11 min for slower (20 m s−1 upper frames) and faster (80 m s−1
lower frames) slide velocities. The 5–6 m shallow water wave heightsproduced by the slower landslide fall significantly short of the 12–15 m inundation elevations in western New Britain. Generatingtsunami with just 2 per cent efficiency, the 20 m s−1 landslide doesnot seem capable of delivering enough damage. On the other hand,the 80 m s−1 landslide model, with a tsunami efficiency of 11 percent, produces waves off western New Britain that appear too largein view of the relatively well-constrained inundation height and dis-tance there. Even given the limitations of the damage observationson Umboi and Sakar discussed above, the wave heights offshore ofthese islands for the 80 m s−1 model look excessive. The 40 m s−1
landslide velocity model fits the damage data better than either ofthe other two models.
6 C O M PA R I S O N W I T H E Y E W I T N E S SO B S E RVAT I O N S
We compare direct eyewitness reports of the wave with synthetictsunami waveforms (Fig. 8) at four proxy locations indicated bythe red dots in the first frames of Figs 5 and 6. Site 1, the proxy forHatzfeldhafen, is located 60 km northeast in 1300 m of water. Sites2 and 3 correspond to shallower (640 and 260 m) water locationsoff the coasts of Tolokiwa and New Britain. Site 2 is a partial proxy
C© 2003 RAS, GJI, 154, 891–902
August 6, 2003 18:4 Geophysical Journal International gji2016
Ritter island collapse tsunami 897
Figure 6. Tsunami envelope heights predicted for the later stages of theRitter Island collapse event. The panels show the wave evolution from 15 to45 min after the start of the 40 m s−1 event.
Figure 7. Tsunami envelope heights predicted for the early stages of theRitter Island tsunami with alternative landslide velocities. The top and bot-tom groups are for 20 and 80 m s−1 slides.
for Kelana, which may have received waves that had travelled botheast and west of Umboi. Site 4 is located in deep (3200 m) watersouth of the Dampier Strait. Waves would have propagated fromhere to Finschafen and possibly to Kelana. To make a comparisonwith onshore observations, the waveforms at the deep water proxysites were shoaled to a hypothetical shallow water (h(r ) ∼ 30 m)
C© 2003 RAS, GJI, 154, 891–902
August 6, 2003 18:4 Geophysical Journal International gji2016
898 S. N. Ward and S. Day
Ritter Island Landslide Tsunami 1888
10 20 30 6050 minutes40
Est. Run-up: 5.4 m
Est. Run-up: 16.4 m
Est. Run-up: 12.1 m
Site 1:H=1368m
Site 2:H=640m
Site 3:H= 262m
Site 4: H= 3179m
Est. Run-up: 10.7 m
Est. Run-up: 33.1 m
Est. Run-up: 13.8 m
Est. Run-up: 9.0 m
Site 1:H=1368m
Site 2:H=640m
Site 3:H= 262m
Site 4: H= 3179m
Est. Run-up: 16.5 m
Est. Run-up: 55.0 m
Est. Run-up: 25.9 m
Est. Run-up: 12.1 m
V = 20 m s−1
Site 1:H=1368m
Site 2:H=640m
Site 3:H= 262m
Site 4: H= 3179m
V = 40 m s−1
V = 80 m s−1
Est. Run-up: 5.4 m
25m
25m
25m
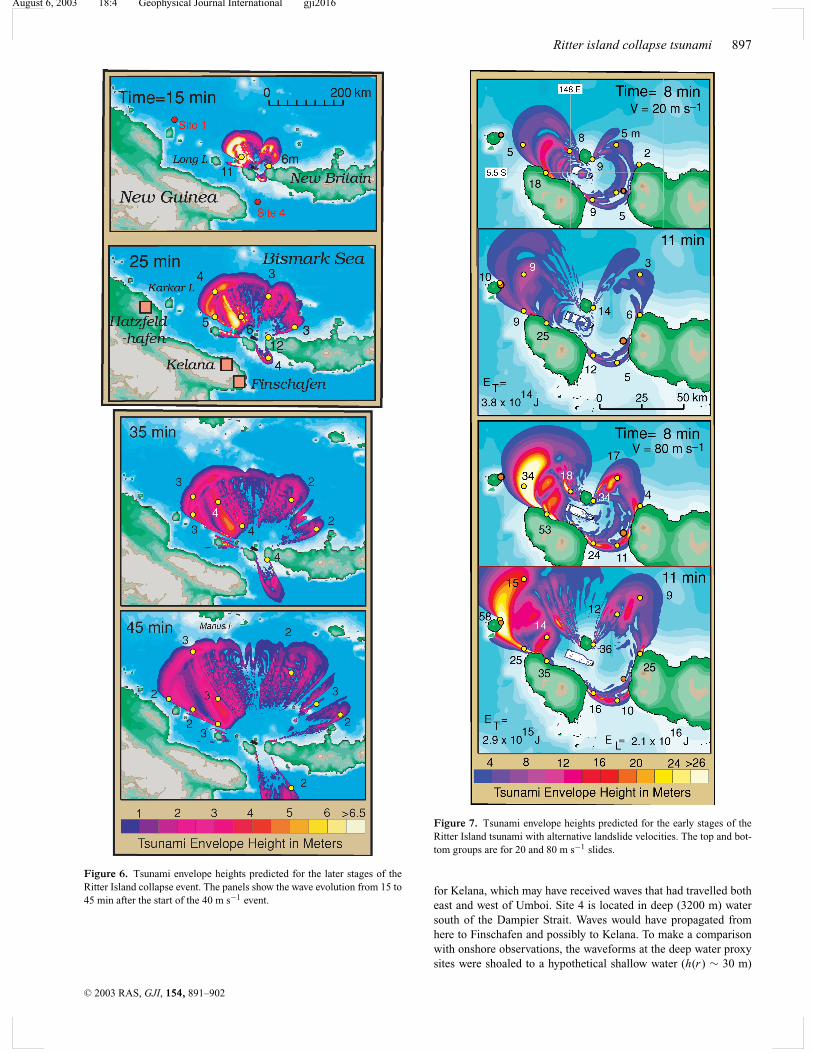
Figure 8. Synthetic tsunami wave trains from 20, 40 and 80 m s−1 land-slides at the four offshore proxy sites indicated by red spots in Figs 5 and6. H denotes the actual water depth at the site. To estimate wave size on ahypothetical shores at these sites, shoaling corrections to shallow water havebeen included and a runup height was predicted using eq. (6). The time inminutes after the start of the landslide is marked along the top.
depth. Then, the amplitudes A(r ) of these shoaled waves were scaledto a runup height R by (Ward & Asphaug 2003)
R = A(r)4/5h(r)1/5. (6)
Wave initial motion
The simulation correctly predicts an initial drop of sea level at Fin-schafen (Site 4) and an initial rise at Hatzfeldhafen (Site 1). Dipolefirst motions like this are typical in landslide-generated tsunami—the first wave in the direction of land sliding is positive, whereasin the opposite direction the first wave, generated by draw-downover the excavation is negative.
Wave periods and tsunami duration
Recall that all observers emphasized a 3–4 min wave period. In-spection of the maregrams in Fig. 8 reveals that waves of this periodindeed dominate everywhere and confirms that the tsunami origi-nated from the landslide. Fig. 9 plots the amplitude spectrum foreach of the records in Fig. 8. Virtually all the tsunami energy liesbetween 1 and 5 min periods. In the forward direction, toward Sites 1and 2, the peak near 3 min matches the timed period at Hatzfeld-hafen. The fact that 3 min waves also dominate at Kelana suggests
Wave Period
234610 90 70 60 50 40
Site 1
Site 2
Site 3
Site 4
SecondsMinutes
Tsunami Amplitude Spectra
40 m s−1
80 m s−1
1000 m-s
20 m s−1
Figure 9. Amplitude spectra of the tsunami waveforms in Fig. 8. Contrastthe smooth broad peaks in the spectra at fore-Sites 1 and 2 and complexspectra at back-Sites 3 and 4.
that much of the wave energy arriving there travelled via the channelwest of Umboi, rather than via Dampier Strait. Note that fore-Sites 1and 2 show orderly spectra that become relatively enhanced at shortperiod as the slide velocity increases. In contrast, the back-Sites 3and 4 show chaotic spectral changes to different landslide speeds.The orderly versus chaotic appearance shows in the records of Fig. 8as well. Site 4 gives a good qualitative match with the irregular watermovements at Finschafen.
The increasing duration of the wave trains (15, 25, 40, >50 min)with increasing distance (in the order Site 3, Site 2, Site 4, Site 1)in Fig. 8 is a consequence of wave dispersion. While unaccountedfor reflections and reverberations would extend the duration of ac-tual waves, we suggest that dispersion principally causes the longerduration tsunami at distant Hatzfeldhafen (2.5 h) than closer in atKelana or Finschafen (1 h and 30 min, respectively).
Time to maximum wave height
The synthetic waveforms at the fore-Sites 1 and 2 predict maximumwave heights close to the beginning of the wave trains. Back-sites tothe southeast show the third or fourth wave being the highest. Thispattern seems consistent with the observation that the fourth wavewas the highest at Kelana, although as noted above, the wave perioddata indicate a western origin for the waves there.
The most unusual eyewitness observation was that tsunami heightpeaked at Hatzfeldhafen at about 8 AM, over an hour after the firstwaves arrived. A notable feature of the synthetic waveforms in Fig. 8(also evident in Fig. 6) is that a second peak in wave height followsthe first by an interval that varies with landslide velocity and distancefrom the source. This second peak is most evident to the north andwest (fore-Sites 1 and 2) in the direction of landslide motion. The
C© 2003 RAS, GJI, 154, 891–902
August 6, 2003 18:4 Geophysical Journal International gji2016
Ritter island collapse tsunami 899
delayed second peak in amplitude corresponds to a second peak inthe wave spectra at 45–55 s. The second peak clearly registers inthe 40 and 80 m s−1 spectra in Fig. 9. The waves in the second peaktravel more slowly than the dominant 3 min waves and hence lagbehind. Although the second spectral peak is much weaker than thefirst, it is possible that the harbour at Hatzfeldhafen resonated tothe later arriving, shorter-period waves to produce the 1 h delay inmaximum wave height. Harbour resonance cannot be evaluated withthe presently available data, but because no similar effect occurredelsewhere, the late peak in tsunami size at Hatzfeldhafen must bedue to local conditions.
Wave heights
Wave heights computed at the proxy sites should exceed those atmission sites that did not have line-of-sight exposure. Thus, the 8–10 m waves seen at Kelana and Hatzfeldhafen, should correspond to>10 m waves shoaling at the proxy sites. The 20 m s−1 landslide ofFig. 8 bears waves much smaller than 10 m at Sites 1 and 4 and notmuch larger at Site 2, closer to the source than Kelana. A landslidetravelling at 20 m s−1 does not seem potent enough to produce wavesas large as those observed at Kelana and Hatzfeldhafen. Conversely,waves produced from the 80 m s−1 landslide appear too large at alldistances, even allowing for spreading, dispersion and refraction. Weconclude that the most plausible source for the 1888 Ritter Islandtsunami waves is a landslide travelling at least 40 m s−1. Velocitiesof 80 m s−1 do not fit the data well, but cannot be excluded.
It should be noted that our model assumes a landslide volume atthe upper end of the range proposed by Johnson (1987). In termsof tsunami production, landslide velocity and volume are broadlyinterchangeable if the plan form of the slide remains similar. Thus, asmaller, thinner landslide produces tsunami comparable to a slower,thicker landslide. Although we doubt that landslide volume short-falled 4–5 km3, we cannot exclude a landslide velocity as high as80 m s−1 if it did.
7 S I M P L E M O D E L S O F L A N D S L I D EM E C H A N I C S
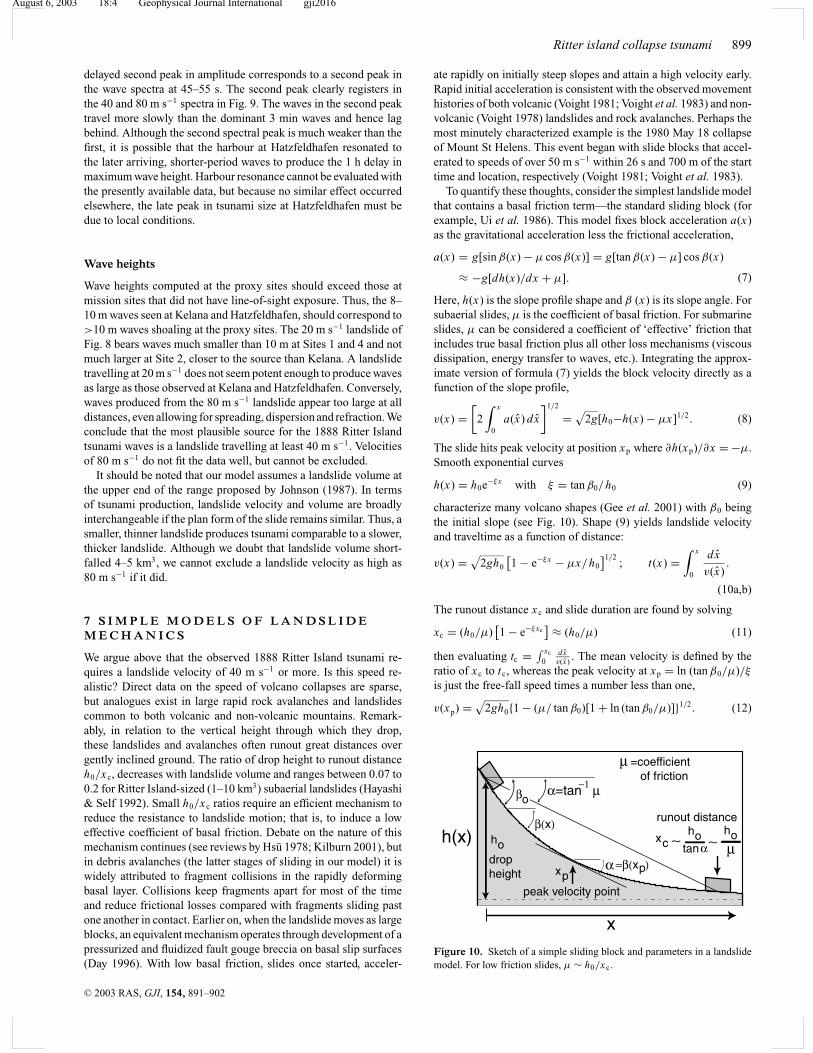
We argue above that the observed 1888 Ritter Island tsunami re-quires a landslide velocity of 40 m s−1 or more. Is this speed re-alistic? Direct data on the speed of volcano collapses are sparse,but analogues exist in large rapid rock avalanches and landslidescommon to both volcanic and non-volcanic mountains. Remark-ably, in relation to the vertical height through which they drop,these landslides and avalanches often runout great distances overgently inclined ground. The ratio of drop height to runout distanceh0/x c, decreases with landslide volume and ranges between 0.07 to0.2 for Ritter Island-sized (1–10 km3) subaerial landslides (Hayashi& Self 1992). Small h0/x c ratios require an efficient mechanism toreduce the resistance to landslide motion; that is, to induce a loweffective coefficient of basal friction. Debate on the nature of thismechanism continues (see reviews by Hsu 1978; Kilburn 2001), butin debris avalanches (the latter stages of sliding in our model) it iswidely attributed to fragment collisions in the rapidly deformingbasal layer. Collisions keep fragments apart for most of the timeand reduce frictional losses compared with fragments sliding pastone another in contact. Earlier on, when the landslide moves as largeblocks, an equivalent mechanism operates through development of apressurized and fluidized fault gouge breccia on basal slip surfaces(Day 1996). With low basal friction, slides once started, acceler-
ate rapidly on initially steep slopes and attain a high velocity early.Rapid initial acceleration is consistent with the observed movementhistories of both volcanic (Voight 1981; Voight et al. 1983) and non-volcanic (Voight 1978) landslides and rock avalanches. Perhaps themost minutely characterized example is the 1980 May 18 collapseof Mount St Helens. This event began with slide blocks that accel-erated to speeds of over 50 m s−1 within 26 s and 700 m of the starttime and location, respectively (Voight 1981; Voight et al. 1983).
To quantify these thoughts, consider the simplest landslide modelthat contains a basal friction term—the standard sliding block (forexample, Ui et al. 1986). This model fixes block acceleration a(x)as the gravitational acceleration less the frictional acceleration,
a(x) = g[sin β(x) − µ cos β(x)] = g[tan β(x) − µ] cos β(x)
≈ −g[dh(x)/dx + µ]. (7)
Here, h(x) is the slope profile shape and β (x) is its slope angle. Forsubaerial slides, µ is the coefficient of basal friction. For submarineslides, µ can be considered a coefficient of ‘effective’ friction thatincludes true basal friction plus all other loss mechanisms (viscousdissipation, energy transfer to waves, etc.). Integrating the approx-imate version of formula (7) yields the block velocity directly as afunction of the slope profile,
v(x) =[
2∫ x
0a(x) dx
]1/2
=√
2g[h0−h(x) − µx]1/2. (8)
The slide hits peak velocity at position xp where ∂h(xp)/∂x = −µ.Smooth exponential curves
h(x) = h0e−ξ x with ξ = tan β0/h0 (9)
characterize many volcano shapes (Gee et al. 2001) with β0 beingthe initial slope (see Fig. 10). Shape (9) yields landslide velocityand traveltime as a function of distance:
v(x) = √2gh0
[1 − e−ξ x − µx/h0
]1/2; t(x) =
∫ x
0
dx
v(x).
(10a,b)
The runout distance x c and slide duration are found by solving
xc = (h0/µ)[1 − e−ξ xc
] ≈ (h0/µ) (11)
then evaluating tc = ∫ xc
0dxv(x) . The mean velocity is defined by the
ratio of x c to t c, whereas the peak velocity at xp = ln (tan β0/µ)/ξis just the free-fall speed times a number less than one,
v(xp) = √2gh0{1 − (µ/ tan β0)[1 + ln (tan β0/µ)]}1/2. (12)
β(x)
α=tan µ−1
xc
xp
βo
ho
α
runout distance
drop height
peak velocity point
h(x)
x
µ =coefficient of friction
hotanα∼
hoµ∼
=β(x )p
Figure 10. Sketch of a simple sliding block and parameters in a landslidemodel. For low friction slides, µ ∼ h0/xc.
C© 2003 RAS, GJI, 154, 891–902
August 6, 2003 18:4 Geophysical Journal International gji2016
900 S. N. Ward and S. Day
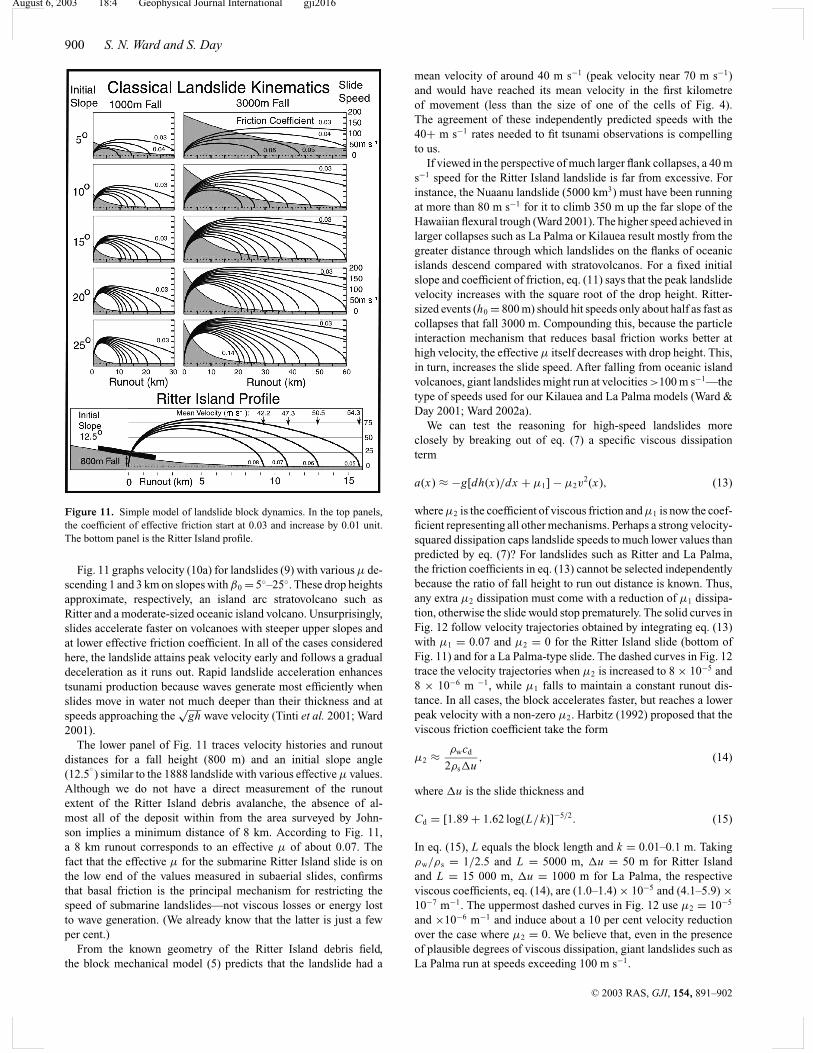
Figure 11. Simple model of landslide block dynamics. In the top panels,the coefficient of effective friction start at 0.03 and increase by 0.01 unit.The bottom panel is the Ritter Island profile.
Fig. 11 graphs velocity (10a) for landslides (9) with various µ de-scending 1 and 3 km on slopes with β0 = 5◦–25◦. These drop heightsapproximate, respectively, an island arc stratovolcano such asRitter and a moderate-sized oceanic island volcano. Unsurprisingly,slides accelerate faster on volcanoes with steeper upper slopes andat lower effective friction coefficient. In all of the cases consideredhere, the landslide attains peak velocity early and follows a gradualdeceleration as it runs out. Rapid landslide acceleration enhancestsunami production because waves generate most efficiently whenslides move in water not much deeper than their thickness and atspeeds approaching the
√gh wave velocity (Tinti et al. 2001; Ward
2001).The lower panel of Fig. 11 traces velocity histories and runout
distances for a fall height (800 m) and an initial slope angle(12.5
◦) similar to the 1888 landslide with various effective µ values.
Although we do not have a direct measurement of the runoutextent of the Ritter Island debris avalanche, the absence of al-most all of the deposit within from the area surveyed by John-son implies a minimum distance of 8 km. According to Fig. 11,a 8 km runout corresponds to an effective µ of about 0.07. Thefact that the effective µ for the submarine Ritter Island slide is onthe low end of the values measured in subaerial slides, confirmsthat basal friction is the principal mechanism for restricting thespeed of submarine landslides—not viscous losses or energy lostto wave generation. (We already know that the latter is just a fewper cent.)
From the known geometry of the Ritter Island debris field,the block mechanical model (5) predicts that the landslide had a
mean velocity of around 40 m s−1 (peak velocity near 70 m s−1)and would have reached its mean velocity in the first kilometreof movement (less than the size of one of the cells of Fig. 4).The agreement of these independently predicted speeds with the40+ m s−1 rates needed to fit tsunami observations is compellingto us.
If viewed in the perspective of much larger flank collapses, a 40 ms−1 speed for the Ritter Island landslide is far from excessive. Forinstance, the Nuaanu landslide (5000 km3) must have been runningat more than 80 m s−1 for it to climb 350 m up the far slope of theHawaiian flexural trough (Ward 2001). The higher speed achieved inlarger collapses such as La Palma or Kilauea result mostly from thegreater distance through which landslides on the flanks of oceanicislands descend compared with stratovolcanos. For a fixed initialslope and coefficient of friction, eq. (11) says that the peak landslidevelocity increases with the square root of the drop height. Ritter-sized events (h0 = 800 m) should hit speeds only about half as fast ascollapses that fall 3000 m. Compounding this, because the particleinteraction mechanism that reduces basal friction works better athigh velocity, the effective µ itself decreases with drop height. This,in turn, increases the slide speed. After falling from oceanic islandvolcanoes, giant landslides might run at velocities >100 m s−1—thetype of speeds used for our Kilauea and La Palma models (Ward &Day 2001; Ward 2002a).
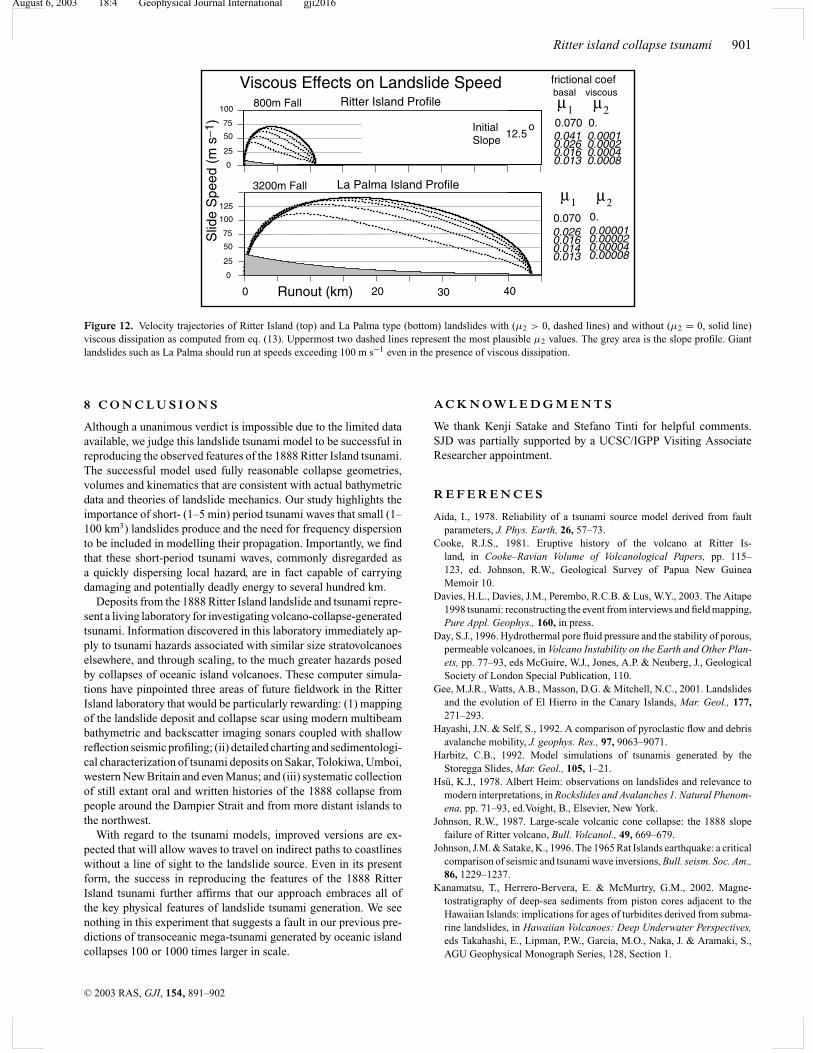
We can test the reasoning for high-speed landslides moreclosely by breaking out of eq. (7) a specific viscous dissipationterm
a(x) ≈ −g[dh(x)/dx + µ1] − µ2v2(x), (13)
where µ2 is the coefficient of viscous friction and µ1 is now the coef-ficient representing all other mechanisms. Perhaps a strong velocity-squared dissipation caps landslide speeds to much lower values thanpredicted by eq. (7)? For landslides such as Ritter and La Palma,the friction coefficients in eq. (13) cannot be selected independentlybecause the ratio of fall height to run out distance is known. Thus,any extra µ2 dissipation must come with a reduction of µ1 dissipa-tion, otherwise the slide would stop prematurely. The solid curves inFig. 12 follow velocity trajectories obtained by integrating eq. (13)with µ1 = 0.07 and µ2 = 0 for the Ritter Island slide (bottom ofFig. 11) and for a La Palma-type slide. The dashed curves in Fig. 12trace the velocity trajectories when µ2 is increased to 8 × 10⁻⁵ and8 × 10−6 m −1, while µ1 falls to maintain a constant runout dis-tance. In all cases, the block accelerates faster, but reaches a lowerpeak velocity with a non-zero µ2. Harbitz (1992) proposed that theviscous friction coefficient take the form
µ2 ≈ ρwcd
2ρs�u, (14)
where �u is the slide thickness and
Cd = [1.89 + 1.62 log(L/k)]−5/2. (15)
In eq. (15), L equals the block length and k = 0.01–0.1 m. Takingρw/ρs = 1/2.5 and L = 5000 m, �u = 50 m for Ritter Islandand L = 15 000 m, �u = 1000 m for La Palma, the respectiveviscous coefficients, eq. (14), are (1.0–1.4) × 10−5 and (4.1–5.9) ×10−7 m−1. The uppermost dashed curves in Fig. 12 use µ2 = 10−5
and ×10−6 m−1 and induce about a 10 per cent velocity reductionover the case where µ2 = 0. We believe that, even in the presenceof plausible degrees of viscous dissipation, giant landslides such asLa Palma run at speeds exceeding 100 m s−1.
C© 2003 RAS, GJI, 154, 891–902
August 6, 2003 18:4 Geophysical Journal International gji2016
Ritter island collapse tsunami 901
0.070 0. 0.041 0.0001 0.026 0.0002 0.016 0.0004 0.013 0.0008
0.070 0. 0.026 0.00001 0.016 0.00002 0.014 0.00004 0.013 0.00008
Ritter Island Profile
La Palma Island Profile
µ1 µ2
Viscous Effects on Landslide Speed
µ1 µ2S
lide
Spe
ed (
m s
−1)
basal viscousfrictional coef
800m Fall
o
3200m Fall
40200 Runout (km) 0
50
75
25
100
125
Initial Slope
12.5
0
50
75
25
100
30
Figure 12. Velocity trajectories of Ritter Island (top) and La Palma type (bottom) landslides with (µ2 > 0, dashed lines) and without (µ2 = 0, solid line)viscous dissipation as computed from eq. (13). Uppermost two dashed lines represent the most plausible µ2 values. The grey area is the slope profile. Giantlandslides such as La Palma should run at speeds exceeding 100 m s−1 even in the presence of viscous dissipation.
8 C O N C L U S I O N S
Although a unanimous verdict is impossible due to the limited dataavailable, we judge this landslide tsunami model to be successful inreproducing the observed features of the 1888 Ritter Island tsunami.The successful model used fully reasonable collapse geometries,volumes and kinematics that are consistent with actual bathymetricdata and theories of landslide mechanics. Our study highlights theimportance of short- (1–5 min) period tsunami waves that small (1–100 km3) landslides produce and the need for frequency dispersionto be included in modelling their propagation. Importantly, we findthat these short-period tsunami waves, commonly disregarded asa quickly dispersing local hazard, are in fact capable of carryingdamaging and potentially deadly energy to several hundred km.
Deposits from the 1888 Ritter Island landslide and tsunami repre-sent a living laboratory for investigating volcano-collapse-generatedtsunami. Information discovered in this laboratory immediately ap-ply to tsunami hazards associated with similar size stratovolcanoeselsewhere, and through scaling, to the much greater hazards posedby collapses of oceanic island volcanoes. These computer simula-tions have pinpointed three areas of future fieldwork in the RitterIsland laboratory that would be particularly rewarding: (1) mappingof the landslide deposit and collapse scar using modern multibeambathymetric and backscatter imaging sonars coupled with shallowreflection seismic profiling; (ii) detailed charting and sedimentologi-cal characterization of tsunami deposits on Sakar, Tolokiwa, Umboi,western New Britain and even Manus; and (iii) systematic collectionof still extant oral and written histories of the 1888 collapse frompeople around the Dampier Strait and from more distant islands tothe northwest.
With regard to the tsunami models, improved versions are ex-pected that will allow waves to travel on indirect paths to coastlineswithout a line of sight to the landslide source. Even in its presentform, the success in reproducing the features of the 1888 RitterIsland tsunami further affirms that our approach embraces all ofthe key physical features of landslide tsunami generation. We seenothing in this experiment that suggests a fault in our previous pre-dictions of transoceanic mega-tsunami generated by oceanic islandcollapses 100 or 1000 times larger in scale.
A C K N O W L E D G M E N T S
We thank Kenji Satake and Stefano Tinti for helpful comments.SJD was partially supported by a UCSC/IGPP Visiting AssociateResearcher appointment.
R E F E R E N C E S
Aida, I., 1978. Reliability of a tsunami source model derived from faultparameters, J. Phys. Earth, 26, 57–73.
Cooke, R.J.S., 1981. Eruptive history of the volcano at Ritter Is-land, in Cooke–Ravian Volume of Volcanological Papers, pp. 115–123, ed. Johnson, R.W., Geological Survey of Papua New GuineaMemoir 10.
Davies, H.L., Davies, J.M., Perembo, R.C.B. & Lus, W.Y., 2003. The Aitape1998 tsunami: reconstructing the event from interviews and field mapping,Pure Appl. Geophys., 160, in press.
Day, S.J., 1996. Hydrothermal pore fluid pressure and the stability of porous,permeable volcanoes, in Volcano Instability on the Earth and Other Plan-ets, pp. 77–93, eds McGuire, W.J., Jones, A.P. & Neuberg, J., GeologicalSociety of London Special Publication, 110.
Gee, M.J.R., Watts, A.B., Masson, D.G. & Mitchell, N.C., 2001. Landslidesand the evolution of El Hierro in the Canary Islands, Mar. Geol., 177,271–293.
Hayashi, J.N. & Self, S., 1992. A comparison of pyroclastic flow and debrisavalanche mobility, J. geophys. Res., 97, 9063–9071.
Harbitz, C.B., 1992. Model simulations of tsunamis generated by theStoregga Slides, Mar. Geol., 105, 1–21.
Hsu, K.J., 1978. Albert Heim: observations on landslides and relevance tomodern interpretations, in Rockslides and Avalanches 1. Natural Phenom-ena, pp. 71–93, ed.Voight, B., Elsevier, New York.
Johnson, R.W., 1987. Large-scale volcanic cone collapse: the 1888 slopefailure of Ritter volcano, Bull. Volcanol., 49, 669–679.
Johnson, J.M. & Satake, K., 1996. The 1965 Rat Islands earthquake: a criticalcomparison of seismic and tsunami wave inversions, Bull. seism. Soc. Am.,86, 1229–1237.
Kanamatsu, T., Herrero-Bervera, E. & McMurtry, G.M., 2002. Magne-tostratigraphy of deep-sea sediments from piston cores adjacent to theHawaiian Islands: implications for ages of turbidites derived from subma-rine landslides, in Hawaiian Volcanoes: Deep Underwater Perspectives,eds Takahashi, E., Lipman, P.W., Garcia, M.O., Naka, J. & Aramaki, S.,AGU Geophysical Monograph Series, 128, Section 1.
C© 2003 RAS, GJI, 154, 891–902
August 6, 2003 18:4 Geophysical Journal International gji2016
902 S. N. Ward and S. Day
Kawata, Y. et al., 1999. Tsunami in Papua New Guinea was as intense asfirst thought, EOS, Trans. Am. geophys. Un., 80 101 104–105.
Kilburn, C.R.J., 2001. The flow of giant rock landslides, in Paradoxes inGeology, pp. 245–265, eds Briegel, U. & Xiao, W., Elsevier, Amsterdam.
Latter, J.H., 1981. Tsunamis of volcanic origin; summary of causes, withparticular reference to Krakatoa, 1883, Bull. Volcanol., 44, 467–499.
McSaveney, M.J., Goff, J.R., Darby, D.J., Goldsmith, P., Barnett, A., Elliot,S. & Nongkas, M., 2000. The 17 July 1998 tsunami, Papua New Guinea;evidence and initial interpretation, Mar. Geol., 170, 81–92.
Satake, K., 1987. Inversion of tsunami waveforms for the estimation of afault heterogeneity: method and numerical experiments, J. Phys. Earth,35, 241–254.
Satake, K. & Kato, Y., 2001. The 1741 Oshima–Oshima eruption: extent andvolume of submarine debris avalanche, Geophys. Res. Lett., 28, 427–430.
Satake, K., Smith, J.R. & Shinozaki, K., 2002. Three-dimensional recon-struction and Tsunami model of the Nuuanu and Wailau Giant Landslides,Hawaii, in Hawaiian Volcanoes: Deep Underwater Perspectives, edsTakahashi, E., Lipman, P.W., Garcia, M.O., Naka, J. & Aramaki, S., AGUGeophysical Monograph Series, 128, Section 3.
Self, S. & Rampino, M.R., 1981. The 1883 eruption of Krakatau, Nature,294, 699–704.
Siebert, L., Glicken, H. & Ui. T., 1987. Volcanic hazards from Bezymiannyand Bandai-type eruptions, Bull. Volcanol., 49, 435–459.
Simkin, T. & Fiske, R.S., 1983. Krakatau 1883: the Volcanic Eruption andits Effects, Smithsonian Institute Press, Washington, p. 464.
Tinti, S., Bortolucci, E. & Chiavettier, C., 2001. Tsunami excitation by sub-marine slides in shallow-water approximation, Pure Appl. Geophys., 158,759–797.
Ui, T., Yamamoto, H & Suzuki-Kamata, K., 1986. Characterization of debrisavalanche deposits in Japan, J. Volc. Geotherm. Res., 29, 231–243.
Voight, B., ed. 1978. Rockslides and Avalanches 1: Natural Phenomena,Elsevier, Amsterdam, p. 833.
Voight, B., 1981. Time scale for the first moments of the May 18 eruption,in The 1980 Eruptions of Mount St Helens, Washington, pp. 69–86, edsLipman, P.W. & Mullineaux, D.R., US Geol. Surv. Prof. Paper 1250.
Voight, B., Janda, R.J., Glicken, H. & Douglass, P.M., 1983. Nature andmechanics of the Mount St Helens rockslide-avalanche of 18 May 1980,Geotechnique, 33, 243–273.
Ward, S.N., 2001. Landslide tsunami, J. geophys. Res., 106, 11 201–11 216.Ward, S.N., 2002a. Slip-sliding away, Nature, 415, 973–974.Ward, S.N., 2002b. Tsunamis, in Encyclopedia of Physical Science and Tech-
nology, Vol. 17, 3rd edn, pp. 175–191, Academic, New York.Ward, S.N. & Asphaug, E., 2003. Asteroid impact tsunami of 2880 March
16, Geophys. J. Int., 153, F6–F10.Ward, S.N. & Day, S.J., 2001. Cumbre Vieja Volcano—potential collapse and
tsunami at La Palma, Canary Islands, Geophys. Res. Lett., 28, 397–400.
C© 2003 RAS, GJI, 154, 891–902


![Climate change as a driver of volcano lateral collapse [Bill McGuire]](https://img.pdfslide.net/doc/110x75/558535c0d8b42a30308b5244/climate-change-as-a-driver-of-volcano-lateral-collapse-bill-mcguire.jpg)