Embed Size (px)
Citation preview
1
RIVER CHANNEL GEOMETRY AND RATING CURVE ESTIMATION USING HEIGHT ABOVE THE NEAREST DRAINAGE
Xing Zheng, David G. Tarboton, David R. Maidment, Yan Y. Liu, Paola Passalacqua
Ph.D. Student (Zheng) and Professor (Maidment, Passalacqua), Center for Research in
Water Resources, University of Texas at Austin,10100 Burnet Rd., Austin, Texas 78758;
and Professor (Tarboton), Civil and Environmental Engineering Department, Utah State
University, Logan, Utah; and Senior Research Programmer (Liu), CyberGIS Center,
University of Illinois at Urbana-Champaign, Urbana, Illinois (E-Mail/Zheng:
ABSTRACT: River channel geometry is an important input to hydraulic and hydrologic
models. Traditional approaches to quantify river geometry have involved surveyed river
cross-sections, which are complex to extend to ungauged basins. In this paper, we
describe a method for developing a synthetic rating curve relating flow to water level in a
stream reach based on reach-averaged channel geometry properties developed using the
Height Above Nearest Drainage (HAND) method. HAND uses a digital elevation model
of the landscape and computes the elevation difference between each land surface cell
and the stream bed cell to which it drains. Taking increments in water level in the stream,
HAND defines the inundation zone and a water depth grid within this zone, and the
channel characteristics are defined from this water depth grid. We evaluate an application
of our method on the Blanco River (TX) using 10-meter terrain data from the USGS
3DEP Elevation dataset. We compare the reach-average stage-river geometry
relationships and rating curves to those from calibrated HEC-RAS models. The results
demonstrate that after some adjustment, the river geometry information and rating curves
derived from HAND using national-coverage datasets are comparable to those applied in
local hydraulic models, built using more data intensive traditional cross section analysis.
KEY TERMS: hydrologic terrain analysis; river geometry; rating curve; HAND; flooding
Revised and submitted to the Journal of the American Water Resources Association (JAWRA), October 18, 2017.

2
INTRODUCTION
Flooding is the most threatening natural disaster worldwide considering the
fatalities and property damage it causes. It makes up about 40% of all natural disasters
worldwide and causes about half of all natural hazard fatalities (Noji, 1991; Ohl et al.,
2001). Under a changing climate, the magnitude (Knox, 1993) and frequency (Milly,
2002) of floods may increase significantly, which, together with growing population and
expanding urbanization, results in more serious and frequent flood hazards. For the 136
coastal cities across the world alone, the annual losses due to flooding have been
projected to increase to $52 billion per year by 2050 (the 2005 estimate was $6 billion)
considering socio-economic impacts alone, and this number could even reach $1 trillion
if other factors are considered (Hallegatte et al., 2013).
Inundation maps show the spatial extent of flooding and play an important role in
emergency response during flood events (Apel et al., 2009; Maidment, 2016). Accurately
mapping flood inundation extent requires a comprehensive description of the geometry of
the channel and floodplain, since flooding water is routed by the river fluvial system
(Maidment, 1992). Traditional approaches to quantifying river geometry rely on
measurements of river cross sections. Attempts to combine many independently
developed local HEC-RAS models have failed due to variations in model development,
overlaps in cross sections from one local model to another, and gaps in coverage of some
streams (Zheng, 2015).
Other approaches to obtaining channel geometry without introducing cross
sectional information have also been investigated, such as hydraulic geometry
relationships (Leopold et al., 1953), and remotely sensed imagery inference (Pavelsky
and Smith, 2008),. Andreadis et al., (2013) developed a simple global river bankfull
width and depth database using a regression relationship between bankfull discharge,
drainage area and hydraulic geometry characteristics. Yamazaki et al., (2014) applied an
algorithm that calculates the distance from remotely-sensed water body edge to the river
centerlines following flow directions, to produce the Global Width Database for Large
Rivers (GWD-LR) using the SRTM Water Body Database and the HydroSHED
(Hydrological data and maps based on SHuttle Elevation Derivatives at multiple scales)
3
flow direction raster. Both bankfull width and effective river width without islands were
computed for river channels between 60S and 60N (Yamazaki et al., 2014).
A so-called first fine-resolution, continental-scale river centerline and width
database, the Landsat-derived North American River Width (NARWidth) dataset, has
been developed (Allen and Pavelsky, 2015). It includes rivers ranging from
approximately fourth to tenth Strahler stream order, the width of which are wider than 30
meter at annual mean discharge. Some limitations are found in these river geometry
datasets: first, the resolution of the river network is not high enough to use in flooding
studies of local streams. Taking Texas as an example, there are 20,004 HydroSHEDS
flowlines in Texas, while the number of flowlines is 101,240 in the medium-resolution
National Hydrograph Dataset Plus (NHDPlus) used in the National Water Model.
Therefore, numerous local streams, which are critical during flood events, are not
detected in the existing global river width and depth database. Second, only the bankfull
width and depth are provided instead of a continuous relationship between stage height
and channel properties, which limits the applicability of this dataset for inundation
mapping.
While prior research using remotely sensed data or statistical approaches to
investigate river geometry and rating curve has resulted in useful insights and general
laws (Getirana et al., 2013; Paris et al., 2016; Garambois et al., 2017), these methods do
not extract information from the actual terrain. General laws obtained from statistical
analyses are thus insufficient to depict the unique physiographic characteristics of each
channel, and remotely-sensed imagery only captures part of a transient state of the river
system from a top view, which is incomplete. Therefore, a new approach is needed to
take advantage of the available terrain information and provide channel characteristics for
ungauged basins.
This paper evaluates a new method that estimates channel geometry properties
and rating curves from high-resolution terrain data. This method uses hydrological terrain
analysis to determine the Height Above Nearest Drainage (HAND) (Rodda, 2005; Renno
et al., 2008), which is defined as the height of each grid cell with respect to the nearest
stream cell it drains to. The HAND value of each grid cell thus indicates the water height
4
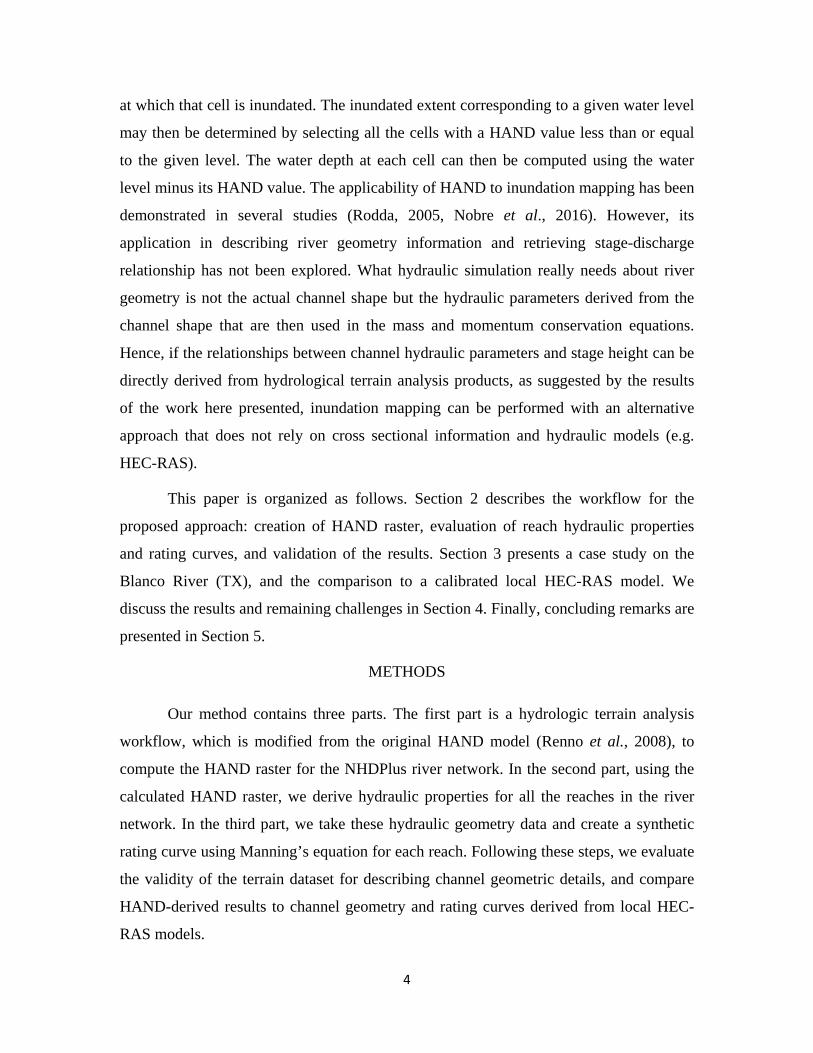
at which that cell is inundated. The inundated extent corresponding to a given water level
may then be determined by selecting all the cells with a HAND value less than or equal
to the given level. The water depth at each cell can then be computed using the water
level minus its HAND value. The applicability of HAND to inundation mapping has been
demonstrated in several studies (Rodda, 2005, Nobre et al., 2016). However, its
application in describing river geometry information and retrieving stage-discharge
relationship has not been explored. What hydraulic simulation really needs about river
geometry is not the actual channel shape but the hydraulic parameters derived from the
channel shape that are then used in the mass and momentum conservation equations.
Hence, if the relationships between channel hydraulic parameters and stage height can be
directly derived from hydrological terrain analysis products, as suggested by the results
of the work here presented, inundation mapping can be performed with an alternative
approach that does not rely on cross sectional information and hydraulic models (e.g.
HEC-RAS).
This paper is organized as follows. Section 2 describes the workflow for the
proposed approach: creation of HAND raster, evaluation of reach hydraulic properties
and rating curves, and validation of the results. Section 3 presents a case study on the
Blanco River (TX), and the comparison to a calibrated local HEC-RAS model. We
discuss the results and remaining challenges in Section 4. Finally, concluding remarks are
presented in Section 5.
METHODS
Our method contains three parts. The first part is a hydrologic terrain analysis
workflow, which is modified from the original HAND model (Renno et al., 2008), to
compute the HAND raster for the NHDPlus river network. In the second part, using the
calculated HAND raster, we derive hydraulic properties for all the reaches in the river
network. In the third part, we take these hydraulic geometry data and create a synthetic
rating curve using Manning’s equation for each reach. Following these steps, we evaluate
the validity of the terrain dataset for describing channel geometric details, and compare
HAND-derived results to channel geometry and rating curves derived from local HEC-
RAS models.
5
Hydrologic Terrain Analysis
The Height Above Nearest Drainage (HAND), first introduced by Rennó et al.
(2008), is a special case of a hydrologic terrain proximity measure (Tesfa et al., 2011).
There are multiple approaches to represent topography-driven flow over a terrain
represented by a digital elevation model (DEM). The D8 model (O'Callaghan et al., 1984)
assigns a single flow direction from each grid cell to one of its neighbors based on the
steepest descent direction. It is the earliest and simplest method developed, and is still
widely used due to its simplicity and the property that flow does not diverge, which is
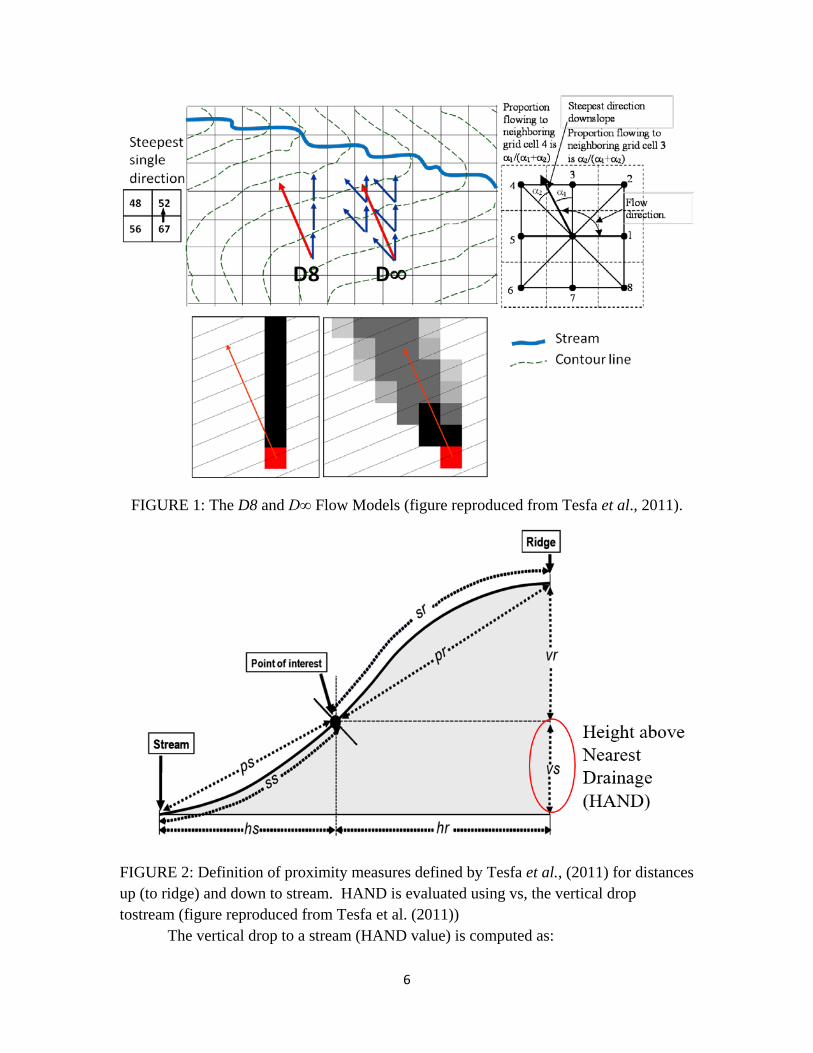
desirable when mapping stream flow paths. The D∞ model introduced by Tarboton
(1997) generalizes D8 by representing flow direction as a vector along the direction of
steepest downward slope on one of the eight triangular facets centered at each grid cell.
Flow from a grid cell is shared between the two down slope grid cells closest to the
vector flow angle based on angle proportioning (Fig.1). Taking the advantage of the D∞
flow model, Tesfa et al. (2011) developed methods to derive a wide range of flow related
quantities useful to hydrological and environmental modeling, including the calculation
of distance to stream (horizontal or vertical). The TauDEM software (Tarboton, 2016)
implements these methods. In this paper we use the D∞ approach for the computation of
HAND as the vertical distance or drop to a stream (Fig. 2) as implemented in the
TauDEM software.
6
FIGURE 1: The D8 and D∞ Flow Models (figure reproduced from Tesfa et al., 2011).
FIGURE 2: Definition of proximity measures defined by Tesfa et al., (2011) for distances up (to ridge) and down to stream. HAND is evaluated using vs, the vertical drop tostream (figure reproduced from Tesfa et al. (2011))
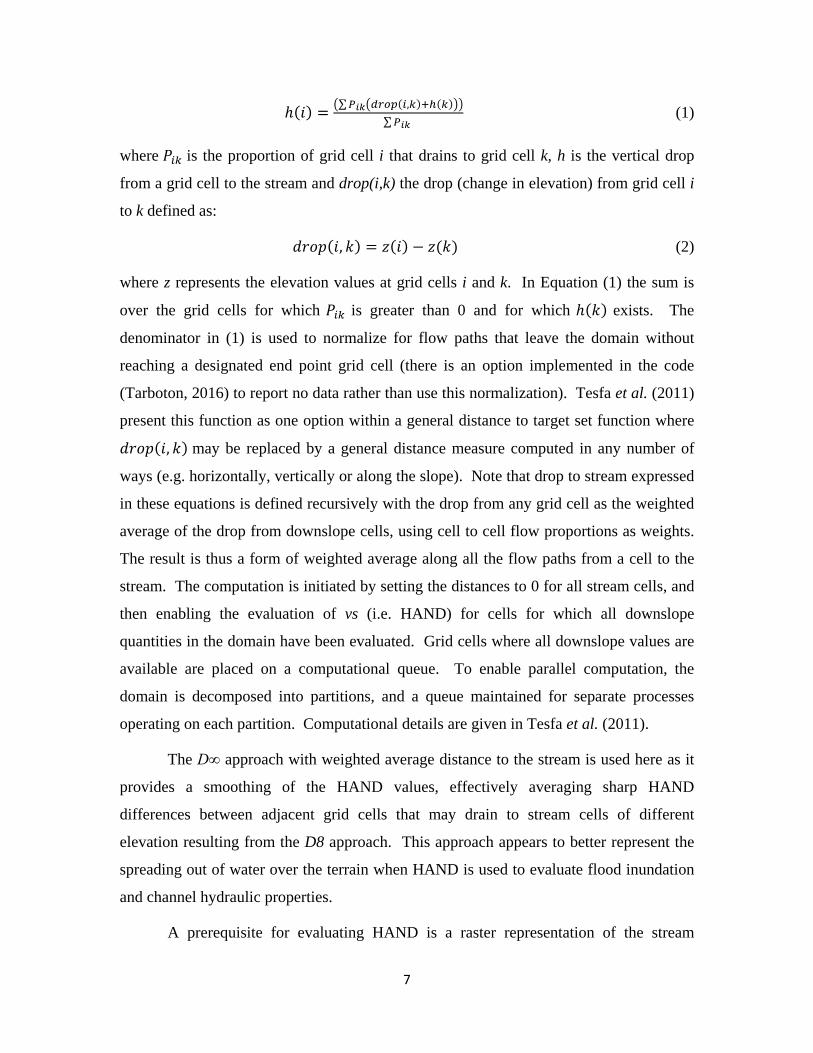
The vertical drop to a stream (HAND value) is computed as:
7
ℎ(𝑖𝑖) = �∑𝑃𝑃𝑖𝑖𝑖𝑖�𝑑𝑑𝑑𝑑𝑑𝑑𝑑𝑑(𝑖𝑖,𝑘𝑘)+ℎ(𝑘𝑘)��∑𝑃𝑃𝑖𝑖𝑖𝑖
(1)
where 𝑃𝑃𝑖𝑖𝑘𝑘 is the proportion of grid cell i that drains to grid cell k, h is the vertical drop
from a grid cell to the stream and drop(i,k) the drop (change in elevation) from grid cell i
to k defined as:
𝑑𝑑𝑑𝑑𝑑𝑑𝑑𝑑(𝑖𝑖, 𝑘𝑘) = 𝑧𝑧(𝑖𝑖) − 𝑧𝑧(𝑘𝑘) (2)
where z represents the elevation values at grid cells i and k. In Equation (1) the sum is
over the grid cells for which 𝑃𝑃𝑖𝑖𝑘𝑘 is greater than 0 and for which ℎ(𝑘𝑘) exists. The
denominator in (1) is used to normalize for flow paths that leave the domain without
reaching a designated end point grid cell (there is an option implemented in the code
(Tarboton, 2016) to report no data rather than use this normalization). Tesfa et al. (2011)
present this function as one option within a general distance to target set function where
𝑑𝑑𝑑𝑑𝑑𝑑𝑑𝑑(𝑖𝑖, 𝑘𝑘) may be replaced by a general distance measure computed in any number of
ways (e.g. horizontally, vertically or along the slope). Note that drop to stream expressed
in these equations is defined recursively with the drop from any grid cell as the weighted
average of the drop from downslope cells, using cell to cell flow proportions as weights.
The result is thus a form of weighted average along all the flow paths from a cell to the
stream. The computation is initiated by setting the distances to 0 for all stream cells, and
then enabling the evaluation of vs (i.e. HAND) for cells for which all downslope
quantities in the domain have been evaluated. Grid cells where all downslope values are
available are placed on a computational queue. To enable parallel computation, the
domain is decomposed into partitions, and a queue maintained for separate processes
operating on each partition. Computational details are given in Tesfa et al. (2011).
The D∞ approach with weighted average distance to the stream is used here as it
provides a smoothing of the HAND values, effectively averaging sharp HAND
differences between adjacent grid cells that may drain to stream cells of different
elevation resulting from the D8 approach. This approach appears to better represent the
spreading out of water over the terrain when HAND is used to evaluate flood inundation
and channel hydraulic properties.
A prerequisite for evaluating HAND is a raster representation of the stream

8
network. These are stream grid cells where HAND is assigned to be 0. The TauDEM
D∞ distance down function may actually be evaluated for any target zone represented by
a set of grid cells to which the distance is to be computed for whatever purpose.
However, in the evaluation of HAND, the target zone is a raster representation of the
stream network. There are many approaches to the definition of a raster stream network
based on DEM flow models. These generally use the D8 method, as defining divergent
stream networks is impractical. TauDEM implements a number of the methods described
by Tarboton and Ames (2001; Tarboton et al., 1992; Tarboton et al., 1991), including
simple contributing area threshold methods, and more advanced methods based on
measures of curvature to identify valley grid cells, objectively adapt to the complexity of
the topography, and quantify drainage density.
In this paper, our interest is in stream networks aligned with the NHDPlus dataset
used by the National Water Model. The NHDPlus stream network was mapped at a
nominal 1:100,000 resolution. The USGS National Elevation Dataset (NED) DEM is
currently available at a 1/3 arc sec (~10 m) horizontal resolution across the continental
US and represents information at a finer resolution more consistent with 1:24,000 scale
mapping.
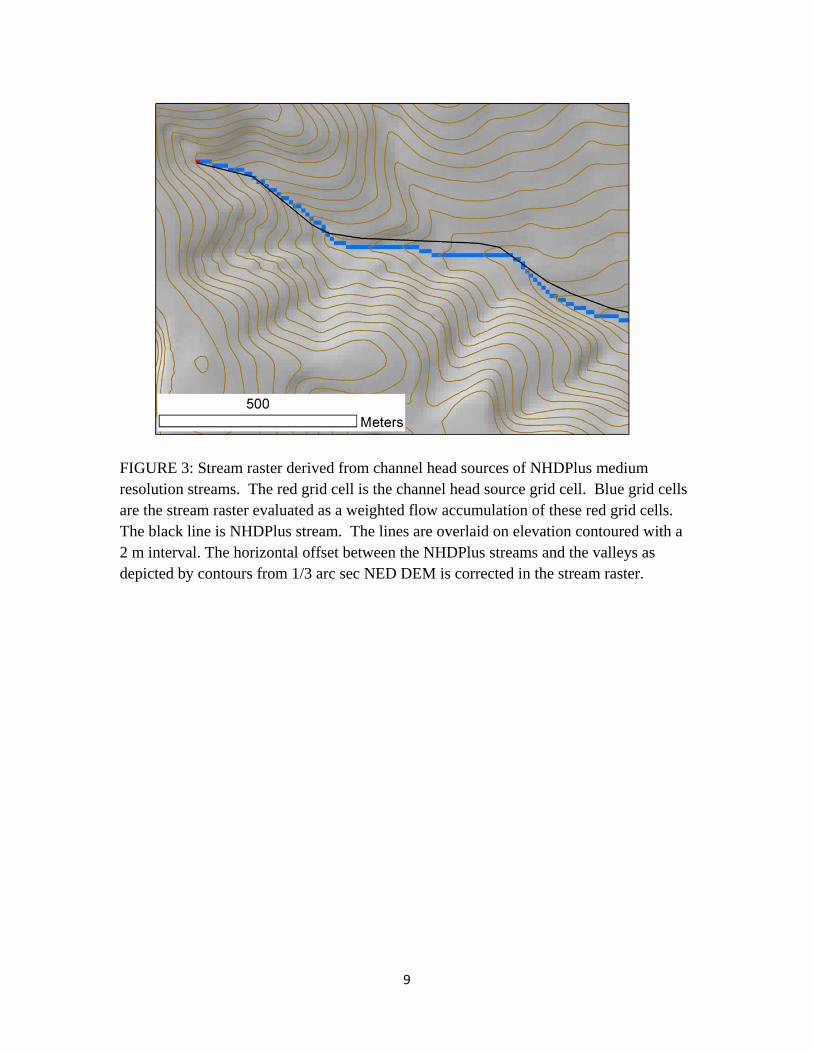
NHDPlus streams, however, do not always align with valleys in the 1/3 arc sec
NED DEM. To avoid the spurious HAND values that would result from calculating
HAND to a direct rasterization of NHDPlus flowlines, we derived a stream raster at the
same drainage density as the NHDPlus stream network, but aligned with 1/3 arc sec NED
DEM. This operation was performed by identifying the upstream channel head of each
first order NHDPlus stream and representing this as a grid cell with value of 1, and
setting all other grid cells to a value of 0 in a stream source weight grid. This weight grid
was then used as input to a weighted flow accumulation calculation using D8 flow
directions (TauDEM areaD8 function). Stream grid cells were mapped where the
weighted flow accumulation was greater than 1. The result is a raster representation of a
stream network originating at each source point, but following down the valleys as
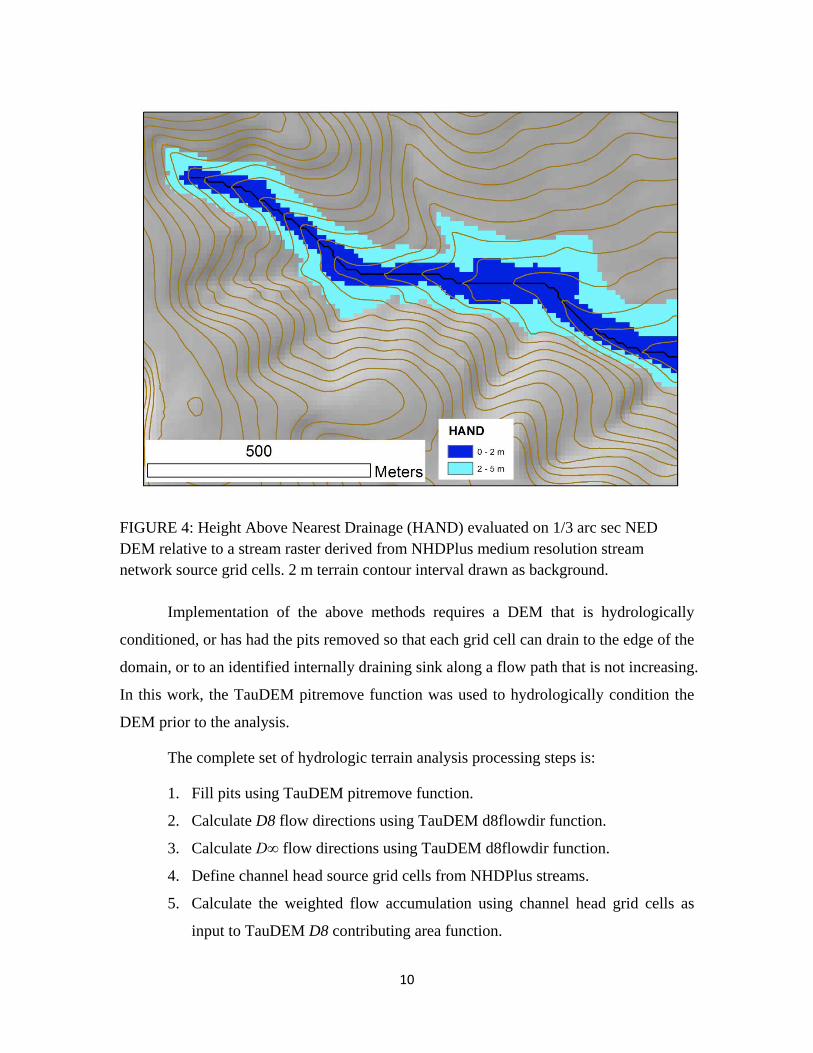
indicated in the 1/3 arc sec DEM (Fig. 3). This stream raster was used as the target set in
the evaluation of vertical distance down using the TauDEM distance down function to
obtain HAND values (Fig. 4).
9
FIGURE 3: Stream raster derived from channel head sources of NHDPlus medium resolution streams. The red grid cell is the channel head source grid cell. Blue grid cells are the stream raster evaluated as a weighted flow accumulation of these red grid cells. The black line is NHDPlus stream. The lines are overlaid on elevation contoured with a 2 m interval. The horizontal offset between the NHDPlus streams and the valleys as depicted by contours from 1/3 arc sec NED DEM is corrected in the stream raster.
10
FIGURE 4: Height Above Nearest Drainage (HAND) evaluated on 1/3 arc sec NED DEM relative to a stream raster derived from NHDPlus medium resolution stream network source grid cells. 2 m terrain contour interval drawn as background.
Implementation of the above methods requires a DEM that is hydrologically
conditioned, or has had the pits removed so that each grid cell can drain to the edge of the
domain, or to an identified internally draining sink along a flow path that is not increasing.
In this work, the TauDEM pitremove function was used to hydrologically condition the
DEM prior to the analysis.
The complete set of hydrologic terrain analysis processing steps is:
1. Fill pits using TauDEM pitremove function.
2. Calculate D8 flow directions using TauDEM d8flowdir function.
3. Calculate D∞ flow directions using TauDEM d8flowdir function.
4. Define channel head source grid cells from NHDPlus streams.
5. Calculate the weighted flow accumulation using channel head grid cells as
input to TauDEM D8 contributing area function.
11
6. Define the stream raster using a threshold of 1 with weighted flow
accumulation.
7. Calculate HAND using D∞ distance to stream function with the vertical drop
option.
River Geometry and Rating Curve Estimation
The conceptual basis for implementing HAND in inundation mapping is as
follows. A river segment is defined as a stream reach R. The reach catchment, C,
contributes the local drainage area of the stream reach R. Let us define the value, L, as
the length of the reach R measured along its thalweg line. A measure location, m, along
reach R is defined by its percentage distance from the lower end of the reach, in other
words by the ratio of the length from that location to the lower end of the reach, divided
by the length of the reach, L. The water level, y, at any location m along the stream
channel is given by the difference between the water surface elevation and the minimum
channel elevation at that location, designated by y(m). The average water level along the
stream reach is given by y. The HAND value, h(s), is the elevation difference between a
cell, s, on the land surface within the reach catchment, and the minimum channel
elevation at the location on the corresponding stream reach where water draining from
that cell converges into the channel. The location, s, on the land surface is inundated if
the water level in the channel reach is greater than the HAND value of that location, i.e.
inundation occurs if y > h(s).
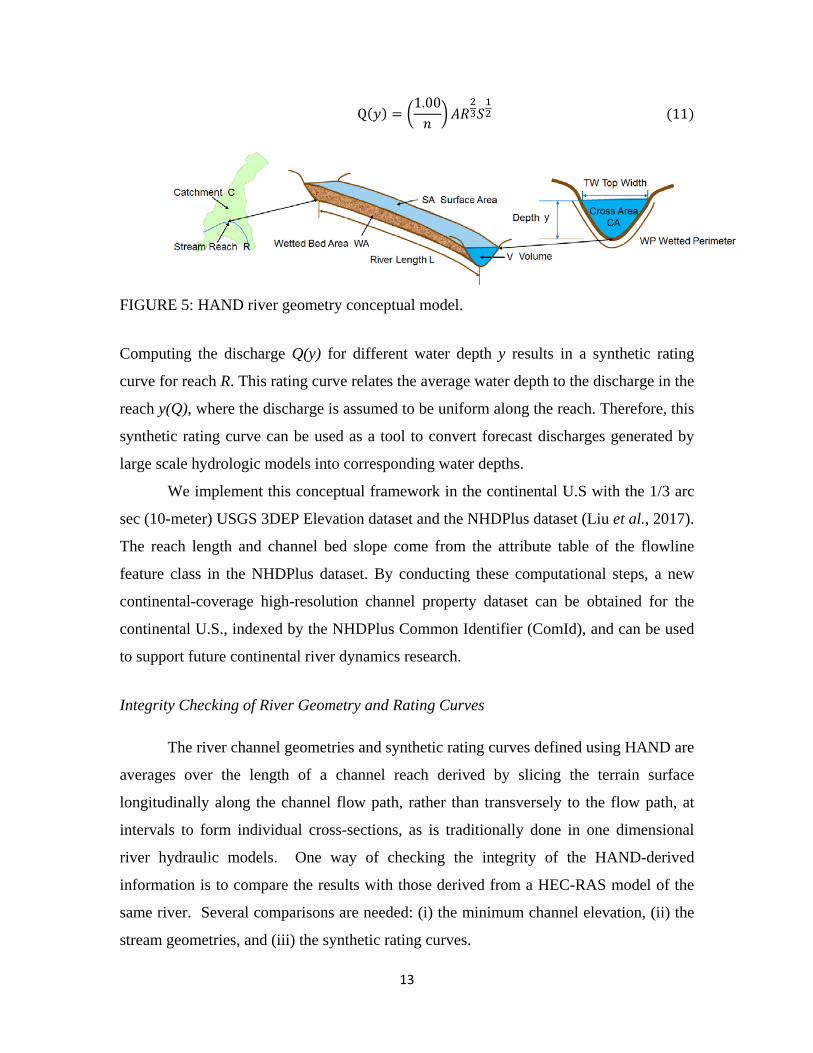
The conceptual basis for implementing HAND to estimate the channel hydraulic
properties (Fig. 5) and rating curve is as follows: for reach R at a water level of y, all the
cells, s, with a HAND value smaller than y compose an inundated zone F(y), which is a
subarea of the reach catchment C. The water depth at any cell s in the inundated zone,
d(s), is the difference between the reach-average water level y and the HAND of that cell
h(s), which can be represented as:
𝑑𝑑(𝑠𝑠,𝑦𝑦) = 𝑦𝑦 − ℎ(𝑠𝑠), 𝑠𝑠 ∈ 𝐹𝐹(𝑦𝑦) (3)
Since a uniform reach-average water level y is applied to check the inundation of any cell
within the catchment, the inundated zone F(y) should be interpreted at reach level.
12
The water surface area of the inundated zone at a water depth of y, S(y), can be calculated
as:
𝑆𝑆(𝑦𝑦) = � 𝐴𝐴(𝑠𝑠)𝑠𝑠∈𝐹𝐹(𝑦𝑦)
(4)
where A(s) is the area of cell s.
The channel bed area of the inundated zone at a water depth of y, B(y), can be calculated
as:
𝐵𝐵(𝑦𝑦) = � 𝐴𝐴(𝑠𝑠)�(1 + 𝑠𝑠𝑠𝑠𝑑𝑑(𝑠𝑠)2)𝑠𝑠∈𝐹𝐹(𝑦𝑦)
(5)
where slp(s) is the surface slope of cell s, expressed as rise/run or atan of the slope angle.
This equation approximates the surface area of the grid cell as the area of the planar
surface with surface slope, which intersects with the horizontal projected area of the grid
cell.
The flood volume of the inundated zone V(y) at a water depth of y can be calculated as:
𝑉𝑉(𝑦𝑦) = � 𝐴𝐴(𝑠𝑠)𝑠𝑠∈𝐹𝐹(𝑦𝑦)
𝑑𝑑(𝑠𝑠,𝑦𝑦) (6)
If the reach length L is known, the reach-average channel width at a water depth of y,
W(y), can be calculated as:
𝑊𝑊(𝑦𝑦) = 𝑆𝑆(𝑦𝑦)/𝐿𝐿 (7)
Similarly for the reach-average cross section area A(y):
𝐴𝐴(𝑦𝑦) = 𝑉𝑉(𝑦𝑦)/𝐿𝐿 (8)
and the reach-average cross section wetted perimeter P(y) :
𝑃𝑃(𝑦𝑦) = 𝐵𝐵(𝑦𝑦)/𝐿𝐿 (9)
Combining the reach-average cross sectional area A(y) and the wetted perimeter P(y)
gives the reach-average cross section hydraulic radius R(y) as:
𝑅𝑅(𝑦𝑦) = 𝐴𝐴(𝑦𝑦)/𝑃𝑃(𝑦𝑦) (10)
If the channel bed slope of reach R is S and a Manning’s value is assumed as n, the
Manning’s equation can be applied to obtain a discharge Q(y) corresponding to the water
depth of y at uniform flow as:
13
Q(𝑦𝑦) = �1.00𝑛𝑛�𝐴𝐴𝑅𝑅
23𝑆𝑆
12 (11)
FIGURE 5: HAND river geometry conceptual model.
Computing the discharge Q(y) for different water depth y results in a synthetic rating
curve for reach R. This rating curve relates the average water depth to the discharge in the
reach y(Q), where the discharge is assumed to be uniform along the reach. Therefore, this
synthetic rating curve can be used as a tool to convert forecast discharges generated by
large scale hydrologic models into corresponding water depths.
We implement this conceptual framework in the continental U.S with the 1/3 arc
sec (10-meter) USGS 3DEP Elevation dataset and the NHDPlus dataset (Liu et al., 2017).
The reach length and channel bed slope come from the attribute table of the flowline
feature class in the NHDPlus dataset. By conducting these computational steps, a new
continental-coverage high-resolution channel property dataset can be obtained for the
continental U.S., indexed by the NHDPlus Common Identifier (ComId), and can be used
to support future continental river dynamics research.
Integrity Checking of River Geometry and Rating Curves
The river channel geometries and synthetic rating curves defined using HAND are
averages over the length of a channel reach derived by slicing the terrain surface
longitudinally along the channel flow path, rather than transversely to the flow path, at
intervals to form individual cross-sections, as is traditionally done in one dimensional
river hydraulic models. One way of checking the integrity of the HAND-derived
information is to compare the results with those derived from a HEC-RAS model of the
same river. Several comparisons are needed: (i) the minimum channel elevation, (ii) the
stream geometries, and (iii) the synthetic rating curves.
14
The minimum channel elevation at a particular measure location m, zc(m), is the
elevation above geodetic datum of the stream thalweg at that location. When a stream is
represented by a sequence of cells in a DEM, the DEM cell that corresponds to location
mi has a DEM channel elevation above geodetic datum of zd(m). Because digital elevation
models are smoothed versions of land surface topography, and because the digital
elevation model may have been created when the channel was partly filled with water,
the DEM channel elevation is generally higher than the minimum channel elevation. The
value Δz(m) = zd(m) - zc(m) represents the bed elevation difference between the DEM
channel elevation and the thalweg channel elevation at that location. The mean value of
this bed elevation difference along a stream reach is given by Δz.
An assumption of our implementation that needs to be evaluated is whether a
DEM at a resolution of 10 meters is able to capture the terrain details within the channel.
One way of carrying out this evaluation is to compare the streamline bed elevation profile
extracted from the 10-m DEM, with the minimum channel elevation in a HEC-RAS
model obtained by connecting the minimum elevation of HEC-RAS cross sections from
upstream to downstream. In order to keep the same profile length and elevation sampling
rate in the two methods, we adopt the streamline measure system of the HEC-RAS model,
and obtain the DEM-derived profile by intersecting the DEM-derived flowline with the
HEC-RAS cross sections and extracting the DEM elevations of the intersected locations.
Because Δz is generally greater than zero, it is useful to introduce a bottom shift
into the HAND-derived water levels reflecting the “shelf effect” where the bottom of a
DEM channel is actually flat over a finite area. Using this approach, the channel width W
is a positive number when the water level y is zero, so the true water depth is larger than
that computed using the DEM alone.
HAND-derived channel hydraulic properties can also be compared with those
derived from river geometry information stored in HEC-RAS models. The main channel
property that we evaluated was the channel width, because it is a description of the river
geometry that is readily obtained by the HAND method. To do this, we derive a water
level-channel width relationship from the HAND raster for a river segment using Eq. (7).
Since the cross section shape is stored in HEC-RAS, a similar relationship can be
established from the shape of each cross section located on the study reach. These cross
15
section level-width relationships form a sample space for a given stream reach. If the
HAND-derived relationship falls within this sample space, we have some confidence that
the accuracy of the HAND-derived river geometry information is comparable to that of
the river geometry data used in local hydraulic simulations. Taking the channel widths for
all the cross sections on the segment at the same water level, together with the distance
between adjacent cross sections, we can compute the flood volume corresponding to the
given water depth. If the volume is divided by the total length of the segment, an
equivalent reach-averaged channel width can be derived from these cross sectional
shapes. Repeating this process for a series of threshold water depths gives us a reach-
averaged water level-width relationship derived from cross sectional shapes. Calculating
the difference between this cross section-derived relationship and the HAND-derived
relationship also helps to evaluate the quality of HAND-derived river geometry
information.
A third part component of the integrity checking is to compare the HAND-derived
rating curves with the rating curves stored in local HEC-RAS models. If a HEC-RAS
project contains the simulation at multiple flow conditions, a rating curve will be
generated for each cross section from the steady flow simulation results. Similar to the
channel width sample space we use to validate river geometry, a rating curve sample
space for the river segment is established from rating curves from different cross sections.
To better quantify the water depth uncertainty brought by channel geometry, a fixed flow
rate is assigned to every cross section in a HEC-RAS model for a given channel reach to
create a representative flow condition that is replicated with the HAND-derived rating
curve. In this way, the water depth uncertainty caused by the difference in discharge
between HAND and HEC-RAS is eliminated. This median rating curve in the rating
curve sample space from HEC-RAS is chosen as the reference to validate the HAND-
derived rating curves. The optimal roughness value is selected for the HAND-derived
rating curve by minimizing the root-mean-square error (RMSE) between the HAND-
derived rating curve and the median rating curve from HEC-RAS.
16
APPLICATION OF THE PROPOSED APPROACH
Study Area and Data
In order to evaluate our approach, we conduct a case study on the Blanco River
(Fig. 6) following the steps described in the Methods section. The Blanco River is located
in Central Texas, which is one of the most flash-flood prone regions in North America. In
May 2015, a historic flash flood occurred across parts of Central Texas, causing severe
life and property losses. The Blanco River was one of the most affected areas in this
flood due to a flood wave of more than 12 meters in water depth.
The network of the Blanco River watershed is composed of 170 medium-
resolution NHDPlus reaches. The total drainage area is 1129.57 km2, and the average
drainage area of the individual reach catchments is 6.72 km2. The total river length is
539.71 km, and the average river length of the reaches is 3.17 km. For the hydrological
terrain analysis portion, we created the HAND raster for the Blanco watershed. The DEM
used in this study is the 1/3 arc-second DEM from the USGS 3DEP Elevation dataset
with horizontal resolution of about 10 meters. The RMSE is 1.55 meters and represents
the vertical accuracy of the DEM (Gesch et al., 2014). A calibrated HEC-RAS steady
flow model, covering the lower half of the Blanco River main channel, was provided by
the Fort Worth District of the U.S. Army Corps of Engineers and used as the reference
for river geometry and rating curve comparison. In particular, we implemented the
approach for a single NHDPlus reach with COMID 1630223. We chose this reach
because: (1) its length is close to the average river length of the entire NHDPlus network
with 2.67 million reaches, making it a representative reach for the catchment; (2) the
reach is covered by the local HEC-RAS model and there are 8 cross sections lying on this
reach; (3) the reach is close to Wimberley where 11 people were killed in the 2015
Memorial Day Flood, adding practical significance to understanding this reach.
17
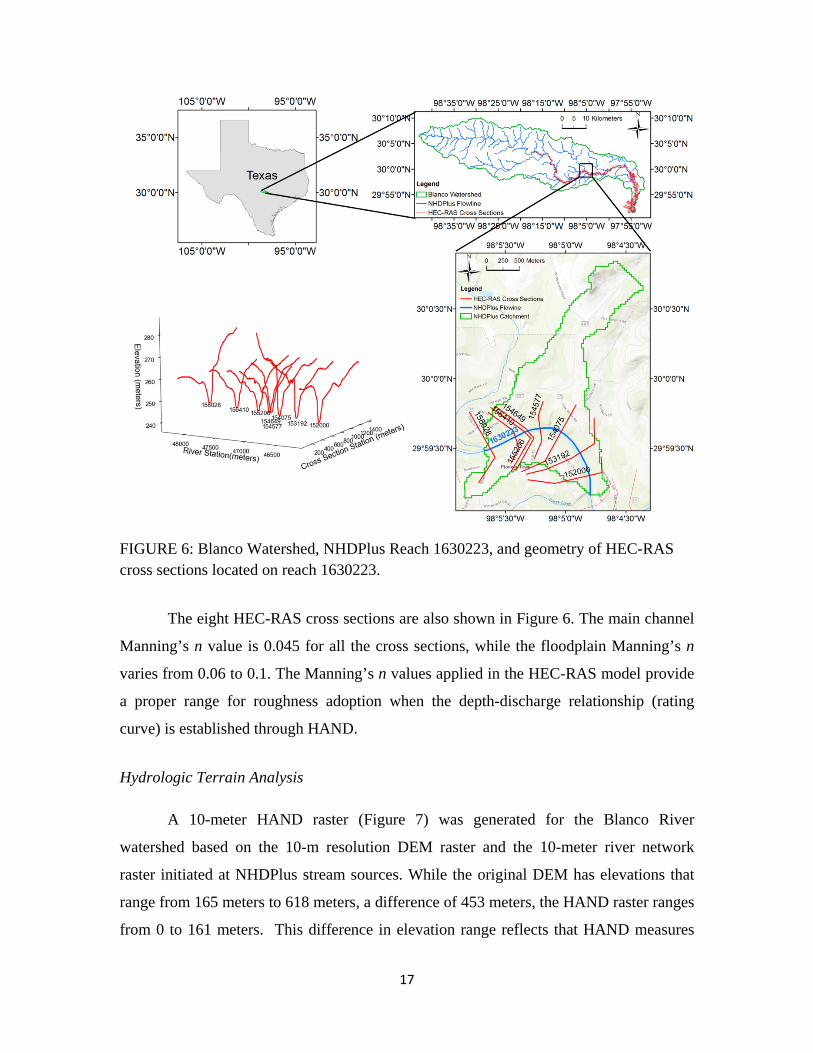
FIGURE 6: Blanco Watershed, NHDPlus Reach 1630223, and geometry of HEC-RAS cross sections located on reach 1630223.
The eight HEC-RAS cross sections are also shown in Figure 6. The main channel
Manning’s n value is 0.045 for all the cross sections, while the floodplain Manning’s n
varies from 0.06 to 0.1. The Manning’s n values applied in the HEC-RAS model provide
a proper range for roughness adoption when the depth-discharge relationship (rating
curve) is established through HAND.
Hydrologic Terrain Analysis
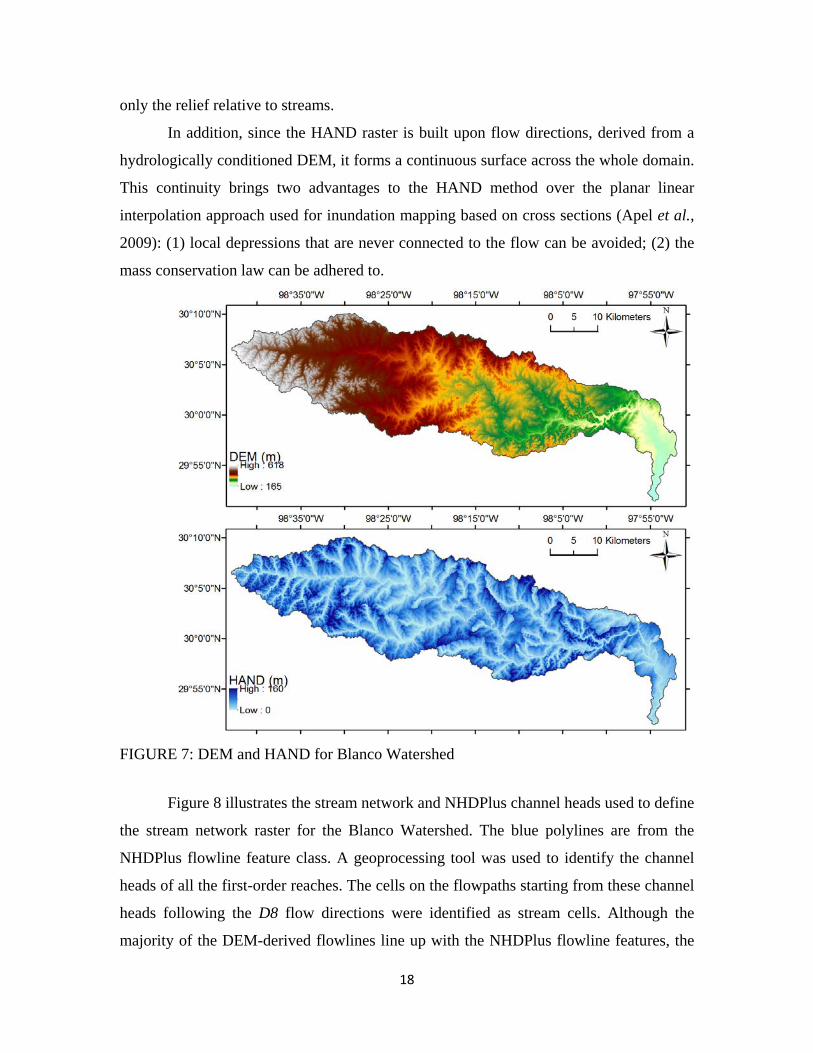
A 10-meter HAND raster (Figure 7) was generated for the Blanco River
watershed based on the 10-m resolution DEM raster and the 10-meter river network
raster initiated at NHDPlus stream sources. While the original DEM has elevations that
range from 165 meters to 618 meters, a difference of 453 meters, the HAND raster ranges
from 0 to 161 meters. This difference in elevation range reflects that HAND measures
18
only the relief relative to streams.
In addition, since the HAND raster is built upon flow directions, derived from a
hydrologically conditioned DEM, it forms a continuous surface across the whole domain.
This continuity brings two advantages to the HAND method over the planar linear
interpolation approach used for inundation mapping based on cross sections (Apel et al.,
2009): (1) local depressions that are never connected to the flow can be avoided; (2) the
mass conservation law can be adhered to.
FIGURE 7: DEM and HAND for Blanco Watershed
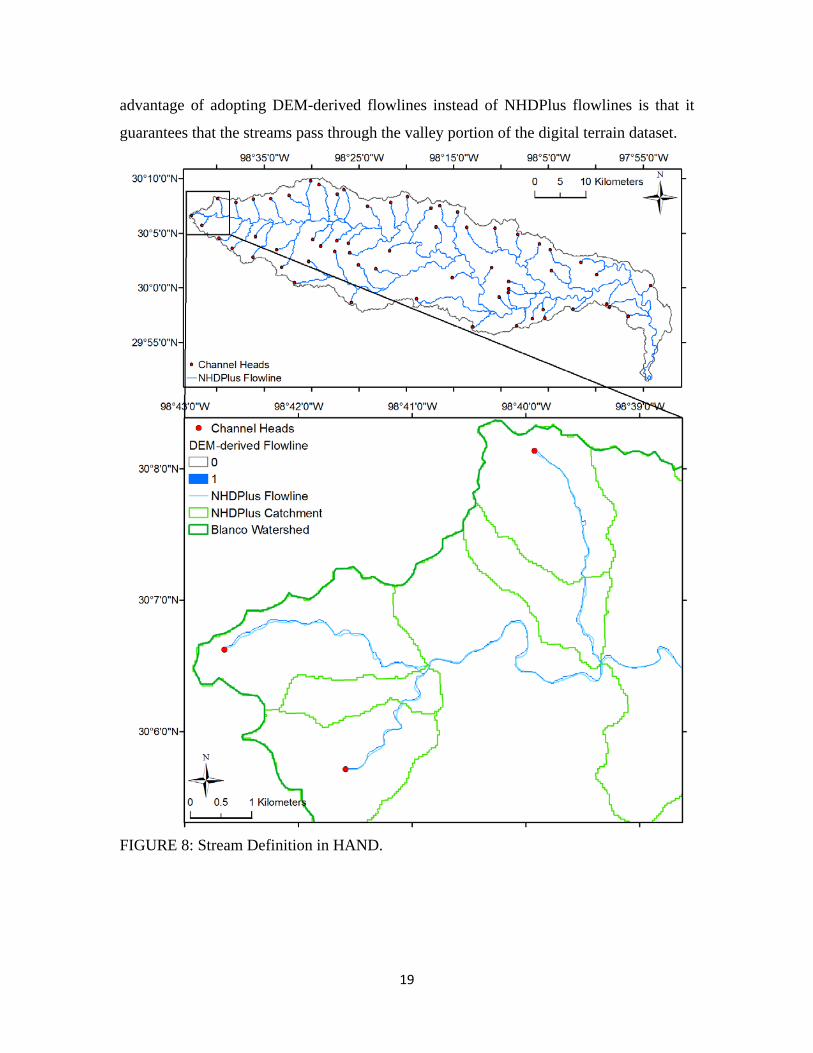
Figure 8 illustrates the stream network and NHDPlus channel heads used to define
the stream network raster for the Blanco Watershed. The blue polylines are from the
NHDPlus flowline feature class. A geoprocessing tool was used to identify the channel
heads of all the first-order reaches. The cells on the flowpaths starting from these channel
heads following the D8 flow directions were identified as stream cells. Although the
majority of the DEM-derived flowlines line up with the NHDPlus flowline features, the
19
advantage of adopting DEM-derived flowlines instead of NHDPlus flowlines is that it
guarantees that the streams pass through the valley portion of the digital terrain dataset.
FIGURE 8: Stream Definition in HAND.
20
River Geometry and Rating Curve Estimation
By setting a water level threshold to the HAND raster, the inundation extent
consisting of all the cells with a HAND value smaller than the threshold, can be
generated. The water depth raster is then computed by using the threshold water level
value subtracted from the HAND value (Eq. (3)). All the inundated cells have a positive
water depth, and the stream cells have a water depth equal to the threshold water level.
The procedure for obtaining river geometry properties for each reach is illustrated
here for the selected study reach and catchment (COMID: 1630223). We first clip the
Blanco watershed HAND raster with the catchment boundary polygon to obtain a HAND
subset for that catchment. From the HAND raster, we create the water depth grids that
correspond to a series of threshold water levels from 0 to 18.29 meters (60 feet) at an
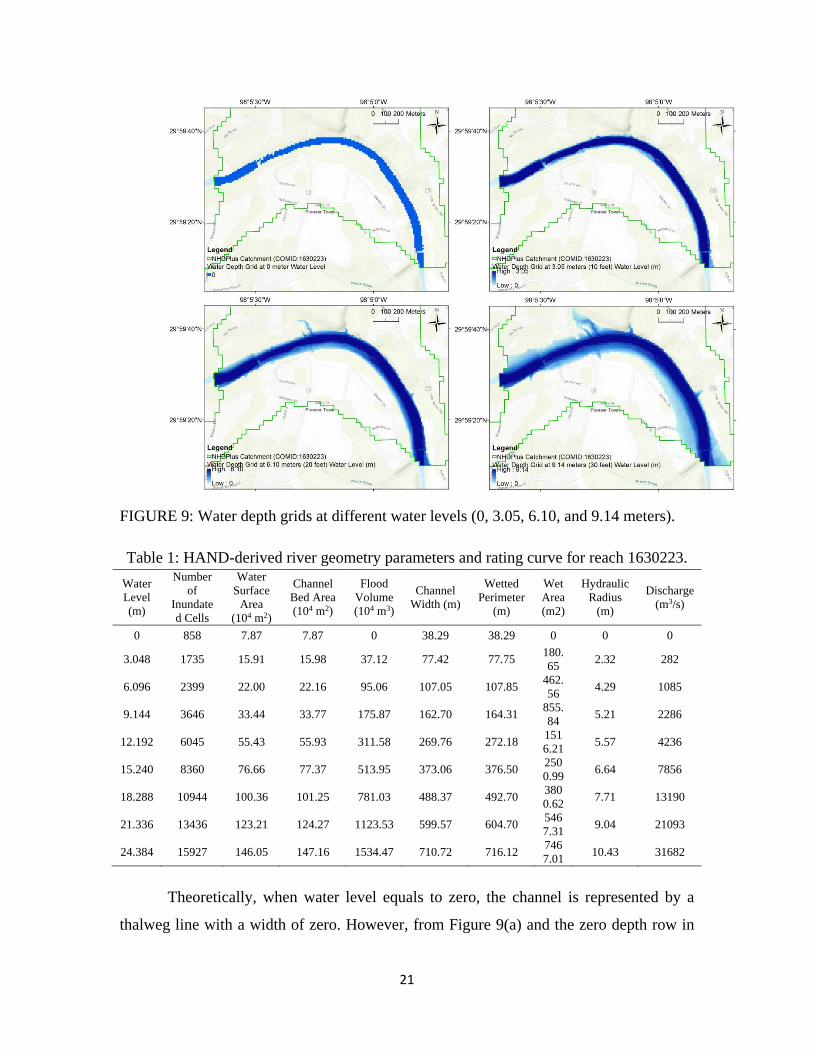
interval of 0.3048 meter (1 foot). As shown in Figure 9, water spreads out of the channel
and the depth at the same location increases as the water level rises up. Following the
method described earlier, we get the water level-channel geometric property relationships
for this reach as shown in Table 1.
To estimate the rating curve for that reach, the derived water level-cross sectional
area and water level-hydraulic radius relationships, together with the river length and
reach average slope attributes of that specific reach from the NHDPlus dataset and
Manning's roughness coefficient, are substituted into the Manning’s flow resistance
equation. In this study for Reach 1630223, the segment length is 2.055 kilometers, and
the channel bed slope is 0.001976. Manning’s n value was taken as 0.05 for consistency
with the HEC-RAS model for this river. Selection of Manning’s n is a source of
uncertainty in this approach and its calibration is discussed in the validation section.
21
FIGURE 9: Water depth grids at different water levels (0, 3.05, 6.10, and 9.14 meters).
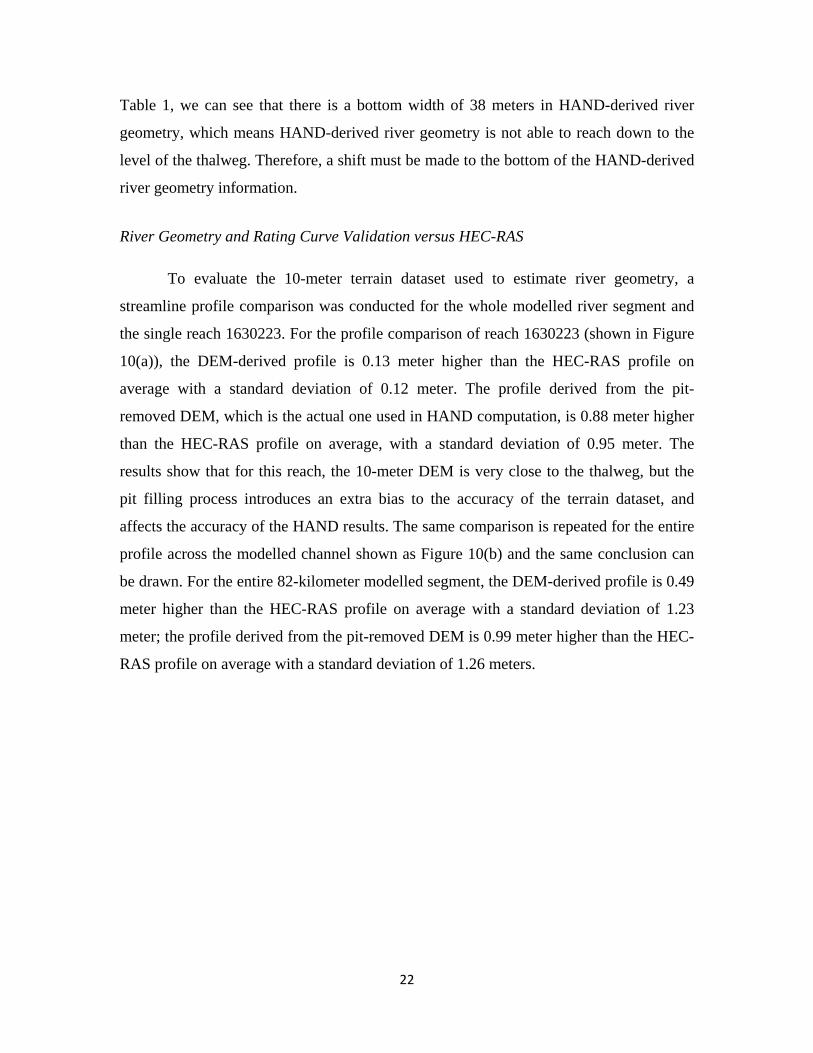
Table 1: HAND-derived river geometry parameters and rating curve for reach 1630223. Water Level (m)
Number of
Inundated Cells
Water Surface
Area (104 m2)
Channel Bed Area (104 m2)
Flood Volume (104 m3)
Channel Width (m)
Wetted Perimeter
(m)
Wet Area (m2)
Hydraulic Radius
(m)
Discharge (m3/s)
0 858 7.87 7.87 0 38.29 38.29 0 0 0
3.048 1735 15.91 15.98 37.12 77.42 77.75 180.65 2.32 282
6.096 2399 22.00 22.16 95.06 107.05 107.85 462.56 4.29 1085
9.144 3646 33.44 33.77 175.87 162.70 164.31 855.84 5.21 2286
12.192 6045 55.43 55.93 311.58 269.76 272.18 1516.21 5.57 4236
15.240 8360 76.66 77.37 513.95 373.06 376.50 2500.99 6.64 7856
18.288 10944 100.36 101.25 781.03 488.37 492.70 3800.62 7.71 13190
21.336 13436 123.21 124.27 1123.53 599.57 604.70 5467.31 9.04 21093
24.384 15927 146.05 147.16 1534.47 710.72 716.12 7467.01 10.43 31682
Theoretically, when water level equals to zero, the channel is represented by a
thalweg line with a width of zero. However, from Figure 9(a) and the zero depth row in
22
Table 1, we can see that there is a bottom width of 38 meters in HAND-derived river
geometry, which means HAND-derived river geometry is not able to reach down to the
level of the thalweg. Therefore, a shift must be made to the bottom of the HAND-derived
river geometry information.
River Geometry and Rating Curve Validation versus HEC-RAS
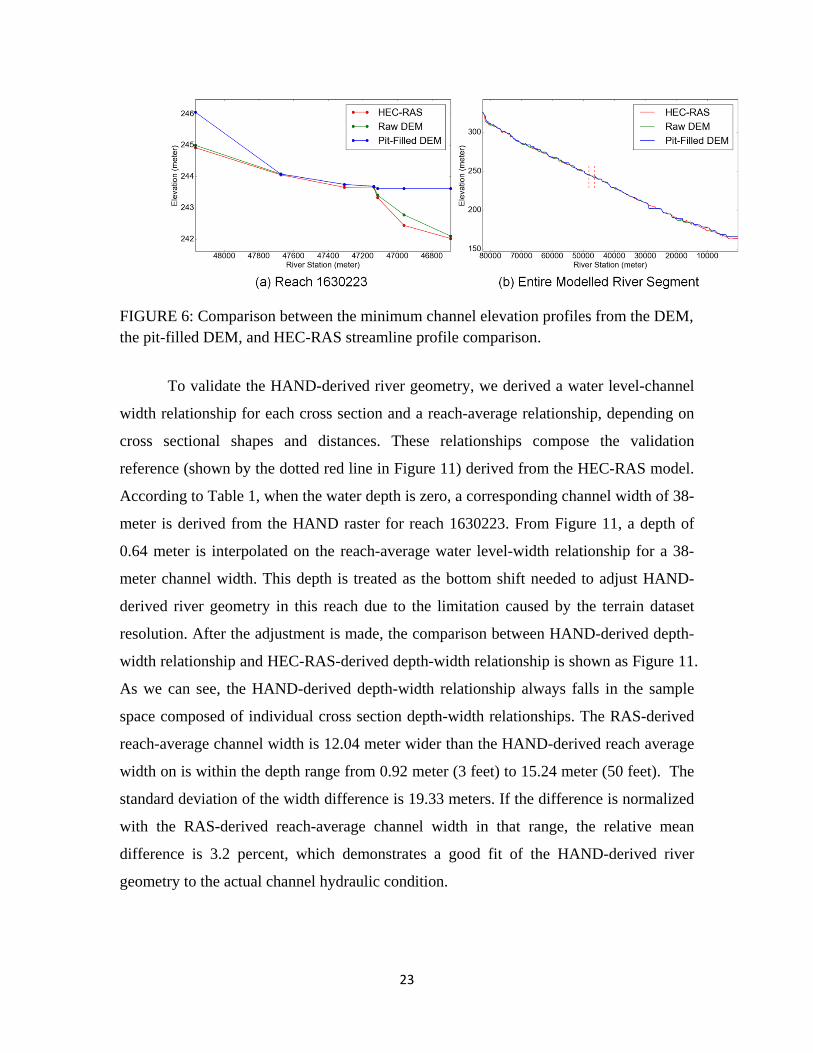
To evaluate the 10-meter terrain dataset used to estimate river geometry, a
streamline profile comparison was conducted for the whole modelled river segment and
the single reach 1630223. For the profile comparison of reach 1630223 (shown in Figure
10(a)), the DEM-derived profile is 0.13 meter higher than the HEC-RAS profile on
average with a standard deviation of 0.12 meter. The profile derived from the pit-
removed DEM, which is the actual one used in HAND computation, is 0.88 meter higher
than the HEC-RAS profile on average, with a standard deviation of 0.95 meter. The
results show that for this reach, the 10-meter DEM is very close to the thalweg, but the
pit filling process introduces an extra bias to the accuracy of the terrain dataset, and
affects the accuracy of the HAND results. The same comparison is repeated for the entire
profile across the modelled channel shown as Figure 10(b) and the same conclusion can
be drawn. For the entire 82-kilometer modelled segment, the DEM-derived profile is 0.49
meter higher than the HEC-RAS profile on average with a standard deviation of 1.23
meter; the profile derived from the pit-removed DEM is 0.99 meter higher than the HEC-
RAS profile on average with a standard deviation of 1.26 meters.
23
FIGURE 6: Comparison between the minimum channel elevation profiles from the DEM, the pit-filled DEM, and HEC-RAS streamline profile comparison.
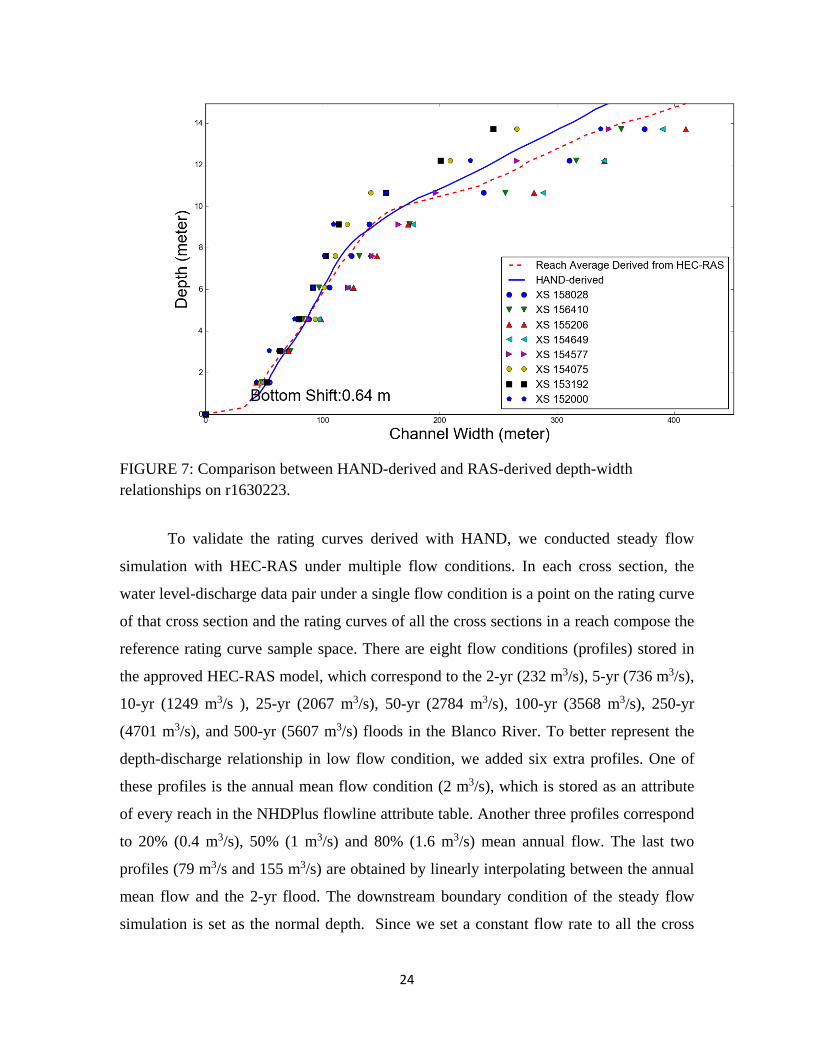
To validate the HAND-derived river geometry, we derived a water level-channel
width relationship for each cross section and a reach-average relationship, depending on
cross sectional shapes and distances. These relationships compose the validation
reference (shown by the dotted red line in Figure 11) derived from the HEC-RAS model.
According to Table 1, when the water depth is zero, a corresponding channel width of 38-
meter is derived from the HAND raster for reach 1630223. From Figure 11, a depth of
0.64 meter is interpolated on the reach-average water level-width relationship for a 38-
meter channel width. This depth is treated as the bottom shift needed to adjust HAND-
derived river geometry in this reach due to the limitation caused by the terrain dataset
resolution. After the adjustment is made, the comparison between HAND-derived depth-
width relationship and HEC-RAS-derived depth-width relationship is shown as Figure 11.
As we can see, the HAND-derived depth-width relationship always falls in the sample
space composed of individual cross section depth-width relationships. The RAS-derived
reach-average channel width is 12.04 meter wider than the HAND-derived reach average
width on is within the depth range from 0.92 meter (3 feet) to 15.24 meter (50 feet). The
standard deviation of the width difference is 19.33 meters. If the difference is normalized
with the RAS-derived reach-average channel width in that range, the relative mean
difference is 3.2 percent, which demonstrates a good fit of the HAND-derived river
geometry to the actual channel hydraulic condition.
24
FIGURE 7: Comparison between HAND-derived and RAS-derived depth-width relationships on r1630223.
To validate the rating curves derived with HAND, we conducted steady flow
simulation with HEC-RAS under multiple flow conditions. In each cross section, the
water level-discharge data pair under a single flow condition is a point on the rating curve
of that cross section and the rating curves of all the cross sections in a reach compose the
reference rating curve sample space. There are eight flow conditions (profiles) stored in
the approved HEC-RAS model, which correspond to the 2-yr (232 m3/s), 5-yr (736 m3/s),
10-yr (1249 m3/s ), 25-yr (2067 m3/s), 50-yr (2784 m3/s), 100-yr (3568 m3/s), 250-yr
(4701 m3/s), and 500-yr (5607 m3/s) floods in the Blanco River. To better represent the
depth-discharge relationship in low flow condition, we added six extra profiles. One of
these profiles is the annual mean flow condition (2 m3/s), which is stored as an attribute
of every reach in the NHDPlus flowline attribute table. Another three profiles correspond
to 20% (0.4 m3/s), 50% (1 m3/s) and 80% (1.6 m3/s) mean annual flow. The last two
profiles (79 m3/s and 155 m3/s) are obtained by linearly interpolating between the annual
mean flow and the 2-yr flood. The downstream boundary condition of the steady flow
simulation is set as the normal depth. Since we set a constant flow rate to all the cross
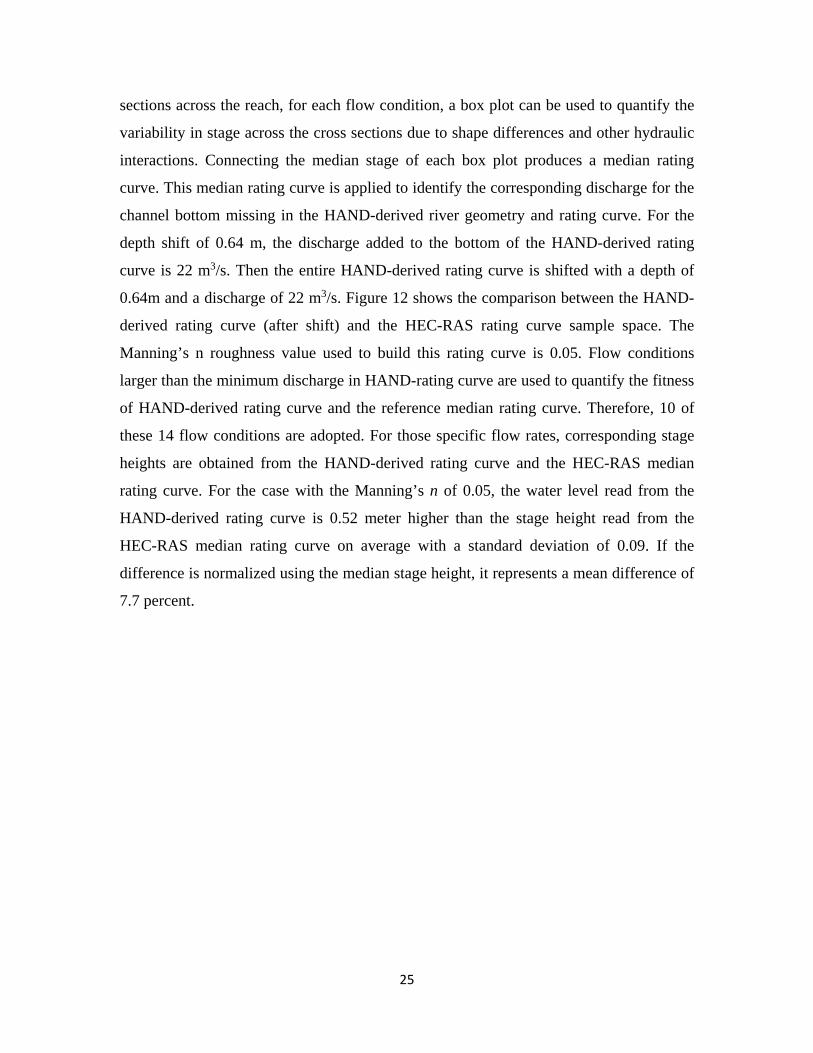
25
sections across the reach, for each flow condition, a box plot can be used to quantify the
variability in stage across the cross sections due to shape differences and other hydraulic
interactions. Connecting the median stage of each box plot produces a median rating
curve. This median rating curve is applied to identify the corresponding discharge for the
channel bottom missing in the HAND-derived river geometry and rating curve. For the
depth shift of 0.64 m, the discharge added to the bottom of the HAND-derived rating
curve is 22 m3/s. Then the entire HAND-derived rating curve is shifted with a depth of
0.64m and a discharge of 22 m3/s. Figure 12 shows the comparison between the HAND-
derived rating curve (after shift) and the HEC-RAS rating curve sample space. The
Manning’s n roughness value used to build this rating curve is 0.05. Flow conditions
larger than the minimum discharge in HAND-rating curve are used to quantify the fitness
of HAND-derived rating curve and the reference median rating curve. Therefore, 10 of
these 14 flow conditions are adopted. For those specific flow rates, corresponding stage
heights are obtained from the HAND-derived rating curve and the HEC-RAS median
rating curve. For the case with the Manning’s n of 0.05, the water level read from the
HAND-derived rating curve is 0.52 meter higher than the stage height read from the
HEC-RAS median rating curve on average with a standard deviation of 0.09. If the
difference is normalized using the median stage height, it represents a mean difference of
7.7 percent.
26
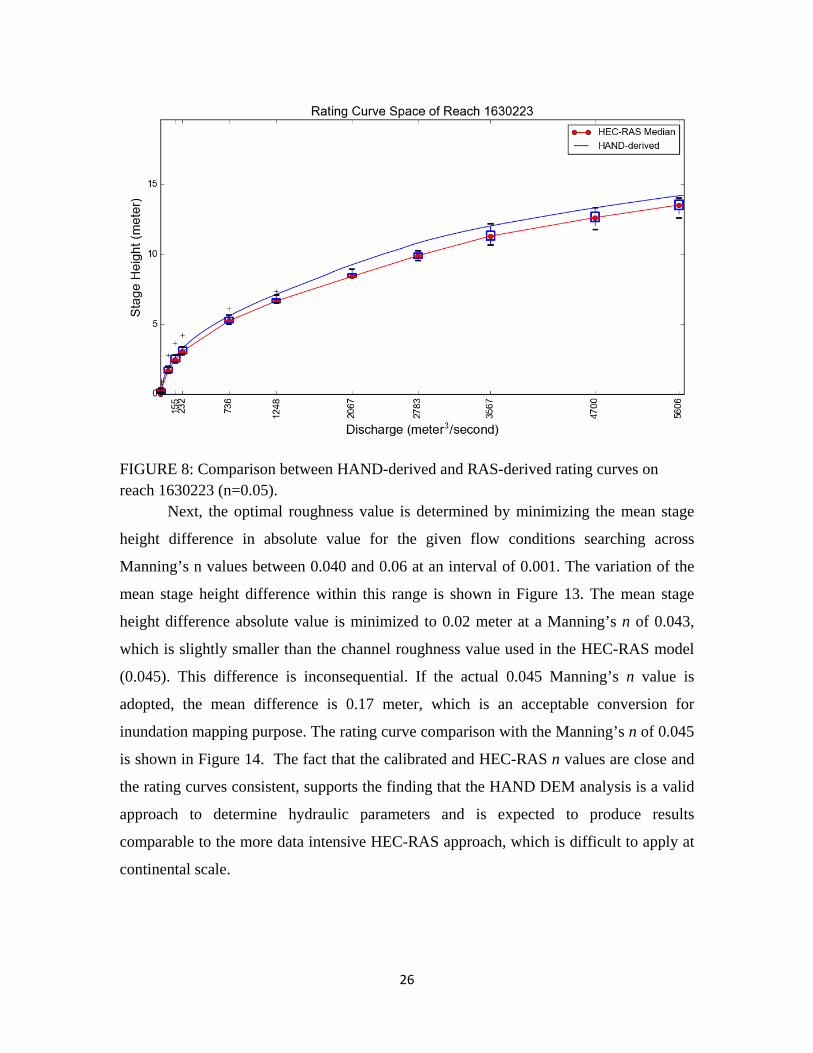
FIGURE 8: Comparison between HAND-derived and RAS-derived rating curves on reach 1630223 (n=0.05).
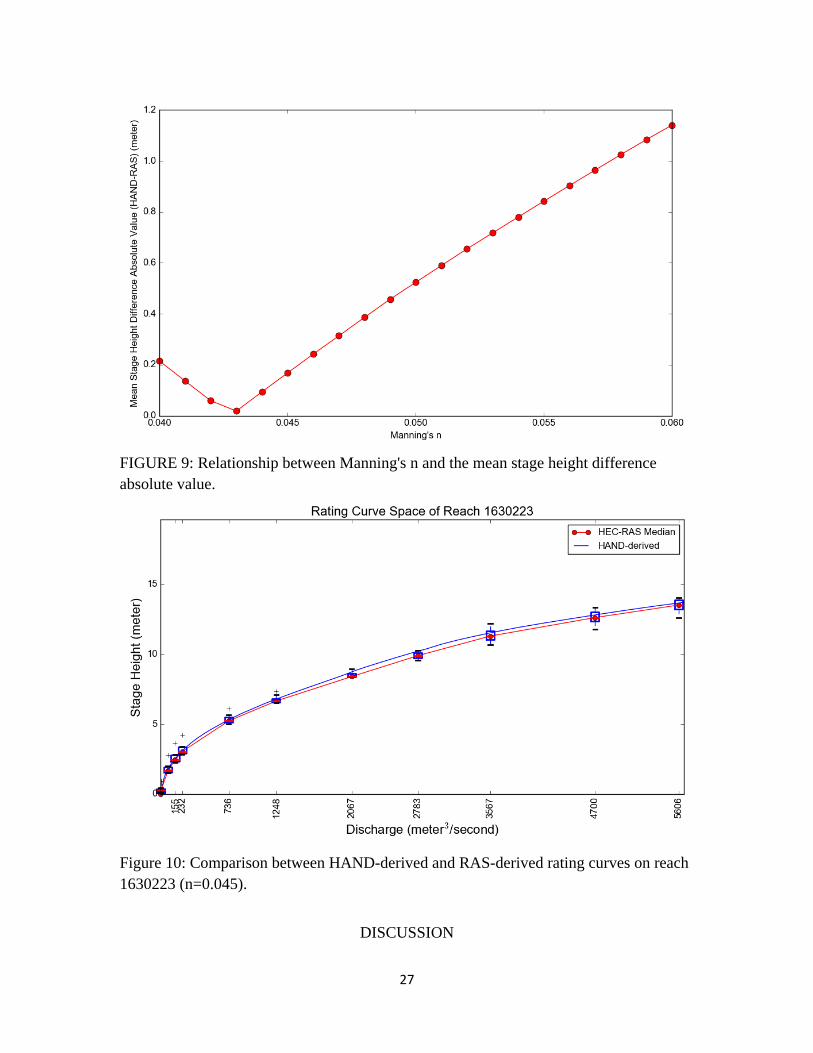
Next, the optimal roughness value is determined by minimizing the mean stage
height difference in absolute value for the given flow conditions searching across
Manning’s n values between 0.040 and 0.06 at an interval of 0.001. The variation of the
mean stage height difference within this range is shown in Figure 13. The mean stage
height difference absolute value is minimized to 0.02 meter at a Manning’s n of 0.043,
which is slightly smaller than the channel roughness value used in the HEC-RAS model
(0.045). This difference is inconsequential. If the actual 0.045 Manning’s n value is
adopted, the mean difference is 0.17 meter, which is an acceptable conversion for
inundation mapping purpose. The rating curve comparison with the Manning’s n of 0.045
is shown in Figure 14. The fact that the calibrated and HEC-RAS n values are close and
the rating curves consistent, supports the finding that the HAND DEM analysis is a valid
approach to determine hydraulic parameters and is expected to produce results
comparable to the more data intensive HEC-RAS approach, which is difficult to apply at
continental scale.
27
FIGURE 9: Relationship between Manning's n and the mean stage height difference absolute value.
Figure 10: Comparison between HAND-derived and RAS-derived rating curves on reach 1630223 (n=0.045).
DISCUSSION
28
This paper has presented a new method for the determination of reach average
hydraulic properties from a digital elevation model based on the Height Above Nearest
Drainage (HAND) approach. Any method is only as good as the data is and this
approach relies on the fidelity with which the DEM represents the shape of the river
channel. The comparison to HEC-RAS cross sections showed that the method can
produce reasonable results. This holds promise, as the method can be fully automated
and is based on readily available national data and can thus be applied rapidly across the
whole country reducing the need for detailed cross section-based flood inundation
mapping. We do acknowledge the preliminary and approximate nature of this method,
particularly in areas where artificial hydraulic structures or momentum interaction
between channel and floodplain controls the propagation of flood waves. Therefore, we
suggest it be used primarily as a screening tool to identify locations where more detailed
study is warranted. It also has the potential to support national scale modeling, such as
the National Water Model. We did find, with the HEC-RAS comparisons, that
adjustment of the base elevation may be needed in certain cases. We expect that as
DEMs are improved, especially if and when they include channel bed bathymetry,
perhaps from water penetrating LIDAR or sonic depth measurement, that the need for
such adjustments will be reduced, and that the results from HAND will become better.
There are some DEM and hydrography considerations that need to be addressed
in applying HAND. We illustrated how the pit filling process needed to ensure a
hydrologically conditioned DEM where each grid cell drains to the edge of the domain,
can result in inflated DEM values along the streams. Some of these values occur behind
barriers due to artefacts in the DEM production process and due to the DEM representing
the elevation of road/railway crossings and not the elevation of the bridge or drain
beneath these crossings through which water passes. We are investigating ways to use
high resolution hydrography information (e.g. NHD HR, nominally at 1:24,000 scale
(ftp://rockyftp.cr.usgs.gov/vdelivery/Datasets/Staged/Hydrography/NHD/National/HighR
esolution/) that represents flow lines with greater fidelity than NHDPlus) to adjust the
DEM so that elevation is non increasing along hydrographically mapped flow lines. This
provides the capability to punch through barriers where the hydrography indicates that
29
flow crosses the barrier, partially alleviating this problem. We are also investigating
using geodesic approaches to map flow paths (e.g., Passalacqua et al., 2010; Sangireddy
et al., 2016) to overcome barriers more automatically using geomorphologically based
filtering approaches without the requirement for hydrographic mapping.
We also showed how hydrography, notably the NHDplus medium resolution
hydrography used in the National Water Model can be misaligned with valley paths in a
DEM. The HAND approach follows flow directions downslope and requires streams
aligned with the DEM. Using the NHDPlus flowlines directly would have resulted in
spurious results for the area (as illustrated in Figures 3 and 4), and this motivated our use
of the DEM stream delineation approach starting from NHDPlus channel heads.
However, even with this approach, there is not a guarantee of a one to one mapping
between stream segments in the DEM delineated network and NHDPlus, and areas
draining to DEM stream segments may not align exactly with NHDPlus catchments
resulting in some errors around the edges when we clip the HAND raster based on
NHDPlus catchments. There is thus a need, in national datasets, for better alignment and
reconciliation of elevation and hydrography representations of streams, through efforts
such as NHDPlusHR (Viger et al., 2016).
The channel properties are currently organized by reach and a uniform water
depth is assigned to a reach during the inundation mapping process. Sometimes reaches
are quite long and assuming uniform depth is unreasonable. It is possible to split reaches
into shorter segments, but we leave to future work the exploration of the best length to
use when considering splitting reaches. The optimal distance between cross sections in
1D hydraulic modelling has been shown to be proportional to the bankfull width
(Samuels, 1990; Castellarin, 2009); adding extra cross sections within the optimal
spacing decreases rather than increases the accuracy of the simulation due to rounding
errors (Castellarin, 2009). If the segments of a reach can be specified and exported during
the HAND computational process, these new profiles across the stream cells have a
potential to replace the traditional cross sections used in 1-D hydraulic models.
Organizing hydraulic properties in a segment unit smaller than a reach also has the
potential to help resolve the instability problem in large-scale hydraulic models when a
sudden channel shape change happens at a river confluence. The validation of HAND
30
channel geometry properties through the comparison with HEC-RAS-derived reach-
average channel should be extended to a larger sample size. To ensure
comprehensiveness, this sample should cover reaches of different stream orders and with
different physiographic settings.
A generic way to evaluate channel and floodplain roughness values from land
cover information or any other instructive variables would be helpful to improve the
accuracy of the HAND rating curves. If the bankfull depth information of all the rivers in
a large-scale network could be derived from the geometry data, instead of applying a
single Manning’s equation to all water levels in a reach, a compound uniform flow
equation could be implemented to better describe the hydraulics when the water level
reaches the floodplain with a different roughness value. Also, the hydraulic conductance
underestimation problem of empirical hydraulic equations at high flow condition needs to
be considered. If a large-scale hydrodynamic model such as SPRNT (Liu and Hodges,
2014) is used, rating curves can be generated from the dynamic simulation with HAND
river geometry information fed to the model. Note that, if a different method is used to
determine the water depth in the channel, such as by direct observation or by using a
solution of the full Saint Venant equations (SPRNT), then the hydraulic geometry data
and the HAND raster can be used to produce an inundation map without the need for use
of a synthetic rating curve.
CONCLUSION
In this paper, a workflow for computing river geometry and estimating channel
reach rating curves based on DEM derived Height Above Nearest Drainage (HAND) was
presented. This was illustrated for NHDPlus reaches of the Blanco watershed using the
1/3 arc sec USGS 3DEP Elevation dataset DEM. The workflow requires as input only a
DEM, channel heads (or a stream network from which they can be extracted), and a priori
Manning's n. The hydraulic geometry properties and rating curve derived from the
HAND approach were shown to be generally consistent with similar information derived
from more traditional cross sections and HEC-RAS hydraulic modeling, in a much more
labor and data intensive process. Issues related to DEM fidelity and the need for
31
adjustments in the base elevation were identified and discussed. Calibration, to
determine an optimal Manning’s n roughness parameter produced a value very close to
the value used in HEC-RAS modeling, further validating the approach. Overall, this
approach was shown to have promise for supporting quantitative hydraulic modeling at
continental scale using readily available national datasets. A companion paper (Liu et al.,
2017) applies this approach to this nationally available data using high performance
computing.
Recent flood disasters resulting from hurricanes Harvey, Irma and Maria,
emphasize the need for rapid, approximate flood inundation mapping over very large
areas. The authors were involved at the Texas State Operations Center in the flood
emergency response for Hurricane Harvey in Texas, which produced flooding in about
40,000 miles of streams and rivers in Southeast Texas during August and September
2017. Hurricane Harvey alone was the worst recorded storm for 3-5 day duration rainfall
in the history of the United States. This resulted in a huge flood emergency response
operation involving hundreds of helicopters and aircraft, thousands of trucks and boats,
and tens of thousands of flood emergency response personnel, directed from the Texas
State Operations Center. A critical piece of information in facing such a huge disaster is
a map of the flooded water conditions across the landscape throughout the impacted zone
to inform the direction of flood emergency response to people and communities who
need help.
During Hurricane Harvey, the US Army Corps of Engineers produced flood
inundation mapping using engineering scale models on the main stem rivers of the region,
including the Guadalupe, Colorado, Brazos, Trinity, Neches and Sabine rivers. The
Height Above Nearest Drainage method linked to flows computed by the National Water
Model was used to create inundation mapping throughout the region. To be effective in
providing actionable intelligence for flood emergency response, such mapping is required
within a few hours of the forecast discharges becoming available. There are many
approximations inherent in the flood inundation mapping described in this paper.
However, what the events during Hurricane Harvey demonstrated is that this method can
be applied quickly to provide an estimate of the flood inundation extent over a very large
region.
32
ACKNOWLEDGEMENTS This research has been supported in part by Texas Division of Emergency
Management under grant number 26-3215-2275 and Consortium of Universities for the
Advancement of Hydrologic Science, Inc. (CUAHSI). Part of this study was conducted
during the 2016 National Water Center Innovators Program: Summer Institute at the
National Water Center. Thanks to Fort Worth District of US Army Corps of Engineers
for providing the Blanco HEC-RAS model. Thanks to the Editor, Associate Editor, and
three reviewers for insightful comments which significantly improved this work.
LITERATURE CITED
Allen, George H., and Tamlin M. Pavelsky, 2015. Patterns of river width and surface area
revealed by the satellite‐derived North American River Width data set. Geophysical Research Letters 42(2): 395-402. DOI: 10.1002/2014GL062764.
Andreadis, Konstantinos M., Guy J.-P. Schumann, and Tamlin M. Pavelsky, 2013. A simple global river bankfull width and depth database. Water Resources Research 49(10): 7164-7168. DOI: 10.1002/wrcr.20440.
Apel, Heiko, G. T. Aronica, H. Kreibich, and A. H. Thieken, 2009. Flood risk analyses—how detailed do we need to be?. Natural Hazards 49(1): 79-98. DOI: 10.1007/s11069-008-9277-8
Castellarin, Attilio, Giuliano Di Baldassarre, Paul D. Bates, and Armando Brath, 2009. Optimal cross-sectional spacing in Preissmann scheme 1D hydrodynamic models. Journal of Hydraulic Engineering 135(2): 96-105. DOI: 10.1061/(ASCE)0733-9429(2009)135:2(96)
Garambois, Pierre-André, Stéphane Calmant, Hélène Roux, Adrien Paris, Jérôme Monnier, Pascal Finaud-Guyot, Amanda Samine Montazem, and Joecila Santos da Silva, 2017. Hydraulic visibility: Using satellite altimetry to parameterize a hydraulic model of an ungauged reach of a braided river. Hydrological Processes 31(4): 756-767. DOI: 10.1002/hyp.11033
Gesch, D.B., Oimoen, M.J., and Evans, G.A., 2014. Accuracy assessment of the U.S. Geological Survey National Elevation Dataset, and comparison with other large-area elevation datasets—SRTM and ASTER: U.S. Geological Survey Open-File Report 2014–1008, 10 p., DOI: 10.3133/ofr20141008.
Getirana, Augusto C. V., Boone, Aaron Boone, Dai Yamazaki, Nelly Mognard, 2013. Automatic parameterization of a flow routing scheme driven by radar altimetry data: Evaluation in the Amazon basin. Water Resources Research 49(1): 614-629. DOI: 10.1002/wrcr.20077
Hallegatte, Stephane, Colin Green, Robert J. Nicholls, and Jan Corfee-Morlot, 2013. Future flood losses in major coastal cities. Nature climate change 3(9): 802-806. DOI: 10.1038/nclimate1979
Knox, James C., 1993. Large increases in flood magnitude in response to modest changes in climate. Nature 361(6411): 430-432. DOI: 10.1038/361430a0
33
Leopold, Luna Bergere, and Thomas Maddock, 1953. The hydraulic geometry of stream channels and some physiographic implications (No. 252). US Government Printing Office.
Liu, Frank, and Ben R. Hodges, 2014. Applying microprocessor analysis methods to river network modelling. Environmental Modelling & Software 52: 234-252. DOI: 10.1016/j.envsoft.2013.09.013
Liu, Yan Y., David R. Maidment, David G. Tarboton, Xing Zheng, and Shaowen Wang, 2017. A CyberGIS Integration and Computation Framework for High-Resolution Continental-Scale Flood Inundation Mapping. Journal of the American Water Resources Association (JAWRA), Draft for review.
Maidment, David R., 1992. Handbook of hydrology. McGraw-Hill, New York, ISBN-13: 978-0070397323
Maidment, David R., 2016. Conceptual Framework for the National Flood Interoperability Experiment. Journal of the American Water Resources Association (JAWRA) 53(2): 245-257. DOI: 10.1111/1752-1688.12474
Milly, P. Christopher D., Richard T. Wetherald, K. A. Dunne, and Thomas L. Delworth, 2002. Increasing risk of great floods in a changing climate. Nature 415(6871): 514-517. DOI: 10.1038/415514a
Nobre, Antonio Donato, Luz Adriana Cuartas, Martin G. Hodnett, Camilo Daleles Rennó, G. Rodrigues, A. Silveira, Maarten J. Waterloo and S. Saleska, 2011. Height Above the Nearest Drainage–a hydrologically relevant new terrain model. Journal of Hydrology 404(1): 13-29. DOI: 10.1016/j.jhydrol.2011.03.051
Nobre, Antonio Donato, Luz Adriana Cuartas, Marcos Rodrigo Momo, Dirceu Luís Severo, Adilson Pinheiro, and Carlos Afonso Nobre, 2016. HAND contour: A new proxy predictor of inundation extent. Hydrological Processes 30(2): 320-333. DOI: 10.1002/hyp.10581
Noji, E. K., 1991. Natural disasters. Critical care clinics 7(2): 271-292. O'Callaghan, John F., and David M. Mark, 1984. The extraction of drainage networks from
digital elevation data. Computer vision, graphics, and image processing 28(3): 323-344. DOI: 10.1016/S0734-189X(84)80011-0
Ohl, Christopher A., and Sue Tapsell, 2000. Flooding and human health: the dangers posed are not always obvious. British Medical Journal 321(7270): 1167-1167.
Paris, Adrien, Rodrigo Dias de Paiva, Joecila Santos da Silva, Daniel Medeiros Moreira, Stephane Calmant, Pierre‐André Garambois, Walter Collischonn, Marie‐Paule Bonnet, and Frederique Seyler, 2016. Stage-discharge rating curves based on satellite altimetry and modeled discharge in the Amazon basin. Water Resources Research 52(5): 3787-3814. DOI: 10.1002/2014WR016618.
Passalacqua, Paola, Tien Do Trung, Efi Foufoula‐Georgiou, Guillermo Sapiro, and William E. Dietrich, 2010. A geometric framework for channel network extraction from lidar: Nonlinear diffusion and geodesic paths. Journal of Geophysical Research Earth Surface. 115: F01002. DOI: 10.1029/2009JF001254
Pavelsky, Tamlin M., and Laurence C. Smith, 2008. RivWidth: A software tool for the calculation of river widths from remotely sensed imagery. IEEE Geoscience and Remote Sensing Letters 5(1): 70-73. DOI: 10.1109/LGRS.2007.908305
Rennó, Camilo Daleles, Antonio Donato Nobre, Luz Adriana Cuartas, João Vianei Soares, Martin G. Hodnett, Javier Tomasella, and Maarten J. Waterloo, 2008. HAND, a new terrain
34
descriptor using SRTM-DEM: Mapping terra-firme rainforest environments in Amazonia. Remote Sensing of Environment 112(9): 3469-3481. DOI: 10.1016/j.rse.2008.03.018
Rodda, Harvey J., 2005. The development and application of a flood risk model for the Czech Republic. Natural hazards 36(1-2): 207-220. DOI: 10.1007/s11069-004-4549-4
Samuels, P. G., 1990. Cross-section location in 1-D models. In: 2nd International Conference on River Flood Hydraulics. Wiley, Chichester, pp. 339-350.
Sangireddy, Harish, Colin P. Stark, Anna Kladzyk, Paola Passalacqua, 2016. GeoNet: An open source software for the automatic and objective extraction of channel heads, channel network, and channel morphology from high resolution topography data, Environmental Modeling and Software. 83: 58-73. DOI: 10.1016/j.envsoft.2016.04.026
Tarboton, David G., Rafael L. Bras and Ignacio Rodriguez‐Iturbe, 1991. On the Extraction of Channel Networks from Digital Elevation Data. Hydrologic Processes 5(1): 81-100. DOI: 10.1002/hyp.3360050107
Tarboton, David G., Rafael L. Bras and Ignacio Rodriguez‐Iturbe, 1992. A Physical Basis for Drainage Density. Geomorphology 5(1/2): 59-76. DOI: 10.1016/0169-555X(92)90058-V
Tarboton, David G., 1997. A new method for the determination of flow directions and upslope areas in grid digital elevation models. Water Resources Research 33(2): 309-319. DOI: 10.1029/96WR03137
Tarboton, David G. and Daniel P. Ames, 2001. Advances in the mapping of flow networks from digital elevation data. In: Bridging the Gap: Meeting the World's Water and Environmental Resources Challenges. World Water and Environmental Resources Congress, Orlando, Florida, pp. 1-10. DOI: 10.1061/40569(2001)166
Tarboton, David G., 2016. Terrain Analysis Using Digital Elevation Models (TauDEM). Utah Water Research Laboratory. Utah State University. http://hydrology.usu.edu/taudem. accessed 9/5/2016.
Tesfa, Teklu K., David G. Tarboton, Daniel W. Watson, Kimberly A. T. Schreuders, Matthew E. Baker and Robert M. Wallace, 2011. Extraction of hydrological proximity measures from DEMs using parallel processing. Environmental Modelling & Software 26(12): 1696-1709. DOI: 10.1016/j.envsoft.2011.07.018
Viger, Roland J., Alan Rea, Jeffrey D. Simley and Karen M. Hanson, 2016. NHDPlusHR: A National Geospatial Framework for Surface-Water Information, Journal of the American Water Resources Association (JAWRA) 52(4): 901-905. DOI: 10.1111/1752-1688.12429
Yamazaki, Dai, Fiachra O'Loughlin, Mark A. Trigg, Zachary F. Miller, Tamlin M. Pavelsky, and Paul D. Bates, 2014. Development of the global width database for large rivers. Water Resources Research 50(4): 3467-3480. DOI: 10.1002/2013WR014664
Zheng, X., 2015. Hydraulic fabric: an information framework for river channel cross section data. Master Dissertation, University of Texas at Austin, Austin, Texas