Embed Size (px)
Citation preview
f\
University of Minnesota St. Anthony Falls Hydraulic Laboratory
Project Report No. 295
RIVER ICE PROCESSES AND FLOODING: FIELD DATA COLLECTION AND MATHEMATICAL MODELING
by
Qizhong Guo, Oi Kuwang Tan
and
Charles C. S. Song
Prepared for
Legislative Commission on Minnesota Resources State of Minnesota
June 1989 Minneapolis, Minnesota

The University of Minnesota is committed to the policy that all persons shall have equal access to its programsj facilities j and employment without regard to race religionj color, sexj national origin, handicap, age or veteran status.
---------~ ~ --~ -~ - ~~--~ --~----~-~-----~-~---~- ----------~-----------------
(~.
ACKNOWLEDGEMENT
This research was funded by the Legislative Commission on Minnesota Resources, Minnesota State Legislature, 1987-89 biennial.
During collection of data and information about river ice processes and £Looding in the Mississippi River Basin near Anoka, and in the Red River of the North, the following organizations and individuals offered great help:
U. S. Geological Survey, St. Paul Office: George Carlson, Greg Mitton et al.
U. S. Corp's of Engineers, St. Paul District: Richard Pormerleau et al. NWS River Forecast Center, Minneapolis Office: Larry Longsdorff.
et al. Northern States Power Company: Anthony Bauman (retired), Roger
Anderson et al. Anoka City engineer's Office: Robert B. Johnson (retired), Ray
Schultz et al. . Hennepin County Park Reserve District: Mark Johnson et al. Elk River City Engineer's Office: Steve Rohlf. Anoka City Sewage Treatment Plant: Howard Grindy. Minnesota Department of Natural Resources; Russ Schultz et al. St. Anthony Falls Hydraulic Laboratory: John Gulliver et al. City of Coon Rapids: Gaylord Aldinger et al. City of Dayton: Douglas Mclean (retired) et al. Anoka County Historical Society Sherburne County Historical Society Wright Country Historical Society
Michael G. Ferrick of the Cold Regions Research and' Engineering Laboratory, U. S. Army Corps of Engineers read the draft report, and some of his comments were included in the final report. .
Pat Swanson, Diana Dalbotten, and Terri Boldischar typed and edited the manuscript. Aaron Gimbel produced eleven figures described herein.
i

ii
"
IJ. ,
Acknowledgements
List of Figures
TABLE OF CONTENTS
Page No.
i
v
I. Introduction 1
II. Ice Processes and Flooding in the Mississippi River Basin near Anoka 3
A. Description of Site 3
B. Ice Processes and Flooding in 1964-65 Cold Season 8
C. Ice Processes and flooding in 1983-84 Cold Season 19
D. Analysis 31
III. . Modeling of Ice Cover Freeze-up
A. Hydraulic Routing
B. - Distribution of Water Temperature and Frazil Concentration
C. Formation and Progression of Ice-Cover
D. Growth and Decay of Ice Cover
E. Freeze-up Program Logic
F. Simplified Test Case
iii
37
37
39
42
44
45
45
Page No.
IV. Modeling of Ice Cover Breakup, Jamming and Flooding 53
A. Ice cover and Ice Jam 53
B. Simplified River System Near Anoka and Specified Flow Conditions 53
C. Free Surface Flow 55
D. Ice Covered Flow 60
E. Ice Cover Breakup Process and Flooding 63
F. Ice Jamming Process and Flooding 64
V. Conclusions 74
References 75
Appendix A 79
iv
Figure No.
II-1
II-2
II-3
II-4
II-5
II--6
II-7
II-8
II-9
II-10
II-ll
II-12
II-13
II-14
II-15
------- ----------------------
LIST OF FIGURES
The Mississippi River and its tributaries flowing toward Anoka.
Detailed river geometry in the study reach.
Mississippi River bed slope.
A cross-section of the Coon Rapids Dam.
Air temperature at Anoka in 1964--65 cold season.
Snow thickness on ground in '1964--65 cold season.
Flow discharges in the Mississippi River and tributaries above Anoka in 1964--65 cold season.
Flow discharge downstream of the Coon Rapids Dam during 1965 spring flood.
Water stage in the Crow River at Rockford during 1965 spring flood.
Water stage in the Mississippi River at Anoka during 1965 spring flood.
Water stage downstream of the Coon Rapids Dam during 1965 spring flood.
A. Ice jam staying above the Coon Rapids Dam in December 1984.
B. Ice jam breaking through the Coon Rapids Dam in December 1984.
Air temperature at Anoka in 1983-84 cold season.
Snow thickness on ground in 1983-84 cold season.
Flow discharge in the Crow River at Rockford in the 1983-84 cold season.
v
Figure No.
11-16
11-17
11-18
11-19
11-20
11-21
11-22
111-1
111-2
111-3
ll-4
111-5
111-6
IV-l
IV-2
IV-3
IV-4
IV-5
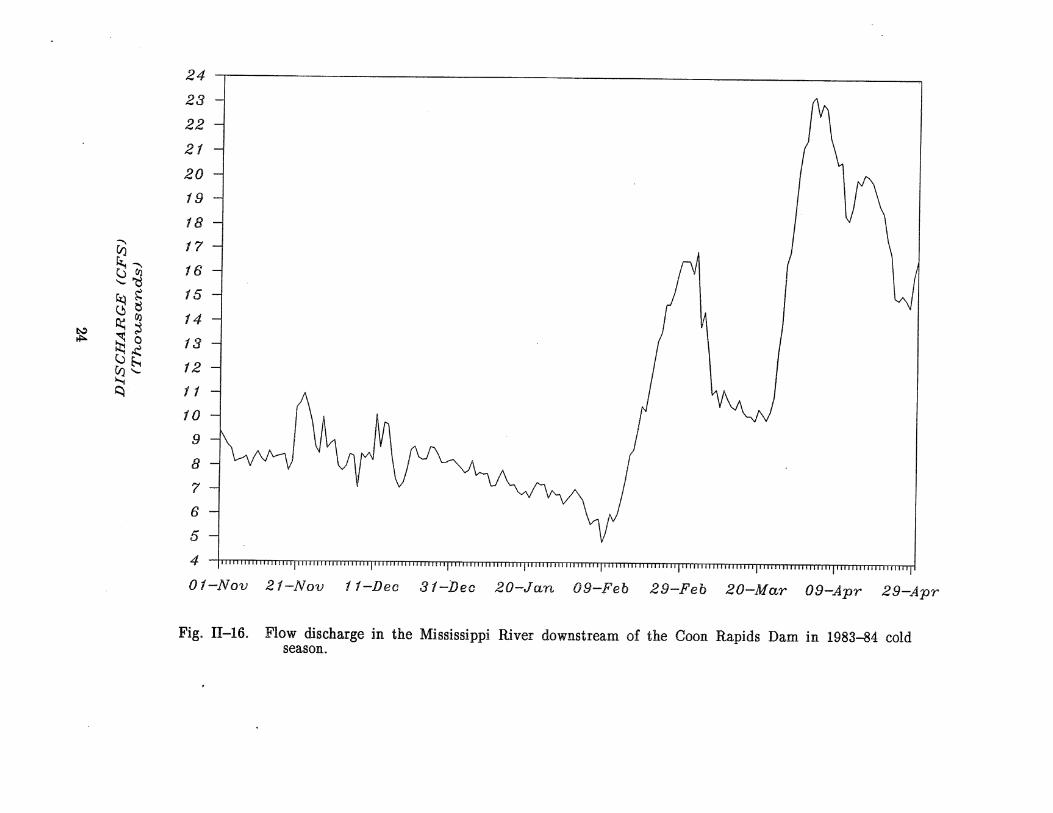
Flow discharge in the Mississippi River downstream of the Coon Rapids Dam in 1983-84 cold s-eason.
Water stage in the Crow River at Rockford in 1983-84 cold season.
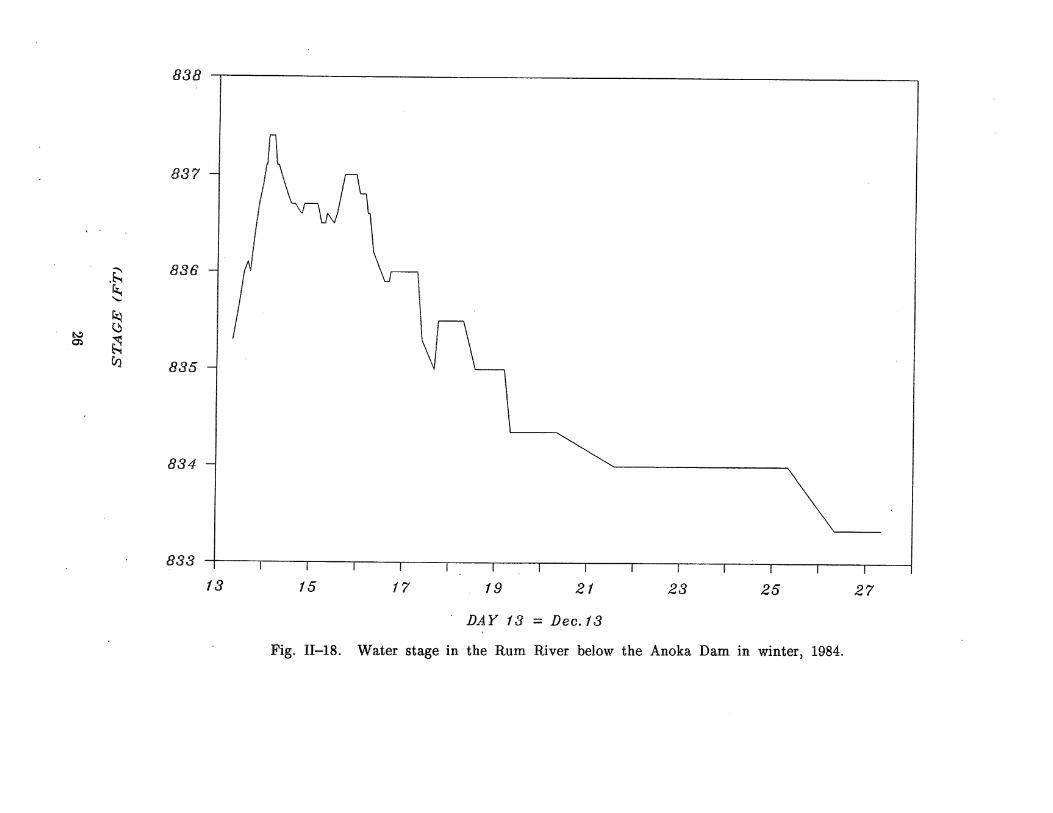
Water stage in the Rum River below the Anoka Dam in winter, 1984.
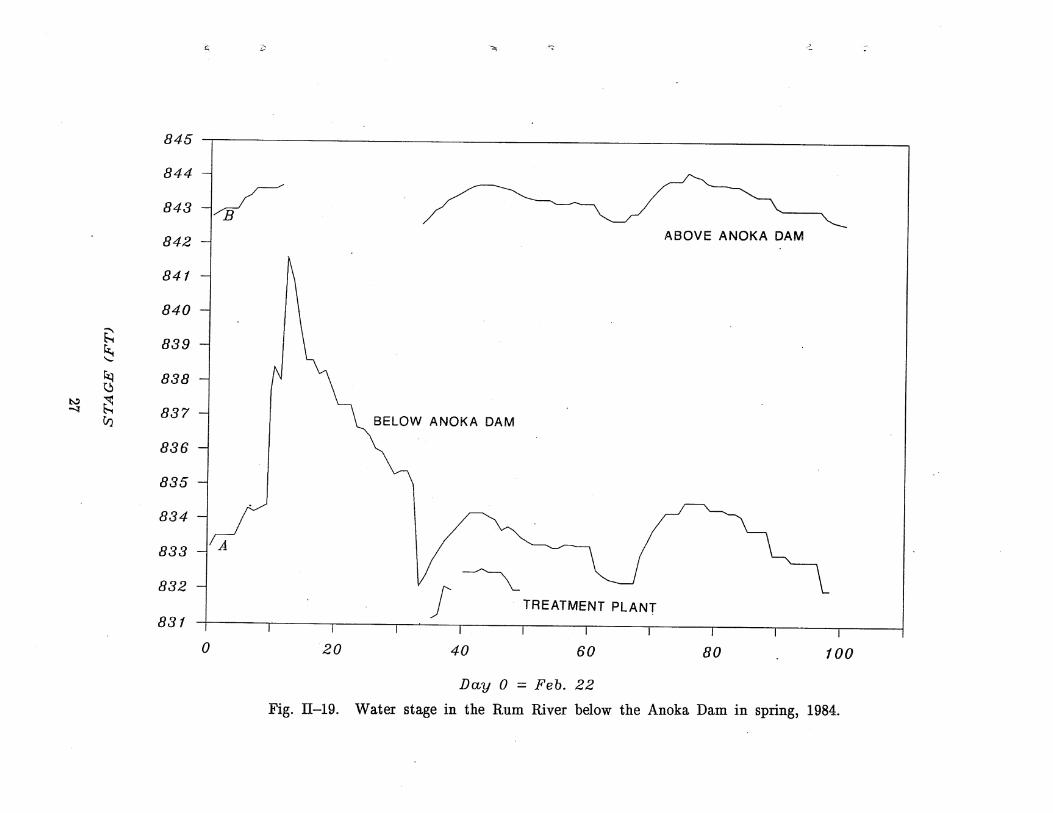
Water stage in the Rum River below the Anoka Dam in spring, 1984.
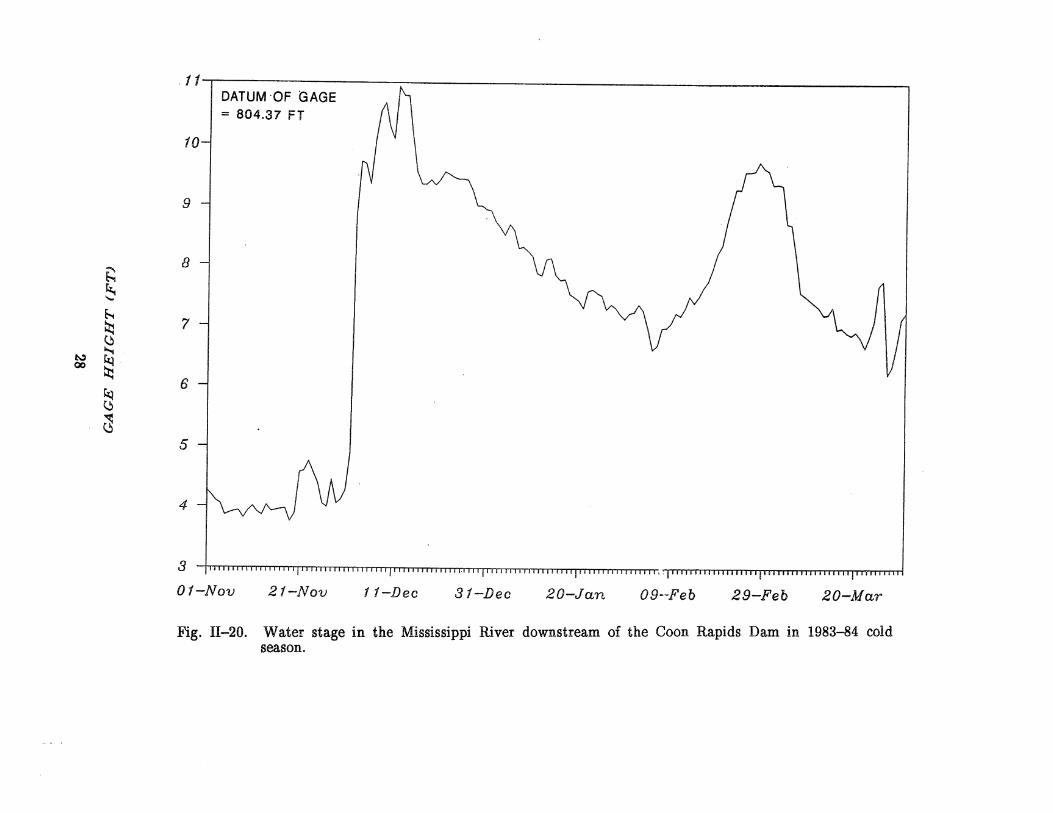
Water stage in the Mississippi River downstrea.m of the Coon Rapids Dam. in 1983-84 cold season.
Ice cover in the Crow River near Rockford, Jan. 25, 1984.
Schematic diagram of an equilibrium ice jam.
Freeze-up program logic.
Air temperature in 1964-65 cold season.
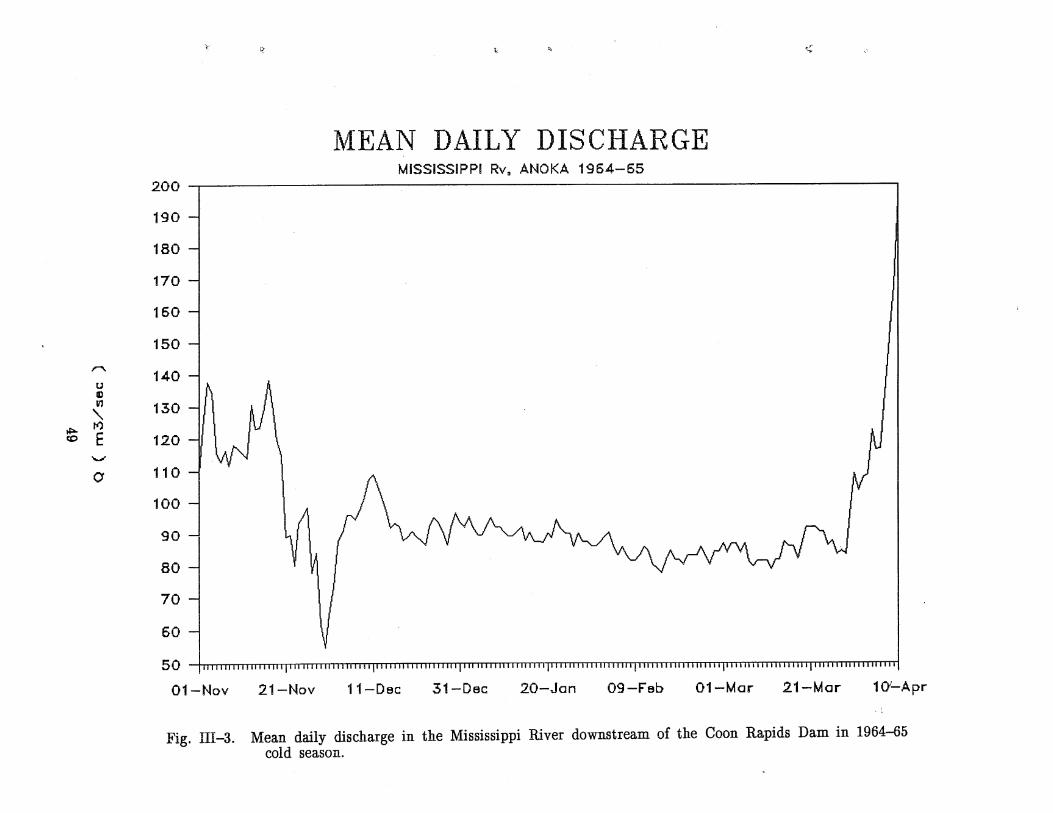
Mean daily discharge in the Mississippi River downstream of the Coon Rapids Dam in 1964-65 cold season.
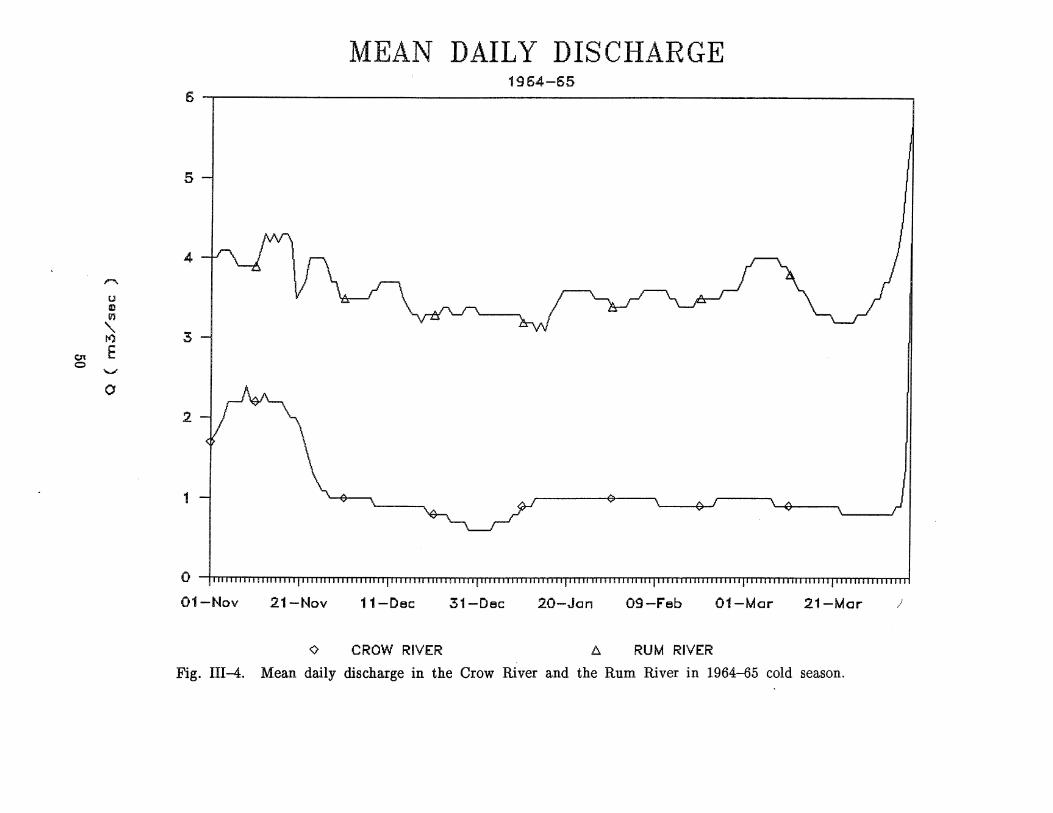
Mean daily discharge in the Crow River and the Rum River in 1964-65 cold season.
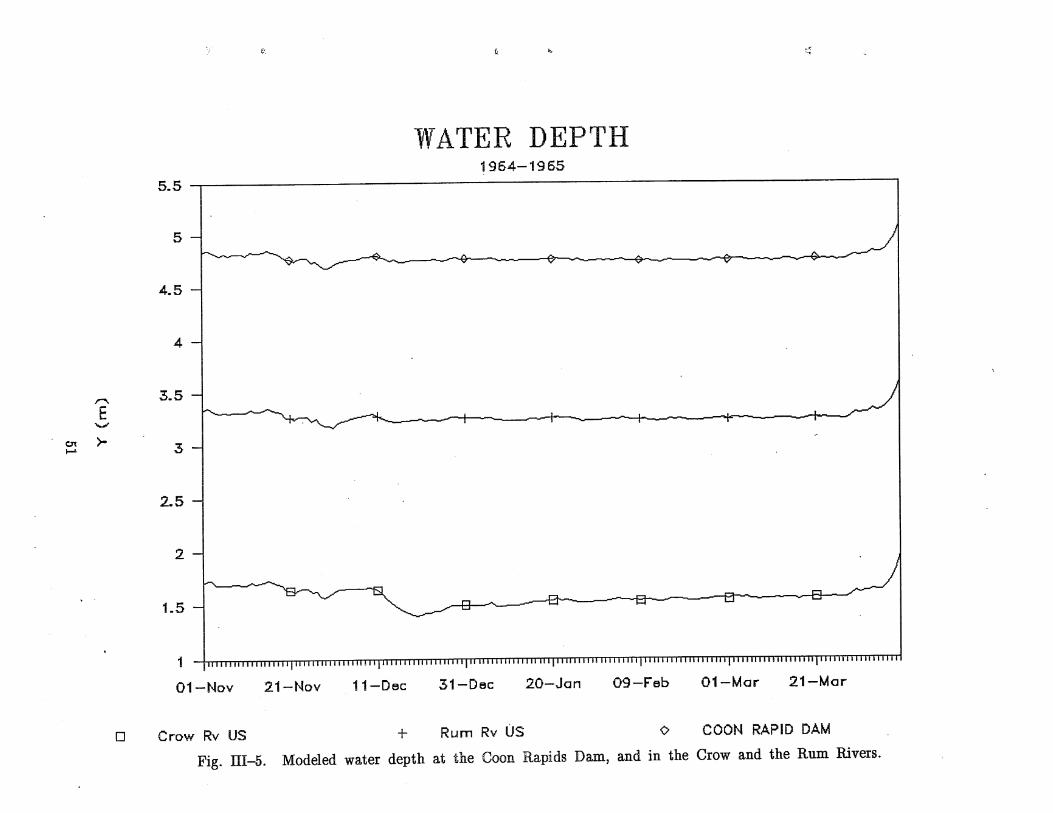
Modeled water depth at the Coon Rapids Dam, and in the Crow and the Rum Rivers.
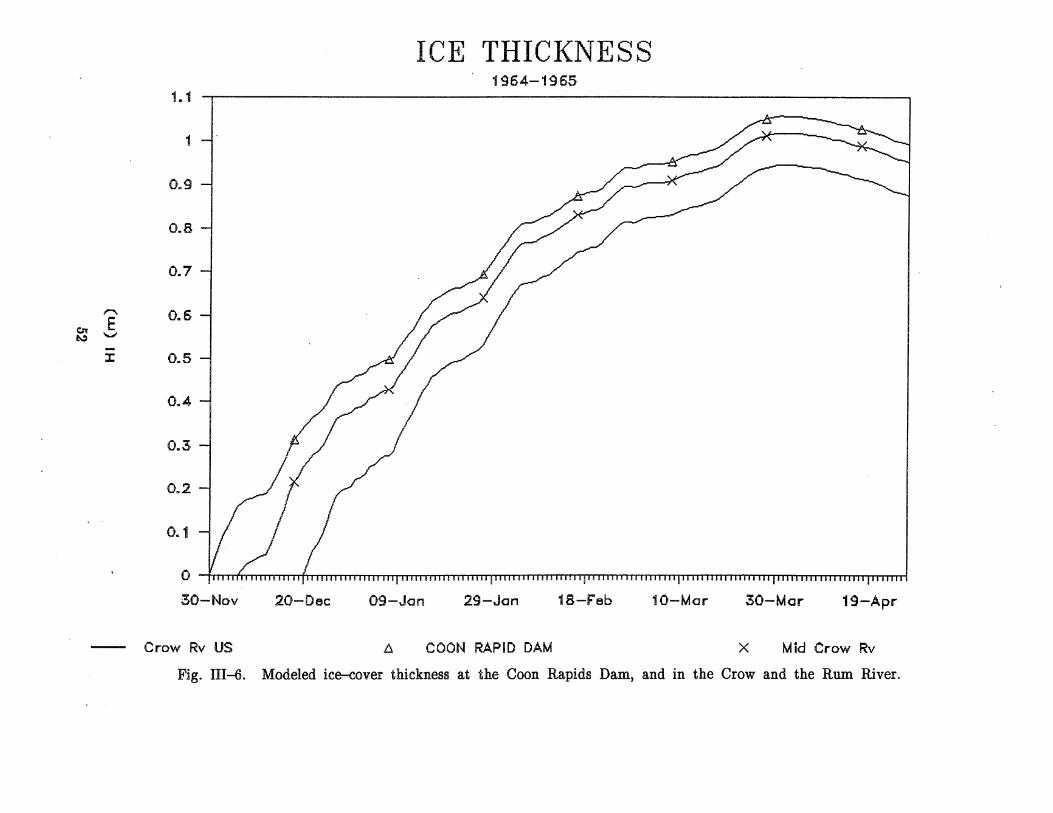
Modeled ice-cover thickness at the Coon Rapids Dam, and in the Crow and the Rum River.
Simplified Mississippi River System for modeling purpose.
Modeled free surface wave movements due to the upstream gradual ice jam release.
Modeled free surface flow depth due to the upstream gradual ice jam release.
Modeled free surface surge movement due to the upstream instantaneous ice jam. release.
Modeled free surface flow depth due to the upstream gradual ice jam release and the downstream ice jam.
vi
I)
fl,
Figure No.
IV-6
IV-7
IV--8
IV-9
IV-l 0
IV-ll
IV-12
IV-l 3
Modeled ice covered flow depth.
Modeled flow depth during ice cover breakuI;>.
Sketch of concept for modeling the ice cover breakup and jamming process.
Initial ice cover and flow distribution for modeling.
Modeled ice breakup and jamming process.
Modeled equilibrium ice jam and peak water stage.
Modeled ice jam failure.
Modeled flow depth during ice breakup and jamming process.
vii

----------- ------~------- --~--------~--------
\1
~\
I. INTRODUCTION
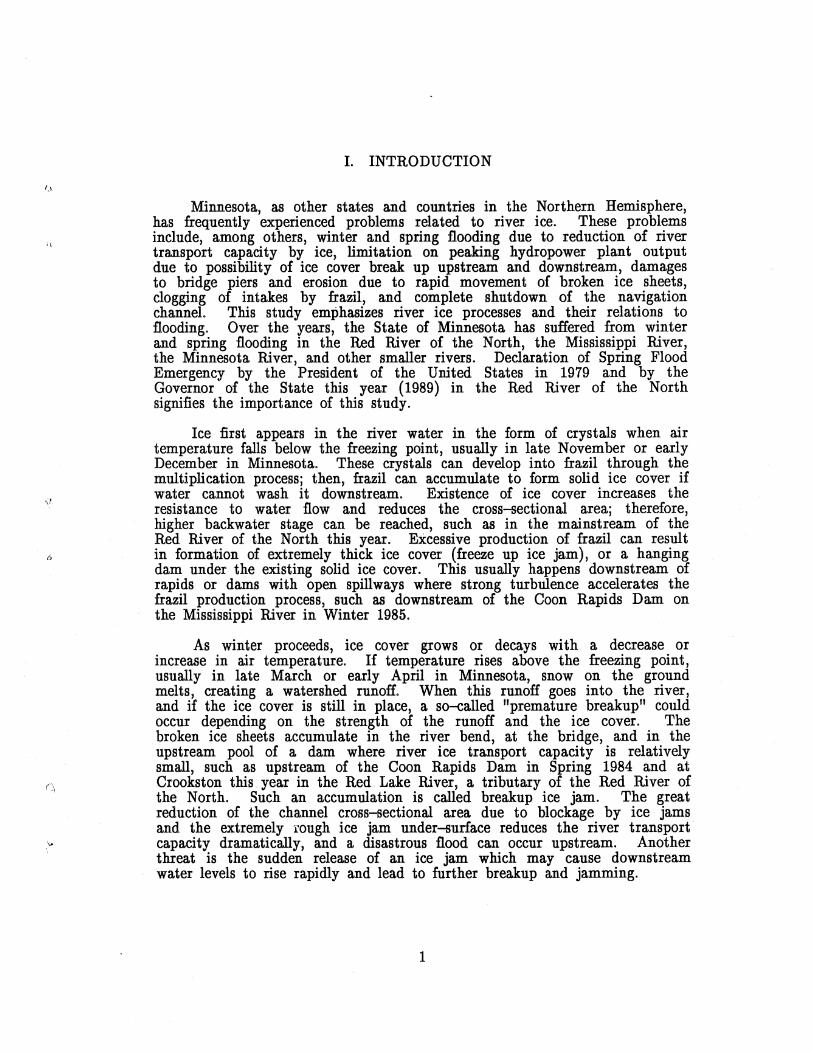
Minnesota, as other states and countries in the Northern Hemisphere, has frequently experienced problems related to river ice. These problems include, among others, winter and spring flooding due to reduction of river transport capacity by ice, limitation on peaking hydropower plant output due to possibility of ice cover break up upstream and downstream, damages to bridge piers and erosion due to rapid movement of broken ice sheets, clogging of intakes by frazil, and complete shutdown of the navigation channel. This study emphasizes river ice processes and their relations to flooding. Over the years, the State of Minnesota has suffered from winter and spring flooding in the Red River of the North, the Mississippi River, the Minnesota River, and other smaller rivers. Declaration of Spring Flood Emergency by the President of the United States in 1979 and by the Governor of the State this year (1989) in the Red River of the North signifies the importance of this study.
Ice first appears in the river water in the form of crystals when air temperature falls below the freezing point, usually in late November or early December in Minnesota. These crystals can develop into frazil through the multiplication process; then, frazil can accumulate to form solid ice cover if water cannot wash it downstream. Existence of ice cover increases the resistance to water flow and reduces the cross-sectional area; therefore, higher backwater stage can be reached, such as in the mainstream of the Red River of the North this year. Excessive production of frazil can result in formation of extremely thick ice cover (freeze up ice jam), or a hanging dam under the existing solid ice cover. This usually happens downstream of rapids or dams with open spillways where strong turbulence accelerates the frazil production process, such as downstream of the Coon Rapids Dam on the Mississippi River in Winter 1985.
As winter proceeds, ice cover grows or decays with a decrease or increase in air temperature. If temperature rises above the freezing point, usually in late March or early April in Minnesota, snow on the ground melts, creating a watershed runoff. When this runoff goes into the river, and if the ice cover is still in place, a so-called "premature breakup" could occur depending on the strength of the runoff and the ice cover. The broken ice sheets accumulate in the river bend, at the bridge, and in the upstream pool of a dam where river ice transport capacity is relatively small, such as upstream of the Coon Rapids Dam in Spring 1984 and at Crookston this year in the Red Lake River, a tributary of the Red River of the North. Such an accumulation is called breakup ice jam. The great reduction of the channel cross-sectional area due to blockage by ice jams and the extremely rough ice jam under-surface reduces the river transport capacity dramatically, and a disastrous flood can occur upstream. Another threat is the sudden release of an ice jam which may cause downstream water levels to rise rapidly and lead to further breakup and jamming.
1
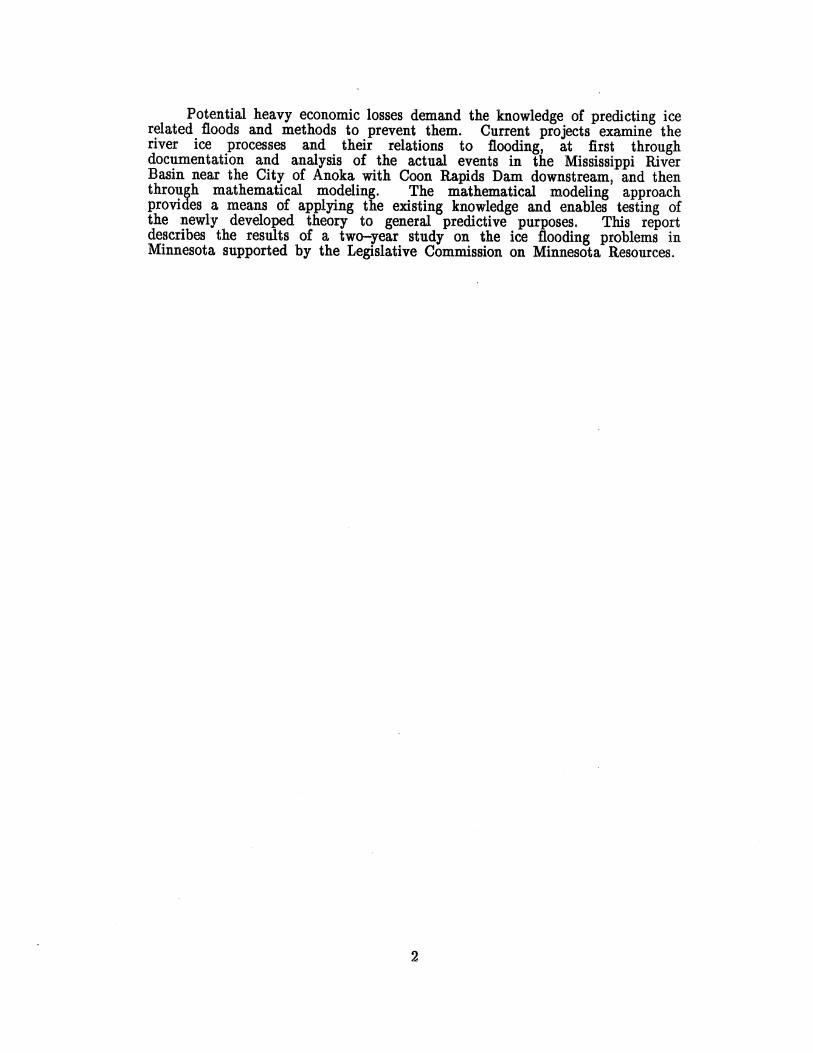
Potential heavy economic losses demand the knowledge of predicting ice related floods and methods to prevent them. Current projects examine the river ice processes and their relations to flooding, at first through documentation and analysis of the actual events in the Mississippi River Basin near the City of Anoka with Coon Rapids Dam downstream, and then through mathematical modeling. The mathematical modeling approach provides a means of applying the existing knowledge and enables testing of the newly developed theory to general predictive purposes. This report describes the results of a two-year study on the ice flooding problems in Minnesota supported by the Legislative Commission on Minnesota Resources.
2
------- ~~--~--- - ----------~---~-~-~ - ---~- -- --~-~-----~----~-~- -~ -~---------------~----- ~
f.l
L\
II. ICE PROCESSES AND FLOODING IN THE
MISSISSIPPI RIVER BASIN NEAR ANOKA
A. DESCRIPTION OF SITE
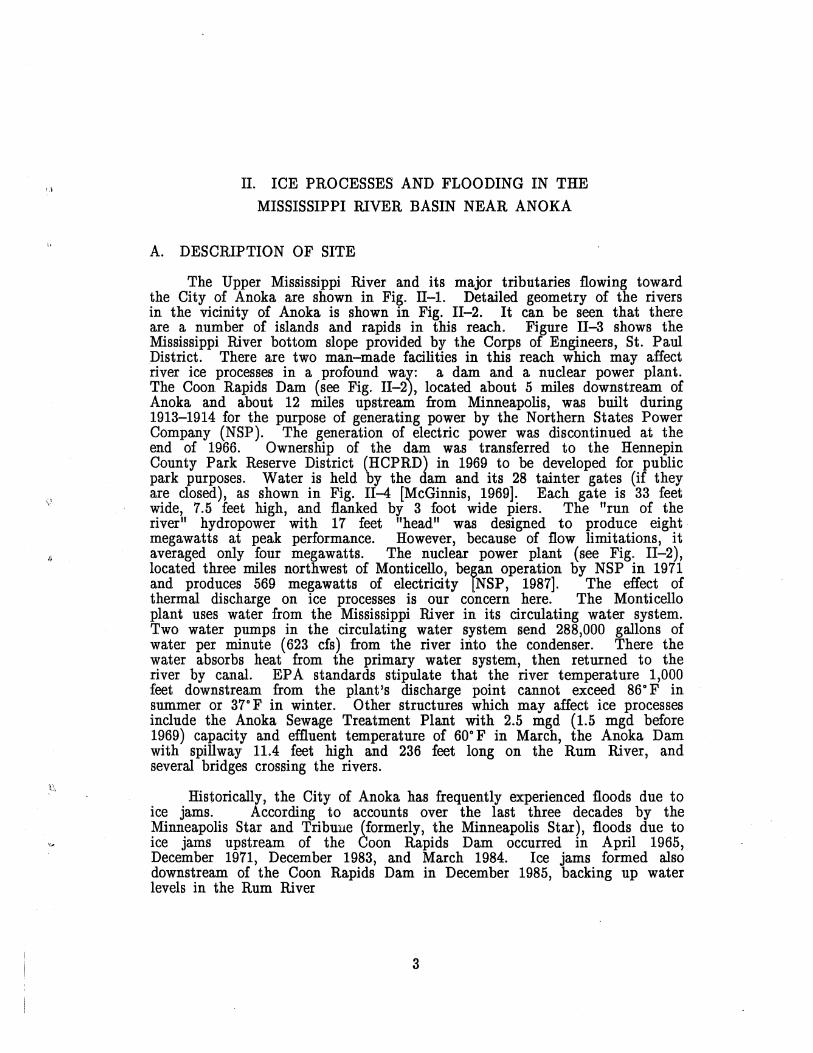
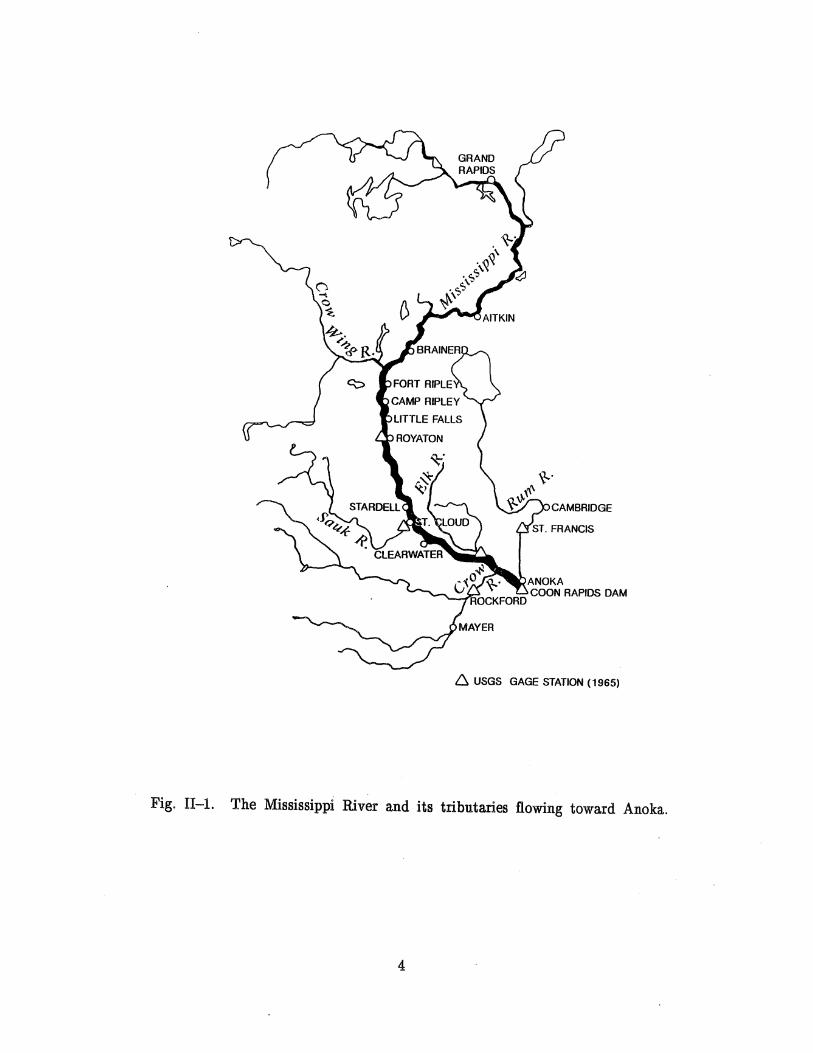
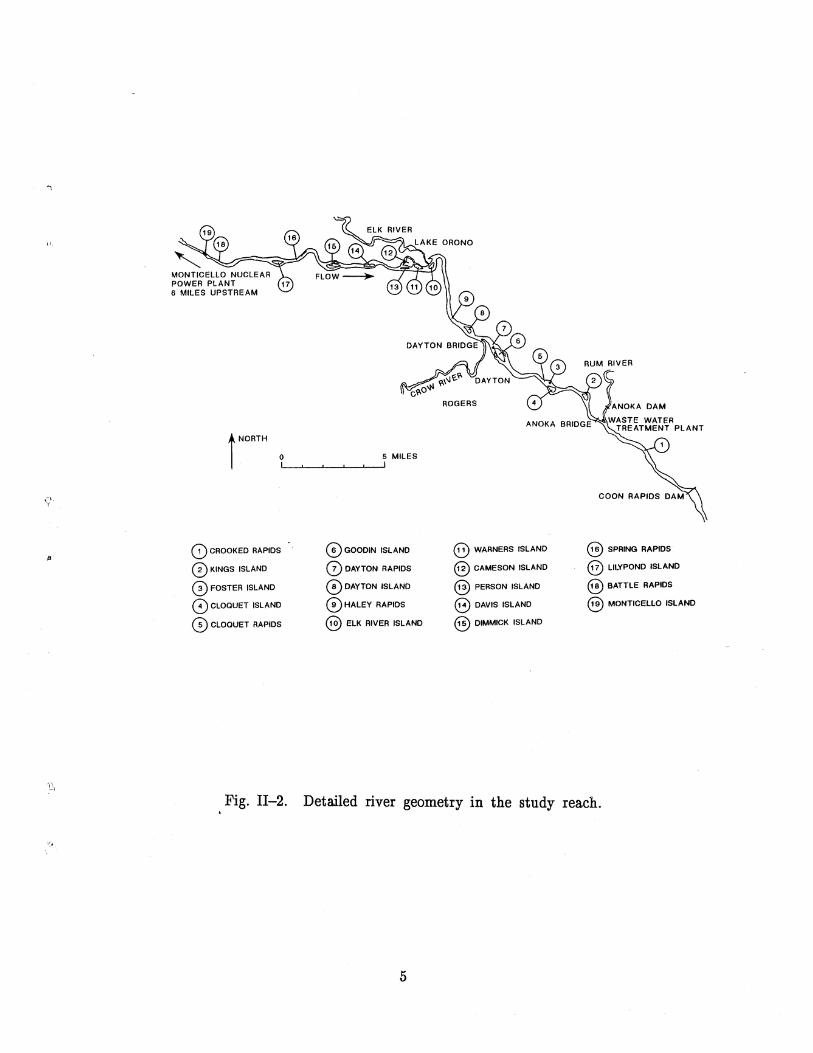
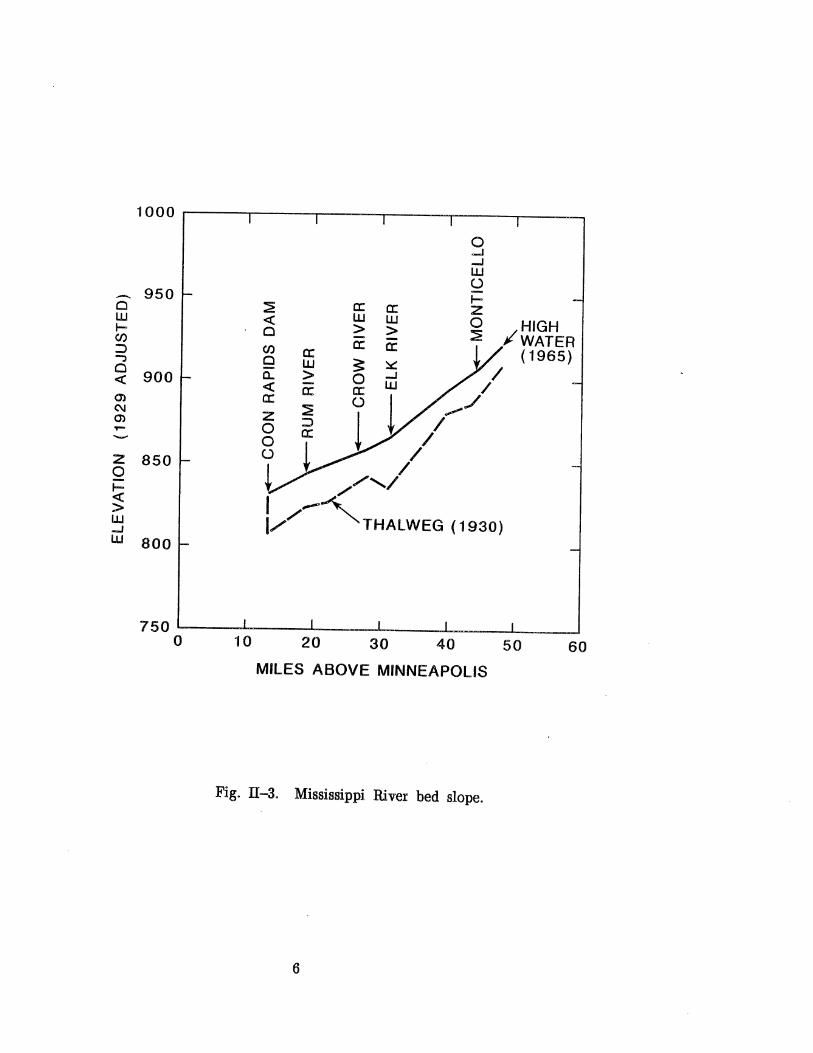
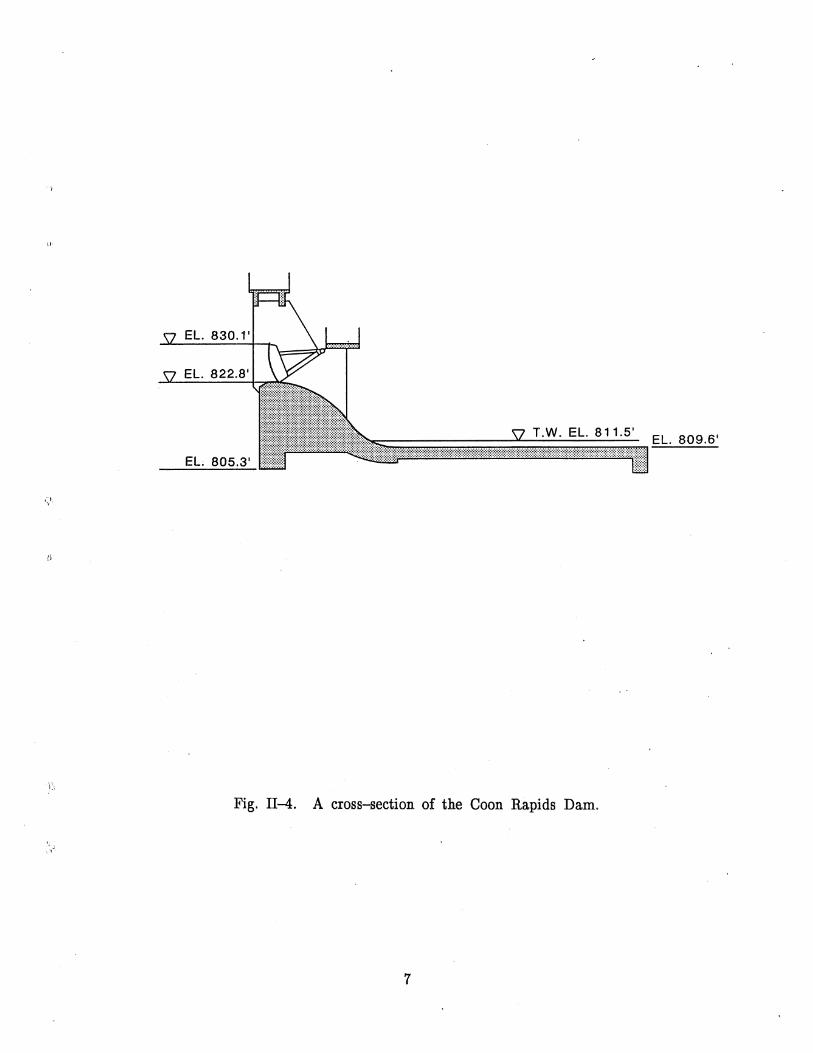
The Upper Mississippi River and its major tributaries flowing toward the City of Anoka are shown in Fig. II-I. Detailed geometry of the rivers in the vicinity of Anoka is shown in Fig. II-2. It can be seen that there are a number of islands and rapids in this reach. Figure II-3 shows the Mississippi River bottom slope provided by the Corps of Engineers, St. Paul District. There are two man-made facilities in this reach which may affect river ice processes in a profound wa~: a dam and a nuclear power plant. The Coon Rapids Dam (see Fig. II-2) , located about 5 miles downstream of Anoka and about 12 miles upstream from Minneapolis, was built during 1913-1914 for the purpose of generating power by the Northern States Power Company (NSP). The generation of electric power was discontinued at the end of 1966. Ownership of the dam was transferred to the Hennepin County Park Reserve District (HCPRD) in 1969 to be developed for public park purposes. Water is held by the dam and its 28 tainter gates (if they are closed), as shown in Fig. II-4 [McGinnis, 1969]. Each gate is 33 feet wide, 7.5 feet high, and flanked by 3 foot wide piers. The "run of the river" hydropower with 17 feet "head" was designed to produce eight megawatts at peak performance. However, because of flow limitations, it averaged only four megawatts. The nuclear power plant (see Fig. II-2) , located three miles northwest of Monticello, bes.an operation by NSP in 1971 and produces 569 megawatts of electricity lNSP, 1987]. The effect of thermal discharge on ice processes is our concern here. The Monticello plant uses water from the Mississippi River in its circulating water system. Two water pumps in the circulating water system send 288,000 gallons of water per minute (623 cfs) from the river into the condenser. There the water absorbs heat from the primary water system, then returned to the river by canal. EP A standards stipulate that the river temperature 1,000 feet downstream from the plant's discharge point cannot exceed 86" F in summer or 37" F in winter. Other structures which may affect ice processes include the Anoka Sewage Treatment Plant with 2.5 mgd (1.5 mgd before 1969) capacity and effluent temperature of 60· F in March, the Anoka Dam with spillway 11.4 feet high and 236 feet long on the Rum River, and several bridges crossing the rivers.
Historically, the City of Anoka has frequently experienced floods due to ice jams. According to accounts over the last three decades by the Minneapolis Star and Tribune (formerly, the Minneapolis Star), floods due to ice jams upstream of the Coon Rapids Dam occurred in April 1965, December 1971, December 1983, and March 1984. Ice jams formed also downstream of the Coon Rapids Dam in December 1985, backing up water levels in the Rum River
3
6:. USGS GAGE STATION (1965)
Fig. II-l. The Mississippi River and its tributaries flowing toward Anoka.
4
OJ.
t NORTH
o I
8 CROOKED RAPIDS
o KINGS ISLAND
o FOSTER ISLAND o CLOQUET ISLAND
o CLOQUET RAPIDS
5 MILES I
o GOODIN ISLAND
o DAYTON RAPIDS
o DAYTON ISLAND
o HALEy RAPIDS
@ ELK RIVER ISLAND
ROGERS
~ WARNERS ISLAND
@ CAMESON ISLAND
~ PERSON ISLAND
e DAVIS ISLAND
® DIMMICK ISLAND
@ SPRING RAPIDS
@ LILYPOND ISlAND
@ BATTLE RAPIDS
® MONTICELLO ISLAND
Fig. 11-2. Detailed river geometry in the study reach.
5
1000
0 -l ..J W ()
950 I-Cl :2 ex:: a: z w « w w 0 HIGH I- Cl > > ~ /WATER (j') a: ::> (j') ex:: (1965 ) -:l Cl W ~ / Cl
900 0.. > 0 « « c: / CJ:) CC
""'./ C\I z :2 CJ:)
0 :::> / yo- ex:: / - 0
~ Z 850 () /
/ 0 //,/ I-« I ,.-~ > w 1// THALWEG (1930) ...J LU 800
750 ~----~----~----~------~----~----~ o 10 20 30 40 50 60
MILES ABOVE MINNEAPOLIS
Fig. II-3. Mississippi River bed slope.
6
EL. 830.1'
EL. 822.8'
EL 805.3'
Fig. II-4. A cross-section of the Coon Rapids Dam.
7
B. ICE PROCESSES AND FLOODING IN 1964-65 COLD SEASON
The floods of March-May 1965 were the most devastating in the history of the Upper Mississippi River Basin. Factors contributing to the floods were rapid melting of the winter accumulation of snow, heavy rains on the snow pack, and deeply frozen ground throughout much of the basin, which made the soil almost impervious and thereby greatly increased the amount of runoff [Anderson and Burmeister, 1970]. In some locations, such as Anoka, ice may also be an important factor, as will be demonstrated below.
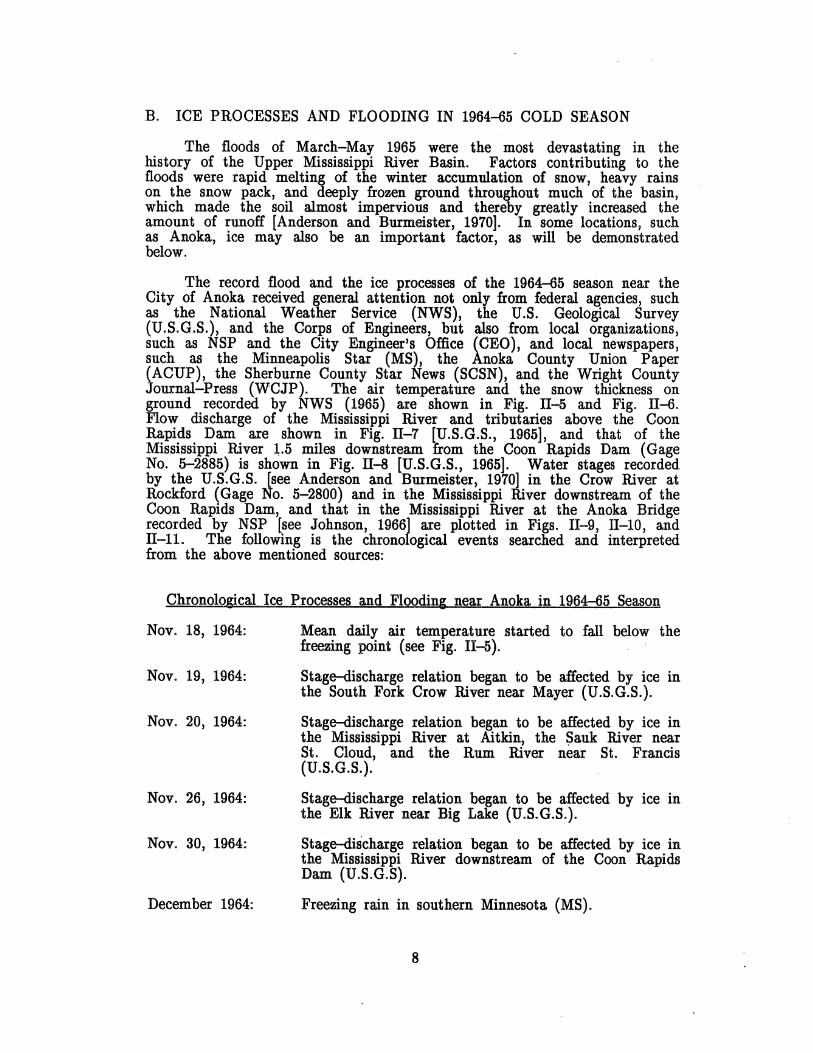
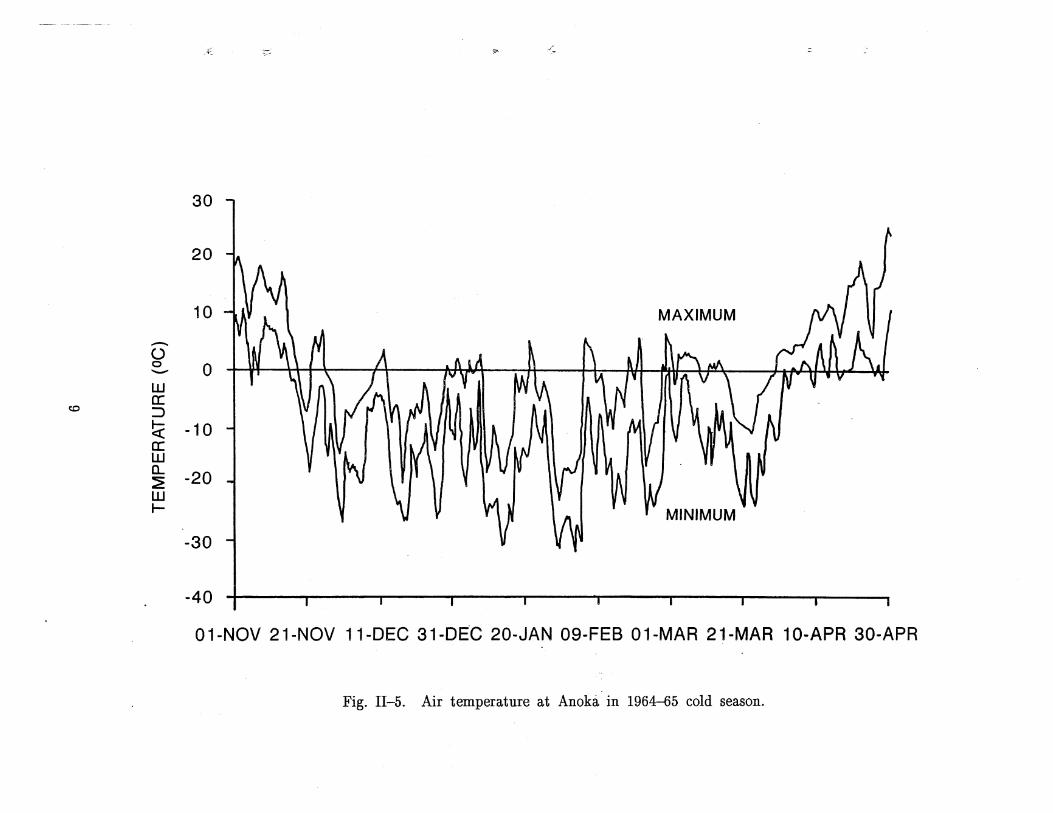
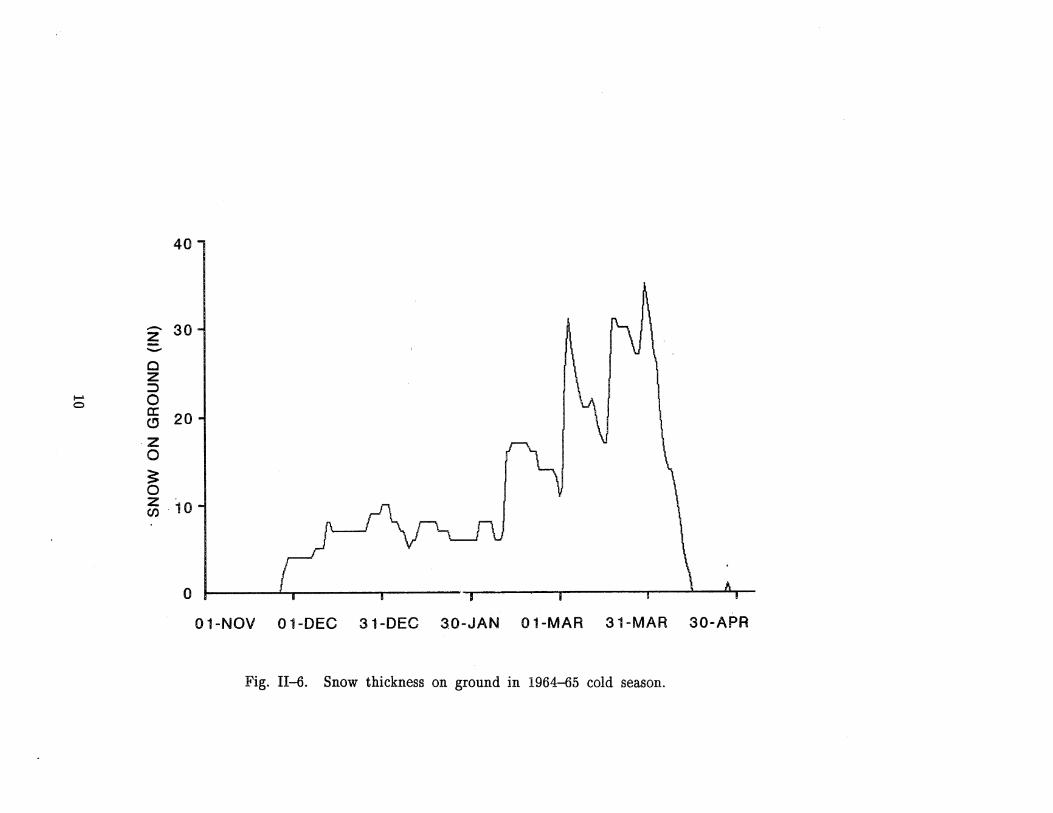
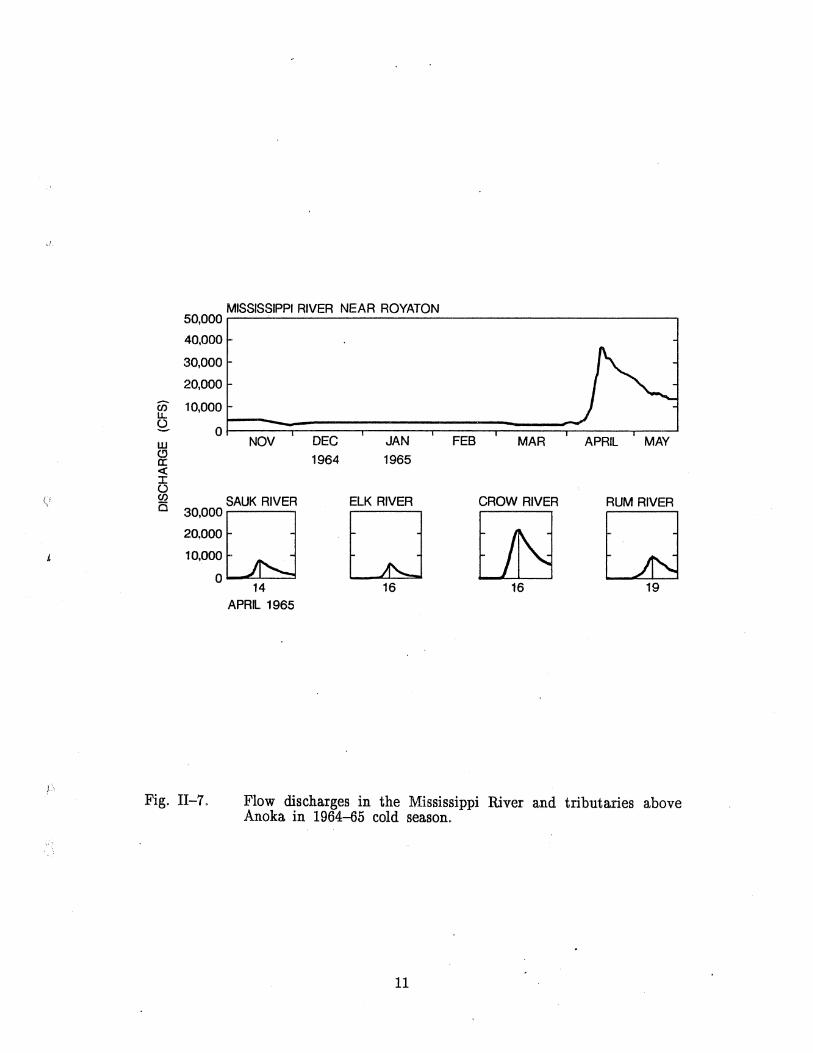
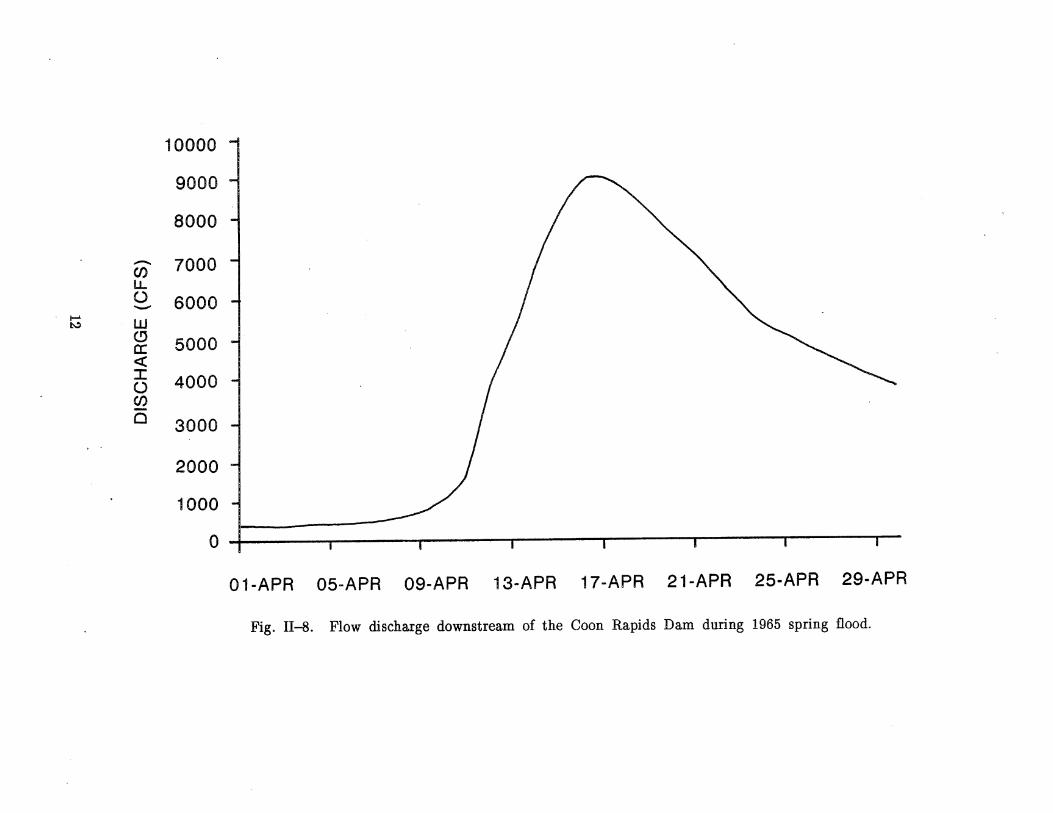
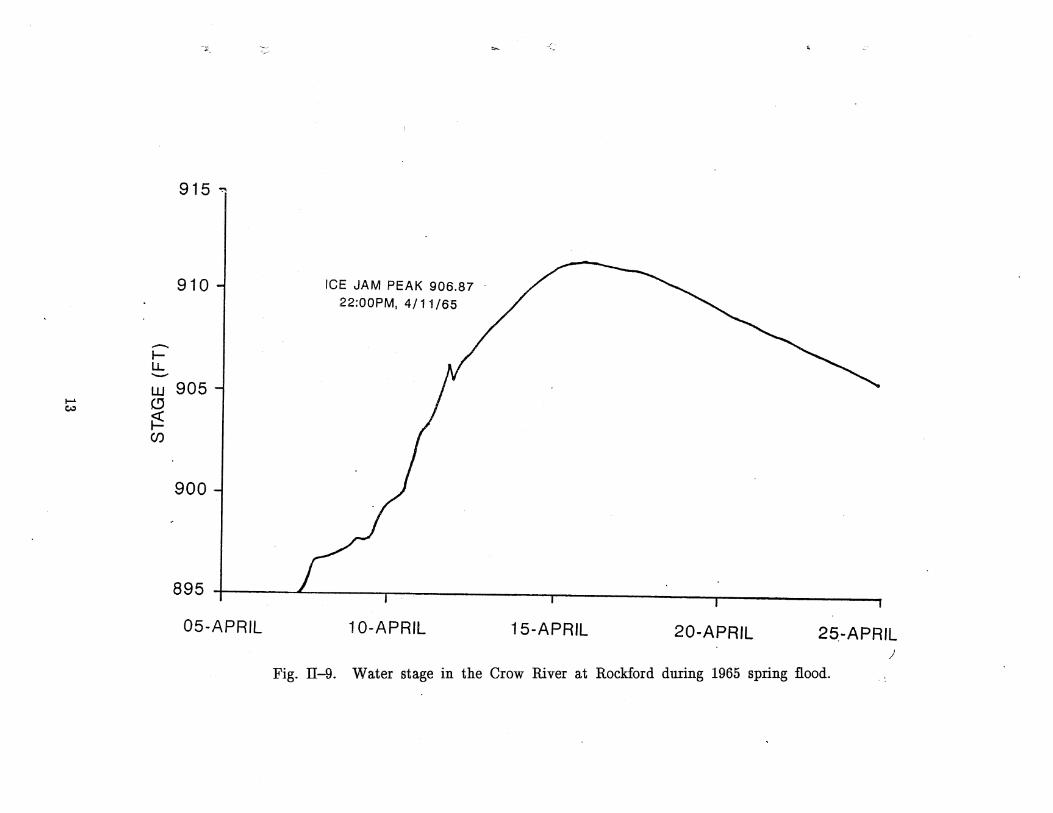
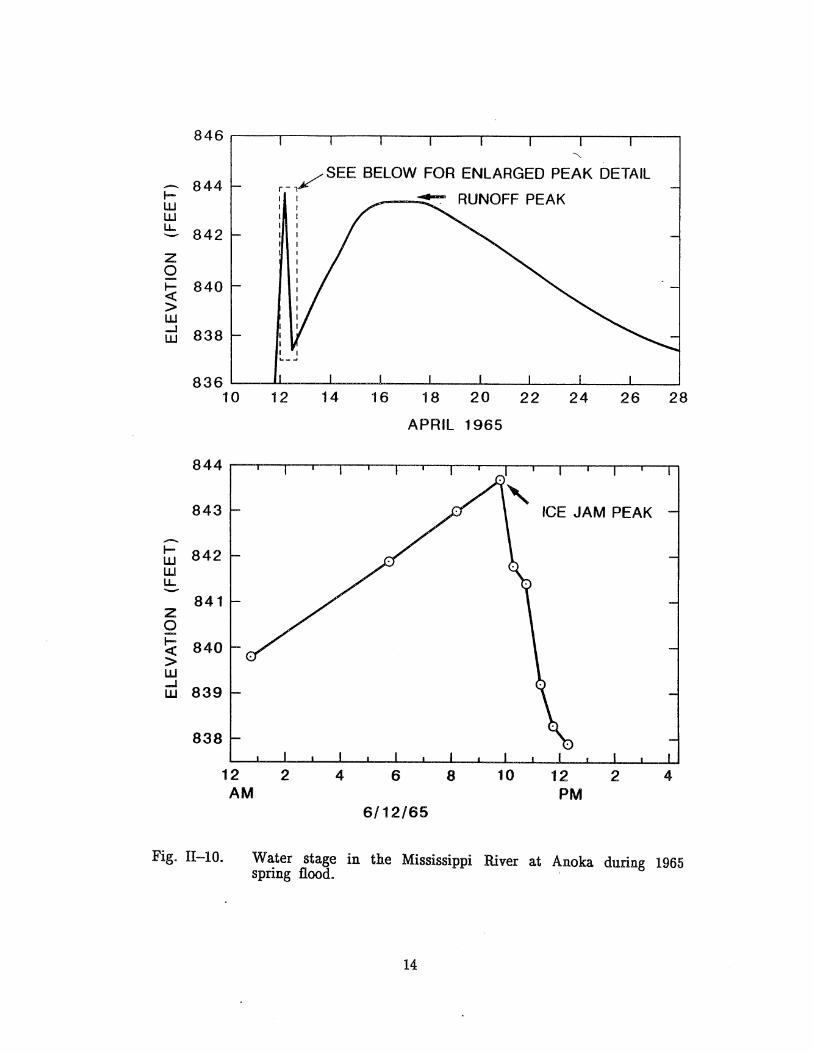
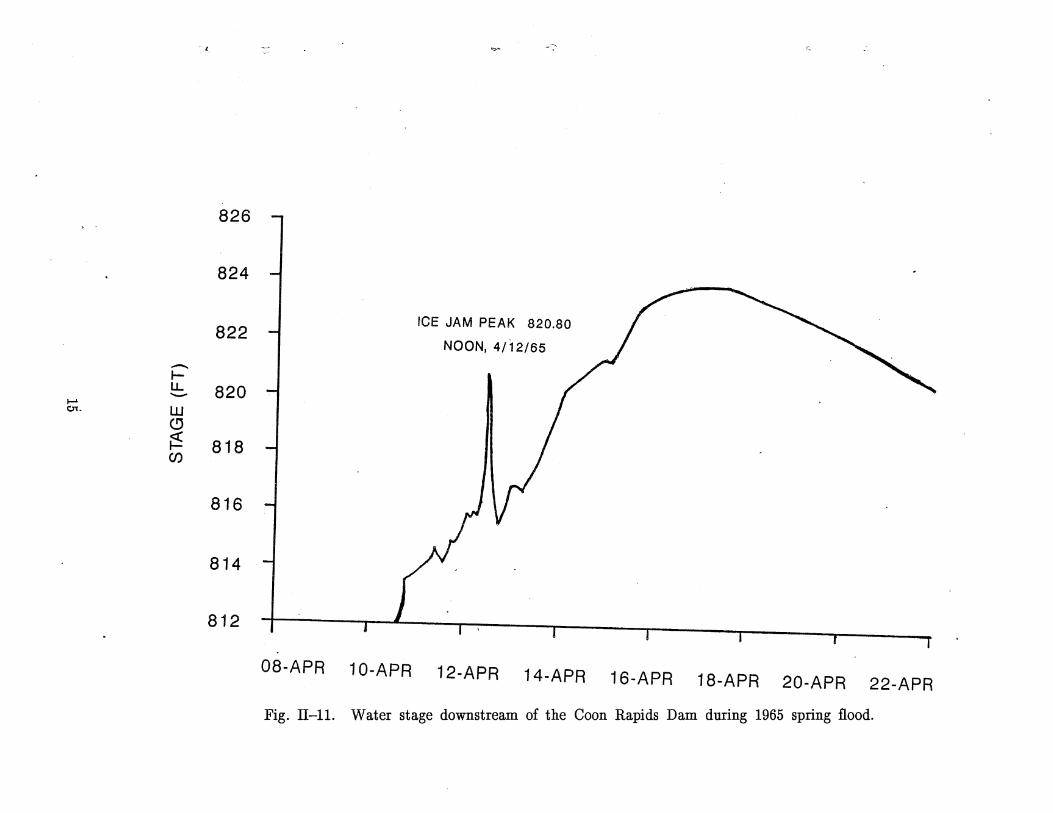
The record flood and the ice processes of the 1964-65 season near the City of Anoka received general attention not only from federal agencies, such as the National Weather Service (NWS), the U.S. Geological Survey (U.S.G.S.), and the Corps of Engineers, but also from local organizations, such as NSP and the City Engineer's Office (CEO), and local newspapers, such as the Minneapolis Star (MS), the Anoka County Union Paper (ACUP), the Sherburne County Star News (SCSN), and the Wright County Journal-Press (WCJP). The air temperature and the snow thickness on ground recorded by NWS (1965) are shown in Fig. II-5 and Fig. 11-6. Flow discharge of the Mississippi River and tributaries above the Coon Rapids Dam are shown in Fig. II-7 [U.S.G.S., 1965], and that of the Mississippi River ~.5 miles downstream from the Coon Rapids Dam (Gage No. 5-2885) is shown in Fig. 11-8 [U.S.G.S., 19651. Water stages recorded by the U.S.G.S. [see Anderson and Burmeister, 19701 in the Crow River at Rockford (Gage No. 5-2800) and in the Mississippi River downstream of the Coon RapIds Dam, and that in the Mississippi River at the Anoka Bridge recorded by NSP [see Johnson, 19661 are plotted in Figs. II-9, 11-10, and 11-11. The following is the chrono(ogical events searched and interpreted from the above mentioned sources:
Chronological Ice Processes and Flooding near Anoka in 1964-65 Season
Nov. 18, 1964:
Nov. 19, 1964:
Nov. 20, 1964:
Nov. 26, 1964:
Nov. 30, 1964:
December 1964:
Mean daily air temperature .started to fall below the freezing point (see Fig. II-5). . .
Stage-d.ischarge relation began to be affected by ice in the South Fork Crow River near Mayer (U.S.G.S.).
Stage-discharge relation began to be affected by ice in the Mississippi River at Aitkin, the ~auk River near St. Cloud, and the Rum River near St. Francis (U.S.G.S.). .
Stage-d.ischarge relation began to be affected by ice in the Elk River near Big Lake (U.S.G.S.).
Stage-d.ischarge relation began to be affected by ice in the Mississippi River downstream of the Coon Rapids Dam (U.S.G.S).
Freezing rain in southern Minnesota (MS).
8
A~ y ~ -<.
30
20
101AV h ~ MAXIMUM .A 1 -0
0 0 -w a:
CO ::J
~ -10 a: w a.. -20 :E w I--
-30
-40
01-NOV 21-NOV 11-DEC 31-DEC 20-JAN 09-FEB 01-MAR 21-MAR 10·APR 30·APR
Fig. II-5. Air temperature at Anoka in 1964---65 cold season.
40
Z 30 -c Z ::;)
I-" 0 0
a:: <!J 20 z 0
3: 0 z 10 en
o o 1-NOV 01-DEC 31-DEC 3~-JAN 01-MAR 31-MAR 30-APR
Fig. II-6. Snow thickness on ground in 1964-65 cold season.
.I.
(! \
,,'I
.M.~'S~S='S~S'~P~P'~R~'V~E~R~NE_A_R __ R~O_YA_J~O_N ________________________ ~ 50,000'-
40,000
30,000
20,000
fe 10,000
£ O~~~====~====~====~====~---'--~ DEC JAN FEB MAR APRIL MAY lli ~ [5
NOV
~ SAUK RIVER
30'000[:J 20,000
10,000
o 14
APRIL 1965
1964 1965
ELK RIVER CROW RIVER RUM RIVER
Owed 16 16 19
Fig. 11-7. Flow discharges in the Mississippi River and tributaries above Anoka in 1964-65 cold season.
11
~ ~
-en u.. () -w (!) a: « J: () (J)
0
10000
9000
8000
7000
6000
5000
4000
3000
2000
1000
0
o 1-APR OS-APR 09-APR 13-APR 17 -APR 21-APR 25-APR 29-APR
Fig. 11-8. Flow discharge downstream of the Coon Rapids Dam during 1965 spring flood.
'-
915 ":'l
910 ., ICE JAM PEAK 906.87 22:00PM, 4/11/65
.-.-u. --UJ 905
~ (!) ~
~ (f)
900
895 I L
05-APRIL 10-APRIL 15-APRIL 20-APRIL 25-APRIL )
Fig. IT-9. Water stage in the Crow River at Rockford during 1965 spring flood.
846 ~--~----.----,----.----.----.----.----.----.
844 I-LU LU lJ..
z o
842
~ 840 > LU
u:l 838
r _ ,/ SEE BELOW FOR ENLARGED PEAK DETAIL
I I ~ RUNOFF PEAK I
I I I I
836 L-__ ~ __ ~ ____ ~ __ ~ ____ ~ __ ~ ____ ~ __ ~ __ ~
10 12
843
I- 842 UJ LU lJ..
z o
841
~ 840 > LU ..J LU 839
838
12 2 AM
14
4
16 18 20 22 24 26 28
APRIL 1965
ICE JAM PEAK
6 8 10 12 2 4 PM
6/12/65
Fig. II-lO. Water stage in the Mississippi River at Anoka during 1965 spring flood.
14
" ~"~ .,.. -'_t
826
824
I ICE JAM PEAK 820.80
822 1 NOON, 4/12/65
-I-u.. 820 -'""'" en. LU (!)
~ 818 en
816
814
812
08-APR 10-APR 12-APR 14-APR 16-APR 18-APR 20-APR 22-APR
Fig. ll-11. Water stage downstream of the Coon Rapids Dam during 1965 spring flood.
March 28, 1964:
24:00, 4/9/65:
4/10/65:
6:00 pm, 4/11/65:
Evening:
7:00 pm:
7:30 pm:
10:00 pm:
about midnight:
0.00 am, 4/12/65:
1:00 am:
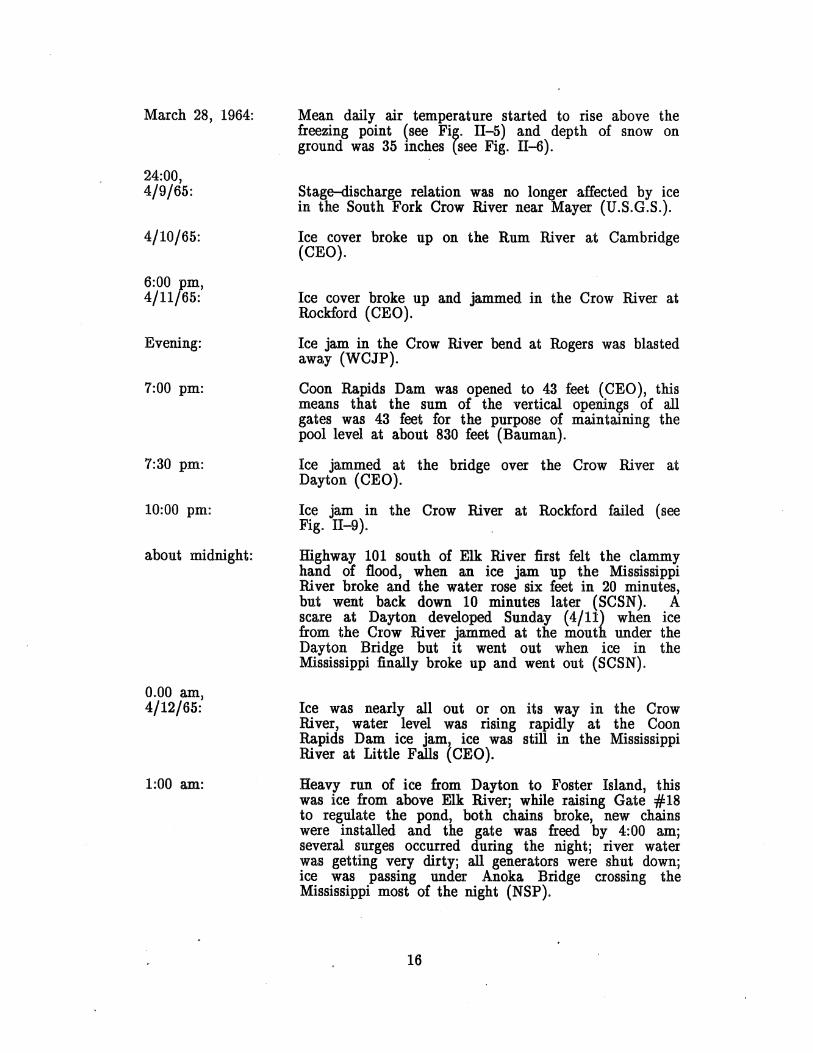
Mean daily air temperature started to rise above the freezing point (see Fig. 11-5) and depth of snow on ground was 35 mches (see Fig. 11-6).
Stage-discharge relation was no longer affected by ice in the South Fork Crow River near Mayer (u.s.a.s.).
Ice cover broke up on the Rum River at Cambridge (CEO).
Ice cover broke up and jammed in the Crow River at Rockford (CEO).
Ice jam in the Crow River bend at Rogers was blasted away (WCJP).
Coon Rapids Dam was opened to 43 feet (CEO), this means that the sum of the vertical openings of all gates was 43 feet for the purpose of maintaining the pool level at about 830 feet (Bauman).
Ice jammed at the bridge over the Crow River at Dayton (CEO).
Ice jam in the Crow River at Rockford failed (see Fig. 11-9). .
Highway 101 south of Elk River first felt the clammy hand of flood, when an ice jam up the Mississippi lliver broke and the water rose six feet in 20 minutes, but went back down 10 minutes later (SCSN). A scare at Dayton developed Sunday (4/11) when ice from the Crow River jammed at the mouth under the Dayton Bridge but it went out when ice in the Mississippi finally broke up and went out (SCSN).
Ice was nearly all out or on its way in the Crow River, water level was rising rapidly at the Coon Rapids Dam ice jam} ice was still in the Mississippi River at Little Falls t CEO).
Heavy run of ice from Dayton to Foster Island, this was ice from above Elk River; while raising Gate #18 to regulate the pond, both chains broke, new chains were installed and the gate was freed by 4:00 ami several surges occurred during the night; river water was getting very dirty; all generators were shut downi ice was passing under Anoka Bridge crossing the Mississippi most of the night (NSP).
16
v
(cont.) 6:00 am:
6:45 am:
9:00 am:
9:45 am:
10:17 am:
10:21 am:
11:00 am:
11:04 am:
3:00 pm:
6:00 pm:
12:00 pm:
night:
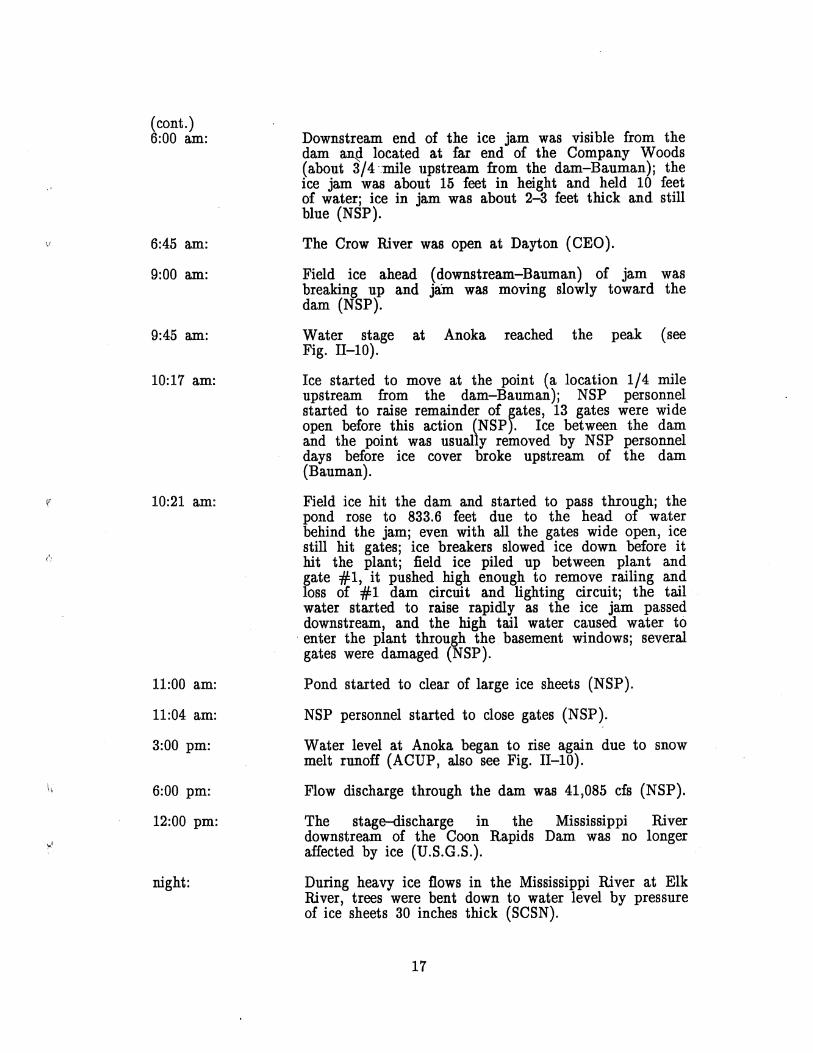
Downstream end of the ice jam was visible from the dam a.n.Q. located at far end of the Company Woods (about 3/4'mile upstream from the dam-Bauman); the ice jam was about 15 feet in height and held 10 feet of waterj ice in jam was about 2-3 feet thick and still blue (NSP).
The Crow River was open at Dayton (CEO).
Field ice ahead (downstream-Bauman) of jam was breaking up and jain was moving slowly toward the dam (NSP).
Water stage at Anoka reached the peak (see Fig. 11-10).
Ice started to move at the point (a location 1/4 mile upstream from the dam-Bauman); NSP personnel started to raise remainder of ~ates, 13 gates were wide open before this action (NSP). Ice between the dam and the point was usually removed by NSP personnel days before ice cover broke upstream of the dam (Bauman).
Field ice hit the dam and started to pass through; the pond rose to 833.6 feet due to the head of water behind the jam; even with all the gates wide open, ice still hit gatesj ice breakers slowed ice down before it hit the plant; field ice piled up between plant and gate #1, it pushed high enough to remove railing and loss of #1 dam circuit and lighting circuit; the tail water started to raise rapidly as the ice jam passed downstream, and the high tail water caused water to
. enter the plant through the. basement windows; several gates were damaged (NSP).
Pond started to clear of large ice sheets (NSP).
NSP personnel started to close gates (NSP).
Water level at Anoka began to rise again due to snow melt runoff (ACUP, also see Fig. 11-10).
Flow discharge through the dam was 41,085 cfs (NSP).
The stage-discharge in the Mississippi River downstream of the Coon Rapids Dam was no longer affected by ice (U.S.O.S.).
During heavy ice flows in the Mississippi River at Elk River, trees were bent down to water level by pressure of ice sheets 30 inches thick (SCSN).
17
2:00 am, 4/13/65:
morning:
shortly after noon:
early afternoon:
afternoon:
in between:
10:15
12:00 pm
after midnight:
4/14/65:
4/15/65:
4/16/65:
4/18/65:
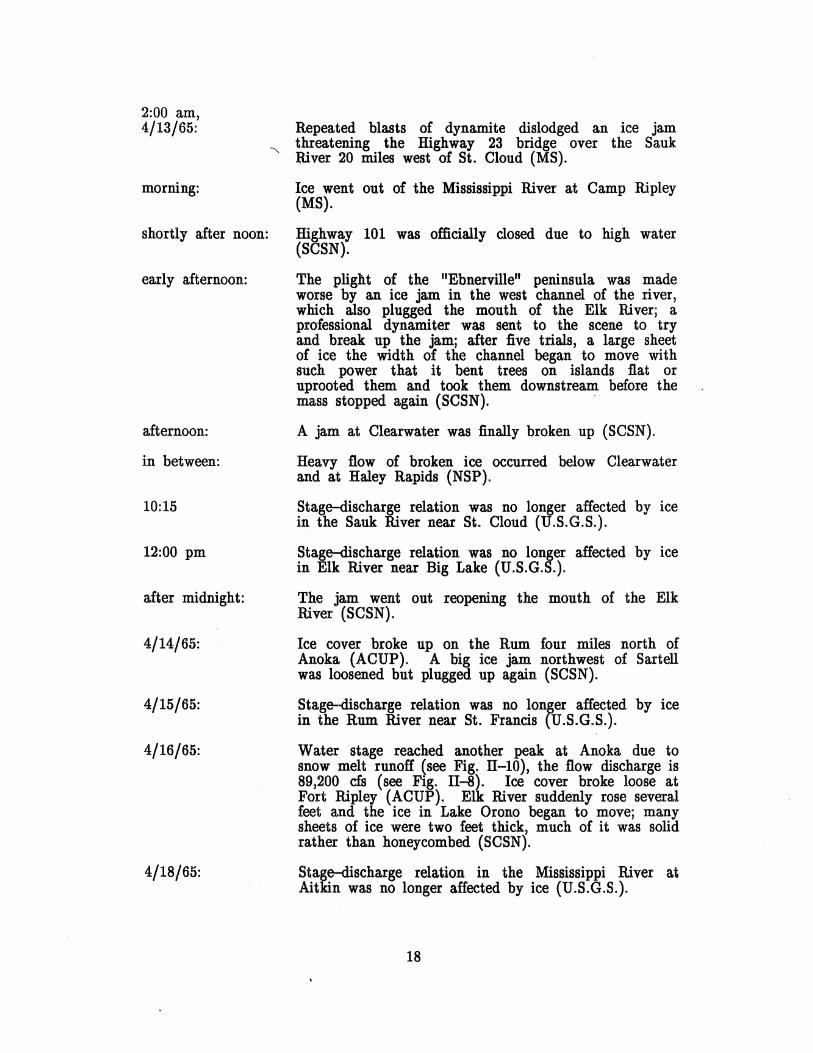
Repeated blasts of dynamite dislodged an ice jam "" threatening the Highway 23 bridge over the Sauk
ltiver 20 miles west of St. Cloud (MS).
Ice went out of the Mississippi River at Camp Ripley (MS).
ffighway 101 was officially closed due to high water (SCSN).
The plight of the "Ebnerville" peninsula was made worse by an ice jam in the west channel of the river, which also plugged the mouth of the Elk River; a professional dynamiter was sent to the scene to try and break up the jam; after five trials, a large sheet of ice the width of the channel began to move with such power that it bent trees on islands flat or uprooted them and took them downstream before the mass stopped again (SCSN). .
A jam at Clearwater was finally broken up (SCSN).
Heavy flow of broken ice occurred below Clearwater and at Haley Rapids (NSP).
Stage-discharge relation was no longer affected by ice in the Sauk River near St. Cloud (U.S.G.S.).
Stage-discharge relation was no longer affected by ice in Elk River near Big Lake (U.S.G.S.).
The jam went out reopening the mouth of the Elk River (SCSN).
Ice cover broke up on the Rum four miles north of Anoka (ACUP). A big ice jam northwest of Sartell was loosened but plugged up again (SCSN).
Stage-discharge relation was no lon~er affected by ice in the Rum River near St. Francis (U.S.G.S.).
Water stage reached another peak at Anoka due to snow melt runoff (see Fig. II-10), the flow discharge is 89,200 cfs (see. Fig. II-8). Ice cover broke loose at Fort Ripley (ACUP). Elk Biver suddenly rose several feet and the ice in Lake Orono began to movej many sheets of ice were two feet thick, much of it was solid rather than honeycombed (SCSN).
Stage-discharge relation in the MiSSissippi River at Aitkin was no longer affected by ice (U.S.G.S.).
18
\-
~---------- -----
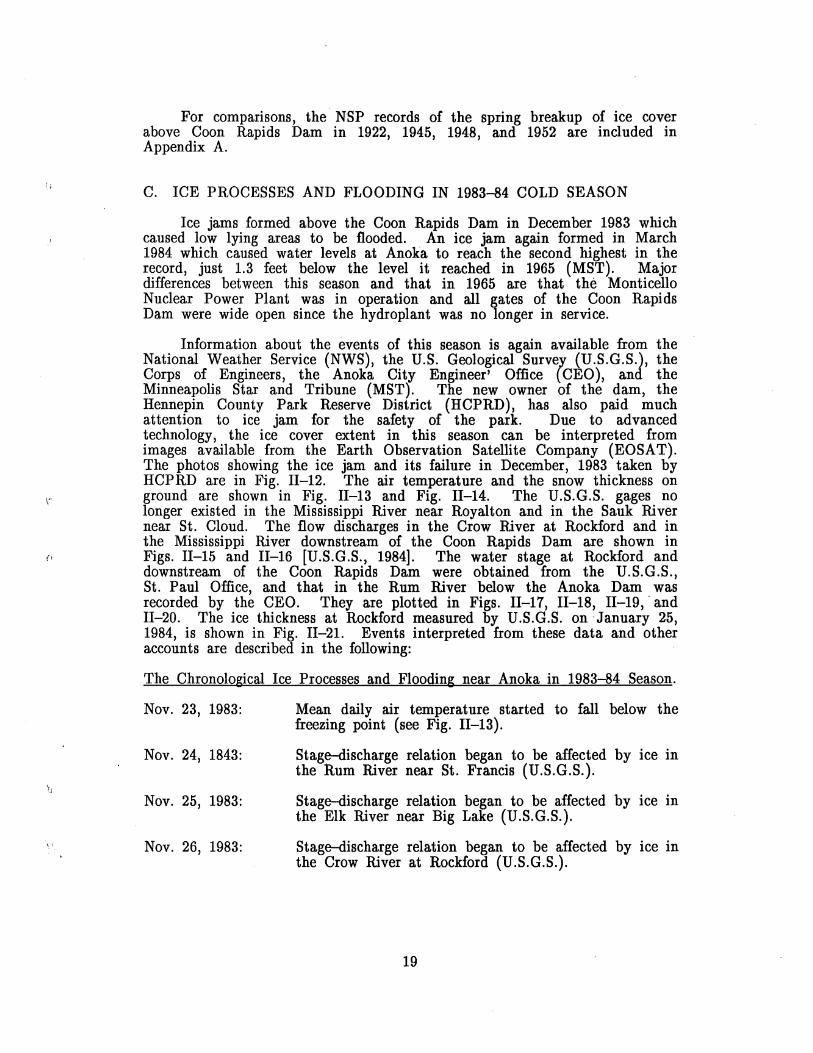
For comparisons, the NSP records of the spring breakup of ice cover above Coon Rapids Dam in 1922, 1945, 1948, and 1952 are included in Appendix A.
C. ICE PROCESSES AND FLOODING IN 1983-84 COLD SEASON
Ice jams formed above the Coon Rapids Dam in December 1983 which caused low lying areas to be flooded. An ice jam again formed in March 1984 which caused water levels at Anoka to reach the second highest in the record, just 1.3 feet below the level it reached in 1965 (MST). Major differences between this season and that in 1965 are that the Monticello Nuclear Power Plant was in operation and all gates of the Coon Rapids Dam were wide open since the hydroplant was no longer in service.
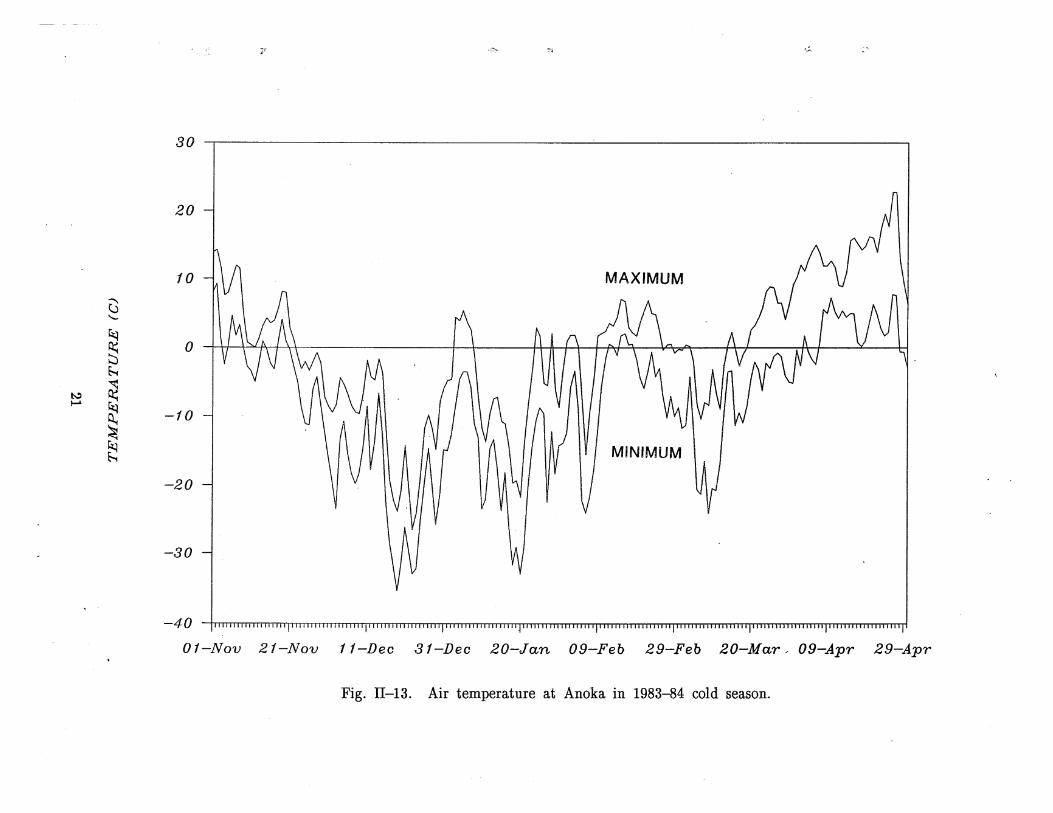
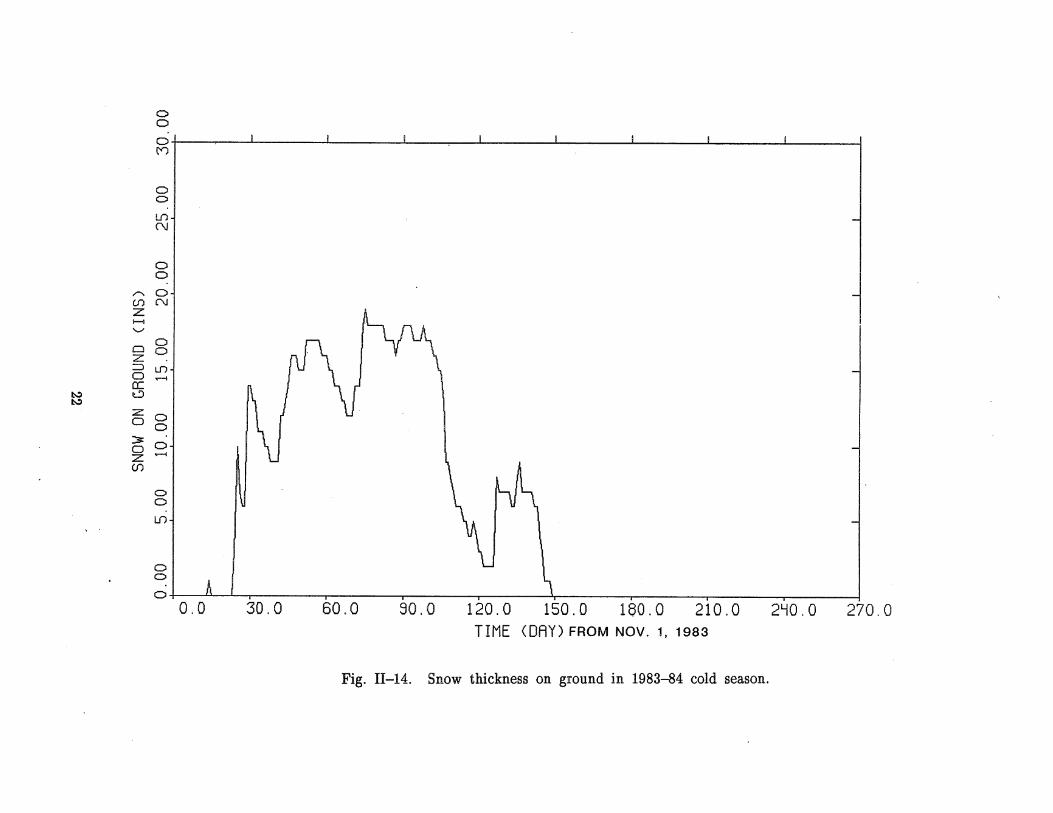
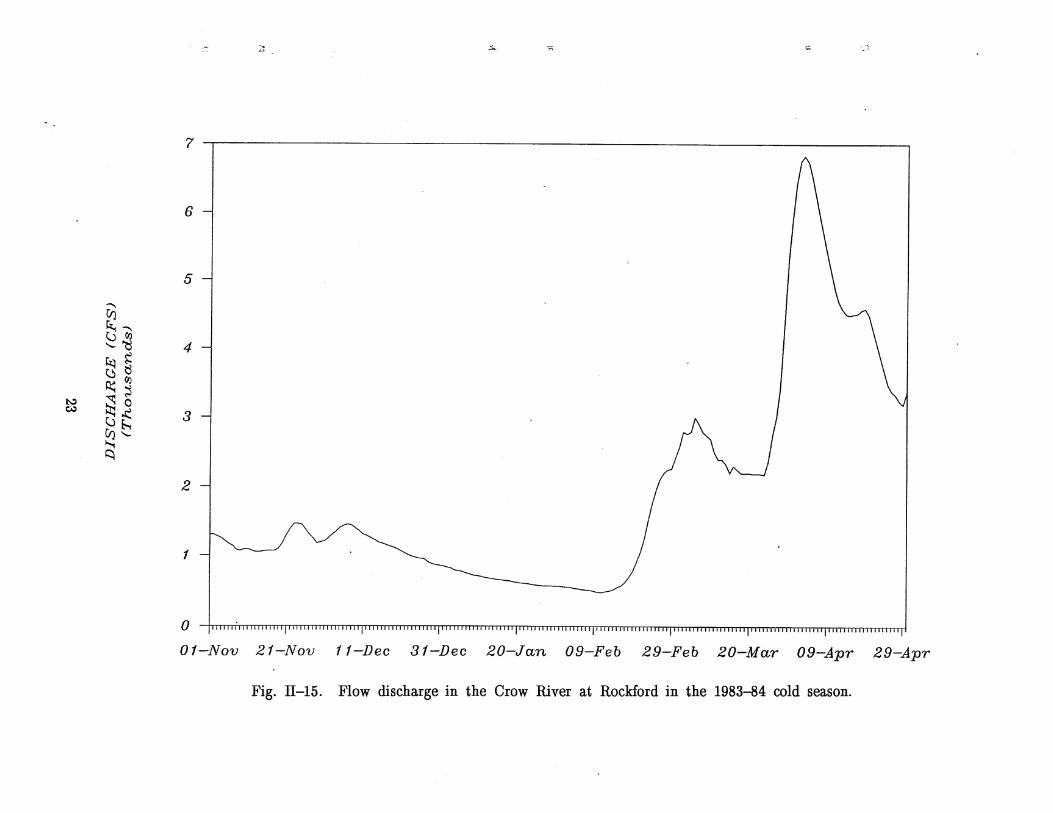
Information about the events of this season is again available from the National Weather Service (NWS), the U.S. Geological Survel. (U.S.G.S.), the Corps of Engineers, the Anoka City Engineer' Office (CEO), and the Minneapolis Star and Tribune (MST). The new owner of the dam, the Hennepin County Park Reserve District (HCPRD), has also paid much attention to ice jam for the safety of the park. Due to advanced technology, the ice cover extent in this season can be interpreted from images available from the Earth Observation Satellite Company (EOSAT). The photos showing the ice jam and its failure in December, 1983 taken by HCPRD are in Fig. II-12. The air temperature and the snow thickness on ground are shown in Fig. II-13 and Fig. II-14. The U.S.G.S. gages no longer existed in the Mississippi River near Royalton and in the Sauk River near St. Cloud. The flow discharges in the Crow River at Rockford and in the Mississippi River downstream of the Coon Rapids Dam are shown in Figs. II-15 and 11-16 [U.S.G.S., 1984]. The water stage at Rockford and downstream of the Coon Rapids Dam were obtained from the U.S.G.S., St. Paul Office, and that in the Rum River below the Anoka Dam was recorded by the CEO. They are plotted in Figs. II-17, 11-18, II-19, -and II-20. The ice thickness at Rockford measured by U.S.G.S. on -January 25, 1984, is shown in Fig. II-21. Events interpreted from these data and other accounts are described in the following:
The Chronological Ice Processes and Flooding near Anoka in 1983-84 Season.
Nov. 23, 1983:
Nov. 24, 1843:
Nov. 25, 1983:
Nov. 26, 1983:
Mean daily air temperature started to fall below the freezing point (see Fig. II-13).
Stage--discharge relation began to be affected by ice in the Rum River near St. Francis (U.S.G.S.).
Stage--discharge relation began to be affected by ice in the Elk River near Big Lake (U.S.G.S.).
Stage--discharge relation began to be affected by ice in the Crow River at Rockford (U.S.G.S.).
19
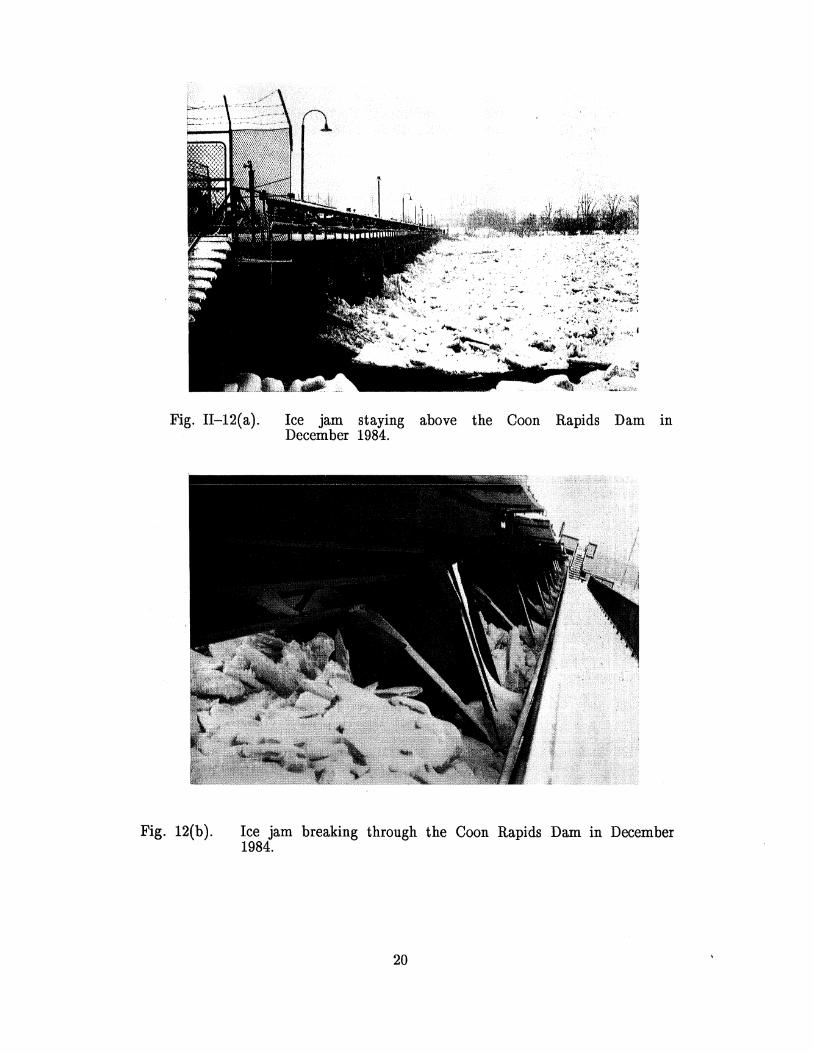
Fig. II-12{a). Ice jam staying above the Coon Rapids Dam in December 1984.
Fig. 12(b). Ice jam breaking through the Coon Rapids Dam in December 1984.
20
J' ,.q.. "" ...:,
30
20
10 iV\ MAXIMUM n
t3 "-
~ § 0
h
~ ~ ~
~ -fO ~ ~
-20
-30
-40 JIIIII i1 i ii Ii i II i Ii I II iii" i , II I Iii i i II i II I Ii 1111 Ii i Ii Ii i II II ' II ill II Ii I III iii Ill' i IIi 1111 IIIi Ii i Ii 'I' Ii i i 1111 II iii iii "I' i II Ii Ii i Ii I ill Ii i I II Ii Ii i II Jill Ii Ii Ii 'I" Ii i 1111 iii ill , "'II
Of-Nov 21-Nov ff-Dec3f-Dec 20-Jan 09-Feb 29-Feb 20-Mar.09-Apr 29-Apr
Fig. IT-l3. Air temperature at Anoka in 1983-84 cold season.
t-.:) t-.:)
0 0
0 C"')
0 0
If) (\j
0 0
""' 0 c.n C\J Z I--< '-./
0 D 0 Z ::J LD ° .-. 0:: L)
20 °0
~O 0.-. Z (f)
0 0
U"')
0 0
0
0.0 30.0 60.0 90.0 120.0 150.0 180.0 210.0 2l..j0.0 270.0 TIME (DAY) FROM NOV. 1, 1983
Fig. II-14. Snow thickness on ground in 1983-84 cold season.
2l .:>.. ";\ <!-
7
6
5
""" Ii)
~~ 4 "-~
~ § f.!l fIJ ~ ~
~ ~ 0 3
~
Cj~ V)"-Io..t q
2
I
o o I-Nov 2t-Nov 1 I-Dec 31-Dec 20-Jan 09-Feb 29-Feb 20-Mar 09-Apr 29-Apr
Fig. ll-15. Flow discharge in the Crow River at Rockford in the 1983-84 cold season.
~ ~
&) ~~ "'"'~
~ ~ d ~ (/)
~ ~ ~~ V)"'"'
"" ~
24
23
22
21
20
19
18
17
16
15
14
13
12
11
10
9
8
7
6
5
4
o I-Nov 21-Nov II-Dec 31-fJec 20-Jan 09-Feb 29-Feb 20-Mar 09-Apr 29-Apr
Fig. 11-16. Flow discharge in the Mississippi River downstream of the Coon Rapids Dam in 1983-84 cold season.

(~ 1; -" "
tt-r::===-----DATUM OF GAGE = 893 FT
to
9
~ .8
~ ~
7 ~
~ ..... , en
~ 6
~ ~
5
4
3
at-Nov 21-Nov It-Dec 31-Dec' 20-Jan 09-Feb 29-Feb 2 a-Mar
Fig. II-17. Water stage, in the Crow River at Rockford in 1983-84 cold season.
838 ~---------------------------------------------------------------------.
837
~ 836
~ ~ C.!l
t'-'
~ a..
V:J 835
834
833
13 15 17 19 21 23 25 27
DAY 13 ::::: Dec.13
Fig. 11-18. Water stage in the Rum River below the Anoka Dam in winter, 1984.
t; z:, . ." ,~ .~
845
844
8431~ ABOVE ANOKA DAM
842
841
840
~ 839 ~
~ 838 t-.:) ~ -:r 837
V) BELOW ANOKA DAM
836
835
834
833
832 ~ f TREATMENT PLANT
831
0 20 40 60 80 100
Day 0 = Feb. 22
Fig. IT-19. Water stage in the Rum River below the Anoka Dam in spring, 1984.
~ ~ .E-..
~ ~ ~ 00
~
~ ~
11 ~--------~--------------------------~ DATUM ·OF GAGE = 804.37 FT
10
9
8
7
6
5
4
3 11-llill)I)!li"I!II'II")III!!II'II"'li!!"r!!"I!!1iii.liiililii!ill!I!li!!!!III!i!I!lilill'!il!!. liiliiii!li.i."lllill"I,iiiilii •• iii'illlii'lili,1
01-Nov 21-Nov 1t-Dec 31-Dec 20-Jan 09--Feb 29-Feb 20-Mar
Fig. II-20. Water stage in the Mississippi River downstream of the Coon Rapids Dam in 1983-84 cold season.
"
DISTANCE (FEET)
150 125 100 75 50 25 0 0
1 -Iii 2 w u. -3 J:
4 I:i: w 0
n 5
<
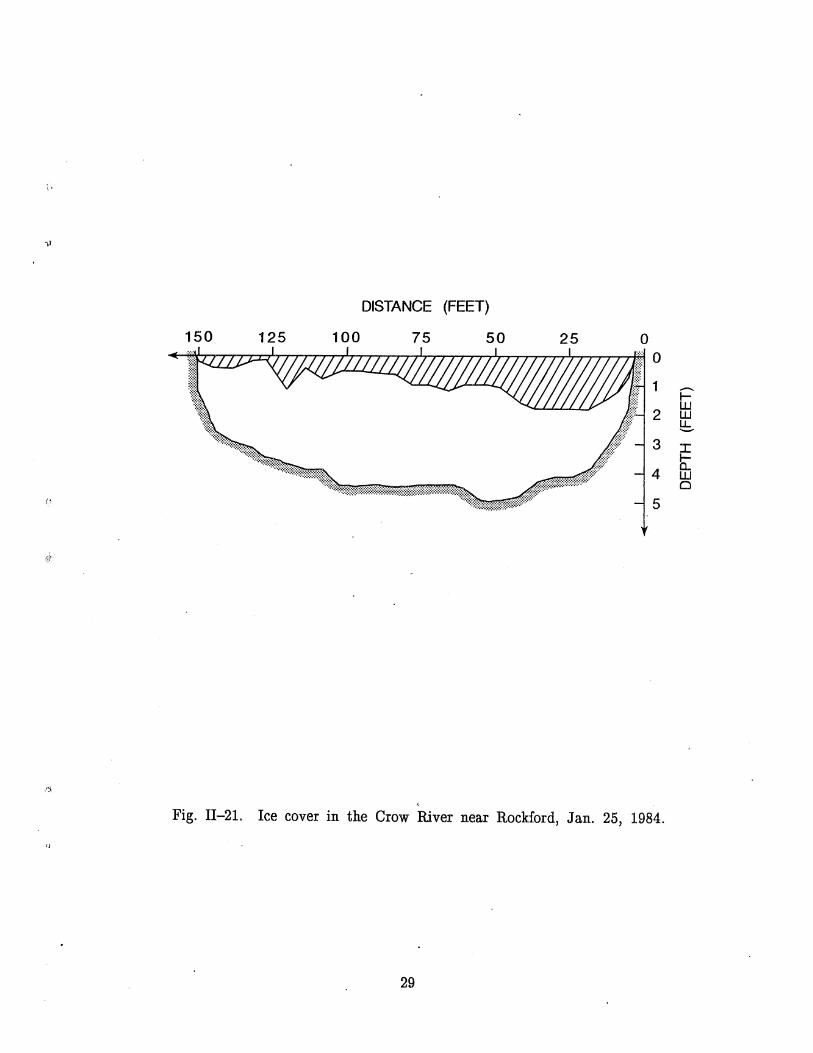
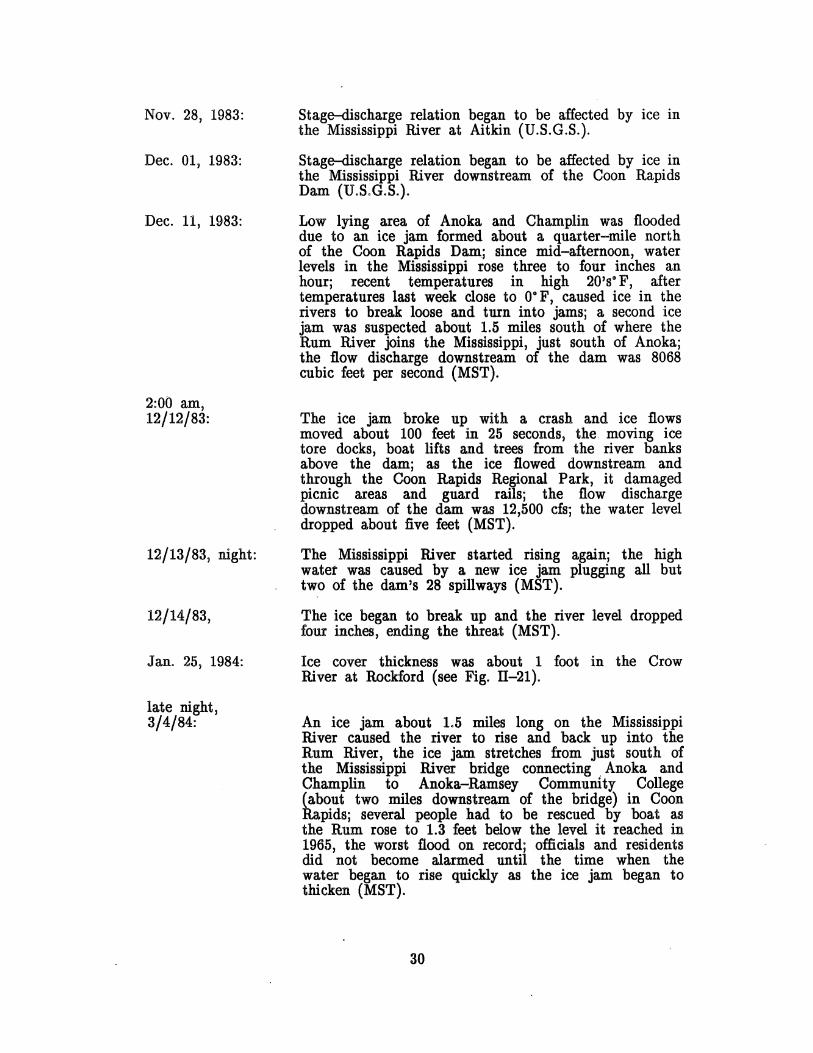
Fig. II-21. Ice cover in the Crow River near Rockford, Jan. 25, 1984.
29
Nov. 28, 1983:
Dec. 01, 1983:
Dec. 11, 1983:
2:00 am, 12/12/83:
12/13/83, night:
12/14/83,
Jan. 25, 1984:
late night, 3/4/84:
Stage-discharge relation began to be affected by ice in the Mississippi River at Aitkin (U.S.G.S.).
Stage-discharge relation began to be affected by ice in the Mississippi River downstream of the Coon Rapids Dam (U.S.G.S.).
Low lying area of Anoka and Champlin was flooded due to an ice jam formed about a quarter-mile north of the Coon Rapids Dam.; since mid-afternoon, water levels in the Mississippi rose three to four inches an hour; recent temperatures in high 20's· F, after temperatures last week close to O· F, caused ice in the rivers to break loose and turn into jams; a second ice jam was suspected about 1.5 miles south of where the Rum River joins the Mississippi, just south of Anoka; the flow discharge downstream of the dam was 8068 cubic feet per second (MST).
The ice jam broke up with a crash and ice flows moved about 100 feet in 25 seconds, the. moving ice tore docks, boat lifts and trees from the river banks above the dam; as the ice flowed downstream and through the Coon Rapids Regional Park, it damaged picnic areas and guard rails; the flow discharge downstream of the dam was 12,500 cfs'; the water level dropped about five feet (MST).
The Mississippi River started rising again; the high water was caused by a new ice jam plugging all but two of the dam's 28 spillways (MST).
The ice began to break up and the river level dropped four inches, ending the threat (MST).
Ice cover thickness was about 1 foot in the Crow River at Rockford (see Fig. II-21).
An ice jam about 1.5 miles long on the Mississippi River caused the river to rise and back up into the Rum River, the ice jam stretches from just south of the Mississippi River bridge connecting. Anoka and Champlin to Anoka-Ramsey Community College (about two miles downstream of the bridge) in Coon Rapids; several people had to be rescued by boat as the Rum rose to 1.3 feet below the level it reached in 1965, the worst flood on record; officials and residents did not become alarmed until the time when the water began to rise quickly as the ice jam began to thicken (MST).
30
{T
/, . .'\
March 6, 1984:
March 16, 1984:
March 20, 1984:
March 22, 1984:
March 25, 1984:
March 26, 1984:
April 04, 1984:
D. ANALYSIS
Flood waters from the Mississippi and Rum Rivers receded about 2 feet by morning and had held steady in the afternoon; the reason for the receding was suspected to be that more water was making its way through channels in the ice jam, which was estimated to be 8 to 10 feet thick, and cold weather may also have slowed the flow of water on the Mississippi north of Anoka (MST).
The Mississippi River was ice free from the Monticello nuclear power plant to Elk River (EOSAT).
Stage-discharge relation was no longer affected by ice in the Crow River at Rockford (U.S.G.S.).
Stage-discharge relation was no longer affected by ice in the Elk River near Big Lake and in the Rum River near St. Francis (U.S.G.S.). .
The 1.5-mile long ice jam on the Mississippi River broke up early evening, water levels dropped about 5 feet (MST).
Stage-discharge relation in the Mississippi downstream of the Coon Rapids Dam was no longer affected by ice (U.S.G.S.).
Stage-discharge relation in the Mississippi at Aitkin was no longer affected by ice (U.S.G.S.).
If we interpret the data of ice influence on the stage-discharge relation as ice freeze-up and breakup date, then we can see from the 1964-65 and 1983-84 events that ice in the Mississippi River at Aitkin and downstream of the Coon Rapids Dam follows the air temperature pattern, i.e., the higher the latitude the earlier the ice cover forms and the later the ice cover breaks up. But, in tributaries, the rule does not hold because ice freeze-up and breakup also depends on flow condition. The ice thickness just before breakup and jamming in 1965 were about 2.5 feet in the Mississippi River, which is only slightly larger than that in Lake Orono where the hydraulic factor can be ignored. This indicates that the ice thickness just before the breakup can be simply predicted by using the thermal model after we know where the ice cover would stay.
We can also see from the records that the major floods are usually associated with breakup ice jams at this site. The primary reason for the ice jam near Anoka is the existence of the Coon Rapids Dam which creates a pool of stagnant water which can freeze up readily. A combination of relatively slow flow and the solid ice cover causes the broken ice sheets carried by the flow from the stretch of river just upstream to accumulate
31
here. Although ice jams occurred at the same location for the 1964-65 season and the 1983-84 season, they appeared to be caused by two different breakup mechanisms. In April 1965, ice cover in the Crow River broke up first and formed an ice jam at the Dayton bridge where the Crow River joins the Mississippi River as in the cases of 1922, 1945, 1948, and 1952 (see Appendix A). This ice jam was supported by either the still solid ice cover in the Mississippi River or the Dayton bridge. The most likely series of events that follows the formation of ice jams at the Dayton bridge are as follows. Increased runoff in the Crow River combined with the deterioration of ice caused the ice jam to break, producing surge in the Mississippi River. When this surge moved downstream, it broke up ice cover along the way until it met some strong resistance, such as islands and bridges, and stayed there temporarily. The ice cover was, in this case, broken by the surge at first and transported by flow behind the surge later. The surge and associated broken ice sheets eventually stopped at the upper pool of the Coon Rapids Dam and formed a big ice jam.
Records show that the chain reaction of ice jam· formations and releases frequently were initiated at the Dayton bridge. But the possibility of the chain reaction initiated at the Mississippi River near Elk River cannot be ruled out. The record of the 1965 event is not clear on the initiation of the chain reaction. But the record is quite clear that the ice jams in two other tributaries of the Mississippi River near Coon Rapids Dam, Rum River and Elk River, did not trigger the chain reaction in the Missi~sippi River described above. The ice in the Rum River and Elk River were stopped by Anoka Dam and Lake Orono, respectively, until after the ice in the Mississippi River cleared. Clearly, the ice sheets causing jams at Coon Rapids Dam came from Crow River and a stretch of Mississippi River upstream of the dam.
The ice problem at Coon Rapids Dam apparently has improved significantly since the Monticello nuclear powerplant became operational in 1971. Thermal discharge from the power plant tends to keep the stretch of river between Monticello and Elk River free of ice cover and reduces the possibility of· an ice jam at Elk River. Reduced ice thickness in the Mississippi River at Dayton also reduced the possibility of an ice jam in the Crow River. There was no ice cover from· Monticello to just below Elk River in the 1983-84 season, as indicated by an EOSAT image of March 17, 1984. This was also the case on January 17, 1974, as shown by the ERTS image and reported by Stefan et ale [1975]. Therefore, it is possible to assert that the 1983-84 ice jam was not caused by the chain reactions described before.
Under the 1983-84 conditions, ice cover in the Mississippi River had to be broken by the snow melt runoff at the time·of weaker ice strength. In this case, the breaking front travels at almost the same speed as the broken ice sheets, and the broken ice sheets themselves may exert forces on the unbroken ice cover. Ice in the jaIil in this season came from the MiSSissippi River below Elk River only. One indication of slower breakup and jamming in 1983-84 than in 1965 is that water level rising speeds at the Dam were 2 inches an hour and 5 inches an hour, respectively.
32
(1
,J
The thermal discharge from the Anoka Sewage Treatment Plant is small (3.88 cfs) , and should not have much effect on the overall ice cover in both concerned seasons, even though an open narrow strip near the outfall point did appear as observed in our February 18, 1988, field trip.
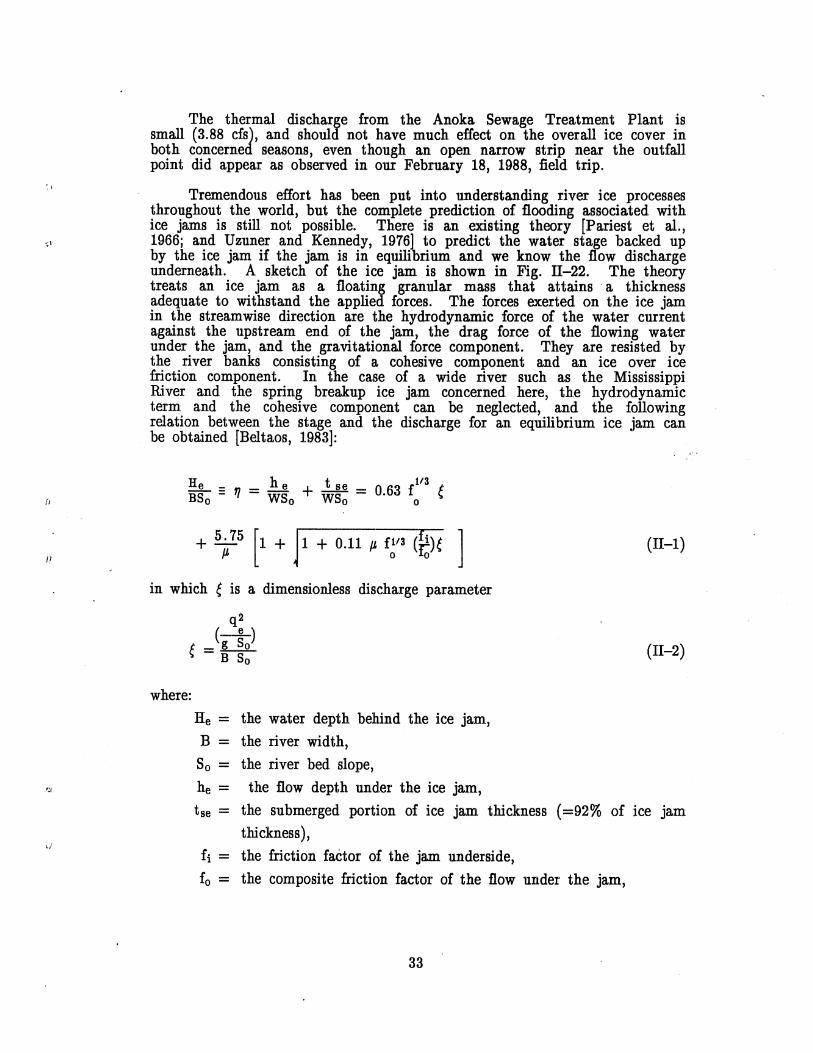
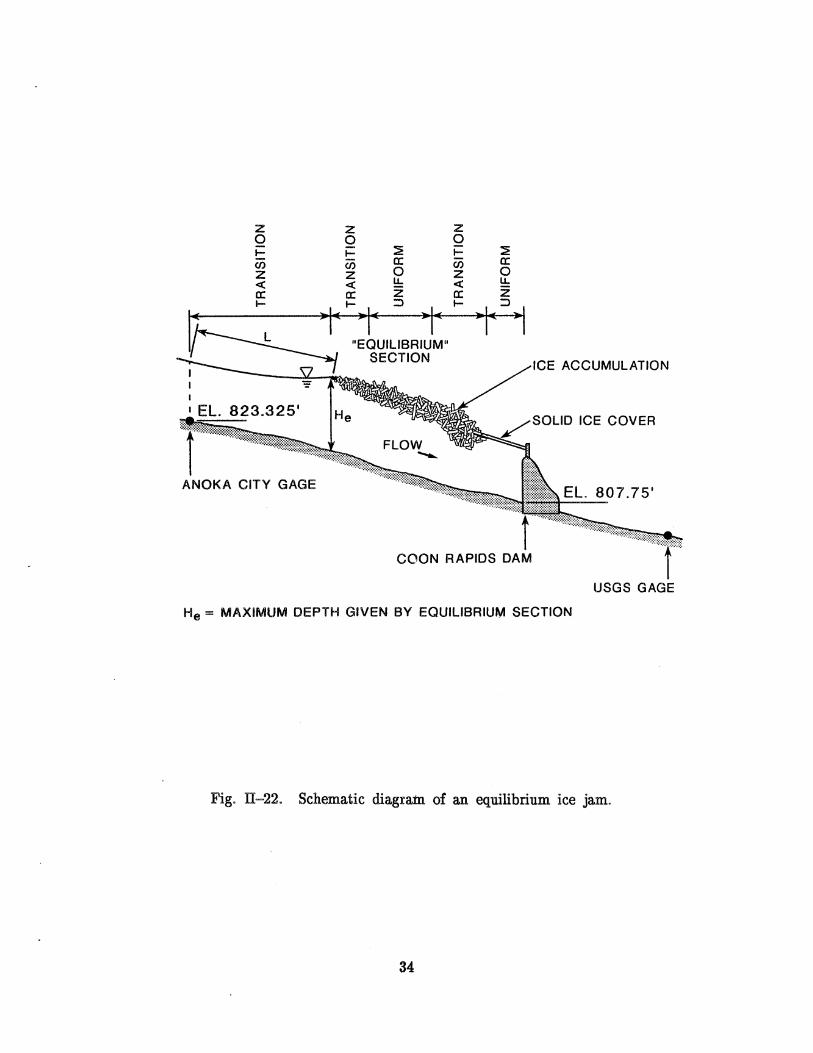
Tremendous effort has been put into understanding river ice processes throughout the world, but the complete prediction of flooding associated with ice jams is still not possible. There is an existing theory [Pariest et al., 1966; and Uzuner and Kennedy, 19761 to predict the water stage backed up by the ice jam if the jam is in equilibrium and we know the flow discharge underneath. A sketch of the ice jam is shown in Fig. II-22. The theory treats an ice jam as a floating granular mass that attains' a thickness adequate to withstand the applied forces. The forces exerted on the ice jam in the streamwise direction are the hydrodynamic force of the water current against the upstream end of the jam, the drag force of the flowing water under the jam, and the gravitational force component. They are resisted by the river banks consisting of a cohesive component and an ice over ice friction component. In the case of a wide river such as the Mississippi River and the spring breakup ice jam concerned here, the hydrodynamic term and the cohesive component can be neglected, and the following relation between the stage and the discharge for an equilibrium ice jam can be obtained [Beltaos, 1983]:
He _ _ he t se fi/3 t BSo = " - WSo + wso = 0.63 0 ~
+ 5 ~ 75 [1 + 1 + 0.11 P f~/3 (to)e 1 in which e is a dimensionless discharge parameter
q2
e =(g So)
where:
B So
He = the water depth behind the ice jam,
B = the river width,
So = the river bed slope,
he = the flow depth under the ice jam,
(II-l)
(II-2)
tse = the submerged portion of ice jam thickness (=92% of ice jam
thickness ),
fi = the friction faCtor of the jam underside,
fo = the composite friction factor of the flow under the jam,
33
I
z Q I-(i5 Z « a: I-
I EL. 823.325 1
ANOKA CITY GAGE
z Q l-e;; Z « a: I-
"EQUILIBRIUM" SECTION
FLOW ........
z o i=
COON RAPIDS DAM
ACCUMULATION
SOLID ICE COVER
: ':.
USGS GAGE
He = MAXIMUM DEPTH GIVEN BY EQUILIBRIUM SECTION
Fig. II-22. Schematic diagram of an equilibrium ice jam.
34
p = the coefficient related to the ice jam internal friction,
q - the flow discharge per unit width, and e
g = the gravitational acceleration.
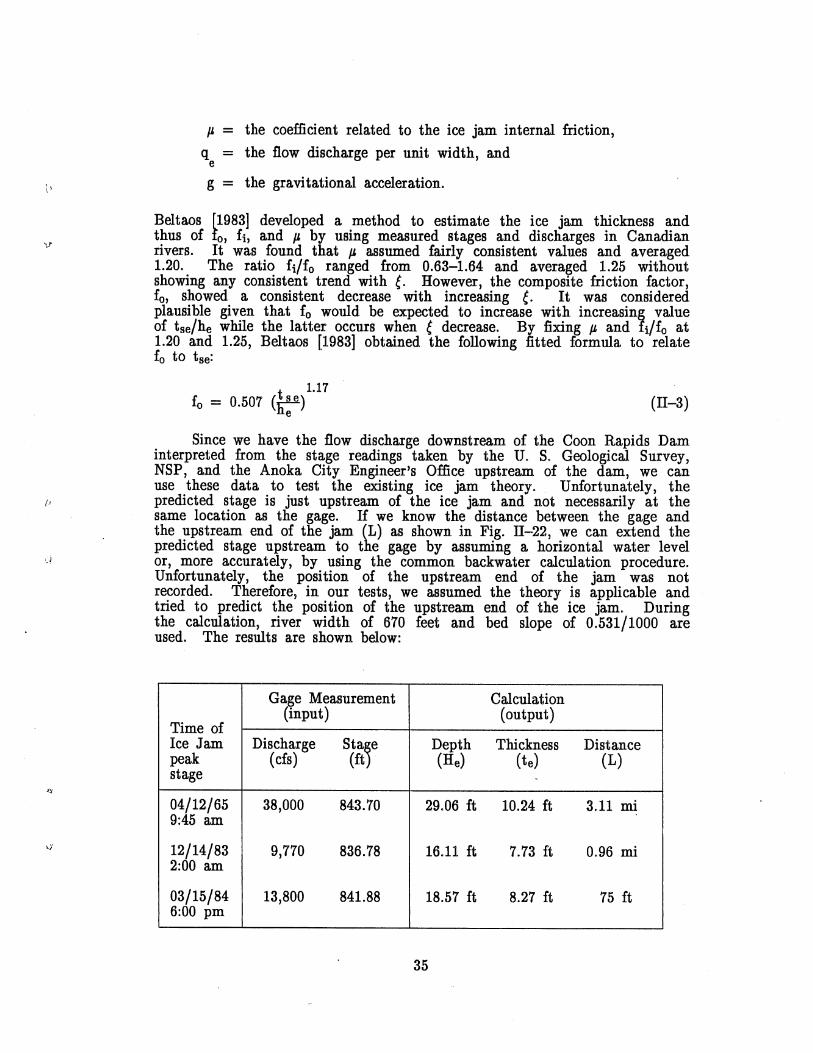
Beltaos r1983] developed a method to estimate the ice jam thickness and thus of to, fi, and p by using measured stages and discharges in Canadian rivers. It was found that p assumed fairly consistent values and averaged 1.20. The ratio fi/fo ranged from 0.63-1.64 and averaged 1.25 without showing any consistent trend with e. However, the composite friction factor, fo, showed a consistent decrease with increasing e. It was considered plausible given that fo would be expected to increase with increasing value of tse/he while the latter occurs when e decrease. By fixing p, and fi/fo at 1.20 and 1.25, Beltaos [1983] obtained the following fitted formula to relate fo to tse:
t 1.17 fo = 0.507 (li: e) (II-3)
Since we have the flow discharge downstream of the Coon Rapids Dam interpreted from the stage readings taken by the U. S. Geological Survey, NSP, and the Anoka City Engineer's Office upstream of the dam, we can use these data to test the existing ice jam theory. Unfortunately, the predicted stage is just upstream of the ice jam and not necessarily at the same location as the gage. If we know the distance between the gage and the upstream end of the jam (L) as shown in Fig. II-22 , we can extend the predicted stage upstream to the gage by assuming a horizontal water level Of, more accurately, by using the common backwater calculation procedure. Unfortunately, the position of the upstream end of the jam was not recorded. Therefore, in our tests, we assumed the theory is applicable and tried to predict the position of the upstream end of the ice jam. During the calculation, river width of 670 feet and bed slope of 0.531/1000 are used. The results are shown below:
Gage Measurement Calculation
Time of (input) (output)
Ice Jam Discharge Sta~e Depth Thickness Distance peak (ds) (ft (He) (te) (L) stage
04/12/65 38,000 843.70 29,06 ft 10.24 ft 3.11 mi 9:45 am
12/14/83 9,770 836.78 16.11 ft 7.73 ft 0.96 mi 2:00 am
03/15/84 13,800 841.88 18.57 ft 8.27 ft 75 ft 6:00 pm
35
From these measured data and tests, we can see that the larger the flow discharge, the larger the ice jam stage (or the water depth behind the jam), which is a general rule an equilibrium ice jam should follow. The predicted ice jam thickness and locations are in the range of the recorded values. Therefore, we can say the existing theory works reasonably well in our cases.
As pointed out above, to have a complete prediction, we have to know at what discharge ice will jam up and reach equilibrium. To know the jamming discharge, we have to know when and where ice cover will form and break up, and how the broken ice sheets will accumulate. There are no existing theories that can answer all these questions yet. Due to the complexity of the problems, a mathematical modeling approach is selected in this study. The existing theories will be used whenever available, and the gap will be filled with some new assumptions.
A number of proposals have been put up to solve the flooding problem at Anoka. They include raising the flooding plain, building an earth levee, or turning the flooded area into a park to reduce losses. If a mathematical model is well developed and tested, it can be used to predict the required protection level and to refine the existing flood. plain limit map [Ca.rlson and Guetzkow, 1980]. The mathematical model is. especially useful to evaluate ice management methods. Increase of thermal discharge from the Monticello nuclear power plant, operation of gates at the Coon Rapids Dam, and usage of Anoka Dam water storage to wash out ice cover before natural breakup may be realistic and cost-effective management methods for this site. Leaving the gates open at the dam was the practice HCPRD has engaged in since 1969. This practice has merits of lowering the maintenance cost and the pre-breakup water level, but, due to delayed formation of the ice cover in the upper pool, excessive production of frazil may cause ice jams downstream of the dam [Barr Engineering Co., 19731. The most recent one occurred in December 1985 which caused the water level to rise higher than the dam crest as reported by the Minneapolis Star and Tribune. It is also speculated that the limited space under the ice cover near the dam due to lower water levels may have contributed to the severe blockage of broken ice sheets in the 1983-84 season.
36
'.1
III. MODELING OF ICE COVER FREEZE UP
The simulation of river ice processes in the northern part of the state is a complex and challenging task. For modeling purposes, the river ice process is first divided into two parts: (1) freeze-up, and (2) breakup. Two models, one for each process, were developed and tested. They will be combined to form a complete model to simulate river freeze-up, breakup, and the effect of ice on flooding.
The freeze-up model will simulate the river ice process from the initial open water condition to the formation of continuous ice cover, and the growth and decay of ice cover up to but not including breakup. Then the breakup model will simulate the breakup process, including ice jam formation and failure, until the river is ice free again.
The freeze-up model is a one-dimensional model with the following major components: (1) hydraulic routing, (2) distribution of water .. temperature and frazil concentration, (3) formation and progression of:" ice-cover, and (4) growth and decay of ice cover.
A. HYDRAULIC ROUTING
A steady-state gradually varied flow routing has been chosen for the freeze-up model. This simple model is adequate because freeze-up is a relatively slow process usually occurring during low flow periods. A quasi-steady analysis with time step of one day should be sufficient for long term simulation. During the breakup season, the flow rate changes dramatically and transient analysis becomes necessary. In that case, the existence of supercritical flow and/or complexity of the boundary condition may warrant an unsteady flow routing.
The steady-state gradually varied flow equation can be integrated directly with a 4th order Runge Kutta method:
§- = So - Sf
1-~ gA3
1 Yi+l = Yi + B<al + 2a2 + 2as + a4)
37
(III-I)
(III-2)
in which
where:
x = distance along the channel, y = flow depth,
So = channel bed slope, Sf = energy slope obtained from Manning's equation,
Q = discharge, B = water surface width, A = flow cross-ilectional area, and
g = acceleration due to gravity.
The effect of ice cover on the flow condition is reflected by the increase in wetted perimeter and hydraulic roughness. The composite Manning's n is computed by the well know Sabaneev's equation [Uzuner, 1975]:
[ n3/2 n 3/~ 2/3
n - i + b - 2 (III-3)
where ni, nb = roughness coefficients for ice cover and channel bed. Time varia.tion of the value of ice cover Manning's n is calculated from an exponential function first suggested by Nezhikovskiy [1964]:
n· - n· + (n·· n· )e-kt 1- Ie 11- Ie (III-4)
38
',./'
where:
t = number of days since ice-cover formed,
nu = roughness coefficient at the beginning of freeze-up, about 0.01
to 0.012,
nie = roughness coefficient at the end of the freeze-up, about 0.008
to 0.01,
k = a decay constant that varies from river to river and year to
year.
B. DISTRIBUTION OF WATER TEMPERATURE AND FRAZIL CONCENTRATION
The computation of the longitudinal water temperature distribution and frazil ice concentration has an important role in the freeze-up simulation of ice-covered river. The physical phenomenon is governed by a onedimensional transport equation and a water-a.ir heat exchange equation. The mass of frazil produced is largely determined by the heat losses from the w~er. .
The transport equation of thermal energy in the water [Shen and Chiang, 1984] is given as: .
~pCpATw) + ~QpCpTw) =
where:
~AExpCp ~w) - B~T + qtCp(Tl- Tw)
Tw =water temperature,
p = density of water,
Ex = longitudinal dispersion coefficient,
B = width of river section,
~T =. net heat loss rate to the atmosphere,
ql = flow rate of lateral inflow,
T l = lateral inflow water temperature, and
Cp = heat capacity of water.
39
(III-5)
When the heat loss rate to the atmosphere is high, the water temperature T w will fall below the freezing point and supercooling occurs. This supercooling cannot continue for long; fruil ice will form by secondary nucleation. The concentration of fruil ice, Ci, produced can be computed as:
C. - -p Cp Tw 1 -
Pi Li
where:
Pi = density of ice, and
Li = latent heat coefficient.
Evaluation of the net heat loss coefficient before the ice cover forms is very important. Detailed analysis of the heat exchan~e process between water and air have been formulated by past researchers lAsthon 1986; Shen and Chiang, 1984]. It is a process governed by the weather conditions like air temperaturej solar radiation and wind speed. A simplified approach [Matousek, 1984 has been used in our model:
~T = - 81 + 12Ta + 3.2(O.8Ta + O.I)W
+ (318 + 4.6 Ta)CO [w/m2]
for air temperature 0" C > Ta > -12" C, and
~T = - 96 + 11 Ta + 3.2(O.7Ta - O.9)W
+ (326 + 4.6 Ta)CO [w/m2]
for air temperature Ta < - 12° C,
where:
(III~)
(III-7)
W = wind velocity at an elevation of 2 meter above the water
surface,
o = cloudiness, i.e. the extent of sky overcast with clouds classified
by' a scale from 0 to 1,
40
:.
1/
r)
C = coefficient dependent on the cloud density, for thin clouds
C = 0.006, moderately dense clouds C = 0.16, dense clouds
C = 0.21.
The formulations above are valid only when there is no ice cover in the river reach. With an ice cover acting as an insulation layer, the water temperature remains fairly constant throughout the winter at O· C. Heat exchange between the water and ice will occur only if the water temperature is above freezing point (Tm) and the heat exchange rate becomes lAshton, 1986]:
where:
U = flow velocity and
Y = flow depth.
(III-8)
The assumptions made in here are that turbulent heat exchange, bed heat flux, and shortwave radiation that penetrate into the water can be ignored.
. When the river flow is fully turbulent, the dispersion term in Eq. III-5 usually can be neglected, as compared to other terms. Then, we can rewrite . Eq. III-5 as :
, !n'I ~ [ -B<PT + ql pCp(Ti-Tw) ] u~w + U u~w _ at ox - p Cp A (III-9)
where:
U = Q/A, mean flow velocity, , T w = water temperature at a previous timestep.
By assuming dx/ dt = U, the left hand side of Eq. 1II-9 is simplified to dTw/dt. The equation is then solved by the well-known Characteristic method.
41
The Characteristic method in the freeze up model uses a time line interpolation or a spatial interpolation rGoldberg and Wylie, 1983], depending on the value of Courant number, Cr (Cr = uatl ax). In each cross section, Cr will be calculated at every time step. When Cr is less than 1, a spatial interpolation is used. Time line interpolation will be used when Cr is greater than 1. By this method, the numerical scheme is always stable.
C. FORMATION AND PROGRESSION OF ICE COVER
When the air temperature falls below the freezing point for an extended period of time, ice cover is very likely to form on an open stretch of river under favorable conditions. The formation of initial ice cover on a river surface can be divided into two major process: (1) border ice growth from the banks toward the center of the river and (2) frontal ice progression from barrier, either a man-made structure or a naturaJ. ice bridge.
Border ice growth is the major mode of ice formation in a fast flowing river where complete ice cover across the section does not occur in the early state of freeze-up. Using a two-dimensional analysis, researchers have been able to present some mathematical models that can provide satisfactory results [Hirayama, 1986; Svensson, Billfalk and Hammar, 1988].
Over the years, studies have shown that large rivers with relatively low velocity are most likely to experience frontal progression by juxtaposition and/or dynamic progression [Michel, 1984l. Although both are accumulation of ice fragments that progress upstream, Juxtaposition will form an ice cover of one layer thick; dynamic formation will give a larger initial thickness depending on the Froude number. In this model, we only consider the frontal progression without border ice growth. .
The criteria for the upstream progression of ice cover by dynamic formation is derived from the theory of the narrow equilibrium ice jam [Pariset and Hausser, 1961], sometimes also know as the submergence criterion:
u --= ,.Jgy
where:
ho = ini tial thickness of ice cover, y = water depth,
ec = ep + (l-ep)e, ep = porosity in the ice floes accumulation,
e = porosity of an ice floe.
42
(111-10)
:.
(;
\j
Note that the unknown in Eq. 111-10 is ho and the left-hand side is the Froude number. When the Froude number is too high, ice cover becomes unstable and upstream progression will not occur. This limiting Froude number is reported in the literature with the range of 0.08 to· 0.12. The wide equilibrium ice jam theory, as described in Section II, has also been used to determine the initial thickness, but it is not used in this model.
With the initial thickness given either by juxtaposition or dynamic formation, the rate at which ice cover advances upstream can be computed [Shen, Lal and Gunaratna, 1988]:
5
Vcp = Qi - Qu 5
[Bho(l~ ) (1~p)] _ Qi - Qu Vs
where: 5
Qi = acQ Ci = volumetric rate of surface ice discharge,
Qu = volumetric rate of ice entrainment under the cover,
B = width of ice cover,
V 5 = average velocity of the incoming surface ice particles,
ac = surface ice discharge ratio.
(111-11)
Frontal progression will occur only after an ice-bridge has formed in the river. Currently, formulation of the process of ice bridging is not available, thus the time and location of the ice bridge's occurrence have to be treated as input parameters in the model.
Once the ice bridge is formed in the downstream section, a subroutine (see Section III-E) will be called to compute the frontal progression until the whole river section is completely ice covered. The initial thickness ho of ice cover at each station is computed from Eq. 111-10, then the upstream progression rate V cp is calculated from Eq. 111-11.
The ice front in each timestep can be traced by dividing the distance between stations, ax, by V cp in the downstream cross section to obtain the travel time; if this travel time is less than the timestep, V cp and ho for the next section will be calculated. This process will continue until the cumulative travel time is equal to the timestep.
. In each timestep, the frontal progression is calculated unless the ice front encounters a section with Froude number exceeding the limiting value or it reaches the last station at the upstream boundary. Once the second condition is satisfied, the whole river section is completely ice covered, and we will not compute frontal progression in the next timestep. .
43
D. GROWTH AND DECAY OF ICE COVER
After the formation of ice cover, the thickness of the cover in each section will grow and decay with the weather condition. Taking into account snow cover and effect of warm water discharge, the one-dimensional heat exchange equation is given as:
L dhi Tm - Ta h (T T ) Pi i :rr = 1 h . h - wi w - m Ub + 1 + s
Ii;; Xi x;-
where:
hi, hs = thickness of ice cover and snow cover,
hwa, hWi = heat exchange coefficients at the top and bottom surfaces of the cover,
Ks, Ki = thermal conductivities of snow and ice, and Tm, Ta = freezing temperature and air temperature.
(111-12)
The formulation of Eq. 111-12 is based on the assumption that the temperature profile is linear in both the ice and the snow. Turbulence, heat exchange, and bed heat flux have been ignored too.
Snow cover plays an important role in the growth and decay of ice cover. During the freeze up season, the snow cover with lower conductivity becomes an insulating layer and thus limits the growth of ice cover significantly. When the snow cover is very thick, it would be able to submerge the ice cover. Snow ice will be formed, as water can seep through cracks in the ice cover and wet the snow layer. Based on weight balance considerations, the thickness of snow susceptible to the formation of snow ice is given as [Asthon, 1986]:
h - ps - Pi h. s - Pi 1
(111-13)
Sado, Nakao and Sakurai [1988] presented a static ice growth model based on equilibrium surface temperature and heat exchange coefficient which appears to be a promising improvement over Eq. 111-12. However, our current model took a simplified approach and used Eq. 111-12. The thickness of the snow cover is computed from the precipitation data, which is multiplied by a compaction coefficient in the range of 0.2 to 0.35. Effect of snow ice is not considered here yet.
The value of hwa can be calculated as a linear function of wind velocity, hwa = a + bW. Typical values of hwa range from 10· W Imo C for still conditions to about 25 W/mo C for wind speeds on the order of 4 m/s [Asthon, 1980]. The water-ice heat exchange coefficient hwi can he calculated from Eq. 111-8.
44
II
,'1
I'
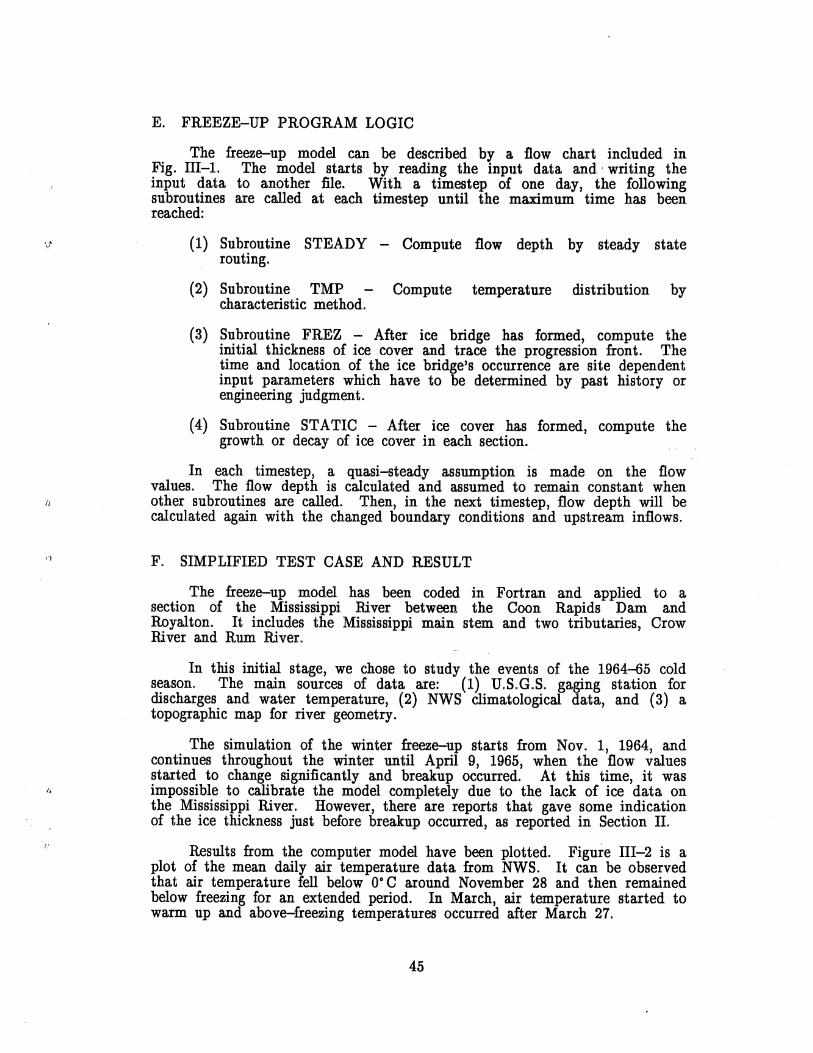
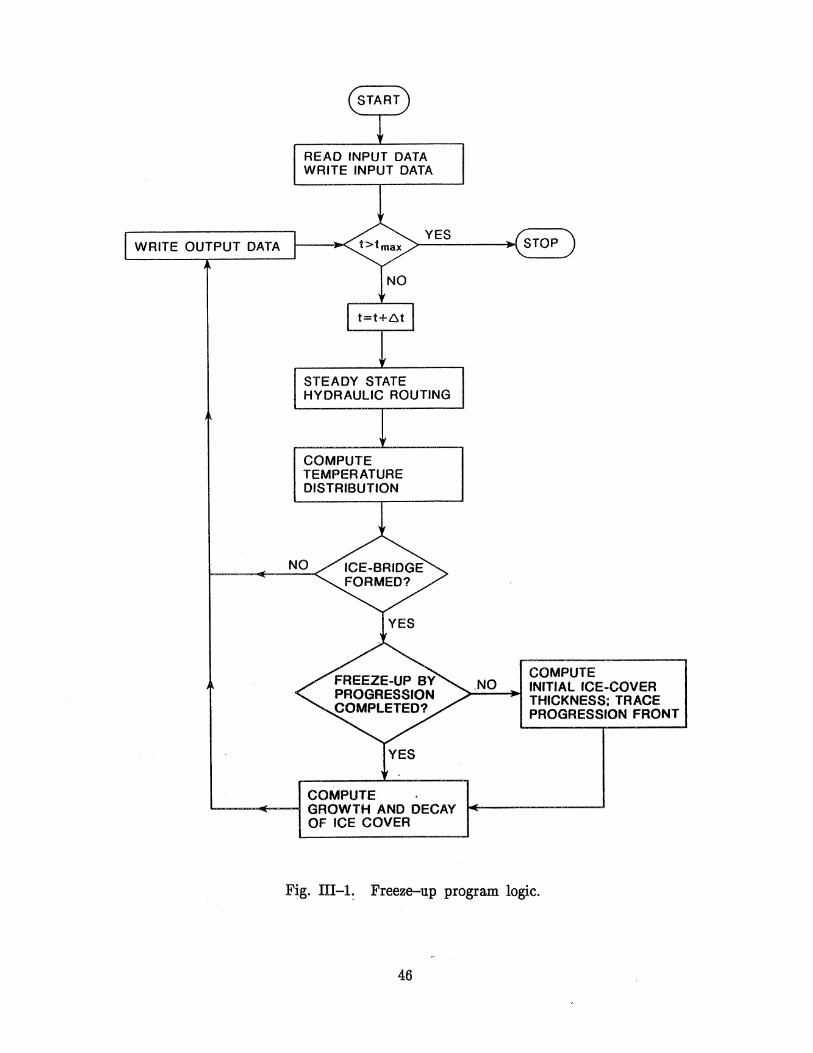
E. FREEZE-UP PROGRAM LOGIC
The freeze-up model can be described by a flow chart included in Fig. 111-1. The model starts by reading the input data and, writing the input data to another file. With a timestep of one day, the following subroutines are called at each timestep until the maximum time has been reached:
(1) Subroutine STEADY - Compute flow depth by steady state routing.
(2) Subroutine TMP Compute temperature distribution by characteristic method.
(3) Subroutine FREZ - After ice bridge has formed, compute the initial thickness of ice cover and trace the progression front. The time and location of the ice bridge's occurrence are site dependent input parameters which have to be determined by past history or engineering judgment.
(4) Subroutine STATIC - After ice cover has formed, compute the growth or decay of ice cover in each section ..
In each timestep, a quasi-steady assumption is made on the flow values. The flow depth is calculated and assumed to remain constant when other subroutines are called. Then, in the next timestep, flow depth will be calculated again with the changed boundary conditions and upstream inflows.
F. SIMPLIFIED TEST CASE AND RESULT
The freeze-up model has been coded in Fortran and applied to a section of the Mississippi River between the Coon Rapids Dam and Royalton. It includes the Mississippi main stem and two tributaries, Crow River and Rum River.
In this initial stage, we chose to study the events of the 1964-65 cold season. The main sources of data are: (1) U.S.G.S. gaging station for discharges and water temperature, (2) NWS climatological data, and (3) a topographic map for river geometry.
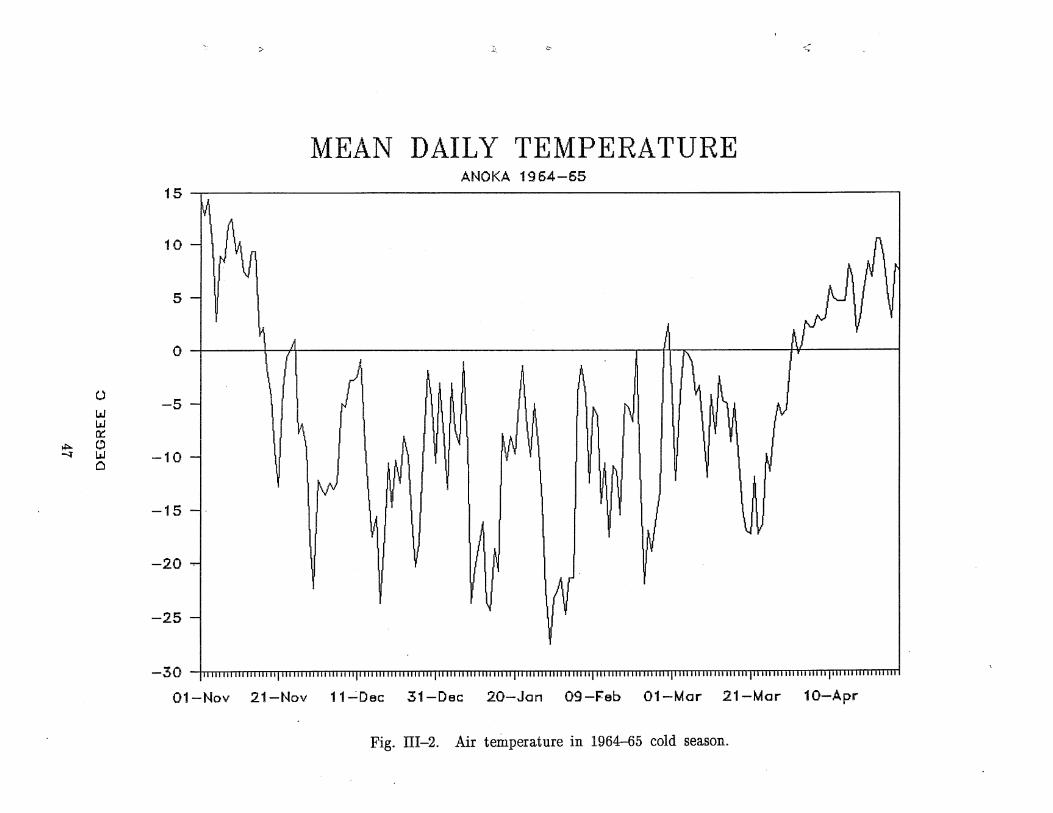
The simulation of the winter freeze-up starts from Nov. 1, 1964, and continues throughout the winter until April 9, 1965, when the flow values started to change significantly and breakup occurred. At this time, it was impossible to calibrate the model completely due to the lack of ice data on the Mississippi River. However, there are reports that gave some indication of the ice thickness just before breakup occurred, as reported in Section II.
Results from the computer model have been plotted. Figure 111-2 is a plot of the mean daily air temperature data from NWS. It can be observed that air temperature fell below O· C around November 28 and then remained below freezing for an extended period. In March, air temperature started to warm up and above-freezing temperatures occurred after March 27.
45
WRITE OUTPUT DATA
READ INPUT DATA WRITE INPUT DATA
YES
STEADY STATE HYDRAULIC ROUTING
COMPUTE TEMPERATURE DISTRIBUTION
COMPUTE L-..-~--t GROWTH AND DECAY
OF ICE COVER
COMPUTE .NO INITIAL ICE-COVER
THICKNESS; TRACE PROGRESSION FRONT
Fig. III-1: Freeze-up program logic.
46
0 lIJ lIJ 0:::
~ " ~ lIJ Q
:> 1:. c- -<
MEAN DAILY TEMPERATURE ANOKA 1964-65
15
10
5
0
-5
-10
-15
-20
-25
-30 III III iii iii 111111111 Illlii ill iii ill Ii "I' ill iii iii Ii ilii iii 1'111111111 illi 11111 111111111 ilii 11111 iii Hi 111111 iii Iii iii il' Iii III iii Iii hlill Iii iii ill iii iii i1i1ijili iii Iii Ii ill IIti
01-Nov 21-Nov 11~Dec 31-Dec 20-Jan 09-F'eb 01-Mar 21-Mar 10-Apr
Fig. III-2. Air temperature in 1964-65 cold season.
Figures ill-3 and 1II-4 are the plots of data from U.S.G.S. gaging stations. They are the mean daily discharges of the Mississippi River main stem and the two tributaries, Crow River and Rum River. These figures showed that during the freeze-up season, from November 30 to April 9, the discharge remained fairly constant. Figure 111-5 is the plot of calculated water depths at the upstream ends of the Crow River and Rum River and the water depth upstream of Coon Rapids Dam.
The calculated ice cover thickness at selected reaches is given in Fig. 111-6. We can observe the time lapse of the formation of complete ice cover in the main stem and tributary. The ice thickness computed prior to breakup compares favorably with the reported value of about 1 m.
The ice cover attained a maximum thickness around March 27, then started to decay due to the warming of air temperature. From the ice thickness plot, it can be concluded that the breakup was not due to thermal decay but rather a premature mechanical breakup, which is the case experienced in the 1964-65 cold season:
48
,...... u I) UJ
"~ It') f.O E
.......
\" '" Ie " < ,",
MEAN DAILY DISCHARGE MISSISSIPPI Rv. ANOKA 1964-65
200 -.---------------------------------------------------------------------.
190
180
170
160
150
140
130
120
o 110
100
90
80
70
60
50 III II 11111 I II Ii I II II I' II II 11111 II i II II ill' II 1111 Ii II 11111 II 11 I II II II 11111 1111 I I if III III 11111 II II I 1111"11 III III ",ii Ii I I 1"1111111 II 1111111 '1""1 111111 1111 11111
01-Nov 21-Nov ii-Dec 31-Dec 20-Jan 09-F"eb 01-Mar 2i-Mar 1O'-Apr
Fig. III-3. Mean daily discharge in the Mississippi River downstream of the Coon Rapids Dam in 196~5 cold season.
MEAN DAILY DISCHARGE 1964-65
6
5
4 ,..., u G)
'" " 3 tc)
en E 0 ........
0
2
1
o 1111 I IIII iii I Ii Iii iii I iii II iii i II iii Ii Iii Ii I i 1111 Iii iii I Iii i i ill I iii H Ii i ill iii I II iii Ii II i II i Ii i II iii i i II i Ii Ii II ill ill Iii 1111111 I iii Iii Iii iii I I iii Ii iii ill I iii I
01-Nov 21-Nov 11-Dec 31-Dec 20-Jon 09-F'eb 01-Mor 21-Mor )
<> CROW RIVER 6. RUM RIVER
Fig. 111-4. Mean daily discharge in the Crow River and the Rum River in 1964-65 cold season.
" !, .. ~
WATER DEPTH 1964-1965
5.5 -.----------------------------------------------------------------------~
5
4.5
4
'"' 3.5
E '"""
en >- 3 .....
o
2.5
2
1.5
1
01-Nov
Crow Rv US
21-Nov 11-Dec
+
31-Dec 20-Jon 09-Feb 01-Mol'" 21-Mol'"
Rum Rv US o COON RAPID DAM
Fig. ID-5. Modeled water depth at the Coon Rapids Dam, and in the Crow and the Rum Rivers.
ICE THICKNESS 1964-1965
1.1
1
0.9
0.8
0.7
,..... O.S en E t.:I '-'
-J: 0.5
0.4
0.3
0.2
0.1
0
30-Nov 20-Dec 09-Jan 29-Jan 18-F'eb 10-Mar 30-Mar 19-Apr
Crow Rv US A COON RAPID DAM x Mid Crow Rv
Fig. III-6. Modeled ice-cover thickness at the Coon Rapids Dam, and in the Crow and the Rum River.
, . "
IV. MODELING OF ICE COVER BREAKUP,
JAMMING AND FLOODING
A. ICE COVER AND ICE JAM
Continuous ice covers can exist in two forms: consolidated and fragmented. Consolidated covers, which are commonly called ice covers, can be either newly formed or fragmented covers that have been reconsolidated and smoothed. As illustrated in Section III, the source of ice for this type of cover is frazil or frozen water under the initial cover. The undersurface of this type of ice cover is characteristically either smooth or has small ripples because it is formed by accumulation of small particles. Therefore, the resistance is relatively small, and the Manning's coefficient of ice cover (ni) is about 0.01. When an existing ice cover is broken up but the large ice masses remain interlocked, a continuous fragmented ice cover may form. This condition is often referred to as an ice jam. The undersurface of fragmented unconsolidated ice covers (ice jams) is extremely rough, increasing with increasing thickness, and th.e Manning's coefficient lni) could reach 0.1, which is much larger than 0.025-0.03 of typical river bed (nb). The thickening mechanisms for both ice cover and ice jam are the same: juxtaposition, under surface accumulation or internal crushing depending on the flow condition. Therefore, the major reason for an ice jam to be treated separately from ice cover is the difference in their sources: frazil for ice cover and broken ice sheets for ice jams. This section will treat the ice cover breakup and the jamming processes. For comparisons, the free-surface flow and the ice-covered flow are modeled first.
B. SIMPLIFIED RIVER SYSTEM NEAR. ANOKA AND SPECIFIED FLOW CONDITIONS
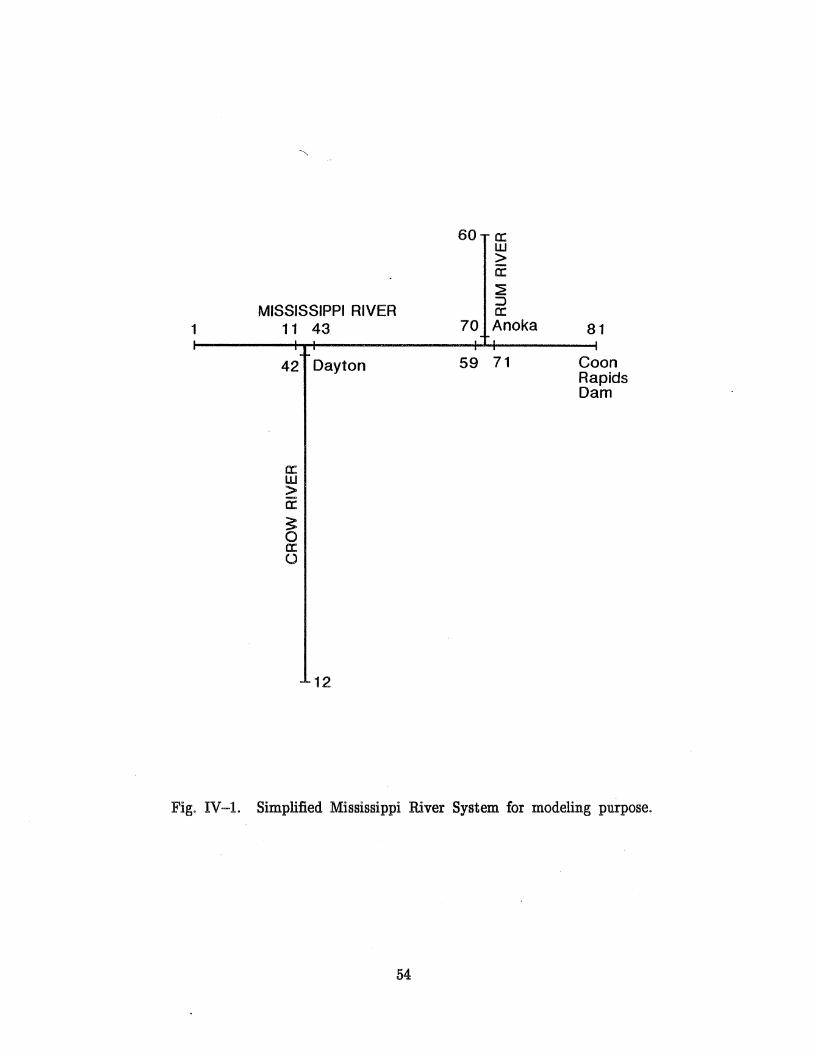
The Mississippi River and its tributaries near Anoka were selected for the purposes of modeling different ice processes and their relations to flooding. The modeled area includes the Mississippi River from the Coon Rapids Dam to a location below the City of Elk River, the lower reaches of the Crow and the Rum Rivers, as shown in Fig. IV-I. Numbers shown in Fig. IV-1 are the station numbers for the purpose of defining segments of the system. Each river junction is represented by three stations for identification of three connecting segments. The entire system is divided into 76 segments of 2500 feet each. The width of the Mississippi River is taken to be 670 feet, that of the Crow River to be 220 feet and the Rum River to be 267 feet. Slopes of the Mississippi River, the Crow River and Rum River are taken to be 0.531/1000, 0.45/1000, and 0.531/1000, respectively. The free overflow condition is assumed at the Coon Rapids Dam (downstream boundary). From the headwater curve measured for the dam when all gates are open [McGinnis, 1969], the following discharge head relation is derived and applied in the modeling:
53
1 MISSISSIPPI RIVER
11
42
a: w > a: ~ o a: U
43
Dayton
12
60 a: w > a: ~ :::> a:
70 Anoka 81
59 71 Coon Rapids Dam
Fig. IV-I. Simplified Mississippi River System for modeling purpose.
54
Q = 0.49 BAHj 2gAH (IV-I)
where:
Q - flow discharge over the dam, B - the total width of the dam opening and equal to 924 feet
AH = the difference between the headwater level above the dam, and the dam crest level which is 822.8 feet.
The bottom elevation of the dam is taken to be 807.75 feet when the dam height is 15.05 feet.
The flow conditions and ice processes of the 1964-65 cold season is taken to be the test case. The flow entered into the river system at three upstream ends is specified according to measurements of U.S.G.S., which can also be predicted by a snow melt runoff model. Flow at station No. 1 coming from the Mississippi River near Royalton, the Sank River near St. Cloud and the Elk River near Big Lake, was equal to 14,190 cfs at noon on April 11, 1965, and 22,169 ds 24 hours later. Flow at station No. 12 was measured in the Crow River at Rockford and ranged from 6800 ds to 11,900 cfs within one day. The Rum River flow entering at station No. 60 was 500 to 1080 ds in this time period. As was stated in Section II, the initial driving force for ice cover breakup and jamming in the modeled Mississippi River reach could be the ice jam release in the Crow River at Dayton (station No. 42). .
According to the record, ice jam failure first occurred at about 10:00 p.m. on April 11, 1965, at Rockford in the Crow River. This ice jam _ failure is estimated to have triggered another ice jam at Dayton to fail at about 3:00 a.m. of April 12, which is located at the confluence of Crow River and Mississippi River. The flow depth behind the Dayton jam was 15.8 feet just before the release, as determined by using the same method described in Section II. The condition at 3:00 a.m. of April 12 was used as the 1nitial condition of the mathematical modeling, and the subsequent ice breakup and jamming process in the Mississippi River near Coon Rapids Dam was simulated.
C. FREE SURF ACE FLOW
The unsteady free surface flow is modeled by using the well known St. Venant equations:
(IV-2)
f)y lJv &v g 7Ji. + or + v 7Ji + g (Sf - So) = 0 (IV-3)
55
where: y = the flow depth, v = the flow velocity, c = the gravity wave speed,
So = the river bed slope, Sf = the energy slope, and g = the acceleration due to gravity.
The above equations are solved by the method of characteristics. The initial flow distribution in the study reach is determined by running the unsteady model for a period of time with the fixed inflow at the three upstream ends until steady state is reached. After this, the response of the study reach to the ice jam release at station No. 42 (Dayton) is modeled.
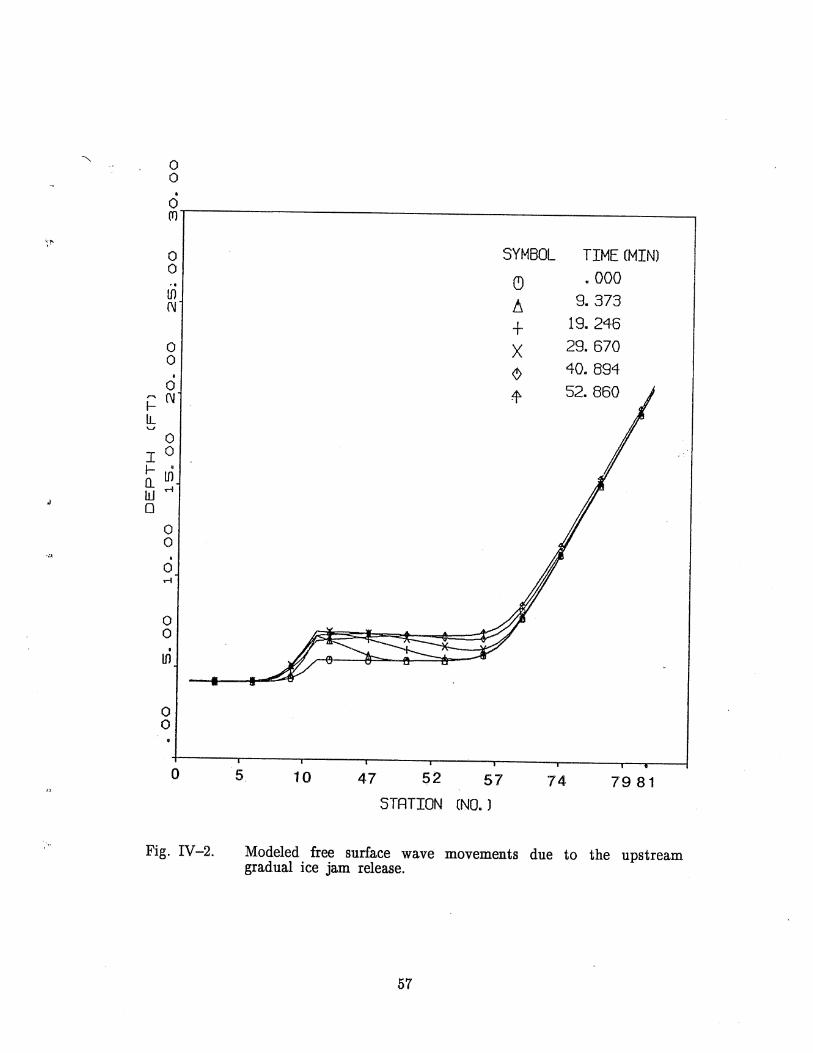
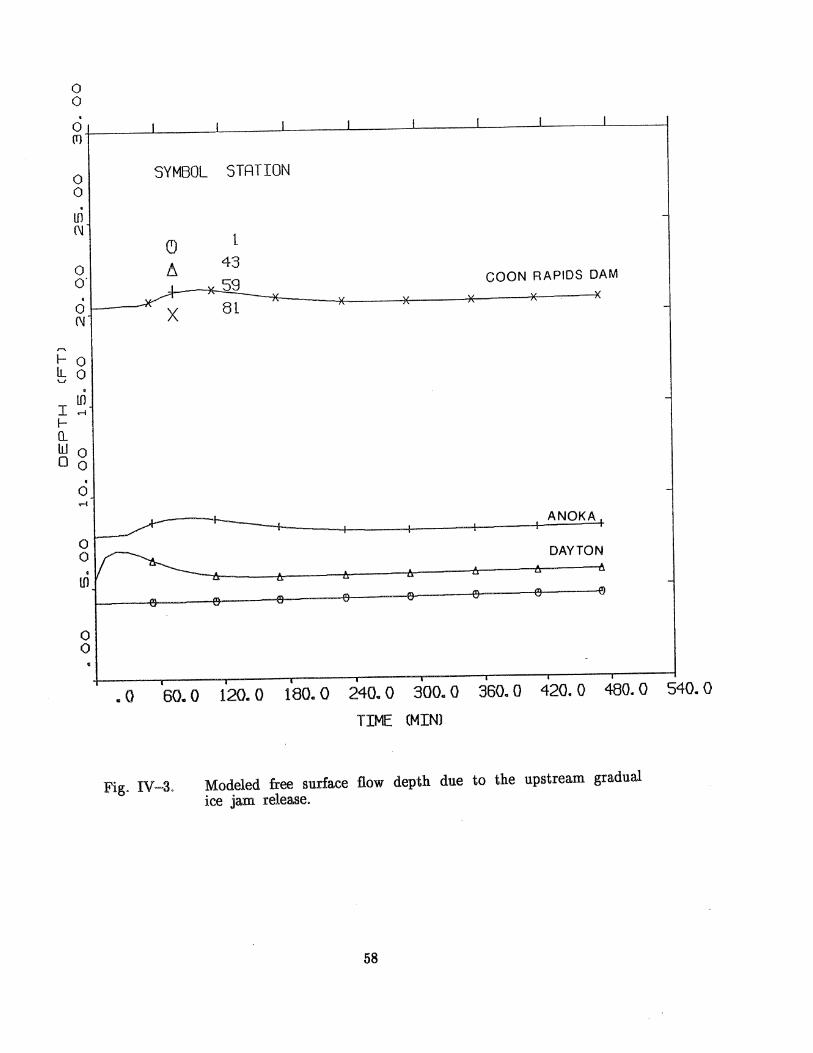
Two different types of ice jam releases at station No. 42 are considered: gradual and instantaneous. Two different types of downstream boundary conditions are also considered: free overflow and an equilibrium ice jam at the Coon Rapids Dam. The gradual ice jam release at Dayton assumes that ice jam release will not produce surge and Eqs. IV-2 and IV-3 are applicable everywhere. Numerically, the occurrence of shock waves is prevented by using a diffusive method. The simulated wave movement for the case that free overflow at Coon Rapids Dam was assumed along the Mississippi River due to the gradual jam release in the Crow River at Dayton are shown in Fig. IV-2. The corresponding water. depth at several locations are shown in Fig. IV -3. It can be seen from these figures that the wave steepness becomes smaller as it travels downstream due to the diffusion and the backwater effect of the dam.
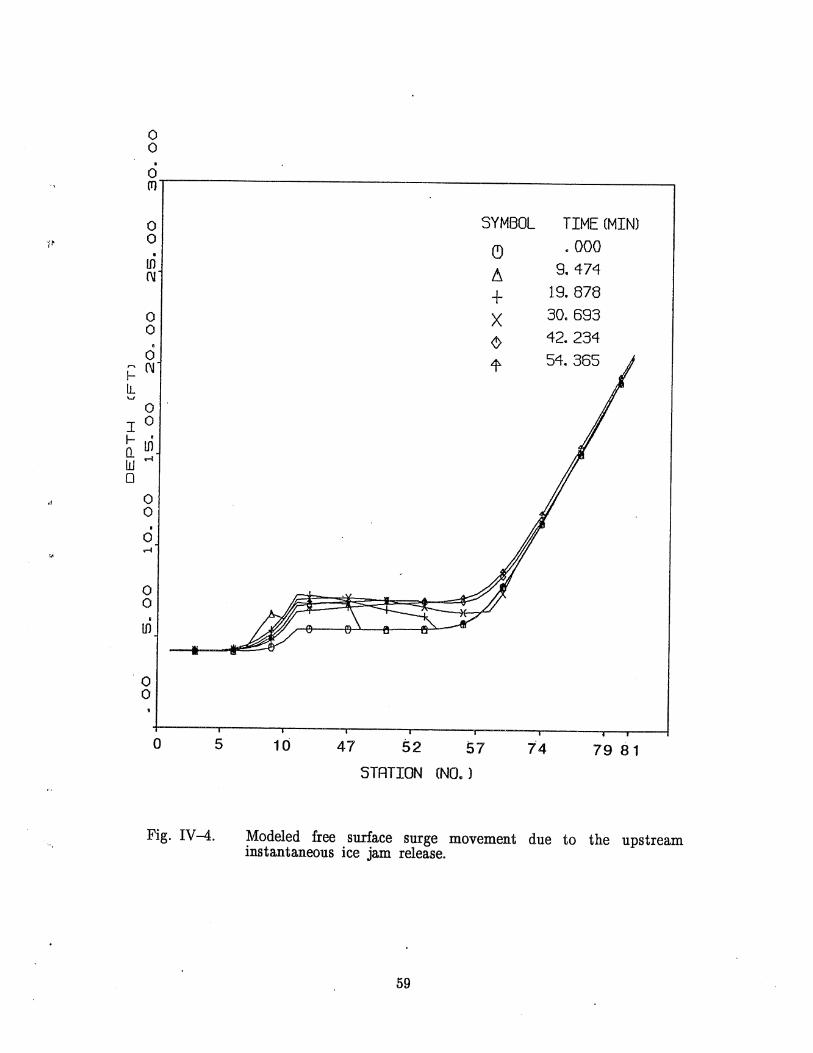
The instantaneous ice jam release at Dayton is simulated by initially setting up a positive surge (hydraulic jump) moving downstream and a negative wave moving upstream, as described by Henderson and Gerard [1981]. The movement of the surge into and along the Mississippi River is simulated by a shock fitting method in which the continuity and the momentum equations in the moving coordinates are applied over the surge. This method is the same as that used by SAFHL to model the storm sewer flow [see, e.g., Song et al., 1983; Guo and Song, 1989] except that one side of the surge in the storm sewer is pressurized. The modeled movement of surge along the Mississippi River with the dam free overflow downstream is shown in Fig. IV-4. It can be seen that the slope of the water level at the surge is much larger than that of the gradual release. Only the modeling results of the gradual release of the ice jam will be reported even though the impact of the steep surge on the ice cover breakup will also be discussed.
.56
"-
\t
0 0 ,
0 (T)
0 0 -, If) N
0 0 ,
0 '"' N l-lL '-'
0 I 0 I- • fl lD W M
0
0 0 . 0 M
0 0 •
lD
o o
o
Fig. IV-2.
5
SYMBOL TIME (MIN)
(9 .000
/], 9.373
+ 19. 246
X 29.670
~ 40.894
t 52.860
10 47 52 57 74 7981
STRTION (NO.)
Modeled free surface wave movements due to the upstream gradual ice jam release.
57
0 0
· 0 (T)
0 0
· m N
0 o·
· 0 N
~
I- 0 lL 0 \.J
· If) I ~I I-0.. W 0 0 0
· 0 M
0 0
· ill
0 0
I I J 1 I L I 1
SYMBOL STRTION
(9
A _I
X
~
~ m ~
. . 0 60.0
Fig. IV-3.
1 43
~59 COON RAPIDS DAM
8t v )~ )E X
- ANOKA
DAYTON
~ ~ ... ~ ~ ~ u
~ 1tI
'" ~ ~ v v v v
. . 120.0 180.0 240 .. 0 300Q 0 360~0 420.0 480.0
TIME (MIN]
Modeled free surface flow depth due to the upstream gradual ice jam release.
58
-
-
540.0
1~
..
"
0 0
· 0 (J)
0 0
· IJ) N
0 0 •
0 .... N l-LL '-'
0 I 0 I-- • 0. Ii) W ..-I
0
0 0 •
0 ..-I
0 0 •
In
o o
a 5
Fig. IV-4.
SYMBOL TIME (MIN)
(9 .000
A 9. 474
+ 19.878
X 30.693
~ 42.234
4- 54.365
10 47 52 67 74 79 81
STATION (NO.)
Modeled free surface surge movement due to the upstream instantaneous ice jam release.
59
If an equilibrium ice jam exists at the Coon Rapids Dam, the outflow from this system is no longer controlled by the dam, and the role of the dam is only to initiate the jam. The relation between the discharge and the depth for the equilibrium ice jam, as described in Section II, has to be used as the downstream boundary condition. The modeled water depth at various locations is shown in Fig. IV-5. Due to the much higher resistance and the blockage by the jam, the backwater level is much high~r than that of the dam-free overflow case. Maximum water level and the most severe flood can be expected under this condition. In reality, if upstream flow increases too rapidly, the ice jam cannot adjust its thickness quick enough to resist the bigger flow drag, and the jam fails.
D. ICE COVERED FLOW
In a wide river such as the Mississippi River under consideration, ice cover formed in early winter is usually disconnected from banks due to flow fluctuation, and the ice cover floats. Therefore, the ice covered flow should not be treated as a pressurized flow. We will calculate the free-surface water level at the banks and in the crack of the cover as water depth y in the St. Venant equations. Effect of ice cover on flow (flooding) is modeled by corrections to the energy slope term and the gravity wave speed. In the energy slope term:
where:
(IV-4)
A = flow cross-sectional area reduced in depth by Sit (Si is specific
gravity of ice = 0.92, t the thickness of ice cover),
P = wetted perimeter increased by the ice cover width,
n = composite Manning's coefficient obtained through Eq. III-3 in
Section III.
The gravity wave speed c is as follows:
C = j g (y-s it ) (IV-5)
which is derived by assuming a fully flexible ice cover. At the boundary between the ice covered flow and the free surface flow, the depth y is the same at both sides but the velocity is larger at the ice covered side due to reduction in flow cross-sectional area. Assuming the Manning's coefficient is the same for both ice cover and river bed and equal to 0.013, and assuming the river system is ice covered with the thickness of 1 foot, except the Crow River, the modeled flow result is shown in Fig. IV-6. The curves in Fig. IV -6 represent the water depth variation at several locations due to the gradual ice jam release in the Crow River and the increasing snow melt runoff inflow at upstream ends. It can be seen that water level is higher than that of the free-surface flow shown in Fig. IV-3, e.g., ice covered
60
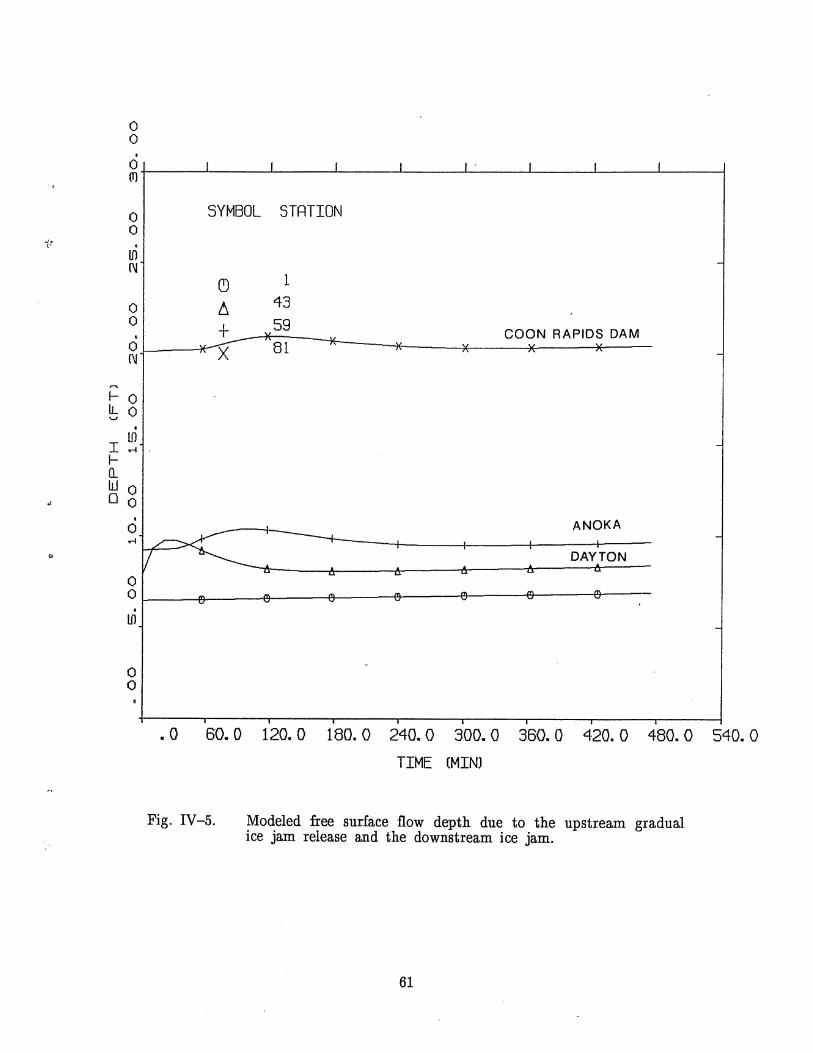
0 0 •
0 (T)
0 0
it · ill (\J
0 0 •
0 (\J
'"' I- 0 lL 0 '-'
• I
ill .-l
I-0.. W 0 o 0
· 0 .-l
0 0
· ill
0 0
I I I I I . I I I
SYMBOL STATION
(9
6-+ X
~ 7
-~
.0 60.0
Fig. IV-5.
1 43
v 59 COON RAPIDS DAM 81 '"
ANOKA ..J.
DAYTON .. u -=
- ~ - ,.. ,.. -v -v v v
120.0 180.0 240.0 300.0 360.0 420.0 480.0
TIME (MIN)
Modeled free surface flow depth due to the upstream gradual ice jam release and the downstream ice jam.
61
-
-
-
540.0
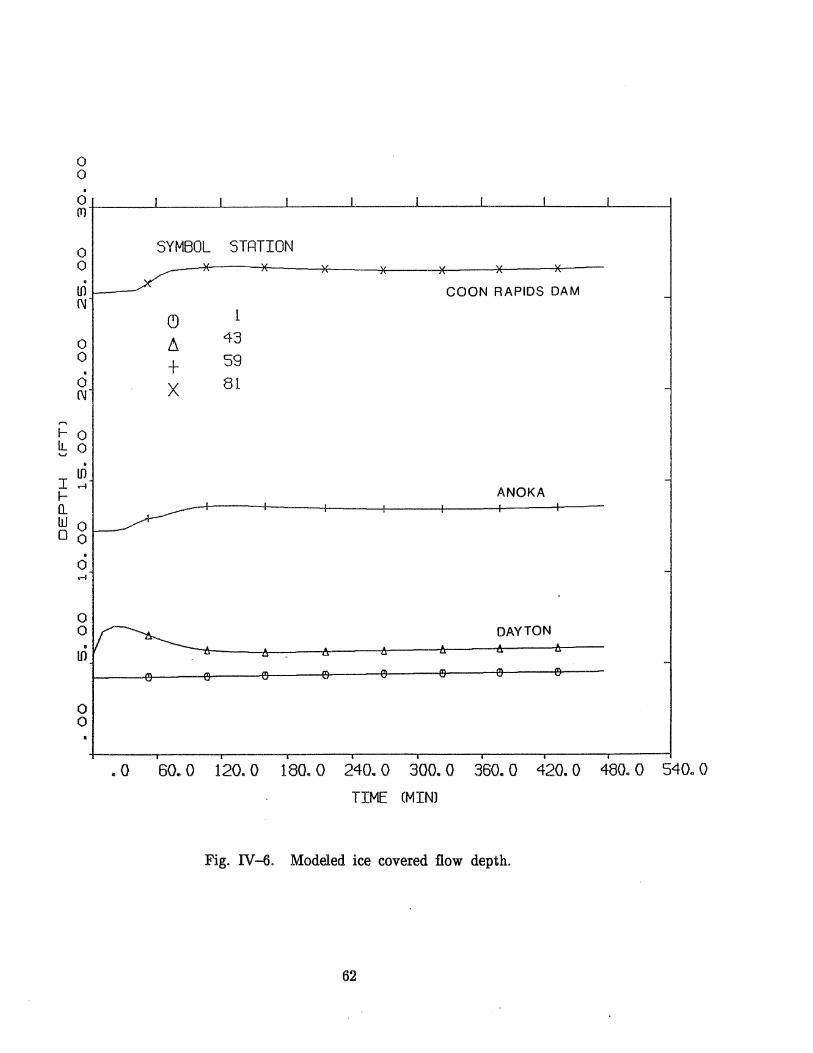
o o · O+-____ ~I ______ ~I ____ ~I~ ____ ~I. ______ ~I ____ ~I ____ ~I~ ____ ~I ____ ~
(T)
~
o o · tn~-
N
o o · o
N
I- 0 It. 0 "" · I ~ I-
SYMBOL STRTION
(9
A + X
1 43 59 81
~O~ o 0
· o .-I
o o
, I I •
COON RAPIDS DAM -
-
-ANOKA
DAYTON
-
. 0 60.0 120.0 180.0 240.0 300.0 360.0 420.0 480.0 540.0
TIME (MIN)
Fig. IV-6. Modeled ice covered flow depth.
62
J
water level is 1.43 feet higher than free surface level at Anoka (station No. 59) at the end of the simulation.
E. ICE COVER BREAKUP PROCESS AND FLOODING
When there is an increase of inflow upstream of the river, either due to the snow melt runoff or the upstream ice jam failure, ice cover could be broken up and transported downstream. As the ice cover breakup progresses from upstream toward downstream and the resistance to the flow decreases, more water will be released from the upstream side of the remaining ice cover. The combined effect of the increased inflow and the newly released water may produce even larger breaking force. If the broken ice sheets cannot be transported downstream, then an ice jam will form and even higher water stage will be reached. In this section, only the breakup process is to be considered.
A number of ice cover breakup models have been proposed over the years. They can be basically classified into two categories: breakup due to drag and breakup due to bending. The initial thickness of ice cover and ice jam in the wide river are determined from force balance in the flow direction as described before, where ice cover formed by small ice floes and ice jam formed by big broken ice chunks are treated as a granular mass. After formation, especially of the ice cover, they can be reconsolidated or thicken by the thermal process. If the water drag increases to exceed the shear strength of the ice cover, ice cover will fail. If the water drag increases dramatically, as in the case of an upstream jam failure, the whole section of ice cover can be dislodged from the banks instantaneously. If the water drag only increases slightly, as in the case of snow melt runoff, the ice cover will be broken in the center at first where the drag is maximum. Ferrick and Mulherin [1989] termed these two kinds of breakup processes as support-dominated and strength-dominated breakup or high-energy and low-energy breakup. The criterion for the support-dominated breakup is [Ferrick and Mulherin, 1989]:
where:
fh = the applied hydraulic force per unit length of ice sheet,
Sf = the flow energy gradient,
B = the river width,
1 and 1i = the specific weights of water and ice respectively,
R = the hydraulic radius of the channel, and
ti = the ice cover thickness.
63
(IV-6)
The number 1680 (P a) was taken from the field study of the Connecticut River near Winsor, Vermont, which is between the commonly used measures of strength of pure solid ice and that of fragmented ice. This criterion is used in the current model because of the assumed existence of an upstream ice jam failure. The modeled result is shown in Fig. IV-7. Rapid increase of the water level due to water release during ice cover breakup can be seen in the figure. The movement of the breakup front can also be observed from the time of the water level change at different locations. The energy slope was the criterion for the strength-dominant breakup, which is determined by Ferrick et al. [19861 to be 0.00006 for very thin ice cover on the Hudson River in New Yorx. In the strength dominant breakup, movement of the breakup front may coincide with movement of broken ice sheets and, therefore, broken ice sheets may also be involved in the breakup; thus, quantification of this breakup becomes complicated. Generally, in a reach of an ice covered river with diminishing hydraulic gradient, the support-dominant breakup will occur upstream, the strength-dominant breakup at downstream, and the jamming at the downstream end when it is possible.
Two kinds of bending mechanisms have been proposed for the breakup studies: vertical bending in a straight channel and horizontal bending in a meandering channel. Billfalk [1982] studied analytically the response of ice cover to upstream water wave. The analysis is based on the theory of beams on an elastic foundation (water under the ice cover). Initial cracking is assumed to occur when the vertical bending moment induced in the ice cover by the wave exceeds theflexual strength of the ice cover. According to the analysis,- a wave front steepness of about 0.01 is required for the bending failure, which is not common in rivers. As pointed out befo:re, when there is an instantaneous ice jam failure upstream, a strong surge can be created. In this case, the exact solution to the surge movement using the shock fitting method is needed. A bending movement on planes parallel to the water surface may be created in a meandering river, which was studied by Beltaos [1983]. In this case, the moment is obtained through multiplying the driving force by a characteristic length. If the flexual strength is exceeded, the ice cover cracks.
F. ICE JAMMING PROCESS AND FLOODING
In the last section, it was assumed that the broken ice sheets could be washed downstream as soon as they are broken. In the following, accumulation of the broken ice sheets (jamming) and its effect on the backwater level are to be considered.
As pointed out before, there are a number of conditions that determine the final thickness of an equilibrium ice jam. Thickness of an ice jam formed by a single layer of broken ice sheets is apparent and equal to the thickness of ice floes and ice chunks themselves. The thickness of an ice jam formed by submergence and accumulation can be determined by Eq. 111-10 for a narrow ice jam, and that formed by the internal crashing (shoving) can be determined by Eq. 11-1 for a wide ice jam. Questions remaining to be answered are whether an ice jam will form and in which mode it will form. Therefore, a model is needed to simulate a continuous
64
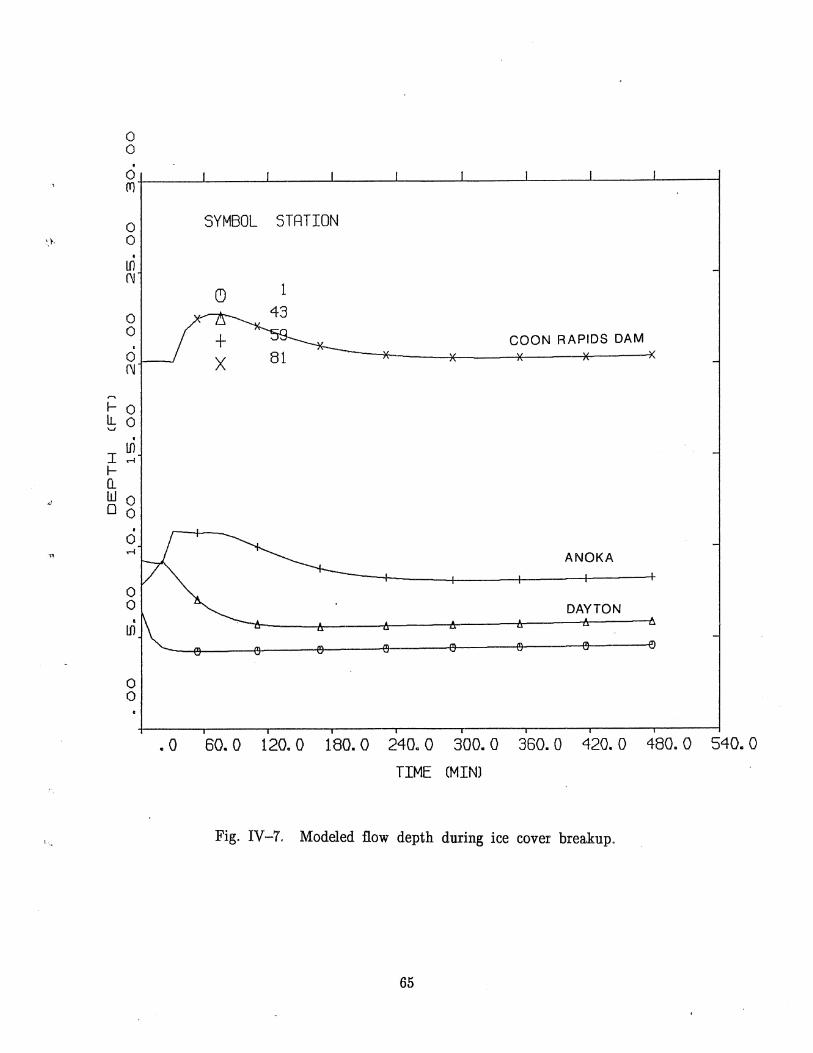
\~,
.'
0 0 •
0 (T1
0 0 •
U1 (\J
0 0
· 0 (\J
~
I- 0 IL 0 "'-'
• U1
I .-l
l-n.. W 0 o 0
• 0 .-l
0 0 •
U1
o o
SYMBOL STATION
1
COON RAPIDS DAM
81
ANOKA
DAYTON
.0 60.0 120.0 180.0 240.0 300.0 360.0 420.0 480.0 540.0
TIME (MIN)
Fig. IV-7. Modeled flow depth during ice cover breakup.
65
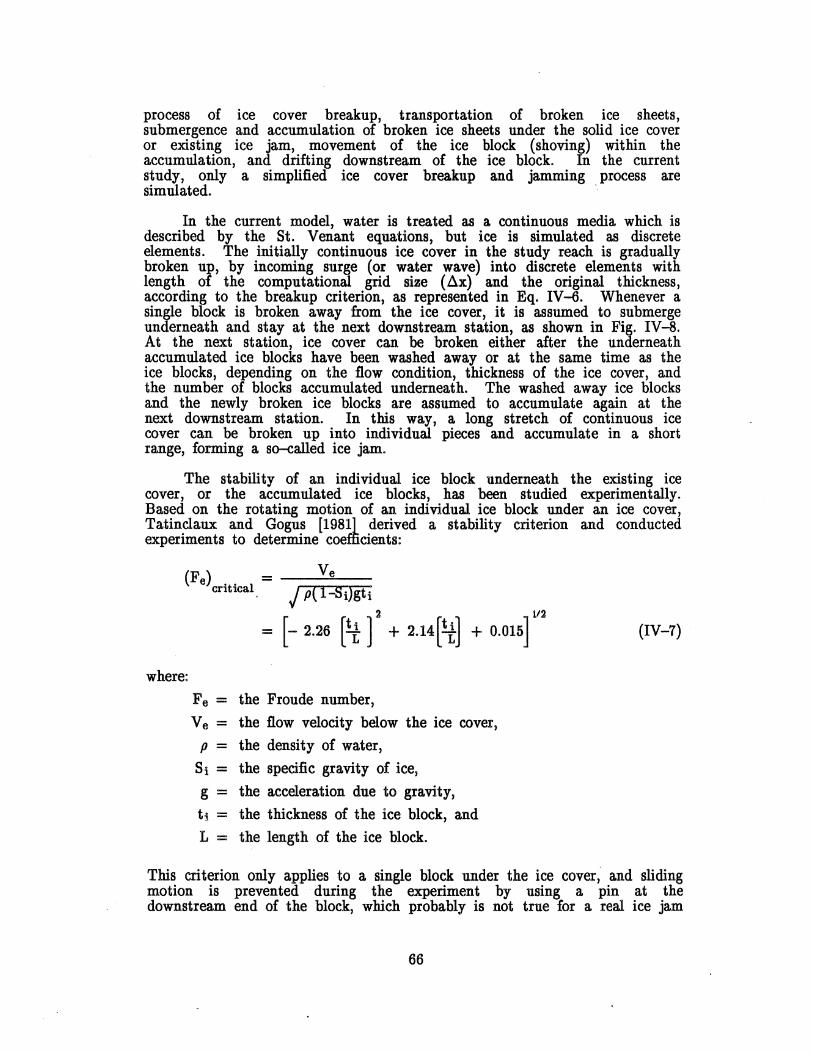
process of ice cover breakup, transportation of broken ice sheets, submergence and accumulation of broken ice sheets under the solid ice cover or existing ice jam, movement of the ice block (shoving) within the accumulation, and drifting downstream of the ice block. In the current study, only a simplified ice cover breakup and jamming process are simulated. .
In the current model, water is treated as a continuous media which is described by the St. Venant equations, but ice is simulated as discrete elements. The initially continuous ice cover in the study reach is gradually broken up, by incoming surge (or water wave) into discrete elements with length of the computational grid size (Ax) and the original thickness, according to the breakup criterion, as represented in Eq. IV-6. Whenever a single block is broken away from the ice cover, it is assumed to submerge underneath and stay at the next downstream station, as shown in Fig. IV-8. At the next station, ice cover can be broken either after the underneath accumulated ice blocks have been washed away or at the same time as the ice blocks, depending on the flow condition, thickness of the ice cover, and the number of blocks accumulated underneath. The washed away ice blocks and the newly broken ice blocks are assumed to accumulate again at the next downstream station. In this way, a long stretch of continuous ice cover can be broken up into individual pieces and accumulate in a short range, forming a s<H:alled ice jam.
The stability of an individual ice block underneath the existing ice cover, or the accumulated ice blocks, has been studied experimentally. Based on the rotating motion of an individual ice block under an ice cover, Tatinclaux and Gogus [19811 derived a stability criterion and conducted experiments to determine coefficients:
(F e) = ---;::;:V~e:;;:;:;;: critical j p( 1 :Si)gti
where:
2 1/2
- [- 2.26 [ti] + 2.14[ti] + 0.015]
Fe = the Froude number, Ve = the flow velocity below the ice cover,
p = the density of water, Si = the specific gravity of ice,
g = the acceleration due to gravity, ti = the thickness of the ice block, and L = the length of the ice block.
(IV-7)
This criterion only applies to a single block under the ice cover, and sliding motion is prevented during the experiment by using a pin at the downstream end of the block, which probably is not true for a real ice jam
66
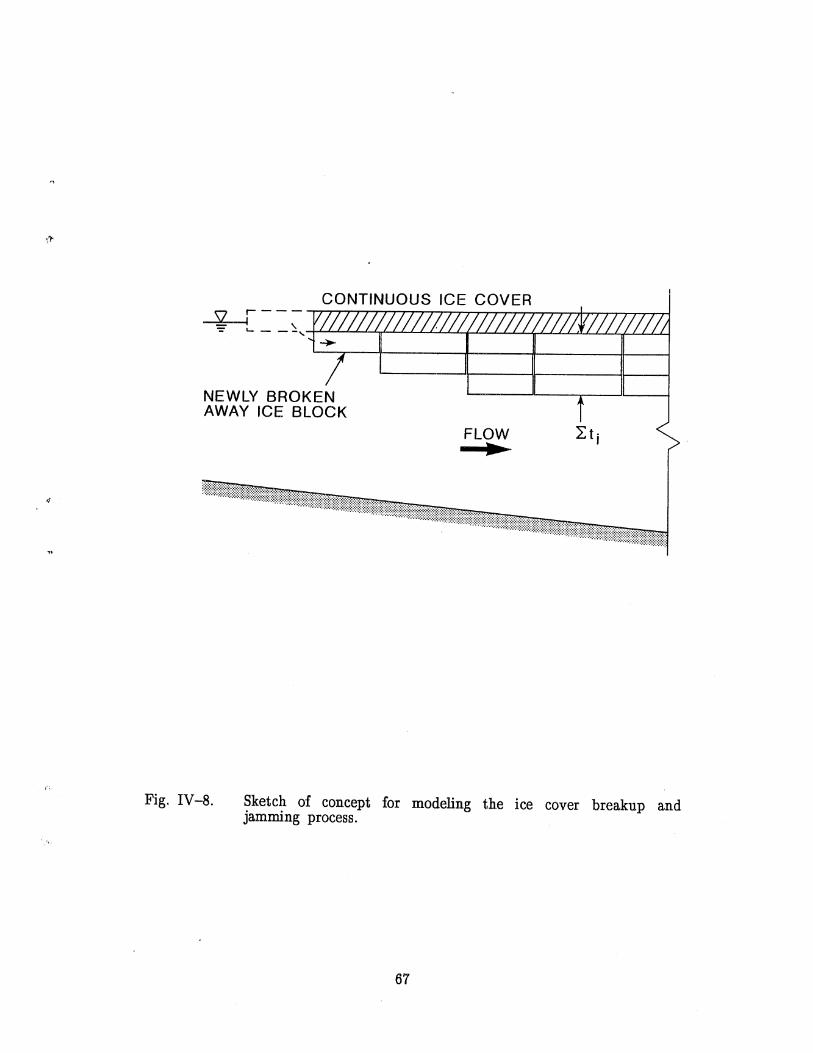
NEWLY BROKEN AWAY ICE BLOCK
FLOW L:tj •
Fig. IV-8. Sketch of concept for modeling the ice cover breakup and jamming process.
67
formation. But, major obstacles for its application in the current model are that this criterion requires knowing the length of the ice block, which is not readily known, and that this criterion leads to formation of a narrow ice jam, which is not common. Therefore, a stability criterion which is consistent with the wide river ice jam and which does not require information about the length of the ice block is proposed and used in the current model. In Pariest et al. 's [1966] paper, the stability criterion for a wide ice jam is expressed in the following way:
where:
x Q
B
C H
p,
Si t
= = = -----
a dimensionless parameter,
the flow discharge,
the river width,
the Chezy coefficient,
the back water depth,
the internal friction factor as used in Eq. II-I,
the specific gravity of ice,
the thickness of the ice jam.
(IV-8)
X reaches the maximum value of 2.8xlO-3 when ~H is equal to 0.4 and if p, = 1.28, Si = 0.92. Ferrick and Mulherin [1989 pointed out that the ice cover breakup criterion in Eq. IV-6 would yield = 7.4xl0-3 for the river section studied by them. For the current model, the following modified Ferrick and Mulherin's breakup criterion is used to determine the stability of an ice block under the ice cover or the existing ice jam:
(IV-9)
where Eti (see Fig. IV-8) represents the sum of thickness of several block considered for movement under the ice cover and p is the modified coefficient. Whether only one block or several blocks will· be washed downstream can be determined by changing Eti.
The simulated ice breakup and jamming process, produced by using the current model, is shown in Fig. IV-9 through Fig. IV-12. Water levels at several locations are shown in Fig. IV-I 3, from which we can see that the water level due to ice cover breakup and jamming is higher than that of pure breakup as shown in Fig. IV-7. Most significantly, water level changes from that affected by ice cover, as shown in Fig. IV--6, to that affected by a downstream wide equilibrium ice jam, as shown in Fig. IV-5, which means that the whole process of ice cover break up and jamming can be simulated by the current model.
68
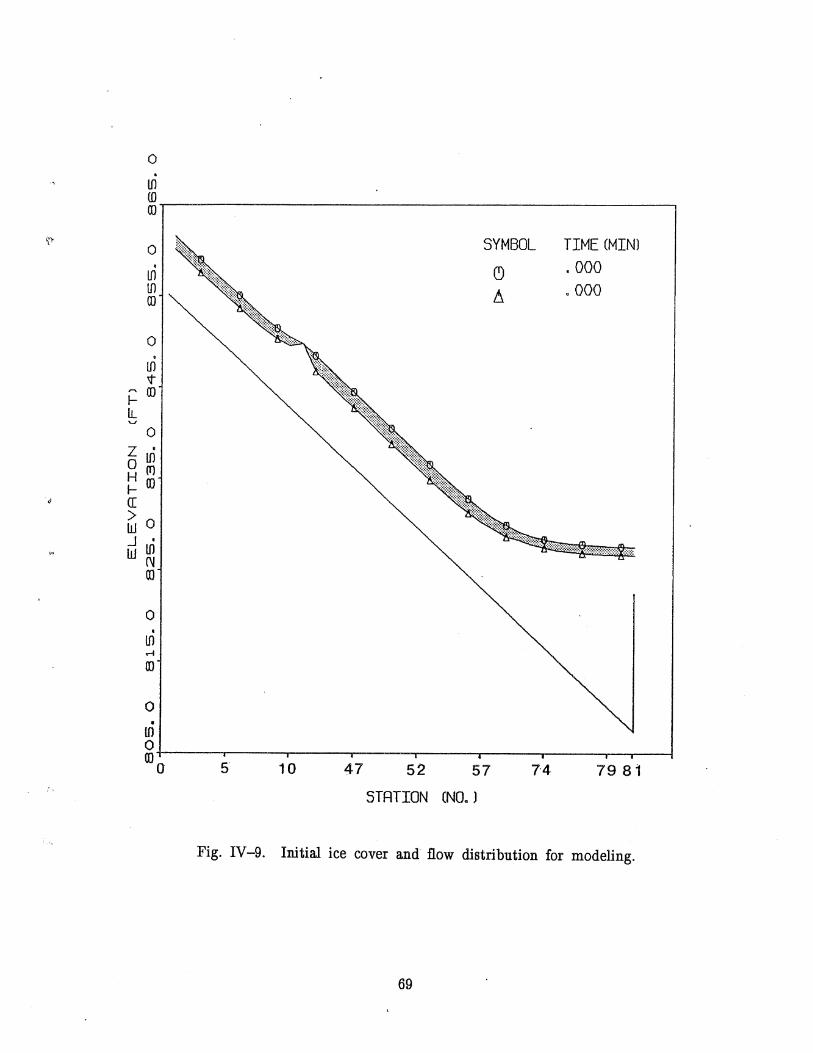
0
· Ul (D 00
'r" 0 SYMBOL TIME (MIN) • (9 . 000 Ul
Ul A .000 00
0
· Ul 't
~ 00 l-II
0 Z ' a Ul H (f) I- 00 ([
~ 0 .J • w Ul
N 00
0
· Ul .-l
00
0 •
If) 0 00 0 5 10 47 52 57 7'4 7981
,'. STATION (NO. )
Fig. IV-9. Initial ice cover and flow distribution for modeling.
69
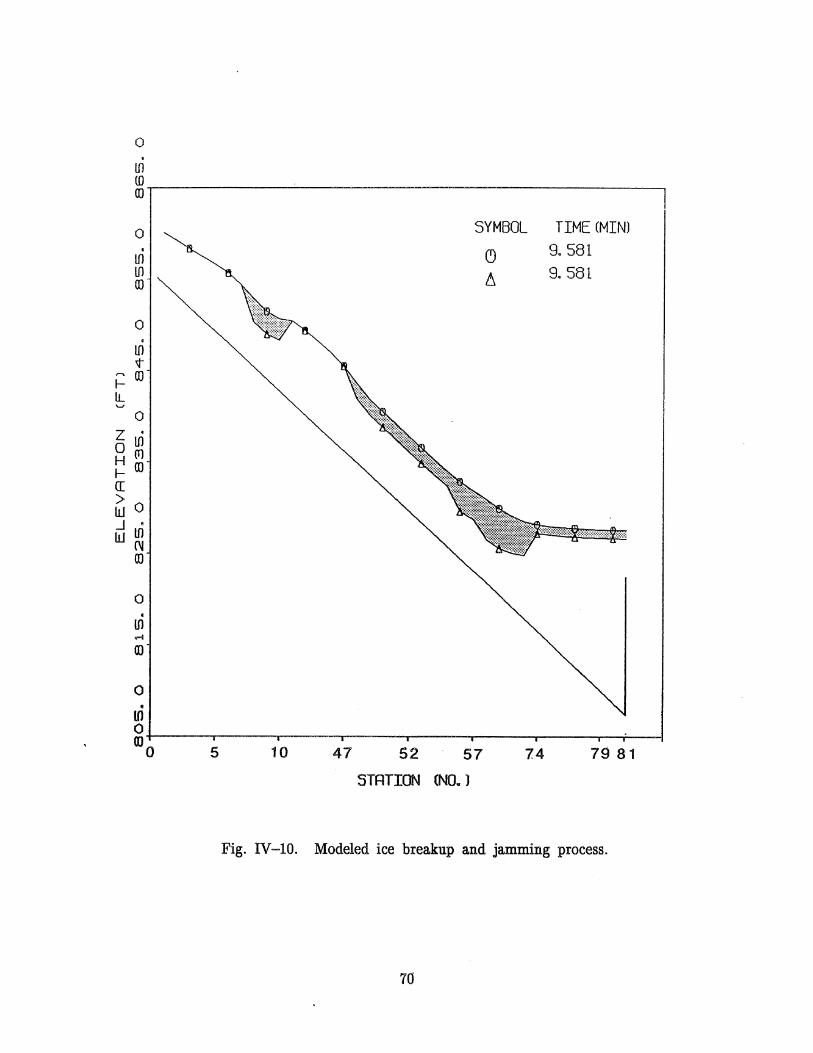
o · Ul ill~ ____________ ~ ________________________________ ~ fD
o · Ul
Ul fD
o · Ul
V" '""' fD l-lL '-'
o z . o Ul H (T) I- fD ([
~O -1 • W If)
(\J fD
o · If) ~
ID
o •
U1
SYMBOL
(9
tJ.
TIME (MIN) 9.581 9.581
O~ ____ ~ ____ ~ ____ ~ ____ ~ ____ ~ ____ ~ ____ ~-T __ ~
IDO 5 10 47 52 57 14 79 81
STATION (NO.)
Fig. IV-lO. Modeled ice breakup and jamming process.
70
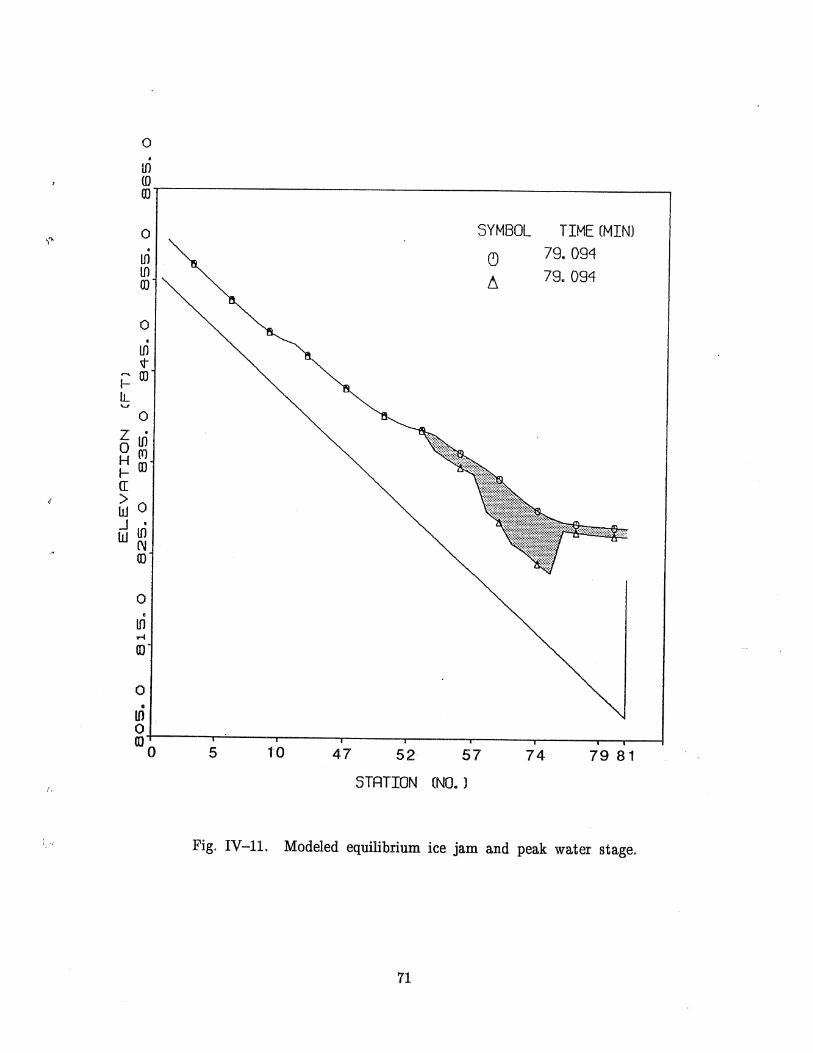
0 •
U) (0 ID
0 SYMBOL TIME (MIN) ~.,.
79.094 · e) If) If) A 79.094 ID
0
· If) ¢
~ ID t-IL '-I
0 Z . o U) H (T) t- ID ([
~ 0 .J • W II)
N ,< ID
0
· II) .-f
aJ
0 •
II) 0 aJO 5 10 47 52 57 74 79 81
STATION (NO. ) r .•
Fig. IV-H. Modeled equilibrium ice jam and peak water stage.
71
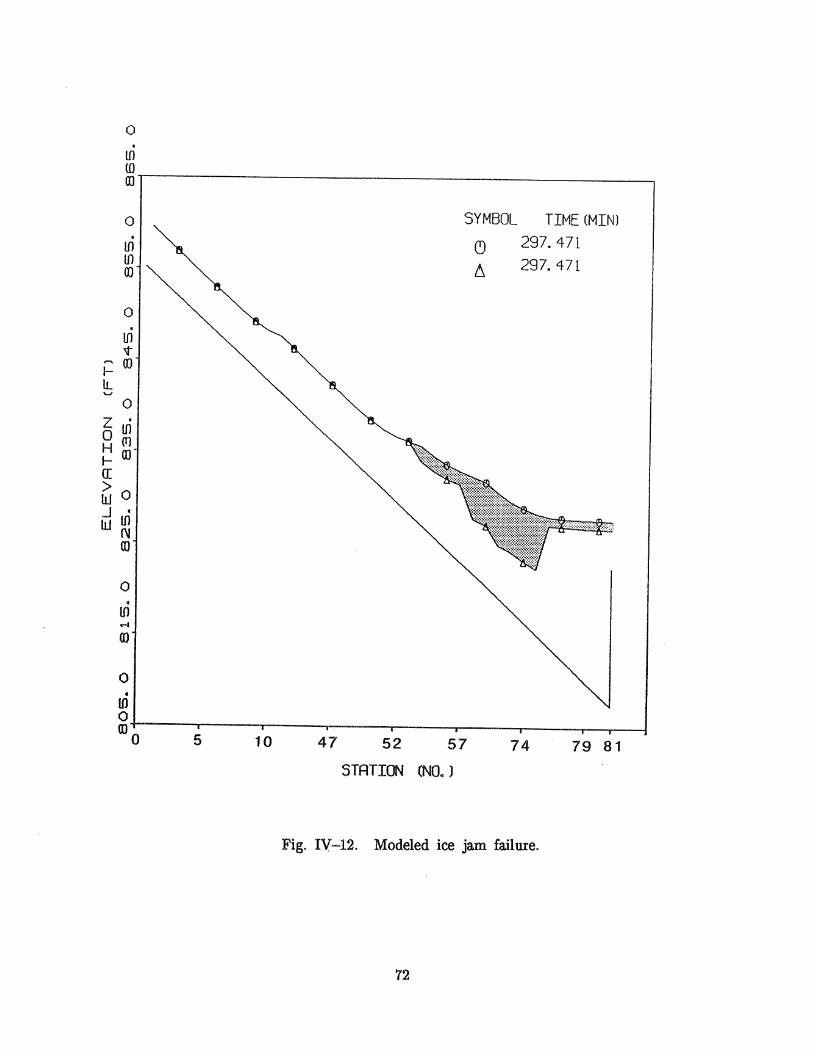
o · lD m~ ______________________________________________ --, [)
o ,
lD lD [)
o
o z . o lD H (T1 I- [) a.: ~ 0 .J • W lD
('J [)
o · to
..-I
[)
o · Ul
SYMBOL
C)
t,
TIME (MIN)
297.471
297.471
O+-____ ~ __ --~----~----~------~----~----~~~ roo 5 10 47 52 57 74 79 81
STATION (NO. J
Fig. IV-12. Modeled ice jam failure.
72
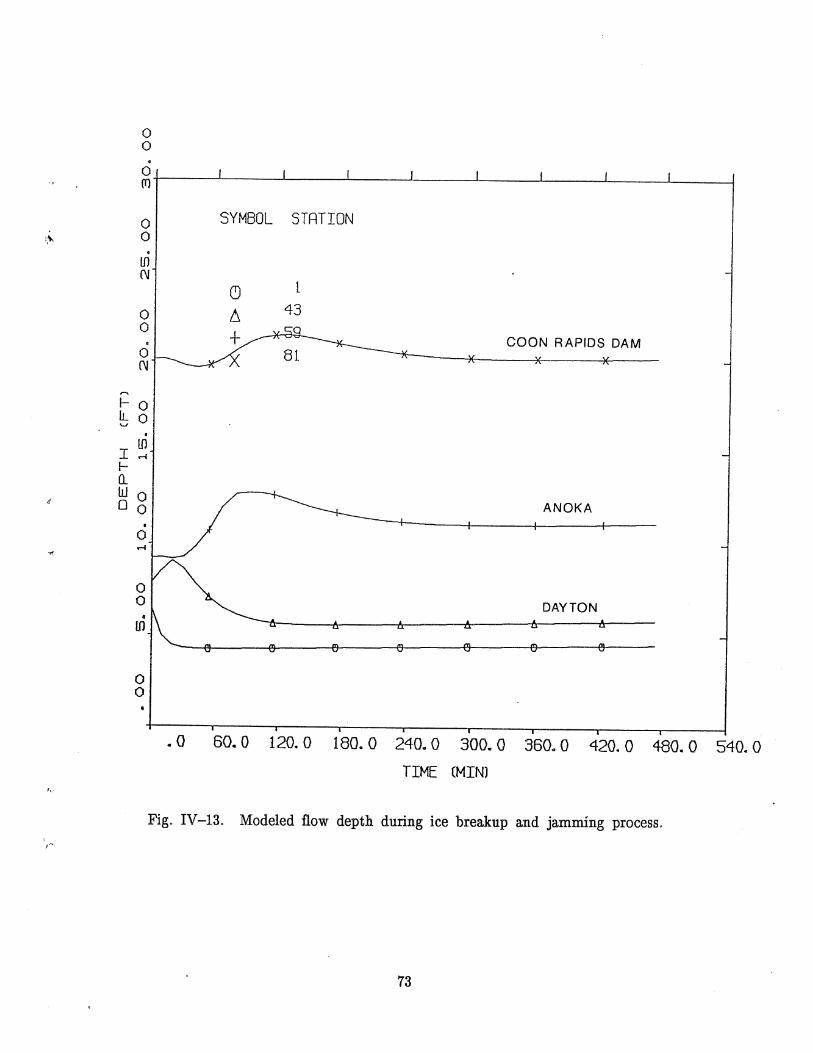
'."'-
'"
T,
0 0
· 0 (l1
0 0
· If) (\J
0 0
· 0 (\J
,... I- 0 I.L 0 '-" · I ~ l-II W 0 o 0
· 0 ..--I
0 0 •
If)
o o
SYMBOL STRTION
C) 1
6 43
+ COON RAPIDS DAM 81
ANOKA
DAYTON
.0 60.0 120.0 180.0 240.0 300.0 360.0 420.0 480.0 540.0
TIME (MIN)
Fig. IV-13. Modeled flow depth during ice breakup and jamming process.
73
V. CONCLUSIONS
lliver ice processes, including ice cover formation, breakup, and jamming, may cause the river water level to rise to a flood stage. In order to understand the ice processes and their relations to flooding, and to provide data for the mathematical modeling, a reach of the Mississippi River and its tributaries is selected as the prototype. Events of 1964-65 and 1983-84 are documented with help from many organizations and individuals. Analyses made on collected information and data show that there is a direct relation between flooding at the City of Anoka and the existence of a breakup ice jam upstream of the Coon Rapids Dam. The 1965 spring ice cover breakup and jamming was strongly associated with upstream ice jam failures, which resulted in the most severe flood on record. The 1983 winter and 1984 spring breakup and jamming resulted from upstream snow melt runoff, and less severe floods occurred. The magnitude of the 1984 ice jam could have been greater if it was not for the thermal discharge of Monticello Nuclear Power Plant that prevented the formation of ice cover and ice jams. The ice processes at this site are recommended to be managed by increasing the thermal discharge, operating the gates of the Coon Rapids Dam, and using the Anoka Dam water storage.
The ice cover fo.rmation process is mathematically simulated by a comprehensive model, in which frazil production, formation and progression of an ice cover front, growth and decay of an ice cover, and quasi-steady flow routing are considered. With adjusted thermal coefficients, ice thickness just before the breakup can be well predicted. Effect of ice cover on the water stage (flooding) is mainly determined by the ice cover thickness and roughness. The roughness of the ice cover is strongly dependent on the mechanisms of its formation, which is a subject that needs further study.
Even though a relation between water stage behind an equilibrium ice jam and flow discharge beneath it was well studied and can be applied to predict the flood level in the prototype selected, people did not know at what discharge the equilibrium ice jam would form. A mathematical model is proposed and constructed in this study to predict the ice jam formation process and the water level behind it. This model traces the movement of individual ice block from its breaking off to its accumulation or moving away under the downstream ice cover or ice jam.
For comparisons and tests, various flow conditions, including free surface flow, ice covered flow, flow during ice cover breakup, and flow during the ice jam formation, are all simulated. The results clearly show the effect of the different ice processes on flooding. In the future, the model of movement of the individual ice block needs to be refined; hopefully, exact events of the prototype can be duplicated, and the model can be used to design the ice management methods.
74
r;
REFERENCES
Anderson, D. B., And Burmeister, I. L. (1970). "Floods of March-May 1965 in the Upper Mississippi River Basin," Geological Survey Water Supply Paper 1850-A.
Asthon, G. D., (1980), "Freshwater ice growth, motion, and· decay," In Dynamics of Snow and Ice Masses (S. C. Collbeck, Ed.), Academic Press, New York, pp. 261-304.
Asthon, G. D., editor (1986). River and Lake Ice Engineering, Water Resources Publications, Colorado, pp. 216-232.
Carlson, G. H., and Guetzkow, L. C. (1980). "Flood-plain areas of the Mississippi River, mile 866.8 to mile 888.0," Water-Resources Investigation 80-972, Open-file report, U.S.G.S., St. Paul.
Barr Engineering Co. (1973). "Preliminary report on repairs and improvements to the Coon Rapids Dam," Report to the Hennepin County Park Reserve District.
Beltaos, S. (1984). "A conceptual model of river ice break up," Canadian Journal of Civil Engineering, 11, 516-529.
Beltaos, S. (1983). "River ice jams: theory, case studies and applications," J. of Hydraulic Engineering, Vol. 11, No. 10, pp. 1338-1359.
Billfalk, L. (1982). "Breakup of solid ice covers due to rapid water level variations," CRREL Report 82-3. .
Ferrick, M., Lemieux, G., Mulherin, N. and Demond, M. (1986). "Controlled river ice cover breakup, Part 2: Theory and numerical model studies," IAHR Ice Symposium, Iowa City, Iowa.
Ferrick, M. G., and Mulherin, N.D. (1989). "Framework for control of dynamic ice breakup by river regulation," Regulated Rivers: Research and Management," Vol. 3, pp. 79-92.
Goldberg, D. E. and Wylie, E. B. (1983). "Characteristics method using time-line interpolation," ASCE journal of Hydraulic Engineering, Vol. 109, No.5.
Guo, Q. and Song, C. C. S. (1989). "Surging in urban storm drainage systems," submitted to ASCE Journal Of Hydraulic Engineering.
Henderson, F. M. and Gerard, R. (1981). "Flood wave caused by ice jam formation and failure," Proceedings of IAHR International Symposium on Ice, Quebec, Canada.
75
Hirayama, K. (1986). "Growth of ice cover in steep and small rivers," Proceedings of IAHR Ice Symposium, Iowa City, Iowa, Vol 1, pp. 451-464.
Johnson, R. B. (1966). "Report on Mississippi and Rum River 1965 record high water conditions in the City of Anoka area and information for future predictions, action and community service," Anoka, Minnesota.
Matousek, V. (1984). "Regularity of the freeze-up of the water. surface and heat exchange between water body and water surface," Proceedings of IAHR Ice Symposium, Hamburg, Vol. 1 pp. 187-200.
McGinnis, R. S. (1969). "Coon Rapids Dam," Northern States Power Co.
Michel, B. (1984). "Comparison of field data with theories on ice cover progression In large rivers," Canadian Journal of Engineering, Vol. 11, pp. 798-814.
National Weather Service (1984). "Weather data for Minnesota."
Northern States Power Co. (1987). "Nuclear Power at Monticello."
Nezhikovskiy, R. A. ~1964). "Coefficients of roughness of bottom surface of slush ice cover,' Soviet Hydrology: Selected Papers, No.2, 1964, pp. 127-148.
Pariset, G. and Hausser, R. (1961). "Formation and evolution of the ice covers on River," Engineering Institute of Canada, Transactions, Vol. 5, pp. 41-49.
Pariest, E., Hausser, R., and Gagnon, A. (1966)- "Formation and evolution of ice covers and ice jams in rivers,' Journal of the Hydraulics Division, ASCE, Vol. 92, No. HY6, pp. 1-24.
Sado, K., Nakao, T. and Sakurai, H. (1988). "Growth of ice covers in reservoirs using equilibrium. surface temperature," Proceedings of IAHR Ice Symposium, Sapporo, Vol. 2, pp. 199-208.
Shen, H. T. and Chiang, L. A., (1984). "Simulation of growth and decay of river ice cover," ASCE Journal of Hydraulic Engineering, Vol. 110, No.7, pp. 958-971.
Shen, H. T., Lal, A.M. and Gunaratna, P. (1988). "A mathematical model for river ice process," Proceedings of IAHR Ice Symposium, Sapporo, Vol. 2 pp. 346.
Song, C. C. S., CardIe, J. A. and Lenny, K. S. (1983). "Transient mixed flow models for storm sewers," Journal 01 Hydraulic Engineering, ASCE, Vol. 109, No. 11.
Stefan, H., Ford, D.E., and Gulliver, J. S. (1975). "Observations of cooling water discharge effects on ice covers and dissolved oxygen levels in selected Minnesota streams and lakes," St. Anthony Falls Hydraulic Laboratory, Project Report No. 155.
76
Svensson, U., Billfalk, L. and Hammar, L., (1988). "A mathematical model of border-ice formation in rivers," Cold. Regions Science and Technology, 16 (1989) 179-189, Elsevier Science Publishers B. V., Amst.erdam.
Tatinciaux, J. C., and Gogus, M. (1981). "Stability of flows below a floating cover," IAHR Ice Symposium, Quebec, Canada.
U.S.G.S. (1965). "Water resources data, Minnesota."
U.S.G.S. {1984). "Water resources data, Minnesota, water year 1984, Vol 2: Upper Mississippi and Missouri River Basin," U.S.G.S. Water-Data Report MN-84-2.
Uzuner, M. S., (1975). "The composite roughness of ice covered streams," Journal of Hydraulic Research, Vol. 13, No.1, pp. 79-102 ..
Uzuner, M. S., and Kennedy, J. F. (1976). "Theoretical model of river ice jams," J. of the Hydraulics Division, ASCE, Vol. 102, No. HY9, pp. 1365-1383.
77

78

APPENDIX
79

80
APPENDIX A
NSP RECORDS OF RIVER ICE BREAK-UP AT COON RAPIDS DAM
The following constitutes a summary of the detailed report attached regarding the ice breakup at Coon Rapids for the spring of 1922. This will be treated in the same chronological order as the main report and reference can be made to it for details.
Break-up of the Crow river at Dayton for a distance of three miles up from its mouth at 1:00 P.M. on Saturday, March 25, was the first indication of the regular spring break-up. This movement of ice out of the Crow out a channel across the Mississippi at its mouth forming jams at and below Dayton for a distance of a quarter to a half mile in length with several feet of water in back of it, but leaving the ice in the Mississippi above the mouth of the Crow intact. This jam moved down stream, pushing the ice in the channel ahead of it, at intervals in the next forty-eight hours, passing under Champlin Bridge Monday, March 27th, and forming a jam at this point. Further movements during Monday and Tuesday brought the head of the jam to Delaittre's Lodge about two miles above the dam with a nine foot head of water in back of it.
Action of the ice this year was distinctive in that a channel was formed ahead of the jam. This channel was apparently worked out by floating pieces of ice which traveled under the jam or were broken off from the end of the jam, cutting a narrow channel in the ice ahead of the jam by action of the current in the channel behind it and the milling action of the pieces of ice cutting under the solid ice where the channel had not yet formed. Investigation showed that this action had taken place at points further up the river, as well as between the Champlin Bridge and Coon Rapids where it was noticed to the most marked degree. After this action had carried on for a certain period, the main jam would loosen and fill up the channel and the action would commence in practically the same way again.
In the meantime, all precautions were taken at the dam to take care of surges that might occur when the jam would move down river and release momentarily large quantities of water. An almost continuous system of patrols kept in touch with the conditions of the river and movements of ice. Detailed reports of these patrols are covered in the attached report.
There were three slight surges at the dam on Monday and Tuesday, but none of these were serious nor caused any difficulty. During Tuesday night and early Wednesday morning the channel kept working ahead of the jam until on Wednesday morning as soon as it was light we found a channel out through from the head of the jam to the channel cut in the field ice prior to the break-up.
81

A large triangular piece of field ice which had been lodged against the boom in front of the Power House had been gradually working its way across the open channel out in the field ice until at 6:30 A.M .. Wednesday, March 29th, it had lodged directly across the channel and wedged against the west shore. Efforts were made to blast this loose and break it up but movement of the main jam prevented completion of this work.
The main jam hit the dam at approximately 8:30 A.M. with Gates #13 to #28 inclusive and #6 Gate up wide. Gates #9, #8 and #5 were being raised and the balance #1, #2, #3, #4, #7, #10, #11 and #12 were down. Gates #7 and #8 were damaged by the pressure of the field ice and the wedging action of the large triangUlar piece of field ice which had swung across the channel and pivoted near Gates #7 and #8. #7 Gate was closed when it was broken and #8 was being raised and was about eighteen inches up when damaged. During this run the head did not raise above 836.3, or 1. 7 feet below normal.
The maximum flow of the river during this run was approximately 37,000 second feet. -
The primary break-up of the ice this year was distinctive in that the river flow was comparatively low for .. the volume of ice passed through. Very little blasting was required and the ice ran heavy for less than two hours. Ice continued to flow for the greater part of the day in light runs. the head was built up during the afternoon until at 5:00 P.M. the head was back to 838.3. Reports from observation of the river at that time indicated no trouble would occur until the ice form beyond Dayton started moving. However, during the evening heavy snow started falli~, making it impossible to see for any distance above the dam, and during this snowstorm two large cakes floated off from the west shore about a mile and a half above the Power House. This was followed by an exceptionally large piece which extended practically all the way across the channel in front of the dam. With this short warning, .it was impossible to raise the gates in time to release the pressure and permit the ice to break up and go through the dam. This large piece pushed in against Gates #7 to #12 inclusive which were all down. Gates #8, #9, #10, #11 received the bulk of the pressure. Gates #13 to #17 inclusive were open, also #2 and #3. #4 Gate was being raised. This large cake broke up to some extent before it hit the gates, but the small pieces jammed in front of the gates which were closed, and the tremendous pressure caused by the large piece in back of this jam was what damaged the gates. All the gates not damaged with the exception of Gates #25 to #28 inclusive were opened and the head was allowed to remain a little below 835. Details of damages to gates were recorded on Page 9 of the attached report.
Efforts were made during the night to obtain information by patrol as to conditions in the river above Anoka, but with the heavy snow and wind it was impossible to penetrate through the snow more than one hundred feet with a searchlight. On Thursday, March 30, river conditions as far as Monticello were investigated. Action of the ice at points above Dayton was similar to that between the Champlin Bridge and Coon Rapids. Invariably a narrow channel was worked out ahead of the jam.
82
A small ice run occurred at 4:00 P.M. Thursday. This, however, was very light and although some large pieces necessitated blasting the majority of the ice was small and passed through the dam without difficulty.
On Friday, March 31, the head was gradually raised to 83 .4 in order to float off the sheer ice during the day. Also a blasting crew was sent up the east shore of the river to Talbot's point to break up some heavy pieces of shore ice before they were floated off. A report at 2:00 P.M. from Elk River stated that the ice was running heavy. Prior to this small runs had been reported at the Champlin Bridge. At 4:00 P.M. the ice started running in small quantities at the dam. Gates were raised until they were all. wide open at 5:15 P.M. with the exception of the damaged gates. By 6:00 P.M. the ice was running very heavy and the two blasting crews on the dam proved insufficient to take care of the jams which occurred in front of the gates. Arrival of blasting crew from Talbot's point relieved the situation somewhat, but not until a jam had formed in front of the east portion of the dam. The damaged gates caused a jam which tended to spread out from both sides of this group of gates until finally the east channel completely closed. This left the channel from Gates #18 to #28 on the west shore to take care of the ice. A t times this channel was also jammed temporarily. Between 600 and 700 pounds of dynamite in two and three stick shots was used between 5:00 p.m. and 9:00 p.m. At one time the supply of dynamite was so low as 75 pounds but additional dynamite arrived in time to keep the west channel clear.
After the flow of ice had subsided somewhat, efforts were made to open the jam in front of the gates nearest the Power House, but the ice apparent~y had grounded and removal of the ice directly in front of the gates failed to open a channel more than twenty-feet back from the front of the dam. During this run which, from all reports and information we can find, is the heaviest that has occurred in the history of the river. No damage was done to the gates. The flow of water as estimated from the head and number of gates 9pen was slightly in excess of the flow during the first run on Wednesday morning, but still less than 40,000 second feet.
The ice ran heavy from 6:00 P.M. to 8:30 P.M. March 31st, and from 8:30 P.M. to 10:30 P.M. it gradually diminished but continued in a small flow until 1:00 A.M. April 1st, after which it ran moderately heavy until 3:00 A.M.
On Saturday, April 1st, efforts were made to remove the ice which had jammed in front of the dam and along the boom and east shore of the pond during the run the previous night. Considerable blasting together with raising of head was necessary before this ice could be dislodged. Apparently the ice had grounded in a great many places in front of the dam. Finally by closing the gates on the cast side of the dam, causing a draft toward the west shore, the ice lodged in front of the boom gradually started working out about 1:30 P.M. This ice, although working away almost continuously, was not all removed until 6:30 P.M. This illustrates to what an extent the ice had been jammed and to what depth it had lodged along the boom. Observation of some of these cakes indicated ice as thick as three feet and averaging easily more than twenty inches, had been passing through the dam the previous evening.
83
The Power House which had been shut down was put into operation at 4:30 P.M. and a load of 1000 KW carried on #5 Generator. By Sunday evening, April 2, conditions were considered fairly normal and a load of 6000 K.W. carried on the station.
84
,.
A.
March 28, 1945
Mr. A.G. Keely, Mr. J .A. Colvin, Manager of Power Production and System Operation, NSP
Construction Department Activities Spring Break-up Coon Rapids-1945
Dear Mr. Colvin:
The following is a summary of the work which the Construction Department took care of incidental to the removal of the Coon Rapids pond ice and in connection with the spring break-up in the river above the dam.
March 14th to 16th inclusive During this period, Mr. Heggen with a crew of 15 men cut and sluiced the pond ice. The ice this year averaged about 2' in thickness and due to the extremely warm weather we had considerable difficulty the last two days operating the power driven saw, on account of the slush which covered the ice to a depth of about 4".
Two improvements were made in the equipment, which resulted in speeding up the work of removing the pond ice.,
1. A cooling water pump was installed on the power driven ice saw which prevented the engine from over-heating as it had always done in the past.
2. An ice auger, driven by a gasoline powered ground rod driving machine which we own was used to drill 6" diameter holes for the dynamiting.
One change in the cutting procedure proved to be very beneficial during the sluicing operations. The first hand saw cut was made along the east side of the slot and this provided a smooth surface for the dynamited ice on the west side of the slot to work against and prevented it from hanging up as it had done in previous years. It was not necessary to dislodge a single piece of ice with pike poles during the entire sluicing period.
At 7 P.M. on March 16th the watch at the Anoka Bridge and the patrol of the river between there and Dayton was started.
85
Mr. J. A. Colvin:
Construction Department Activities Spring Break-up Coon Rapids 1945
March 17th Saturday
March 28, 1945
9 men were employed on miscellaneous preparatory work around the dam. The 24 hour watch at Anoka and above was continued. At approximately 5:30 P.M. the ice pushed out of the Crow River at Dayton into the Mississippi and lodged about one mile below Dayton. Movement of the ice between Anoka and the dam was observed throughout Saturday night.
March 18th Sunday The crew at the dam and on the river was continued. Around 9 A.M. the ice between Anoka and the dam broke thru the arch above the pond and was sluiced thru without damage. At approximately 11 A.M. the ice in the river between Anoka and a mile this side of Dayton reached the dam and continued to run until 2 P.M. This flow was extremely heavy and considerable dynamiting was required to keep the gates at the dam clear, but no damage was incurred.
March 19th Monday The crew on the dam and the river patrol was continued. At about 6:15 A.M. the large section of ice which remained along the west side of the bay, immediately above the dam, after the ice had been sluiced, broke away and due to poor visibility was not observed until it was too close to open additional gates. At this time all gat'es from No. 19 to the west bank, inclusive, were opened. this large section of ice swung out into the stream and the extreme east end of it caught gates #16 and #17 which were closed at the time. The gates were so badly damaged that they will have to be replaced and this work is now under-way under a separate authorization.
March 20th All crews continued on the job but very little ice passed the dam. A heavy ice jam had started about 4 miles this side of Monticello Sunday afternoon and it was continuing to pile up on this date.
March 21st Wednesday The crews were continued on the dam and on the river patrol. Early in the morning the ice jam below Monticello started to move with a considerable head of water behind it. Around 10:30 A.M. the first ice reached the dam and it was necessary to open 22 gates to handle the river flow.
86
March 22nd to 24th inclusive A crew of 10 men in 2-12 hour shifts continued work at the dam and on the trash racks. The river patrol was discontinued Frida.y evening. The timber boom across the intake to the power plant had been dislodged by the ice and this was replaced and repaired. All work was discontinued by our department at the end of the day on Saturday, March 24th.
87
April 15, 1948
Mr. A. G. Keely
Mr. J.A. Colvin, Manager of Power Production, and System Operation
Construction Department Activities Spring Breakup Coon Rapids-1948
Dear Mr. Colvin:
The following is a summary of the work which the Construction Department took care of incidental to the removal of the Coon Rapids pond ice and in connection with the spring break-up in the river above the dam.
March 18th A contract for the sawing of the pond ice was given on an equipment and operator basis to the Certified Ice and Fuel Company of St. Paul. A foreman and 8-man crew hauled the equipment, consisting of a compressor, two jack hammers and other miscellaneous tools to the dam. Work was started on laying out the line for the initial wedge cut. The sawing equipment arrived on the site in the afternoon and by the end of the day the sawing operations were well underway. The ice was found to be 28 to 30" thick covered with 4 to 6" of soft snow and slush. The snow and slush on the ice made operation of the field saws rather difficult as the traction features of the saw did not work and necessitated the use of manpower for locomotion.
March 19th On the previous day, it was found that the movement of the. compressors for drilling dynamite holes in the ice was too laborious to be done by hand, so a truck and jeep were added to the equipment, which were used to move the compressors. The crew was increased to 16 men plus the saw operator and a second compressor and two more jack hammers were used. Blasting operations were started and by evening the initial wedge cut had been flumed thru the dam and the cutting operations and the drilling of blasting holes were progressing rapidly.
March 20th A 16-man crew continued fluming operations and blasting and by evening all of the sawing necessary for the removal of the pond ice was completed. Approximately 60% of the pond ice had been blasted and flumed thru the dam. Patrol of the river from· Anoka up to the Crow lliver was started at 7 A.M. on this date. Two men were assigned to this phase of the operation with headquarters in Anoka and a 24-hour patrol was maintained. March 21st
88
1\.
Ii
March 21st The crew was cut to 14 men and the blasting and fluming of the pond ice was continued. No movement in the river above the dam was reported by the patrol.
89
Mr. J. A. Colvin:
Spring Break-up Coon Rapids-1948
March 22
April 15, 1948
The crew was again cut to 12 men, who completed removal of the pond ice and the assembling of the equipment. No movement of the river ice was reported on this date.
March 23, 24, and 25 The patrol reported no indications of ice movement in the river until 2:20 P.M. March 25th, at which time the Crow River broke up, causing an ice jam in the vicinity of the mouth of the Crow River at Dayton. Movement of the river ice was first noted on this date at 4 P.M., at which time a crack in the ice across the river and open water was noted in the river near the WCCO tower. At 8:30 P.M. on this date, the ice moved at the Anoka Bridge and a jam was forming in the vicinity of the WCCO tower.
March 26 At 1:55 A.M. the flow of ice was reported at the Anoka bridge. The report indicated that major movement of the ice was imminent above the dam and a watch was placed on the bridge, consisting of a foreman and three men; the foreman and two men being located on the dam one man watching the river a.t a point above the dam. A 24-hour watch was maintained with crews on 8-hour shifts. At 1 P.M. the river ice as far upstream as Dayton broke up and a heavy run of ice was started. This run lasted for 1 1/2 hours during which time it was necessary to open all of the gates in order to take care of the flowage.
March 27 The river patrol continued on 24-hour basis. No additional movement of the ice was reported; however a small quantity of ice continued to flow at the dam. From this date to completion of the ice run, from 6 to 9 gates were open.
March 28 A jam had previously developed at Haley's Rapids which broke and considerable ice passed thru the dam, starting at 2:35 P.M. The heaviest part of the run wa.s over by 3 P.M.
March 29 Another heavy run started at 6:35 P.M. and lasted until 8:45. In order to clear this ice and pass it thru the gates, it was necessary to resort to considerable blasting. A light run of ice continued thru most of the night.
90
1\
,(
· March 30 A flow of ice started again at 9:15 A.M. and lasted until 10:30.
March 31 A 24-hour watch was continued but no activities were reported.
April 1st At 4:45 P.M. a heavy flow of ice started and lasted for 2 1/2 hours, after which a relatively light flow continued for several hours.
91
April I1j 1952
Mr. A. G. Keely
Mr. J.A. Colvin, Manager of Power Production and System Operation
Construction Department Activities Spring Break-up, Coon Rapids Dam 1952
Dear Mr. Colvin:
The following is a log of the activities of the Construction Department in connection with the annual ice removal work at Coon Rapids Dam, W.O. #9-44723:
March 3 through March 7 During this period a 2-man crew under H. Buckley prepared 650 lbs. of dynamite charges and began to stake out and plow the pond.
March 10 through 13 Crew completed staking, plowing, and sawing the pond. The crew was increased to 8 men on March 10th.
March 14 A crew of 6 men opened 200 yards of the slot and finished saving the pond.
March 23 Finished opening slot. Crew increased to 17 men.
March 18 through March 21 During this period a 20-man crew dynamited and sluiced all pond ice.
March 23 through April 4 During this period a 4-man crew cleared snow and ice away from all gates. On April 1, three 8-hour, a-man shifts were placed on duty at Coon Rapids Dam.
March 10 through March 25 Intermittent trips were made during this period to inspect the river upstream from Coon Rapids for evidence of ice movements.
March 26 A I-man, 12-hour, patrol was begun covering the river from Anoka Bridge upstream to Elk River. This patrol reported the river open along the east bank from Elk River downstream to Goodin Island just below the town of Dayton. Gauge reading at Anoka Bridge was 833.5.
92
t' "
March 27 through April 6 During this period the patrol reported ice movements that formed jams at Haley's Rapids, Telephone Crossing, and King's Island. The ice from Mississippi Beach to 100-yards below the Anoka Bridge was also' broken into huge slabs. On March 30 a night man was added to this patrol.
93