Embed Size (px)
Citation preview

t
RIVER LODDON/BASINGSTOKE STW SIMCAT MODELLING: FINAL REPORT
WRc Ref: UC 3330 September 1999
E A -TH AM ES
I ox 3
ENVIRONMENT AGENCY - THAMES REGION

E n v ir o n m e n t Ag e n c y
NATIONAL LIBRARY & INFORMATION SERVICE
T H A M E S R E G IO N
Kings Meadow House. Kings Meadow Road. Reading RG1 8DQ

RIVER LODDON / BASINGSTOKE STW SIMCAT MODELLING: FINAL REPORT
Report No.: UC 3330
September 1999
Author: Bob Crabtree
Contract Manager: Bob Crabtree
Contract No.: 11659-0
RESTRICTION: This report has the following limited distribution:
Environment Agency - Thames Region
Thames Water Utilities Limited
WRc - Authors

Any enquiries relating to this report should be referred to the authors at the following address:
WRc Swindon, Frankland Road, Blagrove, Swindon, Wiltshire, SN5 8YF.Telephone: (01793) 511711

The contents of this document are subject to copyright and all rights are reserved. No part of this document may be reproduced, stored in a retrieval system or transmitted, in any form or by any means electronic, mechanical, photocopying, recording or otherwise, without the prior written consent of the copyright owner.
This document has been produced by WRc pic.
ENVIRONMENT AGENCY THAMES REGION
CONTENTS
SUMMARY 4
1. INTRODUCTION 5
1.1 Background 51.2 Study Objectives 61.3 River Quality targets and Modelling Scenarios 71.4 Report Structure and Contents 9
2. OVERVIEW OF SIMCAT MODELLING APPROACH 11
2.1 SIMCAT 112.2 Modelling Approach 132.3 Data Analysis 15
3. MODEL CONCEPTUALISATION AND BUILDING 23
3.1 River reaches 233.2 Flow gauges 233.3 Tributary inputs 243.4 Water quality monitoring sites 243.5 STWs 253.6 Model schematic 26
4. MODEL CALIBRATION 27
4.1 Flow calibration 274.2 Quality calibration 29
5. MODELLING SCENARIO RESULTS 39
5.1 ‘Current’ compliance with river quality targets. 395.2 Compliance with STWs operating at current consents 425.3 Future scenarios 44
6. CONCLUSIONS 47
APPENDICES
APPENDIX A MODEL RESULTS 49APPENDIX B SIMCAT MODEL DATAFILE 55APPENDIX C AMMONIA CONCENTRATIONS IN BASINGSTOKE FINAL
EFFLUENT 62

ENVIRONMENT AGENCY THAMES REGION
LIST OF TABLES
Table 1.1 River Quality Targets 9Table 2.1 River flow statistics (Ml/d) 15Table 2.2 River quality data outliers 17Table 2.3 Water quality summary statistics 18Table 2.4 STW quality data outliers 21Table 2.5 STW effluent flow and quality summary statistics 22Table 3.1 River Reaches 23Table 3.2 Flow gauge location 23Table 3.3 Tributary input location 24Table 3.4 Water quality monitoring site location 24Table 3.5 STW location 25Table 4.1 Initial model results, prior to manual calibration 27Table 4.2 Manual calibration flow results 28Table 4.3 Decay rates 30Table 4.4 SIMCAT Load Summary for current situation 37Table 5.1 River Quality Targets 40Table 5.2 Assessment for current situation 42Table 5.3 Current consent and actual STW flow 43Table 5.4 Current consent and actual STW quality 43Table 5.5 River quality assessment for current consents 44Table 5.6 Increased effluent flow scenarios 45Table 5.7 Flow transfer results 46Table 5.8 Sherfield consent for future scenarios 46
LIST OF FIGURES
Figure 1.1 River Loddon Catchment: Location of SIMCAT Model Features 6Figure 2.1 Study methodology 13Figure 2.2 Application of PSl methodology 14Figure 3.1 SIMCAT Model Schematic 26Figure 4.1 Flow calibration 29Figure 4.2 Chloride manual calibration (decay rate = 0/d.) 30Figure 4.3 BOD manual calibration (decay rate = 5/d.) 31Figure 4.4 Ammonia manual calibration (decay rate = 10/d.) 32Figure 4.5 Dissolved oxygen manual calibration (rearation rate = 10/d.) 33Figure 4.6 Chloride calibration 34

ENVIRONMENT AGENCY THAMES REGION
Figure 4.7 BOD calibration 35Figure 4.8 Ammonia calibration 36Figure 4.9 Dissolved Oxygen calibration 37

Environment Agency - Thames Region
SUMMARY
The Environment Agency has agreed to co-operate with Thames W ater Utilities Limited (TWUL) to carry out detailed, auditable modelling studies of the effects of increases in flows from Basingstoke STW on the effluent receiving watercourses. The main question that the modelling has to answer is “What are the standards required at the STW to meet the river standards required by the Agency with the proposed increase in flow?”. The Agency operates a load standstill and no deterioration policy, interpreted as meaning that the quality in the river downstream that would be delivered by the current consent must be maintained after the population increases.
WRc carried out this study by building, calibrating and applying a SIMCAT model to the River Loddon and key tributaries. The study outcome can be summarised as follows:
1. Under current operation, RE2 standards are achieved in the Loddon. Bow Brook / Vyne Stream fails to meet RE3. Salmonid standards are met on the Loddon except for DO.
2. Under current consents for flow and quality, RE2, Salmonid and operational standards will not be achieved downstream of Basingstoke STW. Bow Brook fails to achieve RE3. The Loddon downstream of Bow Brook will achieve RE2 and Salmonid standards.
3. A revised consent for Sherfield STW, based on the current actual flow, has been calculated to achieve the same downstream impact as the current consent.
4. Three future population scenarios have been represented for 2001, 2006 and 2011. Considerable population growth and increase in effluent is predicted over this period. The modelling study has shown that planned river quality can be maintained if consents are tightened (to the highest proposed standard) and flows are transferred from Basingstoke to Sherborne and Sherfield. The rivers cannot sustain further effluent inputs beyond the 2011 discharge estimates without better effluent quality consents.
5. A Total Ammonia consent of less than 1.0 (as a 95 %ile) is required to meet river quality objectives on the Loddon if future flows are routed through Basingstoke (rather than transferred to Sherborne and Sherfield)
WRc Ref: UC 3330/11659-0September 1999
4
Environment Agency - Thames Region
1. INTRODUCTION
1.1 Background
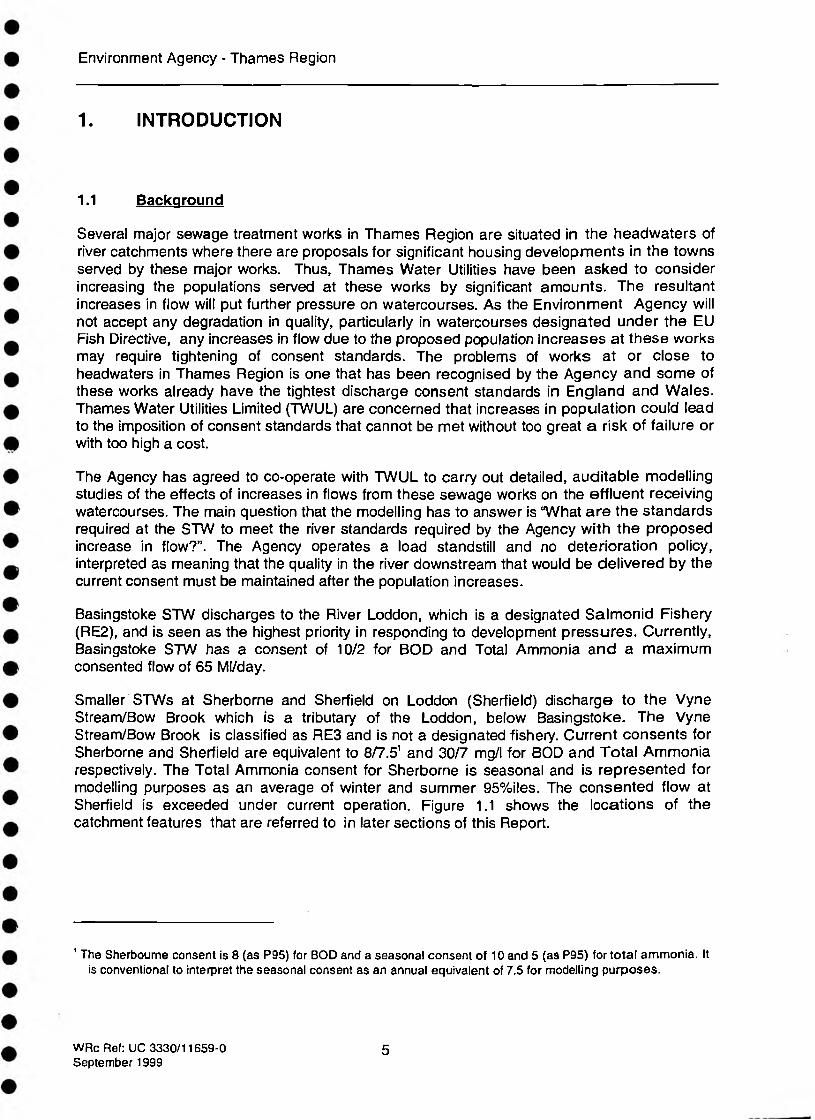
Several major sewage treatment works in Thames Region are situated in the headwaters of river catchments where there are proposals for significant housing developments in the towns served by these major works. Thus, Thames Water Utilities have been asked to consider increasing the populations served at these works by significant amounts. The resultant increases in flow will put further pressure on watercourses. As the Environment Agency will not accept any degradation in quality, particularly in watercourses designated under the EU Fish Directive, any increases in flow due to the proposed population increases at these works may require tightening of consent standards. The problems of works at or close to headwaters in Thames Region is one that has been recognised by the Agency and some of these works already have the tightest discharge consent standards in England and Wales. Thames Water Utilities Limited (TWUL) are concerned that increases in population could lead to the imposition of consent standards that cannot be met without too great a risk of failure or with too high a cost.
The Agency has agreed to co-operate with TWUL to carry out detailed, auditable modelling studies of the effects of increases in flows from these sewage works on the effluent receiving watercourses. The main question that the modelling has to answer is “What are the standards required at the STW to meet the river standards required by the Agency with the proposed increase in flow?”. The Agency operates a load standstill and no deterioration policy, interpreted as meaning that the quality in the river downstream that would be delivered by the current consent must be maintained after the population increases.
Basingstoke STW discharges to the River Loddon, which is a designated Salmonid Fishery (RE2), and is seen as the highest priority in responding to development pressures. Currently, Basingstoke STW has a consent of 10/2 for BOD and Total Ammonia and a maximum consented flow of 65 Ml/day.
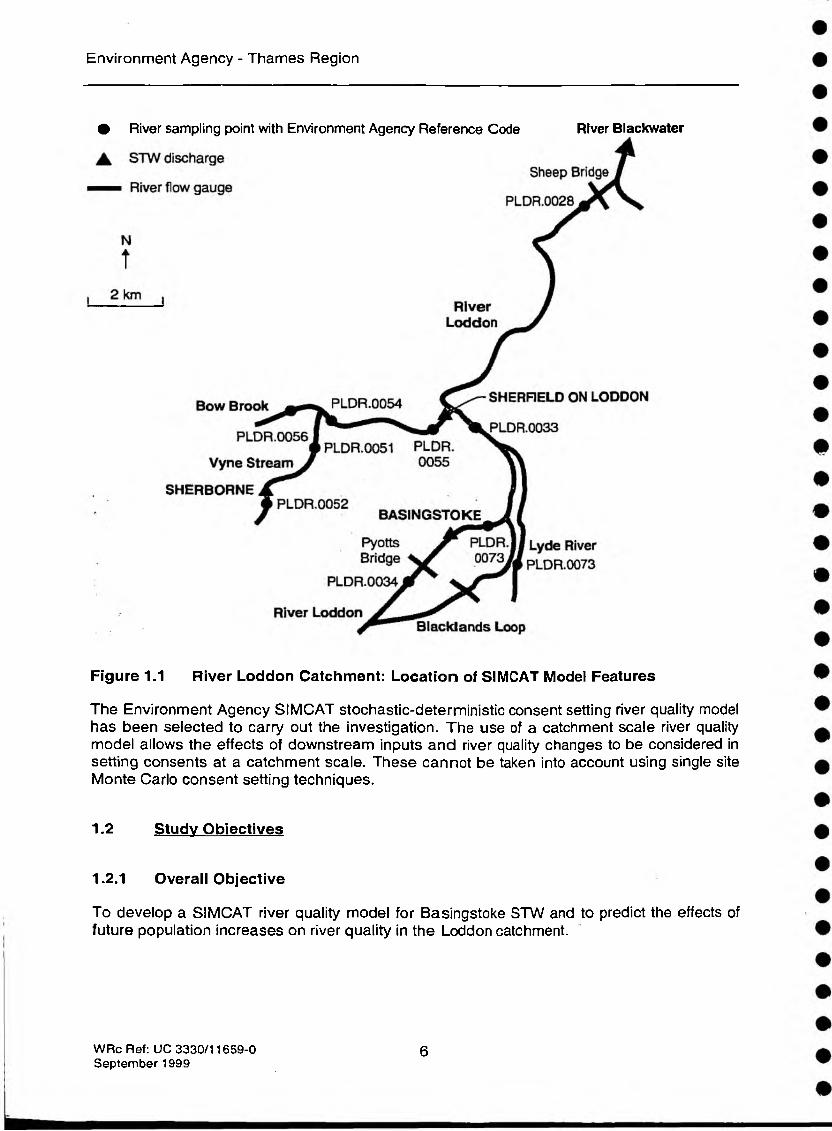
Smaller STWs at Sherborne and Sherfield on Loddon (Sherfield) discharge to the Vyne Stream/Bow Brook which is a tributary of the Loddon, below Basingstoke. The Vyne Stream/Bow Brook is classified as RE3 and is not a designated fishery. Current consents for Sherborne and Sherfield are equivalent to 8/7.51 and 30/7 mg/l for BOD and Total Ammonia respectively. The Total Ammonia consent for Sherborne is seasonal and is represented for modelling purposes as an average of winter and summer 95%iles. The consented flow at Sherfield is exceeded under current operation. Figure 1.1 shows the locations of the catchment features that are referred to in later sections of this Report.
‘ The Sherbourne consent is 8 (as P95) for BOD and a seasonal consent of 10 and 5 (as P95) for total ammonia. It is conventional to interpret the seasonal consent as an annual equivalent of 7.5 for modelling purposes.
WRc Ref: UC 3330/11659-0September 1999
5
Environment Agency - Thames Region
• River sampling point with Environment Agency Reference Code River Blackwater
Figure 1.1 River Loddon Catchment: Location of SIMCAT Model Features
The Environment Agency SIMCAT stochastic-deterministic consent setting river quality model has been selected to carry out the investigation. The use of a catchment scale river quality model allows the effects of downstream inputs and river quality changes to be considered in setting consents at a catchment scale. These cannot be taken into account using single site Monte Carlo consent setting techniques.
1.2 Study Objectives
1.2.1 Overall Objective
To develop a SIMCAT river quality model for Basingstoke STW and to predict the effects of future population increases on river quality in the Loddon catchment.
WRc Ref: UC 3330/11659-0September 1999
6

Environment Agency - Thames Region
1.2.2 Specific Objectives
i) To collate water quality, flow and catchment data provided by the Agency and TWUL
ii) To screen and assess the quality of the data using standard statistical techniques to remove outliers from the data sets and to choose the most suitable data periods to provide inputs to the model.
iii) To build and calibrate the SIMCAT model for the parameters - DO, BOD, Total Ammonia (Ammonia) and Chloride.
iv) To undertake specified “what if scenarios”.
v) To produce a report detailing the results from SIMCAT modelling work.
1.2.3 Modelling Requirements
Un-ionised Ammonia will not be modelled directly as a SIMCAT parameter. Model predictions for Total Ammonia will be converted to Un-ionised Ammonia using the Environment Agency ‘Ammonia’ conversion programme with inputs of site specific pH and temperature distributions.
Flow calibration will be established from gauged river flow data in the catchment, and Micro Low Flows estimates for ungauged catchments and naturalised flows at key locations. These estimates can be “corrected" with gauged data further downstream. Where possible, Chloride, modelled as a conservative determinand, will be used to support the flow calibration
The model will start upstream of Basingstoke STW at Pyotts Bridge and will include Sherborne STW and Sherfield STW. It will continue to Kings Bridge on the Loddon which is just upstream of the Blackwater confluence. The model will include the Lyde River as a tributary. Other inputs will be represented as diffuse inputs to give a manual calibration of flow and quality prior to auto-calibration.
1.3 River Quality targets and Modelling Scenarios
The study requires a series of SIMCAT simulations to represent variations on the current pattern of consents and flows, plus predicting the effects of future scenarios incorporating increased flows to represent proposed population growth. The basic output from the scenarios is the prediction of river quality against specified targets and associated discharge consents for the STWs.
1.3.1 River Quality Classification
The study requires demonstration of compliance against RE, EU Fishery and ‘operational’ river quality targets, as specified below. Compliance must be assessed at the boundaries and within (at the control sampling point) each classified reach.
WRc Ref: UC 3330/11659-0September 1999
7

Environment Agency - Thames Region
RE classified reaches
Reach boundaries and control sampling points are:
LODDON
Source to upstream Basingstoke STW - sampling point pldr.0034 RE2
Downstream Basingstoke STW to confluence with Lyde ( NGR 692576) - sampling RE2 point pldr.0073
Confluence with Lyde to Stanford End Bridge (NGR701628) - sampling point RE2pldr.0033 (above Bow conf.)
Stanford End Bridge to confluence with Blackwater - sampling point pldr.0028 RE2
VYNE STREAM
Sherborne St John to Bow Brook - sampling point (pldr.0051) RE3
BOW BROOK
Confluence with Vyne Stream to confluence with Loddon - sampling point RE3(pldr.0055)
Fisheries Directive
The Loddon downstream of Basingstoke STW is a designated Salmonid Fishery
Fisheries ‘operational’ standard
On the Loddon at pldr.0033 (upstream of Bow Brook confluence).
1.3.2 RIVER QUALITY TARGETS
The numerical river quality targets in Table 1.1 were used for compliance assessment for classified reaches.
WRc Ref: UC 3330/11659-0September 1999
8
Environment Agency - Thames Region
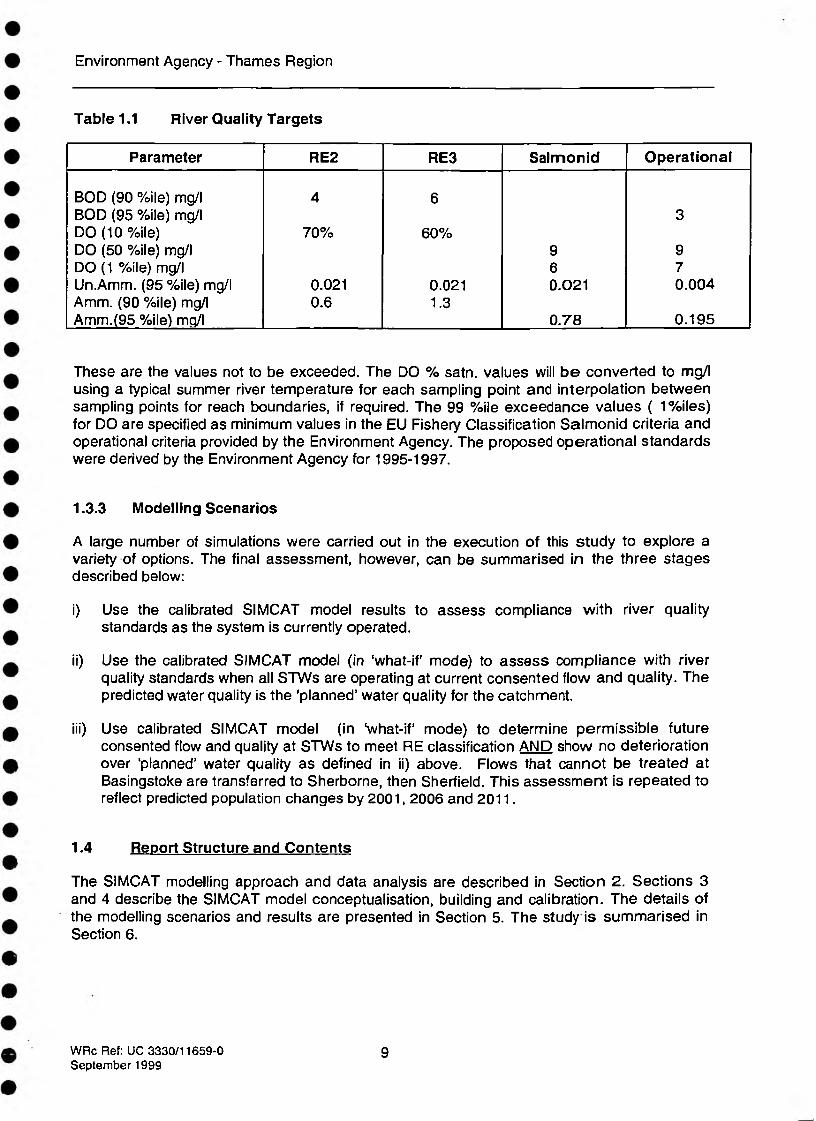
Table 1.1 River Quality Targets
Parameter RE2 RE3 Salmonid Operational
BOD (90 %ile) mg/l 4 6BOD (95 %ile) mg/l 3DO (10 %ile) 70% 60%DO (50 %ile) mg/l 9 9DO (1 %ile) mg/l 6 7Un.Amm. (95 %ile) mg/l 0.021 0.021 0.021 0.004Amm. (90 %ile) mg/l 0.6 1.3Amm.(95 %ile) mg/l 0.78 0.195
These are the values not to be exceeded. The DO % satn. values will be converted to mg/l using a typical summer river temperature for each sampling point and interpolation between sampling points for reach boundaries, if required. The 99 %ile exceedance values ( 1 %iles) for DO are specified as minimum values in the EU Fishery Classification Salmonid criteria and operational criteria provided by the Environment Agency. The proposed operational standards were derived by the Environment Agency for 1995-1997.
1.3.3 Modelling Scenarios
A large number of simulations were carried out in the execution of this study to explore a variety of options. The final assessment, however, can be summarised in the three stages described below:
i) Use the calibrated SIMCAT model results to assess compliance with river quality standards as the system is currently operated.
ii) Use the calibrated SIMCAT model (in ‘what-if’ mode) to assess compliance with river quality standards when all STWs are operating at current consented flow and quality. The predicted water quality is the ‘planned’ water quality for the catchment.
iii) Use calibrated SIMCAT model (in “what-if mode) to determine permissible future consented flow and quality at STWs to meet RE classification AND show no deterioration over ‘planned’ water quality as defined in ii) above. Flows that cannot be treated at Basingstoke are transferred to Sherborne, then Sherfield. This assessment is repeated to reflect predicted population changes by 2001, 2006 and 2011.
1.4 Report Structure and Contents
The SIMCAT modelling approach and data analysis are described in Section 2. Sections 3 and 4 describe the SIMCAT model conceptualisation, building and calibration. The details of the modelling scenarios and results are presented in Section 5. The study is summarised in Section 6.
WRc Ref: UC 3330/11659-0September 1999
9

Environment Agency - Thames Region
WRc Ref: UC 3330/11659-0 10September 1999

Environment Agency - Thames Region
2. OVERVIEW OF SIMCAT MODELLING APPROACH
2.1 SIMCAT
SIMCAT is a mathematical model which describes the quality of river water throughout a catchment. It is used to help to identify the effluent discharge consents (expressed as 95 %iles) required to meet river water quality targets. This is achieved by predicting the behaviour of the summary statistics of river and effluent quality, such as the mean and 90 or 95 percentile. Hence, the model recognises the fact that predictions must be defined as statistics in order to allow a correct assessment of compliance with quality objectives, while also recognising the variability of river and effluent flow and quality.
SIMCAT has special features, such as auto-calibration, which enables it to produce reliable results quickly. It also controls the effect of the statistical uncertainties associated with water quality data on decision making. SIMCAT has been widely used in the UK over a number of years and is recognised as being a cost-effective, practical water quality management tool to support catchment management and discharge control decision making on a routine basis.
The advantages of the SIMCAT approach are:
i) proven Environment Agency software:
ii) is readily applied at a catchment scale;
iii) makes best use of existing available, but often limited, data; and,
iv) allows rapid assessment of management options.
SIMCAT offers a significant insight into catchment behaviour based on the use of existing data from routine monitoring of river and effluent quality for continuous discharges. SIMCAT is designed to minimise the recognised limitations of these data and produce results with identified confidence levels for comparison against water quality standards and planning criteria. SIMCAT also produces pollutant source load results, in addition to predicted river concentrations.
Inputs to SIMCAT can be defined as:
• point source inputs, such as river headwaters, tributaries, and STW discharges;
• diffuse inputs;
• abstractions; and
• unknown inputs.
Each type of input is represented by summary statistics, based on available data for the period represented by the model; for example, the mean and the standard deviation. Inputs are represented as selected probability distributions; for example, Normal or Lognormal
WRc Ref: UC 3330/11659-0September 1999
11

Environment Agency - Thames Region
distributions, based on the results of distribution fitting to the original data. Unknown inputs (or losses) are calculated by the model during auto-calibration to represent the difference between the input data from all sources, known abstractions, self-purification and the measured flows and pollutant loads at points in the catchment.
SIMCAT represents self-purification in the river (the loss of a pollutant; decay of BOD) by an exponential decay function of the form:
C = Coe‘kt
where Co is the initial concentration (t=0) and k is a temperature dependent rate constant. Modelling of dissolved oxygen (DO) includes the effects of surface aeration on losses due to the decay of BOD. At a discharge (input) point SIMCAT uses a Monte-Carlo simulation approach to mix the flow and quality distributions of the discharge with the upstream river flow and quality distributions. This produces downstream flow and quality distributions which are routed down the model applying a decay to pollutant concentrations, as appropriate.
Further details of SIMCAT are provided in “SIMCAT 6.0 - A GUIDE FOR USERS, October 1998” which is available from the Environment Agency.
WRc Ref: UC 3330/11659-0September 1999
12

Environment Agency - Thames Region
2.2 Modelling Approach
The approach adopted for the application of SIMCAT to the River Loddon covers five stages, as illustrated in Figure 2.1, which indicates the output from each stage.
...............sr...................Output
Project Report
Figure 2.1 Study methodology
Previous SIMCAT modelling work undertaken by WRc has resulted in the development of a procedure called Pre SIMCAT Investigation (PSI). This procedure is based around a suite of software tools which form the standard data analysis protocol developed by WRc for the Environment Agency. PSI is operated in accordance with WRc’s quality assurance procedures and the Environment Agency’s Codes of Practice for Data Analysis.
WRc Ref: UC 3330/11659-0September 1999
13

Environment Agency - Thames Region
Figure 2.2 shows how the PSI methodology is applied. The LAPWING element, the spatial analysis of water quality trends, most commonly used as an initial screening tool for large catchments has been omitted.
Figure 2.2 Application of PSI methodology
Detailed analysis of river and discharge quality data is performed using WRc’s AARDVARK software. A number of automatic AARDVARK analyses are carried out using the PSI tools to perform statistical tests on all the data sets in rapid succession. The first of these is the
t Multiple Outlier Test (MOT) which automatically detects and flags statistical outliers. If appropriate, agreed outliers will be removed from the data sets. The second tool is Steps Automatically Detected (SAD) which uses cumulative sum (cusum) methods to identify sudden changes in the distribution of the data to allow consistent data to be used to generate input for SIMCAT. By following this approach, there is greater confidence in the final summary statistics generated by TOAD (Testing Of Assorted Distributions) which outputs the mean, standard deviation and distribution type (normal;, log normal or shifted log normal) for each determinand. Flow data are analysed in a similar way.
The results from PSI are stored in a database for ease of reporting and input to the SIMCAT model. PSI is described further in Section 2.3.
WRc Ref: UC 3330/11659-0September 1999
14

Environment Agency - Thames Region
2.3 Data Analysis
2.3.1 River Flow Data
Observed flow data were available from two gauges on the Loddon:
i) at Pyotts Bridge (upstream of Basingstoke STW); and
ii) at Sheep Bridge (close to the end of the modelled catchment).
Another gauge located at Pyotts Bridge measures flows of a tributary of the Loddon, the Blacklands Loop which joins the Loddon 1.4km downstream of Basingstoke STW, as shown in Figure 1.1.
Table 2.1 shows flow statistics for the period 1995 to 1998 for these three gauges. The Table also shows Micro-Low-Flow estimates for headwaters, tributaries and subcatchments.
Table 2.1 River flow statistics (Ml/d)
Name Mean 95%ile low flo w Shift
Pyotts Bridge Gauge (95-98) (Loddon) 37.30 17.7 6.7Sheep Bridge Gauge (95-98) 183.00 85.30 76.6Pyotts Bridge Gauge (95-98) (Blacklands Loop) 55.60 30.70 23.0
Head of Loddon (Pyotts Bridge) estimate 37.10 13.00 0Lyde tributary estimate 23.95 6.38 0Head of Vyne Stream estimate 3.68 1.27 0Vyne Stream subcatchment estimate 10.72 1.89 0Bow Brook tributary estimate 18.51 2.84 0Bow Brook subcatchment estimate 34.37 4.64 0
2.3.2 River Quality Data
Summary statistics were calculated using routinely monitored data collected across the catchment from 1989 to 1998. A full Pre SIMCAT Investigation (PSI) .excluding LAPWING, was carried out for Chloride, BOD, Total Ammonia, Dissolved Oxygen, pH and Temperature.
The data were influenced by a large number of ‘less than’ values. This was complicated by changes in the limit of detection for Total Ammonia and BOD. A standard protocol was adopted whereby less than values were taken as 0.5L, where L is the limit of detection.
Standard methods were applied to screen for statistical outliers (Test Data Facility MOT program) and step changes (Test Data Facility SAD program). Summary statistics were
WRc Ref: UC 3330/11659-0September 1999
15

Environment Agency - Thames Region
calculated using the Test Data Facility TOAD program. TOAD produces all the input statistics required for SIMCAT.
Screening for statistical outliers
The presence of statistical outliers in a dataset can affect the summary statistics to such an extent that they no longer adequately describe the ‘average* value and variability of values for that determinand. Table 2.2 lists outliers detected using the Test Data Facility MOT program that have t statistic greater than 4 or less than -4. All these data observations were excluded from further analysis.
Screening for step changes
Step changes occur in water quality data following the opening (or closure) of STW plant or changes in treatment technology. For SIMCAT models it is important to exclude older data from summary statistics when they are not representative o f current operating conditions. The Test Data Facility SAD program performs an automatic cusum analysis that identifies statistically significant step changes.
Unfortunately, step changes also occur when changes in the limit of detection for parameters occur. In the Loddon catchment, this effect was highly evident. Limits of detection for Total Ammonia and BOD were reduced at the beginning of 1995 at many sites along the Loddon.
Generating summary statistics
In consultation with the Agency, it was agreed to restrict summary statistic generation to the period 1995 to 1998. Where this period yielded too few data {or the only data available were from outside this period) summary statistics were calculated from all available data.
Table 2.3 contains the summary statistics calculated using the Test Data Facility TOAD program. The Table lists each monitoring station and gives the site name, Agency code and an abbreviated code used by WRc for this study. At each monitoring station statistics are reported for Chloride, BOD, Ammonia, Dissolved Oxygen, Temperature and pH. Distribution shape identifies whether the data are Normal (1), logNormal (2) of shifted logNormal (3). If the distribution shape is 3, a shift value is also given. The mean and standard deviation are reported together with the number of values (n) and the date range. The determinands Chloride, BOD, Ammonia and Dissolved Oxygen are reported in mg/l. Temperature is reported in degrees centigrade.
The restricted date range and small number of values should be noted at PLDR0056 (Bow Brook above Vyne Stream) and PLDR0054 (Bow Brook at Locks Bridge)
WRc Ref: UC 3330/11659-0Septomber 1999
16

Environment Agency - Thames Region
Table 2.2 River quality data outliers
Site Determinand Date OutlierValue
Type Median n t-stat Out:Medratio
Loddon at Pyotts Bridge, Basing (B1) Log_Chloride 27/3/1996 54.00 high 25 145 5.6 2.2Loddon at Pyotts Bridge, Basing (B1) Log_Chloride 27/3/1996 58.00 high 25 145 6.1 2.3Loddon at Pyotts Bridge, Basing (B1) Log_Chloride 27/3/1996 60.01 high 25 145 6.4 2.4Loddon at Pyotts Bridge, Basing (B1) Log_Chloride 15/11/1991 68.99 high 25 145 7.4 2.8Loddon at Pyotts Bridge, Basing (B1) Log_Ammonia 28/2/1995 0.50 high 0.08 149 4.2 6.3Loddon at Pyotts Bridge, Basing (B1) Log_Ammonia 27/8/1998 9.00 high 0.08 149 10.7 112.5Loddon at Keepers Cottage, Wildmoor (B3) Log_Chloride 27/3/1996 18.00 low 58 134 -4.4 3.2Loddon at Keepers Cottage, Wildmoor (B3) Log_Chloride 27/3/1996 15.00 low 58 134 -5.0 3.9Loddon at Keepers Cottage, Wildmoor (B3) Log_Chloride 11/12/1991 10.00 low 58 134 -6.6 5.8Loddon at Keepers Cottage, Wildmoor (B3) Log_BOD (ATU) 19/1/1994 11.70 high 1.4 130 4.7 8.4Lyde at Deanland Farm Log_Chlortde 28/9/1994 88.00 high 20 129 4.5 4.4Lyde at Deanland Farm Log_Chloride 12/12/1989 146.00 high 20 129 6.1 7.3Loddon at Long Bridge, Sherfield (B4) Log_Chloride 27/3/1996 13.00 low 43 202 -5.7 3.3Vyne Stream below Vyne, Sherfield (B8) D.O. (mg/l) 18/ 5/1998 18.40 high 9.76 101 4.3 1.9Vyne Stream below Vyne, Sherfield (B8) D.O. (mg/l) 14/6/1994 18.70 high 9.76 101 4.4 1.9Vyne Stream below Vyne, Sherfield (B8) pH 30/3/1995 9.70 high 8.1 103 4.4 1.2Loddon above Blackwater at Kings Bridge (B5) Log_Chloride 30/10/1992 4.00 low 43 183 -9.9 10.7Loddon above Blackwater at Kings Bridge (B5) Log BOD (ATU) 1/12/1993 14.80 high 2 177 5.2 7.4Loddon above Blackwater at Kings Bridge (B5) pH 15/2/1990 6.70 low 8 185 -4.9 1.2
WRc Ref: UC 3330/11659*0September 1999
17

Environment Agency - Thames Region
Table 2.3 Water quality summary statistics
WRccode
EA code Site name determinand dist.shape
mean sd shift n date range
B1 PLDR.0034 Loddon At Pyotts Bridge Basing Chloride 2 26.51 2.46 0 57 1995-1998B1 PLDR.0034 Loddon At Pyotts Bridge Basing BOD 2 0.97 0.62 0 58 1995-1998B1 PLDR.0034 Loddon At Pyotts Bridge Basing Ammonia 2 0.08 0.05 0 58 1995-1998B1 PLDR.0034 Loddon At Pyotts Bridge Basing DO 2 9.74 1.22 0 57 1995-1998B1 PLDR.0034 Loddon At Pyotts Bridge Basing Temp 1 10.88 2.76 0 59 1995-1998B1 PLDR.0034 Loddon At Pyotts Bridge Basing pH 2 7.68 0.16 0 60 1995-1998B3 PLDR.0073 Loddon At Keepers Cottage Wildmoor Chloride 1 62.81 16.00 0 59 1995-1998B3 PLDR.0073 Loddon At Keepers Cottage Wildmoor BOD 2 1.09 0.66 0 59 1995-1998B3 PLDR.0073 Loddon At Keepers Cottage Wildmoor Ammonia 2 0.12 0.24 0 61 1995-1998B3 PLDR.0073 Loddon At Keepers Cottage Wildmoor DO 2 10.48 1.35 0 55 1995-1998B3 PLDR.0073 Loddon At Keepers Cottage Wildmoor Temp 1 12.42 3.89 0 58 1995-1998B3 PLDR.0073 Loddon At Keepers Cottage Wildmoor pH 1 7.94 0.20 0 61 1995-1998B13 PLDR.0039 Lyde At Deanland Farm Chloride 2 22.50 5.13 0 56 1995-1998B13 PLDR.0039 Lyde At Deanland Farm BOD 2 1.09 0.58 0 54 1995-1998B13 PLDR.0039 Lyde At Deanland Farm Ammonia 2 0.10 0.06 0 56 1995-1998B13 PLDR.0039 Lyde At Deanland Farm DO 2 10.09 1.28 0 55 1995-1998B13 PLDR.0039 Lyde At Deanland Farm Temp 1 11.62 3.28 0 55 1995-1998B13 PLDR.0039 Lyde At Deanland Farm pH 2 7.95 0.13 0 56 1995-1998B4 PLDR.0033 Loddon At Long Bridge Sherfield Chloride 1 42.57 7.50 0 56 1995-1998B4 PLDR.0033 Loddon At Long Bridge Sherfield BOD 2 1.09 0.87 0 56 1995-1998B4 PLDR.0033 Loddon At Long Bridge Sherfield Ammonia 2 0.07 0.06 0 57 1995-1998B4 PLDR.0033 Loddon At Long Bridge Sherfield DO 1 10.60 1.47 0 56 1995-1998B4 PLDR.0033 Loddon At Long Bridge Sherfield Temp 2 11.01 4.25 0 56 1995-1998B4 PLDR.0033 Loddon At Long Bridge Sherfield pH 1 8.06 0.21 0 57 1995-1998B6 PLDR.0052 Vyne Stream Above Stw Sherborne St John Chloride 2 30.47 26.10 0 30 1989-1996B6 PLDR.0052 Vyne Stream Above Stw Sherborne St John BOD 2 1.98 2.66 0 29 1989-1996B6 PLDR.0052 Vyne Stream Above Stw Sherborne St John Ammonia 2 0.06 0.10 0 30 1989-1996B6 PLDR.0052 Vyne Stream Above Stw Sherborne St John DO 2 10.06 1.21 0 28 1989-1996WRc Ref: UC 3330/11659-0September 1999
18

Environment Agency - Thames Region
WRccode
EA code Site name determinand dist.shape
mean sd shift n date range
B6 PLDR.0052 Vyne Stream Above Stw Sherborne St John Temp 2 11.04 4.24 0 30 1989-1996B6 PLDR.0052 Vyne Stream Above Stw Sherborne St John pH 1 8.02 0.23 0 30 1989-1996B8 PLDR.0051 Vyne Stream Below The Vyne Sherborne St Chloride 2 49.06 19.55 0 45 1995-1998B8 PLDR.0051 Vyne Stream Below The Vyne Sherborne St BOD 2 3.08 3.44 0 45 1995-1998B8 PLDR.0051 Vyne Stream Below The Vyne Sherborne St Ammonia 2 0.06 0.04 0 45 1995-1998B8 PLDR.0051 Vyne Stream Below The Vyne Sherborne St DO 2 10.22 1.51 0 43 1995-1998B8 PLDR.0051 Vyne Stream Below The Vyne Sherborne St Temp 2 11.40 5.56 0 45 1995-1998B8 PLDR.0051 Vyne Stream Below The Vyne Sherborne St pH 2 8.26 0.30 0 44 1995-1998B9 PLDR.0056 Bow Brook above Vyne Stream Chloride 2 40.25 10.10 0 8 1989-1992B9 PLDR.0056 Bow Brook above Vyne Stream BOD 2 2.10 2.12 0 8 1989-1992B9 PLDR.0056 Bow Brook above Vyne Stream Ammonia 2 0.03 0.01 0 8 1989-1992B9 PLDR.0056 Bow Brook above Vyne Stream DO 1 9.04 1.55 0 7 1989-1992B9 PLDR.0056 Bow Brook above Vyne Stream Temp 2 11.78 5.27 0 8 1989-1992B9 PLDR.0056 Bow Brook above Vyne Stream pH 2 7.90 0.33 0 8 1989-1992B10 PLDR.0054 Bow Brook at Locks Bridge Chloride 2 56.75 9.19 0 8 1989-1992B10 PLDR.0054 Bow Brook at Locks Bridge BOD 2 3.28 2.52 0 8 1989-1992B10 PLDR.0054 Bow Brook at Locks Bridge Ammonia 2 0.04 0.03 0 8 1989-1992B10 PLDR.0054 Bow Brook at Locks Bridge DO 1 8.82 1.44 0 6 1989-1992B10 PLDR.0054 Bow Brook at Locks Bridge Temp 2 11.74 5.23 0 8 1989-1992B10 PLDR.0054 Bow Brook at Locks Bridge pH 2 8.00 0.26 0 8 1989-1992B12 PLDR.0055 Bow Brook At Bow Bridge Sherfield Chloride 2 49.02 17.50 0 46 1995-1998B12 PLDR.0055 Bow Brook At Bow Bridge Sherfield BOD 2 3.03 3.89 0 44 1995-1998B12 PLDR.0055 Bow Brook At Bow Bridge Sherfield Ammonia 2 0.05 0.05 0 46 1995-1998B12 PLDR.0055 Bow Brook At Bow Bridge Sherfield DO 1 10.27 2.34 0 45 1995-1998B12 PLDR.0055 Bow Brook At Bow Bridge Sherfield Temp 2 11.71 5.76 0 46 1995-1998B12 PLDR.0055 Bow Brook At Bow Bridge Sherfield pH 2 8.07 0.28 0 46 1995-1998B5 PLDR.0028 Loddon Above Blackwater At Kings Bridge Chloride 2 45.07 7.46 0 46 1995-1998B5 PLDR.0028 Loddon Above Blackwater At Kings Bridge BOD 2 1.47 0.92 0 45 1995-1998B5 PLDR.0028 Loddon Above Blackwater At Kings Bridge Ammonia 2 0.07 0.09 0 46 1995-1998B5 PLDR.0028 Loddon Above Blackwater At Kings Bridge DO 1 9.86 1.51 0 47 1995-1998B5 PLDR.0028 Loddon Above Blackwater At Kings Bridge Temp 1 12.71 4.17 0 47 1995-1998B5 PLDR.0028 Loddon Above Blackwater At Kings Bridge pH 2 8.16 0.15 0 46 1995-1998WRc Ref: UC 3330/11659-0September 1999
19

Environment Agency - Thames Region
2.3.3 Effluent Flow and Quality
Summary statistics were calculated using measured flow data and routine Agency effluent sample data for Basingstoke, Sherborne and Sherfield STWs (1989-1998). A Pre SIMCAT Investigation (PSI) was carried out for Chloride, BOD, Total Ammonia, Dissolved Oxygen, pH and Temperature by repeating the methods used for river quality data.
Effluent flow
Investigations showed that the most consistent date range to pool STW flow data was the period 1997 to 1998. Flow summary statistics are included in Table 2.5
Screening for statistical outliers
Table 2.4 lists outliers detected using the Test Data Facility MOT program that have t statistic greater than 4 or less than -4. All these data observations were excluded from further analysis.
Screening for step changes
There was no evidence to suggest that it would be inappropriate to choose a period different to that used for water quality data. Therefore, to ensure consistency with the river quality data, the period 1995 to 1998 was selected for further data processing.
Generating summary statistics
Table 2.5 contains the summary statistics calculated using the Test Data Facility TOAD program. The Table lists each STW and gives the site name, Agency code and an abbreviated code used by WRc for this study. At each monitoring station statistics are reported for Chloride, BOD, Ammonia, Dissolved Oxygen, Temperature, pH and flow. Distribution shape identifies whether the data are Normal (1), logNormal (2) of shifted logNormal (3). If the distribution shape is 3 a shift value is also given. The mean and standard deviation are reported together with the number of values (n) and the date range.
Determinands Chloride, BOD, Ammonia and Dissolved Oxygen are reported in mg/I. Flow is reported in Ml/d and temperature in degrees centigrade. The parametric estimates of 95 %ile concentrations for each works actual performance, based on 1995-98 data, were:
BOD Total Ammonia~52 Y24.1 0.59.9 4.2
Further details on the ammonia concentrations in the Final Effluent of Basingstoke are included in Appendix C.
BasingstokeSherborneSherfield
WRc Ref: UC 3330/11659-0September 1999
20

Environment Agency - Thames Region
Table 2.4 STW quality data outliers
WWTP Determinand Date OutlierValue
Type Median n t-stat Out:Medratio
Basingstoke (B2) Log_Chloride 19/10/1989 308.00 high 106.0 343 5.4 2.9Basingstoke (B2) Log_Chloride 13/11/1997 325.00 high 106.0 343 5.7 3.1Basingstoke (B2) Log_Chloride 01/09/1998 8.00 low 106.0 343 -13.1 13.2Basingstoke (B2) Log_Chloride 04/11/1993 326.00 high 106.0 343 5.7 3.1Basingstoke (B2) Log_BOD (ATU) 19/01/1994 26.90 high 2.0 260 4.2 13.5Basingstoke (B2) Log_BOD (ATU) 15/03/1995 39.50 high 2.0 260 4.9 19.8Basingstoke (B2) Log BOD (ATU) 15/03/1995 79.00 high 2.0 260 6.0 39.5Basingstoke (B2) pH 16/06/1998 8.59 high 7.5 374 4.3 1.1Sherfield on Loddon (B15) Log_Chloride 15/05/1995 28.00 low 112.0 132 -6.2 4.0
WRc Ref: UC 3330/11659-0September 1999
21

Environment Agency - Thames Region
Table 2.5 STW effluent flow and quality summary statistics
Site EA code Site name Determinand Dist Mean SD Shift N Date range
B2 PLDE.0012 Basingstoke STW Chloride 1 114.90 21.03 0 149 1995-1998B2 PLDE.0012 Basingstoke STW BOD 2 1.80 1.93 0 143 1995-1998B2 PLDE.0012 Basingstoke STW Ammonia 2 0.36 0.60 0 152 1995-1998B2 PLDE.0012 Basingstoke STW DO 2 7.11 1.21 0 80 1995-1998B2 PLDE.0012 Basingstoke STW Temp 1 15.22 4.02 0 144 1995-1998B2 PLDE.0012 Basingstoke STW pH 2 7.62 0.19 0 150 1995-1998B2 PLDE.0012 Basingstoke STW Flow 3 27.60 4.50 21.6 541 1997-1998B7 PLDE.0089 Sherborne St John STW Chloride 1 208.55 89.34 0 44 1995-1998B7 PLDE.0089 Sherborne St John STW BOD 2 2.05 1.10 0 42 1995-1998B7 PLDE.0089 Sherborne St John STW Ammonia 2 0.29 0.10 0 44 1995-1998B7 PLDE.0089 Sherborne St John STW DO 2 8.90 1.31 0 18 1995-1998B7 PLDE.0089 Sherborne St John STW Temp 2 12.86 4.14 0 44 1995-1998B7 PLDE.0089 Sherborne St John STW pH 2 7.98 0.14 0 44 1995-1998B7 PLDE.0089 Sherborne St John STW Flow 3 1.4 0.6 0.6 497 1997-1998B15 PLDE.0091 Sherfield on Loddon STW Chloride 2 108.30 18.44 0 42 1995-1998B15 PLDE.0091 Sherfield on Loddon STW BOD 2 4.98 2.62 0 42 1995-1998B15 PLDE.0091 Sherfield on Loddon STW Ammonia 1 2.13 1.23 0 43 1995-1998B15 PLDE.0091 Sherfield on Loddon STW DO 2 7.10 1.25 0 18 1995-1998B15 PLDE.0091 Sherfield on Loddon STW Temp 2 13.18 4.01 0 41 1995-1998B15 PLDE.0091 Sherfield on Loddon STW pH 3 7.80 0.23 7.31 43 1995-1998B15 PLDE.0091 Sherfield on Loddon STW Flow 3 2.0 0.4 0.9 371 1997-1998
WRc Ref: UC 3330/11659-0September 1999
22

Environment Agency - Thames Region
3. MODEL CONCEPTUALISATION AND BUILDING
3.1 River reaches
A three reach SIMCAT model was built to represent the River Loddon and the Bow Brook/Vyne Stream. The model name of each reach and its length in kilometres are given in Table 3.1. Blacklands Loop and the Lyde River are represented as inputs to the Loddon and the upper Bow Brook is an input to the Vyne Stream reach ( note: the actual name below the confluence is the Bow Brook).
Table 3.1 River Reaches
Reach No. Reach name Length (km) Tributaries
1 Upper Loddon 7.4 Blacklands Loop and Lyde River
2 Vyne Stream 8.9 Bow Brook3 Lower Loddon 10.0
3.2 Flow gauges
Eight river flow gauges or Micro-Low-Flow estimates were available for river flow calibration. Table 3.2 shows their location in the SIMCAT model. Two of these have been used to define headwater flow for the River Loddon and Vyne Stream and another two have been used to define the tributary flow inputs for the Lyde River and the Bow Brook.
Table 3.2 Flow gauge location
Code Name Reach Distance from head of reach (km)
Comment
F1 Pyotts Bridge gauge (95-98) (Loddon) 1 0.0 Loddon above Basingstoke
F2 Pyotts Bridge gauge (95-98) (Blacklands) - - Tributary flow inputF3 Lyde River tributary estimate - - Tributary flow inputF4 Head of Vyne Stream estimate 2 0.0F5 Vyne Stream subcatchment estimate 2 3.0F6 Bow Brook tributary estimate - - Tributary flow inputF7 Bow Brook subcatchment estimate 2 8.7F8 Sheep Bridge gauge (95-98) 3 9.9 bottom of modelled
catchment
WRc Ref: UC 3330/11659-0September 1999
23

Environment Agency - Thames Region
3.3 Tributary inputs
Three tributary inputs were included, to represent Blacklands Loop, the Lyde River and the Bow Brook upstream of its confluence with the Vyne Stream. Flow data were available for each of these tributaries, as indicated in Table 3.2. The quality of these inputs is measured at B1 for Blacklands Loop, B13 for the Lyde, and B9 for the Bow Brook. Table 3.3 shows the position of the tributary inputs in the SIMCAT model.
Table 3.3 Tributary input location
Name Reach Distance from head of reach (km)
Blacklands Loop 1 1.5Lyde River 1 4.7Bow Brook, u/s Vyne confl. 2 3.5
3.4 Water quality monitoring sites
Table 3.4 shows the position of each of the water quality monitoring stations used in the SIMCAT model. The Table uses the Agency code and a WRc abbreviation for each monitoring station.
Table 3.4 Water quality monitoring site location
Site EA code Site name ReachNo.
Distance from head of reach (km)
B1 PLDR0034 Loddon At Pyotts Bridge Basing 1 0.0B3 PLDR0073 Loddon At Keepers Cottage Wildmoor 1 1.0B13 PLDR0039 Lyde At Deanland Farm 1 Tributary input qualityB4 PLDR0033 Loddon At Long Bridge Sherfield 1 6.3B6 PLDR0052 Vyne Stream Above Stw Sherborne St John 2 0.0B8 PLDR0051 Vyne Stream Below The Vyne Sherborne St 2 2.4B9 PLDR0056 Bow Brook above Vyne Stream 2 Tributary input qualityB10 PLDR0054 Bow Brook at Locks Bridge 2 4.2B12 PLDR0055 Bow Brook At Bow Bridge Sherfield On Lo 2 8.1B5 PLDR0028 Loddon Above Blackwater At Kings Bridge 3 9.3
WRc Ref: UC 3330/11659-0September 1999
24

Environment Agency - Thames Region
3.5 STWs
Table 3.5 shows the position of each of the STWs represented in the SIMCAT model. The Table uses the Agency code and a WRc abbreviation for each works.
Table 3.5 STW location
Site EA code Site name ReachNo.
Distance from head of reach (km)
B2 PLDE.0012 Basingstoke STW 1 0.1B7 PLDE.0089 Sherborne St John STW 2 0.3B15 PLDE.0091 Sherfield on Loddon STW 2 8.5
WRc Ref: UC 3330/11659-0September 1999
25

Environment Agency - Thames Region
3.6 Model schematic
Figure 3.1 is a schematic representation of the SIM CAT model showing each of the major features.
WRc Ref: UC 3330/11659-0September 1999
26
Environment Agency - Thames Region
4. MODEL CALIBRATION
The SIMCAT model was built and calibrated using SIMCAT version 6.2 (December 1998).Calibration was in two stages for river flow and river quality:
1. Manual calibration - where the modeller optimises user definable variables and boundary conditions (within sensible limits) to achieve the best possible match with observed data.
2. Auto-calibration - where SIMCAT automatically makes adjustments to account for inputs or river processes not represented explicitly in the model. This ensures full agreement between obsen/ed and modelled river quality statistics.
4.1 Flow calibration
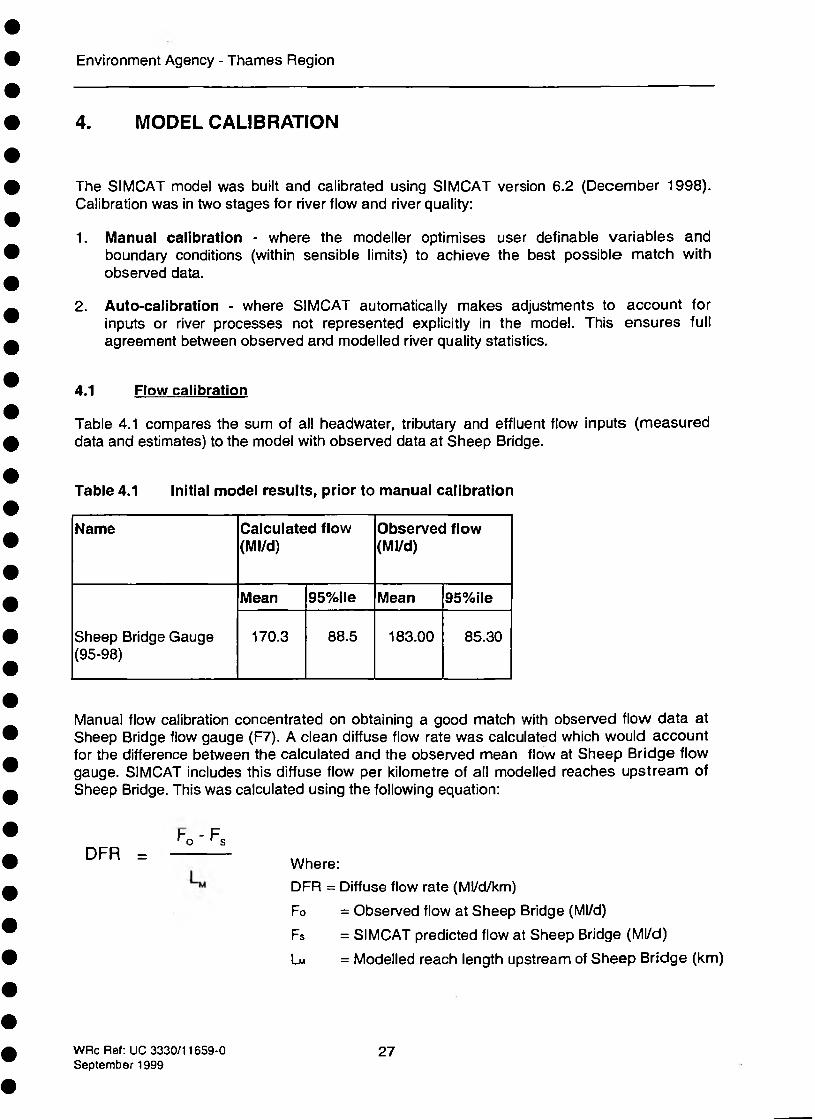
Table 4.1 compares the sum of all headwater, tributary and effluent flow inputs (measureddata and estimates) to the model with observed data at Sheep Bridge.
Table 4.1 Initial model results, prior to manual calibration
Name Calculated flow (Ml/d)
Observed flow (Ml/d)
Sheep Bridge Gauge (95-98)
Mean 95%ile Mean 95%ile
170.3 88.5 183.00 85.30
Manual flow calibration concentrated on obtaining a good match with observed flow data at Sheep Bridge flow gauge (F7). A clean diffuse flow rate was calculated which would account for the difference between the calculated and the observed mean flow at Sheep Bridge flow gauge. SIMCAT includes this diffuse flow per kilometre of all modelled reaches upstream of Sheep Bridge. This was calculated using the following equation:
Where:DFR = Diffuse flow rate (Ml/d/km)Fo = Observed flow at Sheep Bridge (Ml/d)Fs = SIMCAT predicted flow at Sheep Bridge (Ml/d)L m = Modelled reach length upstream of Sheep Bridge (km)
D FR =Fo'Fs
WRc Ref: UC 3330/11659-0September 1999
27

Environment Agency - Thames Region
The 95%ile low flow for this diffuse flow input was calculated by keeping the same distribution shape (mean:95%ile low flow ratio) as the measured distribution at Sheep Bridge.
The calculated clean diffuse input had a mean of 0.49 Ml/d/km and a 95%ile of 0.25 Ml/d/km.
Table 4.2 summarises the flow balance results, prior to flow auto-calibration.
Table 4.2 Manual calibration flow results
Name Calculated flow (Ml/d)
Observed flow (Ml/d)
Sheep Bridge Gauge (95-98)
Mean 95%ile Mean 95%ile
182.8 95.3 183.00 85.30
The clean diffuse input was given the same quality as that observed at monitoring site B1, which is at the headwater of the Upper Loddon.
Auto-calibration to observed flow at Sheep Bridge resulted in minor adjustments following manual calibration. Figure 4.1 shows plots of modelled (line) and observed (+ symbol) flow throughout the catchment following flow auto-calibration. Flow data for the Vyne Stream are Micro-Low-Flow estimates. These were not used to calibrated flows.
WRc Ref: UC 3330/11659-0September 1999
28

Environment Agency - Thames Region
Figure 4.1 Flow calibration
4.2 Quality calibration
River quality was calibrated following flow auto-calibration. Figure 3.1 indicates the river quality sampling site used to provide input data for headwater quality and quality calibration.
Default decay rates for BOD, Ammonia and DO were applied as shown in Table 4.3. Figures4.2 - 4.5 show the observed and calculated quality when river quality is simulated with autocalibrated flows.
WRc Ref: UC 3330/11659-0September 1999
29

Environment Agency - Thames Region
Table 4.3 Decay rates
Determinand Decay rate(1/d)
Chloride 0.0BOD 5.0Ammonia 10.0DO* 10.0
*rearation rate
Figure 4.2 Chloride manual calibration (decay rate = 0/d.)
WRc Ref: UC 3330/11659-0September 1999
30

Environment Agency - Thames Region
B.O.D - Upper Loddon reach B.O.D - Lower Loddon reach
-------Mean values .......— 95 percentile values + Observed values
Figure 4.3 BOD manual calibration (decay rate = 5/d.)
WRc Ref: UC 3330/11659-0September 1999
31

Environment Agency - Thames Region
Figure 4.4 Ammonia manual calibration (decay rate = 10/d.)
WRc Ref: UC 3330/11659-0September 1999
32

Environment Agency - Thames Region
Figure 4.5 Dissolved oxygen manual calibration (rearation rate = 10/d.)
Figures 4.6 - 4.9 show plots of results following quality auto-calibration. Site B10 on the Vyne Stream was not used as an auto-calibration point due to the small number of observations at this site. The plots compare observed and modelled mean and 90%ile concentrations and also show confidence limits about model predictions. Small differences between observed and modelled 90%iles are because SIMCAT auto-calibrates to the observed 95%ile statistic.
WRc Ref: UC 3330/11659-0September 1999
33

Environment Agency - Thames Region
Chloride - Upper Loddon reach
0.3m
Chloride -Vyne Stream reach0 20 40 60 80 100 120 140 160
-A—
M ean values 90 percentile values Confidence limits Obseived values
Figure 4.6 Chloride calibration
WRc Ref: UC 3330/11659-0September 1999
34

Environment Agency - Thames Region
B.O.D - Upper Loddon reach B.O.D - Lower Loddon reach
------ Mean value* --------90 percentile values ------- Confidence limits + Observed values
Figure 4.7 BOD calibration
WRc Ref: UC 3330/11659-0September 1999
35

Environment Agency - Thames Region
Ammonia - Upper Loddon reach Ammonia - Lower Loddon reach
EY; —— Msan values -------90 percentile values --------Confidence limits + Obseived values
Figure 4.8 Ammonia calibration
WRc Ref: UC 3330/11659-0September 1999
36
Environment Agency - Thames Region
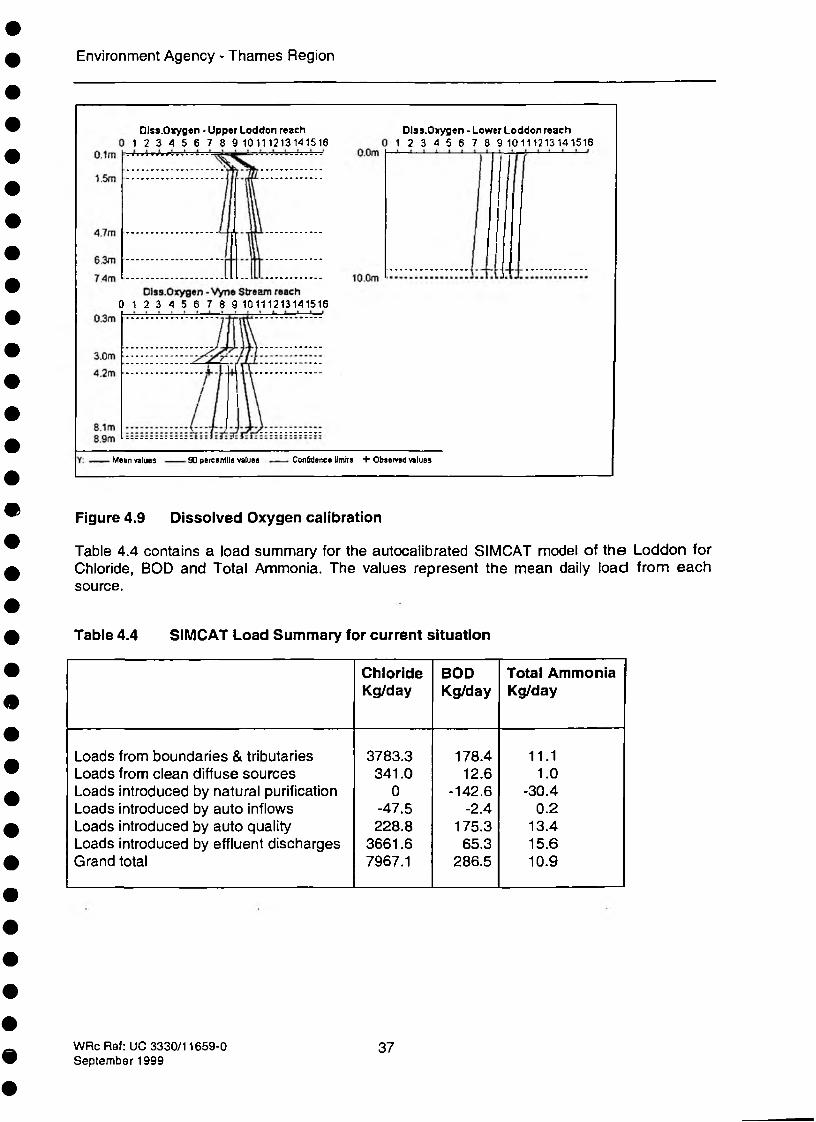
□Iss.Oxygen - Upper Loddon reach1 2 3 4 5 6 7 8 9 10111213141516
Dlss.Oxygen • Lower Loddon reach1 2 3 4 5 6 7 8 9 10111213141516
0 1 2 3 4 5 6 7 8 9 10111213141516
Mean values ■ 90 percentile values Confidence limits +• Observed values
Figure 4.9 Dissolved Oxygen calibration
Table 4.4 contains a load summary for the autocalibrated SIMCAT model of the Loddon for Chloride, BOD and Total Ammonia. The values represent the mean daily load from each source.
Table 4.4 SIMCAT Load Summary for current situation
ChlorideKg/day
BODKg/day
Total Ammonia Kg/day
Loads from boundaries & tributaries 3783.3 178.4 11.1Loads from clean diffuse sources 341.0 12.6 1.0Loads introduced by natural purification 0 -142.6 -30.4Loads introduced by auto inflows -47.5 -2.4 0.2Loads introduced by auto quality 228.8 175.3 13.4Loads introduced by effluent discharges 3661.6 65.3 15.6Grand total 7967.1 286.5 10.9
WRc Ftef: UC 3330/11659-0Septembar 1999
37

Environment Agency - Thames Region
WRc Ref: UC 3330/11659-0 3 8September 1999

Environment Agency - Thames Region
5. MODELLING SCENARIO RESULTS
Following auto-calibration, the SIMCAT model was used to represent the specified modelling scenarios based on the current and future flows and consents. The auto-calibration inputs, diffuse inputs and headwater inputs used in calibrating the current situation model against the observed data were maintained for all scenarios.
All scenario results are based on the lace value’ SIMCAT results and take no account the confidence intervals calculated for each statistical output. The reliability of the interpretation of the results to these and other sensitivity issues should be considered as part of any subsequent decision making process. In particular, care should be taken in the interpretation of DO predictions, as these are largely dependent on the assumed DO inputs from the STWs. These were maintained at current observed levels for all scenarios
As described in Section 1.3.3, three broad modelling tasks were carried out as described below.
i) Use the calibrated SIMCAT model results to assess current compliance with river quality standards.
ii) Use the calibrated SIMCAT model (in ‘what-if’ mode) to assess compliance with river quality standards when all STWs are operating at current consented flow and quality. The predicted water quality is the ‘planned’ water quality for the catchment.
iii) Use calibrated SIMCAT model (in ‘what-if’ mode) to determine permissible future consented flow and quality at STWs to meet RE classification AND show no deterioration over ‘planned’ water quality as defined in ii) above. Flows that cannot be treated at Basingstoke are transferred to.Sherborne, then Sherfield. This assessment is repeated to reflect predicted population changes by 2001, 2006 and 2011.
They are considered in detail in Sections 5.1 to 5.3
5.1 ‘Current* compliance with river quality targets.
The calibrated SIMCAT model was used assess compliance with river quality targets. The different targets used in the catchment are summarised in Table 5.1.
The Upper Loddon (from Basingstoke STW to the confluence with Bow Brook) and the Lower Loddon (from the confluence with Bow Brook to Kings Bridge) are classified as RE2 and as a Salmonid Fishery. Operational standards are also applied.
The Vyne Stream / Bow Brook reach (from Sherborne STW to the confluence with the Loddon) is classified as RE3. No other standards apply.
The Targets for Dissolved Oxygen are conversions from Percent Saturation values. The conversion has been made using standard formula that use the average summer temperature of the water at that location. The resulting targets have been rounded to the nearest integer.
WRc Ref: UC 3330/11659-0September 1999
39

Environment Agency - Thames Region
Table 5.1 River Quality Targets
REC
90%BODmg/l
90%NH4Nmg/l
10%DOmg/l
95%unzdNH4Nmg/l
Salmonid Fishery
mean 1 % 95% DO DO NH4N mg/l mg/l mg/l
Operational Standard
95% 1% 95% 95% BOD DO unzd NH4N mg/l mg/l NH4N mg/l
mg/l
d/s Basingstoke STW 4 0.6 7 0.021 9 6 0.78B3 (PLDR.0073) 4 0.6 7 0.021 9 6 0.78 3 7 0.004 0.195d/s Lyde 4 0.6 7 0.021 9 6 0.78B4 (PLDR.0033) 4 0.6 7 0.021 9 6 0.78End of Upper Loddon 4 0.6 7 0.021 9 6 0.78
d/s Sherborne STW 6 1.3 6 0.021B8 (PLDR.0051) 6 1.3 6 . 0.021d/s Bow Brook 6 1.3 6 0.021B10 (PLDR.0054) 6 1.3 6 0.021B12 (PLDR.0055) 6 1.3 6 0.021d/s Sherfield STW 6 1.3 6 0.021End of Bow Brook 6 1.3 6 0.021
Head of Lower Loddon 4 0.6 7 0.021 9 6 0.78B5 (PLDR.0028) 4 0.6 7 0.021 9 6 0.78End of Lower Loddon 4 0.6 7 0.021 9 6 0.78
Note: RE1, 2 and 3 un-ionised ammonia standards are identical to the Salmonid Fishery standard for un-ionised Ammonia applied to the Loddon. The same criteria is applied to the Vyne Stream/Bow Brook which is RE3.
Table 5.1 shows a number of assessment locations within each river reach. For example, the Upper Loddon has assessment points immediately downstream of Basingstoke STW; at the monitoring station PLDR.0073; downstream of the Lyde tributary; at the monitoring station PLDR.0033; and, at the end of the reach. Compliance with targets throughout a reach is required. Un-ionised Ammonia results were calculated from the total Ammonia results produced by SIMCAT and the observed distributions of temperature and pH by using a WRc Monte Carlo simulation program.
Appendix A (A1) contains model the full suite of model results for the simulation. Table 5.2 assesses the compliance of these results with the targets in Table 5.1. These results may be summarised as follows:
WRc Ref: UC 3330/11659-0September 1999
40
Environment Agency - Thames Region
Upper Loddon
RE2 river quality target is met. Salmonid Fishery Target is met except for a failure in mean DO immediately downstream of Basingstoke STW. The Operational Standards are met at PLDR.0033.
Vyne Stream / Bow Brook
Reach fails RE3 BOD target.
Lower Loddon
Reach complies with RE2 and Salmonid Fishery target.
WRc Ref: UC 3330/11659-0September 1999
41

Environment Agency - Thames Region
Table 5.2 Assessment for current situation
REC Salmonid Fishery Operational Standard
BOD NH4-N DO UNZD mean DO Amm BOD DO UNZD AmmAmm DO P01 P95 P95 P01 Amm P95P95 P95
d/s Basingstoke STW PASS PASS PASS PASS FAIL PASS PASSB3 (PLDR.0073) PASS PASS PASS PASS PASS PASS PASSd/s Lyde River PASS PASS PASS PASS PASS PASS PASSB4 (PLDR.0033) PASS PASS PASS PASS PASS PASS PASS PASS PASS PASS PASSEnd of Upper Loddon PASS PASS PASS PASS PASS PASS PASS
d/s Sherborne STW PASS PASS PASS PASSB8 (PLDR.0051) FAIL PASS PASS PASSd/s Bow Brook PASS PASS PASS PASSB10 (PLDR.0054) PASS PASS PASS PASSB12 (PLDR.0055) FAIL PASS PASS PASSd/s Sherfield STW FAIL PASS PASS PASSEnd of Bow Brook FAIL PASS PASS PASS
Head of Lower Loddon PASS PASS PASS PASS PASS PASS PASSB5 (PLDR.0028) PASS PASS PASS PASS PASS PASS PASSEnd of Lower Loddon PASS PASS PASS PASS PASS PASS PASS
5.2 Compliance with STWs operating at current consents
The current consented flow and quality for each STW in the catchment have been interpreted as distributions in Tables 5.3 and 5.4 and compared with current measured flow and quality. In estimating SIMCAT input statistics for consented flow and quality, the observed Coefficients of Variation and ratios between mean and shift have been maintained. The 95 percentiles have been calculated by Method of Moments.
WRc Ref: UC 3330/11659-0September 1999
42

Environment Agency - Thames Region
Table 5.3 Current consent and actual STW flow
Consented Flow (Ml/d) Current Observed Flow (Ml/d)
STW mean sd shift mean sd shiftflow flow flow flow flow flow
Basingstoke 27.60 4.50 21.60 27.6 4.5 21.6Sherborne 1.82 0.78 0.79 1.4 0.6 0.6Sherfield 1.04 0.21 0.47 2.0 0.4 0.9
Table 5.3 shows that Basingstoke is currently operating at consented flow; Sherborne is operating below consented flow; and, Sherfield is operating above consented flow. Table 5.4 shows that each works is operating within its quality consent.
Table 5.4 Current consent and actual STW quality
STW meanBOD
sdBOD
95%ileBOD
meanNH4-N
sdNH4-N
95%ileNH4-N
Consented Quality
Basingstoke 3.78 3.42 10.0 0.66 0.79 2.0Sherborne 3.69 2.28 8.0 2.57 2.84 7.5Sherfield 14.94 7.96 30.0 3.59 2.07 7.0Current Observed Quality
Basingstoke 1.80 1.93 5.2 0.36 0.6 1.2Sherborne 2.05 1.10 4.1 0.29 0.1 0.5Sherfield 4.98 2.62 9.9 2.13 1.23 4.2
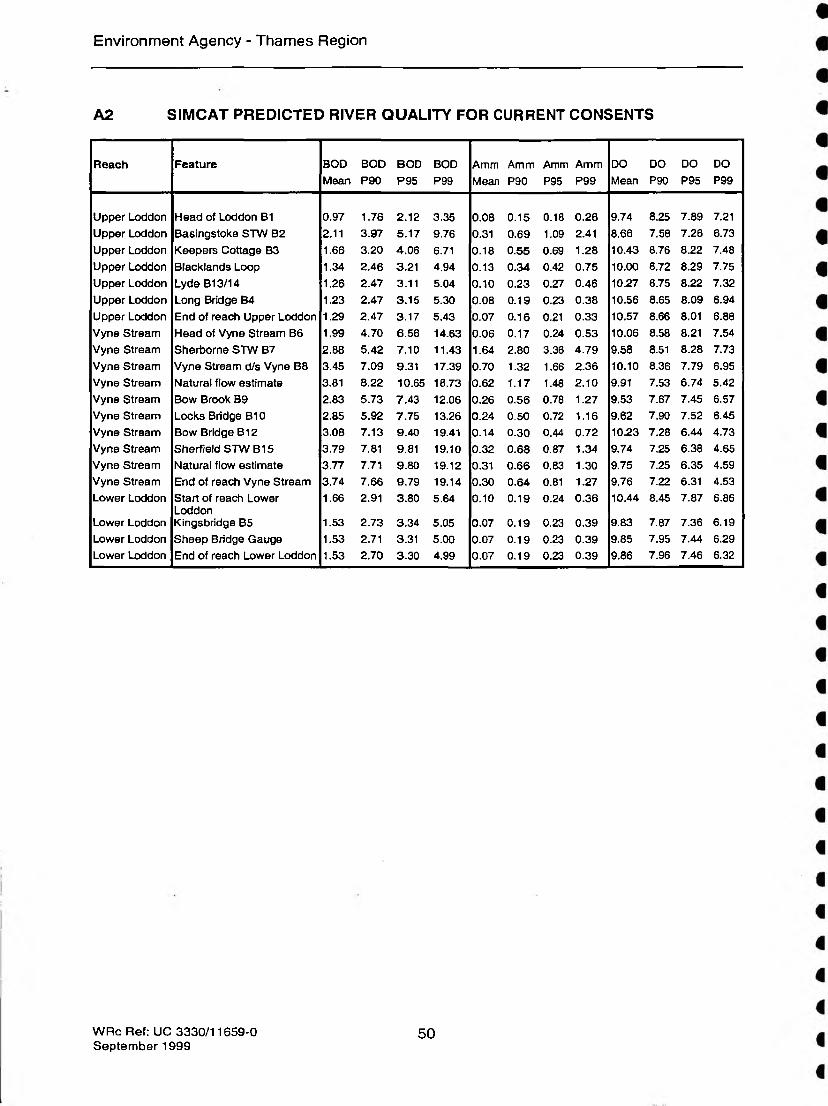
Appendix A (A2) shows the full suite of results for the ‘what-if SIMCAT simulation for each STW operating at current consents. Table 5.5 assesses the compliance of these results with the river quality targets in Table 5.1.
WRc Ref: UC 3330/11659-0September 1999
43

Environment Agency - Thames Region
Table 5.5 River quality assessment for current consents
REC SalmonidFishery
Operational Standard
BOD NH4-N DO 95% mean 1% 95% 95% 1% 95% 95%unzd DO DO NH4-N BOD DO unzd NH4-NNH4-N NH4-N
d/s Basingstoke STW PASS FAIL PASS FAIL FAIL PASS FAILB3 (PLDR.0073) PASS PASS PASS PASS PASS PASS PASSd/s Lyde PASS PASS PASS PASS PASS PASS PASSB4 (PLDR.0033) PASS PASS PASS PASS PASS PASS PASS PASS FAIL PASS FAILEnd of Upper Loddon PASS PASS PASS PASS PASS PASS PASS
d/s Sherborne STW PASS FAIL PASS PASSB8 (PLDR.0051) FAIL FAIL PASS PASSd/s Bow Brook PASS PASS PASS PASSB10 (PLDR.0054) PASS PASS PASS PASSB12 (PLDR.0055) FAIL PASS PASS PASSd/s Sherfield STW FAIL PASS PASS PASSEnd of Bow Brook FAIL PASS PASS PASS
Head of Lower Loddon PASS PASS PASS PASS PASS PASS PASS2.5km PASS PASS PASS PASS PASS PASS PASS5.0km PASS PASS PASS PASS PASS PASS PASSB5 (PLDR.0028) PASS PASS PASS PASS PASS PASS PASSEnd of Lower Loddon PASS PASS PASS PASS PASS PASS PASS
There is a failure of the RE2 ammonia standard downstream of Basingstoke STW and of the operational standard at PLDR.0033. There are ammonia and BOD failures on Vyne Stream / Bow Brook. The Lower Loddon meets all standards.
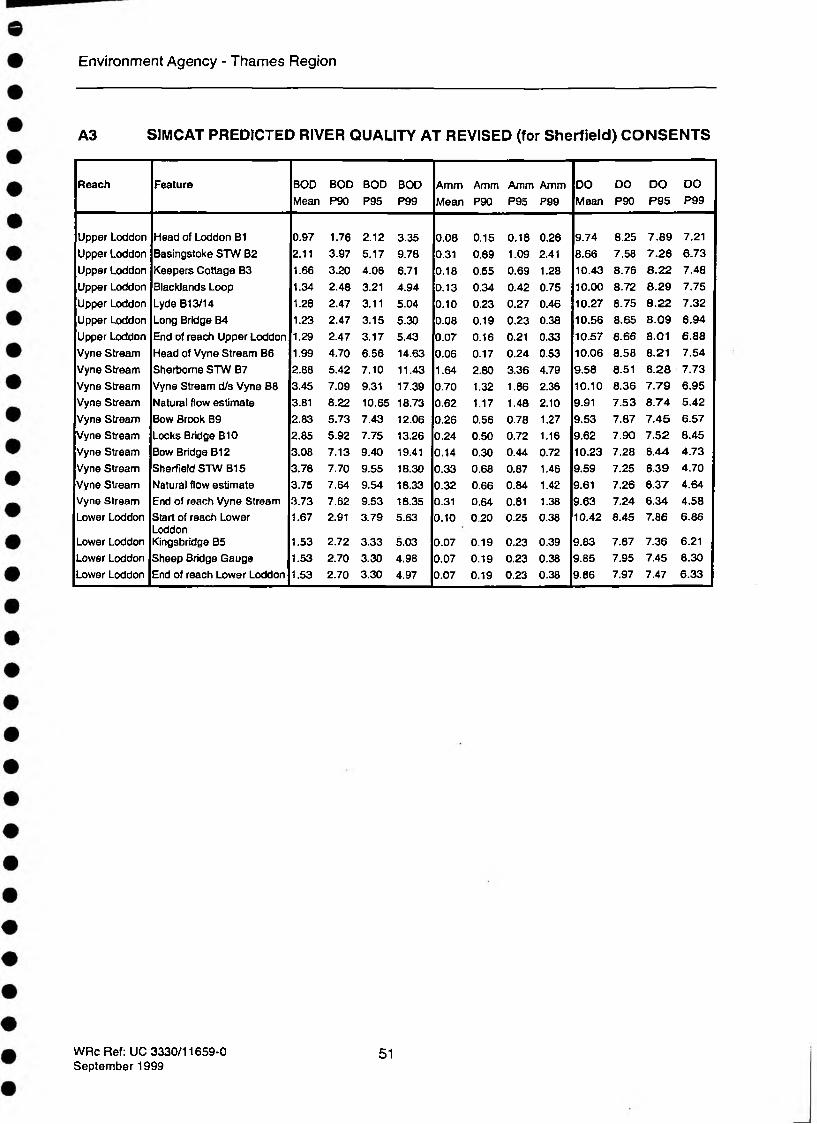
As the consented flow from Sherfield STW is exceeded under current operation, a new consented effluent quality was required that took account of the additional flow. The SIMCAT model was used to determine the consent required at Sherfield to achieve the same immediate downstream impact as the current consent (i.e. 7.8 mg/l BOD and 0.68mg/l Ammonia, as 90%iles).
The revised Sherfield consents are 19.1 mg/l for BOD and 4.4mg/l for Total Ammonia, as95 %iles for a consented flow equivalent to a mean flow of 2.0 Ml/d. Full simulation results for revised consents are presented in A3 of Appendix A.
5.3 Future scenarios
Three future scenarios were identified by TWUL to represent stages of population growth in the catchment. Each is represented in Table 5.6 which shows the mean effluent flow at each STW. For comparison, the actual and current (revised for Sherfield) consented flows are also included.
WRc Ref: UC 3330/11659-0September 1999
44
Environment Agency - Thames Region
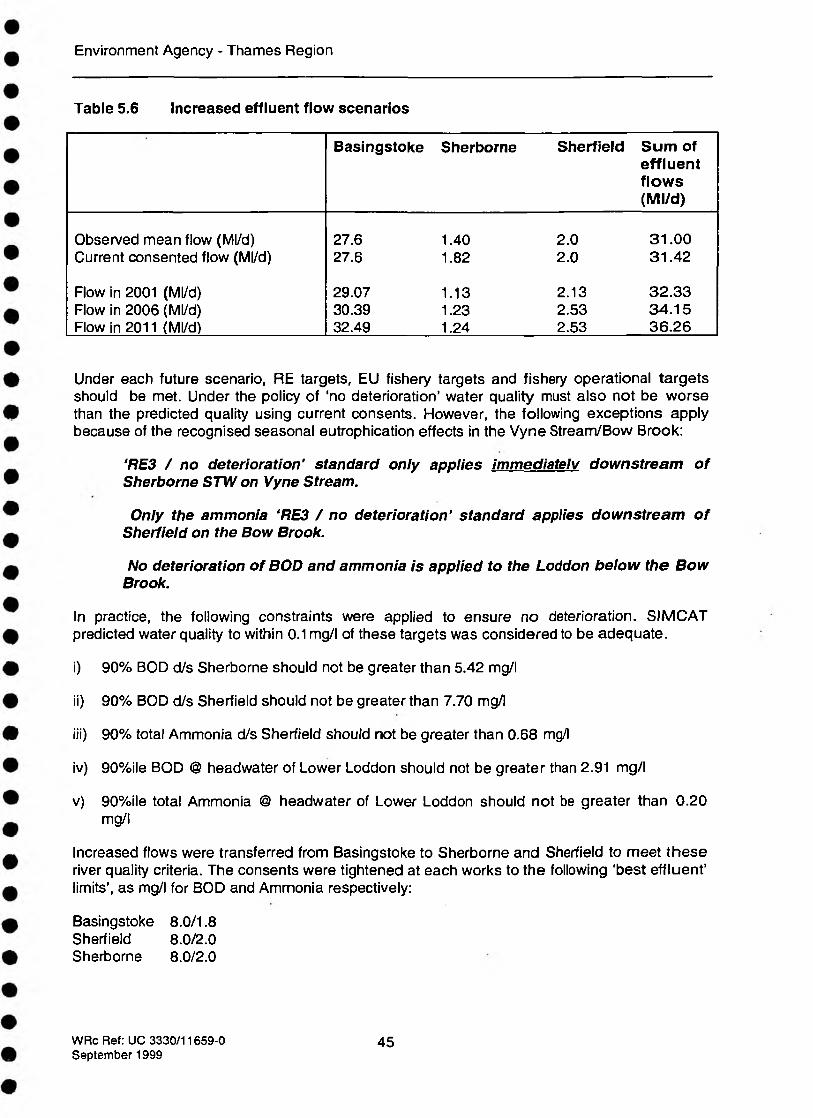
Table 5.6 Increased effluent flow scenarios
Basingstoke Sherborne Sherfield Sum of effluent flows (Ml/d)
Observed mean flow (Ml/d) 27.6 1.40 2.0 31.00Current consented flow (Ml/d) 27.6 1.82 2.0 31.42
Flow in 2001 (Ml/d) 29.07 1.13 2.13 32.33Flow in 2006 (Ml/d) 30.39 1.23 2.53 34.15Flow in 2011 (Ml/d) 32.49 1.24 2.53 36.26
Under each future scenario, RE targets, EU fishery targets and fishery operational targets should be met. Under the policy of ‘no deterioration’ water quality must also not be worse than the predicted quality using current consents. However, the following exceptions apply because of the recognised seasonal eutrophication effects in the Vyne Stream/Bow Brook:
‘RE3 / no deterioration’ standard only applies immediately downstream of Sherborne STW on Vyne Stream.
Only the ammonia ' RE3 / no deterioration' standard applies downstream of Sherfield on the Bow Brook.
No deterioration of BOD and ammonia is applied to the Loddon below the Bow Brook.
In practice, the following constraints were applied to ensure no deterioration. SIMCAT predicted water quality to within 0.1 mg/l of these targets was considered to be adequate.
i) 90% BOD d/s Sherborne should not be greater than 5.42 mg/l
ii) 90% BOD d/s Sherfield should not be greater than 7.70 mg/l
iii) 90% total Ammonia d/s Sherfield should not be greater than 0.68 mg/l
iv) 90%ile BOD @ headwater of Lower Loddon should not be greater than 2.91 mg/l
v) 90%ile total Ammonia @ headwater of Lower Loddon should not be greater than 0.20 mg/l
Increased flows were transferred from Basingstoke to Sherborne and Sherfield to meet these river quality criteria. The consents were tightened at each works to the following ‘best effluent’ limits’, as mg/l for BOD and Ammonia respectively:
Basingstoke 8.0/1.8 Sherfield 8.0/2.0 Sherborne 8.0/2.0
WRc Ref: UC 3330/11659-0September 1999
45

Environment Agency - Thames Region
The best effluent values represent the tightest feasible consents agreed between the Agency and Thames Water that ensure downstream compliance with relevant river quality objectives. For example, Basingstoke STW causes a failure downstream if it operates at the current consent (8.0/2.0). With current flow, the consent has to be tightened to 8.0/1.8 to meet ammonia standards downstream.
Flows were transferred first to Sherborne until a consent of less than the ‘best effluent’ was required; and, then further flows were transferred to Sherfield. Transferred flows were added to the ‘planned growth’ flow for each discharge for each scenario.
Simulation results showing optimised water quality for each scenario are included in Appendix A as A4 (2001), A5 (2006) and A6 (2011). Table 5.7 shows how flows must be distributed in future scenarios. Basingstoke and Sherborne have maximum average flows of 24.5 and 2.0 Ml/d respectively. Additional flows have to be transferred to Sherfield.
Table 5.7 Flow transfer results
Basingstoke Sherborne Sherfield Sum of effluent flows (Ml/d)
Observed mean flow (Ml/d) 27.6 1.40 2.0 31.00Revised consented flow (Ml/d) 27.6 1.82 2.0 31.42
Flow in 2001 (Ml/d) 24.5 2.0 5.83 32.33Flow in 2006 (Ml/d) 24.5 2.0 7.65 34.15Flow in 2011 (Ml/d) 24.5 2.0 9.76 36.26
For all scenarios, Basingstoke and Sherborne consents were set at ‘best effluent’ quality. Table 5.8 shows how Sherfield required a progressively tighter consent for each scenario to ensure no deterioration over planned water quality as effluent flows increased.
Table 5.8 Sherfield consent for future scenarios
2001 2006 2011
BOD 95%ile
Amm 95%ile
12.0 11.0 10.0
2.7 2.3 2.0
The SIMCAT model simulations show that no further effluent flows can be treated in the catchment after 2011 unless an Ammonia consent of less that 2 (mg/l as a 95%ile) is applied at Sherfield or the ‘best effluent quality’ consents for Basingstoke or Sherborne are tightened.
WRc Ref: UC 3330/11659-0September 1999
46
Environment Agency - Thames Region
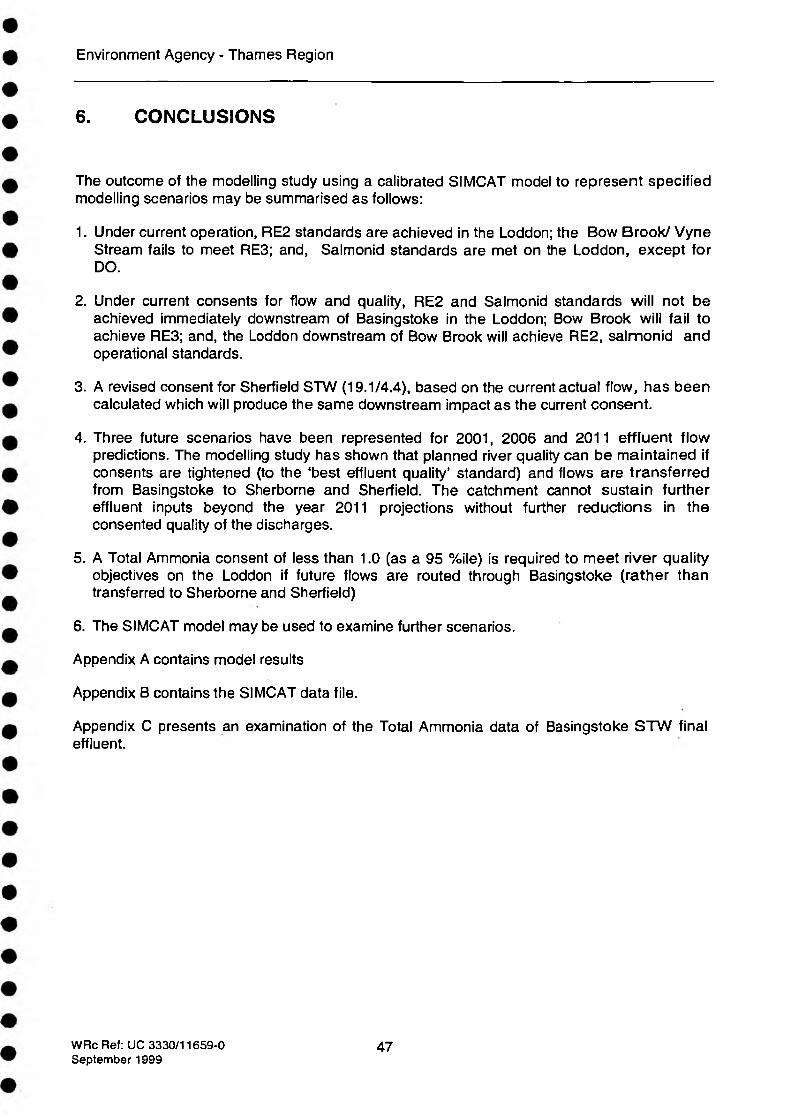
6. CONCLUSIONS
The outcome of the modelling study using a calibrated SIMCAT model to represent specifiedmodelling scenarios may be summarised as follows:
1. Under current operation, RE2 standards are achieved in the Loddon; the Bow Brook/ Vyne Stream fails to meet RE3; and, Salmonid standards are met on the Loddon, except for DO.
2. Under current consents for flow and quality, RE2 and Salmonid standards will not be achieved immediately downstream of Basingstoke in the Loddon; Bow Brook will fail to achieve RE3; and, the Loddon downstream of Bow Brook will achieve RE2, salmonid and operational standards.
3. A revised consent for Sherfield STW (19.1/4.4), based on the current actual flow, has been calculated which will produce the same downstream impact as the current consent.
4. Three future scenarios have been represented for 2001, 2006 and 2011 effluent flow predictions. The modelling study has shown that planned river quality can be maintained if consents are tightened (to the ‘best effluent quality’ standard) and flows are transferred from Basingstoke to Sherborne and Sherfield. The catchment cannot sustain further effluent inputs beyond the year 2011 projections without further reductions in the consented quality of the discharges.
5. A Total Ammonia consent of less than 1.0 (as a 95 %ile) is required to meet river quality objectives on the Loddon if future flows are routed through Basingstoke (rather than transferred to Sherborne and Sherfield)
6. The SIMCAT model may be used to examine further scenarios.
Appendix A contains model results
Appendix B contains the SIMCAT data file.
Appendix C presents an examination of the Total Ammonia data of Basingstoke STW finaleffluent.
WRc Ref: UC 3330/11659-0September 1999
47

Environment Agency - Thames Region
WRc Ref: UC 3330/11659-0 48September 1999

Environment Agency - Thames Region
APPENDIX A MODEL RESULTS
A1 SIMCAT PREDICTED RIVER QUALITY FOR CURRENT SITUATION
Reach Feature BODMean
BODP90
BODP95
BODP99
AmmMean
AmmP90
AmmP95
AmmP99
DOMean
DOP90
DOP95
DOP99
Upper Loddon Head of Loddon B1 0.97 1.76 2.12 3.35 0.08 0.15 0.18 0.26 9.74 8.25 7.89 7.21Upper Loddon Basingstoke STW B2 1.35 2.39 2.96 5.18 0.21 0.44 0.69 1.50 8.66 7.58 7.26 6.73Upper Loddon Keepers Cottage B3 1.09 1.93 2.34 3.61 0.12 0.36 0.43 0.80 10.48 8.84 8.25 7.52Upper Loddon Blacklands Loop 1.05 1.86 2.33 3.35 0.10 0.24 0.30 0.51 10.03 8.76 8.36 7.76Upper Loddon Lyde B13/14 1.09 2.06 2.57 4.30 0.08 0.18 0.21 0.32 10.31 8.78 8.25 7.41Upper Loddon Long Bridge B4 1.09 2.15 2.70 4.68 0.07 0.15 0.18 0.28 10.60 8.72 8.18 7.10Upper Loddon End of reach Upper Loddon 1.17 2.18 2.78 4.84 0.06 0.14 0.17 0.25 10.61 8.72 8.14 6.95Vyne Stream Head of Vyne Stream B6 1.99 4.70 6.58 14.63 0.06 0.17 0.24 0.53 10.06 8.58 8.21 7.54Vyne Stream Sherborne STW B7 2.21 4.40 6.13 11.75 0.13 0.22 0.27 0.42 9.64 8.55 8.30 7.72Vyne Stream Vyne Stream d/s Vyne B8 3.08 6.90 9.03 18.01 0.06 0.12 0.14 0.20 10.22 8.41 7.74 6.95Vyne Stream Natural flow estimate 3.52 8.08 10.55 19.24 0.07 0.13 0.15 0.22 9.99 7.50 6.68 5.39Vyne Stream Bow Brook B9 2.69 5.62 7.41 12.10 0.05 0.08 0.10 0.15 9.55 7.87 7.45 6.52Vyne Stream Locks Bridge B10 2.73 5.83 7.74 13.33 0.05 0.09 0.10 0.16 9.65 7.89 7.50 6.44Vyne Stream Bow Bridge B12 3.03 7.14 9.44 19.63 0.05 0.12 0.14 0.22 10.27 7.28 6.42 4.70Vyne Stream Sherfield STW B15 3.29 7.05 9.21 18.10 0.27 0.56 0.75 1.08 9.59 7.24 6.38 4.66Vyne Stream Natural flow estimate 3.28 7.03 9.22 18.14 0.26 0.55 0.73 1.05 9.62 7.24 6.37 4.60Vyne Stream End of reach Vyne Stream 3.27 7.01 9.18 18.18 0.25 0.53 0.70 1.02 9.64 7.23 6.32 4.55Lower Loddon Start of reach Lower
Loddon1.50 2.64 3.34 5.55 0.09 0.16 0.20 0.28 10.46 8.48 7.94 6.94
Lower Loddon Kingsbridge B5 1.47 2.64 3.21 5.02 0.07 0.18 0.22 0.37 9.86 7.93 7.38 6.27Lower Loddon Sheep Bridge Gauge 1.47 2.62 3.17 4.97 0.07 0.18 0.22 0.36 9.88 7.99 7.47 6.40Lower Loddon End of reach Lower Loddon 1.48 2.62 3.17 4.96 0.07 0.18 0.22 0.36 9.89 8.01 7.49 6.42
WRc Ref: UC 3330/11659-0September 1999
49
Environment Agency - Thames Region
A2 SIMCAT PREDICTED RIVER QUALITY FOR CURRENT CONSENTS
Reach Feature BODMean
BODP90
BODP95
BODP99
AmmMean
AmmP90
AmmP95
AmmP99
DOMean
DOP90
DOP95
DOP99
Upper Loddon Head of Loddon B1 0.97 1.76 2.12 3.35 0.08 0.15 0.18 0.26 9.74 8.25 7.89 7.21Upper Loddon Basingstoke STW B2 2.11 3.97 5.17 9.76 0.31 0.69 1.09 2.41 8.66 7.58 7.26 6.73Upper Loddon Keepers Cottage B3 1.66 3.20 4.06 6.71 0.18 0.55 0.69 1.28 10.43 8.76 8.22 7.48Upper Loddon Blacklands Loop 1.34 2.46 3.21 4.94 0.13 0.34 0.42 0.75 10.00 8.72 8.29 7.75Upper Loddon Lyde B13/14 1.26 2.47 3.11 5.04 0.10 0.23 0.27 0.46 10.27 8.75 8.22 7.32Upper Loddon Long Bridge B4 1.23 2.47 3.15 5.30 0.08 0.19 0.23 0.38 10.56 8.65 8.09 6.94Upper Loddon End of reach Upper Loddon 1.29 2.47 3.17 5.43 0.07 0.16 0.21 0.33 10.57 8.66 8.01 6.88Vyne Stream Head of Vyne Stream B6 1.99 4.70 6.56 14.63 0.06 0.17 0.24 0.53 10.06 8.58 8.21 7.54Vyne Stream Sherborne STW B7 2.88 5.42 7.10 11.43 1.64 2.80 3.36 4.79 9.58 8.51 8.28 7.73Vyne Stream Vyne Stream d/s Vyne B8 3.45 7.09 9.31 17.39 0.70 1.32 1.66 2.36 10.10 8.36 7.79 6.95Vyne Stream Natural flow estimate 3.81 8.22 10.65 18.73 0.62 1.17 1.48 2.10 9.91 7.53 6.74 5.42Vyne Stream Bow Brook B9 2.83 5.73 7.43 12.06 0.26 0.56 0.78 1.27 9.53 7.67 7.45 6.57Vyne Stream Locks Bridge B10 2.85 5.92 7.75 13.26 0.24 0.50 0.72 1.16 9.62 7.90 7.52 6.45Vyne Stream Bow Bridge B12 3.08 7.13 9.40 19.41 0.14 0.30 0.44 0.72 10.23 7.28 6.44 4.73Vyne Stream Sherfield STW B15 3.79 7.81 9.81 19.10 0.32 0.68 0.87 1.34 9.74 7.25 6.38 4.65Vyne Stream Natural flow estimate 3.77 7.71 9.80 19.12 0.31 0.66 0.83 1.30 9.75 7.25 6.35 4.59Vyne Stream End of reach Vyne Stream 3.74 7.66 9.79 19.14 0.30 0.64 0.81 1.27 9.76 7.22 6.31 4.53Lower Loddon Start of reach Lower
Loddon1.66 2.91 3.80 5.64 0.10 0.19 0.24 0.36 10.44 8.45 7.87 6.86
Lower Loddon Kingsbridge B5 1.53 2.73 3.34 5.05 0.07 0.19 0.23 0.39 9.83 7.87 7.36 6.19Lower Loddon Sheep Bridge Gauge 1.53 2.71 3.31 5.00 0.07 0.19 0.23 0.39 9.85 7.95 7.44 6.29Lower Loddon End of reach Lower Loddon 1.53 2.70 3.30 4.99 0.07 0.19 0.23 0.39 9.86 7.96 7.46 6.32
WRc Ref: UC 3330/11659-0September 1999
50
Environment Agency - Thames Region
A3 SIMCAT PREDICTED RIVER QUALITY AT REVISED (for Sherfield) CONSENTS
Reach Feature BODMean
BODP90
BODP95
BODP99
AmmMean
AmmP90
Amm Amm P95 P99
DOMean
DOP90
DOP95
DOP99
Upper Loddon Head of Loddon B1 0.97 1.76 2.12 3.35 0.08 0.15 0.18 0.26 9.74 8.25 7.89 7.21Upper Loddon Basingstoke STW B2 2.11 3.97 5.17 9.78 0.31 0.69 1.09 2.41 8.66 7.58 7.26 6.73Upper Loddon Keepers Cottage B3 1.66 3.20 4.06 6.71 0.18 0.55 0.69 1.28 10.43 8.76 8.22 7.48Upper Loddon Blacklands Loop 1.34 2.48 3.21 4.94 0.13 0.34 0.42 0.75 10.00 8.72 8.29 7.75Upper Loddon Lyde B13/14 1.26 2.47 3.11 5.04 0.10 0,23 0.27 0.46 10.27 8.75 8.22 7.32Upper Loddon Long Bridge B4 1.23 2.47 3.15 5.30 0.08 0.19 0.23 0.38 10.56 8.65 8.09 6.94Upper Loddon End of reach Upper Loddon 1.29 2.47 3.17 5.43 0.07 0.16 0.21 0.33 10.57 8.66 8.01 6.88Vyne Stream Head of Vyne Stream B0 1.99 4.70 6.56 14.63 0.06 0.17 0.24 0.53 10.06 8.58 8.21 7.54Vyne Stream Sherborne STW B7 2.88 5.42 7.10 11.43 1.64 2.80 3.36 4.79 9.58 8.51 8.28 7.73Vyne Stream Vyne Stream d/s Vyne B8 3.45 7.09 9.31 17.39 0.70 1.32 1.66 2.36 10.10 8.36 7.79 6.95Vyne Stream Natural flow estimate 3.81 8.22 10.65 18.73 0.62 1.17 1.48 2.10 9.91 7.53 8.74 5.42Vyne Stream Bow Brook B9 2.83 5.73 7.43 12.06 0.26 0.56 0.78 1.27 9.53 7.87 7.45 6.57Vyne Stream Locks Bridge B10 2.85 5.92 7.75 13.26 0.24 0.50 0.72 1.16 9.62 7.90 7.52 8.45Vyne Stream Bow Bridge B12 3.08 7.13 9.40 19.41 0.14 0,30 0.44 0.72 10.23 7.28 6.44 4.73Vyne Stream Sherfield STW B15 3.78 7.70 9.55 18.30 0.33 0.68 0.87 1.46 9.59 7.25 6.39 4.70Vyne Stream Natural flow estimate 3.75 7.64 9.54 18.33 0.32 0.66 0.84 1.42 9.61 7.26 6.37 4.64Vyne Stream End of reach Vyne Stream 3.73 7.62 9.53 18.35 0.31 0.64 0.81 1.38 9.63 7.24 6.34 4.58Lower Loddon Start of reach Lower
Loddon1.67 2.91 3.79 5.63 0.10 0.20 0.25 0.38 10.42 8.45 7.86 6.86
Lower Loddon Kingsbridge B5 1.53 2.72 3.33 5.03 0.07 0.19 0.23 0.39 9.83 7.87 7.36 6.21Lower Loddon Sheep Bridge Gauge 1.53 2.70 3.30 4.98 0.07 0.19 0.23 0.38 9.85 7.95 7.45 8.30Lower Loddon End of reach Lower Loddon 1.53 2.70 3.30 4.97 0.07 0.19 0.23 0.38 9.86 7.97 7.47 6.33
WRc Ref: UC 3330/11659*0September 1999
51

Environment Agency - Thames Region
A4 SIMCAT PREDICTED RIVER QUALITY IN 2001
Reach Feature BODMean
BODP90
BODP95
BODP99
AmmMean
AmmP90
AmmP95
AmmP99
DOMean
DOP90
DOP95
DOP99
Upper Loddon Head of Loddon B1 0.97 1.76 2.12 3.35 0.08 0.15 0.18 0.26 9.74 8.25 7.89 7.21Upper Loddon Basingstoke STW B2 1.74 3.18 4.02 7.56 0.27 0.60 0.93 2.04 8.74 7.65 7.37 6.83Upper Loddon Keepers Cottage B3 1.38 2.54 3.14 5.13 0.16 0.48 0.59 1.09 10.59 8.89 8.28 7.54Upper Loddon Blacklands Loop 1.19 2.15 2.76 4.18 0.12 0.30 0.37 0.65 10.04 8.78 8.36 7.80Upper Loddon Lyde B13/14 1.18 2.23 2.82 4.73 0.09 0.21 0.24 0.40 10.30 8.75 8.22 7.32Upper Loddon Long Bridge B4 1.16 2.32 2.93 5.05 0.08 0.17 0.21 0.34 10.59 8.67 8.13 6.90Upper Loddon End of reach Upper Loddon 1.23 2.33 2.99 5.21 0.07 0.15 0.19 0.30 10.59 8.68 8.04 6.84Vyne Stream Head of Vyne Stream B6 1.99 4.70 6.56 14.63 0.06 0.17 0.24 0.53 10.06 8.58 8.21 7.54Vyne Stream Sherborne STW B7 2.92 5.42 7.04 11.21 0.49 0.81 1.00 1.33 9.56 8.50 8.26 7.69Vyne Stream Vyne Stream d/s Vyne B8 3.45 7.00 9.23 17.07 0.22 0.39 0.49 0.66 10.07 8.37 7.83 7.01Vyne Stream Natural flow estimate 3.80 8.10 10.45 18.39 0.20 0.36 0.45 0.61 9.90 7.56 6.78 5.45Vyne Stream Bow Brook B9 2.83 5.72 7.38 11.99 0.10 0.19 0.26 0.40 9.53 7.87 7.47 6.59Vyne Stream Locks Bridge B10 2.85 5.89 7.71 13.23 0.09 0.18 0.24 0.39 9.62 7.91 7.53 6.46Vyne Stream Bow Bridge B12 3.07 7.09 9.36 19.29 0.07 0.16 0.20 0.32 10.23 7.29 6.44 4.76Vyne Stream Sherfield STW B15 3.84 7.45 8.95 15.80 0.35 0.68 0.88 1.49 9.17 7.21 6.45 4.87Vyne Stream Natural flow estimate 3.81 7.39 8.93 15.83 0.34 0.66 0.85 1.45 9.21 7.22 6.45 4.83Vyne Stream End of reach Vyne Stream 3.78 7.34 8.91 15.87 0.33 0.64 0.81 1.41 9.24 7.25 6.43 4.79Lower Loddon Start of reach Lower
Loddon1.68 2.92 3.64 5.64 0.11 0.20 0.26 0.38 10.36 8.39 7.85 6.86
Lower Loddon Kingsbridge B5 1.53 2.71 3.30 5.03 0.08 0.19 0.23 0.38 9.83 7.89 7.37 6.26Lower Loddon Sheep Bridge Gauge 1.53 2.68 3.26 4.98 0.07 0.19 0.23 0.38 9.86 7.96 7.45 6.35Lower Loddon End of reach Lower Loddon 1.53 2.68 3.25 4.97 0.07 0.19 0.23 0.38 9.86 7.98 7.47 6.36
WRc Ref: UC 3330/11659-0September 1999
52

Environment Agency - Thames Region
A5 SIMCAT PREDICTED RIVER QUALITY IN 2006
Reach Feature BODMean
BODP90
BODP95
BODP99
AmmMean
AmmP90
AmmP95
AmmP99
DOMean
DOP90
DOP95
DOP99
Upper Loddon Head of Loddon B1 0.97 1.76 2.12 3.35 0.08 0.15 0.18 0.26 9.74 8.25 7.89 7.21Upper Loddon Basingstoke STW B2 1.74 3.18 4.02 7.56 0.27 0.60 0.93 2.04 8.74 7.65 7.37 6.83Upper Loddon Keepers Cottage B3 1.38 2.54 3.14 5.13 0.16 0.48 0.59 1.09 10.59 8.89 8.28 7.54Upper Loddon Blacklands Loop 1.19 2.15 2.76 4.18 0.12 0.30 0.37 0.65 10.04 8.78 8.36 7.80Upper Loddon Lyde B13/14 1.18 2.23 2.82 4.73 0.09 0.21 0.24 0.40 10.30 8.75 8.22 7.32Upper Loddon Long Bridge B4 1.16 2.32 2.93 5.05 0.08 0.17 0.21 0.34 10.59 8.67 8.13 6.90Upper Loddon End of reach Upper Loddon 1.23 2.33 2.99 5.21 0.07 0.15 0.19 0.30 10.59 8.68 8.04 6.84Vyne Stream Head of Vyne Stream B6 1.99 4.70 6.56 14.63 0.06 0.17 0.24 0.53 10.06 8.58 8.21 7.54Vyne Stream Sherborne STW B7 2.92 5.43 7.04 11.21 0.49 0.81 1.00 1.33 9.56 8.50 8.26 7.69Vyne Stream Vyne Stream d/s Vyne B8 3.45 7.00 9.23 17.07 0.22 0.39 0.49 0.66 10.07 8.37 7.83 7.01Vyne Stream Natural flow estimate 3.80 8,10 10.45 18.39 0.20 0.36 0.45 0.61 9.90 7.56 6.78 5.45Vyne Stream Bow Brook B9 2.83 5.72 7.38 11.99 0.10 0.19 0.26 0.40 9.53 7.87 7.47 6.59Vyne Stream Locks Bridge B10 2.85 5.89 7.71 13.23 0.09 0.18 0.24 0.39 9.62 7.91 7.53 6.46Vyne Stream Bow Bridge B12 3.07 7.09 9.36 19.29 0.07 0.16 0.20 0.32 10.23 7.29 6.44 4.76Vyne Stream Sherfield STW B15 3.85 7.20 8.85 14.89. 0.36 0.68 0.89 1.46 9.02 7.18 6.52 4.94Vyne Stream Natural flow estimate 3.82 7.18 8.83 14.92 0.35 0.66 0.85 1.42 9.07 7.21 6.47 4.90Vyne Stream End of reach Vyne Stream 3.78 7.12 8.82 14.96 0.33 0.64 0.83 1.39 9.11 7.22 6.46 4.87Lower Loddon Start of reach Lower
Loddon1.71 2.94 3.66 5.62 0.11 0.21 0.27 0.40 10.33 8.37 7.85 6.86
Lower Loddon Kingsbridge B5 1.54 2.71 3.29 5.00 0.08 0.19 0.23 0.38 9.84 7.90 7.38 6.28Lower Loddon Sheep Bridge Gauge 1.54 2.68 3.25 4.95 0.07 0.19 0.22 0.37 9.86 7.98 7.47 6.37Lower Loddon End of reach Lower Loddon 1.54 2.68 3.25 4.94 0.07 0.19 0.22 0.37 9.86 7.99 7.49 6.38
WRc Ref: UC 3330/11659-0September 1999
53
Environment Agency - Thames Region
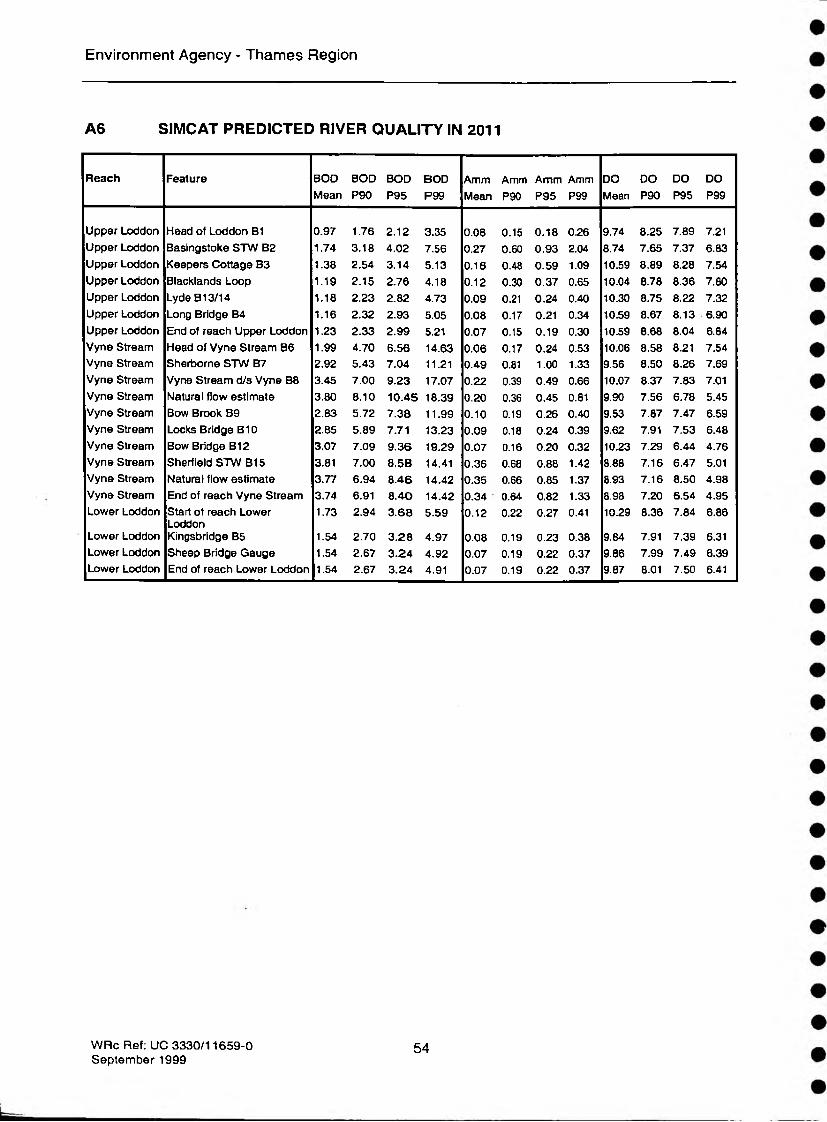
A6 SIMCAT PREDICTED RIVER QUALITY IN 2011
Reach Feature BODMean
BODP90
BODP95
BODP99
AmmMean
AmmP90
AmmP95
AmmP99
DOMean
DOP90
DOP95
DOP99
Upper Loddon Head of Loddon B1 0.97 1.76 2.12 3.35 0.08 0.15 0.18 0.26 9.74 8.25 7.89 7.21Upper Loddon Basingstoke STW B2 1.74 3.18 4.02 7.56 0.27 0.60 0.93 2.04 8.74 7.65 7.37 6.83Upper Loddon Keepers Cottage B3 1.38 2.54 3.14 5.13 0.16 0.48 0.59 1.09 10.59 8.89 8.28 7.54Upper Loddon Blacklands Loop 1.19 2.15 2.76 4.18 0.12 0.30 0.37 0.65 10.04 8.78 8.36 7.80Upper Loddon Lyde B13/14 1.18 2.23 2.82 4.73 0.09 0.21 0.24 0.40 10.30 8.75 8.22 7.32Upper Loddon Long Bridge B4 1.16 2.32 2.93 5.05 0.08 0.17 0.21 0.34 10.59 8.67 8.13 6.90Upper Loddon End of reach Upper Loddon 1.23 2.33 2.99 5.21 0.07 0.15 0.19 0.30 10.59 8.68 8.04 6.84Vyne Stream Head of Vyne Stream B6 1.99 4.70 6.56 14.63 0.06 0.17 0.24 0.53 10.06 8.58 8.21 7.54Vyne Stream Sherborne STW B7 2.92 5.43 7.04 11.21 0.49 0.81 1.00 1.33 9.56 8.50 8.26 7.69Vyne Stream Vyne Stream d/s Vyne B8 3.45 7.00 9.23 17.07 0.22 0.39 0.49 0.66 10.07 8.37 7.83 7.01Vyne Stream Natural flow estimate 3.80 8.10 10.45 18.39 0.20 0.36 0.45 0.81 9.90 7.56 6.78 5.45Vyne Stream Bow Brook B9 2.83 5.72 7.38 11.99 0.10 0.19 0.26 0.40 9.53 7.87 7.47 6.59Vyne Stream Locks Bridge B10 2.85 5.89 7.71 13.23 0.09 0.18 0.24 0.39 9.62 7.91 7.53 6.48Vyne Stream Bow Bridge B12 3.07 7.09 9.36 19.29 0.07 0.16 0.20 0.32 10.23 7.29 6.44 4.76Vyne Stream Sherfield STW B15 3.81 7.00 8.5B 14.41 0.36 0.68 0.88 1.42 8.88 7.16 6.47 5.01Vyne Stream Natural flow estimate 3.77 6.94 8.46 14.42 0.35 0.66 0.85 1.37 8.93 7.16 8.50 4.98Vyne Stream End of reach Vyne Stream 3.74 6.91 8.40 14.42 0.34 0.64 0.82 1.33 8.98 7.20 6.54 4.95Lower Loddon Start of reach Lower
Loddon1.73 2.94 3.68 5.59 0.12 0.22 0.27 0.41 10.29 8.36 7.84 6.86
Lower Loddon Kingsbridge B5 1.54 2.70 3.28 4.97 0.08 0.19 0.23 0.38 9.84 7.91 7.39 6.31Lower Loddon Sheep Bridge Gauge 1.54 2.67 3.24 4.92 0.07 0.19 0.22 0.37 9.86 7.99 7.49 6.39Lower Loddon End of reach Lower Loddon 1.54 2.67 3.24 4.91 0.07 0.19 0.22 0.37 9.87 8.01 7.50 6.41
WRc Ref: UC 3330/11659-0September 1999
54

Environment Agency - Thames Region
APPENDIX B SIMCAT MODEL DATAFILE
SIMCAT data file: B_febl9.Dat Created by E Gill on 19/02/99data analysed using PSI tools for the period 1995-1998 unless specified otherwiseLines beginning with '====' are notes explaining the data. These notes are not used by SIMCAT and may be removed from the data-file if not needed....
The following sets of data (Data-Sets) are required:la) General;tb] Determinands; =Ic) Reaches; =Ed) River Flow; =[e] River Quality; =[f] Effluent Flow & Quality; =Ih) River Quality Targets;[i] Intermittent Discharges,- -[J 3 Features. =
For sets [d],[e] and [f] extra data will need to be appended if the more unusual distributions are selected.In the following notes the term, River Chemistry, refers to the effect of the fixed set of Rate Constants defined below in the Data-Sets for Determinands and Reaches. These can be used with the equations written into SIMCAT to model changes in river quality.Additionally, or alternatively, changes in river quality are handled by Auto-Calibration (AC).
A descriptive title follows...
Thames Basingstoke[a] GeneralThe next 3 variables can be zero or 1
0 set to 1 to exclude confidence limits from output;1 set to 1 to exclude tables of input data;0 set to 1 to exclude output for non-effluent features;
======= In Mean Mode the calculated values of the mean river quality======== will be output to the screen and the River Targets entered ======== as Set [h] are taken as averages.... ======== in 95-percentile Mode the calculated values of ======== 95-percentileswill be output to the screen and the River ======== Targets (Set [h]) will be taken as 95-percentiles.... ======== In 90-percentile Mode the calculated values of ======== 90-percentileswill be output to the screen and the River ======== Targets (Set [h]) will be taken as 90-percentiles.... =
====== set to 1 for mean mode, zero for 95-percentile mode; or =2 2 for 90-percentile mode; or 3 for 99-percentile mode =
1000 number of shots (minimum is 5; maximum is 2500); =11.2 mean temperature of river water. ='Ml/d' units for river and effluent flow (4 characters in quotes) =
1 set to 1 to insert Diffuse Sources; =1 set to 1 to include River Chemistry; =0 set to 1 for Auto-Interpolation. =
WRc Ref: UC 3330/11659-0September 1999
55
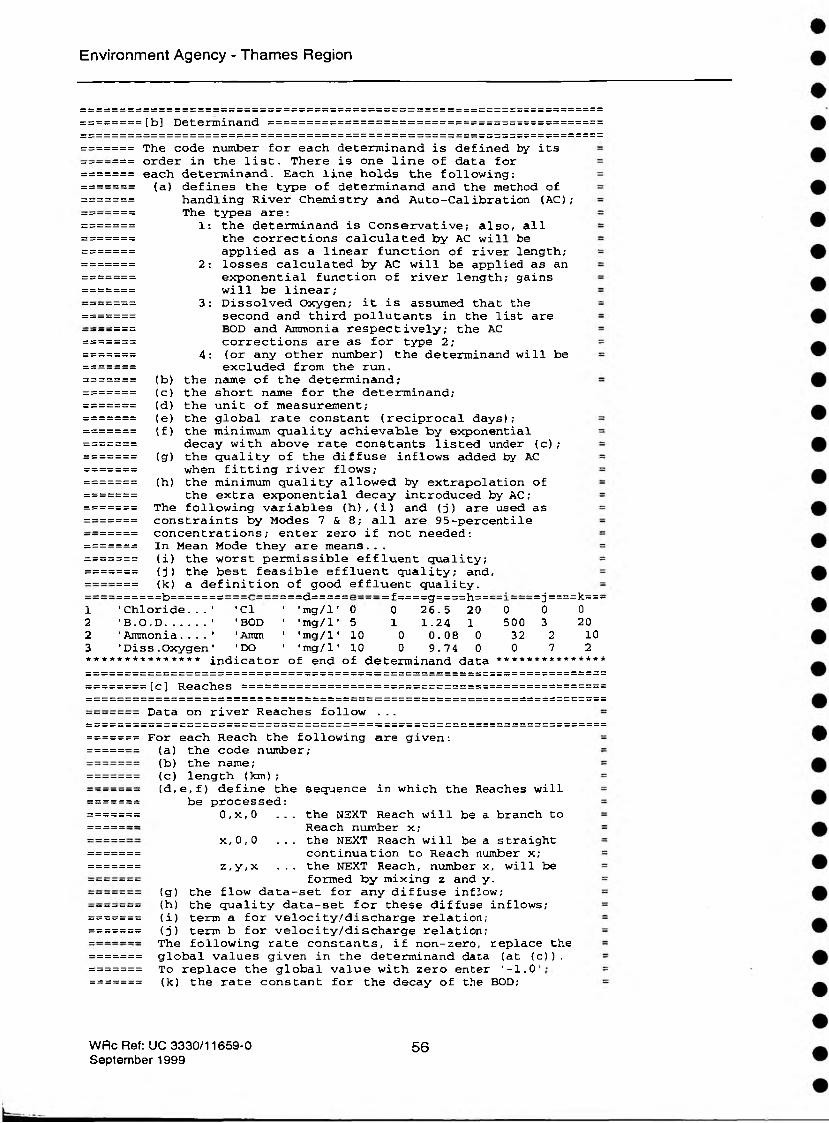
Environment Agency - Thames Region
[b] Determinand
=== The code number for each determinand is defined by its=== order in the list. There is one line of data for=== each determinand. Each line holds the following:=== (a) defines the type of determinand and the method of=== handling River Chemistry and Auto-Calibration (AC);
=== The types are:=== 1: the determinand is Conservative; also, all=== the corrections calculated by AC will be==== applied as a linear function of river length;:=== 2: losses calculated by AC will be applied as an===== exponential function of river length; gains:=== will be linear;:=== 3: Dissolved Oxygen; it is assumed that the==== second and third pollutants in the list are==== BOD and Ammonia respectively; the AC:=== corrections are as for type 2;===== 4: (or any other number) the determinand will be==== excluded from the run.==== (b) the name of the determinand;:=== (c) the short name for the determinand;==== (d) the unit of measurement;:=== (e) the global rate constant (reciprocal days) ;-=== If) the minimum quality achievable by exponential==== decay with above rate constants listed under (c) ;==== (g) the quality of the diffuse inflows added by AC:=== when fitting river flows;==== (h) the minimum quality allowed by extrapolation of==== the extra exponential decay introduced by AC ;
The following variables (h),(i) and (j) are used as==== constraints by Modes 7 & 8; all are 95-percentile==== concentrations; enter zero if not needed:---= in Mean Mode they are means...==== (i) the worst permissible effluent quality;===== (j) the best feasible effluent quality; and,==== (k) a definition of good effluent quality.:------------ b ------------ -- =--- d -------- : - f - - ==g=====h=== = j==== - k = = =
1 ’ C h l o r i d e . . . ' ' C l ' ' mg/ 1 ' 0 0 2 6 . 5 20 0 0 02 ' B . O . D ..............' ' BOD ' ' m g / l ' 5 1 1 . 2 4 1 500 3 202 ' Ammonia. . . . ' 1 Amm 1 ' mg/ 1 1 10 0 0 . 0 8 0 32 2 103 ‘ D i s s . O x y g e n ’ 'DO ' 'mg/l' 10 0 9.74 0 0 7 2****** + + -*-*-** + + * indicator of end of determinand data ***************
[c] Reaches
Data on river Reaches follow . . .
For each Reach the following are given:(a) the code number;(b) the name;(c) length (km);(d,e,f) define the sequence in which the Reaches will
be processed:0,x,0 ... the NEXT Reach will be a branch to
Reach number x; x,0,0 ... the NEXT Reach will be a straight
continuation to Reach number x; z,y,x ... the NEXT Reach, number x, will be
formed by mixing z and y.(g) the flow data-set for any diffuse inflow;(h) the quality data-set for these diffuse inflows;(i) term a for velocity/discharge relation;(j) term b for velocity/discharge relation;The following rate constants, if non-zero, replace the global values given in the determinand data (at (c)). To replace the global value with zero enter ‘-1.0 (k) the rate constant for the decay of the BOD;
WRc Ref: UC 3330/11659-0September 1999
56

Environment Agency - Thames Region
(1) the reaeration constant for Dissolved Oxygen; (m) the rate constant for the loss of Ammonia.
1 'Upper Loddon *7.4 0 2 0 8 12 1 1 0 0 02 'Vyne Stream ’ 8.9 1 2 3 8 12 1 1 0 0 03 'Lower Loddon • 10.0 0 0 0 8 12 1 1 0 0 0
indicator of end of Reach data *******************[d] River Flow
The River Flow Data-Sets follow:One line for each data-set: For each line:(a) the code number of the data-set;(b) the code number of type of distribution:
for Feature types 7 and 9: zero,. 1 or 2;0 - constant, uniform flow;1 - flow follows the Normal Distribution;2 - the Log-Normal Distribution;3 - a Three-Parameter Log-Normal Distribution4 - non-parametric distributions.
(c) the mean flow; except when used by:Feature Type 7 (abstractions): the abstracted flow; Feature Type 9 (river regulation): zero; Distribution Type 3: mean of transformed data
(d) the 95-percentile low flow: except when used by: Feature Type 7 (abstractions): the Hands-Off Flow; Feature Type 9 (river regulation): the Maintained Flow
(e) the shift parameter for distribution types 3: for Distribution Type 0, 1, 2: zero or blank; for Distribution Type 3:
negative; log(flow-shift) is Normal; positive; log(flow+shift) is Normal,-
(f) reserved for non-standard correlation coefficient(g) the name of the site (this is used only for
identification. It is not needed by SIMCAT).
1 2 37 .1 13 .0 0 -9 .9 ’Pyotts Bridge flow es1 2 45.0 15. 8 0 -9 . 9 'WRc estimate
1 3 37 .30 17 .7 6.7 -9 9 1Pyotts Bridge LHS (95-98) 12 2 23.95 6.38 0 -9 9 1Lyde 13 2 3 .68 1.27 0 -9 9 ‘Head of Vyne Stream 14 2 10.72 1.89 0 -9 9 'Vyne Stream est. 15 2 18.51 2.84 0 -9 9 'Bow Brook '6 2 34.37 4.64 0 -9 9 ‘Bow Brook est. '7 3 183.00 85.30 76.6 -9 9 'SheepBridge Gauge (95-98) 18 2 0 .49 0.25 0 -9 9 'diffuse flow for calibration'9 3 55.60 30.70 23.0 -9 9 'Blacklands Loop (95-98) '* ■* ** + * * * *
1 +
| *
1 *
1 «
i +
i +
i * i *
i indicator Of end of river flow data **************
[e] River Quality-River Quality Data-Sets follow. For each Data-Set there is a line of data for each determinand.For each line the following items are required:(a) the code number of the data-set;(b) the code number for the determinand;(c) the code number of type of distribution:
for Feature types 7 and 9: zero, 1 or 2;0 - constant, uniform flow;1 - flow follows the Normal Distribution;2 - the Log-Normal Distribution;3 - a Three-Parameter Log-Normal Distribution;4 - non-parametric distributions.
(d) the mean concentration;(e) the standard deviation;(f) the shift parameter for distribution types 3:
for Distribution Type 0, 1 or 2: zero or blank; for Distribution Type 3:
negative; log(flow-shift) is Normal;
WRc Ref: UC 3330/11659-0 57September 1999

Environment Agency - Thames Region
positive; log(flow+shift) is Normal;(g) reserved for non-standard correlation coefficient
(h) number of samples used to compute the mean;(i) the name of the site (this is used for
identification. It is not needed by SIMCAT).=c=====d======e=====f=======g======h================i:
1 1 2 26 .51 2 .46 0 -9.9 57 'Pyotts Bridge B1 '1 2 2 0 .97 0.62 0 -9.9 581 3 2 0.,08 0.05 0 -9.9 581 4 2 9.,74 1.22 0 -9.9 572 1 1 62 .,81 16.00 0 -9.9 59 ’Keepers Cottage B3 '2 2 2 1.,09 0 .66 0 -9.9 592 3 2 0 .,12 0 .24 0 -9.9 612 4 2 10 .,48 1.35 0 -9.9 553 1 2 22 .,50 5 .13 0 -9.9 56 'Deanland Farm B13/14 *3 2 2 1 .,09 0.58 0 -9 . 9 543 3 2 0 .,10 0. 06 0 -9.9 563 4 2 10 ..09 1.28 0 -9.9 554 1 1 42 ..57 7.50 0 -9.9 56 'Long Bridge B4 14 2 2 1..09 0.87 0 -9.9 564 3 2 0 .,07 0.06 0 -9.9 574 4 1 10..60 1.47 0 -9.9 56= = === = 1989-1996 data has been used for dataset 5 (B6) = tiitiintiiiiinniinniiiiniiiiiin
5 1 2 30 ..47 26 .07 0 -9.9 30 'HW Vyne Stream B65 2 2 1,.98 2 .66 0 -9.9 295 3 2 0 ,.06 0. 10 0 -9.9 305 4 2 10 ..06 1.21 0 -9.9 286 1 2 49 ..06 19 .55 0 -9.9 45 'Vyne Stream d/s Vyne B8'6 2 2 3 .,08 3 .44 0 -9.9 456 3 2 0 ..06 0.04 0 -9.9 456 4 2 10..22 1.51 0 -9.9 43= = === = 1989-1992 data has been used for dataset 8 (B9) = itiiiiitiiniiiiiiitiiiiiiiititiiitin
8 1 2 40. .25 10 .0 7 0 - 9 . 9 8 'HW Bow Brook B9 '8 2 2 2 .1 2 . 12 0 - 9 . 9 88 3 2 0 ,.03 0 . 01 0 - 9 . 9 88 4 1 9 ,.04 1 . 5 5 0 - 9 . 9 7=== === 1 9 8 9 - 1 9 9 2 data has been used for dataset 9 (BIO) iiliiiiiitiititiiiiinniiiiiiniiItll
9 1 2 56,.75 9.19 0 -9.9 8 'Locks Bridge B10 '9 2 2 3 .28 2 .52 0 -9.9 89 3 2 0 .04 0.03 0 -9.9 89 4 1 8 .82 1.44 0 -9.9 610 1 2 49 .02 17 . 50 0 -9.9 46 'Bow Bridge B12 '10 2 2 3 .03 3 .89 0 -9.9 4410 3 2 0 .05 0.05 0 -9.9 4610 4 1 10 .27 2 . 34 0 -9.9 4511 1 2 45 .07 7 .46 0 -9.9 46 'Kingsbridge B5 '11 2 2 1 .47 0. 92 0 -9.9 4511 3 2 0 .07 0.09 0 -9.9 4611 4 1 9 .86 1. 51 0 -9.9 4712 1 2 26 .51 2 .46 0 -9.9 57 'diffuse flow (Bl) '12 2 2 0 . 97 0 . 62 0 -9.9 5812 3 2 0 .08 0.05 0 -9.9 5812 4 2 9 .74 1.22 0 -9.9 57
* indicator of end of river quality data
[f] Effluent Flow & Quality
======= Effluent Flow and Quality Data-Sets follow. For each======= Data-Set there is a line for the flow and a line for======= each determinand in turn:======= For each line the following are entered:======= (a) the code number of the data-set;======= (this will be referred to in the Feature Data)======= (b) the code number for the determinand;======= (c) the code number of type of distribution:======= for Feature types 7 and 9: zero, 1 or 2;======= 0 - constant, uniform flow;= = = = = = = 1 - flow follows the Normal Distribution;
WRc Ref: UC 3330/11659-0September 1999
58

Environment Agency - Thames Region
{d}(e)(f>
(g)
2 - the Log-Normal Distribution;3 - a Three-Parameter Log-Normal Distribution;4 - non-parametric distributions,
the mean value;the standard deviation;the shift parameter for distribution types 3: for Distribution Type 0, 1 or 2: zero or blank; for Distribution Type 3:
negative; log(flow-shift) is Normal; positive; log(flow+shift) is Normal;
reserved for non-standard correlation coefficient
======= (h) number of samples used to compute the mean; ======== (i) the name of the discharge (this is used for ======== identification. It is not needed by SIMCAT). ===========c=====d======e=====f=======g======h================i============================ca1ibration data - current flow and quality===============
'Basingstoke STW:-l 0 3 27 .6 4..5 21..6 -9..9 541
:-l 1 1 114.9 21..03 0 -9..9 149: = 1 2 2 1.80 1..93 0 -9..9 143:-1 3 2 0.36 0..60 0 -9,.9 152= -1 4 2 7.11 1..21 0 -9..9 80-2 0 3 1.4 0 .6 0,,6 -9,.9 497
= = 2 1 1 208.5 89,.34 0 -9,.9 44-2 2 2 2 .05 1,.10 0 -9..9 42
3 2 0.29 0,.10 0 -9..9 44-2 4 2 8.90 1..31 0 -9..9 18:=3 0 3 2.0 0,.4 0 .,9 -9..9 371:-3 1 2 108.3 18..44 0 -9..9 42:=3 2 2 4.98 2 ,.62 0 -9..9 42: = 3 3 1 2 .13 1..23 0 -9..9 43: = 3 4 2 7 .10 1..25 0 -9..9 18
Sherborne STW
Sherfield STW
= = — ̂ = — —— “ ~ ~ = = = = 2 0 0 1 situation ii ii li ll n ii ii ll ii n n li ii ii ii
IIlllll iiiiiitll11ntlitnlllllliiN
0 3 2 4 . 5 3 . 9 9 1 9 . 1 7 - 9 . 9 5 4 1 'Basingstoke STWi 1 1 1 4 . 9 2 1 . 0 3 0 - 9 . 9 1 4 92 2 2 . 7 8 2 . 9 8 0 - 9 . 9 1 4 33 2 0 . 5 3 0 . 8 8 0 - 9 - 9 1 5 24 2 7 . 1 1 1 . 2 1 0 - 9 . 9 80
2 0 3 2 . 0 0 . 8 6 0 . 8 6 - 9 . 9 4 9 7 'Sherborne STW2 1 1 2 0 8 . 5 8 9 . 3 4 0 - 9 - 9 442 2 2 3 . 9 7 2 .13 0 - 9 . 9 422 3 2 1.22 0.42 0 -9.9 442 4 2 8 .90 1.31 0 -9.9 18
= 3 0 3 5.83 1 . 17 2.62 -9.9 371 'Sherfield
108.3 18,. 44 0 -9.9 426.0 3 ..19 0 -9.9 421.26 0..76 0 -9.9 43
7.10 1..25 0 -9.9 18s i tua t
7. 65i on
i,.53 3 . 44 -9.9 371
108.3 18..44 0 -9.9 425.5 2..93 0 -9.9 42
1.08 0 .65 0 -9.9 437 .10 1 ..25 0 -9.9 18
== ===== iillllllii n ii it ii ii ii ii n to o K*
3 0 3 9.76 1.95 4.39 -9.9 3713 1 2 108.3 18.44 0 -9.9 423 2 , 2 5 .00 2 .66 0 -9.9 423 3 2 0.94 0.57 0 -9.9 433 4 2 7 .10 1.25 0 -9.9 18
Sherfield STW
Sherfield STW
************ indicator of end of effluent flow and quality data •**♦*
========[g} River Quality Targets ==================================
WRc Ref: UC 3330/11659-0September 1999
59

Environment Agency - Thames Region
— The data sets for River Quality Targets follow. There is === one line for each set containing: === (a) the code number cited in the Feature data; =;= The targets follow. These are 9 5-percentiles except in =;= Mean Mode when they are taken as averages: =;= {b) the target for the first determinand; =:= (c) as (b) for the second determinand; === (d) as (b) for the third determinand; === (e) as (b) for fourth determinand (Dissolved Oxygen); === (SIMCAT cannot compute automatically (under Option === 7 or 8) the discharge quality needed to achieve === Dissolved Oxygen targets). === Zero indicates that no target is to be applied. = :a=====b====c====d====e========================================1 0.0 4.0 0.6 0.02 0.0 6.0 1.3 0.0 == D/S Sherfield - No det3 0.0 7.7 0.68 0.0
r + + + + + + * indicator of end of data on river quality targets ****
========[i] Features
The Data-Sets for Features follow. There is one line for =each feature. Each line holds: =
(a) the name of the Feature; =(b) the code for the type of Feature; these are: =
1 - monitoring station; =2 - stream or tributary; =3 - sewage works or sewage discharge; =4 - river flow gauge; =5 - industrial effluent discharge; =6 - plotting point; =7 - abstraction (of flow); =8 - weir; =
(must be at head of Reach); =9 - river flow regulation point; =
(switched on only in Modes 3-8) =10 - upstream river boundary; =11 - bifurcation =
(must be at head of Reach); =13 - start point for diffuse pollution; =14 - end point for diffuse pollution; =
(river type) =15 - start point for diffuse pollution; =16 - end point for diffuse pollution; =
(effluent type) =(c) the code number of the Reach on which the =
Feature is located; =(d) distance from the head of the reach (km) ; =(e) the code number of the river flow Data-Set; =
(discharged from Feature Types 2 & 13) = (recorded at Feature Type 4) = (abstracted at Feature Type 7) =
(f) the code number for the river quality = Data-Set or the effluent flow/quality = Data-Set;(non-zero for Feature Types 2,3,5, = 13 &15);(data-set for quality produced by Weir; =
(g) the code number of any river flow Data-Set = to be fitted in Auto-Calibration; = Prefixing a minus sign will suppress = downstream extrapolation; =
Defining the Feature to be at the Head of a =Reach will suppress upstream interpolation. =In this way the Feature acts as a Quality =Adjustment Point and can model the effects =of unusual discharges. =
WRc Ref: UC 3330/11659-0September 1999
60

Environment Agency - Thames Region
(h) the code number for any river quality =Data-Set to be fitted by Auto-Calibration; =Prefixing a minus sign will suppress =downstream extrapolation; =For Feature Type 8: the code number for the =river quality Data-Set defining quality =downstream of the Weir =
Defining the Feature to be at the Head of a = Reach will suppress upstream interpolation. = In this way the Feature acts as a Flow =Adjustment Point and can model the effects of= unusual abstractions and discharges. =
(i) the code number for any Data-set of river quality targets.
'Head of Loddon Bl ' 10 1 0 0 1 1 0 0 0'Basingstoke STW B2 ' 3 1 0 1 0 1 0 0 0'Keepers Cottage B3 ' 1 1 1 0 0 2 0 2 0'Blacklands Loop ' 2 1 1 5 9 1 0 0 0'plotting pointl ' 6 1 4 7 0 0 0 0 0'Lyde B13/14 ' 2 1 4 7 2 3 0 0 0'Long Bridge B4 ' 1 1 6 3 0 4 0 4 0'Head of Vyne Stream B6 ' 10 2 0 0 3 5 0 0 0'Sherborne STW B7 ' 3 2 0 3 0 2 0 0 0’Vyne Stream d/s Vyne B8 ' 1 2 2 4 0 6 0 6 0'Natural flow estimate ' 4 2 3 0 4 0 0 0 0'Bow Brook B9 ' 2 2 3 5 5 8 0 0 0'Locks Bridge BIO ' 1 2 4 2 0 9 0 0 0'Bow Bridge B12 ' 1 2 8 1 0 10 0 10 0'Sherfield STW B15 ' 3 2 8 5 0 3 0 0 3'Natural flow estimate ' 4 2 8 7 6 0 0 0 0'plotting point 2 ' 6 3 0 3 0 0 0 0 0'plotting point 3 ' 6 3 2 5 0 0 0 0 0'plotting point 4 ' 6 3 5 0 0 0 0 0 0’Kingsbridge B5 * 1 3 9 3 0 11 0 11 0'SheepBridge Gauge ' 4 3 9 9 7 0 7 0 0
indicator of end of data
WRc Ref: UC 3330/11659-0September 1999
61

Environment Agency - Thames Region
APPENDIX C AMMONIA CONCENTRATIONS IN BASINGSTOKE FINAL EFFLUENT
Three versions of total ammonia statistics for Basingstoke final effluent are presented below. Estimates of the 95 %ile are calculated using Method of Moments. It was agreed to proceed with the statistics in case No. 2 for the modelling study.
1. The whole Agency record for the period 1995 to 1998 with values at the limit of detection multplied by 1.0
BASINGSTOKE STV Determinand Smnmarj - Ammonia N
Number of Observations
Date Ring*
MinimumMean
Maximum
Standard deviation
SDO
Log-Normal estimate (MoM) oh
5 Per cendl*
10 Percentile 20 Percentile
Median 80 Percentile
90 Percentile 95 Percentile
152
11-01-1935 to 22-10-1998
0.03000.5140
5.3000
0.58470.4411
0.0758
0.10560.1576
0.33940.7307
1.03101.5132
Histogram120T
80-
40':
3 4
Tim* Series
2. The whole Agency record for the period 1995 to 1998 with values at the limit of detection multplied by 0.5 (0.5 is the standard limit of detection multiplier)
BASINGSTOKE STV Determinand Summarj - Ammonia N
Number of Observations
Date Range
MinimumMean
Maximum
Standard deviation SDO
Log-Normal estimate (MoM) of: 5Percend!e
lOPercentfle ■
20 Percentile
Median
80 Percentile
90 Percentile 95 Percentile
152
11-01-1995 to 22-10-1998
0.0150
0.3595
5.3000
0.60320.4538
0X1274
0.0418
0.06950.1941
0.4874
0.91091-2347
100* -
80“
60“
Histogram i ----------- r •
Time Series
I111
J
111I
Irt ______ __1955 1996 1337 1933
WRc Ref: UC 3330/11659-0September 1999
62
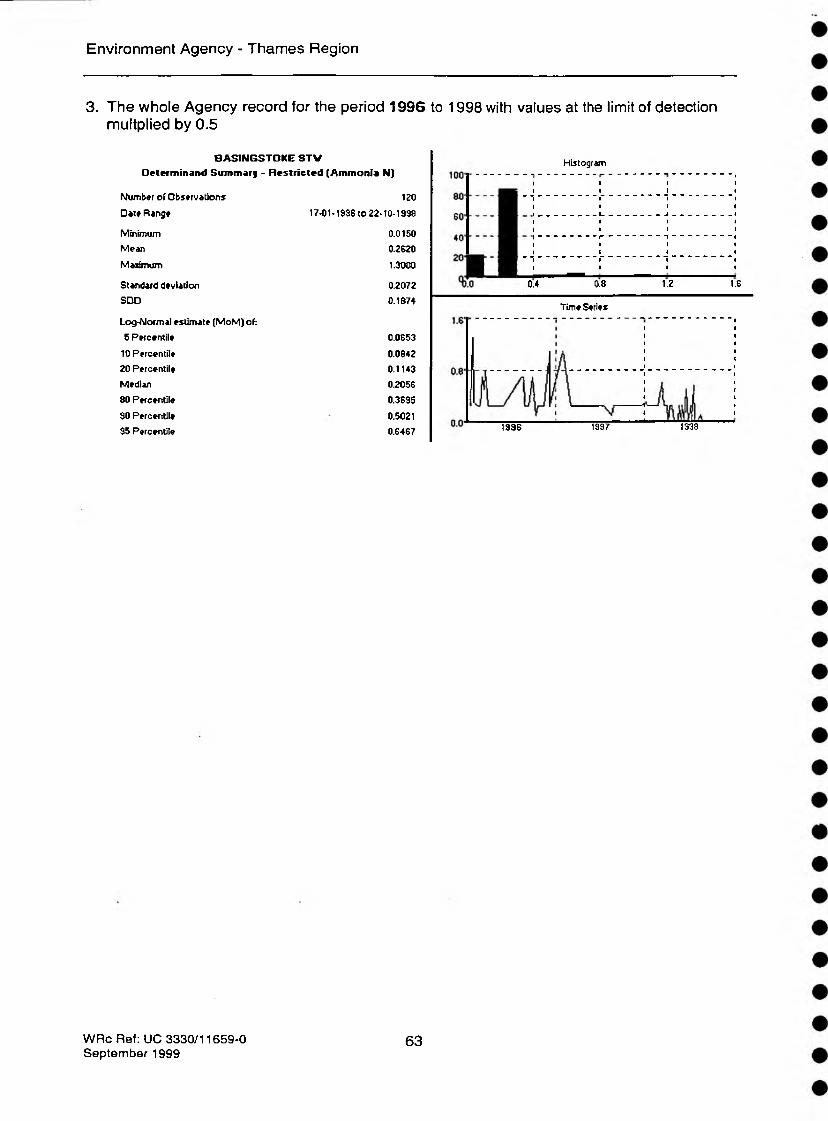
Environment Agency - Thames Region
3. The whole Agency record for the period 1996 to 1998 with values at the limit of detection multplied by 0.5
BASIN GSTO KE S T V Determinand Summ er) - Restricted (Ammonia N)
Number o f Observations
Date Range
Minimum
Mean
Maximum
Standard deviation
SDD
Log-Normal estimate (M oM ) of:
5 Percentile
10 Percentile
20 Percentile
Median
80 Percentile
90 Percentile
95 Percentile
120
17-01-1396 to 22-10-1998
0.0150
0.2620
1.3000
0.2072
0.1874
0.0653
0.0842
0.1143
0.2056
0.3695
0.5021
0.6467
Histogram
0.4 0.8 1.2 1.6
Time Series
1936 1997 1338
WRc Ref: UC 3330/11659-0September 1999
63