Embed Size (px)
Citation preview
River Water Quality in Hong Kong 2020 1
Environmental Protection Department The Government of the Hong Kong Special Administrative Region
River Water Quality in Hong Kong in 2020
River Water Quality in Hong Kong 2020 2
Mission To conduct a comprehensive and scientific monitoring programme that
helps safeguard the health of Hong Kong’s rivers and streams and achieve
the Water Quality Objectives.
Disclaimer Whilst the Government of the Hong Kong Special Administrative Region ("the Government") endeavours to ensure the accuracy of the information in this report, the Government (including its officers and employees) makes no warranty, statement or representation, expressed or implied, with respect to accuracy, completeness, or usefulness of the information contained herein, and in so far as permitted by law, shall not have any legal liability or responsibility (including liability for negligence) for any loss, damage, injury and death which may result, whether directly or indirectly, from the supply or use of such information. Users are responsible for making their own assessments of all information contained in this publication before acting on it.
Copyright Notice The information contained in this publication can be used freely for study, research and training purposes subject to acknowledgement of the source. Use of the information for purposes other than those stated above requires prior written permission of the Director of Environmental Protection.
Acknowledgement We acknowledge the Government Laboratory for undertaking chemical analyses of the water samples.
River Water Quality in Hong Kong 2020 3
Abbreviations / 簡稱
Ammonia Nitrogen NH4-N 氨氮
Chemical Oxygen Demand COD 化學需氧量
Dissolved Oxygen DO 溶解氧
Environmental Protection Department EPD / 環保署 環境保護署
Escherichia coli E. coli 大腸桿菌
Suspended Solids SS 懸浮固體
Water Control Zone WCZ 水質管制區
Water Quality Index WQI 水質指數
Water Quality Objectives WQO 水質指標
5-day Biochemical Oxygen Demand BOD5 五天生化需氧量
River Water Quality in Hong Kong 2020 4
Content
Page 1. Introduction 7 2. An Overview of Hong Kong’s River Water Quality in 2020 8 2.1. Compliance Rate of Water Quality Objectives (WQOs) 8 2.2. Water Quality Index (WQI) Gradings 10 3. Water Quality of Rivers and Streams in Various Districts 14 3.1. Eastern New Territories 14 3.2. Northwestern New Territories 21 3.3. Lantau Island 28 3.4. Southwestern New Territories and Kowloon 30
List of Figures
Page Figure 1 Overall WQO compliance rates for Hong Kong’s rivers, 1987-2020 9 Figure 2 Compliance rates for five key WQO parameters, 1987-2020 9 Figure 3 Overall WQI gradings for Hong Kong’s rivers, 1987-2020 10 Figure 4 Map of river monitoring stations and their WQI gradings in 2020 11 Figure 5 Map of river monitoring stations and their WQI gradings in 1987 11 Figure 6 Overall annual geometric mean E. coli levels in Hong Kong’s rivers
(1988-2020) 12
Figure 7 Map of river monitoring stations and annual geometric mean E. coli levels in 2020
13
Figure 8 WQO compliance rates (%) for rivers and streams in Eastern New Territories over the past three decades
15
Figure 9 WQI gradings and E. coli levels in Shing Mun River 17 Figure 10 WQI gradings and E. coli levels in Lam Tsuen River and Tai Po River 18 Figure 11 WQI gradings and E. coli levels in Tai Po Kau Stream, Shan Liu Stream
and Tung Tze Stream 19
Figure 12 WQI gradings and E. coli levels in Tseng Lan Shue Stream 19 Figure 13 WQI gradings and E. coli levels in Ho Chung River, Tai Chung Hau
Stream and Sha Kok Mei Stream 20
Figure 14 WQO compliance rates (%) for rivers and streams in Northwestern New Territories over the past three decades
22
Figure 15 WQO compliance rates (%) for smaller streams in Lau Fau Shan area over the past three decades
24
Figure 16 WQI gradings and E. coli levels in River Indus, River Beas and River Ganges
25
River Water Quality in Hong Kong 2020 5
Figure 17 WQI gradings and E. coli levels in Yuen Long Creek, Kam Tin River, Tin Shui Wai Nullah and Fairview Park Nullah
26
Figure 18 WQI gradings and E. coli levels in Ha Pak Nai Stream, Tai Shui Hang Stream, Pak Nai Stream, Sheung Pak Nai Stream, Ngau Hom Sha Stream and Tsang Kok Stream
27
Figure 19 WQO compliance rates (%) for rivers on Lantau Island over the past three decades
28
Figure 20 WQI gradings and E. coli levels in Mui Wo River 29 Figure 21 WQI gradings and E. coli levels in Tung Chung River 29 Figure 22 WQO compliance rates (%) for rivers and streams in Southwestern New
Territories and Kowloon over the past three decades 31
Figure 23 WQI gradings and E. coli levels in Tuen Mun River 33 Figure 24 WQI gradings and E. coli levels in Pai Min Kok (Anglers’) Stream, Sam
Dip Tam Stream and Kau Wa Keng Stream 34
Figure 25 WQI gradings and E. coli levels in Kai Tak River 35
List of Appendices
Page Appendix A Summary of river water quality monitoring stations and sampling
frequency A-1
Appendix B River water quality parameters and analytical methods B-1 Appendix C Key WQOs for river monitoring stations in Eastern New Territories C-1 Key WQOs for river monitoring stations in Northwestern New
Territories C-2
Key WQOs for river monitoring stations on Lantau Island C-3 Key WQOs for river monitoring stations in Southwestern New
Territories and Kowloon C-4
Appendix D Water Control Zones (WCZs) in Hong Kong
Location of river water monitoring stations D-1 D-2
Appendix E Summary of water quality monitoring data for Shing Mun River
(Main Channel and Siu Lek Yuen Nullah) in 2020 E-1
Summary of water quality monitoring data for Shing Mun River (Fo Tan Nullah and Kwun Yam Shan Stream) in 2020
E-2
Summary of water quality monitoring data for Shing Mun River (Tai Wai Nullah and Tin Sum Nullah) in 2020
E-3
Summary of water quality monitoring data for Lam Tsuen River in 2020
E-4
Summary of water quality monitoring data for Lam Tsuen River and Tai Po River in 2020
E-6
Summary of water quality monitoring data for Tai Po Kau Stream, Shan Liu Stream and Tung Tze Stream in 2020
E-7
Summary of water quality monitoring data for Ho Chung River in 2020
E-8
River Water Quality in Hong Kong 2020 6
Summary of water quality monitoring data for Sha Kok Mei Stream in 2020
E-9
Summary of water quality monitoring data for Tai Chung Hau Stream in 2020
E-10
Summary of water quality monitoring data for Tseng Lan Shue Stream in 2020
E-11
Summary of water quality monitoring data for River Indus in 2020 E-12 Summary of water quality monitoring data for River Beas in 2020 E-13 Summary of water quality monitoring data for River Ganges in 2020 E-14 Summary of water quality monitoring data for Yuen Long Creek in
2020 E-15
Summary of water quality monitoring data for Kam Tin River in 2020 E-17 Summary of water quality monitoring data for Tin Shui Wai Nullah
and Fairview Park Nullah in 2020 E-18
Summary of water quality monitoring data for Ha Pak Nai Stream, Pak Nai Stream and Sheung Pak Nai Stream in 2020
E-19
Summary of water quality monitoring data for Ngau Hom Sha Stream, Tai Shui Hang Stream and Tsang Kok Stream in 2020
E-20
Summary of water quality monitoring data for Mui Wo River in 2020 E-21 Summary of water quality monitoring data for Tung Chung River in
2020 E-23
Summary of water quality monitoring data for Tuen Mun River in 2020
E-24
Summary of water quality monitoring data for Pai Min Kok Stream and Kau Wa Keng Stream in 2020
E-26
Summary of water quality monitoring data for Sam Dip Tam Stream in 2020
E-27
Summary of water quality monitoring data for Kai Tak River in 2020 E-28 Appendix F WQO compliance rates for rivers and streams in 2020 F-1 Appendix G Water Quality Index (WQI) for rivers and streams in Hong Kong G-1
River Water Quality in Hong Kong 2020 7
1. Introduction The Environmental Protection Department (EPD) has implemented a comprehensive river water
quality monitoring programme since 1986 to provide data for water quality management and pollution
control purposes. One or more representative monitoring stations have been set up at the upstream
and downstream sections of the main channels and tributaries of large rivers in the New Territories
or those flowing through the urban areas. A number of small rivers and streams in rural areas and
outlying islands are also monitored. The monitoring programme serves the following purposes:
• evaluate the pollution status of rivers;
• monitor long-term changes in river water quality;
• provide scientific basis for planning water pollution control strategies;
• assess compliance with the Water Quality Objectives (WQOs); and
• compile Water Quality Index (WQI) to reflect the overall state and trend of the health
of rivers. This report summarises the water quality of rivers and streams covered by EPD’s river monitoring
programme in 2020. Annual reports can be viewed and downloaded from the EPD’s website:
https://www.epd.gov.hk/epd/english/environmentinhk/water/hkwqrc/waterquality/river-2.html
In situ water flow measurement at a tributary of Shing Mun River
River Water Quality in Hong Kong 2020 8
2. An Overview of Hong Kong’s River Water Quality in 2020 The EPD’s river monitoring programme currently covers 30 watercourses and a total of 82 monitoring
stations (Appendix A), as compared with 14 watercourses and 47 stations when the programme
started in 1986. Apart from field measurements, over 50 physico-chemical and biological parameters,
including organic matters, nutrients, metals and E. coli, were analysed in the laboratory (Appendix
B).
2.1. Compliance Rate of Water Quality Objectives (WQOs) Five representative parameters, including pH, suspended solids (SS), dissolved oxygen (DO), 5-day
biochemical oxygen demand (BOD5) and chemical oxygen demand (COD), are used to assess
compliance with the WQOs applicable for individual monitoring stations (Appendix C). This report
presents the annual average compliance rates for individual watercourses as well as the overall
compliance rate for the rivers and streams monitored each month in Hong Kong (Appendix F).
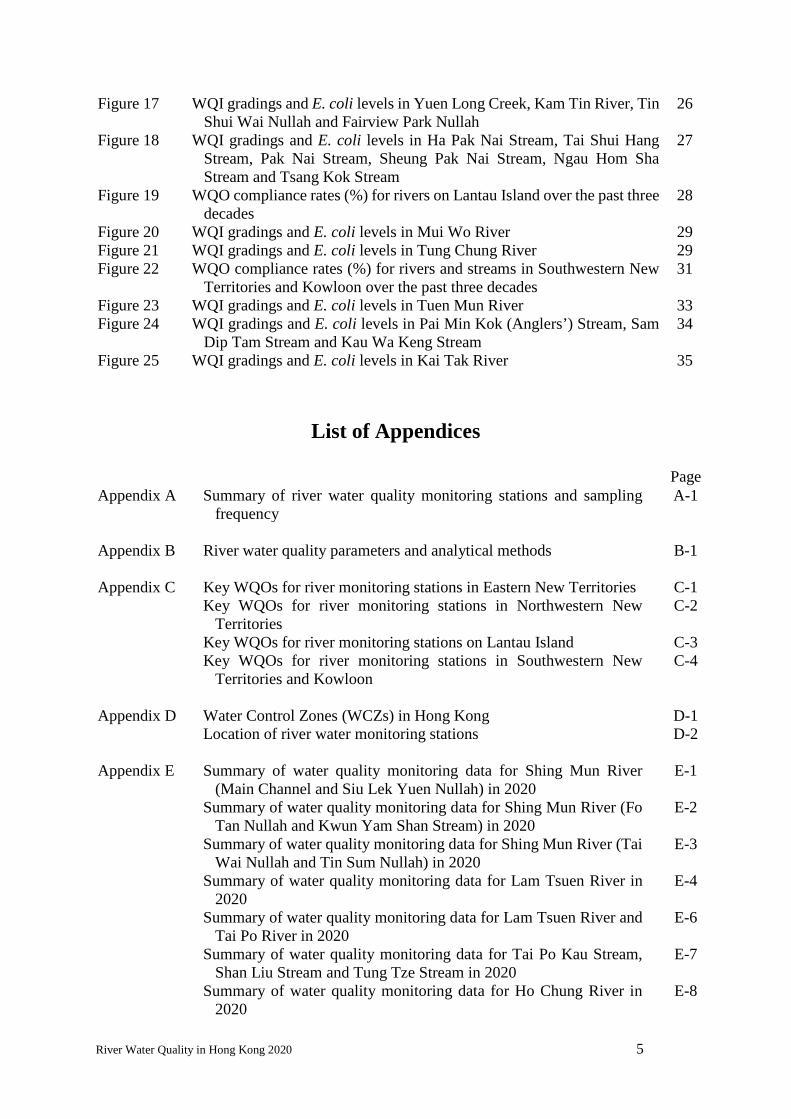
The river water quality in Hong Kong in 2020 continued to be satisfactory with an overall WQO
compliance rate1 of 87% which is generally in the range of fluctuations since 2006 (Figure 1). Figure
2 shows the WQO compliance rates for key river water quality parameters since the beginning of the
monitoring programme.
In summary, the state of water quality of Hong Kong’s watercourses remained good and steady in
2020 and generally maintained a long-term improvement trend as a result of the gradual reduction of
pollution loading to the rivers and streams.
1 For rivers that have more than one monitoring stations, the WQO compliance rate was expressed as an average of the annual compliance rates of all their individual monitoring stations. Similarly, the overall WQO compliance rate for Hong Kong’s river water quality was the overall average rate for all the river monitoring stations in the territory.
River Water Quality in Hong Kong 2020 9
Figure 1. Overall WQO compliance rates for Hong Kong’s rivers, 1987-2020
Figures are rounded to the nearest integer
Figure 2. Compliance rates for five key WQO parameters, 1987-2020
40
50
60
70
80
90
100
48 48
57
61 60 6163
6568
7073
76 75
81 82 82 81 8184
87 86 8789 89 88 89
91 90 8991 90
8890
87
WQ
O C
ompl
ianc
e(B
y pe
rcen
tage
of m
onito
ring
stat
ions
)(Total number of
monitoring stations)
Year(54) (57) (82)(82)(82)(82)(82)(82)(82)(82)(82)(81)(82)(82)(86)(86)(86)(86)(74)(74)(74)(68) (82) (82) (82)(82) (82) (82) (82) (82) (82) (82) (82) (82)
20
30
40
50
60
70
80
90
100
WQ
O C
ompl
ianc
e(B
y pe
rcen
tage
of m
onito
ring
stat
ions
)
Compliance rate for pH objective Compliance rate for BOD₅ objectiveCompliance rate for COD objective Compliance rate for DO objectiveCompliance rate for SS objective
(Total number ofmonitoring stations)
Year(54) (57) (82)(82)(82)(82)(82)(82)(82)(82)(82)(81)(82)(82)(86)(86)(86)(86)(74)(74)(74)(68) (82) (82) (82)(82) (82) (82) (82) (82) (82) (82) (82) (82)
River Water Quality in Hong Kong 2020 10
2.2. Water Quality Index (WQI) Gradings In 2020, 82% of the river monitoring stations were graded “Good” or “Excellent”2, as compared with
only 26% in 1987 (Figure 3), suggesting that the river water quality has greatly improved and the
pollution loadings in these watercourses have been substantially reduced in the past three decades.
Majority of the river monitoring stations located in the Eastern New Territories, Southwestern New
Territories, Lantau Island and Kowloon fell into these two WQI gradings. For comparison, only 7%
of the monitoring stations were graded “Bad” or “Very Bad” in 2020, while 54% stations in these
two gradings were recorded in 1987. Among the 82 monitoring stations, small changes in WQI
gradings for 13 stations in 2020 were observed, and these are generally within the normal range of
natural long-term fluctuations (Figure 3). The distribution of the river monitoring stations and their
gradings are shown in Figures 4 and 5.
Figure 3. Overall WQI gradings for Hong Kong’s rivers, 1987-2020
Figures are rounded to the nearest integer
2 WQI is relevant to conserving the primary beneficial use of rivers and streams for supporting aquatic life. It rates the overall state of health of rivers and streams into five gradings, namely “Excellent”, “Good”, “Fair”, “Bad” and “Very Bad”, by assessing three key water quality parameters: DO, BOD5 and ammonia-nitrogen levels. Please refer to Appendix G for more details on the calculation and assessment of WQI.
Wat
er Q
ualit
y In
dex
(By
perc
enta
ge o
f mon
itorin
g st
atio
ns)
Excellent
Good
Fair
Bad
Very Bad
20 18 19 22 20 19 19 22 17 16 18 17 21 17 20 16 12 7 5 6 9 12 10 7 9 9 7 9 11 9 7 9 9 11
22 2818
2319 19 19 16
14 15 15 1312
12 1212 15
1312 10 7
6 6 9 9 6 6 67 7 6 6 6 5
32 30
28 14 2316 14 14
12 11 26 5
1 12
1 4 2 1 2 2
17 14 18 2028
43
17 20 22 2129 27 30 26 21
29 28 33 3222
28 29 28 33 2820 22 24
3423
31 28 28 319 11
1822 10
3
31 2835 37
35 37 32 4548
42 4444 50
5954 52 56 51
54 66 65 6148
6156
55 57 51
(Total number ofmonitoring stations)
Year(54) (57) (82)(82)(82)(82)(82)(82)(82)(82)(82)(81)(82)(82)(86)(86)(86)(86)(74)(74)(74)(68) (82) (82) (82)(82) (82) (82) (82) (82) (82) (82) (82) (82)
River Water Quality in Hong Kong 2020 11
Figure 4. Map of river monitoring stations and their WQI gradings in 2020
Figure 5. Map of river monitoring stations and their WQI gradings in 1987
17
25 26
2728
14
30
1112
13
8
5
7
10
15
9
6
4
3
29
1819
16
2021
22 24
23
2
1
LANTAUISLAND
HONG KONGISLAND
KOWLOON
NEW TERRITORIES
SHENZHEN NW atercourses
1. Tseng Lan Shue Stream2. Ho Chung River3. Tai Chung Hau Stream4. Sha Kok Mei Stream5. Shing Mun River
- Shing Mun Main Channel- Fo Tan Nullah- Siu Lek Yuen Nullah- Kwun Yam Shan Stream- Tai Wai Nullah- Tin Sum Nullah
6. Tai Po Kau Stream7. Tai Po River8. Lam Tsuen River9. Tung Tze Stream10. Shan Liu Stream11. River Ganges12. River Indus13. River Beas14. Fairview Park Nullah15. Kam Tin River16. Yuen Long Creek17. Tin Shui Wai Nullah18. Ngau Hom Sha Stream19. Sheung Pak Nai Stream20. Pak Nai Stream21. Ha Pak Nai Stream22. Tai Shui Hang Stream 23. Tsang Kok Stream24. Tuen Mun River25. Pai Min Kok (Anglers’) Stream26. Sam Dip Tam Stream27. Kau Wa Keng Stream28. Kai Tak River29. Mui Wo River30. Tung Chung River
ExcellentGood
FairBadVery Bad
W ater Quality Index
13
15
1617
9
6
3
5
8
10
7
4
14
11
12
2
1
LANTAUISLAND
HONG KONGISLAND
KOWLOON
NEW TERRITORIES
SHENZHEN NWatercourses
1. Tseng Lan Shue Stream2. Ho Chung River3. Shing Mun River
- Shing Mun Main Channel- Fo Tan Nullah- Siu LekYuen Nullah- Tai Wai Nullah- Tin Sum Nullah
4. Tai Po Kau Stream5. Tai Po River6. Lam Tsuen River7. Tung Tze Stream8. Shan Liu Stream9. River Beas10. Kam Tin River11. Yuen Long Creek12. Tuen Mun River13. Sam Dip Tam Stream14. Mui Wo River15. Kau Wa Keng Stream16. River Ganges17. River Indus
ExcellentGoodFairBadVery Bad
Water Quality Index
River Water Quality in Hong Kong 2020 12
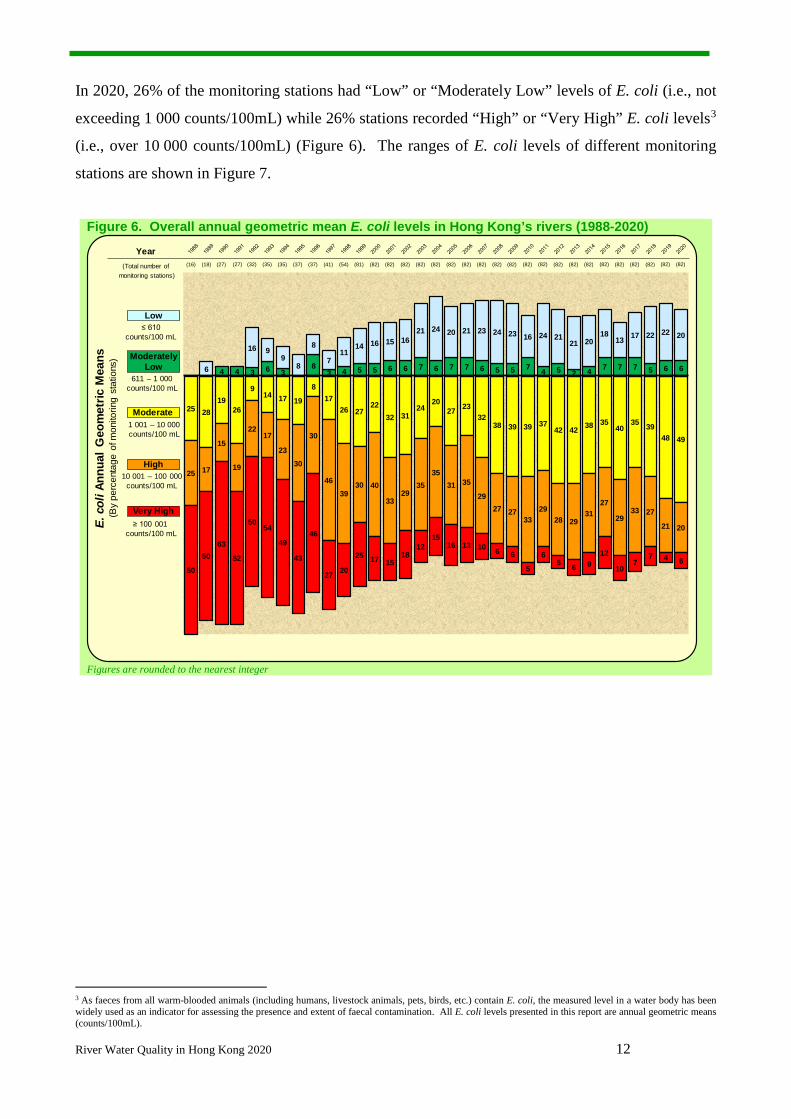
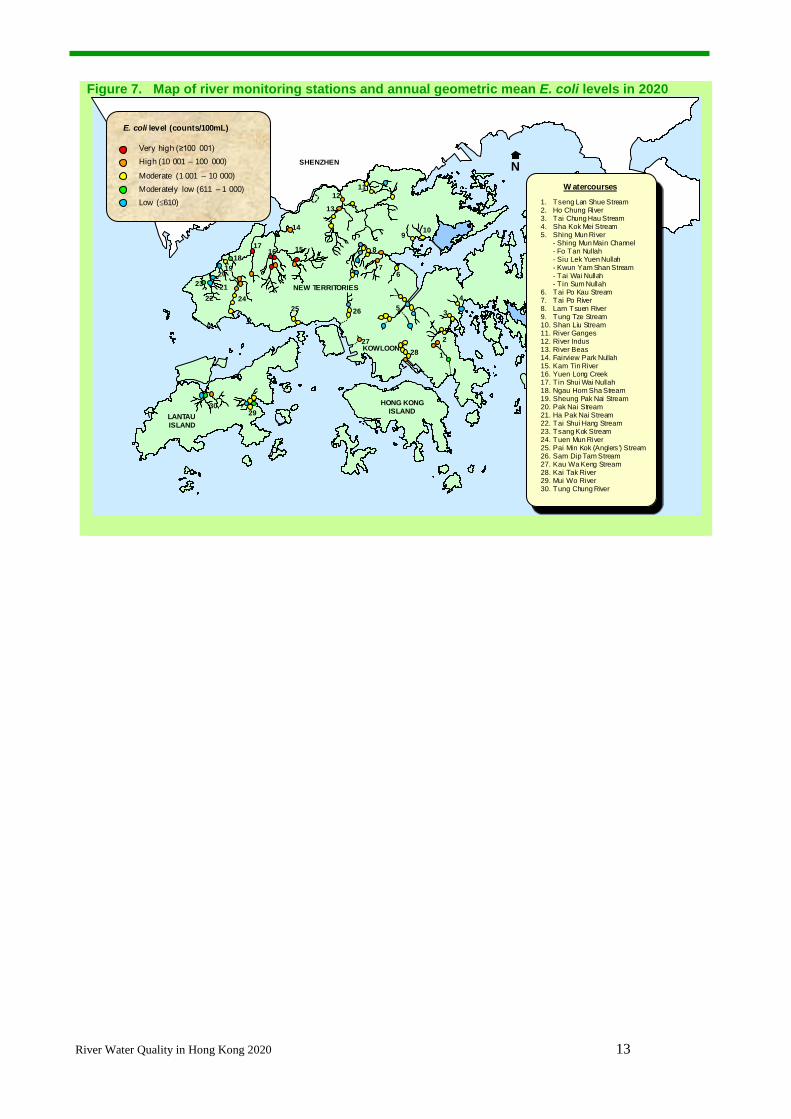
In 2020, 26% of the monitoring stations had “Low” or “Moderately Low” levels of E. coli (i.e., not
exceeding 1 000 counts/100mL) while 26% stations recorded “High” or “Very High” E. coli levels3
(i.e., over 10 000 counts/100mL) (Figure 6). The ranges of E. coli levels of different monitoring
stations are shown in Figure 7.
Figure 6. Overall annual geometric mean E. coli levels in Hong Kong’s rivers (1988-2020)
Figures are rounded to the nearest integer
3 As faeces from all warm-blooded animals (including humans, livestock animals, pets, birds, etc.) contain E. coli, the measured level in a water body has been widely used as an indicator for assessing the presence and extent of faecal contamination. All E. coli levels presented in this report are annual geometric means (counts/100mL).
E. c
oliA
nnua
l Geo
met
ric M
eans
(By
perc
enta
ge o
f mon
itorin
g st
atio
ns)
Low
Moderately Low
Moderate
High
Very High
25 2819
26
914 17 19
817
26 2722
32 3124
2027 23
3238 39 39 37
42 42 38 3540
35 3948 49
25 17
15
19
2217
2330
30
4639
30 40
3329
3535
31 35
2927 27
3329
28 2931
27
2933 27
21 20
50
5063
52
5054
49
43
46
27 20
25 17 1518
1215
16 13 10 6 6
5
65 6 9
12
107
7 4 6
4 4 3 6 38
3 4 5 5 6 6 7 6 7 7 6 5 5 7 4 5 2 4 7 7 7 5 6 66
16 99
8
8
711
14 16 15 1621 24 20 21 23 24 23 16 24 21
21 2018
13 17 22 22 20
(Total number ofmonitoring stations)
Year
≤ 610 counts/100 mL
611 – 1 000 counts/100 mL
10 001 – 100 000 counts/100 mL
1 001 – 10 000 counts/100 mL
≥ 100 001 counts/100 mL
(18) (27)(16) (82)(82)(82)(82)(82)(82)(82)(82)(82)(82)(82)(81)(54)(41)(37)(37)(35)(35)(32)(27) (82) (82) (82)(82) (82) (82) (82) (82) (82) (82)
River Water Quality in Hong Kong 2020 13
Figure 7. Map of river monitoring stations and annual geometric mean E. coli levels in 2020
17
25 26
2728
14
30
1112
13
8
5
7
10
15
9
6
4
3
29
1819
16
20
2122 24
23
2
1
LANTAUISLAND
HONG KONGISLAND
KOWLOON
NEW TERRITORIES
SHENZHEN NVery high (≥100 001)High (10 001 – 100 000)
Moderate (1 001 – 10 000)Moderately low (611 – 1 000)Low (≤610)
E. coli level (counts/100mL)
1. Tseng Lan Shue Stream2. Ho Chung River3. Tai Chung Hau Stream4. Sha Kok Mei Stream5. Shing Mun River
- Shing Mun Main Channel- Fo Tan Nullah- Siu Lek Yuen Nullah- Kwun Yam Shan Stream- Tai Wai Nullah- Tin Sum Nullah
6. Tai Po Kau Stream7. Tai Po River8. Lam Tsuen River9. Tung Tze Stream10. Shan Liu Stream11. River Ganges12. River Indus13. River Beas14. Fairview Park Nullah15. Kam Tin River16. Yuen Long Creek17. Tin Shui Wai Nullah18. Ngau Hom Sha Stream19. Sheung Pak Nai Stream20. Pak Nai Stream21. Ha Pak Nai Stream22. Tai Shui Hang Stream 23. Tsang Kok Stream24. Tuen Mun River25. Pai Min Kok (Anglers’) Stream26. Sam Dip Tam Stream27. Kau Wa Keng Stream28. Kai Tak River29. Mui Wo River30. Tung Chung River
W atercourses
River Water Quality in Hong Kong 2020 14
3. Water Quality of Rivers and Streams in Various Districts
3.1. Eastern New Territories The EPD monitored ten watercourses in the Eastern New Territories, six of which, i.e., Shing Mun
River, Lam Tsuen River, Tai Po River, Tai Po Kau Stream, Shan Liu Stream and Tung Tze Stream,
are located in the Tolo Harbour and Channel Water Control Zone (WCZ). Ho Chung River, Sha Kok
Mei Stream and Tai Chung Hau Stream are situated in the Port Shelter WCZ, while Tseng Lan Shue
Stream is within the Junk Bay WCZ.
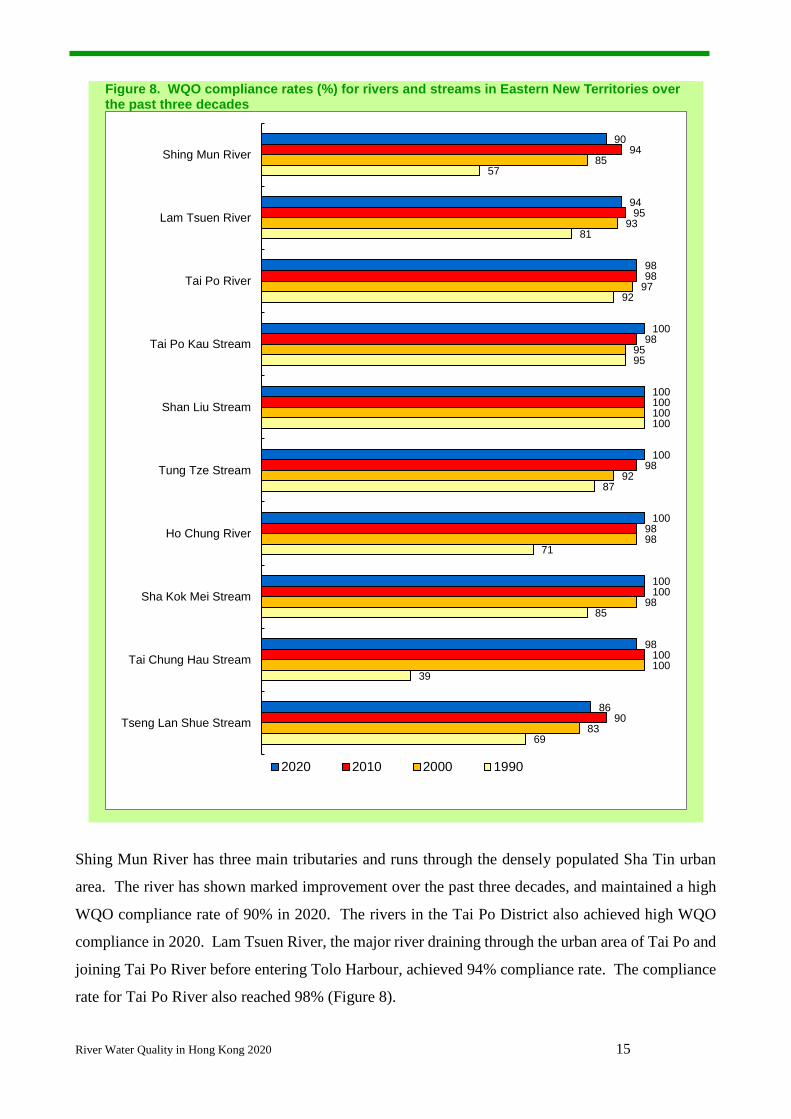
The water quality of rivers and streams in the Eastern New Territories is generally good. In 2020,
the overall WQO compliance rate of all river monitoring stations in these areas remained high at 94%,
as compared with 71% in 1990. Five pristine rivers in these areas, including Tai Po Kau Stream,
Shan Liu Stream, Tung Tze Stream, Ho Chung River and Sha Kok Mei Stream, fully met the WQOs
in 2020 (Figure 8).
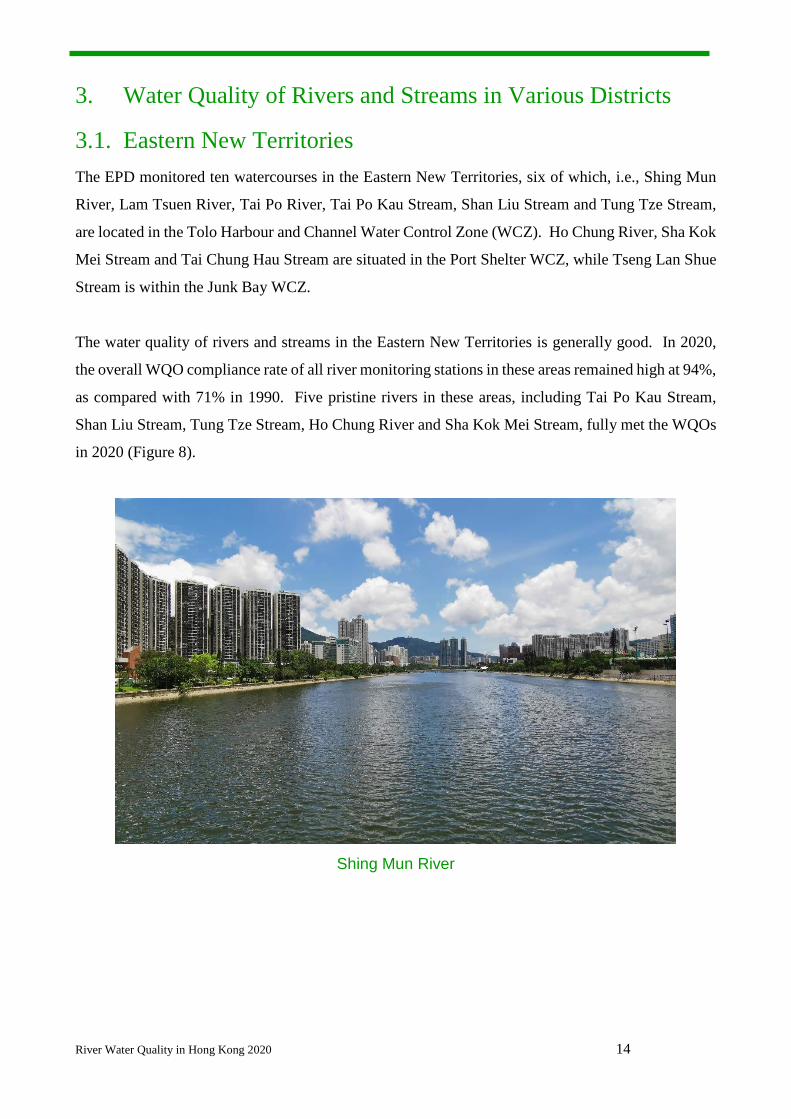
Shing Mun River
River Water Quality in Hong Kong 2020 15
Figure 8. WQO compliance rates (%) for rivers and streams in Eastern New Territories over the past three decades
Shing Mun River has three main tributaries and runs through the densely populated Sha Tin urban
area. The river has shown marked improvement over the past three decades, and maintained a high
WQO compliance rate of 90% in 2020. The rivers in the Tai Po District also achieved high WQO
compliance in 2020. Lam Tsuen River, the major river draining through the urban area of Tai Po and
joining Tai Po River before entering Tolo Harbour, achieved 94% compliance rate. The compliance
rate for Tai Po River also reached 98% (Figure 8).
90
94
98
100
100
100
100
100
98
86
94
95
98
98
100
98
98
100
100
90
85
93
97
95
100
92
98
98
100
83
57
81
92
95
100
87
71
85
39
69
Shing Mun River
Lam Tsuen River
Tai Po River
Tai Po Kau Stream
Shan Liu Stream
Tung Tze Stream
Ho Chung River
Sha Kok Mei Stream
Tai Chung Hau Stream
Tseng Lan Shue Stream
2020 2010 2000 1990
River Water Quality in Hong Kong 2020 16
Lam Tsuen River
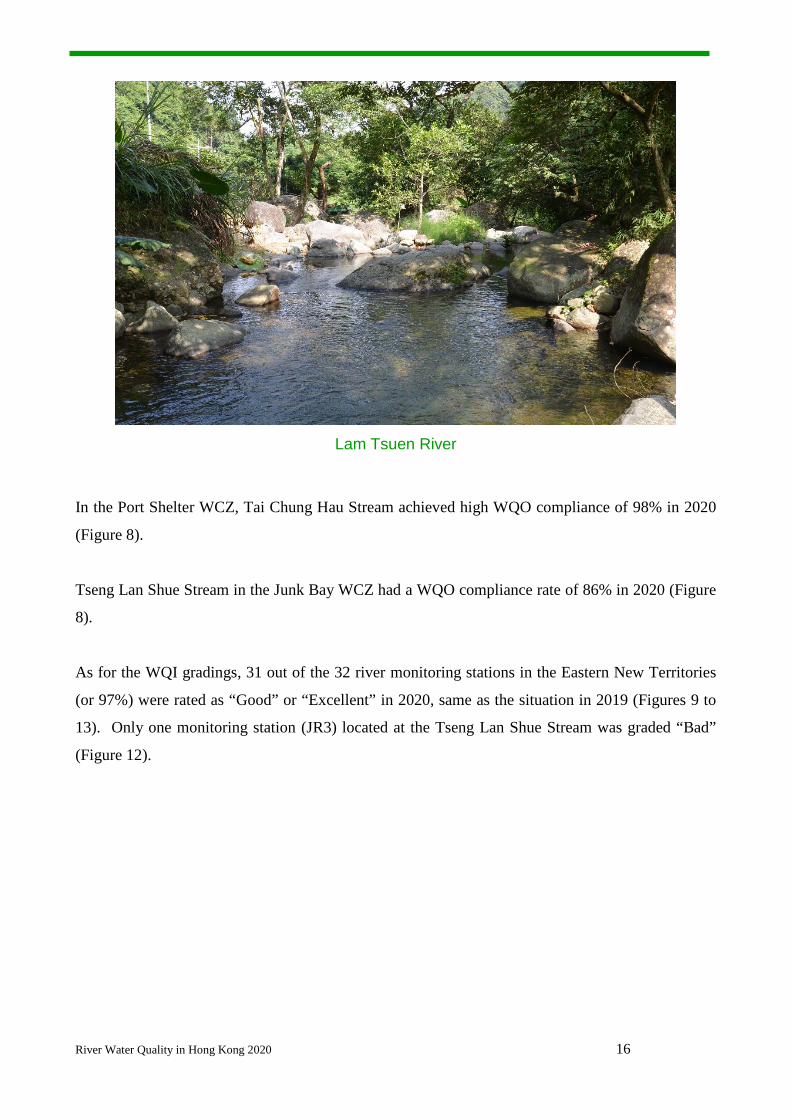
In the Port Shelter WCZ, Tai Chung Hau Stream achieved high WQO compliance of 98% in 2020
(Figure 8).
Tseng Lan Shue Stream in the Junk Bay WCZ had a WQO compliance rate of 86% in 2020 (Figure
8).
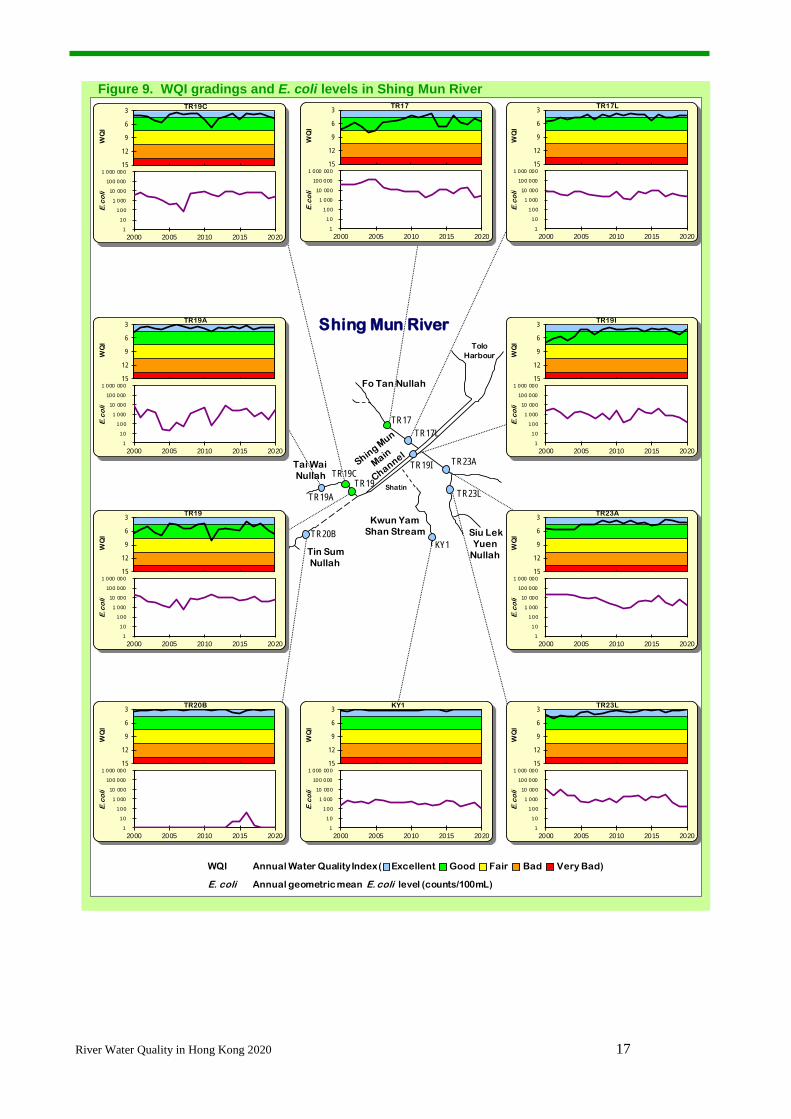
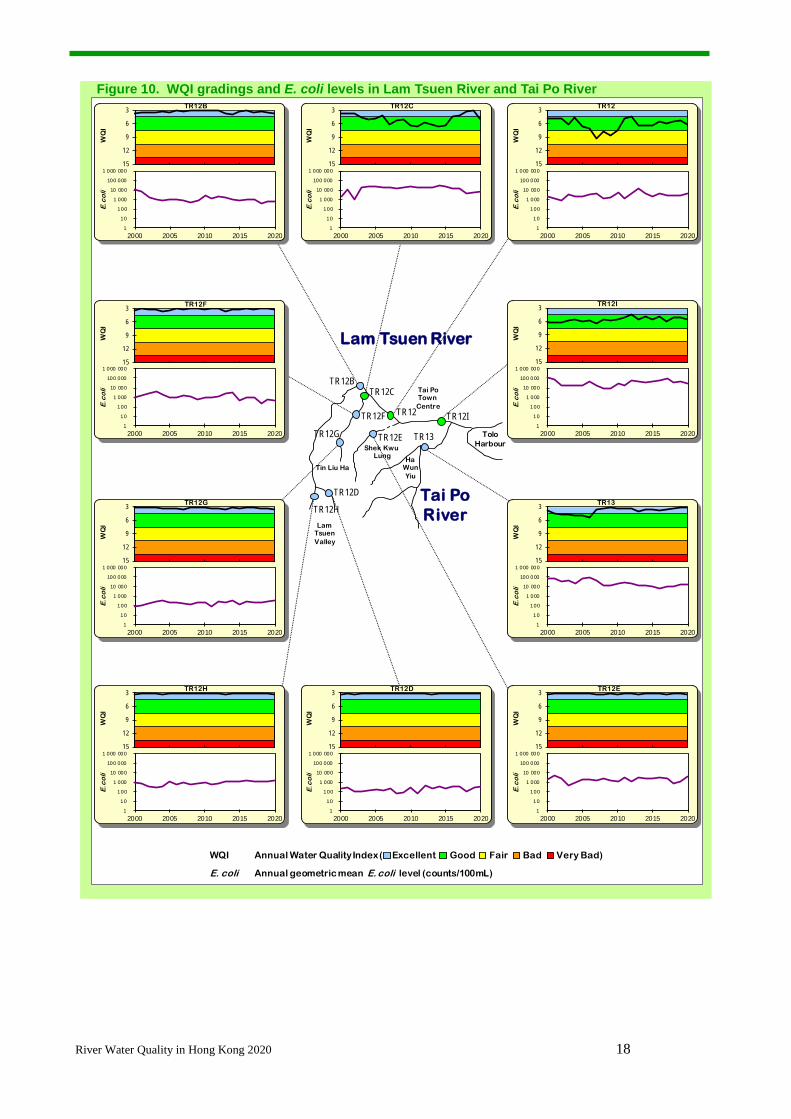
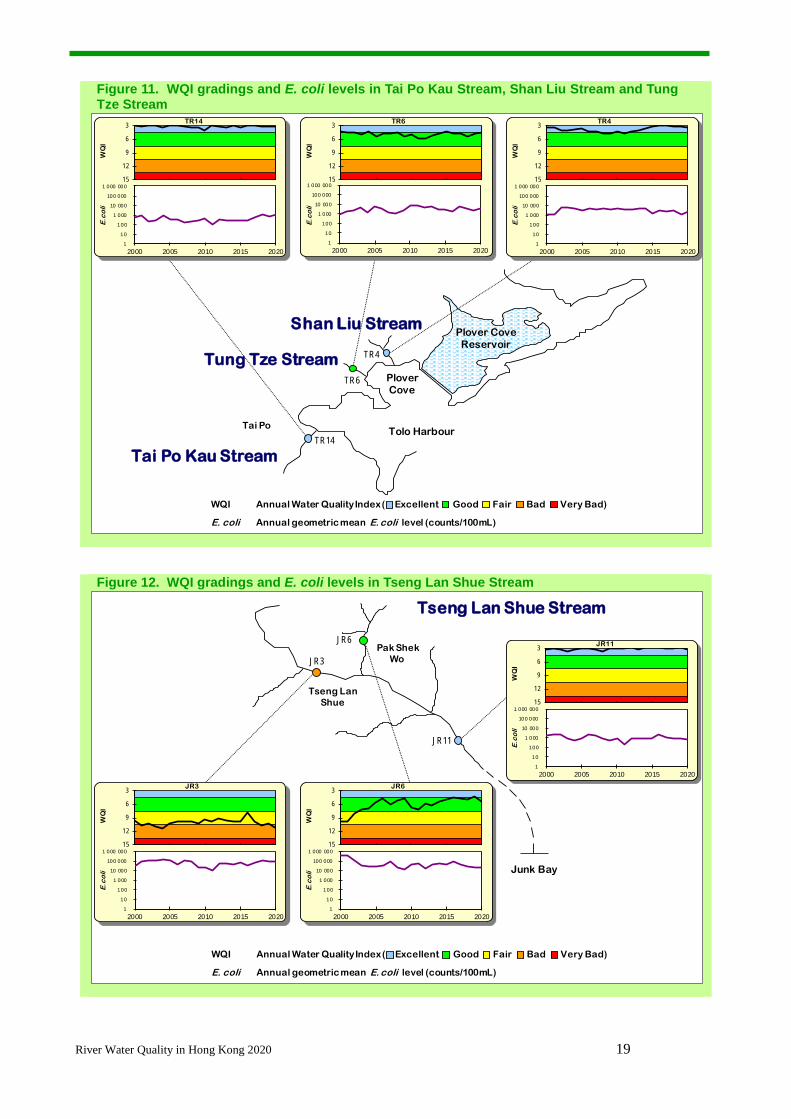
As for the WQI gradings, 31 out of the 32 river monitoring stations in the Eastern New Territories
(or 97%) were rated as “Good” or “Excellent” in 2020, same as the situation in 2019 (Figures 9 to
13). Only one monitoring station (JR3) located at the Tseng Lan Shue Stream was graded “Bad”
(Figure 12).
River Water Quality in Hong Kong 2020 17
Figure 9. WQI gradings and E. coli levels in Shing Mun River
WQI Annual Water Quality Index ( Excellent Good Fair Bad Very Bad)
E. coli Annual geometric mean E. coli level (counts/100mL)
Shing Mun River
TR17
TR19A
Tin SumNullah
Kwun YamShan Stream Siu Lek
YuenNullah
Tai Wai Nullah
Fo Tan Nullah
TR20BKY1
Shatin
TR17L
TR19I TR23A
TR23L
TR19CTR19
ToloHarbour
3
6
9
12
15
TR17L
1
10
100
1 000
10 000
100 000
1 000 000
2000 2005 2010 2015 2020
E.c
oli
W
QI
3
6
9
12
15
TR17
1
10
100
1 000
10 000
100 000
1 000 000
2000 2005 2010 2015 2020
E.c
oli
W
QI
3
6
9
12
15
TR19C
1
10
100
1 000
10 000
100 000
1 000 000
2000 2005 2010 2015 2020
E.c
oli
W
QI
3
6
9
12
15
TR19I
1
10
100
1 000
10 000
100 000
1 000 000
2000 2005 2010 2015 2020
E.c
oli
W
QI
3
6
9
12
15
TR23A
1
10
100
1 000
10 000
100 000
1 000 000
2000 2005 2010 2015 2020
E.c
oli
W
QI
3
6
9
12
15
TR23L
1
10
100
1 000
10 000
100 000
1 000 000
2000 2005 2010 2015 2020
E.c
oli
W
QI
3
6
9
12
15
KY1
1
10
100
1 000
10 000
100 000
1 000 000
2000 2005 2010 2015 2020
E.c
oli
W
QI
3
6
9
12
15
TR20B
1
10
100
1 000
10 000
100 000
1 000 000
2000 2005 2010 2015 2020
E.c
oli
W
QI
3
6
9
12
15
TR19
1
10
100
1 000
10 000
100 000
1 000 000
2000 2005 2010 2015 2020
E.c
oli
W
QI
3
6
9
12
15
TR19A
1
10
100
1 000
10 000
100 000
1 000 000
2000 2005 2010 2015 2020
E.c
oli
W
QI
River Water Quality in Hong Kong 2020 18
Figure 10. WQI gradings and E. coli levels in Lam Tsuen River and Tai Po River
Lam Tsuen River
TR12C
TR12F
TR12G
TR12H
TR12D
TR12B
Tin Liu Ha
LamTsuenValley
TR12ITR12
TR12EShek Kwu
Lung
Tai PoTown Centre
TR13
Tai PoRiver
HaWunYiu
ToloHarbour
WQI Annual Water Quality Index ( Excellent Good Fair Bad Very Bad)
E. coli Annual geometric mean E. coli level (counts/100mL)
3
6
9
12
15
TR12
1
10
100
1 000
10 000
100 000
1 000 000
2000 2005 2010 2015 2020
E.c
oli
W
QI
3
6
9
12
15
TR12C
1
10
100
1 000
10 000
100 000
1 000 000
2000 2005 2010 2015 2020
E.c
oli
W
QI
3
6
9
12
15
TR12B
1
10
100
1 000
10 000
100 000
1 000 000
2000 2005 2010 2015 2020
E.c
oli
W
QI
3
6
9
12
15
TR12F
1
10
100
1 000
10 000
100 000
1 000 000
2000 2005 2010 2015 2020
E.c
oli
W
QI
3
6
9
12
15
TR12G
1
10
100
1 000
10 000
100 000
1 000 000
2000 2005 2010 2015 2020
E.c
oli
W
QI
3
6
9
12
15
TR12H
1
10
100
1 000
10 000
100 000
1 000 000
2000 2005 2010 2015 2020
E.c
oli
W
QI
3
6
9
12
15
TR12D
1
10
100
1 000
10 000
100 000
1 000 000
2000 2005 2010 2015 2020
E.c
oli
W
QI
3
6
9
12
15
TR12E
1
10
100
1 000
10 000
100 000
1 000 000
2000 2005 2010 2015 2020
E.c
oli
W
QI
3
6
9
12
15
TR13
1
10
100
1 000
10 000
100 000
1 000 000
2000 2005 2010 2015 2020
E.c
oli
W
QI
3
6
9
12
15
TR12I
1
10
100
1 000
10 000
100 000
1 000 000
2000 2005 2010 2015 2020
E.c
oli
W
QI
River Water Quality in Hong Kong 2020 19
Figure 11. WQI gradings and E. coli levels in Tai Po Kau Stream, Shan Liu Stream and Tung Tze Stream
Figure 12. WQI gradings and E. coli levels in Tseng Lan Shue Stream
WQI Annual Water Quality Index ( Excellent Good Fair Bad Very Bad)
E. coli Annual geometric mean E. coli level (counts/100mL)
Tai Po Kau Stream
Plover CoveReservoir
Tolo Harbour
PloverCove
TR14Tai Po
Shan Liu Stream
Tung Tze Stream TR4
TR6
3
6
9
12
15
TR4
1
10
100
1 000
10 000
100 000
1 000 000
2000 2005 2010 2015 2020
E.c
oli
W
QI
3
6
9
12
15
TR6
1
10
100
1 000
10 000
100 000
1 000 000
2000 2005 2010 2015 2020
E.c
oli
W
QI
3
6
9
12
15
TR14
1
10
100
1 000
10 000
100 000
1 000 000
2000 2005 2010 2015 2020
E.c
oli
W
QI
Tseng Lan Shue Stream
Junk Bay
JR11
JR6
JR3
Tseng LanShue
Pak ShekWo
3
6
9
12
15
JR11
1
10
100
1 000
10 000
100 000
1 000 000
2000 2005 2010 2015 2020
E.c
oli
W
QI
3
6
9
12
15
JR6
1
10
100
1 000
10 000
100 000
1 000 000
2000 2005 2010 2015 2020
E.c
oli
W
QI
3
6
9
12
15
JR3
1
10
100
1 000
10 000
100 000
1 000 000
2000 2005 2010 2015 2020
E.c
oli
W
QI
WQI Annual Water Quality Index ( Excellent Good Fair Bad Very Bad)
E. coli Annual geometric mean E. coli level (counts/100mL)

River Water Quality in Hong Kong 2020 20
Figure 13. WQI gradings and E. coli levels in Ho Chung River, Tai Chung Hau Stream and Sha Kok Mei Stream
Sha Kok MeiStream
Sai Kung Hoi
Tai Chung HauStream
HebeHaven
Ho Chung River
Ho Chung
MarinaCove
Sai KungTown
Centre
Sha KokMei
Tai ChungHau
PR5PR6
PR7
PR8
PR1PR2
3
6
9
12
15
PR8
1
10
100
1 000
10 000
100 000
1 000 000
2000 2005 2010 2015 2020
E.c
oli
W
QI
3
6
9
12
15
PR6
1
10
100
1 000
10 000
100 000
1 000 000
2000 2005 2010 2015 2020
E.c
oli
W
QI
3
6
9
12
15
PR5
1
10
100
1 000
10 000
100 000
1 000 000
2000 2005 2010 2015 2020
E.c
oli
W
QI
3
6
9
12
15
PR7
1
10
100
1 000
10 000
100 000
1 000 000
2000 2005 2010 2015 2020
E.c
oli
W
QI
3
6
9
12
15
PR2
1
10
100
1 000
10 000
100 000
1 000 000
2000 2005 2010 2015 2020
E.c
oli
W
QI
3
6
9
12
15
PR1
1
10
100
1 000
10 000
100 000
1 000 000
2000 2005 2010 2015 2020
E.c
oli
W
QI
WQI Annual Water Quality Index ( Excellent Good Fair Bad Very Bad)
E. coli Annual geometric mean E. coli level (counts/100mL)
River Water Quality in Hong Kong 2020 21
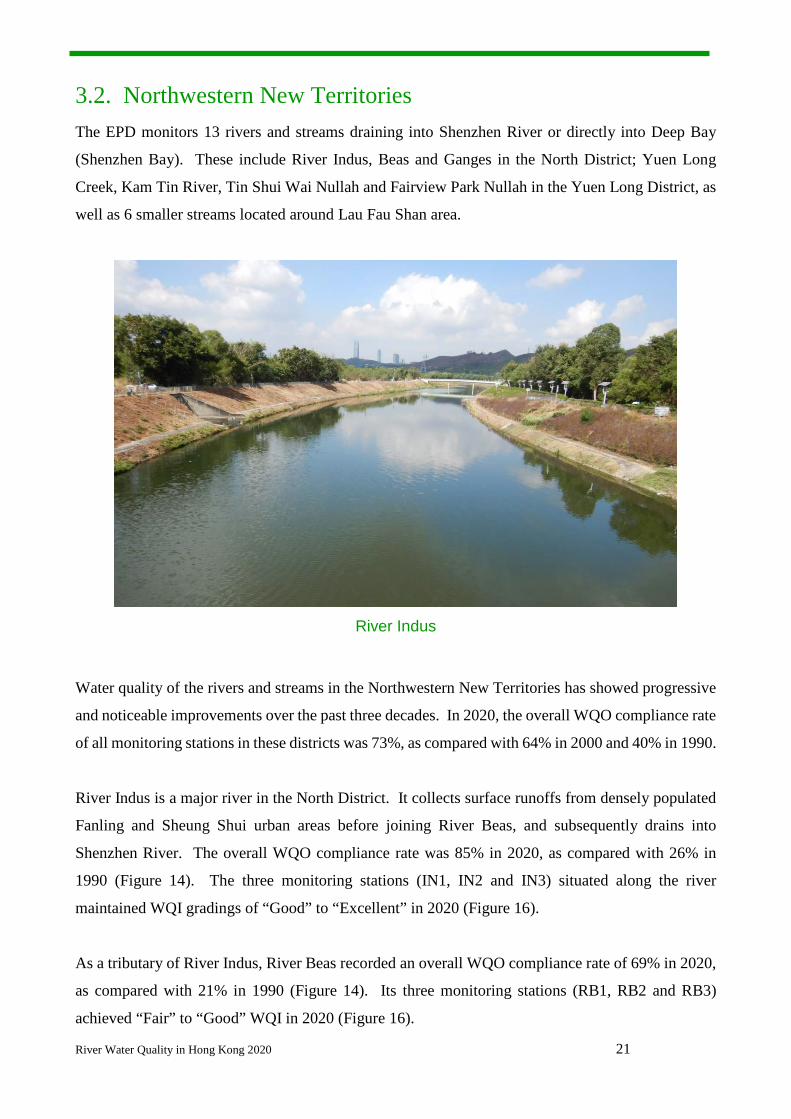
3.2. Northwestern New Territories The EPD monitors 13 rivers and streams draining into Shenzhen River or directly into Deep Bay
(Shenzhen Bay). These include River Indus, Beas and Ganges in the North District; Yuen Long
Creek, Kam Tin River, Tin Shui Wai Nullah and Fairview Park Nullah in the Yuen Long District, as
well as 6 smaller streams located around Lau Fau Shan area.
River Indus
Water quality of the rivers and streams in the Northwestern New Territories has showed progressive
and noticeable improvements over the past three decades. In 2020, the overall WQO compliance rate
of all monitoring stations in these districts was 73%, as compared with 64% in 2000 and 40% in 1990.
River Indus is a major river in the North District. It collects surface runoffs from densely populated
Fanling and Sheung Shui urban areas before joining River Beas, and subsequently drains into
Shenzhen River. The overall WQO compliance rate was 85% in 2020, as compared with 26% in
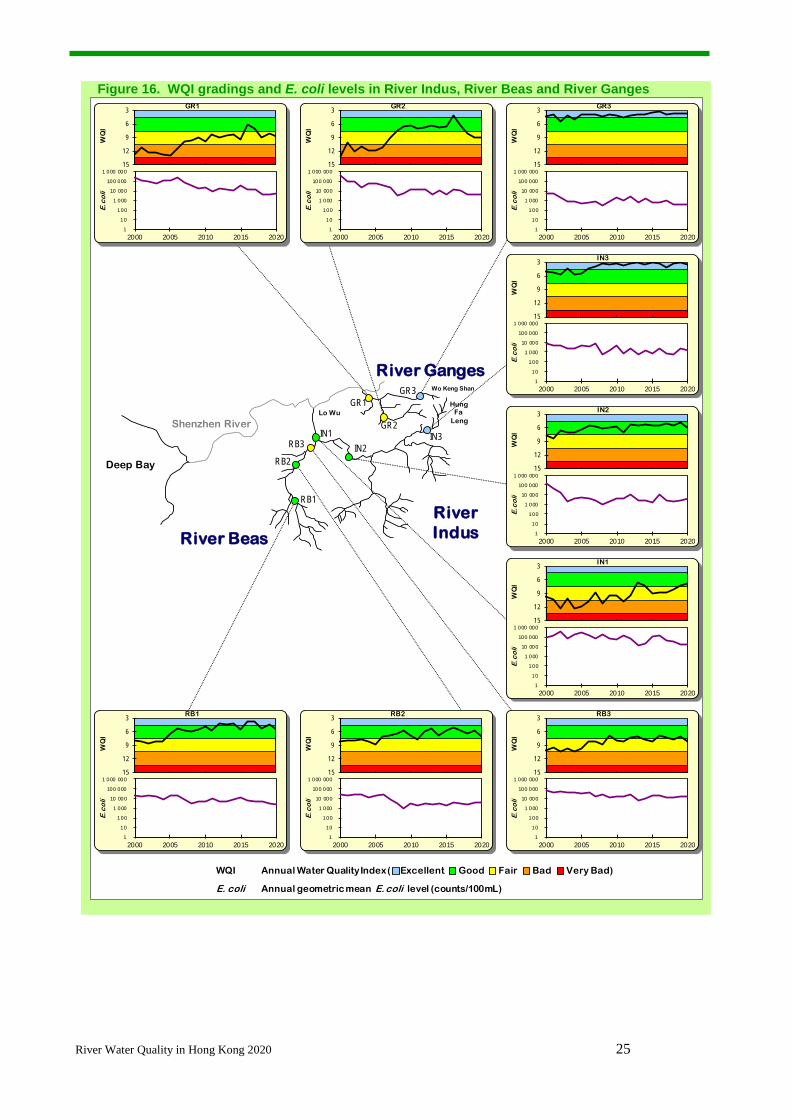
1990 (Figure 14). The three monitoring stations (IN1, IN2 and IN3) situated along the river
maintained WQI gradings of “Good” to “Excellent” in 2020 (Figure 16).
As a tributary of River Indus, River Beas recorded an overall WQO compliance rate of 69% in 2020,
as compared with 21% in 1990 (Figure 14). Its three monitoring stations (RB1, RB2 and RB3)
achieved “Fair” to “Good” WQI in 2020 (Figure 16).
River Water Quality in Hong Kong 2020 22
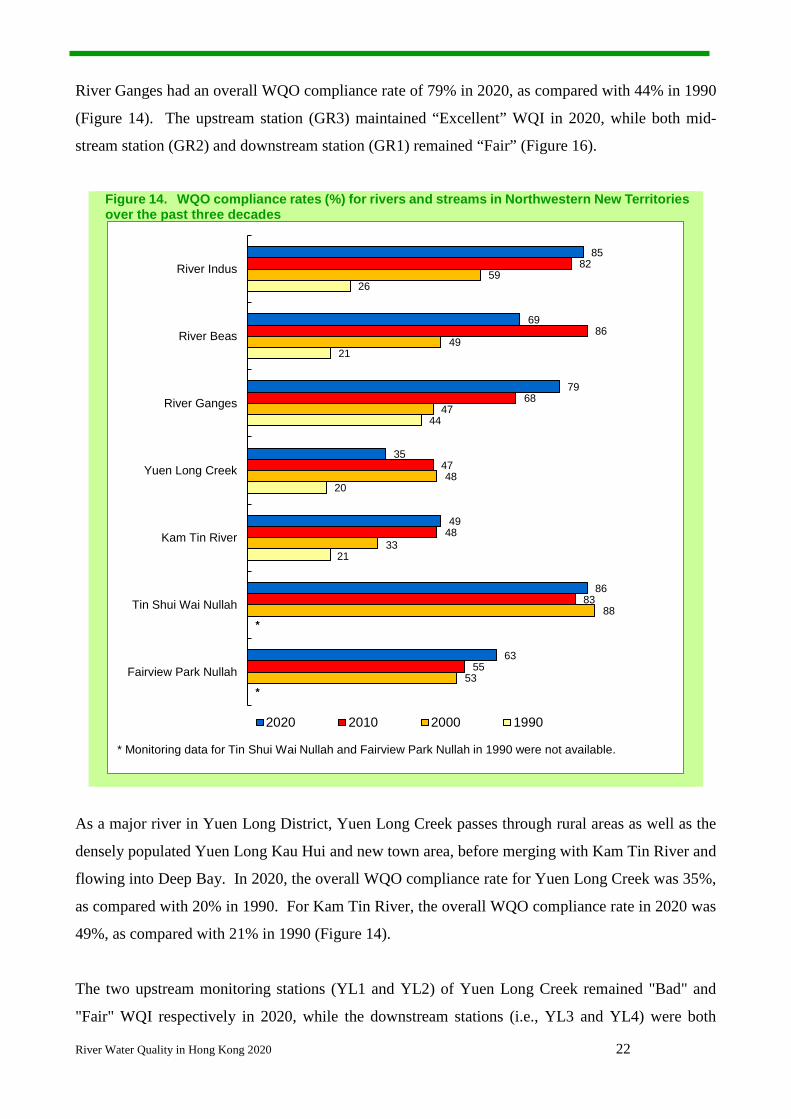
River Ganges had an overall WQO compliance rate of 79% in 2020, as compared with 44% in 1990
(Figure 14). The upstream station (GR3) maintained “Excellent” WQI in 2020, while both mid-
stream station (GR2) and downstream station (GR1) remained “Fair” (Figure 16).
Figure 14. WQO compliance rates (%) for rivers and streams in Northwestern New Territories over the past three decades
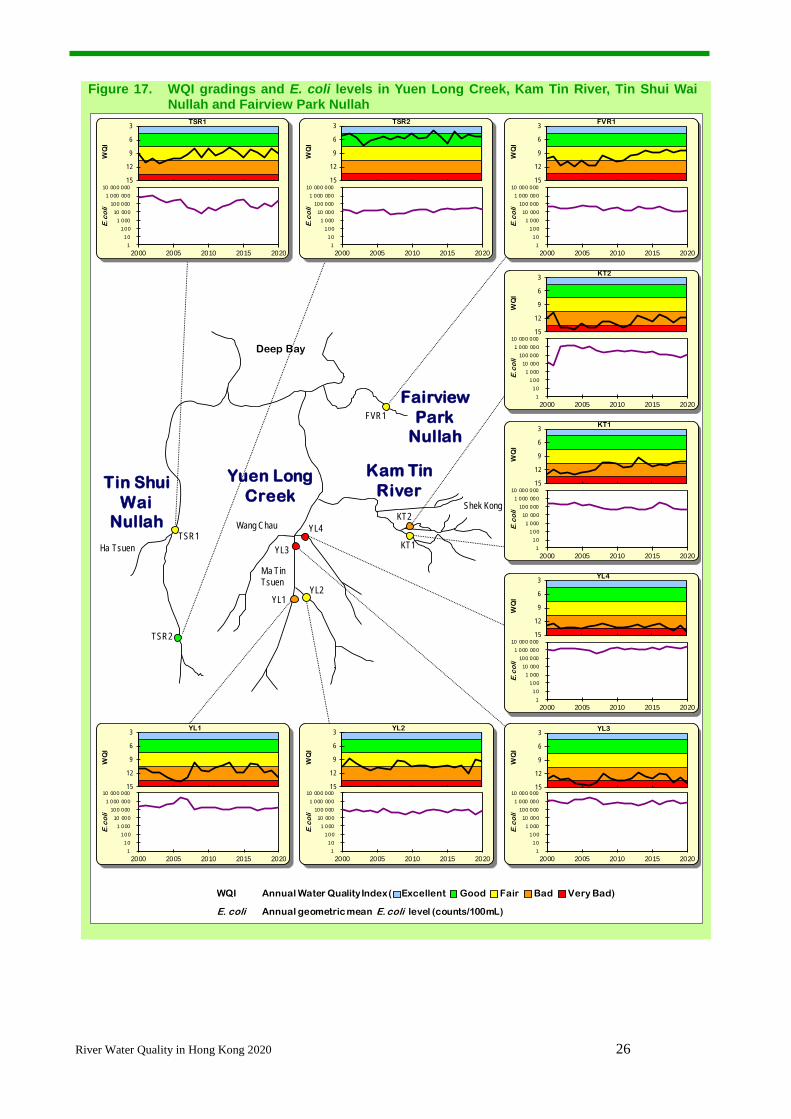
As a major river in Yuen Long District, Yuen Long Creek passes through rural areas as well as the
densely populated Yuen Long Kau Hui and new town area, before merging with Kam Tin River and
flowing into Deep Bay. In 2020, the overall WQO compliance rate for Yuen Long Creek was 35%,
as compared with 20% in 1990. For Kam Tin River, the overall WQO compliance rate in 2020 was
49%, as compared with 21% in 1990 (Figure 14).
The two upstream monitoring stations (YL1 and YL2) of Yuen Long Creek remained "Bad" and
"Fair" WQI respectively in 2020, while the downstream stations (i.e., YL3 and YL4) were both
85
69
79
35
49
86
63
82
86
68
47
48
83
55
59
49
47
48
33
88
53
26
21
44
20
21
*
*
River Indus
River Beas
River Ganges
Yuen Long Creek
Kam Tin River
Tin Shui Wai Nullah
Fairview Park Nullah
2020 2010 2000 1990
* Monitoring data for Tin Shui Wai Nullah and Fairview Park Nullah in 1990 were not available.
River Water Quality in Hong Kong 2020 23
graded "Very Bad" in 2020 (Figure 17). Both monitoring stations (KT1 and KT2) at Kam Tin River
remained “Fair” and “Bad” WQI respectively in 2020.
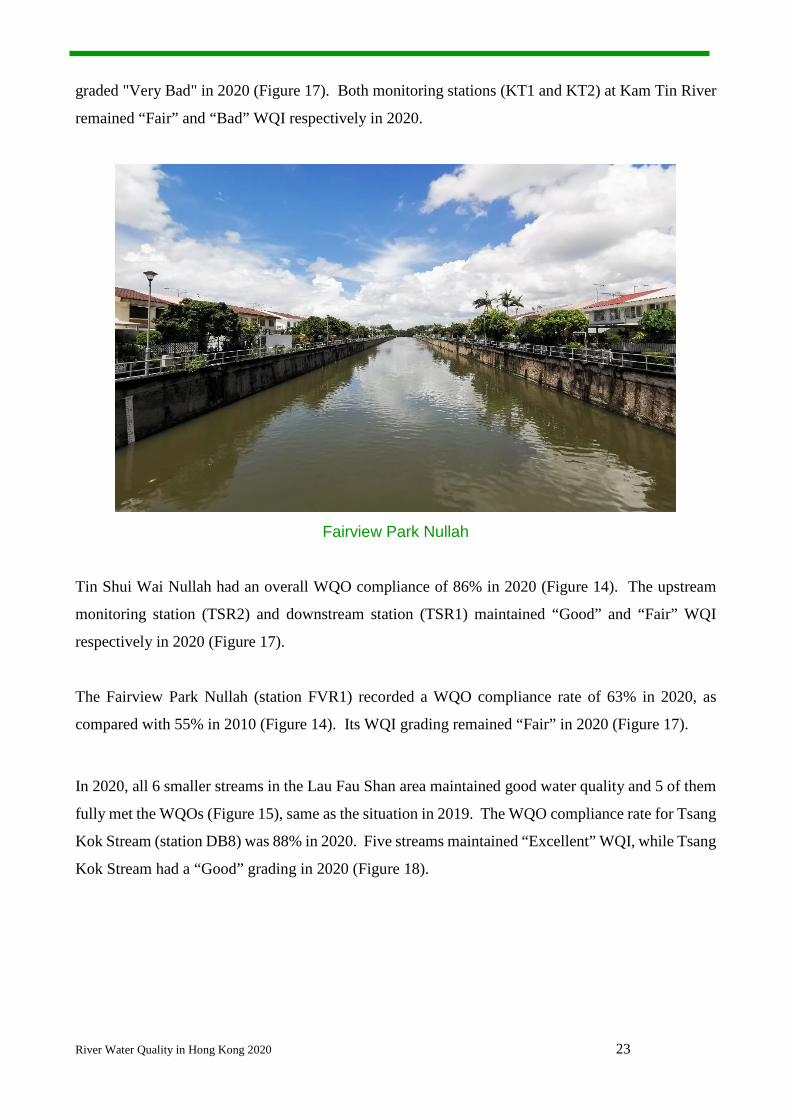
Fairview Park Nullah
Tin Shui Wai Nullah had an overall WQO compliance of 86% in 2020 (Figure 14). The upstream
monitoring station (TSR2) and downstream station (TSR1) maintained “Good” and “Fair” WQI
respectively in 2020 (Figure 17).
The Fairview Park Nullah (station FVR1) recorded a WQO compliance rate of 63% in 2020, as
compared with 55% in 2010 (Figure 14). Its WQI grading remained “Fair” in 2020 (Figure 17).
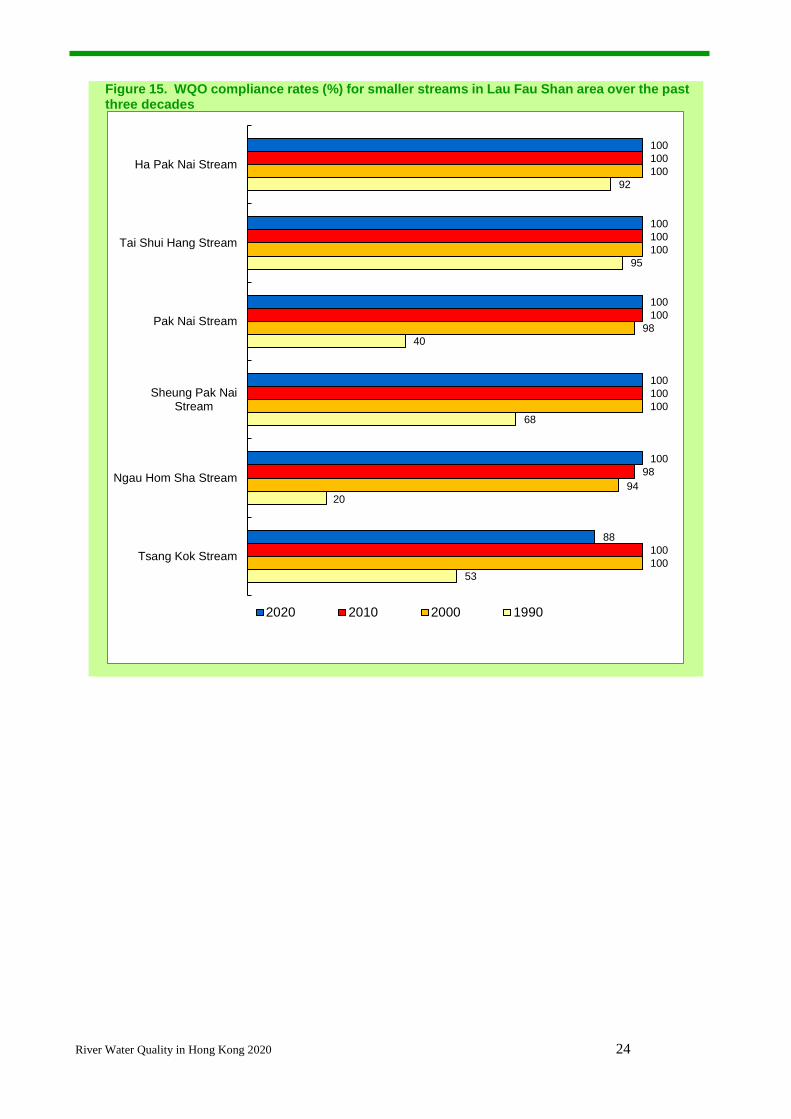
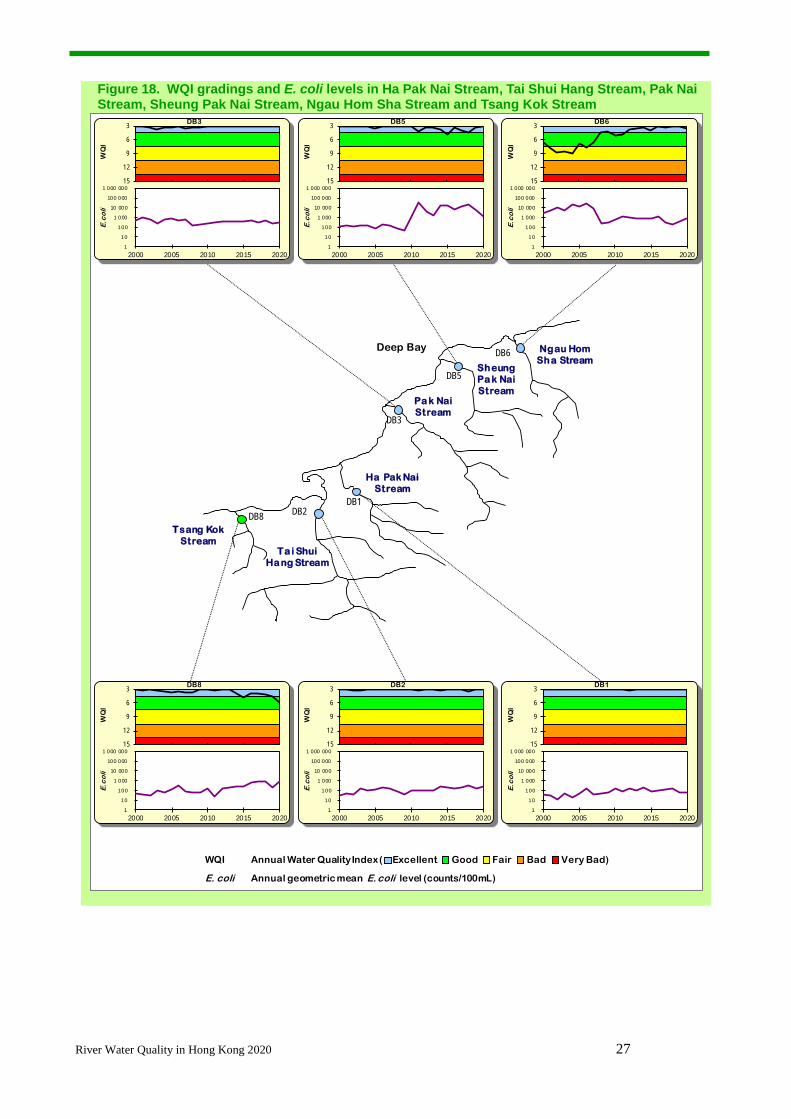
In 2020, all 6 smaller streams in the Lau Fau Shan area maintained good water quality and 5 of them
fully met the WQOs (Figure 15), same as the situation in 2019. The WQO compliance rate for Tsang
Kok Stream (station DB8) was 88% in 2020. Five streams maintained “Excellent” WQI, while Tsang
Kok Stream had a “Good” grading in 2020 (Figure 18).
River Water Quality in Hong Kong 2020 24
Figure 15. WQO compliance rates (%) for smaller streams in Lau Fau Shan area over the past three decades
100
100
100
100
100
88
100
100
100
100
98
100
100
100
98
100
94
100
92
95
40
68
20
53
Ha Pak Nai Stream
Tai Shui Hang Stream
Pak Nai Stream
Sheung Pak NaiStream
Ngau Hom Sha Stream
Tsang Kok Stream
2020 2010 2000 1990
River Water Quality in Hong Kong 2020 25
Figure 16. WQI gradings and E. coli levels in River Indus, River Beas and River Ganges
Deep Bay
Shenzhen River
River Beas
RB2
RB1
RB3
Lo WuHung
FaLeng
RiverIndus
River Ganges
IN1IN2
IN3
GR1
GR2
GR3 Wo Keng Shan
3
6
9
12
15
GR1
1
10
100
1 000
10 000
100 000
1 000 000
2000 2005 2010 2015 2020
E.c
oli
W
QI
3
6
9
12
15
GR2
1
10
100
1 000
10 000
100 000
1 000 000
2000 2005 2010 2015 2020
E.c
oli
W
QI
3
6
9
12
15
GR3
1
10
100
1 000
10 000
100 000
1 000 000
2000 2005 2010 2015 2020
E.c
oli
W
QI
3
6
9
12
15
IN3
1
10
100
1 000
10 000
100 000
1 000 000
2000 2005 2010 2015 2020
E.c
oli
W
QI
3
6
9
12
15
IN2
1
10
100
1 000
10 000
100 000
1 000 000
2000 2005 2010 2015 2020
E.c
oli
W
QI
3
6
9
12
15
IN1
1
10
100
1 000
10 000
100 000
1 000 000
2000 2005 2010 2015 2020
E.c
oli
W
QI
3
6
9
12
15
RB3
1
10
100
1 000
10 000
100 000
1 000 000
2000 2005 2010 2015 2020
E.c
oli
W
QI
3
6
9
12
15
RB2
1
10
100
1 000
10 000
100 000
1 000 000
2000 2005 2010 2015 2020
E.c
oli
W
QI
3
6
9
12
15
RB1
1
10
100
1 000
10 000
100 000
1 000 000
2000 2005 2010 2015 2020
E.c
oli
W
QI
WQI Annual Water Quality Index ( Excellent Good Fair Bad Very Bad)
E. coli Annual geometric mean E. coli level (counts/100mL)
River Water Quality in Hong Kong 2020 26
Figure 17. WQI gradings and E. coli levels in Yuen Long Creek, Kam Tin River, Tin Shui Wai Nullah and Fairview Park Nullah
Yuen LongCreek
YL1YL2
YL3
YL4
KT1
KT2
TSR1
TSR2
FVR1
Tin ShuiWai
Nullah
Kam TinRiver
FairviewPark
Nullah
Deep Bay
Ha Tsuen
Wang Chau
Ma TinTsuen
Shek Kong
3
6
9
12
15
FVR1
1 10
100 1 000
10 000 100 000
1 000 000 10 000 000
2000 2005 2010 2015 2020
E.c
oli
W
QI
3
6
9
12
15
TSR2
1 10
100 1 000
10 000 100 000
1 000 000 10 000 000
2000 2005 2010 2015 2020
E.c
oli
W
QI
3
6
9
12
15
TSR1
1 10
100 1 000
10 000 100 000
1 000 000 10 000 000
2000 2005 2010 2015 2020
E.c
oli
W
QI
3
6
9
12
15
KT2
1 10
100 1 000
10 000 100 000
1 000 000 10 000 000
2000 2005 2010 2015 2020
E.c
oli
W
QI
3
6
9
12
15
KT1
1 10
100 1 000
10 000 100 000
1 000 000 10 000 000
2000 2005 2010 2015 2020
E.c
oli
W
QI
3
6
9
12
15
YL4
1 10
100 1 000
10 000 100 000
1 000 000 10 000 000
2000 2005 2010 2015 2020
E.c
oli
W
QI
3
6
9
12
15
YL3
1 10
100 1 000
10 000 100 000
1 000 000 10 000 000
2000 2005 2010 2015 2020
E.c
oli
W
QI
3
6
9
12
15
YL2
1 10
100 1 000
10 000 100 000
1 000 000 10 000 000
2000 2005 2010 2015 2020
E.c
oli
W
QI
3
6
9
12
15
YL1
1 10
100 1 000
10 000 100 000
1 000 000 10 000 000
2000 2005 2010 2015 2020
E.c
oli
W
QI
WQI Annual Water Quality Index ( Excellent Good Fair Bad Very Bad)
E. coli Annual geometric mean E. coli level (counts/100mL)
River Water Quality in Hong Kong 2020 27
Figure 18. WQI gradings and E. coli levels in Ha Pak Nai Stream, Tai Shui Hang Stream, Pak Nai Stream, Sheung Pak Nai Stream, Ngau Hom Sha Stream and Tsang Kok Stream
Ta i ShuiHa ng Stream
Tsang KokStream
SheungPa k NaiStream
Ha Pak NaiStream
DB8
Pa k NaiStream
Ngau HomSha Stream
DB2DB1
DB3
DB5
DB6Deep Bay
3
6
9
12
15
DB6
1
10
100
1 000
10 000
100 000
1 000 000
2000 2005 2010 2015 2020
E.c
oli
W
QI
3
6
9
12
15
DB5
1
10
100
1 000
10 000
100 000
1 000 000
2000 2005 2010 2015 2020
E.c
oli
W
QI
3
6
9
12
15
DB3
1
10
100
1 000
10 000
100 000
1 000 000
2000 2005 2010 2015 2020
E.c
oli
W
QI
3
6
9
12
15
DB1
1
10
100
1 000
10 000
100 000
1 000 000
2000 2005 2010 2015 2020
E.c
oli
W
QI
3
6
9
12
15
DB2
1
10
100
1 000
10 000
100 000
1 000 000
2000 2005 2010 2015 2020
E.c
oli
W
QI
3
6
9
12
15
DB8
1
10
100
1 000
10 000
100 000
1 000 000
2000 2005 2010 2015 2020
E.c
oli
W
QI
WQI Annual Water Quality Index ( Excellent Good Fair Bad Very Bad)
E. coli Annual geometric mean E. coli level (counts/100mL)
River Water Quality in Hong Kong 2020 28
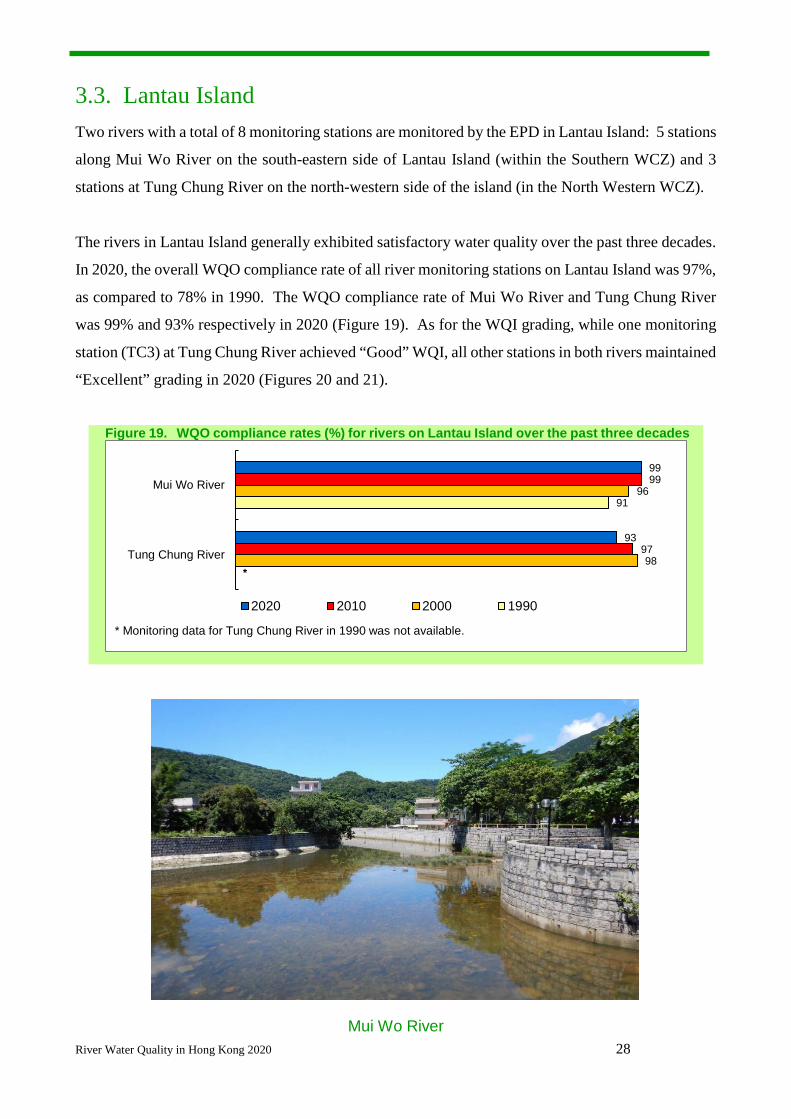
3.3. Lantau Island Two rivers with a total of 8 monitoring stations are monitored by the EPD in Lantau Island: 5 stations
along Mui Wo River on the south-eastern side of Lantau Island (within the Southern WCZ) and 3
stations at Tung Chung River on the north-western side of the island (in the North Western WCZ).
The rivers in Lantau Island generally exhibited satisfactory water quality over the past three decades.
In 2020, the overall WQO compliance rate of all river monitoring stations on Lantau Island was 97%,
as compared to 78% in 1990. The WQO compliance rate of Mui Wo River and Tung Chung River
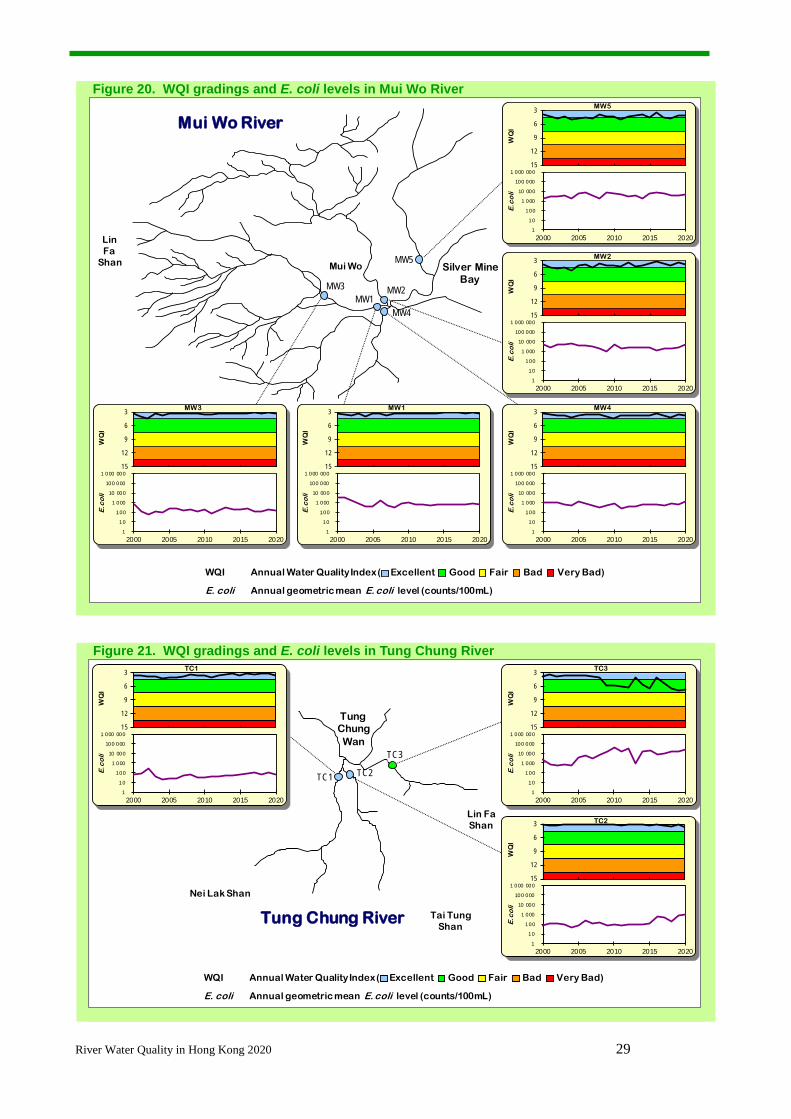
was 99% and 93% respectively in 2020 (Figure 19). As for the WQI grading, while one monitoring
station (TC3) at Tung Chung River achieved “Good” WQI, all other stations in both rivers maintained
“Excellent” grading in 2020 (Figures 20 and 21).
Figure 19. WQO compliance rates (%) for rivers on Lantau Island over the past three decades
Mui Wo River
99
93
99
97
96
98
91
*
Mui Wo River
Tung Chung River
2020 2010 2000 1990
* Monitoring data for Tung Chung River in 1990 was not available.
River Water Quality in Hong Kong 2020 29
Figure 20. WQI gradings and E. coli levels in Mui Wo River
Figure 21. WQI gradings and E. coli levels in Tung Chung River
MW3MW1
MW4
MW2
MW5
Mui Wo River
LinFa
Shan Mui Wo Silver MineBay
3
6
9
12
15
MW3
1
10
100
1 000
10 000
100 000
1 000 000
2000 2005 2010 2015 2020
E.c
oli
W
QI
3
6
9
12
15
MW1
1
10
100
1 000
10 000
100 000
1 000 000
2000 2005 2010 2015 2020
E.c
oli
W
QI
3
6
9
12
15
MW4
1
10
100
1 000
10 000
100 000
1 000 000
2000 2005 2010 2015 2020
E.c
oli
W
QI
3
6
9
12
15
MW2
1
10
100
1 000
10 000
100 000
1 000 000
2000 2005 2010 2015 2020
E.c
oli
W
QI
3
6
9
12
15
MW5
1
10
100
1 000
10 000
100 000
1 000 000
2000 2005 2010 2015 2020
E.c
oli
W
QI
WQI Annual Water Quality Index ( Excellent Good Fair Bad Very Bad)
E. coli Annual geometric mean E. coli level (counts/100mL)
Tung Chung River
TungChungWan
TC1 TC2
TC3
Nei Lak Shan
Lin FaShan
Tai TungShan
3
6
9
12
15
TC1
1
10
100
1 000
10 000
100 000
1 000 000
2000 2005 2010 2015 2020
E.c
oli
W
QI
3
6
9
12
15
TC3
1
10
100
1 000
10 000
100 000
1 000 000
2000 2005 2010 2015 2020
E.c
oli
W
QI
3
6
9
12
15
TC2
1
10
100
1 000
10 000
100 000
1 000 000
2000 2005 2010 2015 2020
E.c
oli
W
QI
WQI Annual Water Quality Index ( Excellent Good Fair Bad Very Bad)
E. coli Annual geometric mean E. coli level (counts/100mL)
River Water Quality in Hong Kong 2020 30
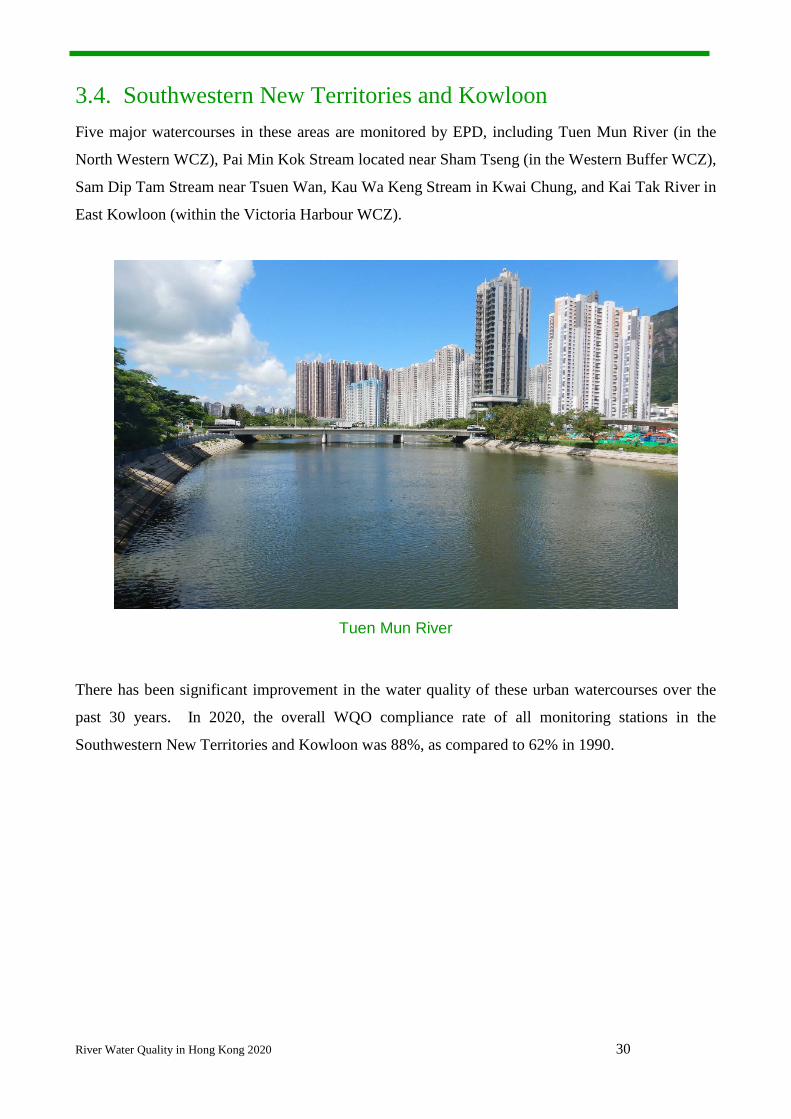
3.4. Southwestern New Territories and Kowloon Five major watercourses in these areas are monitored by EPD, including Tuen Mun River (in the
North Western WCZ), Pai Min Kok Stream located near Sham Tseng (in the Western Buffer WCZ),
Sam Dip Tam Stream near Tsuen Wan, Kau Wa Keng Stream in Kwai Chung, and Kai Tak River in
East Kowloon (within the Victoria Harbour WCZ).
Tuen Mun River
There has been significant improvement in the water quality of these urban watercourses over the
past 30 years. In 2020, the overall WQO compliance rate of all monitoring stations in the
Southwestern New Territories and Kowloon was 88%, as compared to 62% in 1990.
River Water Quality in Hong Kong 2020 31
Figure 22. WQO compliance rates (%) for rivers and streams in Southwestern New Territories and Kowloon over the past three decades
As a major river in the Southwestern New Territories, Tuen Mun River passes through Lam Tei, San
Hing Tsuen and Fu Tei in its upstream section, and then the densely populated Tuen Mun town in its
mid-stream before draining into the Tuen Mun Typhoon Shelter. The river showed marked water
quality improvement in the last three decades, with its WQO compliance rate rising significantly from
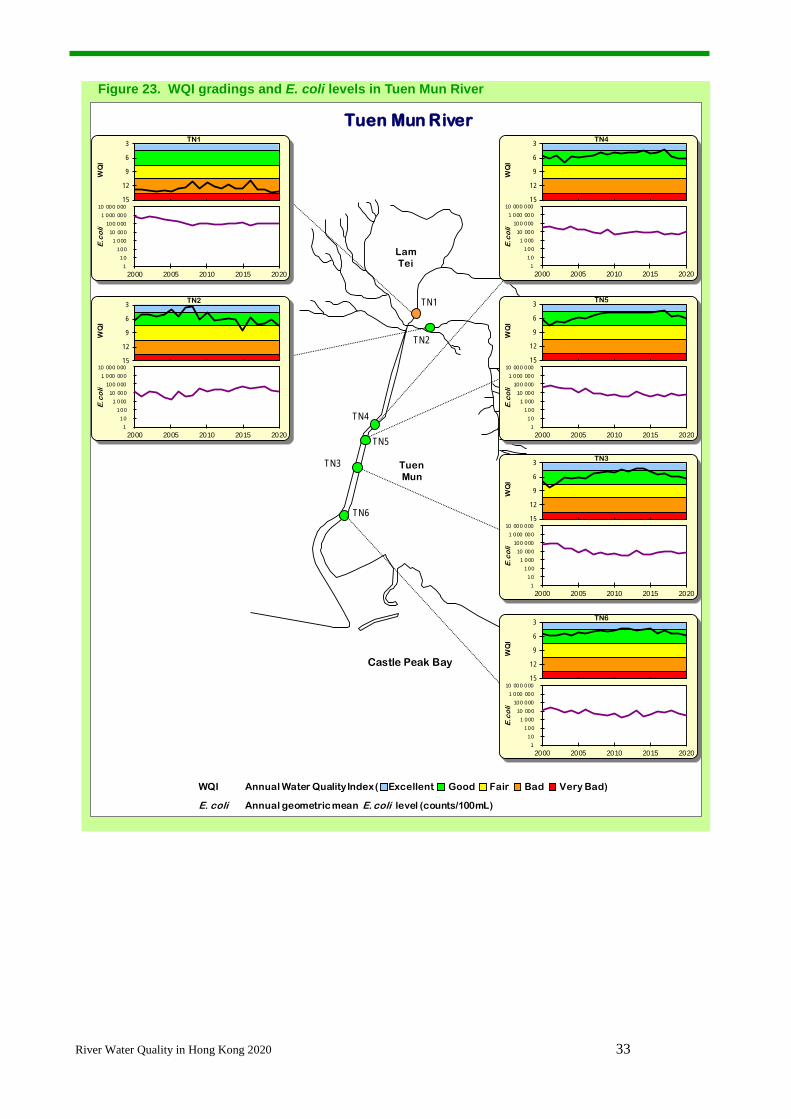
38% in 1990 to 84% in 2020 (Figure 22). Five of the 6 monitoring stations (TN2, TN3, TN4, TN5
and TN6) situated from the middle to lower sections of the river maintained “Good” WQI grading.
In 2020, the upstream monitoring station (TN1) was rated “Bad”, mainly due to discharges from
unsewered rural areas (Figure 23).
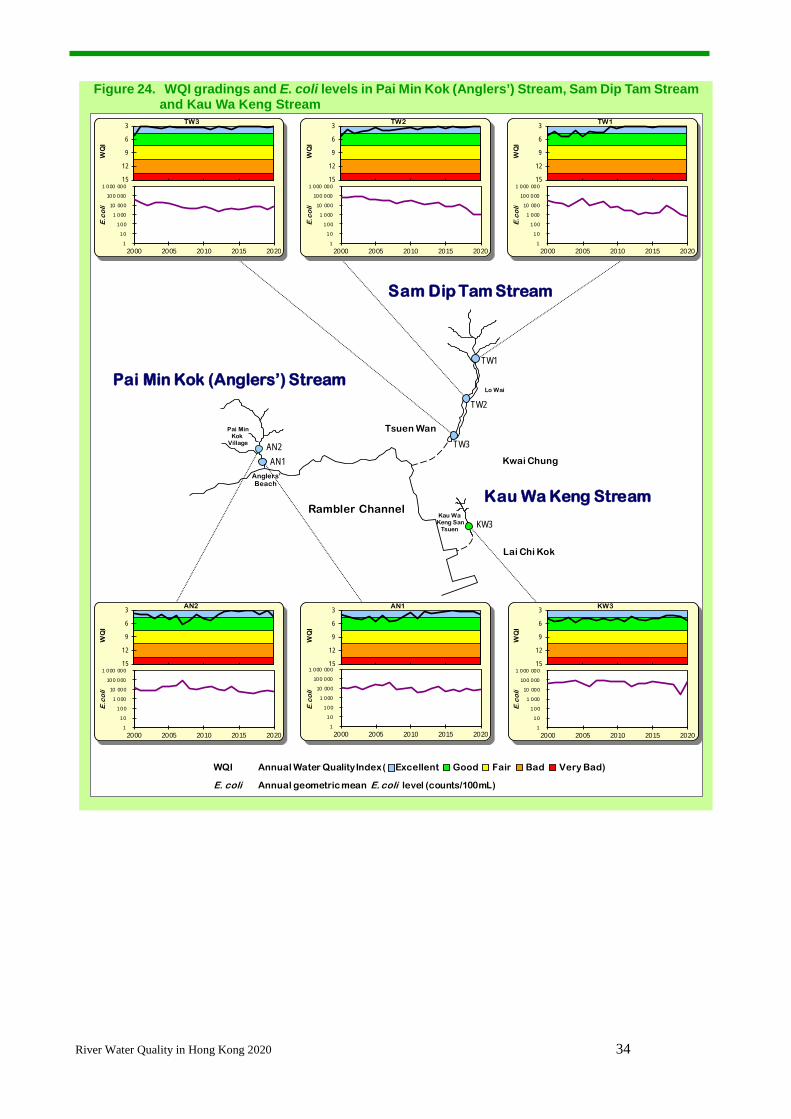
Pai Min Kok Stream located near Sham Tseng achieved an overall WQO compliance rate of 91% in
2020 (Figure 22). Both monitoring stations (AN1 and AN2) in the stream maintained “Excellent”
WQI grading (Figure 24).
84
91
100
94
85
93
96
98
97
85
71
98
92
97
66
38
88
88
75
*
Tuen Mun River
Pai Min Kok (Anglers')Stream
Sam Dip Tam Stream
Kau Wa Keng Stream
Kai Tak River
2020 2010 2000 1990
* Monitoring data for Kai Tak River in 1990 was not available.
River Water Quality in Hong Kong 2020 32
Sam Dip Tam Stream in Tsuen Wan fully met the WQOs in 2020 and 2019 (Figure 22). All 3
monitoring stations in the stream maintained “Excellent” WQI grading (Figure 24).
Kau Wa Keng Stream (monitoring station KW3) in Kwai Chung achieved a WQO compliance rate
of 94% in 2020, as compared with 75% in 1990 (Figure 22). Its “Excellent” WQI grading continued
in 2020 (Figure 24).
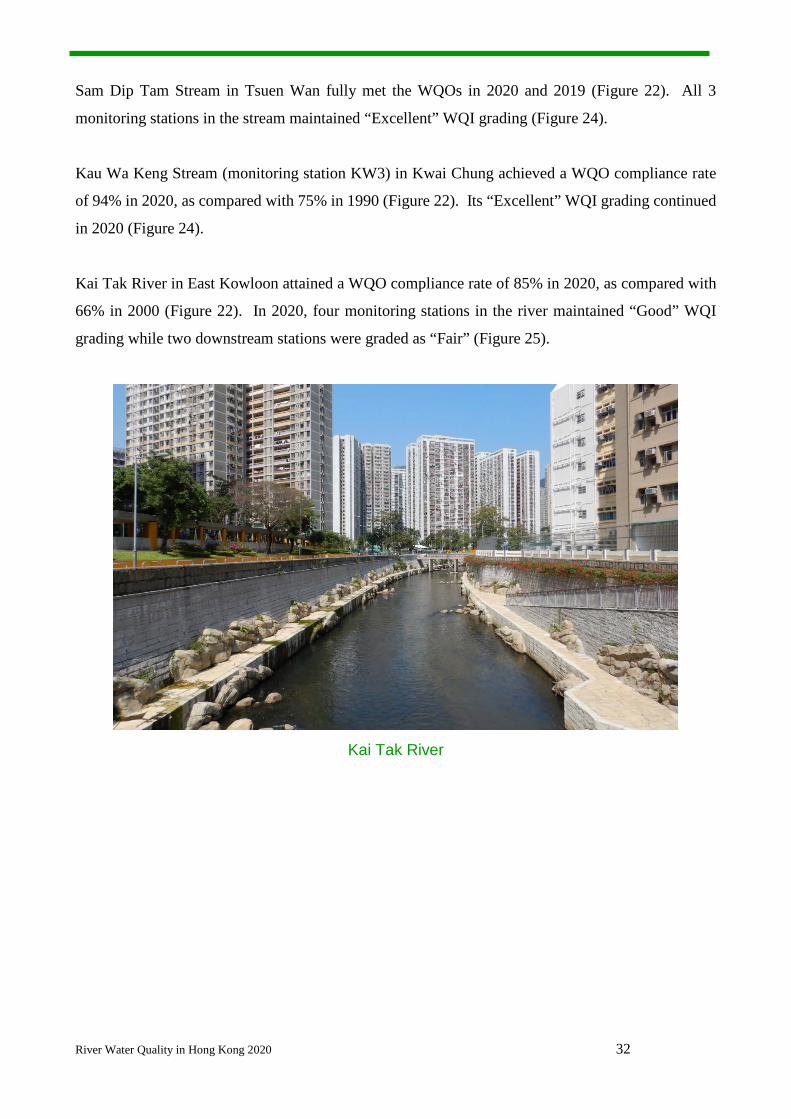
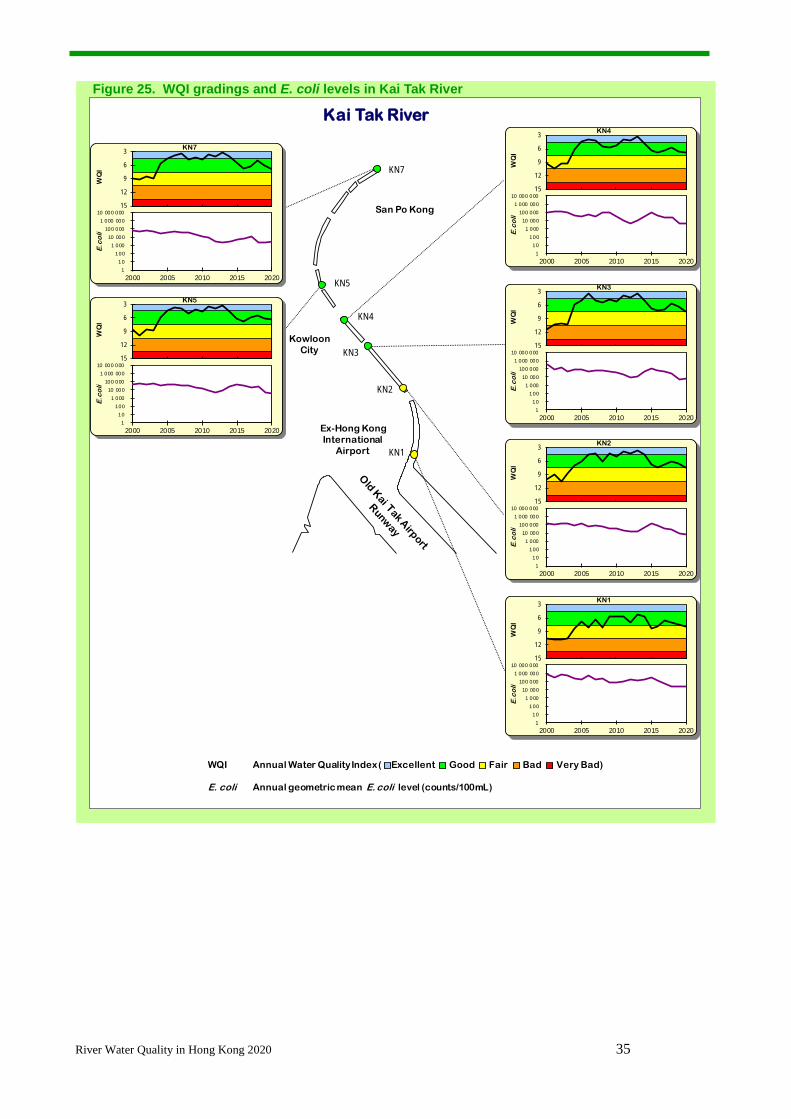
Kai Tak River in East Kowloon attained a WQO compliance rate of 85% in 2020, as compared with
66% in 2000 (Figure 22). In 2020, four monitoring stations in the river maintained “Good” WQI
grading while two downstream stations were graded as “Fair” (Figure 25).
Kai Tak River
River Water Quality in Hong Kong 2020 33
Figure 23. WQI gradings and E. coli levels in Tuen Mun River
WQI Annual Water Quality Index ( Excellent Good Fair Bad Very Bad)
E. coli Annual geometric mean E. coli level (counts/100mL)
Tuen Mun River
Castle Peak Bay
TN1
TN2
TN4
TN5
TN3
TN6
LamTei
TuenMun
3
6
9
12
15
TN1
1 10
100 1 000
10 000 100 000
1 000 000 10 000 000
2000 2005 2010 2015 2020
E.c
oli
W
QI
3
6
9
12
15
TN2
1 10
100 1 000
10 000 100 000
1 000 000 10 000 000
2000 2005 2010 2015 2020
E.c
oli
W
QI
3
6
9
12
15
TN4
E.c
oli
W
QI
3
6
9
12
15
TN5
1 10
100 1 000
10 000 100 000
1 000 000 10 000 000
2000 2005 2010 2015 2020
E.c
oli
W
QI
3
6
9
12
15
TN3
1 10
100 1 000
10 000 100 000
1 000 000 10 000 000
2000 2005 2010 2015 2020
E.c
oli
W
QI
3
6
9
12
15
TN6
1 10
100 1 000
10 000 100 000
1 000 000 10 000 000
2000 2005 2010 2015 2020
E.c
oli
W
QI
1 10
100 1 000
10 000 100 000
1 000 000 10 000 000
2000 2005 2010 2015 2020
River Water Quality in Hong Kong 2020 34
Figure 24. WQI gradings and E. coli levels in Pai Min Kok (Anglers’) Stream, Sam Dip Tam Stream and Kau Wa Keng Stream
WQI Annual Water Quality Index ( Excellent Good Fair Bad Very Bad)
E. coli Annual geometric mean E. coli level (counts/100mL)
Kau WaKeng San
Tsuen
Kau Wa Keng Stream
Sam Dip Tam Stream
Pai Min Kok (Anglers’) Stream
AN1AN2
Pai MinKok
Village
KW3Rambler Channel
Lo Wai
TW2
TW1
TW3
Anglers’Beach
Lai Chi Kok
Kwai Chung
Tsuen Wan
3
6
9
12
15
TW3
1
10
100
1 000
10 000
100 000
1 000 000
2000 2005 2010 2015 2020
E.c
oli
W
QI
3
6
9
12
15
TW2
1
10
100
1 000
10 000
100 000
1 000 000
2000 2005 2010 2015 2020
E.c
oli
W
QI
3
6
9
12
15
TW1
1
10
100
1 000
10 000
100 000
1 000 000
2000 2005 2010 2015 2020
E.c
oli
W
QI
3
6
9
12
15
AN2
1
10
100
1 000
10 000
100 000
1 000 000
2000 2005 2010 2015 2020
E.c
oli
W
QI
3
6
9
12
15
AN1
1
10
100
1 000
10 000
100 000
1 000 000
2000 2005 2010 2015 2020
E.c
oli
W
QI
3
6
9
12
15
KW3
1
10
100
1 000
10 000
100 000
1 000 000
2000 2005 2010 2015 2020
E.c
oli
W
QI
River Water Quality in Hong Kong 2020 35
Figure 25. WQI gradings and E. coli levels in Kai Tak River
WQI Annual Water Quality Index ( Excellent Good Fair Bad Very Bad)
E. coli Annual geometric mean E. coli level (counts/100mL)
Kai Tak River
KN1
KN2
KN4
KN5
KN3
KN7
San Po Kong
KowloonCity
Ex-Hong KongInternational
Airport
3
6
9
12
15
KN7
1 10
100 1 000
10 000 100 000
1 000 000 10 000 000
2000 2005 2010 2015 2020
E.c
oli
W
QI
3
6
9
12
15
KN5
1 10
100 1 000
10 000 100 000
1 000 000 10 000 000
2000 2005 2010 2015 2020
E.c
oli
W
QI
3
6
9
12
15
KN4
1 10
100 1 000
10 000 100 000
1 000 000 10 000 000
2000 2005 2010 2015 2020
E.c
oli
W
QI
3
6
9
12
15
KN3
1 10
100 1 000
10 000 100 000
1 000 000 10 000 000
2000 2005 2010 2015 2020
E.c
oli
W
QI
3
6
9
12
15
KN2
1 10
100 1 000
10 000 100 000
1 000 000 10 000 000
2000 2005 2010 2015 2020
E.c
oli
W
QI
3
6
9
12
15
KN1
1 10
100 1 000
10 000 100 000
1 000 000 10 000 000
2000 2005 2010 2015 2020
E.c
oli
W
QI
Appendices
Appendix A
River Water Quality in Hong Kong in 2020 A - 1
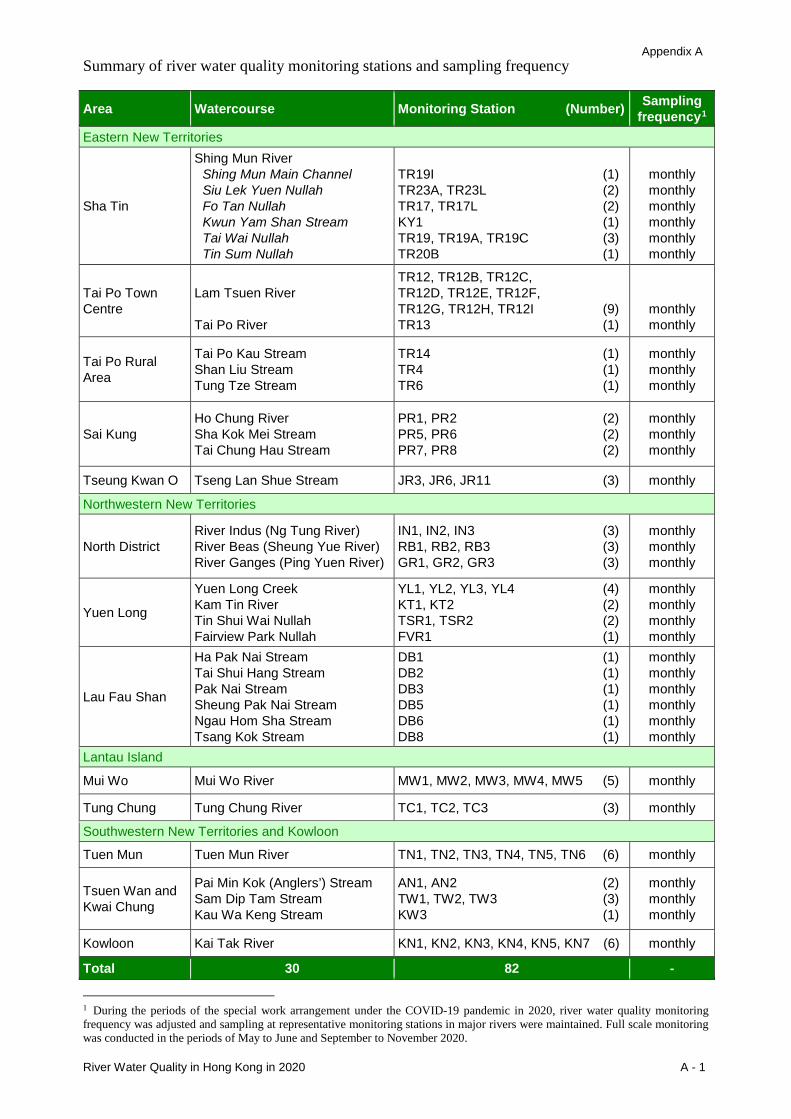
Summary of river water quality monitoring stations and sampling frequency Area Watercourse Monitoring Station (Number) Sampling
frequency1 Eastern New Territories
Sha Tin
Shing Mun River Shing Mun Main Channel Siu Lek Yuen Nullah Fo Tan Nullah Kwun Yam Shan Stream Tai Wai Nullah Tin Sum Nullah
TR19I (1) TR23A, TR23L (2) TR17, TR17L (2) KY1 (1) TR19, TR19A, TR19C (3) TR20B (1)
monthly monthly monthly monthly monthly monthly
Tai Po Town Centre
Lam Tsuen River Tai Po River
TR12, TR12B, TR12C, TR12D, TR12E, TR12F, TR12G, TR12H, TR12I (9) TR13 (1)
monthly monthly
Tai Po Rural Area
Tai Po Kau Stream Shan Liu Stream Tung Tze Stream
TR14 (1) TR4 (1) TR6 (1)
monthly monthly monthly
Sai Kung Ho Chung River Sha Kok Mei Stream Tai Chung Hau Stream
PR1, PR2 (2) PR5, PR6 (2) PR7, PR8 (2)
monthly monthly monthly
Tseung Kwan O Tseng Lan Shue Stream JR3, JR6, JR11 (3) monthly
Northwestern New Territories
North District River Indus (Ng Tung River) River Beas (Sheung Yue River) River Ganges (Ping Yuen River)
IN1, IN2, IN3 (3) RB1, RB2, RB3 (3) GR1, GR2, GR3 (3)
monthly monthly monthly
Yuen Long
Yuen Long Creek Kam Tin River Tin Shui Wai Nullah Fairview Park Nullah
YL1, YL2, YL3, YL4 (4) KT1, KT2 (2) TSR1, TSR2 (2) FVR1 (1)
monthly monthly monthly monthly
Lau Fau Shan
Ha Pak Nai Stream Tai Shui Hang Stream Pak Nai Stream Sheung Pak Nai Stream Ngau Hom Sha Stream Tsang Kok Stream
DB1 (1) DB2 (1) DB3 (1) DB5 (1) DB6 (1) DB8 (1)
monthly monthly monthly monthly monthly monthly
Lantau Island
Mui Wo Mui Wo River MW1, MW2, MW3, MW4, MW5 (5) monthly
Tung Chung Tung Chung River TC1, TC2, TC3 (3) monthly
Southwestern New Territories and Kowloon
Tuen Mun Tuen Mun River TN1, TN2, TN3, TN4, TN5, TN6 (6) monthly
Tsuen Wan and Kwai Chung
Pai Min Kok (Anglers’) Stream Sam Dip Tam Stream Kau Wa Keng Stream
AN1, AN2 (2) TW1, TW2, TW3 (3) KW3 (1)
monthly monthly monthly
Kowloon Kai Tak River KN1, KN2, KN3, KN4, KN5, KN7 (6) monthly
Total 30 82 -
1 During the periods of the special work arrangement under the COVID-19 pandemic in 2020, river water quality monitoring frequency was adjusted and sampling at representative monitoring stations in major rivers were maintained. Full scale monitoring was conducted in the periods of May to June and September to November 2020.
Appendix B
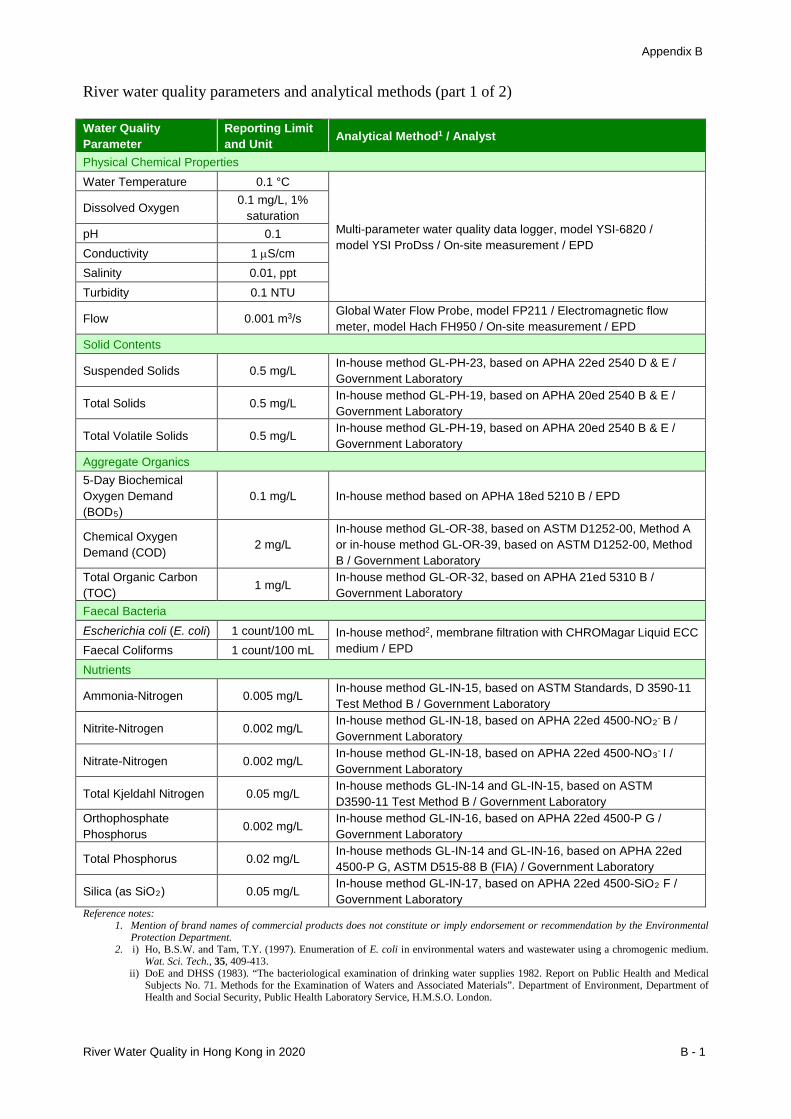
River Water Quality in Hong Kong in 2020 B - 1
River water quality parameters and analytical methods (part 1 of 2) Water Quality Parameter
Reporting Limit and Unit Analytical Method1 / Analyst
Physical Chemical Properties Water Temperature 0.1 °C
Multi-parameter water quality data logger, model YSI-6820 / model YSI ProDss / On-site measurement / EPD
Dissolved Oxygen 0.1 mg/L, 1% saturation
pH 0.1 Conductivity 1 µS/cm Salinity 0.01, ppt Turbidity 0.1 NTU
Flow 0.001 m3/s Global Water Flow Probe, model FP211 / Electromagnetic flow meter, model Hach FH950 / On-site measurement / EPD
Solid Contents
Suspended Solids 0.5 mg/L In-house method GL-PH-23, based on APHA 22ed 2540 D & E / Government Laboratory
Total Solids 0.5 mg/L In-house method GL-PH-19, based on APHA 20ed 2540 B & E / Government Laboratory
Total Volatile Solids 0.5 mg/L In-house method GL-PH-19, based on APHA 20ed 2540 B & E / Government Laboratory
Aggregate Organics 5-Day Biochemical Oxygen Demand (BOD5)
0.1 mg/L In-house method based on APHA 18ed 5210 B / EPD
Chemical Oxygen Demand (COD) 2 mg/L
In-house method GL-OR-38, based on ASTM D1252-00, Method A or in-house method GL-OR-39, based on ASTM D1252-00, Method B / Government Laboratory
Total Organic Carbon (TOC) 1 mg/L In-house method GL-OR-32, based on APHA 21ed 5310 B /
Government Laboratory Faecal Bacteria Escherichia coli (E. coli) 1 count/100 mL In-house method2, membrane filtration with CHROMagar Liquid ECC
medium / EPD Faecal Coliforms 1 count/100 mL Nutrients
Ammonia-Nitrogen 0.005 mg/L In-house method GL-IN-15, based on ASTM Standards, D 3590-11 Test Method B / Government Laboratory
Nitrite-Nitrogen 0.002 mg/L In-house method GL-IN-18, based on APHA 22ed 4500-NO2- B / Government Laboratory
Nitrate-Nitrogen 0.002 mg/L In-house method GL-IN-18, based on APHA 22ed 4500-NO3- I / Government Laboratory
Total Kjeldahl Nitrogen 0.05 mg/L In-house methods GL-IN-14 and GL-IN-15, based on ASTM D3590-11 Test Method B / Government Laboratory
Orthophosphate Phosphorus 0.002 mg/L In-house method GL-IN-16, based on APHA 22ed 4500-P G /
Government Laboratory
Total Phosphorus 0.02 mg/L In-house methods GL-IN-14 and GL-IN-16, based on APHA 22ed 4500-P G, ASTM D515-88 B (FIA) / Government Laboratory
Silica (as SiO2) 0.05 mg/L In-house method GL-IN-17, based on APHA 22ed 4500-SiO2 F / Government Laboratory
Reference notes: 1. Mention of brand names of commercial products does not constitute or imply endorsement or recommendation by the Environmental
Protection Department. 2. i) Ho, B.S.W. and Tam, T.Y. (1997). Enumeration of E. coli in environmental waters and wastewater using a chromogenic medium.
Wat. Sci. Tech., 35, 409-413. ii) DoE and DHSS (1983). “The bacteriological examination of drinking water supplies 1982. Report on Public Health and Medical
Subjects No. 71. Methods for the Examination of Waters and Associated Materials”. Department of Environment, Department of Health and Social Security, Public Health Laboratory Service, H.M.S.O. London.
Appendix B
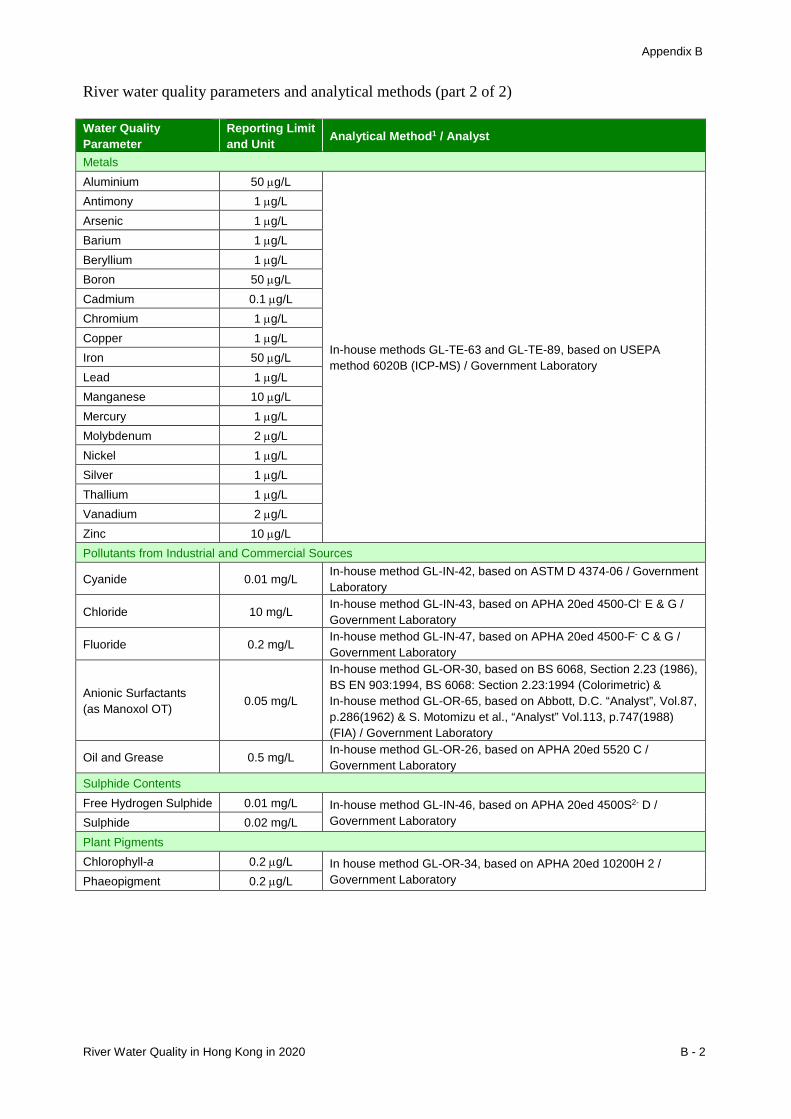
River Water Quality in Hong Kong in 2020 B - 2
River water quality parameters and analytical methods (part 2 of 2) Water Quality Parameter
Reporting Limit and Unit Analytical Method1 / Analyst
Metals Aluminium 50 µg/L
In-house methods GL-TE-63 and GL-TE-89, based on USEPA method 6020B (ICP-MS) / Government Laboratory
Antimony 1 µg/L Arsenic 1 µg/L Barium 1 µg/L Beryllium 1 µg/L Boron 50 µg/L Cadmium 0.1 µg/L Chromium 1 µg/L Copper 1 µg/L Iron 50 µg/L Lead 1 µg/L Manganese 10 µg/L Mercury 1 µg/L Molybdenum 2 µg/L Nickel 1 µg/L Silver 1 µg/L Thallium 1 µg/L Vanadium 2 µg/L Zinc 10 µg/L Pollutants from Industrial and Commercial Sources
Cyanide 0.01 mg/L In-house method GL-IN-42, based on ASTM D 4374-06 / Government Laboratory
Chloride 10 mg/L In-house method GL-IN-43, based on APHA 20ed 4500-Cl- E & G / Government Laboratory
Fluoride 0.2 mg/L In-house method GL-IN-47, based on APHA 20ed 4500-F- C & G / Government Laboratory
Anionic Surfactants (as Manoxol OT) 0.05 mg/L
In-house method GL-OR-30, based on BS 6068, Section 2.23 (1986), BS EN 903:1994, BS 6068: Section 2.23:1994 (Colorimetric) & In-house method GL-OR-65, based on Abbott, D.C. “Analyst”, Vol.87, p.286(1962) & S. Motomizu et al., “Analyst” Vol.113, p.747(1988) (FIA) / Government Laboratory
Oil and Grease 0.5 mg/L In-house method GL-OR-26, based on APHA 20ed 5520 C / Government Laboratory
Sulphide Contents Free Hydrogen Sulphide 0.01 mg/L In-house method GL-IN-46, based on APHA 20ed 4500S2- D /
Government Laboratory Sulphide 0.02 mg/L Plant Pigments Chlorophyll-a 0.2 µg/L In house method GL-OR-34, based on APHA 20ed 10200H 2 /
Government Laboratory Phaeopigment 0.2 µg/L
Appendix C
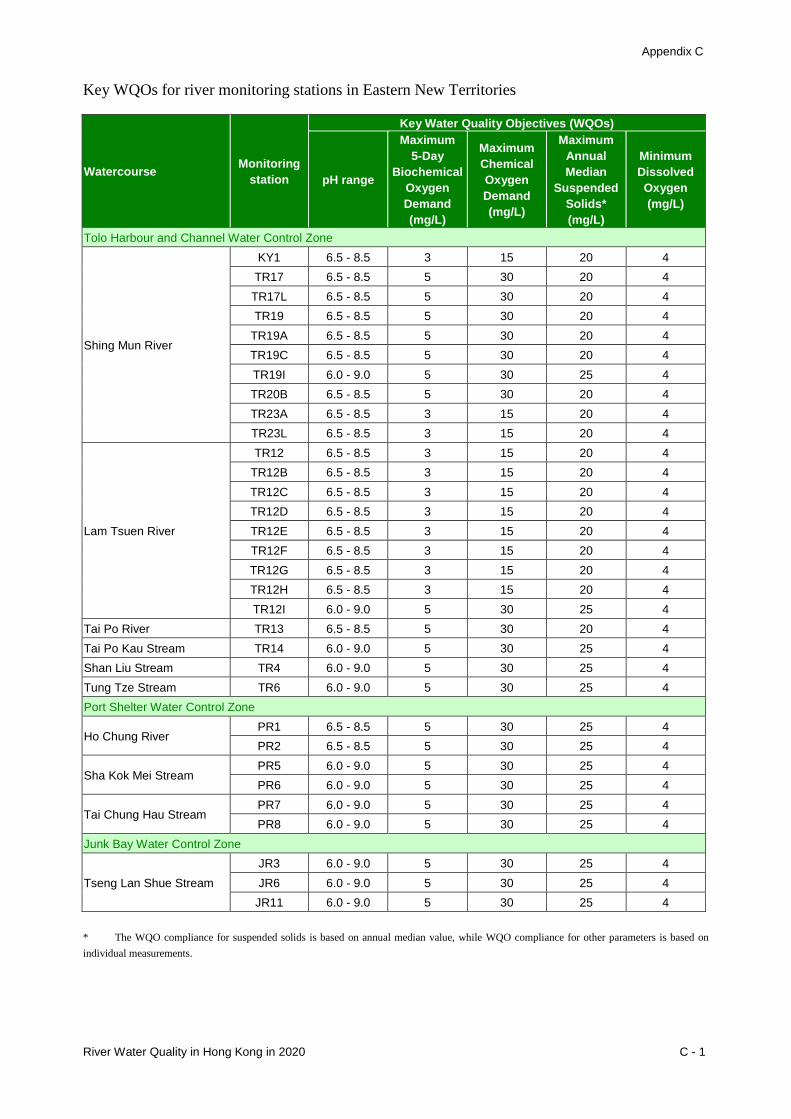
River Water Quality in Hong Kong in 2020 C - 1
Key WQOs for river monitoring stations in Eastern New Territories
Watercourse Monitoring station
Key Water Quality Objectives (WQOs)
pH range
Maximum 5-Day
Biochemical Oxygen Demand (mg/L)
Maximum Chemical Oxygen Demand (mg/L)
Maximum Annual Median
Suspended Solids* (mg/L)
Minimum Dissolved Oxygen (mg/L)
Tolo Harbour and Channel Water Control Zone
Shing Mun River
KY1 6.5 - 8.5 3 15 20 4 TR17 6.5 - 8.5 5 30 20 4
TR17L 6.5 - 8.5 5 30 20 4 TR19 6.5 - 8.5 5 30 20 4
TR19A 6.5 - 8.5 5 30 20 4 TR19C 6.5 - 8.5 5 30 20 4 TR19I 6.0 - 9.0 5 30 25 4 TR20B 6.5 - 8.5 5 30 20 4 TR23A 6.5 - 8.5 3 15 20 4 TR23L 6.5 - 8.5 3 15 20 4
Lam Tsuen River
TR12 6.5 - 8.5 3 15 20 4 TR12B 6.5 - 8.5 3 15 20 4 TR12C 6.5 - 8.5 3 15 20 4 TR12D 6.5 - 8.5 3 15 20 4 TR12E 6.5 - 8.5 3 15 20 4 TR12F 6.5 - 8.5 3 15 20 4 TR12G 6.5 - 8.5 3 15 20 4 TR12H 6.5 - 8.5 3 15 20 4 TR12I 6.0 - 9.0 5 30 25 4
Tai Po River TR13 6.5 - 8.5 5 30 20 4 Tai Po Kau Stream TR14 6.0 - 9.0 5 30 25 4 Shan Liu Stream TR4 6.0 - 9.0 5 30 25 4 Tung Tze Stream TR6 6.0 - 9.0 5 30 25 4 Port Shelter Water Control Zone
Ho Chung River PR1 6.5 - 8.5 5 30 25 4 PR2 6.5 - 8.5 5 30 25 4
Sha Kok Mei Stream PR5 6.0 - 9.0 5 30 25 4 PR6 6.0 - 9.0 5 30 25 4
Tai Chung Hau Stream PR7 6.0 - 9.0 5 30 25 4 PR8 6.0 - 9.0 5 30 25 4
Junk Bay Water Control Zone
Tseng Lan Shue Stream JR3 6.0 - 9.0 5 30 25 4 JR6 6.0 - 9.0 5 30 25 4
JR11 6.0 - 9.0 5 30 25 4 * The WQO compliance for suspended solids is based on annual median value, while WQO compliance for other parameters is based on individual measurements.
Appendix C
River Water Quality in Hong Kong in 2020 C - 2
Key WQOs for river monitoring stations in Northwestern New Territories
Watercourse Monitoring station
Key Water Quality Objectives (WQOs)
pH range
Maximum 5-Day
Biochemical Oxgyen Demand (mg/L)
Maximum Chemical Oxygen Demand (mg/L)
Maximum Annual Median
Suspended Solids* (mg/L)
Minimum Dissolved Oxygen (mg/L)
Deep Bay Water Control Zone
River Indus IN1 6.5 - 8.5 3 15 20 4 IN2 6.5 - 8.5 3 15 20 4 IN3 6.5 - 8.5 3 15 20 4
River Beas RB1 6.5 - 8.5 3 15 20 4 RB2 6.5 - 8.5 3 15 20 4 RB3 6.5 - 8.5 3 15 20 4
River Ganges GR1 6.5 - 8.5 3 15 20 4 GR2 6.5 - 8.5 3 15 20 4 GR3 6.5 - 8.5 3 15 20 4
Yuen Long Creek
YL1 6.5 - 8.5 3 15 20 4 YL2 6.5 - 8.5 3 15 20 4 YL3 6.5 - 8.5 5 30 20 4 YL4 6.5 - 8.5 5 30 20 4
Kam Tin River KT1 6.5 - 8.5 3 15 20 4 KT2 6.5 - 8.5 3 15 20 4
Tin Shui Wai Nullah TSR1 6.0 - 9.0 5 30 20 4 TSR2 6.0 - 9.0 5 30 20 4
Fairview Park Nullah FVR1 6.0 - 9.0 5 30 20 4 Ha Pak Nai Stream DB1 6.0 - 9.0 5 30 20 4 Tai Shui Hang Stream DB2 6.0 - 9.0 5 30 20 4 Pak Nai Stream DB3 6.0 - 9.0 5 30 20 4 Sheung Pak Nai Stream DB5 6.0 - 9.0 5 30 20 4 Ngau Hom Sha Stream DB6 6.0 - 9.0 5 30 20 4 Tsang Kok Stream DB8 6.0 - 9.0 5 30 20 4 * The WQO compliance for suspended solids is based on annual median value, while WQO compliance for other parameters is based on individual measurements.
Appendix C
River Water Quality in Hong Kong in 2020 C - 3
Key WQOs for river monitoring stations on Lantau Island
Watercourse Monitoring station
Key Water Quality Objectives (WQOs)
pH range
Maximum 5-Day
Biochemical Oxgyen Demand (mg/L)
Maximum Chemical Oxygen Demand (mg/L)
Maximum Annual Median
Suspended Solids* (mg/L)
Minimum Dissolved Oxygen (mg/L)
Southern Water Control Zone
Mui Wo River
MW1 6.5 - 8.5 5 30 20 4 MW2 6.5 - 8.5 5 30 20 4 MW3 6.5 - 8.5 5 30 20 4 MW4 6.5 - 8.5 5 30 20 4 MW5 6.0 - 9.0 5 30 25 4
North Western Water Control Zone
Tung Chung River TC1 6.0 - 9.0 5 30 25 4 TC2 6.0 - 9.0 5 30 25 4 TC3 6.0 - 9.0 5 30 25 4
* The WQO compliance for suspended solids is based on annual median value, while WQO compliance for other parameters is based on individual measurements.
Appendix C
River Water Quality in Hong Kong in 2020 C - 4
Key WQOs for river monitoring stations in Southwestern New Territories and Kowloon
Watercourse Monitoring station
Key Water Quality Objectives (WQOs)
pH range
Maximum 5-Day
Biochemical Oxgyen Demand (mg/L)
Maximum Chemical Oxygen Demand (mg/L)
Maximum Annual Median
Suspended Solids (mg/L)
Minimum Dissolved Oxygen (mg/L)
North Western Water Control Zone
Tuen Mun River
TN1 6.0 - 9.0 5 30 25 4 TN2 6.5 - 8.5 3 15 20 4 TN3 6.0 - 9.0 5 30 25 4 TN4 6.0 - 9.0 5 30 25 4 TN5 6.0 - 9.0 5 30 25 4 TN6 6.0 - 9.0 5 30 25 4
Western Buffer Water Control Zone
Pai Min Kok (Anglers') Stream
AN1 6.0 - 9.0 5 30 25 4 AN2 6.0 - 9.0 5 30 25 4
Victoria Harbour Water Control Zone
Sam Dip Tam Stream TW1 6.0 - 9.0 5 30 25 4 TW2 6.0 - 9.0 5 30 25 4 TW3 6.0 - 9.0 5 30 25 4
Kau Wa Keng Stream KW3 6.0 - 9.0 5 30 25 4
Kai Tak River
KN1 6.0 - 9.0 5 30 25 4 KN2 6.0 - 9.0 5 30 25 4 KN3 6.0 - 9.0 5 30 25 4 KN4 6.0 - 9.0 5 30 25 4 KN5 6.0 - 9.0 5 30 25 4 KN7 6.0 - 9.0 5 30 25 4
* The WQO compliance for suspended solids is based on annual median value, while WQO compliance for other parameters is based on individual measurements.
Appendix D
River Water Quality in Hong Kong in 2020 D - 1
Water Control Zones (WCZs) in Hong Kong
N
17
2526
27
28
14
30
1112
13
8
5
7
10
15
9
6
4
3
29
18
19
16
20 21
2224
23
2 1
Wat
erco
urse
s
1.
Tsen
g La
n Sh
ueSt
ream
2.
Ho
Chu
ng R
iver
3.
Tai C
hung
Hau
Stre
am4.
Sh
a Ko
kM
ei S
tream
5.
Shin
gM
unR
iver
-Shi
ngM
unM
ain
Cha
nnel
-Fo
Tan
Nul
lah
-Siu
Lek
Yuen
Nul
lah
-Kw
unYa
m S
han
Stre
am-T
ai W
ai N
ulla
h-T
in S
um N
ulla
h6.
Ta
i Po
Kau
Stre
am7.
Ta
i Po
Riv
er8.
La
m T
suen
Riv
er9.
Tu
ng T
zeSt
ream
10. S
han
Liu
Stre
am11
. Riv
er G
ange
s12
. Riv
er In
dus
13. R
iver
Bea
s14
. Fai
rvie
w P
ark
Nul
lah
15. K
am T
in R
iver
16. Y
uen
Long
Cre
ek17
. Tin
Shu
iWai
Nul
lah
18. N
gau
Hom
Sha
Stre
am19
. She
ung
Pak
Nai
Stre
am20
. Pak
Nai
Stre
am21
. Ha
Pak
Nai
Stre
am22
. Tai
Shu
iHan
g St
ream
23
. Tsa
ng K
okSt
ream
24. T
uen
Mun
Riv
er25
. Pai
Min
Kok
(Ang
lers
’) St
ream
26. S
am D
ip T
am S
tream
27. K
auW
aKe
ngSt
ream
28. K
ai T
akR
iver
29. M
ui W
o R
iver
30. T
ung
Chu
ng R
iver
LANT
AUIS
LAND
HONG
KO
NGIS
LAND
KOW
LOO
N
NEW
TER
RITO
RIES
SHEN
ZHEN
Area
s
East
ern
New
Ter
ritor
ies
Nor
thw
este
rn N
ew T
errit
orie
s
Sout
hwes
tern
New
Ter
ritor
ies
and
Kow
loon
Lant
au Is
land
5
1S
1S1
3
4
6
9
108
7
2S
2SI
7S2
2SI
10.2
10.1
10.1
10.3
2S
Wat
er C
ontro
l Zon
es (W
CZs)
Firs
t App
oint
ed D
ate
Tolo
Har
bour
& C
hann
elSo
uthe
rnPo
rt Sh
elte
rJu
nk B
ayD
eep
Bay
Mirs
Bay
Nor
th W
este
rnW
este
rn B
uffe
rEa
ster
n Bu
ffer
Tolo
Har
bour
Sup
plem
enta
rySo
uthe
rn S
uppl
emen
tary
Vict
oria
Har
bour
Phas
e 1
Phas
e 2
Phas
e 3
Seco
nd S
outh
ern
Supp
lem
enta
ryN
orth
Wes
tern
Sup
plem
enta
ry
1.4.
871.
8.88
1.8.
891.
8.89
1.12
.90
1.12
.90
1.4.
921.
6.93
1.6.
931.
6.93
1.6.
93
1.11
.94
1.9.
951.
4.96
1.11
.99
1.11
.99
1 2 3 4 5 6 7 8 9 1S 2S 1010
.1
10.2
10.3
2SI
7S
Wat
er C
ontr
ol Z
ones
in H
ong
Kong
Appendix D
River Water Quality in Hong Kong in 2020 D - 2
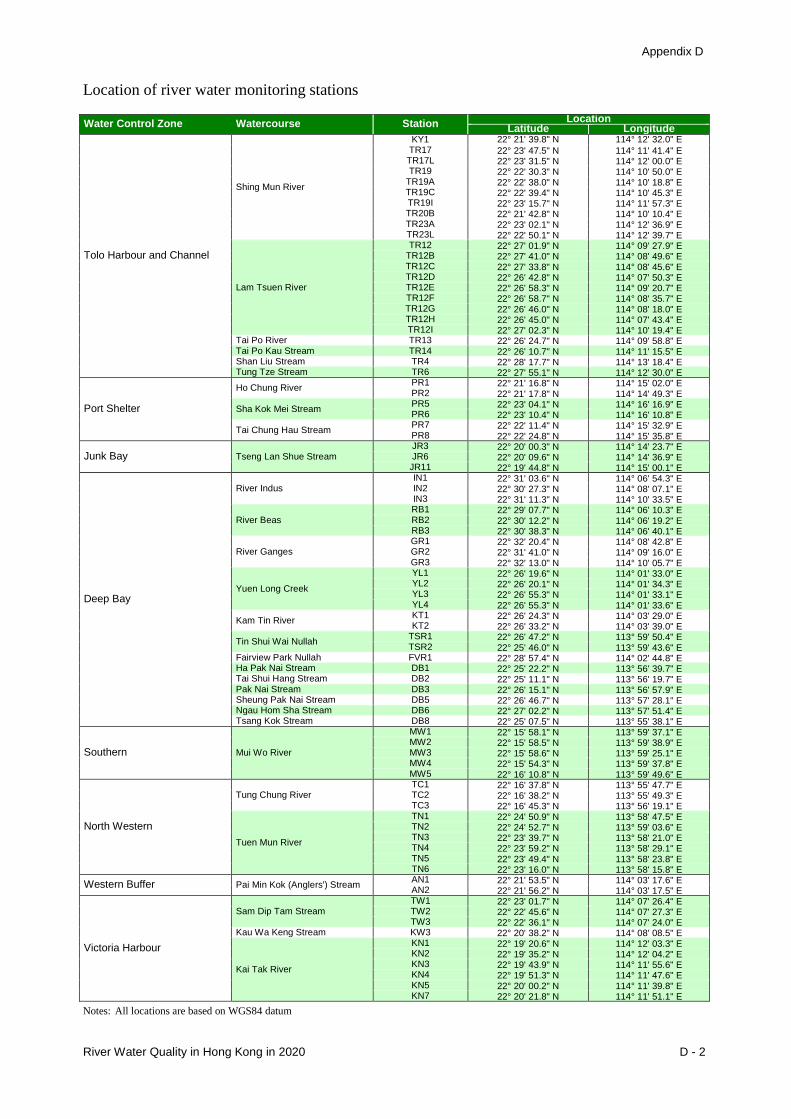
Location of river water monitoring stations Water Control Zone Watercourse Station Location
Latitude Longitude
Tolo Harbour and Channel
Shing Mun River
KY1 22° 21' 39.8" N 114° 12' 32.0" E TR17 22° 23' 47.5" N 114° 11' 41.4" E TR17L 22° 23' 31.5" N 114° 12' 00.0" E TR19 22° 22' 30.3" N 114° 10' 50.0" E
TR19A 22° 22' 38.0" N 114° 10' 18.8" E TR19C 22° 22' 39.4" N 114° 10' 45.3" E TR19I 22° 23' 15.7" N 114° 11' 57.3" E TR20B 22° 21' 42.8" N 114° 10' 10.4" E TR23A 22° 23' 02.1" N 114° 12' 36.9" E TR23L 22° 22' 50.1" N 114° 12' 39.7" E
Lam Tsuen River
TR12 22° 27' 01.9" N 114° 09' 27.9" E TR12B 22° 27' 41.0" N 114° 08' 49.6" E TR12C 22° 27' 33.8" N 114° 08' 45.6" E TR12D 22° 26' 42.8" N 114° 07' 50.3" E TR12E 22° 26' 58.3" N 114° 09' 20.7" E TR12F 22° 26' 58.7" N 114° 08' 35.7" E TR12G 22° 26' 46.0" N 114° 08' 18.0" E TR12H 22° 26' 45.0" N 114° 07' 43.4" E TR12I 22° 27' 02.3" N 114° 10' 19.4" E
Tai Po River TR13 22° 26' 24.7" N 114° 09' 58.8" E Tai Po Kau Stream TR14 22° 26' 10.7" N 114° 11' 15.5" E Shan Liu Stream TR4 22° 28' 17.7" N 114° 13' 18.4" E Tung Tze Stream TR6 22° 27' 55.1" N 114° 12' 30.0" E
Port Shelter
Ho Chung River PR1 22° 21' 16.8" N 114° 15' 02.0" E PR2 22° 21' 17.8" N 114° 14' 49.3" E
Sha Kok Mei Stream PR5 22° 23' 04.1" N 114° 16' 16.9" E PR6 22° 23' 10.4" N 114° 16' 10.8" E
Tai Chung Hau Stream PR7 22° 22' 11.4" N 114° 15' 32.9" E PR8 22° 22' 24.8" N 114° 15' 35.8" E
Junk Bay Tseng Lan Shue Stream JR3 22° 20' 00.3" N 114° 14' 23.7" E JR6 22° 20' 09.6" N 114° 14' 36.9" E JR11 22° 19' 44.8" N 114° 15' 00.1" E
Deep Bay
River Indus IN1 22° 31' 03.6" N 114° 06' 54.3" E IN2 22° 30' 27.3" N 114° 08' 07.1" E IN3 22° 31' 11.3" N 114° 10' 33.5" E
River Beas RB1 22° 29' 07.7" N 114° 06' 10.3" E RB2 22° 30' 12.2" N 114° 06' 19.2" E RB3 22° 30' 38.3" N 114° 06' 40.1" E
River Ganges GR1 22° 32' 20.4" N 114° 08' 42.8" E GR2 22° 31' 41.0" N 114° 09' 16.0" E GR3 22° 32' 13.0" N 114° 10' 05.7" E
Yuen Long Creek
YL1 22° 26' 19.6" N 114° 01' 33.0" E YL2 22° 26' 20.1" N 114° 01' 34.3" E YL3 22° 26' 55.3" N 114° 01' 33.1" E YL4 22° 26' 55.3" N 114° 01' 33.6" E
Kam Tin River KT1 22° 26' 24.3" N 114° 03' 29.0" E KT2 22° 26' 33.2" N 114° 03' 39.0" E
Tin Shui Wai Nullah TSR1 22° 26' 47.2" N 113° 59' 50.4" E TSR2 22° 25' 46.0" N 113° 59' 43.6" E
Fairview Park Nullah FVR1 22° 28' 57.4" N 114° 02' 44.8" E Ha Pak Nai Stream DB1 22° 25' 22.2" N 113° 56' 39.7" E Tai Shui Hang Stream DB2 22° 25' 11.1" N 113° 56' 19.7" E Pak Nai Stream DB3 22° 26' 15.1" N 113° 56' 57.9" E Sheung Pak Nai Stream DB5 22° 26' 46.7" N 113° 57' 28.1" E Ngau Hom Sha Stream DB6 22° 27' 02.2" N 113° 57' 51.4" E Tsang Kok Stream DB8 22° 25' 07.5" N 113° 55' 38.1" E
Southern Mui Wo River
MW1 22° 15' 58.1" N 113° 59' 37.1" E MW2 22° 15' 58.5" N 113° 59' 38.9" E MW3 22° 15' 58.6" N 113° 59' 25.1" E MW4 22° 15' 54.3" N 113° 59' 37.8" E MW5 22° 16' 10.8" N 113° 59' 49.6" E
North Western
Tung Chung River TC1 22° 16' 37.8" N 113° 55' 47.7" E TC2 22° 16' 38.2" N 113° 55' 49.3" E TC3 22° 16' 45.3" N 113° 56' 19.1" E
Tuen Mun River
TN1 22° 24' 50.9" N 113° 58' 47.5" E TN2 22° 24' 52.7" N 113° 59' 03.6" E TN3 22° 23' 39.7" N 113° 58' 21.0" E TN4 22° 23' 59.2" N 113° 58' 29.1" E TN5 22° 23' 49.4" N 113° 58' 23.8" E TN6 22° 23' 16.0" N 113° 58' 15.8" E
Western Buffer Pai Min Kok (Anglers') Stream AN1 22° 21' 53.5" N 114° 03' 17.6" E AN2 22° 21' 56.2" N 114° 03' 17.5" E
Victoria Harbour
Sam Dip Tam Stream TW1 22° 23' 01.7" N 114° 07' 26.4" E TW2 22° 22' 45.6" N 114° 07' 27.3" E TW3 22° 22' 36.1" N 114° 07' 24.0" E
Kau Wa Keng Stream KW3 22° 20' 38.2" N 114° 08' 08.5" E
Kai Tak River
KN1 22° 19' 20.6" N 114° 12' 03.3" E KN2 22° 19' 35.2" N 114° 12' 04.2" E KN3 22° 19' 43.9" N 114° 11' 55.6" E KN4 22° 19' 51.3" N 114° 11' 47.6" E KN5 22° 20' 00.2" N 114° 11' 39.8" E KN7 22° 20' 21.8" N 114° 11' 51.1" E
Notes: All locations are based on WGS84 datum
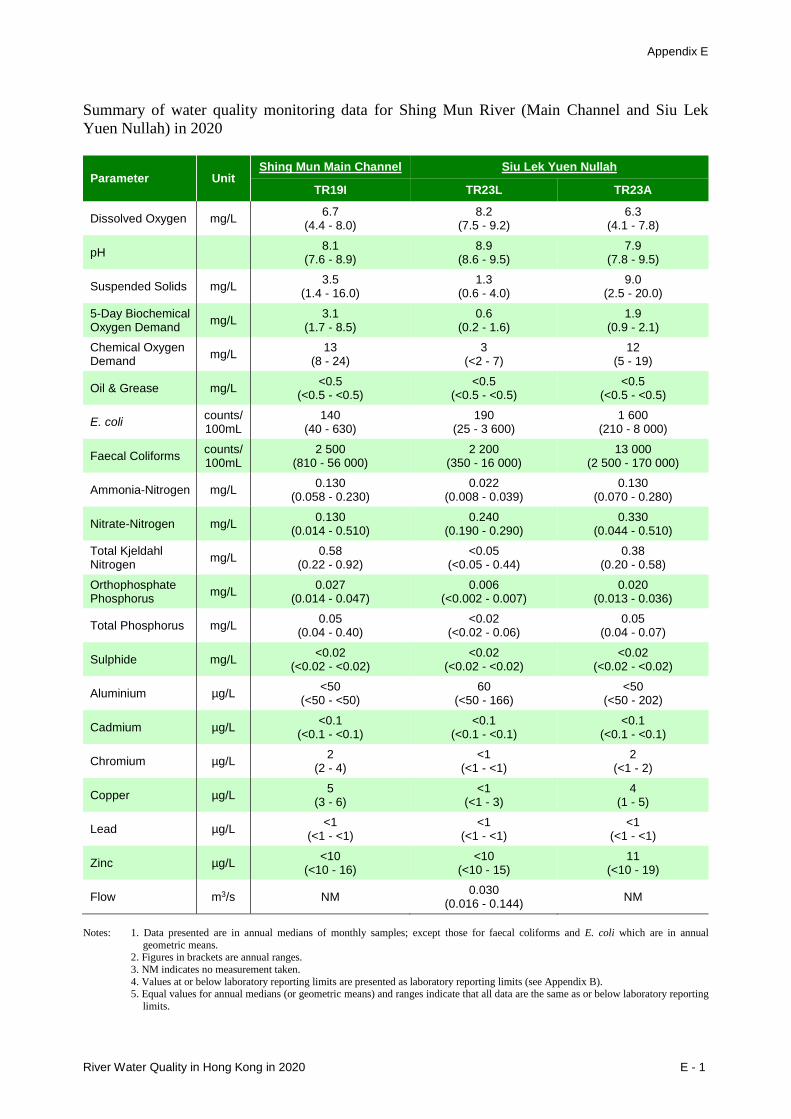
Appendix E
River Water Quality in Hong Kong in 2020 E - 1
Summary of water quality monitoring data for Shing Mun River (Main Channel and Siu Lek Yuen Nullah) in 2020
Parameter Unit Shing Mun Main Channel Siu Lek Yuen Nullah
TR19I TR23L TR23A
Dissolved Oxygen mg/L 6.7 (4.4 - 8.0)
8.2 (7.5 - 9.2)
6.3 (4.1 - 7.8)
pH 8.1 (7.6 - 8.9)
8.9 (8.6 - 9.5)
7.9 (7.8 - 9.5)
Suspended Solids mg/L 3.5 (1.4 - 16.0)
1.3 (0.6 - 4.0)
9.0 (2.5 - 20.0)
5-Day Biochemical Oxygen Demand mg/L 3.1
(1.7 - 8.5) 0.6
(0.2 - 1.6) 1.9
(0.9 - 2.1) Chemical Oxygen Demand mg/L 13
(8 - 24) 3
(<2 - 7) 12
(5 - 19)
Oil & Grease mg/L <0.5 (<0.5 - <0.5)
<0.5 (<0.5 - <0.5)
<0.5 (<0.5 - <0.5)
E. coli counts/ 100mL
140 (40 - 630)
190 (25 - 3 600)
1 600 (210 - 8 000)
Faecal Coliforms counts/ 100mL
2 500 (810 - 56 000)
2 200 (350 - 16 000)
13 000 (2 500 - 170 000)
Ammonia-Nitrogen mg/L 0.130 (0.058 - 0.230)
0.022 (0.008 - 0.039)
0.130 (0.070 - 0.280)
Nitrate-Nitrogen mg/L 0.130 (0.014 - 0.510)
0.240 (0.190 - 0.290)
0.330 (0.044 - 0.510)
Total Kjeldahl Nitrogen mg/L 0.58
(0.22 - 0.92) <0.05
(<0.05 - 0.44) 0.38
(0.20 - 0.58) Orthophosphate Phosphorus mg/L 0.027
(0.014 - 0.047) 0.006
(<0.002 - 0.007) 0.020
(0.013 - 0.036)
Total Phosphorus mg/L 0.05 (0.04 - 0.40)
<0.02 (<0.02 - 0.06)
0.05 (0.04 - 0.07)
Sulphide mg/L <0.02 (<0.02 - <0.02)
<0.02 (<0.02 - <0.02)
<0.02 (<0.02 - <0.02)
Aluminium µg/L <50 (<50 - <50)
60 (<50 - 166)
<50 (<50 - 202)
Cadmium µg/L <0.1 (<0.1 - <0.1)
<0.1 (<0.1 - <0.1)
<0.1 (<0.1 - <0.1)
Chromium µg/L 2 (2 - 4)
<1 (<1 - <1)
2 (<1 - 2)
Copper µg/L 5 (3 - 6)
<1 (<1 - 3)
4 (1 - 5)
Lead µg/L <1 (<1 - <1)
<1 (<1 - <1)
<1 (<1 - <1)
Zinc µg/L <10 (<10 - 16)
<10 (<10 - 15)
11 (<10 - 19)
Flow m3/s NM 0.030 (0.016 - 0.144) NM
Notes: 1. Data presented are in annual medians of monthly samples; except those for faecal coliforms and E. coli which are in annual
geometric means. 2. Figures in brackets are annual ranges. 3. NM indicates no measurement taken. 4. Values at or below laboratory reporting limits are presented as laboratory reporting limits (see Appendix B). 5. Equal values for annual medians (or geometric means) and ranges indicate that all data are the same as or below laboratory reporting
limits.
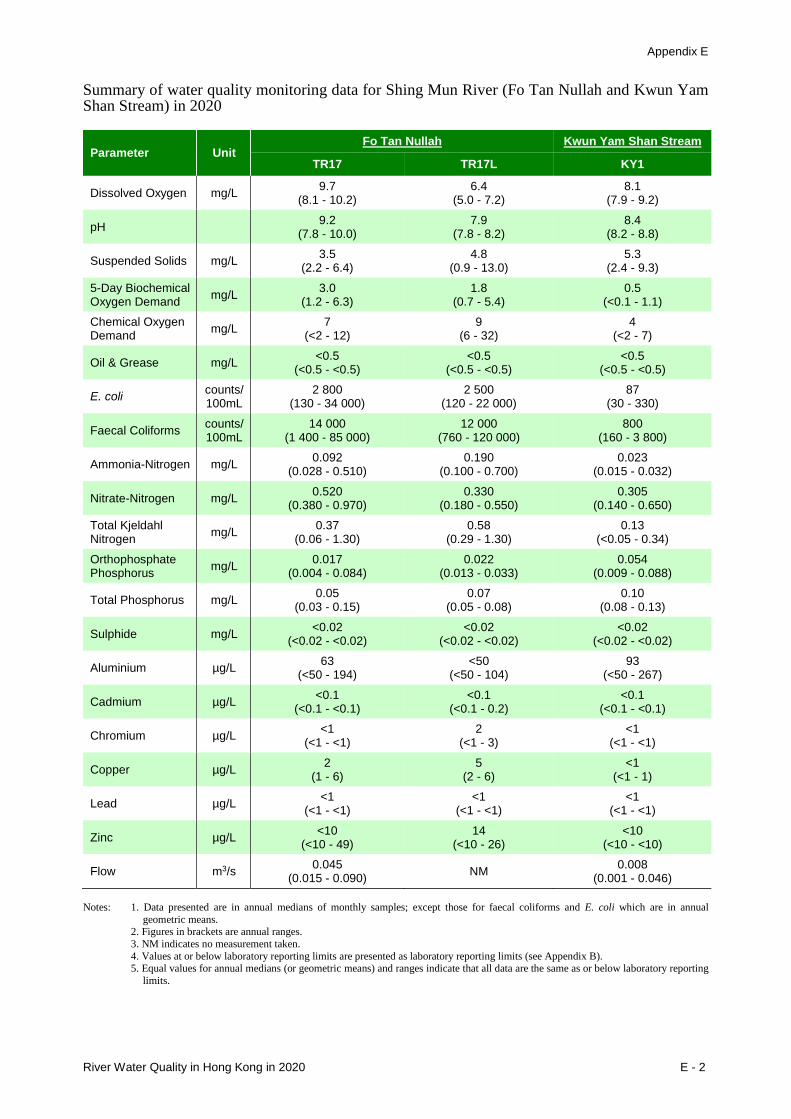
Appendix E
River Water Quality in Hong Kong in 2020 E - 2
Summary of water quality monitoring data for Shing Mun River (Fo Tan Nullah and Kwun Yam Shan Stream) in 2020
Parameter Unit Fo Tan Nullah Kwun Yam Shan Stream
TR17 TR17L KY1
Dissolved Oxygen mg/L 9.7 (8.1 - 10.2)
6.4 (5.0 - 7.2)
8.1 (7.9 - 9.2)
pH 9.2 (7.8 - 10.0)
7.9 (7.8 - 8.2)
8.4 (8.2 - 8.8)
Suspended Solids mg/L 3.5 (2.2 - 6.4)
4.8 (0.9 - 13.0)
5.3 (2.4 - 9.3)
5-Day Biochemical Oxygen Demand mg/L 3.0
(1.2 - 6.3) 1.8
(0.7 - 5.4) 0.5
(<0.1 - 1.1) Chemical Oxygen Demand mg/L 7
(<2 - 12) 9
(6 - 32) 4
(<2 - 7)
Oil & Grease mg/L <0.5 (<0.5 - <0.5)
<0.5 (<0.5 - <0.5)
<0.5 (<0.5 - <0.5)
E. coli counts/ 100mL
2 800 (130 - 34 000)
2 500 (120 - 22 000)
87 (30 - 330)
Faecal Coliforms counts/ 100mL
14 000 (1 400 - 85 000)
12 000 (760 - 120 000)
800 (160 - 3 800)
Ammonia-Nitrogen mg/L 0.092 (0.028 - 0.510)
0.190 (0.100 - 0.700)
0.023 (0.015 - 0.032)
Nitrate-Nitrogen mg/L 0.520 (0.380 - 0.970)
0.330 (0.180 - 0.550)
0.305 (0.140 - 0.650)
Total Kjeldahl Nitrogen mg/L 0.37
(0.06 - 1.30) 0.58
(0.29 - 1.30) 0.13
(<0.05 - 0.34) Orthophosphate Phosphorus mg/L 0.017
(0.004 - 0.084) 0.022
(0.013 - 0.033) 0.054
(0.009 - 0.088)
Total Phosphorus mg/L 0.05 (0.03 - 0.15)
0.07 (0.05 - 0.08)
0.10 (0.08 - 0.13)
Sulphide mg/L <0.02 (<0.02 - <0.02)
<0.02 (<0.02 - <0.02)
<0.02 (<0.02 - <0.02)
Aluminium µg/L 63 (<50 - 194)
<50 (<50 - 104)
93 (<50 - 267)
Cadmium µg/L <0.1 (<0.1 - <0.1)
<0.1 (<0.1 - 0.2)
<0.1 (<0.1 - <0.1)
Chromium µg/L <1 (<1 - <1)
2 (<1 - 3)
<1 (<1 - <1)
Copper µg/L 2 (1 - 6)
5 (2 - 6)
<1 (<1 - 1)
Lead µg/L <1 (<1 - <1)
<1 (<1 - <1)
<1 (<1 - <1)
Zinc µg/L <10 (<10 - 49)
14 (<10 - 26)
<10 (<10 - <10)
Flow m3/s 0.045 (0.015 - 0.090) NM 0.008
(0.001 - 0.046) Notes: 1. Data presented are in annual medians of monthly samples; except those for faecal coliforms and E. coli which are in annual
geometric means. 2. Figures in brackets are annual ranges. 3. NM indicates no measurement taken. 4. Values at or below laboratory reporting limits are presented as laboratory reporting limits (see Appendix B). 5. Equal values for annual medians (or geometric means) and ranges indicate that all data are the same as or below laboratory reporting
limits.
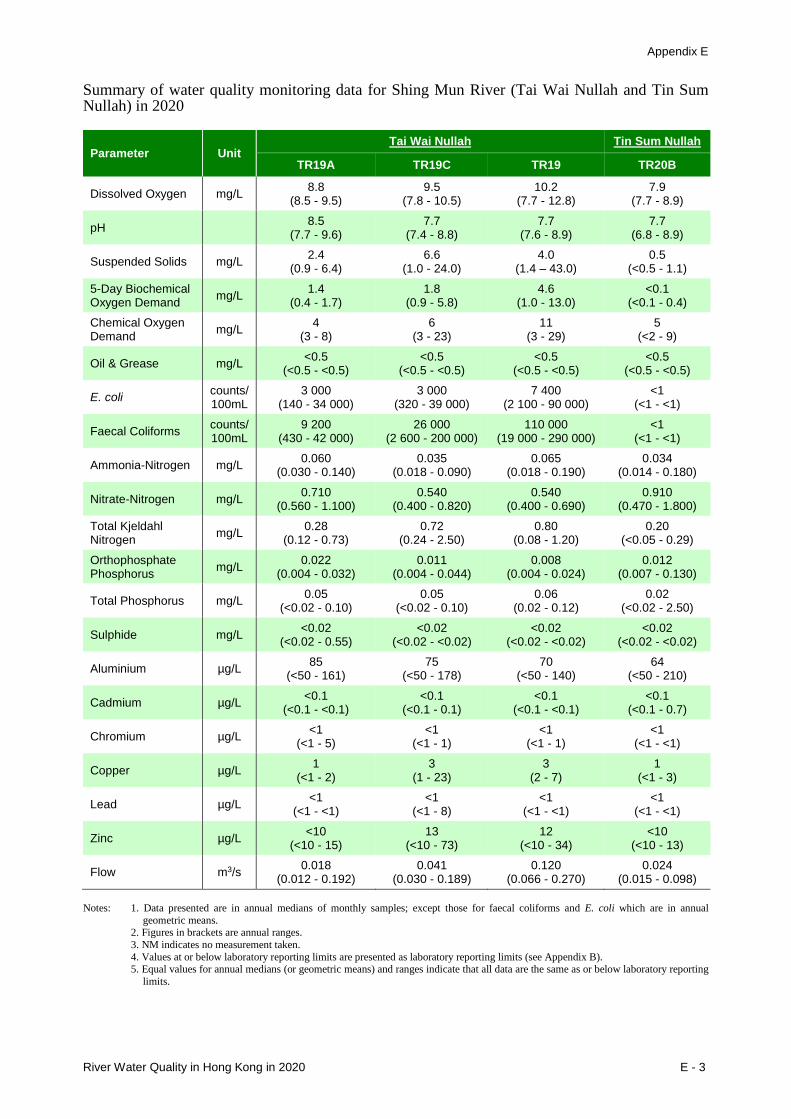
Appendix E
River Water Quality in Hong Kong in 2020 E - 3
Summary of water quality monitoring data for Shing Mun River (Tai Wai Nullah and Tin Sum Nullah) in 2020
Parameter Unit Tai Wai Nullah Tin Sum Nullah
TR19A TR19C TR19 TR20B
Dissolved Oxygen mg/L 8.8 (8.5 - 9.5)
9.5 (7.8 - 10.5)
10.2 (7.7 - 12.8)
7.9 (7.7 - 8.9)
pH 8.5 (7.7 - 9.6)
7.7 (7.4 - 8.8)
7.7 (7.6 - 8.9)
7.7 (6.8 - 8.9)
Suspended Solids mg/L 2.4 (0.9 - 6.4)
6.6 (1.0 - 24.0)
4.0 (1.4 – 43.0)
0.5 (<0.5 - 1.1)
5-Day Biochemical Oxygen Demand mg/L 1.4
(0.4 - 1.7) 1.8
(0.9 - 5.8) 4.6
(1.0 - 13.0) <0.1
(<0.1 - 0.4) Chemical Oxygen Demand mg/L 4
(3 - 8) 6
(3 - 23) 11
(3 - 29) 5
(<2 - 9)
Oil & Grease mg/L <0.5 (<0.5 - <0.5)
<0.5 (<0.5 - <0.5)
<0.5 (<0.5 - <0.5)
<0.5 (<0.5 - <0.5)
E. coli counts/ 100mL
3 000 (140 - 34 000)
3 000 (320 - 39 000)
7 400 (2 100 - 90 000)
<1 (<1 - <1)
Faecal Coliforms counts/ 100mL
9 200 (430 - 42 000)
26 000 (2 600 - 200 000)
110 000 (19 000 - 290 000)
<1 (<1 - <1)
Ammonia-Nitrogen mg/L 0.060 (0.030 - 0.140)
0.035 (0.018 - 0.090)
0.065 (0.018 - 0.190)
0.034 (0.014 - 0.180)
Nitrate-Nitrogen mg/L 0.710 (0.560 - 1.100)
0.540 (0.400 - 0.820)
0.540 (0.400 - 0.690)
0.910 (0.470 - 1.800)
Total Kjeldahl Nitrogen mg/L 0.28
(0.12 - 0.73) 0.72
(0.24 - 2.50) 0.80
(0.08 - 1.20) 0.20
(<0.05 - 0.29) Orthophosphate Phosphorus mg/L 0.022
(0.004 - 0.032) 0.011
(0.004 - 0.044) 0.008
(0.004 - 0.024) 0.012
(0.007 - 0.130)
Total Phosphorus mg/L 0.05 (<0.02 - 0.10)
0.05 (<0.02 - 0.10)
0.06 (0.02 - 0.12)
0.02 (<0.02 - 2.50)
Sulphide mg/L <0.02 (<0.02 - 0.55)
<0.02 (<0.02 - <0.02)
<0.02 (<0.02 - <0.02)
<0.02 (<0.02 - <0.02)
Aluminium µg/L 85 (<50 - 161)
75 (<50 - 178)
70 (<50 - 140)
64 (<50 - 210)
Cadmium µg/L <0.1 (<0.1 - <0.1)
<0.1 (<0.1 - 0.1)
<0.1 (<0.1 - <0.1)
<0.1 (<0.1 - 0.7)
Chromium µg/L <1 (<1 - 5)
<1 (<1 - 1)
<1 (<1 - 1)
<1 (<1 - <1)
Copper µg/L 1 (<1 - 2)
3 (1 - 23)
3 (2 - 7)
1 (<1 - 3)
Lead µg/L <1 (<1 - <1)
<1 (<1 - 8)
<1 (<1 - <1)
<1 (<1 - <1)
Zinc µg/L <10 (<10 - 15)
13 (<10 - 73)
12 (<10 - 34)
<10 (<10 - 13)
Flow m3/s 0.018 (0.012 - 0.192)
0.041 (0.030 - 0.189)
0.120 (0.066 - 0.270)
0.024 (0.015 - 0.098)
Notes: 1. Data presented are in annual medians of monthly samples; except those for faecal coliforms and E. coli which are in annual
geometric means. 2. Figures in brackets are annual ranges. 3. NM indicates no measurement taken. 4. Values at or below laboratory reporting limits are presented as laboratory reporting limits (see Appendix B). 5. Equal values for annual medians (or geometric means) and ranges indicate that all data are the same as or below laboratory reporting
limits.
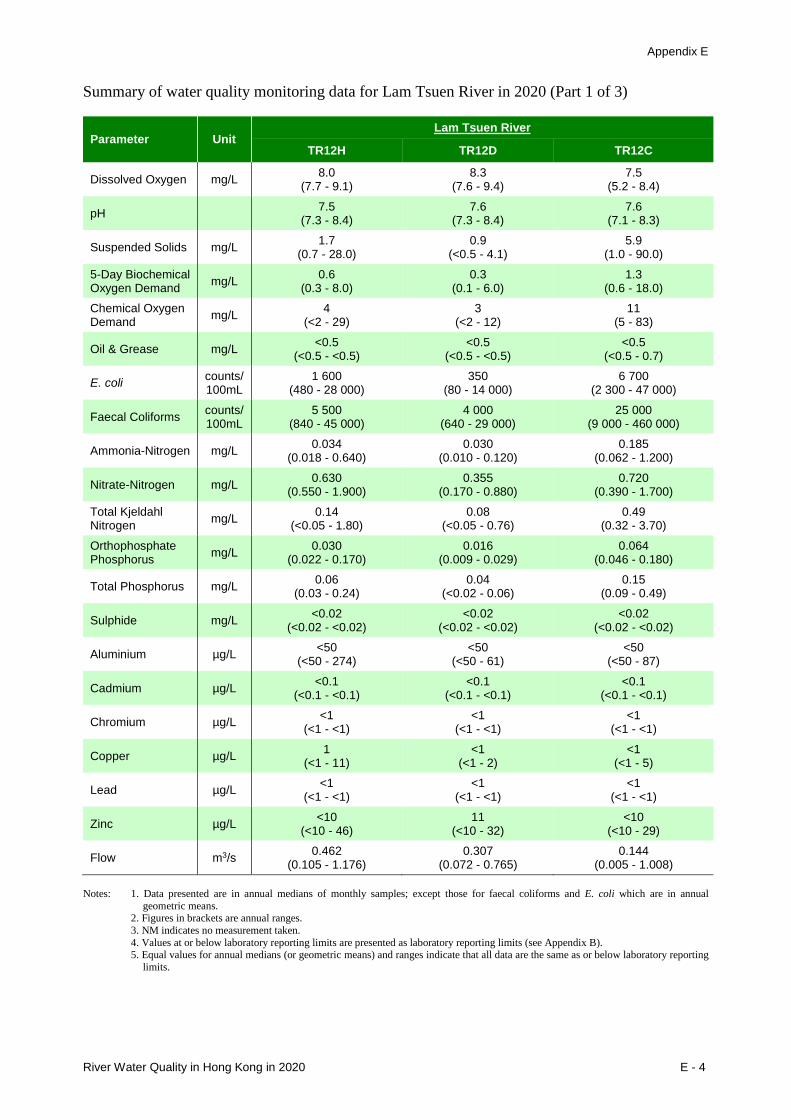
Appendix E
River Water Quality in Hong Kong in 2020 E - 4
Summary of water quality monitoring data for Lam Tsuen River in 2020 (Part 1 of 3)
Parameter Unit Lam Tsuen River
TR12H TR12D TR12C
Dissolved Oxygen mg/L 8.0 (7.7 - 9.1)
8.3 (7.6 - 9.4)
7.5 (5.2 - 8.4)
pH 7.5 (7.3 - 8.4)
7.6 (7.3 - 8.4)
7.6 (7.1 - 8.3)
Suspended Solids mg/L 1.7 (0.7 - 28.0)
0.9 (<0.5 - 4.1)
5.9 (1.0 - 90.0)
5-Day Biochemical Oxygen Demand mg/L 0.6
(0.3 - 8.0) 0.3
(0.1 - 6.0) 1.3
(0.6 - 18.0) Chemical Oxygen Demand mg/L 4
(<2 - 29) 3
(<2 - 12) 11
(5 - 83)
Oil & Grease mg/L <0.5 (<0.5 - <0.5)
<0.5 (<0.5 - <0.5)
<0.5 (<0.5 - 0.7)
E. coli counts/ 100mL
1 600 (480 - 28 000)
350 (80 - 14 000)
6 700 (2 300 - 47 000)
Faecal Coliforms counts/ 100mL
5 500 (840 - 45 000)
4 000 (640 - 29 000)
25 000 (9 000 - 460 000)
Ammonia-Nitrogen mg/L 0.034 (0.018 - 0.640)
0.030 (0.010 - 0.120)
0.185 (0.062 - 1.200)
Nitrate-Nitrogen mg/L 0.630 (0.550 - 1.900)
0.355 (0.170 - 0.880)
0.720 (0.390 - 1.700)
Total Kjeldahl Nitrogen mg/L 0.14
(<0.05 - 1.80) 0.08
(<0.05 - 0.76) 0.49
(0.32 - 3.70) Orthophosphate Phosphorus mg/L 0.030
(0.022 - 0.170) 0.016
(0.009 - 0.029) 0.064
(0.046 - 0.180)
Total Phosphorus mg/L 0.06 (0.03 - 0.24)
0.04 (<0.02 - 0.06)
0.15 (0.09 - 0.49)
Sulphide mg/L <0.02 (<0.02 - <0.02)
<0.02 (<0.02 - <0.02)
<0.02 (<0.02 - <0.02)
Aluminium µg/L <50 (<50 - 274)
<50 (<50 - 61)
<50 (<50 - 87)
Cadmium µg/L <0.1 (<0.1 - <0.1)
<0.1 (<0.1 - <0.1)
<0.1 (<0.1 - <0.1)
Chromium µg/L <1 (<1 - <1)
<1 (<1 - <1)
<1 (<1 - <1)
Copper µg/L 1 (<1 - 11)
<1 (<1 - 2)
<1 (<1 - 5)
Lead µg/L <1 (<1 - <1)
<1 (<1 - <1)
<1 (<1 - <1)
Zinc µg/L <10 (<10 - 46)
11 (<10 - 32)
<10 (<10 - 29)
Flow m3/s 0.462 (0.105 - 1.176)
0.307 (0.072 - 0.765)
0.144 (0.005 - 1.008)
Notes: 1. Data presented are in annual medians of monthly samples; except those for faecal coliforms and E. coli which are in annual
geometric means. 2. Figures in brackets are annual ranges. 3. NM indicates no measurement taken. 4. Values at or below laboratory reporting limits are presented as laboratory reporting limits (see Appendix B). 5. Equal values for annual medians (or geometric means) and ranges indicate that all data are the same as or below laboratory reporting
limits.

Appendix E
River Water Quality in Hong Kong in 2020 E - 5
Summary of water quality monitoring data for Lam Tsuen River in 2020 (Part 2 of 3)
Parameter Unit Lam Tsuen River
TR12G TR12F TR12B
Dissolved Oxygen mg/L 7.6 (6.5 - 8.7)
8.1 (7.1 - 8.8)
8.6 (7.9 - 10.0)
pH 7.4 (7.0 - 8.3)
7.5 (7.2 - 8.4)
7.9 (7.3 - 8.4)
Suspended Solids mg/L 2.9 (1.5 - 4.6)
1.9 (1.1 - 2.6)
1.7 (<0.5 - 7.8)
5-Day Biochemical Oxygen Demand mg/L 0.5
(0.2 - 2.2) 0.6
(0.3 - 1.7) 0.4
(0.2 - 8.0) Chemical Oxygen Demand mg/L 6
(3 - 11) 6
(4 - 9) 4
(3 - 18)
Oil & Grease mg/L <0.5 (<0.5 - <0.5)
<0.5 (<0.5 - <0.5)
<0.5 (<0.5 - <0.5)
E. coli counts/ 100mL
380 (110 - 2 000)
410 (69 - 1 600)
610 (150 - 11 000)
Faecal Coliforms counts/ 100mL
4 200 (1300 - 10 000)
4 600 (370 - 33 000)
5 200 (2 100 - 25 000)
Ammonia-Nitrogen mg/L 0.030 (0.014 - 0.052)
0.032 (0.018 - 0.110)
0.045 (0.025 - 0.220)
Nitrate-Nitrogen mg/L 0.089 (<0.002 - 0.310)
0.350 (0.140 - 0.550)
0.560 (0.270 - 1.500)
Total Kjeldahl Nitrogen mg/L 0.17
(0.07 - 0.48) 0.22
(0.06 - 0.57) 0.18
(0.08 - 1.70) Orthophosphate Phosphorus mg/L 0.019
(0.006 - 0.073) 0.028
(0.018 - 0.100) 0.033
(0.024 - 0.074)
Total Phosphorus mg/L 0.06 (0.02 - 0.10)
0.07 (<0.02 - 0.11)
0.06 (0.04 - 0.13)
Sulphide mg/L <0.02 (<0.02 - <0.02)
<0.02 (<0.02 - <0.02)
<0.02 (<0.02 - <0.02)
Aluminium µg/L <50 (<50 - 89)
<50 (<50 - 88)
<50 (<50 - 92)
Cadmium µg/L <0.1 (<0.1 - <0.1)
<0.1 (<0.1 - <0.1)
<0.1 (<0.1 - <0.1)
Chromium µg/L <1 (<1 - <1)
<1 (<1 - <1)
<1 (<1 - 3)
Copper µg/L <1 (<1 - <1)
<1 (<1 - <1)
<1 (<1 - 2)
Lead µg/L <1 (<1 - <1)
<1 (<1 - <1)
<1 (<1 - <1)
Zinc µg/L <10 (<10 - 13)
<10 (<10 - <10)
<10 (<10 - 22)
Flow m3/s 0.135 (0.052 - 0.308)
0.203 (0.034 - 0.810)
0.324 (0.117 - 1.296)
Notes: 1. Data presented are in annual medians of monthly samples; except those for faecal coliforms and E. coli which are in annual
geometric means. 2. Figures in brackets are annual ranges. 3. NM indicates no measurement taken. 4. Values at or below laboratory reporting limits are presented as laboratory reporting limits (see Appendix B). 5. Equal values for annual medians (or geometric means) and ranges indicate that all data are the same as or below laboratory reporting
limits.
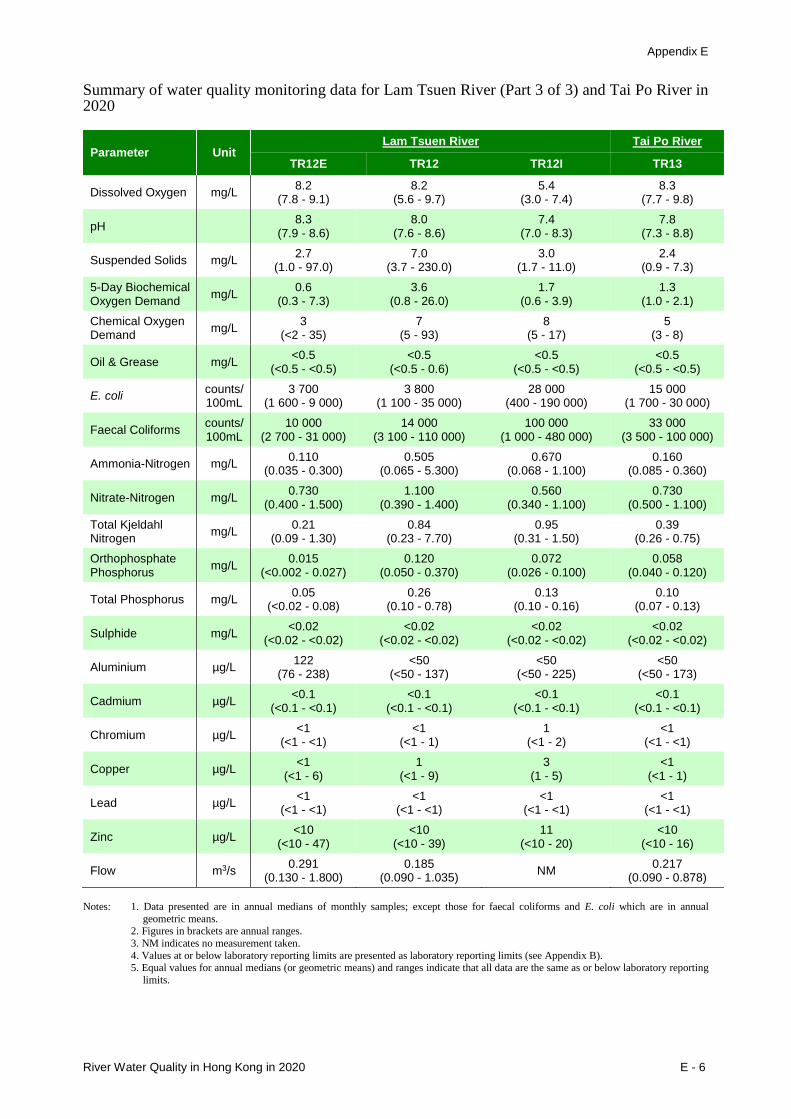
Appendix E
River Water Quality in Hong Kong in 2020 E - 6
Summary of water quality monitoring data for Lam Tsuen River (Part 3 of 3) and Tai Po River in 2020
Parameter Unit Lam Tsuen River Tai Po River
TR12E TR12 TR12I TR13
Dissolved Oxygen mg/L 8.2 (7.8 - 9.1)
8.2 (5.6 - 9.7)
5.4 (3.0 - 7.4)
8.3 (7.7 - 9.8)
pH 8.3 (7.9 - 8.6)
8.0 (7.6 - 8.6)
7.4 (7.0 - 8.3)
7.8 (7.3 - 8.8)
Suspended Solids mg/L 2.7 (1.0 - 97.0)
7.0 (3.7 - 230.0)
3.0 (1.7 - 11.0)
2.4 (0.9 - 7.3)
5-Day Biochemical Oxygen Demand mg/L 0.6
(0.3 - 7.3) 3.6
(0.8 - 26.0) 1.7
(0.6 - 3.9) 1.3
(1.0 - 2.1) Chemical Oxygen Demand mg/L 3
(<2 - 35) 7
(5 - 93) 8
(5 - 17) 5
(3 - 8)
Oil & Grease mg/L <0.5 (<0.5 - <0.5)
<0.5 (<0.5 - 0.6)
<0.5 (<0.5 - <0.5)
<0.5 (<0.5 - <0.5)
E. coli counts/ 100mL
3 700 (1 600 - 9 000)
3 800 (1 100 - 35 000)
28 000 (400 - 190 000)
15 000 (1 700 - 30 000)
Faecal Coliforms counts/ 100mL
10 000 (2 700 - 31 000)
14 000 (3 100 - 110 000)
100 000 (1 000 - 480 000)
33 000 (3 500 - 100 000)
Ammonia-Nitrogen mg/L 0.110 (0.035 - 0.300)
0.505 (0.065 - 5.300)
0.670 (0.068 - 1.100)
0.160 (0.085 - 0.360)
Nitrate-Nitrogen mg/L 0.730 (0.400 - 1.500)
1.100 (0.390 - 1.400)
0.560 (0.340 - 1.100)
0.730 (0.500 - 1.100)
Total Kjeldahl Nitrogen mg/L 0.21
(0.09 - 1.30) 0.84
(0.23 - 7.70) 0.95
(0.31 - 1.50) 0.39
(0.26 - 0.75) Orthophosphate Phosphorus mg/L 0.015
(<0.002 - 0.027) 0.120
(0.050 - 0.370) 0.072
(0.026 - 0.100) 0.058
(0.040 - 0.120)
Total Phosphorus mg/L 0.05 (<0.02 - 0.08)
0.26 (0.10 - 0.78)
0.13 (0.10 - 0.16)
0.10 (0.07 - 0.13)
Sulphide mg/L <0.02 (<0.02 - <0.02)
<0.02 (<0.02 - <0.02)
<0.02 (<0.02 - <0.02)
<0.02 (<0.02 - <0.02)
Aluminium µg/L 122 (76 - 238)
<50 (<50 - 137)
<50 (<50 - 225)
<50 (<50 - 173)
Cadmium µg/L <0.1 (<0.1 - <0.1)
<0.1 (<0.1 - <0.1)
<0.1 (<0.1 - <0.1)
<0.1 (<0.1 - <0.1)
Chromium µg/L <1 (<1 - <1)
<1 (<1 - 1)
1 (<1 - 2)
<1 (<1 - <1)
Copper µg/L <1 (<1 - 6)
1 (<1 - 9)
3 (1 - 5)
<1 (<1 - 1)
Lead µg/L <1 (<1 - <1)
<1 (<1 - <1)
<1 (<1 - <1)
<1 (<1 - <1)
Zinc µg/L <10 (<10 - 47)
<10 (<10 - 39)
11 (<10 - 20)
<10 (<10 - 16)
Flow m3/s 0.291 (0.130 - 1.800)
0.185 (0.090 - 1.035) NM 0.217
(0.090 - 0.878) Notes: 1. Data presented are in annual medians of monthly samples; except those for faecal coliforms and E. coli which are in annual
geometric means. 2. Figures in brackets are annual ranges. 3. NM indicates no measurement taken. 4. Values at or below laboratory reporting limits are presented as laboratory reporting limits (see Appendix B). 5. Equal values for annual medians (or geometric means) and ranges indicate that all data are the same as or below laboratory reporting
limits.
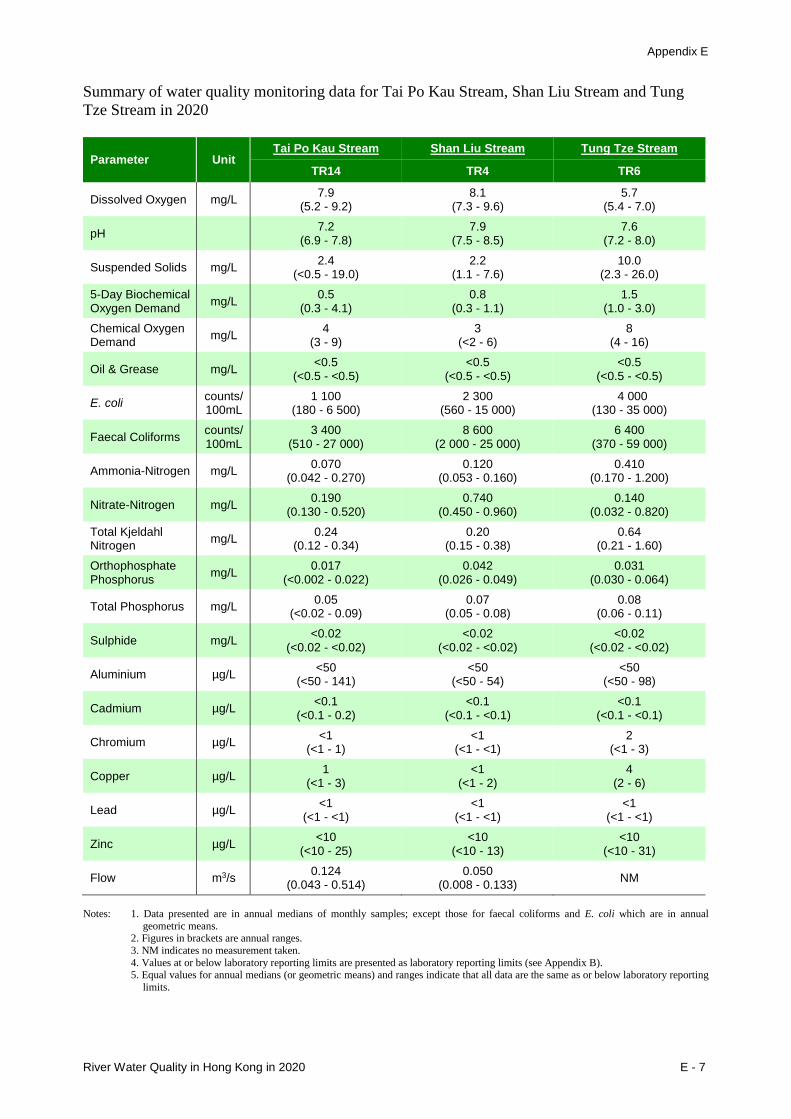
Appendix E
River Water Quality in Hong Kong in 2020 E - 7
Summary of water quality monitoring data for Tai Po Kau Stream, Shan Liu Stream and Tung Tze Stream in 2020
Parameter Unit Tai Po Kau Stream Shan Liu Stream Tung Tze Stream
TR14 TR4 TR6
Dissolved Oxygen mg/L 7.9 (5.2 - 9.2)
8.1 (7.3 - 9.6)
5.7 (5.4 - 7.0)
pH 7.2 (6.9 - 7.8)
7.9 (7.5 - 8.5)
7.6 (7.2 - 8.0)
Suspended Solids mg/L 2.4 (<0.5 - 19.0)
2.2 (1.1 - 7.6)
10.0 (2.3 - 26.0)
5-Day Biochemical Oxygen Demand mg/L 0.5
(0.3 - 4.1) 0.8
(0.3 - 1.1) 1.5
(1.0 - 3.0) Chemical Oxygen Demand mg/L 4
(3 - 9) 3
(<2 - 6) 8
(4 - 16)
Oil & Grease mg/L <0.5 (<0.5 - <0.5)
<0.5 (<0.5 - <0.5)
<0.5 (<0.5 - <0.5)
E. coli counts/ 100mL
1 100 (180 - 6 500)
2 300 (560 - 15 000)
4 000 (130 - 35 000)
Faecal Coliforms counts/ 100mL
3 400 (510 - 27 000)
8 600 (2 000 - 25 000)
6 400 (370 - 59 000)
Ammonia-Nitrogen mg/L 0.070 (0.042 - 0.270)
0.120 (0.053 - 0.160)
0.410 (0.170 - 1.200)
Nitrate-Nitrogen mg/L 0.190 (0.130 - 0.520)
0.740 (0.450 - 0.960)
0.140 (0.032 - 0.820)
Total Kjeldahl Nitrogen mg/L 0.24
(0.12 - 0.34) 0.20
(0.15 - 0.38) 0.64
(0.21 - 1.60) Orthophosphate Phosphorus mg/L 0.017
(<0.002 - 0.022) 0.042
(0.026 - 0.049) 0.031
(0.030 - 0.064)
Total Phosphorus mg/L 0.05 (<0.02 - 0.09)
0.07 (0.05 - 0.08)
0.08 (0.06 - 0.11)
Sulphide mg/L <0.02 (<0.02 - <0.02)
<0.02 (<0.02 - <0.02)
<0.02 (<0.02 - <0.02)
Aluminium µg/L <50 (<50 - 141)
<50 (<50 - 54)
<50 (<50 - 98)
Cadmium µg/L <0.1 (<0.1 - 0.2)
<0.1 (<0.1 - <0.1)
<0.1 (<0.1 - <0.1)
Chromium µg/L <1 (<1 - 1)
<1 (<1 - <1)
2 (<1 - 3)
Copper µg/L 1 (<1 - 3)
<1 (<1 - 2)
4 (2 - 6)
Lead µg/L <1 (<1 - <1)
<1 (<1 - <1)
<1 (<1 - <1)
Zinc µg/L <10 (<10 - 25)
<10 (<10 - 13)
<10 (<10 - 31)
Flow m3/s 0.124 (0.043 - 0.514)
0.050 (0.008 - 0.133) NM
Notes: 1. Data presented are in annual medians of monthly samples; except those for faecal coliforms and E. coli which are in annual
geometric means. 2. Figures in brackets are annual ranges. 3. NM indicates no measurement taken. 4. Values at or below laboratory reporting limits are presented as laboratory reporting limits (see Appendix B). 5. Equal values for annual medians (or geometric means) and ranges indicate that all data are the same as or below laboratory reporting
limits.
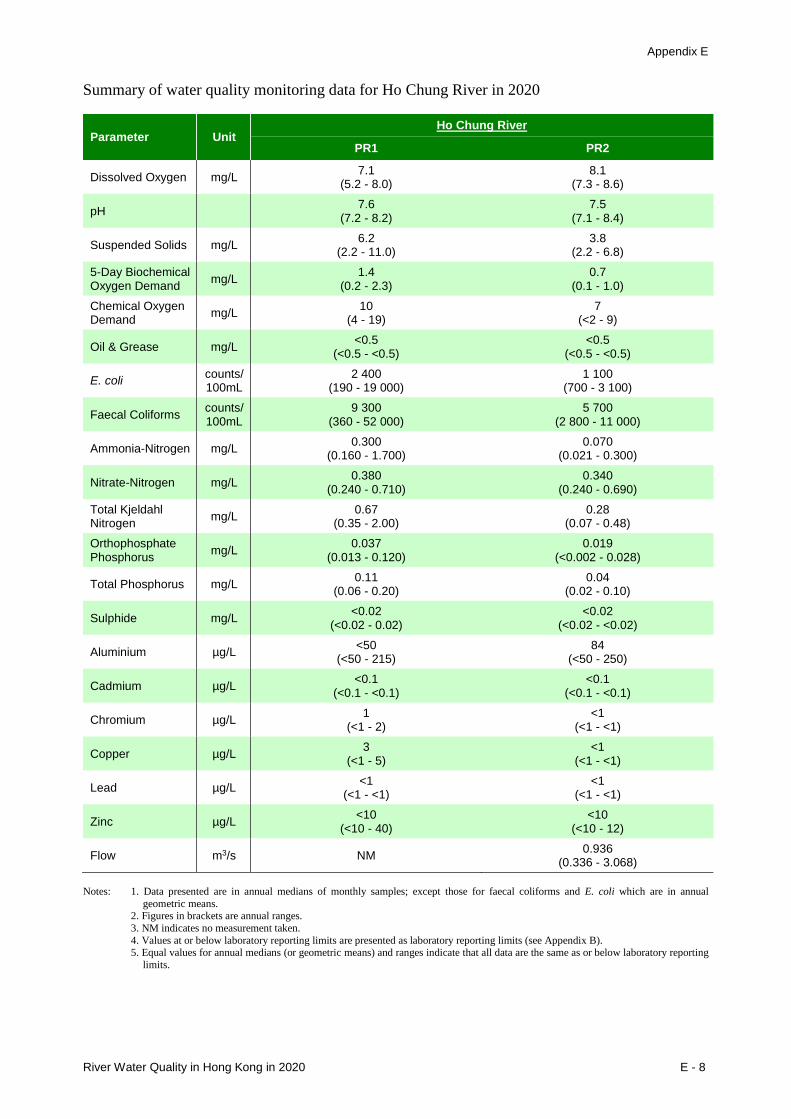
Appendix E
River Water Quality in Hong Kong in 2020 E - 8
Summary of water quality monitoring data for Ho Chung River in 2020
Parameter Unit Ho Chung River
PR1 PR2
Dissolved Oxygen mg/L 7.1 (5.2 - 8.0)
8.1 (7.3 - 8.6)
pH 7.6 (7.2 - 8.2)
7.5 (7.1 - 8.4)
Suspended Solids mg/L 6.2 (2.2 - 11.0)
3.8 (2.2 - 6.8)
5-Day Biochemical Oxygen Demand mg/L 1.4
(0.2 - 2.3) 0.7
(0.1 - 1.0) Chemical Oxygen Demand mg/L 10
(4 - 19) 7
(<2 - 9)
Oil & Grease mg/L <0.5 (<0.5 - <0.5)
<0.5 (<0.5 - <0.5)
E. coli counts/ 100mL
2 400 (190 - 19 000)
1 100 (700 - 3 100)
Faecal Coliforms counts/ 100mL
9 300 (360 - 52 000)
5 700 (2 800 - 11 000)
Ammonia-Nitrogen mg/L 0.300 (0.160 - 1.700)
0.070 (0.021 - 0.300)
Nitrate-Nitrogen mg/L 0.380 (0.240 - 0.710)
0.340 (0.240 - 0.690)
Total Kjeldahl Nitrogen mg/L 0.67
(0.35 - 2.00) 0.28
(0.07 - 0.48) Orthophosphate Phosphorus mg/L 0.037
(0.013 - 0.120) 0.019
(<0.002 - 0.028)
Total Phosphorus mg/L 0.11 (0.06 - 0.20)
0.04 (0.02 - 0.10)
Sulphide mg/L <0.02 (<0.02 - 0.02)
<0.02 (<0.02 - <0.02)
Aluminium µg/L <50 (<50 - 215)
84 (<50 - 250)
Cadmium µg/L <0.1 (<0.1 - <0.1)
<0.1 (<0.1 - <0.1)
Chromium µg/L 1 (<1 - 2)
<1 (<1 - <1)
Copper µg/L 3 (<1 - 5)
<1 (<1 - <1)
Lead µg/L <1 (<1 - <1)
<1 (<1 - <1)
Zinc µg/L <10 (<10 - 40)
<10 (<10 - 12)
Flow m3/s NM 0.936 (0.336 - 3.068)
Notes: 1. Data presented are in annual medians of monthly samples; except those for faecal coliforms and E. coli which are in annual
geometric means. 2. Figures in brackets are annual ranges. 3. NM indicates no measurement taken. 4. Values at or below laboratory reporting limits are presented as laboratory reporting limits (see Appendix B). 5. Equal values for annual medians (or geometric means) and ranges indicate that all data are the same as or below laboratory reporting
limits.
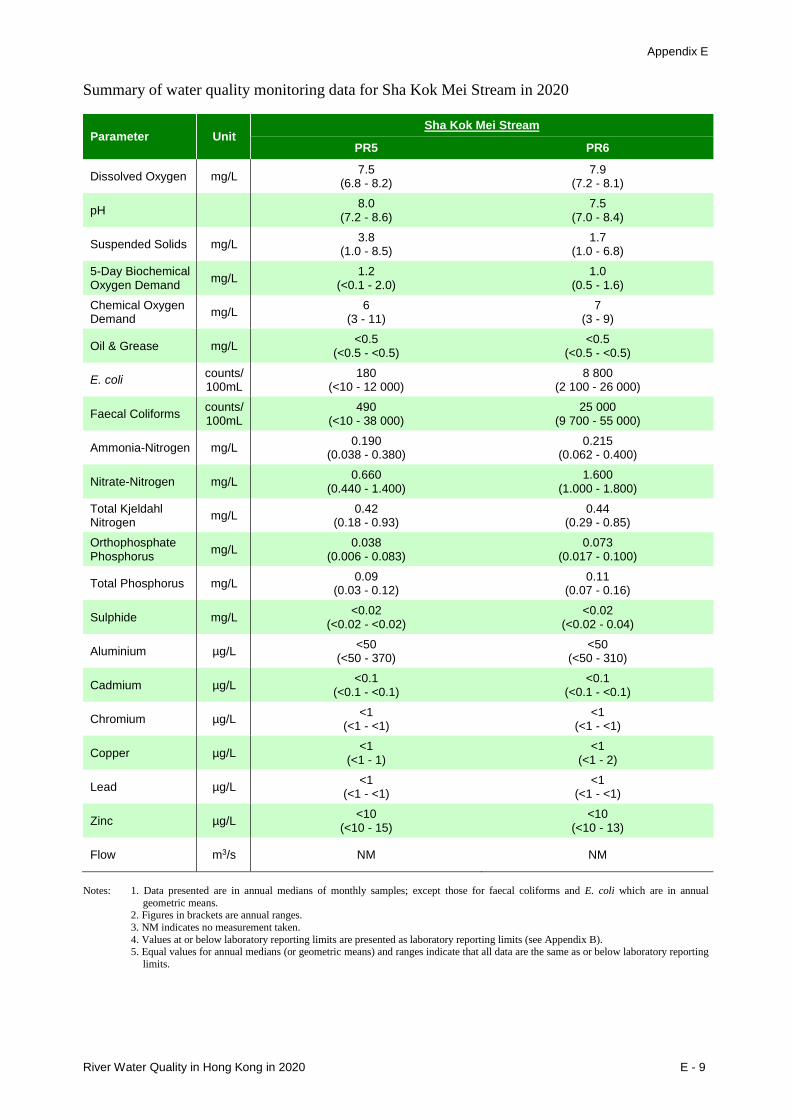
Appendix E
River Water Quality in Hong Kong in 2020 E - 9
Summary of water quality monitoring data for Sha Kok Mei Stream in 2020
Parameter Unit Sha Kok Mei Stream
PR5 PR6
Dissolved Oxygen mg/L 7.5 (6.8 - 8.2)
7.9 (7.2 - 8.1)
pH 8.0 (7.2 - 8.6)
7.5 (7.0 - 8.4)
Suspended Solids mg/L 3.8 (1.0 - 8.5)
1.7 (1.0 - 6.8)
5-Day Biochemical Oxygen Demand mg/L 1.2
(<0.1 - 2.0) 1.0
(0.5 - 1.6) Chemical Oxygen Demand mg/L 6
(3 - 11) 7
(3 - 9)
Oil & Grease mg/L <0.5 (<0.5 - <0.5)
<0.5 (<0.5 - <0.5)
E. coli counts/ 100mL
180 (<10 - 12 000)
8 800 (2 100 - 26 000)
Faecal Coliforms counts/ 100mL
490 (<10 - 38 000)
25 000 (9 700 - 55 000)
Ammonia-Nitrogen mg/L 0.190 (0.038 - 0.380)
0.215 (0.062 - 0.400)
Nitrate-Nitrogen mg/L 0.660 (0.440 - 1.400)
1.600 (1.000 - 1.800)
Total Kjeldahl Nitrogen mg/L 0.42
(0.18 - 0.93) 0.44
(0.29 - 0.85) Orthophosphate Phosphorus mg/L 0.038
(0.006 - 0.083) 0.073
(0.017 - 0.100)
Total Phosphorus mg/L 0.09 (0.03 - 0.12)
0.11 (0.07 - 0.16)
Sulphide mg/L <0.02 (<0.02 - <0.02)
<0.02 (<0.02 - 0.04)
Aluminium µg/L <50 (<50 - 370)
<50 (<50 - 310)
Cadmium µg/L <0.1 (<0.1 - <0.1)
<0.1 (<0.1 - <0.1)
Chromium µg/L <1 (<1 - <1)
<1 (<1 - <1)
Copper µg/L <1 (<1 - 1)
<1 (<1 - 2)
Lead µg/L <1 (<1 - <1)
<1 (<1 - <1)
Zinc µg/L <10 (<10 - 15)
<10 (<10 - 13)
Flow m3/s NM NM
Notes: 1. Data presented are in annual medians of monthly samples; except those for faecal coliforms and E. coli which are in annual
geometric means. 2. Figures in brackets are annual ranges. 3. NM indicates no measurement taken. 4. Values at or below laboratory reporting limits are presented as laboratory reporting limits (see Appendix B). 5. Equal values for annual medians (or geometric means) and ranges indicate that all data are the same as or below laboratory reporting
limits.
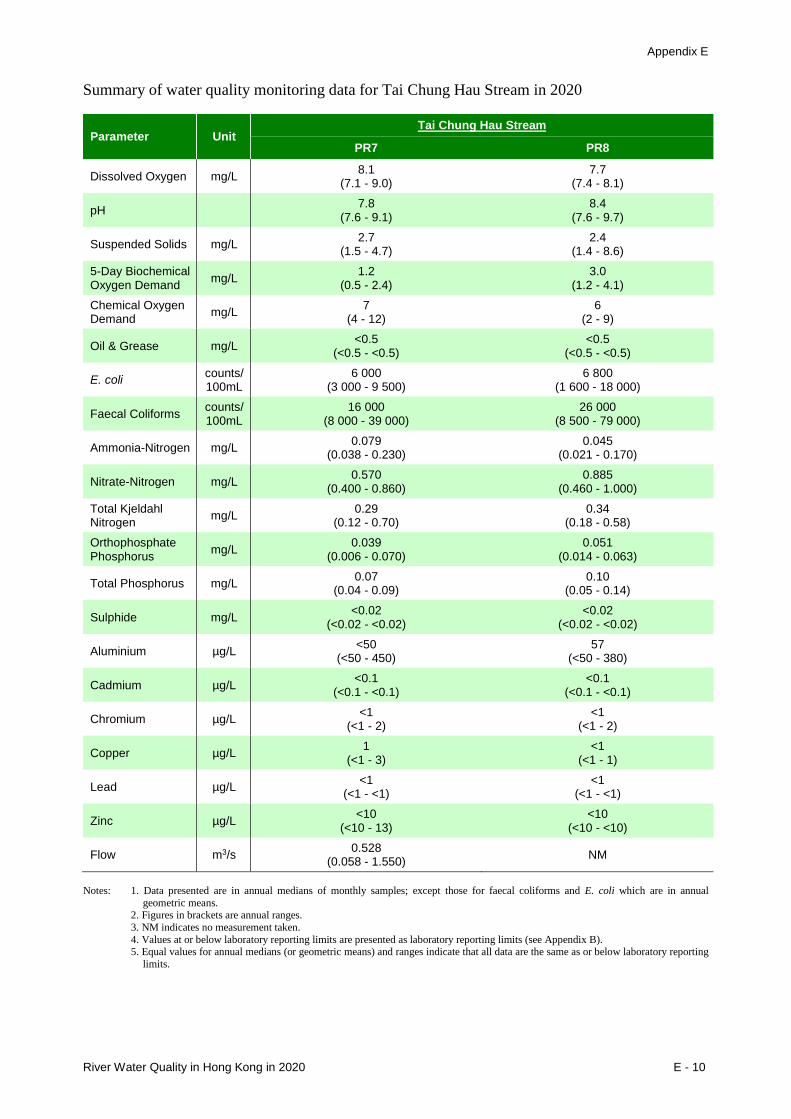
Appendix E
River Water Quality in Hong Kong in 2020 E - 10
Summary of water quality monitoring data for Tai Chung Hau Stream in 2020
Parameter Unit Tai Chung Hau Stream
PR7 PR8
Dissolved Oxygen mg/L 8.1 (7.1 - 9.0)
7.7 (7.4 - 8.1)
pH 7.8 (7.6 - 9.1)
8.4 (7.6 - 9.7)
Suspended Solids mg/L 2.7 (1.5 - 4.7)
2.4 (1.4 - 8.6)
5-Day Biochemical Oxygen Demand mg/L 1.2
(0.5 - 2.4) 3.0
(1.2 - 4.1) Chemical Oxygen Demand mg/L 7
(4 - 12) 6
(2 - 9)
Oil & Grease mg/L <0.5 (<0.5 - <0.5)
<0.5 (<0.5 - <0.5)
E. coli counts/ 100mL
6 000 (3 000 - 9 500)
6 800 (1 600 - 18 000)
Faecal Coliforms counts/ 100mL
16 000 (8 000 - 39 000)
26 000 (8 500 - 79 000)
Ammonia-Nitrogen mg/L 0.079 (0.038 - 0.230)
0.045 (0.021 - 0.170)
Nitrate-Nitrogen mg/L 0.570 (0.400 - 0.860)
0.885 (0.460 - 1.000)
Total Kjeldahl Nitrogen mg/L 0.29
(0.12 - 0.70) 0.34
(0.18 - 0.58) Orthophosphate Phosphorus mg/L 0.039
(0.006 - 0.070) 0.051
(0.014 - 0.063)
Total Phosphorus mg/L 0.07 (0.04 - 0.09)
0.10 (0.05 - 0.14)
Sulphide mg/L <0.02 (<0.02 - <0.02)
<0.02 (<0.02 - <0.02)
Aluminium µg/L <50 (<50 - 450)
57 (<50 - 380)
Cadmium µg/L <0.1 (<0.1 - <0.1)
<0.1 (<0.1 - <0.1)
Chromium µg/L <1 (<1 - 2)
<1 (<1 - 2)
Copper µg/L 1 (<1 - 3)
<1 (<1 - 1)
Lead µg/L <1 (<1 - <1)
<1 (<1 - <1)
Zinc µg/L <10 (<10 - 13)
<10 (<10 - <10)
Flow m3/s 0.528 (0.058 - 1.550) NM
Notes: 1. Data presented are in annual medians of monthly samples; except those for faecal coliforms and E. coli which are in annual
geometric means. 2. Figures in brackets are annual ranges. 3. NM indicates no measurement taken. 4. Values at or below laboratory reporting limits are presented as laboratory reporting limits (see Appendix B). 5. Equal values for annual medians (or geometric means) and ranges indicate that all data are the same as or below laboratory reporting
limits.
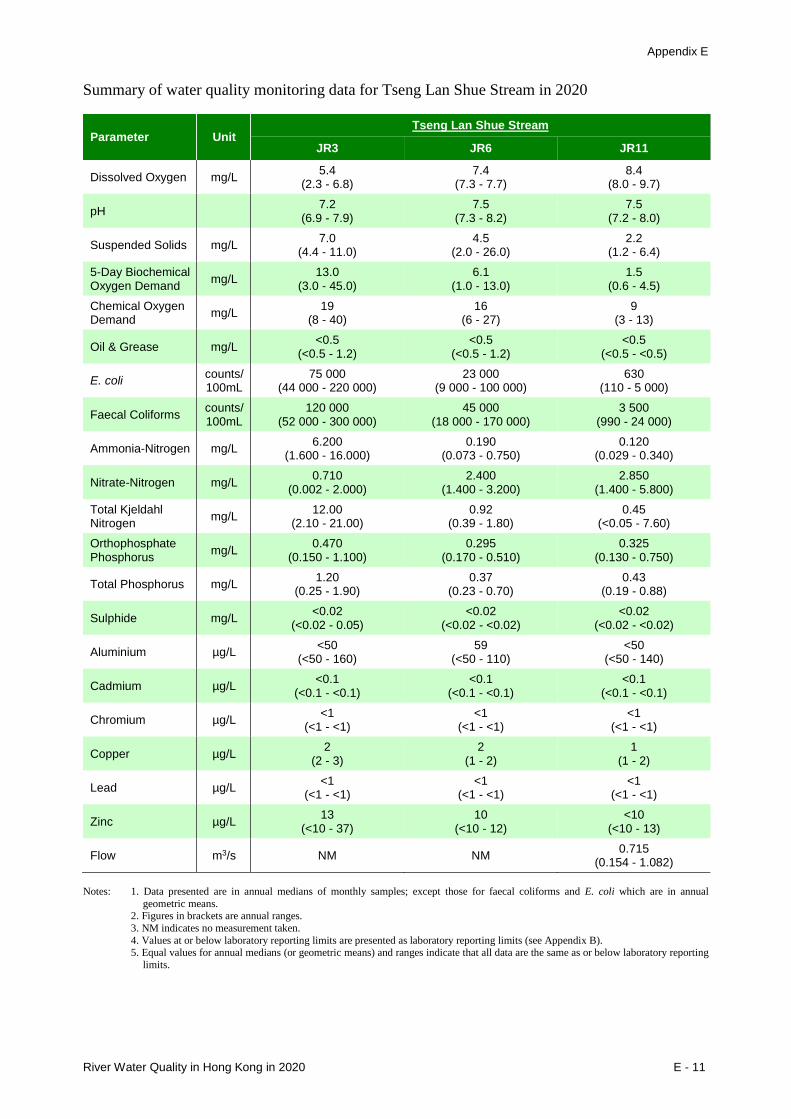
Appendix E
River Water Quality in Hong Kong in 2020 E - 11
Summary of water quality monitoring data for Tseng Lan Shue Stream in 2020
Parameter Unit Tseng Lan Shue Stream
JR3 JR6 JR11
Dissolved Oxygen mg/L 5.4 (2.3 - 6.8)
7.4 (7.3 - 7.7)
8.4 (8.0 - 9.7)
pH 7.2 (6.9 - 7.9)
7.5 (7.3 - 8.2)
7.5 (7.2 - 8.0)
Suspended Solids mg/L 7.0 (4.4 - 11.0)
4.5 (2.0 - 26.0)
2.2 (1.2 - 6.4)
5-Day Biochemical Oxygen Demand mg/L 13.0
(3.0 - 45.0) 6.1
(1.0 - 13.0) 1.5
(0.6 - 4.5) Chemical Oxygen Demand mg/L 19
(8 - 40) 16
(6 - 27) 9
(3 - 13)
Oil & Grease mg/L <0.5 (<0.5 - 1.2)
<0.5 (<0.5 - 1.2)
<0.5 (<0.5 - <0.5)
E. coli counts/ 100mL
75 000 (44 000 - 220 000)
23 000 (9 000 - 100 000)
630 (110 - 5 000)
Faecal Coliforms counts/ 100mL
120 000 (52 000 - 300 000)
45 000 (18 000 - 170 000)
3 500 (990 - 24 000)
Ammonia-Nitrogen mg/L 6.200 (1.600 - 16.000)
0.190 (0.073 - 0.750)
0.120 (0.029 - 0.340)
Nitrate-Nitrogen mg/L 0.710 (0.002 - 2.000)
2.400 (1.400 - 3.200)
2.850 (1.400 - 5.800)
Total Kjeldahl Nitrogen mg/L 12.00
(2.10 - 21.00) 0.92
(0.39 - 1.80) 0.45
(<0.05 - 7.60) Orthophosphate Phosphorus mg/L 0.470
(0.150 - 1.100) 0.295
(0.170 - 0.510) 0.325
(0.130 - 0.750)
Total Phosphorus mg/L 1.20 (0.25 - 1.90)
0.37 (0.23 - 0.70)
0.43 (0.19 - 0.88)
Sulphide mg/L <0.02 (<0.02 - 0.05)
<0.02 (<0.02 - <0.02)
<0.02 (<0.02 - <0.02)
Aluminium µg/L <50 (<50 - 160)
59 (<50 - 110)
<50 (<50 - 140)
Cadmium µg/L <0.1 (<0.1 - <0.1)
<0.1 (<0.1 - <0.1)
<0.1 (<0.1 - <0.1)
Chromium µg/L <1 (<1 - <1)
<1 (<1 - <1)
<1 (<1 - <1)
Copper µg/L 2 (2 - 3)
2 (1 - 2)
1 (1 - 2)
Lead µg/L <1 (<1 - <1)
<1 (<1 - <1)
<1 (<1 - <1)
Zinc µg/L 13 (<10 - 37)
10 (<10 - 12)
<10 (<10 - 13)
Flow m3/s NM NM 0.715 (0.154 - 1.082)
Notes: 1. Data presented are in annual medians of monthly samples; except those for faecal coliforms and E. coli which are in annual
geometric means. 2. Figures in brackets are annual ranges. 3. NM indicates no measurement taken. 4. Values at or below laboratory reporting limits are presented as laboratory reporting limits (see Appendix B). 5. Equal values for annual medians (or geometric means) and ranges indicate that all data are the same as or below laboratory reporting
limits.
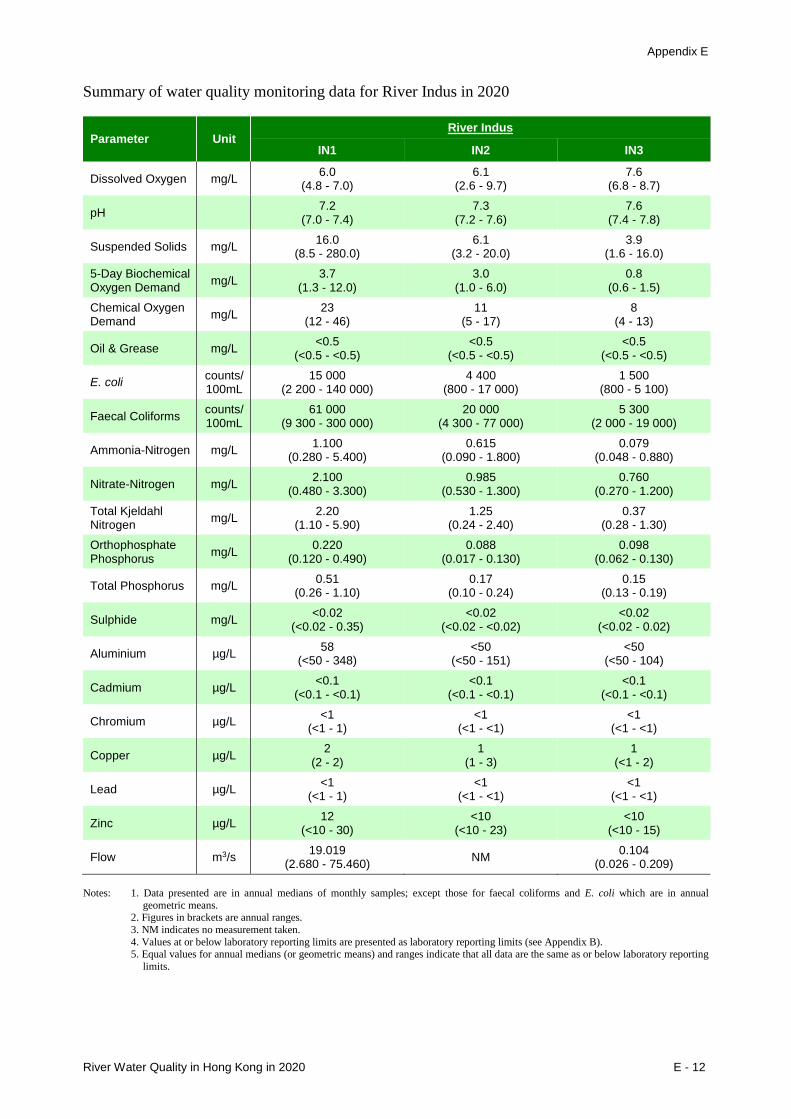
Appendix E
River Water Quality in Hong Kong in 2020 E - 12
Summary of water quality monitoring data for River Indus in 2020
Parameter Unit River Indus
IN1 IN2 IN3
Dissolved Oxygen mg/L 6.0 (4.8 - 7.0)
6.1 (2.6 - 9.7)
7.6 (6.8 - 8.7)
pH 7.2 (7.0 - 7.4)
7.3 (7.2 - 7.6)
7.6 (7.4 - 7.8)
Suspended Solids mg/L 16.0 (8.5 - 280.0)
6.1 (3.2 - 20.0)
3.9 (1.6 - 16.0)
5-Day Biochemical Oxygen Demand mg/L 3.7
(1.3 - 12.0) 3.0
(1.0 - 6.0) 0.8
(0.6 - 1.5) Chemical Oxygen Demand mg/L 23
(12 - 46) 11
(5 - 17) 8
(4 - 13)
Oil & Grease mg/L <0.5 (<0.5 - <0.5)
<0.5 (<0.5 - <0.5)
<0.5 (<0.5 - <0.5)
E. coli counts/ 100mL
15 000 (2 200 - 140 000)
4 400 (800 - 17 000)
1 500 (800 - 5 100)
Faecal Coliforms counts/ 100mL
61 000 (9 300 - 300 000)
20 000 (4 300 - 77 000)
5 300 (2 000 - 19 000)
Ammonia-Nitrogen mg/L 1.100 (0.280 - 5.400)
0.615 (0.090 - 1.800)
0.079 (0.048 - 0.880)
Nitrate-Nitrogen mg/L 2.100 (0.480 - 3.300)
0.985 (0.530 - 1.300)
0.760 (0.270 - 1.200)
Total Kjeldahl Nitrogen mg/L 2.20
(1.10 - 5.90) 1.25
(0.24 - 2.40) 0.37
(0.28 - 1.30) Orthophosphate Phosphorus mg/L 0.220
(0.120 - 0.490) 0.088
(0.017 - 0.130) 0.098
(0.062 - 0.130)
Total Phosphorus mg/L 0.51 (0.26 - 1.10)
0.17 (0.10 - 0.24)
0.15 (0.13 - 0.19)
Sulphide mg/L <0.02 (<0.02 - 0.35)
<0.02 (<0.02 - <0.02)
<0.02 (<0.02 - 0.02)
Aluminium µg/L 58 (<50 - 348)
<50 (<50 - 151)
<50 (<50 - 104)
Cadmium µg/L <0.1 (<0.1 - <0.1)
<0.1 (<0.1 - <0.1)
<0.1 (<0.1 - <0.1)
Chromium µg/L <1 (<1 - 1)
<1 (<1 - <1)
<1 (<1 - <1)
Copper µg/L 2 (2 - 2)
1 (1 - 3)
1 (<1 - 2)
Lead µg/L <1 (<1 - 1)
<1 (<1 - <1)
<1 (<1 - <1)
Zinc µg/L 12 (<10 - 30)
<10 (<10 - 23)
<10 (<10 - 15)
Flow m3/s 19.019 (2.680 - 75.460) NM 0.104
(0.026 - 0.209) Notes: 1. Data presented are in annual medians of monthly samples; except those for faecal coliforms and E. coli which are in annual
geometric means. 2. Figures in brackets are annual ranges. 3. NM indicates no measurement taken. 4. Values at or below laboratory reporting limits are presented as laboratory reporting limits (see Appendix B). 5. Equal values for annual medians (or geometric means) and ranges indicate that all data are the same as or below laboratory reporting
limits.
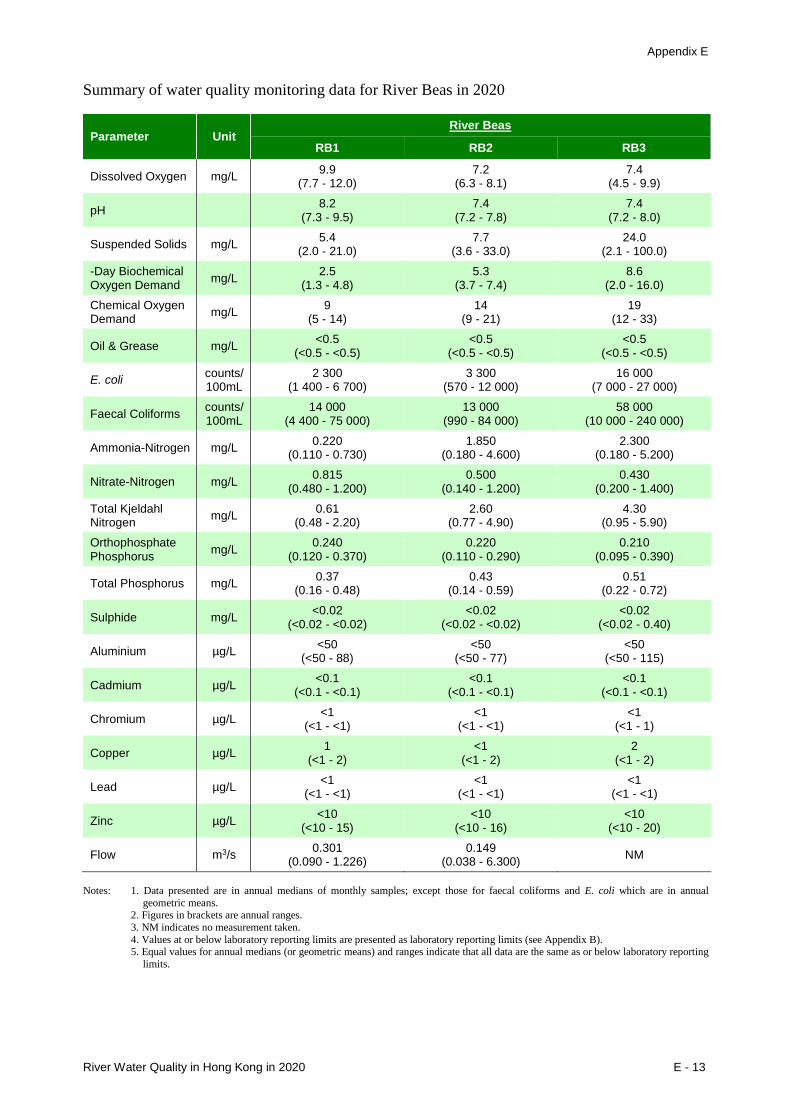
Appendix E
River Water Quality in Hong Kong in 2020 E - 13
Summary of water quality monitoring data for River Beas in 2020
Parameter Unit River Beas
RB1 RB2 RB3
Dissolved Oxygen mg/L 9.9 (7.7 - 12.0)
7.2 (6.3 - 8.1)
7.4 (4.5 - 9.9)
pH 8.2 (7.3 - 9.5)
7.4 (7.2 - 7.8)
7.4 (7.2 - 8.0)
Suspended Solids mg/L 5.4 (2.0 - 21.0)
7.7 (3.6 - 33.0)
24.0 (2.1 - 100.0)
-Day Biochemical Oxygen Demand mg/L 2.5
(1.3 - 4.8) 5.3
(3.7 - 7.4) 8.6
(2.0 - 16.0) Chemical Oxygen Demand mg/L 9
(5 - 14) 14
(9 - 21) 19
(12 - 33)
Oil & Grease mg/L <0.5 (<0.5 - <0.5)
<0.5 (<0.5 - <0.5)
<0.5 (<0.5 - <0.5)
E. coli counts/ 100mL
2 300 (1 400 - 6 700)
3 300 (570 - 12 000)
16 000 (7 000 - 27 000)
Faecal Coliforms counts/ 100mL
14 000 (4 400 - 75 000)
13 000 (990 - 84 000)
58 000 (10 000 - 240 000)
Ammonia-Nitrogen mg/L 0.220 (0.110 - 0.730)
1.850 (0.180 - 4.600)
2.300 (0.180 - 5.200)
Nitrate-Nitrogen mg/L 0.815 (0.480 - 1.200)
0.500 (0.140 - 1.200)
0.430 (0.200 - 1.400)
Total Kjeldahl Nitrogen mg/L 0.61
(0.48 - 2.20) 2.60
(0.77 - 4.90) 4.30
(0.95 - 5.90) Orthophosphate Phosphorus mg/L 0.240
(0.120 - 0.370) 0.220
(0.110 - 0.290) 0.210
(0.095 - 0.390)
Total Phosphorus mg/L 0.37 (0.16 - 0.48)
0.43 (0.14 - 0.59)
0.51 (0.22 - 0.72)
Sulphide mg/L <0.02 (<0.02 - <0.02)
<0.02 (<0.02 - <0.02)
<0.02 (<0.02 - 0.40)
Aluminium µg/L <50 (<50 - 88)
<50 (<50 - 77)
<50 (<50 - 115)
Cadmium µg/L <0.1 (<0.1 - <0.1)
<0.1 (<0.1 - <0.1)
<0.1 (<0.1 - <0.1)
Chromium µg/L <1 (<1 - <1)
<1 (<1 - <1)
<1 (<1 - 1)
Copper µg/L 1 (<1 - 2)
<1 (<1 - 2)
2 (<1 - 2)
Lead µg/L <1 (<1 - <1)
<1 (<1 - <1)
<1 (<1 - <1)
Zinc µg/L <10 (<10 - 15)
<10 (<10 - 16)
<10 (<10 - 20)
Flow m3/s 0.301 (0.090 - 1.226)
0.149 (0.038 - 6.300) NM
Notes: 1. Data presented are in annual medians of monthly samples; except those for faecal coliforms and E. coli which are in annual
geometric means. 2. Figures in brackets are annual ranges. 3. NM indicates no measurement taken. 4. Values at or below laboratory reporting limits are presented as laboratory reporting limits (see Appendix B). 5. Equal values for annual medians (or geometric means) and ranges indicate that all data are the same as or below laboratory reporting
limits.
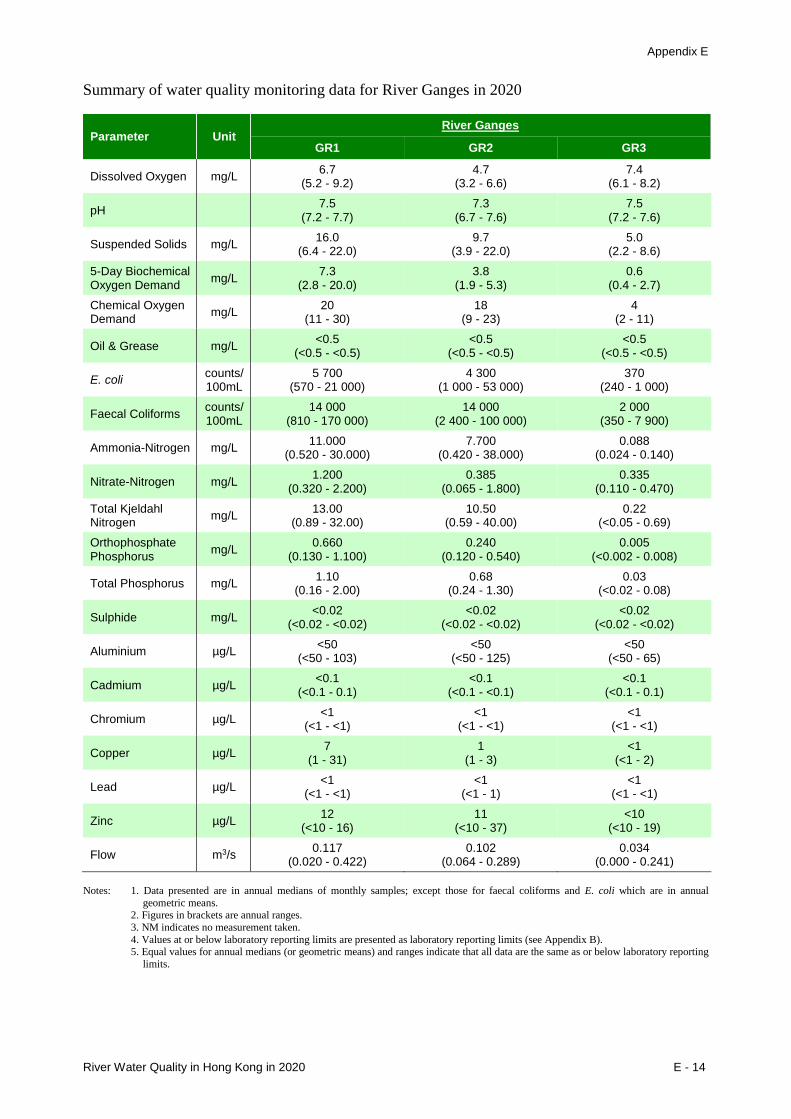
Appendix E
River Water Quality in Hong Kong in 2020 E - 14
Summary of water quality monitoring data for River Ganges in 2020
Parameter Unit River Ganges
GR1 GR2 GR3
Dissolved Oxygen mg/L 6.7 (5.2 - 9.2)
4.7 (3.2 - 6.6)
7.4 (6.1 - 8.2)
pH 7.5 (7.2 - 7.7)
7.3 (6.7 - 7.6)
7.5 (7.2 - 7.6)
Suspended Solids mg/L 16.0 (6.4 - 22.0)
9.7 (3.9 - 22.0)
5.0 (2.2 - 8.6)
5-Day Biochemical Oxygen Demand mg/L 7.3
(2.8 - 20.0) 3.8
(1.9 - 5.3) 0.6
(0.4 - 2.7) Chemical Oxygen Demand mg/L 20
(11 - 30) 18
(9 - 23) 4
(2 - 11)
Oil & Grease mg/L <0.5 (<0.5 - <0.5)
<0.5 (<0.5 - <0.5)
<0.5 (<0.5 - <0.5)
E. coli counts/ 100mL
5 700 (570 - 21 000)
4 300 (1 000 - 53 000)
370 (240 - 1 000)
Faecal Coliforms counts/ 100mL
14 000 (810 - 170 000)
14 000 (2 400 - 100 000)
2 000 (350 - 7 900)
Ammonia-Nitrogen mg/L 11.000 (0.520 - 30.000)
7.700 (0.420 - 38.000)
0.088 (0.024 - 0.140)
Nitrate-Nitrogen mg/L 1.200 (0.320 - 2.200)
0.385 (0.065 - 1.800)
0.335 (0.110 - 0.470)
Total Kjeldahl Nitrogen mg/L 13.00
(0.89 - 32.00) 10.50
(0.59 - 40.00) 0.22
(<0.05 - 0.69) Orthophosphate Phosphorus mg/L 0.660
(0.130 - 1.100) 0.240
(0.120 - 0.540) 0.005
(<0.002 - 0.008)
Total Phosphorus mg/L 1.10 (0.16 - 2.00)
0.68 (0.24 - 1.30)
0.03 (<0.02 - 0.08)
Sulphide mg/L <0.02 (<0.02 - <0.02)
<0.02 (<0.02 - <0.02)
<0.02 (<0.02 - <0.02)
Aluminium µg/L <50 (<50 - 103)
<50 (<50 - 125)
<50 (<50 - 65)
Cadmium µg/L <0.1 (<0.1 - 0.1)
<0.1 (<0.1 - <0.1)
<0.1 (<0.1 - 0.1)
Chromium µg/L <1 (<1 - <1)
<1 (<1 - <1)
<1 (<1 - <1)
Copper µg/L 7 (1 - 31)
1 (1 - 3)
<1 (<1 - 2)
Lead µg/L <1 (<1 - <1)
<1 (<1 - 1)
<1 (<1 - <1)
Zinc µg/L 12 (<10 - 16)
11 (<10 - 37)
<10 (<10 - 19)
Flow m3/s 0.117 (0.020 - 0.422)
0.102 (0.064 - 0.289)
0.034 (0.000 - 0.241)
Notes: 1. Data presented are in annual medians of monthly samples; except those for faecal coliforms and E. coli which are in annual
geometric means. 2. Figures in brackets are annual ranges. 3. NM indicates no measurement taken. 4. Values at or below laboratory reporting limits are presented as laboratory reporting limits (see Appendix B). 5. Equal values for annual medians (or geometric means) and ranges indicate that all data are the same as or below laboratory reporting
limits.

Appendix E
River Water Quality in Hong Kong in 2020 E - 15
Summary of water quality monitoring data for Yuen Long Creek in 2020 (Part 1 of 2)
Parameter Unit Yuen Long Creek
YL1 YL2
Dissolved Oxygen mg/L 2.9 (1.8 - 5.5)
6.9 (4.9 - 9.5)
pH 7.3 (5.8 - 7.7)
7.8 (7.3 - 8.0)
Suspended Solids mg/L 27.5 (8.0 - 49.0)
7.7 (4.0 - 110.0)
5-Day Biochemical Oxygen Demand mg/L 16.5
(8.8 - 33.0) 7.6
(4.9 - 12.0) Chemical Oxygen Demand mg/L 32
(16 - 75) 14
(11 - 30)
Oil & Grease mg/L <0.5 (<0.5 - 1.4)
<0.5 (<0.5 - 0.6)
E. coli counts/ 100mL
170 000 (31 000 - 440 000)
87 000 (28 000 - 390 000)
Faecal Coliforms counts/ 100mL
620 000 (130 000 - 5 200 000)
250 000 (96 000 - 1 800 000)
Ammonia-Nitrogen mg/L 5.250 (2.600 - 18.000)
5.300 (2.900 - 8.100)
Nitrate-Nitrogen mg/L 0.305 (0.013 - 0.910)
0.450 (0.390 - 1.500)
Total Kjeldahl Nitrogen mg/L 6.60
(3.10 - 49.00) 6.30
(3.50 - 10.00) Orthophosphate Phosphorus mg/L 0.615
(0.330 - 7.200) 0.325
(0.190 - 0.450)
Total Phosphorus mg/L 1.30 (0.57 - 7.80)
0.56 (0.37 - 0.76)
Sulphide mg/L 0.04 (<0.02 - 0.08)
<0.02 (<0.02 - 0.03)
Aluminium µg/L <50 (<50 - 112)
<50 (<50 - 173)
Cadmium µg/L <0.1 (<0.1 - <0.1)
<0.1 (<0.1 - <0.1)
Chromium µg/L <1 (<1 - <1)
<1 (<1 - 2)
Copper µg/L 3 (2 - 7)
2 (<1 - 3)
Lead µg/L <1 (<1 - <1)
<1 (<1 - <1)
Zinc µg/L 11 (<10 - 16)
<10 (<10 - 24)
Flow m3/s 0.359 (0.259 - 0.575)
0.015 (0.010 - 0.044)
Notes: 1. Data presented are in annual medians of monthly samples; except those for faecal coliforms and E. coli which are in annual
geometric means. 2. Figures in brackets are annual ranges. 3. NM indicates no measurement taken. 4. Values at or below laboratory reporting limits are presented as laboratory reporting limits (see Appendix B). 5. Equal values for annual medians (or geometric means) and ranges indicate that all data are the same as or below laboratory reporting
limits.
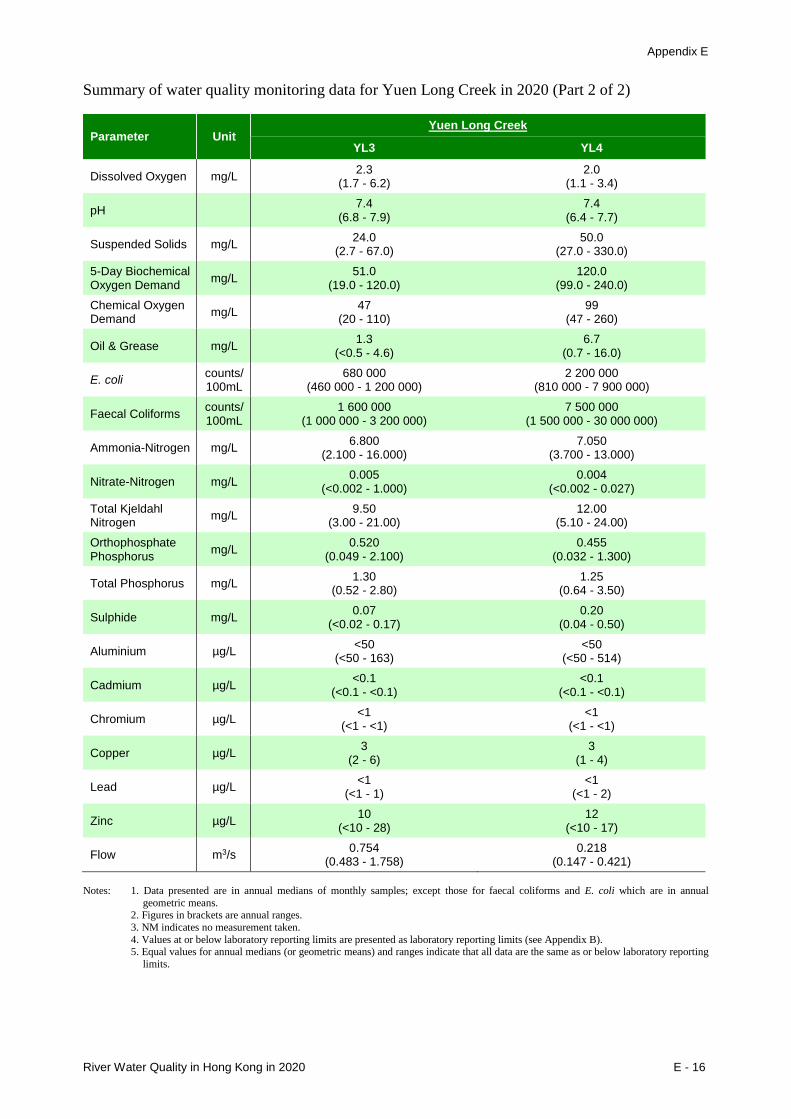
Appendix E
River Water Quality in Hong Kong in 2020 E - 16
Summary of water quality monitoring data for Yuen Long Creek in 2020 (Part 2 of 2)
Parameter Unit Yuen Long Creek
YL3 YL4
Dissolved Oxygen mg/L 2.3 (1.7 - 6.2)
2.0 (1.1 - 3.4)
pH 7.4 (6.8 - 7.9)
7.4 (6.4 - 7.7)
Suspended Solids mg/L 24.0 (2.7 - 67.0)
50.0 (27.0 - 330.0)
5-Day Biochemical Oxygen Demand mg/L 51.0
(19.0 - 120.0) 120.0
(99.0 - 240.0) Chemical Oxygen Demand mg/L 47
(20 - 110) 99
(47 - 260)
Oil & Grease mg/L 1.3 (<0.5 - 4.6)
6.7 (0.7 - 16.0)
E. coli counts/ 100mL
680 000 (460 000 - 1 200 000)
2 200 000 (810 000 - 7 900 000)
Faecal Coliforms counts/ 100mL
1 600 000 (1 000 000 - 3 200 000)
7 500 000 (1 500 000 - 30 000 000)
Ammonia-Nitrogen mg/L 6.800 (2.100 - 16.000)
7.050 (3.700 - 13.000)
Nitrate-Nitrogen mg/L 0.005 (<0.002 - 1.000)
0.004 (<0.002 - 0.027)
Total Kjeldahl Nitrogen mg/L 9.50
(3.00 - 21.00) 12.00
(5.10 - 24.00) Orthophosphate Phosphorus mg/L 0.520
(0.049 - 2.100) 0.455
(0.032 - 1.300)
Total Phosphorus mg/L 1.30 (0.52 - 2.80)
1.25 (0.64 - 3.50)
Sulphide mg/L 0.07 (<0.02 - 0.17)
0.20 (0.04 - 0.50)
Aluminium µg/L <50 (<50 - 163)
<50 (<50 - 514)
Cadmium µg/L <0.1 (<0.1 - <0.1)
<0.1 (<0.1 - <0.1)
Chromium µg/L <1 (<1 - <1)
<1 (<1 - <1)
Copper µg/L 3 (2 - 6)
3 (1 - 4)
Lead µg/L <1 (<1 - 1)
<1 (<1 - 2)
Zinc µg/L 10 (<10 - 28)
12 (<10 - 17)
Flow m3/s 0.754 (0.483 - 1.758)
0.218 (0.147 - 0.421)
Notes: 1. Data presented are in annual medians of monthly samples; except those for faecal coliforms and E. coli which are in annual
geometric means. 2. Figures in brackets are annual ranges. 3. NM indicates no measurement taken. 4. Values at or below laboratory reporting limits are presented as laboratory reporting limits (see Appendix B). 5. Equal values for annual medians (or geometric means) and ranges indicate that all data are the same as or below laboratory reporting
limits.
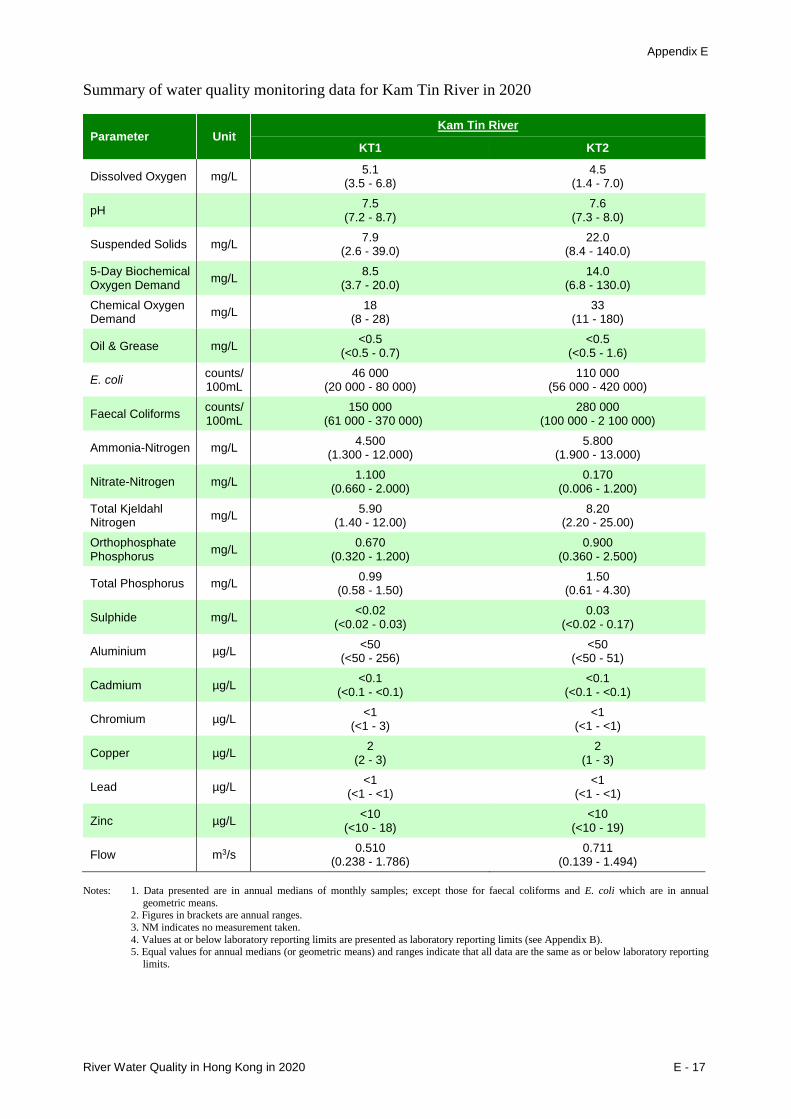
Appendix E
River Water Quality in Hong Kong in 2020 E - 17
Summary of water quality monitoring data for Kam Tin River in 2020
Parameter Unit Kam Tin River
KT1 KT2
Dissolved Oxygen mg/L 5.1 (3.5 - 6.8)
4.5 (1.4 - 7.0)
pH 7.5 (7.2 - 8.7)
7.6 (7.3 - 8.0)
Suspended Solids mg/L 7.9 (2.6 - 39.0)
22.0 (8.4 - 140.0)
5-Day Biochemical Oxygen Demand mg/L 8.5
(3.7 - 20.0) 14.0
(6.8 - 130.0) Chemical Oxygen Demand mg/L 18
(8 - 28) 33
(11 - 180)
Oil & Grease mg/L <0.5 (<0.5 - 0.7)
<0.5 (<0.5 - 1.6)
E. coli counts/ 100mL
46 000 (20 000 - 80 000)
110 000 (56 000 - 420 000)
Faecal Coliforms counts/ 100mL
150 000 (61 000 - 370 000)
280 000 (100 000 - 2 100 000)
Ammonia-Nitrogen mg/L 4.500 (1.300 - 12.000)
5.800 (1.900 - 13.000)
Nitrate-Nitrogen mg/L 1.100 (0.660 - 2.000)
0.170 (0.006 - 1.200)
Total Kjeldahl Nitrogen mg/L 5.90
(1.40 - 12.00) 8.20
(2.20 - 25.00) Orthophosphate Phosphorus mg/L 0.670
(0.320 - 1.200) 0.900
(0.360 - 2.500)
Total Phosphorus mg/L 0.99 (0.58 - 1.50)
1.50 (0.61 - 4.30)
Sulphide mg/L <0.02 (<0.02 - 0.03)
0.03 (<0.02 - 0.17)
Aluminium µg/L <50 (<50 - 256)
<50 (<50 - 51)
Cadmium µg/L <0.1 (<0.1 - <0.1)
<0.1 (<0.1 - <0.1)
Chromium µg/L <1 (<1 - 3)
<1 (<1 - <1)
Copper µg/L 2 (2 - 3)
2 (1 - 3)
Lead µg/L <1 (<1 - <1)
<1 (<1 - <1)
Zinc µg/L <10 (<10 - 18)
<10 (<10 - 19)
Flow m3/s 0.510 (0.238 - 1.786)
0.711 (0.139 - 1.494)
Notes: 1. Data presented are in annual medians of monthly samples; except those for faecal coliforms and E. coli which are in annual
geometric means. 2. Figures in brackets are annual ranges. 3. NM indicates no measurement taken. 4. Values at or below laboratory reporting limits are presented as laboratory reporting limits (see Appendix B). 5. Equal values for annual medians (or geometric means) and ranges indicate that all data are the same as or below laboratory reporting
limits.
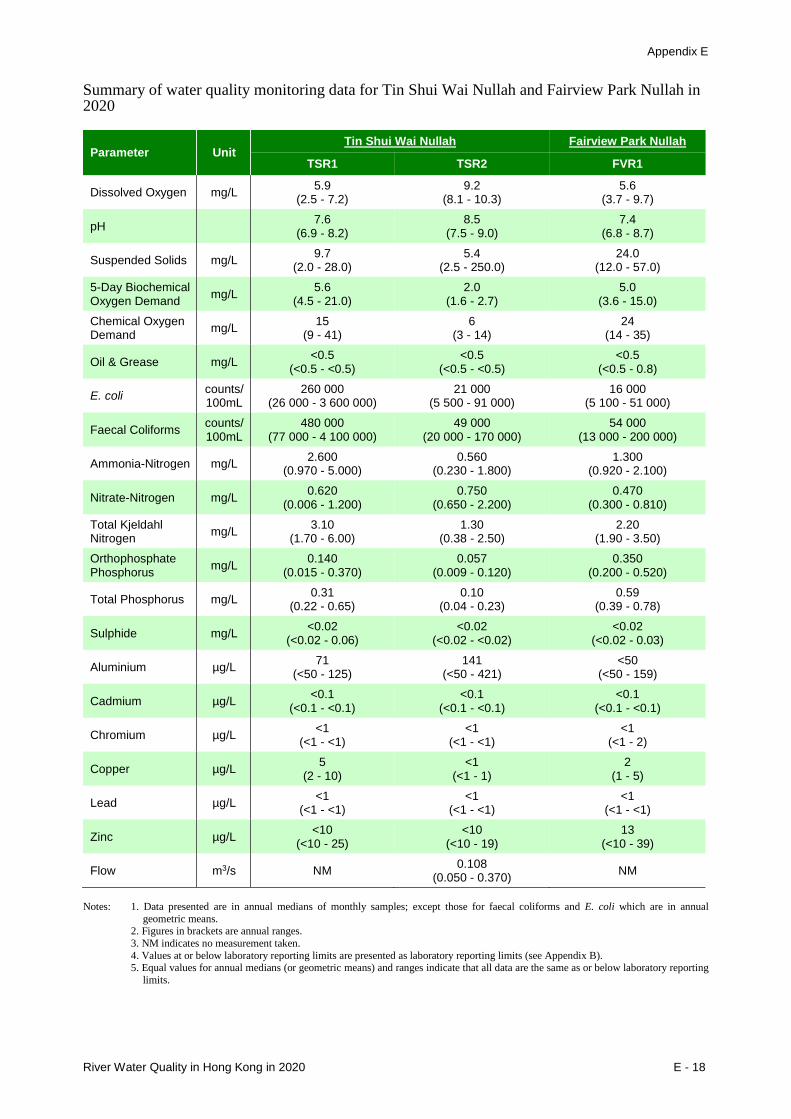
Appendix E
River Water Quality in Hong Kong in 2020 E - 18
Summary of water quality monitoring data for Tin Shui Wai Nullah and Fairview Park Nullah in 2020
Parameter Unit Tin Shui Wai Nullah Fairview Park Nullah
TSR1 TSR2 FVR1
Dissolved Oxygen mg/L 5.9 (2.5 - 7.2)
9.2 (8.1 - 10.3)
5.6 (3.7 - 9.7)
pH 7.6 (6.9 - 8.2)
8.5 (7.5 - 9.0)
7.4 (6.8 - 8.7)
Suspended Solids mg/L 9.7 (2.0 - 28.0)
5.4 (2.5 - 250.0)
24.0 (12.0 - 57.0)
5-Day Biochemical Oxygen Demand mg/L 5.6
(4.5 - 21.0) 2.0
(1.6 - 2.7) 5.0
(3.6 - 15.0) Chemical Oxygen Demand mg/L 15
(9 - 41) 6
(3 - 14) 24
(14 - 35)
Oil & Grease mg/L <0.5 (<0.5 - <0.5)
<0.5 (<0.5 - <0.5)
<0.5 (<0.5 - 0.8)
E. coli counts/ 100mL
260 000 (26 000 - 3 600 000)
21 000 (5 500 - 91 000)
16 000 (5 100 - 51 000)
Faecal Coliforms counts/ 100mL
480 000 (77 000 - 4 100 000)
49 000 (20 000 - 170 000)
54 000 (13 000 - 200 000)
Ammonia-Nitrogen mg/L 2.600 (0.970 - 5.000)
0.560 (0.230 - 1.800)
1.300 (0.920 - 2.100)
Nitrate-Nitrogen mg/L 0.620 (0.006 - 1.200)
0.750 (0.650 - 2.200)
0.470 (0.300 - 0.810)
Total Kjeldahl Nitrogen mg/L 3.10
(1.70 - 6.00) 1.30
(0.38 - 2.50) 2.20
(1.90 - 3.50) Orthophosphate Phosphorus mg/L 0.140
(0.015 - 0.370) 0.057
(0.009 - 0.120) 0.350
(0.200 - 0.520)
Total Phosphorus mg/L 0.31 (0.22 - 0.65)
0.10 (0.04 - 0.23)
0.59 (0.39 - 0.78)
Sulphide mg/L <0.02 (<0.02 - 0.06)
<0.02 (<0.02 - <0.02)
<0.02 (<0.02 - 0.03)
Aluminium µg/L 71 (<50 - 125)
141 (<50 - 421)
<50 (<50 - 159)
Cadmium µg/L <0.1 (<0.1 - <0.1)
<0.1 (<0.1 - <0.1)
<0.1 (<0.1 - <0.1)
Chromium µg/L <1 (<1 - <1)
<1 (<1 - <1)
<1 (<1 - 2)
Copper µg/L 5 (2 - 10)
<1 (<1 - 1)
2 (1 - 5)
Lead µg/L <1 (<1 - <1)
<1 (<1 - <1)
<1 (<1 - <1)
Zinc µg/L <10 (<10 - 25)
<10 (<10 - 19)
13 (<10 - 39)
Flow m3/s NM 0.108 (0.050 - 0.370) NM
Notes: 1. Data presented are in annual medians of monthly samples; except those for faecal coliforms and E. coli which are in annual
geometric means. 2. Figures in brackets are annual ranges. 3. NM indicates no measurement taken. 4. Values at or below laboratory reporting limits are presented as laboratory reporting limits (see Appendix B). 5. Equal values for annual medians (or geometric means) and ranges indicate that all data are the same as or below laboratory reporting
limits.
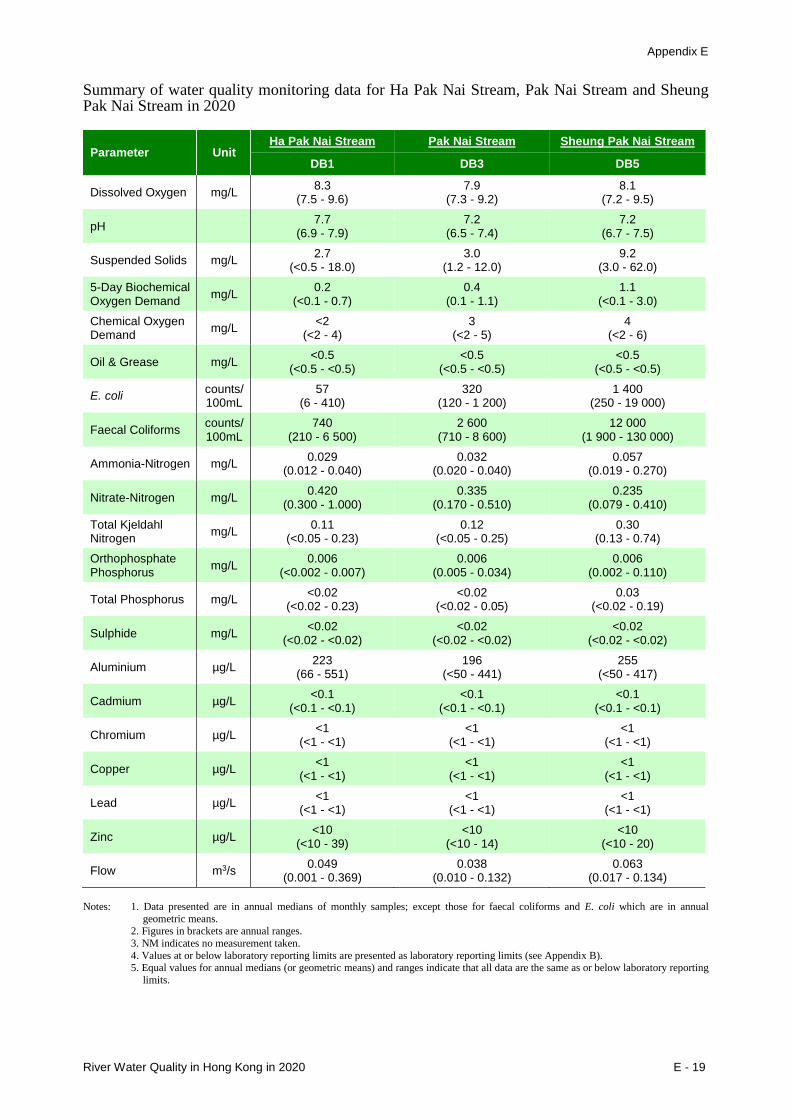
Appendix E
River Water Quality in Hong Kong in 2020 E - 19
Summary of water quality monitoring data for Ha Pak Nai Stream, Pak Nai Stream and Sheung Pak Nai Stream in 2020
Parameter Unit Ha Pak Nai Stream Pak Nai Stream Sheung Pak Nai Stream
DB1 DB3 DB5
Dissolved Oxygen mg/L 8.3 (7.5 - 9.6)
7.9 (7.3 - 9.2)
8.1 (7.2 - 9.5)
pH 7.7 (6.9 - 7.9)
7.2 (6.5 - 7.4)
7.2 (6.7 - 7.5)
Suspended Solids mg/L 2.7 (<0.5 - 18.0)
3.0 (1.2 - 12.0)
9.2 (3.0 - 62.0)
5-Day Biochemical Oxygen Demand mg/L 0.2
(<0.1 - 0.7) 0.4
(0.1 - 1.1) 1.1
(<0.1 - 3.0) Chemical Oxygen Demand mg/L <2
(<2 - 4) 3
(<2 - 5) 4
(<2 - 6)
Oil & Grease mg/L <0.5 (<0.5 - <0.5)
<0.5 (<0.5 - <0.5)
<0.5 (<0.5 - <0.5)
E. coli counts/ 100mL
57 (6 - 410)
320 (120 - 1 200)
1 400 (250 - 19 000)
Faecal Coliforms counts/ 100mL
740 (210 - 6 500)
2 600 (710 - 8 600)
12 000 (1 900 - 130 000)
Ammonia-Nitrogen mg/L 0.029 (0.012 - 0.040)
0.032 (0.020 - 0.040)
0.057 (0.019 - 0.270)
Nitrate-Nitrogen mg/L 0.420 (0.300 - 1.000)
0.335 (0.170 - 0.510)
0.235 (0.079 - 0.410)
Total Kjeldahl Nitrogen mg/L 0.11
(<0.05 - 0.23) 0.12
(<0.05 - 0.25) 0.30
(0.13 - 0.74) Orthophosphate Phosphorus mg/L 0.006
(<0.002 - 0.007) 0.006
(0.005 - 0.034) 0.006
(0.002 - 0.110)
Total Phosphorus mg/L <0.02 (<0.02 - 0.23)
<0.02 (<0.02 - 0.05)
0.03 (<0.02 - 0.19)
Sulphide mg/L <0.02 (<0.02 - <0.02)
<0.02 (<0.02 - <0.02)
<0.02 (<0.02 - <0.02)
Aluminium µg/L 223 (66 - 551)
196 (<50 - 441)
255 (<50 - 417)
Cadmium µg/L <0.1 (<0.1 - <0.1)
<0.1 (<0.1 - <0.1)
<0.1 (<0.1 - <0.1)
Chromium µg/L <1 (<1 - <1)
<1 (<1 - <1)
<1 (<1 - <1)
Copper µg/L <1 (<1 - <1)
<1 (<1 - <1)
<1 (<1 - <1)
Lead µg/L <1 (<1 - <1)
<1 (<1 - <1)
<1 (<1 - <1)
Zinc µg/L <10 (<10 - 39)
<10 (<10 - 14)
<10 (<10 - 20)
Flow m3/s 0.049 (0.001 - 0.369)
0.038 (0.010 - 0.132)
0.063 (0.017 - 0.134)
Notes: 1. Data presented are in annual medians of monthly samples; except those for faecal coliforms and E. coli which are in annual
geometric means. 2. Figures in brackets are annual ranges. 3. NM indicates no measurement taken. 4. Values at or below laboratory reporting limits are presented as laboratory reporting limits (see Appendix B). 5. Equal values for annual medians (or geometric means) and ranges indicate that all data are the same as or below laboratory reporting
limits.
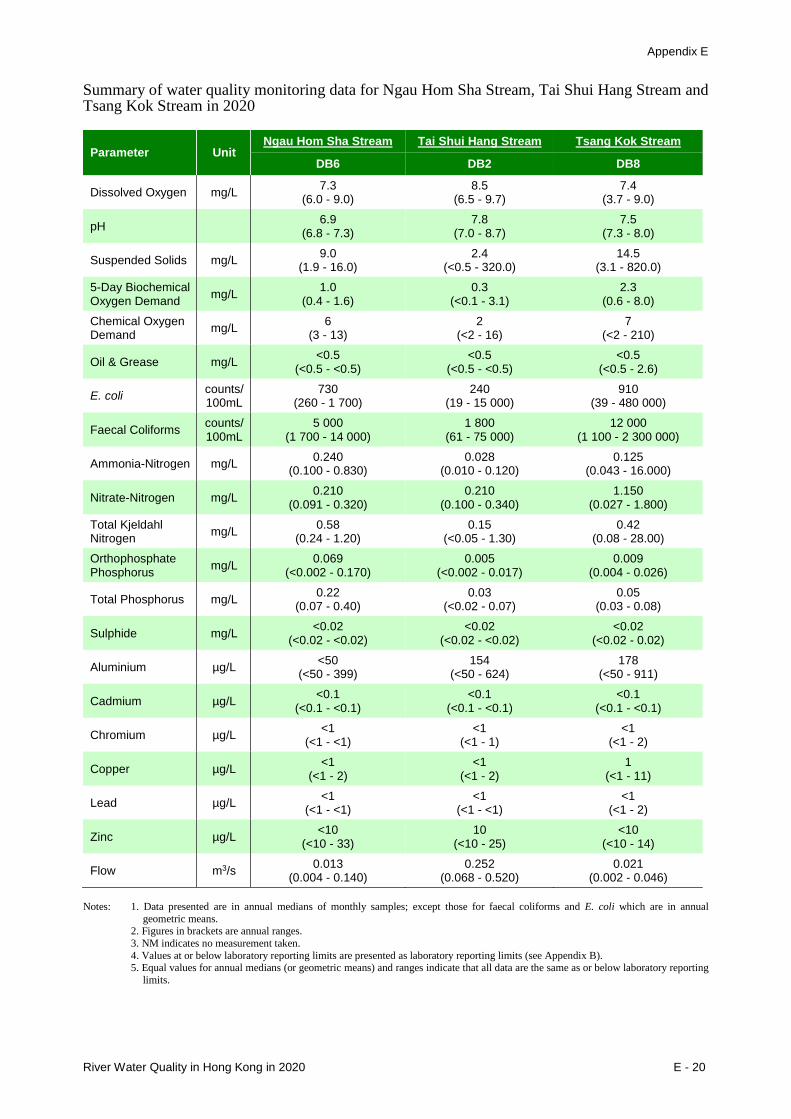
Appendix E
River Water Quality in Hong Kong in 2020 E - 20
Summary of water quality monitoring data for Ngau Hom Sha Stream, Tai Shui Hang Stream and Tsang Kok Stream in 2020
Parameter Unit Ngau Hom Sha Stream Tai Shui Hang Stream Tsang Kok Stream
DB6 DB2 DB8
Dissolved Oxygen mg/L 7.3 (6.0 - 9.0)
8.5 (6.5 - 9.7)
7.4 (3.7 - 9.0)
pH 6.9 (6.8 - 7.3)
7.8 (7.0 - 8.7)
7.5 (7.3 - 8.0)
Suspended Solids mg/L 9.0 (1.9 - 16.0)
2.4 (<0.5 - 320.0)
14.5 (3.1 - 820.0)
5-Day Biochemical Oxygen Demand mg/L 1.0
(0.4 - 1.6) 0.3
(<0.1 - 3.1) 2.3
(0.6 - 8.0) Chemical Oxygen Demand mg/L 6
(3 - 13) 2
(<2 - 16) 7
(<2 - 210)
Oil & Grease mg/L <0.5 (<0.5 - <0.5)
<0.5 (<0.5 - <0.5)
<0.5 (<0.5 - 2.6)
E. coli counts/ 100mL
730 (260 - 1 700)
240 (19 - 15 000)
910 (39 - 480 000)
Faecal Coliforms counts/ 100mL
5 000 (1 700 - 14 000)
1 800 (61 - 75 000)
12 000 (1 100 - 2 300 000)
Ammonia-Nitrogen mg/L 0.240 (0.100 - 0.830)
0.028 (0.010 - 0.120)
0.125 (0.043 - 16.000)
Nitrate-Nitrogen mg/L 0.210 (0.091 - 0.320)
0.210 (0.100 - 0.340)
1.150 (0.027 - 1.800)
Total Kjeldahl Nitrogen mg/L 0.58
(0.24 - 1.20) 0.15
(<0.05 - 1.30) 0.42
(0.08 - 28.00) Orthophosphate Phosphorus mg/L 0.069
(<0.002 - 0.170) 0.005
(<0.002 - 0.017) 0.009
(0.004 - 0.026)
Total Phosphorus mg/L 0.22 (0.07 - 0.40)
0.03 (<0.02 - 0.07)
0.05 (0.03 - 0.08)
Sulphide mg/L <0.02 (<0.02 - <0.02)
<0.02 (<0.02 - <0.02)
<0.02 (<0.02 - 0.02)
Aluminium µg/L <50 (<50 - 399)
154 (<50 - 624)
178 (<50 - 911)
Cadmium µg/L <0.1 (<0.1 - <0.1)
<0.1 (<0.1 - <0.1)
<0.1 (<0.1 - <0.1)
Chromium µg/L <1 (<1 - <1)
<1 (<1 - 1)
<1 (<1 - 2)
Copper µg/L <1 (<1 - 2)
<1 (<1 - 2)
1 (<1 - 11)
Lead µg/L <1 (<1 - <1)
<1 (<1 - <1)
<1 (<1 - 2)
Zinc µg/L <10 (<10 - 33)
10 (<10 - 25)
<10 (<10 - 14)
Flow m3/s 0.013 (0.004 - 0.140)
0.252 (0.068 - 0.520)
0.021 (0.002 - 0.046)
Notes: 1. Data presented are in annual medians of monthly samples; except those for faecal coliforms and E. coli which are in annual
geometric means. 2. Figures in brackets are annual ranges. 3. NM indicates no measurement taken. 4. Values at or below laboratory reporting limits are presented as laboratory reporting limits (see Appendix B). 5. Equal values for annual medians (or geometric means) and ranges indicate that all data are the same as or below laboratory reporting
limits.
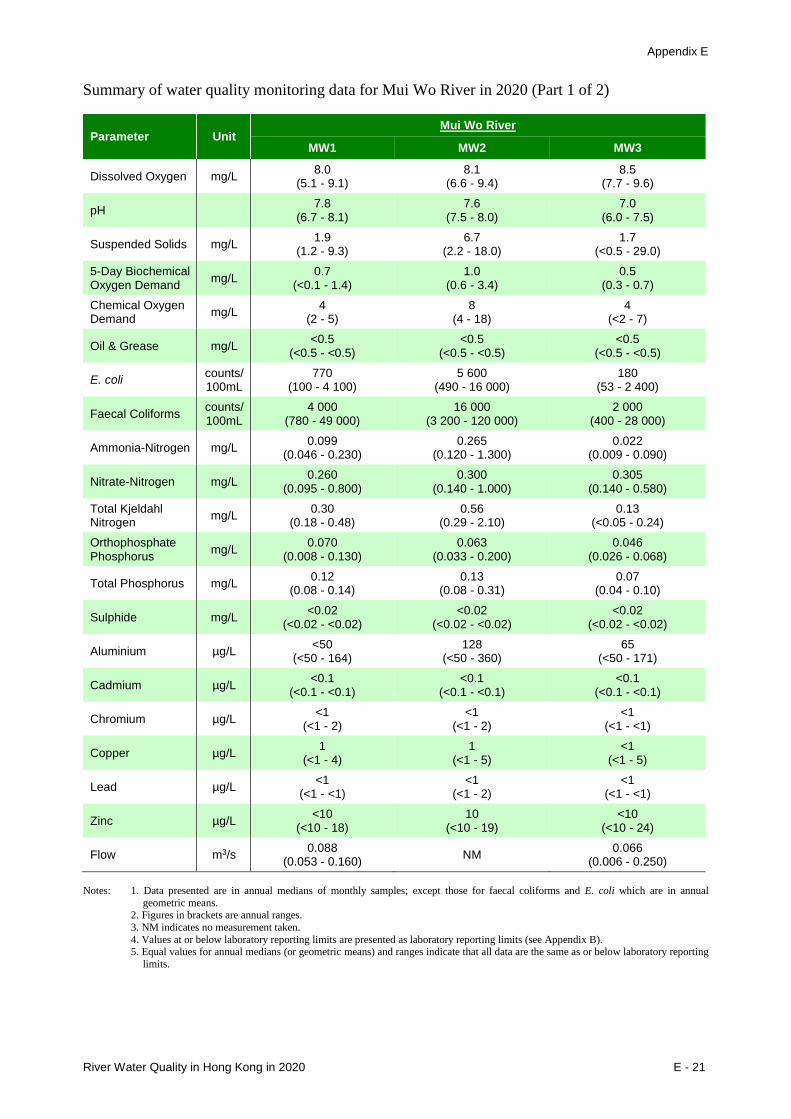
Appendix E
River Water Quality in Hong Kong in 2020 E - 21
Summary of water quality monitoring data for Mui Wo River in 2020 (Part 1 of 2)
Parameter Unit Mui Wo River
MW1 MW2 MW3
Dissolved Oxygen mg/L 8.0 (5.1 - 9.1)
8.1 (6.6 - 9.4)
8.5 (7.7 - 9.6)
pH 7.8 (6.7 - 8.1)
7.6 (7.5 - 8.0)
7.0 (6.0 - 7.5)
Suspended Solids mg/L 1.9 (1.2 - 9.3)
6.7 (2.2 - 18.0)
1.7 (<0.5 - 29.0)
5-Day Biochemical Oxygen Demand mg/L 0.7
(<0.1 - 1.4) 1.0
(0.6 - 3.4) 0.5
(0.3 - 0.7) Chemical Oxygen Demand mg/L 4
(2 - 5) 8
(4 - 18) 4
(<2 - 7)
Oil & Grease mg/L <0.5 (<0.5 - <0.5)
<0.5 (<0.5 - <0.5)
<0.5 (<0.5 - <0.5)
E. coli counts/ 100mL
770 (100 - 4 100)
5 600 (490 - 16 000)
180 (53 - 2 400)
Faecal Coliforms counts/ 100mL
4 000 (780 - 49 000)
16 000 (3 200 - 120 000)
2 000 (400 - 28 000)
Ammonia-Nitrogen mg/L 0.099 (0.046 - 0.230)
0.265 (0.120 - 1.300)
0.022 (0.009 - 0.090)
Nitrate-Nitrogen mg/L 0.260 (0.095 - 0.800)
0.300 (0.140 - 1.000)
0.305 (0.140 - 0.580)
Total Kjeldahl Nitrogen mg/L 0.30
(0.18 - 0.48) 0.56
(0.29 - 2.10) 0.13
(<0.05 - 0.24) Orthophosphate Phosphorus mg/L 0.070
(0.008 - 0.130) 0.063
(0.033 - 0.200) 0.046
(0.026 - 0.068)
Total Phosphorus mg/L 0.12 (0.08 - 0.14)
0.13 (0.08 - 0.31)
0.07 (0.04 - 0.10)
Sulphide mg/L <0.02 (<0.02 - <0.02)
<0.02 (<0.02 - <0.02)
<0.02 (<0.02 - <0.02)
Aluminium µg/L <50 (<50 - 164)
128 (<50 - 360)
65 (<50 - 171)
Cadmium µg/L <0.1 (<0.1 - <0.1)
<0.1 (<0.1 - <0.1)
<0.1 (<0.1 - <0.1)
Chromium µg/L <1 (<1 - 2)
<1 (<1 - 2)
<1 (<1 - <1)
Copper µg/L 1 (<1 - 4)
1 (<1 - 5)
<1 (<1 - 5)
Lead µg/L <1 (<1 - <1)
<1 (<1 - 2)
<1 (<1 - <1)
Zinc µg/L <10 (<10 - 18)
10 (<10 - 19)
<10 (<10 - 24)
Flow m3/s 0.088 (0.053 - 0.160) NM 0.066
(0.006 - 0.250) Notes: 1. Data presented are in annual medians of monthly samples; except those for faecal coliforms and E. coli which are in annual
geometric means. 2. Figures in brackets are annual ranges. 3. NM indicates no measurement taken. 4. Values at or below laboratory reporting limits are presented as laboratory reporting limits (see Appendix B). 5. Equal values for annual medians (or geometric means) and ranges indicate that all data are the same as or below laboratory reporting
limits.
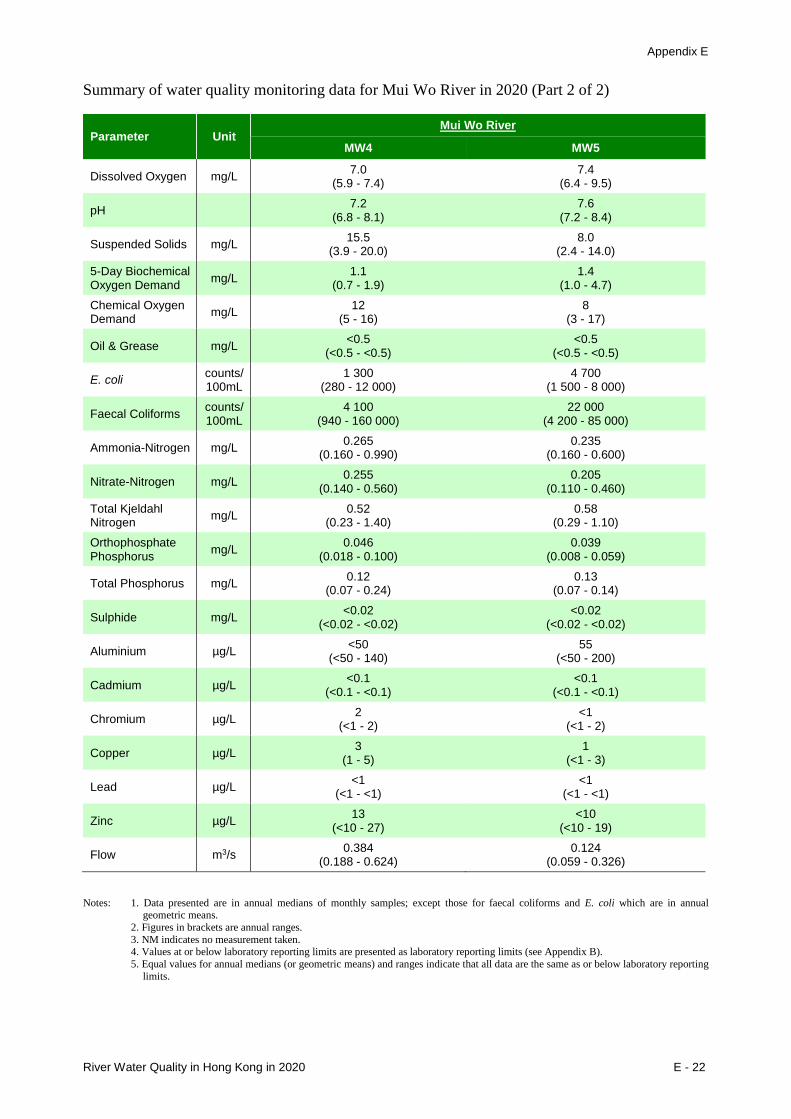
Appendix E
River Water Quality in Hong Kong in 2020 E - 22
Summary of water quality monitoring data for Mui Wo River in 2020 (Part 2 of 2)
Parameter Unit Mui Wo River
MW4 MW5
Dissolved Oxygen mg/L 7.0 (5.9 - 7.4)
7.4 (6.4 - 9.5)
pH 7.2 (6.8 - 8.1)
7.6 (7.2 - 8.4)
Suspended Solids mg/L 15.5 (3.9 - 20.0)
8.0 (2.4 - 14.0)
5-Day Biochemical Oxygen Demand mg/L 1.1
(0.7 - 1.9) 1.4
(1.0 - 4.7) Chemical Oxygen Demand mg/L 12
(5 - 16) 8
(3 - 17)
Oil & Grease mg/L <0.5 (<0.5 - <0.5)
<0.5 (<0.5 - <0.5)
E. coli counts/ 100mL
1 300 (280 - 12 000)
4 700 (1 500 - 8 000)
Faecal Coliforms counts/ 100mL
4 100 (940 - 160 000)
22 000 (4 200 - 85 000)
Ammonia-Nitrogen mg/L 0.265 (0.160 - 0.990)
0.235 (0.160 - 0.600)
Nitrate-Nitrogen mg/L 0.255 (0.140 - 0.560)
0.205 (0.110 - 0.460)
Total Kjeldahl Nitrogen mg/L 0.52
(0.23 - 1.40) 0.58
(0.29 - 1.10) Orthophosphate Phosphorus mg/L 0.046
(0.018 - 0.100) 0.039
(0.008 - 0.059)
Total Phosphorus mg/L 0.12 (0.07 - 0.24)
0.13 (0.07 - 0.14)
Sulphide mg/L <0.02 (<0.02 - <0.02)
<0.02 (<0.02 - <0.02)
Aluminium µg/L <50 (<50 - 140)
55 (<50 - 200)
Cadmium µg/L <0.1 (<0.1 - <0.1)
<0.1 (<0.1 - <0.1)
Chromium µg/L 2 (<1 - 2)
<1 (<1 - 2)
Copper µg/L 3 (1 - 5)
1 (<1 - 3)
Lead µg/L <1 (<1 - <1)
<1 (<1 - <1)
Zinc µg/L 13 (<10 - 27)
<10 (<10 - 19)
Flow m3/s 0.384 (0.188 - 0.624)
0.124 (0.059 - 0.326)
Notes: 1. Data presented are in annual medians of monthly samples; except those for faecal coliforms and E. coli which are in annual
geometric means. 2. Figures in brackets are annual ranges. 3. NM indicates no measurement taken. 4. Values at or below laboratory reporting limits are presented as laboratory reporting limits (see Appendix B). 5. Equal values for annual medians (or geometric means) and ranges indicate that all data are the same as or below laboratory reporting
limits.
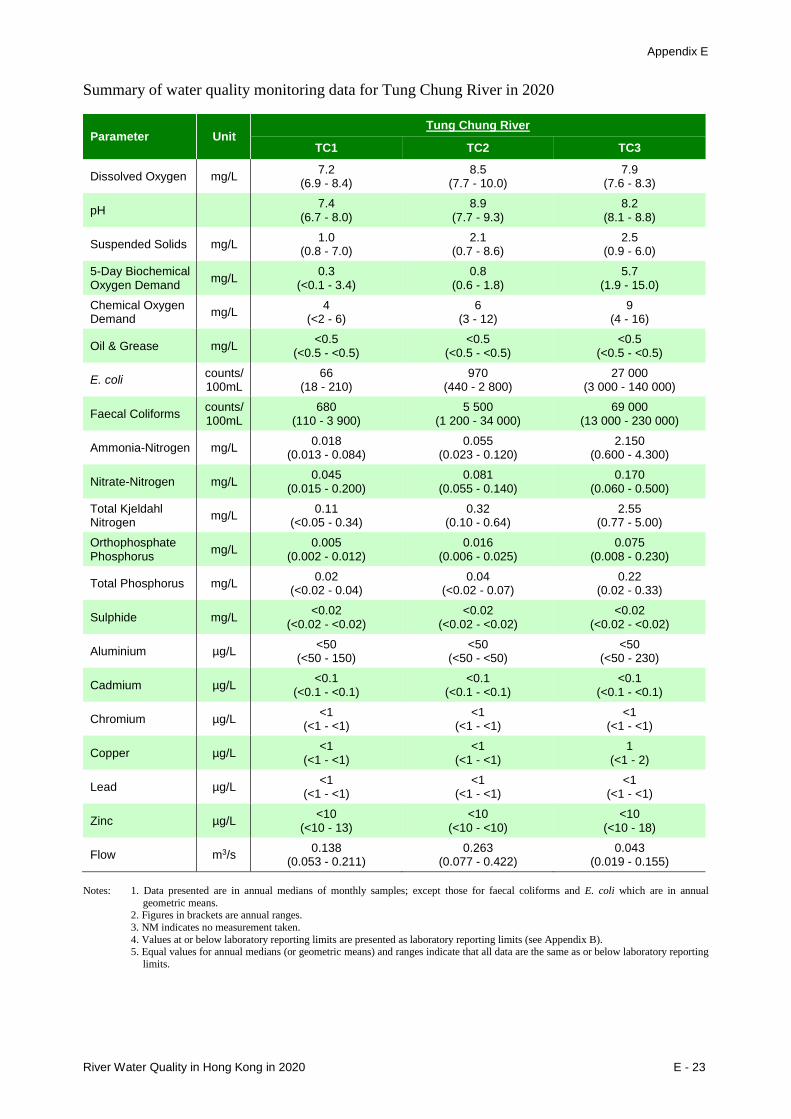
Appendix E
River Water Quality in Hong Kong in 2020 E - 23
Summary of water quality monitoring data for Tung Chung River in 2020
Parameter Unit Tung Chung River
TC1 TC2 TC3
Dissolved Oxygen mg/L 7.2 (6.9 - 8.4)
8.5 (7.7 - 10.0)
7.9 (7.6 - 8.3)
pH 7.4 (6.7 - 8.0)
8.9 (7.7 - 9.3)
8.2 (8.1 - 8.8)
Suspended Solids mg/L 1.0 (0.8 - 7.0)
2.1 (0.7 - 8.6)
2.5 (0.9 - 6.0)
5-Day Biochemical Oxygen Demand mg/L 0.3
(<0.1 - 3.4) 0.8
(0.6 - 1.8) 5.7
(1.9 - 15.0) Chemical Oxygen Demand mg/L 4
(<2 - 6) 6
(3 - 12) 9
(4 - 16)
Oil & Grease mg/L <0.5 (<0.5 - <0.5)
<0.5 (<0.5 - <0.5)
<0.5 (<0.5 - <0.5)
E. coli counts/ 100mL
66 (18 - 210)
970 (440 - 2 800)
27 000 (3 000 - 140 000)
Faecal Coliforms counts/ 100mL
680 (110 - 3 900)
5 500 (1 200 - 34 000)
69 000 (13 000 - 230 000)
Ammonia-Nitrogen mg/L 0.018 (0.013 - 0.084)
0.055 (0.023 - 0.120)
2.150 (0.600 - 4.300)
Nitrate-Nitrogen mg/L 0.045 (0.015 - 0.200)
0.081 (0.055 - 0.140)
0.170 (0.060 - 0.500)
Total Kjeldahl Nitrogen mg/L 0.11
(<0.05 - 0.34) 0.32
(0.10 - 0.64) 2.55
(0.77 - 5.00) Orthophosphate Phosphorus mg/L 0.005
(0.002 - 0.012) 0.016
(0.006 - 0.025) 0.075
(0.008 - 0.230)
Total Phosphorus mg/L 0.02 (<0.02 - 0.04)
0.04 (<0.02 - 0.07)
0.22 (0.02 - 0.33)
Sulphide mg/L <0.02 (<0.02 - <0.02)
<0.02 (<0.02 - <0.02)
<0.02 (<0.02 - <0.02)
Aluminium µg/L <50 (<50 - 150)
<50 (<50 - <50)
<50 (<50 - 230)
Cadmium µg/L <0.1 (<0.1 - <0.1)
<0.1 (<0.1 - <0.1)
<0.1 (<0.1 - <0.1)
Chromium µg/L <1 (<1 - <1)
<1 (<1 - <1)
<1 (<1 - <1)
Copper µg/L <1 (<1 - <1)
<1 (<1 - <1)
1 (<1 - 2)
Lead µg/L <1 (<1 - <1)
<1 (<1 - <1)
<1 (<1 - <1)
Zinc µg/L <10 (<10 - 13)
<10 (<10 - <10)
<10 (<10 - 18)
Flow m3/s 0.138 (0.053 - 0.211)
0.263 (0.077 - 0.422)
0.043 (0.019 - 0.155)
Notes: 1. Data presented are in annual medians of monthly samples; except those for faecal coliforms and E. coli which are in annual
geometric means. 2. Figures in brackets are annual ranges. 3. NM indicates no measurement taken. 4. Values at or below laboratory reporting limits are presented as laboratory reporting limits (see Appendix B). 5. Equal values for annual medians (or geometric means) and ranges indicate that all data are the same as or below laboratory reporting
limits.
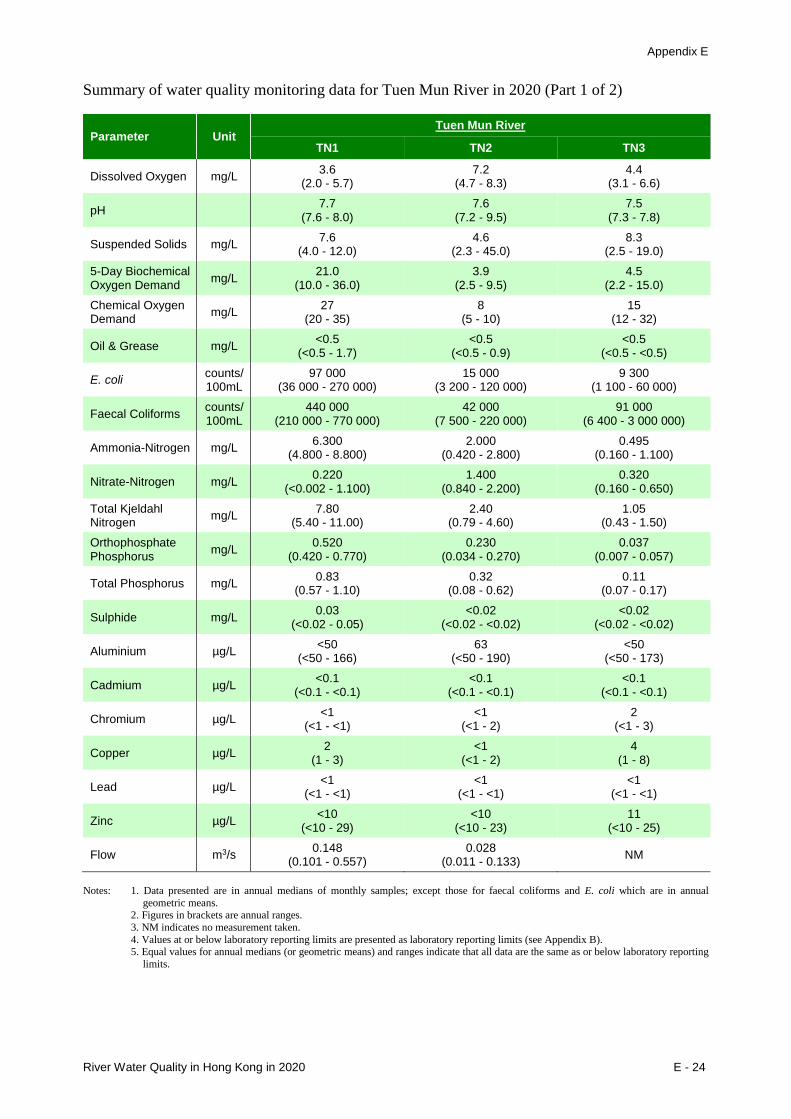
Appendix E
River Water Quality in Hong Kong in 2020 E - 24
Summary of water quality monitoring data for Tuen Mun River in 2020 (Part 1 of 2)
Parameter Unit Tuen Mun River
TN1 TN2 TN3
Dissolved Oxygen mg/L 3.6 (2.0 - 5.7)
7.2 (4.7 - 8.3)
4.4 (3.1 - 6.6)
pH 7.7 (7.6 - 8.0)
7.6 (7.2 - 9.5)
7.5 (7.3 - 7.8)
Suspended Solids mg/L 7.6 (4.0 - 12.0)
4.6 (2.3 - 45.0)
8.3 (2.5 - 19.0)
5-Day Biochemical Oxygen Demand mg/L 21.0
(10.0 - 36.0) 3.9
(2.5 - 9.5) 4.5
(2.2 - 15.0) Chemical Oxygen Demand mg/L 27
(20 - 35) 8
(5 - 10) 15
(12 - 32)
Oil & Grease mg/L <0.5 (<0.5 - 1.7)
<0.5 (<0.5 - 0.9)
<0.5 (<0.5 - <0.5)
E. coli counts/ 100mL
97 000 (36 000 - 270 000)
15 000 (3 200 - 120 000)
9 300 (1 100 - 60 000)
Faecal Coliforms counts/ 100mL
440 000 (210 000 - 770 000)
42 000 (7 500 - 220 000)
91 000 (6 400 - 3 000 000)
Ammonia-Nitrogen mg/L 6.300 (4.800 - 8.800)
2.000 (0.420 - 2.800)
0.495 (0.160 - 1.100)
Nitrate-Nitrogen mg/L 0.220 (<0.002 - 1.100)
1.400 (0.840 - 2.200)
0.320 (0.160 - 0.650)
Total Kjeldahl Nitrogen mg/L 7.80
(5.40 - 11.00) 2.40
(0.79 - 4.60) 1.05
(0.43 - 1.50) Orthophosphate Phosphorus mg/L 0.520
(0.420 - 0.770) 0.230
(0.034 - 0.270) 0.037
(0.007 - 0.057)
Total Phosphorus mg/L 0.83 (0.57 - 1.10)
0.32 (0.08 - 0.62)
0.11 (0.07 - 0.17)
Sulphide mg/L 0.03 (<0.02 - 0.05)
<0.02 (<0.02 - <0.02)
<0.02 (<0.02 - <0.02)
Aluminium µg/L <50 (<50 - 166)
63 (<50 - 190)
<50 (<50 - 173)
Cadmium µg/L <0.1 (<0.1 - <0.1)
<0.1 (<0.1 - <0.1)
<0.1 (<0.1 - <0.1)
Chromium µg/L <1 (<1 - <1)
<1 (<1 - 2)
2 (<1 - 3)
Copper µg/L 2 (1 - 3)
<1 (<1 - 2)
4 (1 - 8)
Lead µg/L <1 (<1 - <1)
<1 (<1 - <1)
<1 (<1 - <1)
Zinc µg/L <10 (<10 - 29)
<10 (<10 - 23)
11 (<10 - 25)
Flow m3/s 0.148 (0.101 - 0.557)
0.028 (0.011 - 0.133) NM
Notes: 1. Data presented are in annual medians of monthly samples; except those for faecal coliforms and E. coli which are in annual
geometric means. 2. Figures in brackets are annual ranges. 3. NM indicates no measurement taken. 4. Values at or below laboratory reporting limits are presented as laboratory reporting limits (see Appendix B). 5. Equal values for annual medians (or geometric means) and ranges indicate that all data are the same as or below laboratory reporting
limits.
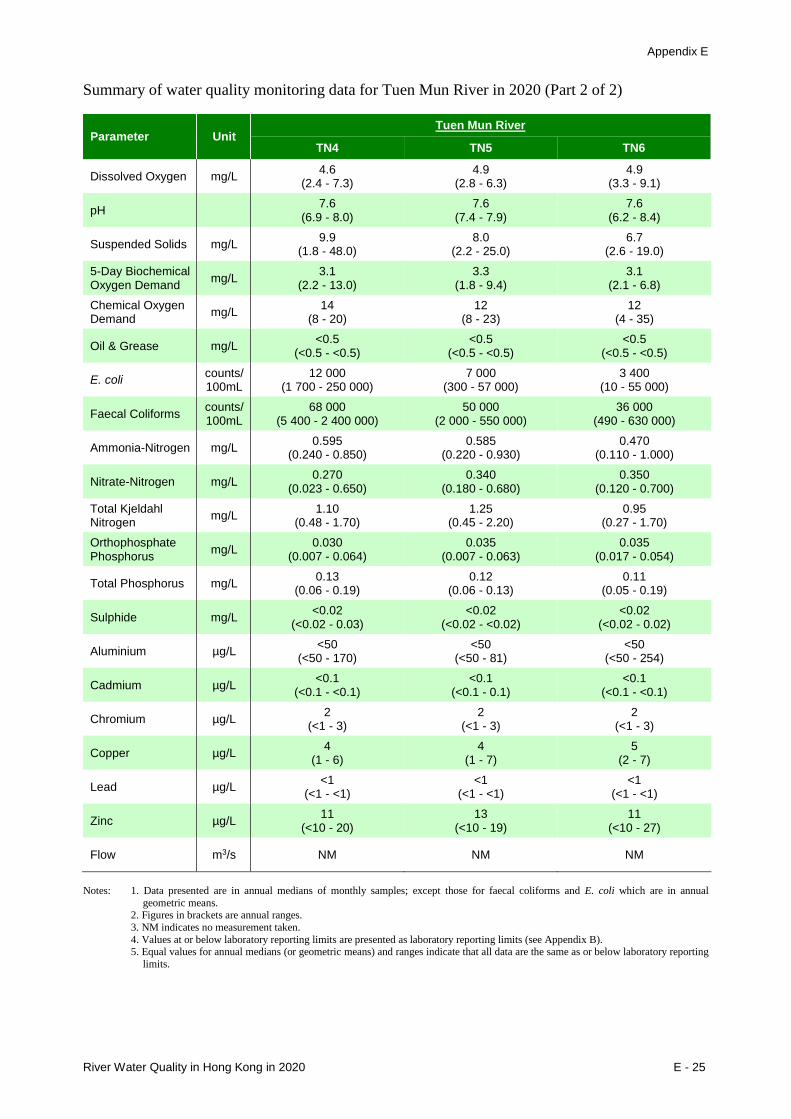
Appendix E
River Water Quality in Hong Kong in 2020 E - 25
Summary of water quality monitoring data for Tuen Mun River in 2020 (Part 2 of 2)
Parameter Unit Tuen Mun River
TN4 TN5 TN6
Dissolved Oxygen mg/L 4.6 (2.4 - 7.3)
4.9 (2.8 - 6.3)
4.9 (3.3 - 9.1)
pH 7.6 (6.9 - 8.0)
7.6 (7.4 - 7.9)
7.6 (6.2 - 8.4)
Suspended Solids mg/L 9.9 (1.8 - 48.0)
8.0 (2.2 - 25.0)
6.7 (2.6 - 19.0)
5-Day Biochemical Oxygen Demand mg/L 3.1
(2.2 - 13.0) 3.3
(1.8 - 9.4) 3.1
(2.1 - 6.8) Chemical Oxygen Demand mg/L 14
(8 - 20) 12
(8 - 23) 12
(4 - 35)
Oil & Grease mg/L <0.5 (<0.5 - <0.5)
<0.5 (<0.5 - <0.5)
<0.5 (<0.5 - <0.5)
E. coli counts/ 100mL
12 000 (1 700 - 250 000)
7 000 (300 - 57 000)
3 400 (10 - 55 000)
Faecal Coliforms counts/ 100mL
68 000 (5 400 - 2 400 000)
50 000 (2 000 - 550 000)
36 000 (490 - 630 000)
Ammonia-Nitrogen mg/L 0.595 (0.240 - 0.850)
0.585 (0.220 - 0.930)
0.470 (0.110 - 1.000)
Nitrate-Nitrogen mg/L 0.270 (0.023 - 0.650)
0.340 (0.180 - 0.680)
0.350 (0.120 - 0.700)
Total Kjeldahl Nitrogen mg/L 1.10
(0.48 - 1.70) 1.25
(0.45 - 2.20) 0.95
(0.27 - 1.70) Orthophosphate Phosphorus mg/L 0.030
(0.007 - 0.064) 0.035
(0.007 - 0.063) 0.035
(0.017 - 0.054)
Total Phosphorus mg/L 0.13 (0.06 - 0.19)
0.12 (0.06 - 0.13)
0.11 (0.05 - 0.19)
Sulphide mg/L <0.02 (<0.02 - 0.03)
<0.02 (<0.02 - <0.02)
<0.02 (<0.02 - 0.02)
Aluminium µg/L <50 (<50 - 170)
<50 (<50 - 81)
<50 (<50 - 254)
Cadmium µg/L <0.1 (<0.1 - <0.1)
<0.1 (<0.1 - 0.1)
<0.1 (<0.1 - <0.1)
Chromium µg/L 2 (<1 - 3)
2 (<1 - 3)
2 (<1 - 3)
Copper µg/L 4 (1 - 6)
4 (1 - 7)
5 (2 - 7)
Lead µg/L <1 (<1 - <1)
<1 (<1 - <1)
<1 (<1 - <1)
Zinc µg/L 11 (<10 - 20)
13 (<10 - 19)
11 (<10 - 27)
Flow m3/s NM NM NM
Notes: 1. Data presented are in annual medians of monthly samples; except those for faecal coliforms and E. coli which are in annual
geometric means. 2. Figures in brackets are annual ranges. 3. NM indicates no measurement taken. 4. Values at or below laboratory reporting limits are presented as laboratory reporting limits (see Appendix B). 5. Equal values for annual medians (or geometric means) and ranges indicate that all data are the same as or below laboratory reporting
limits.
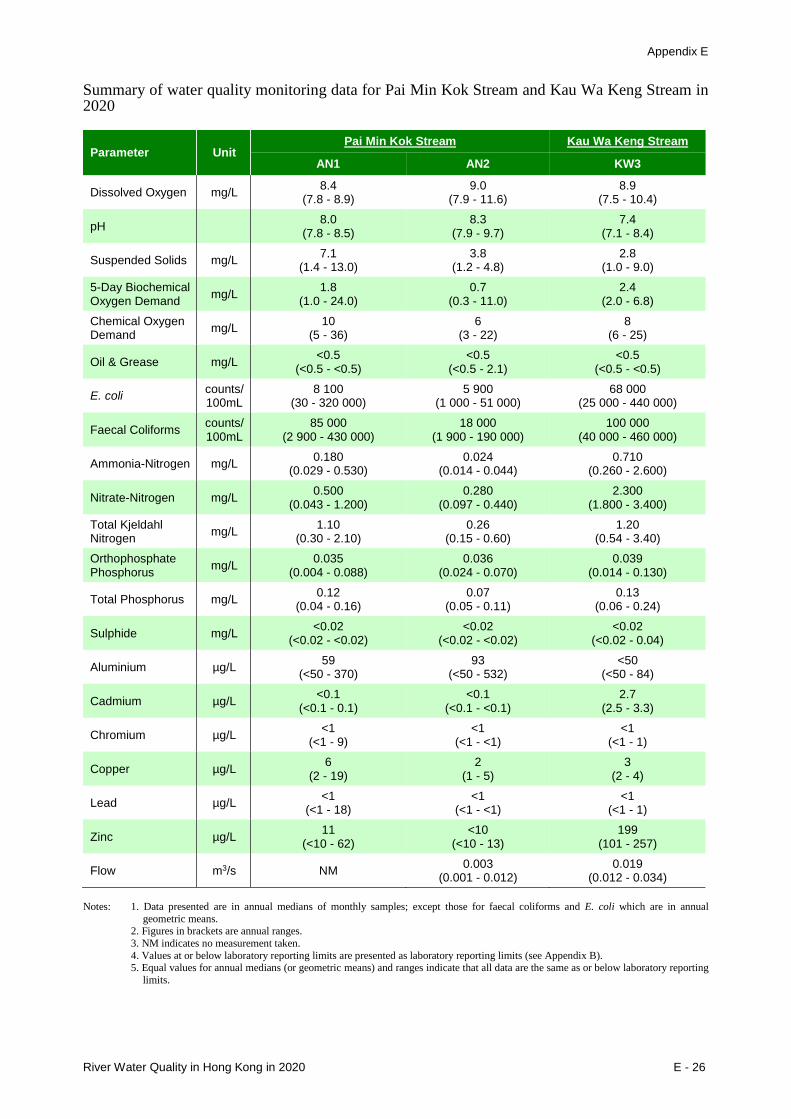
Appendix E
River Water Quality in Hong Kong in 2020 E - 26
Summary of water quality monitoring data for Pai Min Kok Stream and Kau Wa Keng Stream in 2020
Parameter Unit Pai Min Kok Stream Kau Wa Keng Stream
AN1 AN2 KW3
Dissolved Oxygen mg/L 8.4 (7.8 - 8.9)
9.0 (7.9 - 11.6)
8.9 (7.5 - 10.4)
pH 8.0 (7.8 - 8.5)
8.3 (7.9 - 9.7)
7.4 (7.1 - 8.4)
Suspended Solids mg/L 7.1 (1.4 - 13.0)
3.8 (1.2 - 4.8)
2.8 (1.0 - 9.0)
5-Day Biochemical Oxygen Demand mg/L 1.8
(1.0 - 24.0) 0.7
(0.3 - 11.0) 2.4
(2.0 - 6.8) Chemical Oxygen Demand mg/L 10
(5 - 36) 6
(3 - 22) 8
(6 - 25)
Oil & Grease mg/L <0.5 (<0.5 - <0.5)
<0.5 (<0.5 - 2.1)
<0.5 (<0.5 - <0.5)
E. coli counts/ 100mL
8 100 (30 - 320 000)
5 900 (1 000 - 51 000)
68 000 (25 000 - 440 000)
Faecal Coliforms counts/ 100mL
85 000 (2 900 - 430 000)
18 000 (1 900 - 190 000)
100 000 (40 000 - 460 000)
Ammonia-Nitrogen mg/L 0.180 (0.029 - 0.530)
0.024 (0.014 - 0.044)
0.710 (0.260 - 2.600)
Nitrate-Nitrogen mg/L 0.500 (0.043 - 1.200)
0.280 (0.097 - 0.440)
2.300 (1.800 - 3.400)
Total Kjeldahl Nitrogen mg/L 1.10
(0.30 - 2.10) 0.26
(0.15 - 0.60) 1.20
(0.54 - 3.40) Orthophosphate Phosphorus mg/L 0.035
(0.004 - 0.088) 0.036
(0.024 - 0.070) 0.039
(0.014 - 0.130)
Total Phosphorus mg/L 0.12 (0.04 - 0.16)
0.07 (0.05 - 0.11)
0.13 (0.06 - 0.24)
Sulphide mg/L <0.02 (<0.02 - <0.02)
<0.02 (<0.02 - <0.02)
<0.02 (<0.02 - 0.04)
Aluminium µg/L 59 (<50 - 370)
93 (<50 - 532)
<50 (<50 - 84)
Cadmium µg/L <0.1 (<0.1 - 0.1)
<0.1 (<0.1 - <0.1)
2.7 (2.5 - 3.3)
Chromium µg/L <1 (<1 - 9)
<1 (<1 - <1)
<1 (<1 - 1)
Copper µg/L 6 (2 - 19)
2 (1 - 5)
3 (2 - 4)
Lead µg/L <1 (<1 - 18)
<1 (<1 - <1)
<1 (<1 - 1)
Zinc µg/L 11 (<10 - 62)
<10 (<10 - 13)
199 (101 - 257)
Flow m3/s NM 0.003 (0.001 - 0.012)
0.019 (0.012 - 0.034)
Notes: 1. Data presented are in annual medians of monthly samples; except those for faecal coliforms and E. coli which are in annual
geometric means. 2. Figures in brackets are annual ranges. 3. NM indicates no measurement taken. 4. Values at or below laboratory reporting limits are presented as laboratory reporting limits (see Appendix B). 5. Equal values for annual medians (or geometric means) and ranges indicate that all data are the same as or below laboratory reporting
limits.
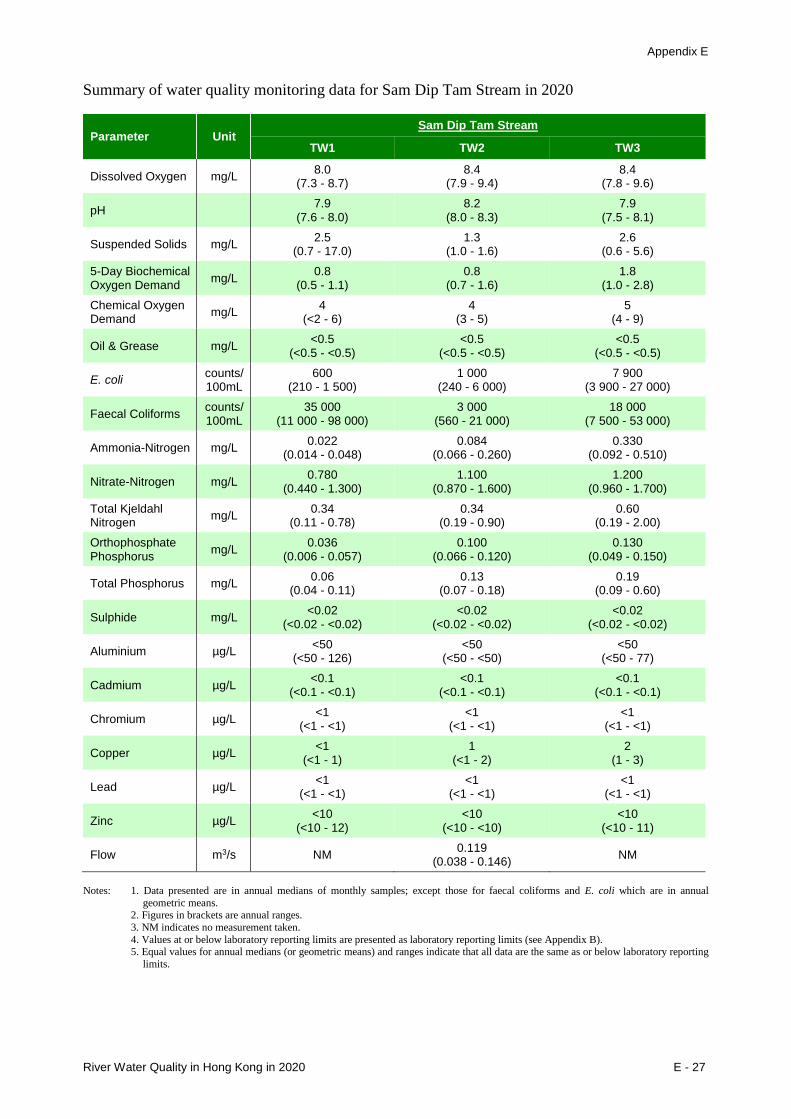
Appendix E
River Water Quality in Hong Kong in 2020 E - 27
Summary of water quality monitoring data for Sam Dip Tam Stream in 2020
Parameter Unit Sam Dip Tam Stream
TW1 TW2 TW3
Dissolved Oxygen mg/L 8.0 (7.3 - 8.7)
8.4 (7.9 - 9.4)
8.4 (7.8 - 9.6)
pH 7.9 (7.6 - 8.0)
8.2 (8.0 - 8.3)
7.9 (7.5 - 8.1)
Suspended Solids mg/L 2.5 (0.7 - 17.0)
1.3 (1.0 - 1.6)
2.6 (0.6 - 5.6)
5-Day Biochemical Oxygen Demand mg/L 0.8
(0.5 - 1.1) 0.8
(0.7 - 1.6) 1.8
(1.0 - 2.8) Chemical Oxygen Demand mg/L 4
(<2 - 6) 4
(3 - 5) 5
(4 - 9)
Oil & Grease mg/L <0.5 (<0.5 - <0.5)
<0.5 (<0.5 - <0.5)
<0.5 (<0.5 - <0.5)
E. coli counts/ 100mL
600 (210 - 1 500)
1 000 (240 - 6 000)
7 900 (3 900 - 27 000)
Faecal Coliforms counts/ 100mL
35 000 (11 000 - 98 000)
3 000 (560 - 21 000)
18 000 (7 500 - 53 000)
Ammonia-Nitrogen mg/L 0.022 (0.014 - 0.048)
0.084 (0.066 - 0.260)
0.330 (0.092 - 0.510)
Nitrate-Nitrogen mg/L 0.780 (0.440 - 1.300)
1.100 (0.870 - 1.600)
1.200 (0.960 - 1.700)
Total Kjeldahl Nitrogen mg/L 0.34
(0.11 - 0.78) 0.34
(0.19 - 0.90) 0.60
(0.19 - 2.00) Orthophosphate Phosphorus mg/L 0.036
(0.006 - 0.057) 0.100
(0.066 - 0.120) 0.130
(0.049 - 0.150)
Total Phosphorus mg/L 0.06 (0.04 - 0.11)
0.13 (0.07 - 0.18)
0.19 (0.09 - 0.60)
Sulphide mg/L <0.02 (<0.02 - <0.02)
<0.02 (<0.02 - <0.02)
<0.02 (<0.02 - <0.02)
Aluminium µg/L <50 (<50 - 126)
<50 (<50 - <50)
<50 (<50 - 77)
Cadmium µg/L <0.1 (<0.1 - <0.1)
<0.1 (<0.1 - <0.1)
<0.1 (<0.1 - <0.1)
Chromium µg/L <1 (<1 - <1)
<1 (<1 - <1)
<1 (<1 - <1)
Copper µg/L <1 (<1 - 1)
1 (<1 - 2)
2 (1 - 3)
Lead µg/L <1 (<1 - <1)
<1 (<1 - <1)
<1 (<1 - <1)
Zinc µg/L <10 (<10 - 12)
<10 (<10 - <10)
<10 (<10 - 11)
Flow m3/s NM 0.119 (0.038 - 0.146) NM
Notes: 1. Data presented are in annual medians of monthly samples; except those for faecal coliforms and E. coli which are in annual
geometric means. 2. Figures in brackets are annual ranges. 3. NM indicates no measurement taken. 4. Values at or below laboratory reporting limits are presented as laboratory reporting limits (see Appendix B). 5. Equal values for annual medians (or geometric means) and ranges indicate that all data are the same as or below laboratory reporting
limits.

Appendix E
River Water Quality in Hong Kong in 2020 E - 28
Summary of water quality monitoring data for Kai Tak River in 2020 (Part 1 of 2)
Parameter Unit Kai Tak River
KN1 KN2 KN3
Dissolved Oxygen mg/L 5.3 (4.0 - 5.8)
6.2 (5.7 - 6.9)
6.7 (6.0 - 7.4)
pH 7.4 (7.2 - 7.8)
7.5 (7.3 - 7.7)
7.5 (7.3 - 7.8)
Suspended Solids mg/L 2.9 (2.1 - 9.1)
4.0 (1.6 - 7.1)
4.1 (2.5 - 9.4)
5-Day Biochemical Oxygen Demand mg/L 2.8
(1.7 - 9.5) 3.3
(2.3 - 7.5) 4.9
(2.2 - 7.0) Chemical Oxygen Demand mg/L 20
(10 - 29) 16
(10 - 38) 26
(12 - 34)
Oil & Grease mg/L <0.5 (<0.5 - <0.5)
<0.5 (<0.5 - <0.5)
<0.5 (<0.5 - <0.5)
E. coli counts/ 100mL
25 000 (2 200 - 220 000)
5 800 (3 400 - 17 000)
6 100 (2 200 - 13 000)
Faecal Coliforms counts/ 100mL
45 000 (3 400 - 390 000)
12 000 (4 800 - 28 000)
13 000 (3 800 - 36 000)
Ammonia-Nitrogen mg/L 2.400 (0.880 - 5.200)
2.300 (0.710 - 6.400)
2.650 (0.680 - 5.300)
Nitrate-Nitrogen mg/L 2.300 (2.100 - 3.300)
2.900 (2.500 - 4.000)
3.000 (2.500 - 4.200)
Total Kjeldahl Nitrogen mg/L 2.90
(1.30 - 7.40) 3.50
(1.20 - 7.90) 3.35
(1.30 - 6.60) Orthophosphate Phosphorus mg/L 0.940
(0.530 - 2.200) 0.890
(0.670 - 2.600) 0.785
(0.670 - 2.000)
Total Phosphorus mg/L 1.10 (0.55 - 2.40)
1.10 (0.98 - 2.70)
1.05 (0.84 - 2.20)
Sulphide mg/L <0.02 (<0.02 - <0.02)
<0.02 (<0.02 - <0.02)
<0.02 (<0.02 - <0.02)
Aluminium µg/L <50 (<50 - <50)
<50 (<50 - <50)
<50 (<50 - <50)
Cadmium µg/L <0.1 (<0.1 - <0.1)
<0.1 (<0.1 - <0.1)
<0.1 (<0.1 - <0.1)
Chromium µg/L 2 (1 - 4)
1 (<1 - 4)
1 (<1 - 2)
Copper µg/L 3 (2 - 8)
3 (2 - 4)
3 (2 - 4)
Lead µg/L <1 (<1 - <1)
<1 (<1 - <1)
<1 (<1 - <1)
Zinc µg/L 13 (<10 - 15)
13 (11 - 18)
13 (<10 - 24)
Flow m3/s NM NM NM
Notes: 1. Data presented are in annual medians of monthly samples; except those for faecal coliforms and E. coli which are in annual
geometric means. 2. Figures in brackets are annual ranges. 3. NM indicates no measurement taken. 4. Values at or below laboratory reporting limits are presented as laboratory reporting limits (see Appendix B). 5. Equal values for annual medians (or geometric means) and ranges indicate that all data are the same as or below laboratory reporting
limits.

Appendix E
River Water Quality in Hong Kong in 2020 E - 29
Summary of water quality monitoring data for Kai Tak River in 2020 (Part 2 of 2)
Parameter Unit Kai Tak River
KN4 KN5 KN7
Dissolved Oxygen mg/L 6.8 (6.0 - 7.3)
7.2 (6.6 - 7.6)
7.2 (6.9 - 7.9)
pH 7.4 (7.2 - 7.8)
7.4 (7.2 - 7.6)
7.2 (7.1 - 7.6)
Suspended Solids mg/L 6.4 (3.3 - 11.0)
6.6 (3.4 - 11.0)
6.7 (4.1 - 11.0)
5-Day Biochemical Oxygen Demand mg/L 5.7
(2.6 - 7.2) 7.0
(2.4 - 9.3) 9.1
(2.7 - 11.0) Chemical Oxygen Demand mg/L 23
(16 - 40) 22
(12 - 32) 27
(10 - 32)
Oil & Grease mg/L <0.5 (<0.5 - <0.5)
<0.5 (<0.5 - <0.5)
<0.5 (<0.5 - <0.5)
E. coli counts/ 100mL
4 600 (2 800 - 12 000)
3 200 (1 400 - 7 900)
3 300 (1 100 - 12 000)
Faecal Coliforms counts/ 100mL
12 000 (4 900 - 41 000)
9 900 (3 200 - 23 000)
6 400 (2 400 - 56 000)
Ammonia-Nitrogen mg/L 2.150 (0.490 - 3.800)
2.250 (0.400 - 3.200)
1.400 (0.360 - 3.900)
Nitrate-Nitrogen mg/L 3.400 (2.500 - 4.000)
3.600 (2.800 - 4.000)
3.700 (2.600 - 4.500)
Total Kjeldahl Nitrogen mg/L 2.95
(1.50 - 4.90) 2.85
(0.98 - 5.60) 4.20
(0.96 - 5.30) Orthophosphate Phosphorus mg/L 0.680
(0.550 - 1.500) 0.660
(0.470 - 1.400) 0.700
(0.490 - 1.300)
Total Phosphorus mg/L 1.10 (0.63 - 1.60)
0.95 (0.58 - 1.50)
1.30 (0.55 - 1.60)
Sulphide mg/L <0.02 (<0.02 - 0.02)
<0.02 (<0.02 - <0.02)
<0.02 (<0.02 - <0.02)
Aluminium µg/L <50 (<50 - <50)
<50 (<50 - <50)
<50 (<50 - 78)
Cadmium µg/L <0.1 (<0.1 - <0.1)
<0.1 (<0.1 - <0.1)
<0.1 (<0.1 - <0.1)
Chromium µg/L 1 (<1 - 2)
1 (<1 - 2)
1 (<1 - 2)
Copper µg/L 3 (2 - 4)
2 (2 - 4)
3 (2 - 4)
Lead µg/L <1 (<1 - <1)
<1 (<1 - <1)
<1 (<1 - <1)
Zinc µg/L 14 (12 - 19)
15 (10 - 16)
14 (11 - 21)
Flow m3/s NM 9.703 (5.875 - 25.228)
2.760 (1.166 - 4.572)
Notes: 1. Data presented are in annual medians of monthly samples; except those for faecal coliforms and E. coli which are in annual
geometric means. 2. Figures in brackets are annual ranges. 3. NM indicates no measurement taken. 4. Values at or below laboratory reporting limits are presented as laboratory reporting limits (see Appendix B). 5. Equal values for annual medians (or geometric means) and ranges indicate that all data are the same as or below laboratory reporting
limits.
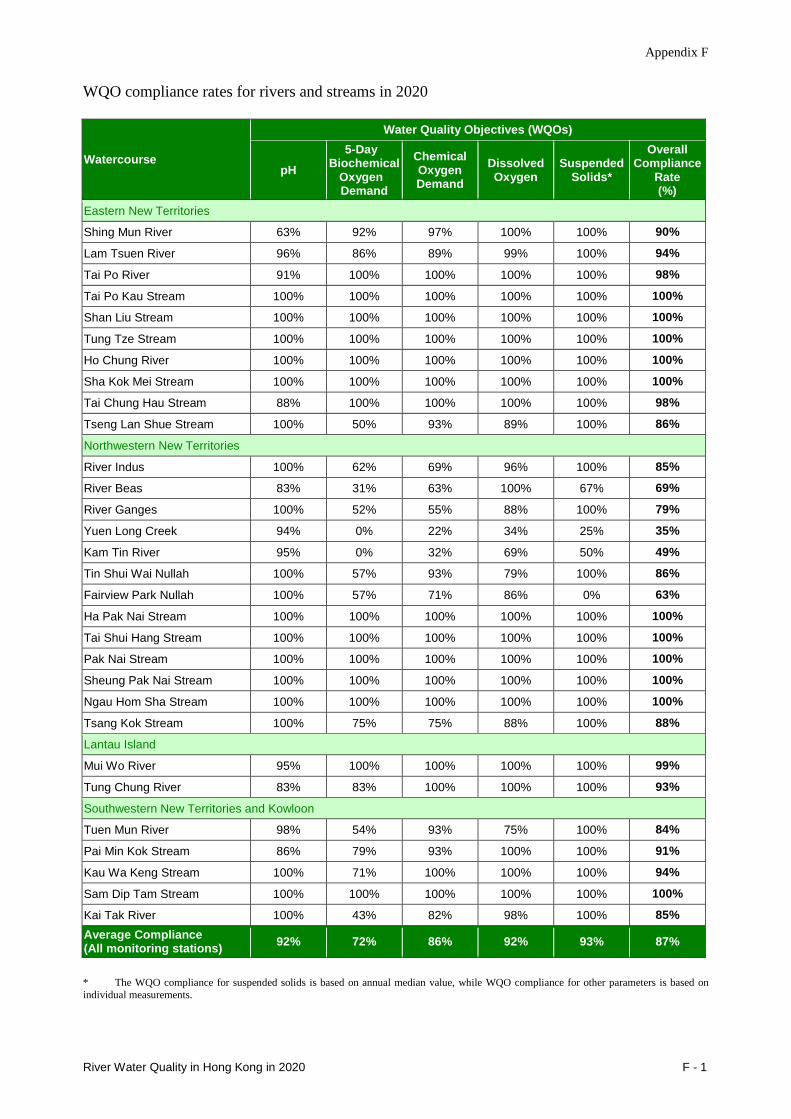
Appendix F
River Water Quality in Hong Kong in 2020 F - 1
WQO compliance rates for rivers and streams in 2020
Watercourse
Water Quality Objectives (WQOs)
pH 5-Day
Biochemical Oxygen Demand
Chemical Oxygen Demand
Dissolved Oxygen
Suspended Solids*
Overall Compliance
Rate (%)
Eastern New Territories Shing Mun River 63% 92% 97% 100% 100% 90%
Lam Tsuen River 96% 86% 89% 99% 100% 94%
Tai Po River 91% 100% 100% 100% 100% 98%
Tai Po Kau Stream 100% 100% 100% 100% 100% 100%
Shan Liu Stream 100% 100% 100% 100% 100% 100%
Tung Tze Stream 100% 100% 100% 100% 100% 100%
Ho Chung River 100% 100% 100% 100% 100% 100%
Sha Kok Mei Stream 100% 100% 100% 100% 100% 100%
Tai Chung Hau Stream 88% 100% 100% 100% 100% 98%
Tseng Lan Shue Stream 100% 50% 93% 89% 100% 86%
Northwestern New Territories River Indus 100% 62% 69% 96% 100% 85%
River Beas 83% 31% 63% 100% 67% 69%
River Ganges 100% 52% 55% 88% 100% 79%
Yuen Long Creek 94% 0% 22% 34% 25% 35%
Kam Tin River 95% 0% 32% 69% 50% 49%
Tin Shui Wai Nullah 100% 57% 93% 79% 100% 86%
Fairview Park Nullah 100% 57% 71% 86% 0% 63%
Ha Pak Nai Stream 100% 100% 100% 100% 100% 100%
Tai Shui Hang Stream 100% 100% 100% 100% 100% 100%
Pak Nai Stream 100% 100% 100% 100% 100% 100%
Sheung Pak Nai Stream 100% 100% 100% 100% 100% 100%
Ngau Hom Sha Stream 100% 100% 100% 100% 100% 100%
Tsang Kok Stream 100% 75% 75% 88% 100% 88%
Lantau Island Mui Wo River 95% 100% 100% 100% 100% 99%
Tung Chung River 83% 83% 100% 100% 100% 93%
Southwestern New Territories and Kowloon Tuen Mun River 98% 54% 93% 75% 100% 84%
Pai Min Kok Stream 86% 79% 93% 100% 100% 91%
Kau Wa Keng Stream 100% 71% 100% 100% 100% 94%
Sam Dip Tam Stream 100% 100% 100% 100% 100% 100%
Kai Tak River 100% 43% 82% 98% 100% 85% Average Compliance (All monitoring stations) 92% 72% 86% 92% 93% 87%
* The WQO compliance for suspended solids is based on annual median value, while WQO compliance for other parameters is based on individual measurements.
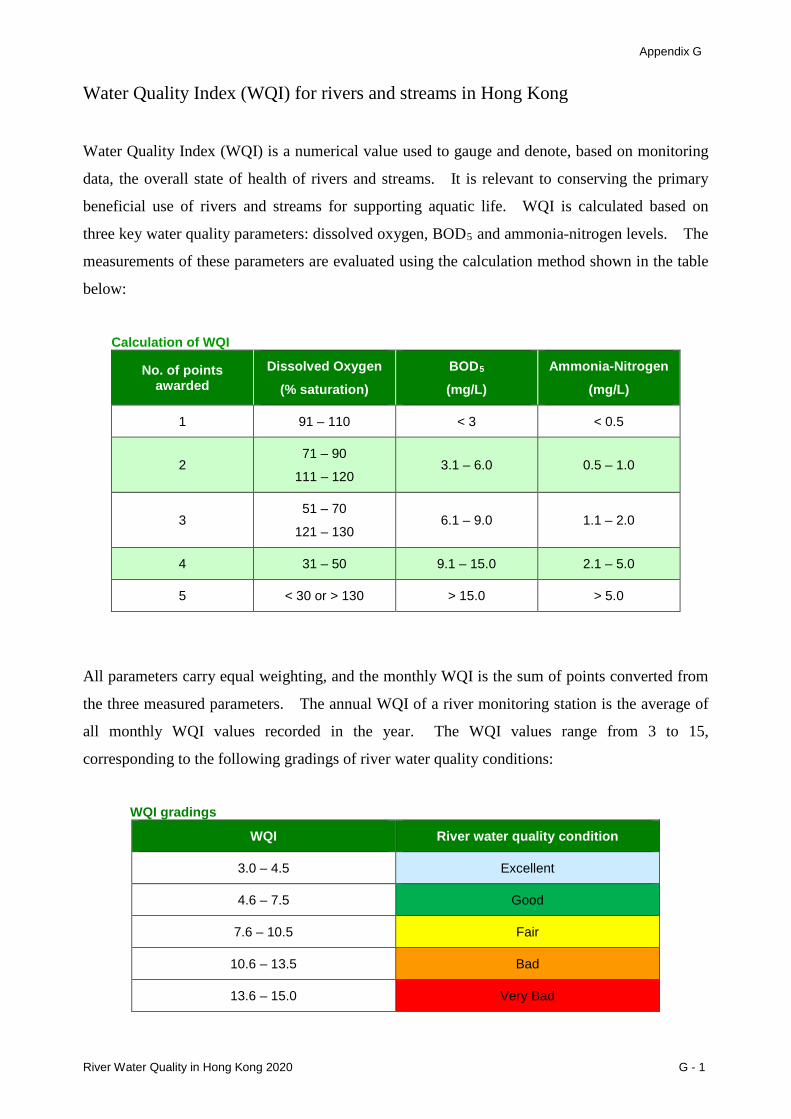
Appendix G
River Water Quality in Hong Kong 2020 G - 1
Water Quality Index (WQI) for rivers and streams in Hong Kong
Water Quality Index (WQI) is a numerical value used to gauge and denote, based on monitoring
data, the overall state of health of rivers and streams. It is relevant to conserving the primary
beneficial use of rivers and streams for supporting aquatic life. WQI is calculated based on
three key water quality parameters: dissolved oxygen, BOD5 and ammonia-nitrogen levels. The
measurements of these parameters are evaluated using the calculation method shown in the table
below:
Calculation of WQI
No. of points awarded
Dissolved Oxygen (% saturation)
BOD5 (mg/L)
Ammonia-Nitrogen (mg/L)
1 91 – 110 < 3 < 0.5
2 71 – 90
111 – 120 3.1 – 6.0 0.5 – 1.0
3 51 – 70
121 – 130 6.1 – 9.0 1.1 – 2.0
4 31 – 50 9.1 – 15.0 2.1 – 5.0
5 < 30 or > 130 > 15.0 > 5.0
All parameters carry equal weighting, and the monthly WQI is the sum of points converted from
the three measured parameters. The annual WQI of a river monitoring station is the average of
all monthly WQI values recorded in the year. The WQI values range from 3 to 15,
corresponding to the following gradings of river water quality conditions:
WQI gradings
WQI River water quality condition
3.0 – 4.5 Excellent
4.6 – 7.5 Good
7.6 – 10.5 Fair
10.6 – 13.5 Bad
13.6 – 15.0 Very Bad