Embed Size (px)
Citation preview
RMBS Performance Watch Australia Part 1 – Market Overview
At December 31, 2017
spglobal.com/ratingsdirect 1-2
RatingsDirect®
PRIMARY ANALYST
Erin Kitson
Melbourne
+61-3-9631-2166
SECONDARY ANALYST
Leslie Wong Melbourne
+61-3-9631-2170
State Of The Nation:
Australian Mortgage Arrears
Mortgage arrears underlying Australian residential mortgage-backed securities (RMBS) appear to be heading lower nationwide, though performances diverge between regional and capital cities as well as resource and nonresource states.
Our fourth quarter edition of "RMBS Performance Watch: Australia" includes a detailed section on mortgage arrears performance nationwide and our insights on what could be behind these trends.
The Macroeconomic Story: Things Are Mostly Improving
− Low unemployment in 2017 has been good for mortgage arrears, by helping to keep defaults low and stem the flow of new loans heading into arrears. Unemployment has the highest correlation with changes in average credit quality (i.e., rating upgrades versus downgrades) for Australian structured finance securities.
− Property price growth is moderating. High loan-to-value (LTV) ratio loans are more exposed to this risk. Loans with an LTV ratio greater than 80% make up around 16% of RMBS portfolios. This is less of a risk for RMBS ratings because most loans underlying RMBS portfolios have modest LTV ratios of around 60%.
Overview
− Twelve of the 20 worst-performing areas for mortgage arrears are in Queensland and Western Australia.
− Most of the 20 areas with the lowest arrears are in eastern capital cities.
− Mortgage arrears fell year on year in December 2017 in 65% of locations.
− Property prices and arrears performance are closely correlated.
− A total of 80% of the 20 worst-performing areas are in regional (nonmetropolitan) Australia.
State Of The Nation: Australian Mortgage Arrears
spglobal.com/ratingsdirect 1-3
− Wage growth is low and slow to increase. Borrowers’ sensitivity to rate rises is greater than at the time of the previous arrears peak, in 2011, because household indebtedness has continued to increase. A large and swift increase in interest rates, as occurred in January 2012, would cause arrears to overshoot their previous peaks, in our opinion.
− Interest rates are likely to go up, not down, in 2018 as interest rate rises are likely to go up now down. We believe a gradual rise in interest rates will put some pressure on arrears, given most underlying mortgages are variable rate. We believe this will not translate into higher defaults if employment conditions remain stable.
− Some 70% of the borrowers in RMBS portfolios are owner-occupiers. For this reason, we expect most borrowers will adjust their spending to stay on top of their mortgage repayments in 2018. This could dampen consumption growth, which has broader economic implications.
Movers And Shakers: Arrears Performance Nationwide
− The outback regions of Western Australia and Queensland have the nation's highest arrears as of Dec. 31, 2017, at 4.73% and 3.39%, respectively.
− The northern beaches and eastern suburbs of Sydney have the lowest arrears as of Dec. 31, 2017, at 0.30% and 0.14%, respectively.
− Toowoomba, Queensland, recorded the nation's largest improvement, with loans more than 30 days in arrears falling to 3.27% in December 2017 from 5.82% in December 2016.
− The Riverina area of New South Wales experienced the largest increase in arrears, with loans more than 30 days in arrears increasing to 1.78% in December 2017 from 0.99% in December 2016.
− Mortgage arrears were down year on year as of December 2017 in 65% of locations nationwide.
− Arrears in nonmetropolitan areas are 50% higher than in metropolitan areas. The gap had been widening, but in recent months it has started to narrow as the spoils of jobs growth appear to be trickling outside of the capital cities. Initiatives such as the National Disability Insurance Scheme and infrastructure projects could be supporting these trends.
− The arrears profile in Queensland and Western Australia differs to the rest of the country. Some 59% of total arrears in Queensland are more than 90 days past due. It is 64% in Western Australia. As a comparison, the number is 51% in both New South Wales and Victoria as of Dec. 31, 2017.
Property Prices And Arrears: There’s A Connection
− Areas that have seen greater property price growth typically have lower levels of arrears. For example, 13 of the 20 areas with the lowest arrears are in Sydney or Melbourne, where there has been significant property price appreciation in the past five years.
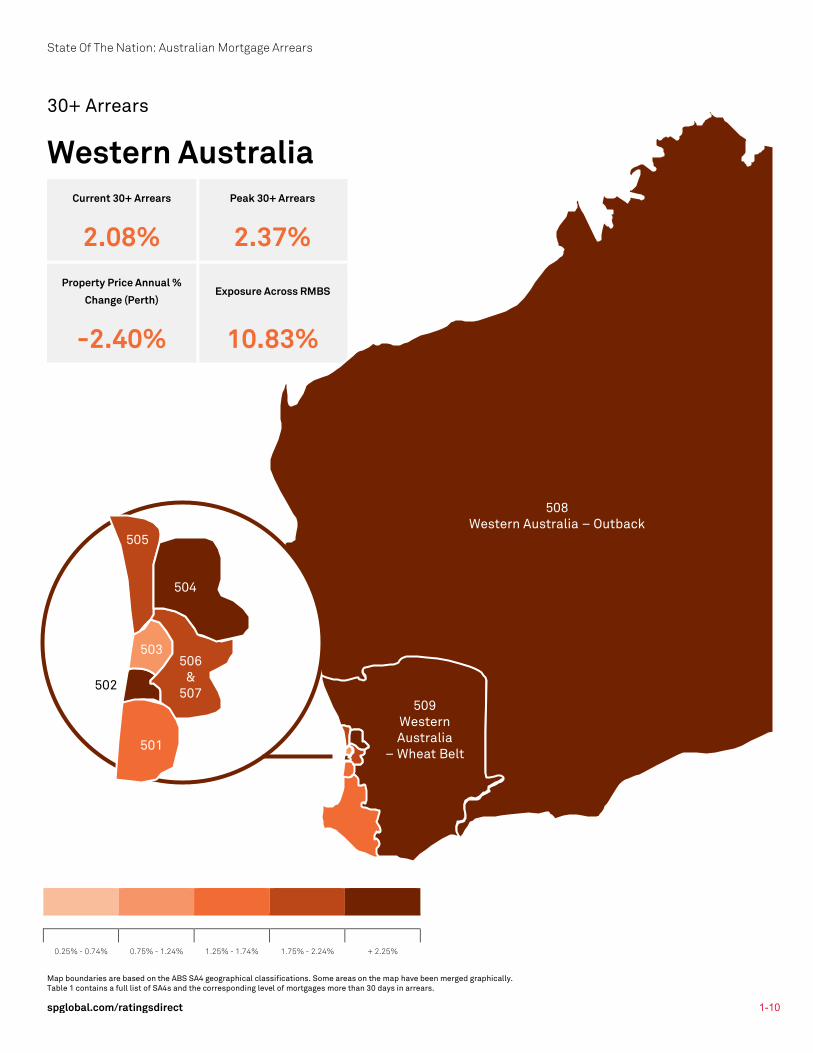
− The opposite is also true. Property prices have grown just 2% in Perth during the past five years. Perth is in the only capital city in the 20 worst-performing areas as of Dec. 31, 2017.
− Property prices affect LTV ratios, which influence refinancing prospects. Loan-to-value ratios historically have proven to be a key predictor of default on residential mortgages. Low to moderate LTV ratios therefore enhance borrowers' finance prospects--a common way for borrowers to self-manage their way out of mortgage stress, particularly in a competitive lending environment.
State Of The Nation: Australian Mortgage Arrears
spglobal.com/ratingsdirect 1-4
What Are Our Expectations For 2018?
− Low unemployment should keep defaults low. Loss of income is a key cause of mortgage default.
− The construction and healthcare sectors experienced some of the largest year-on-year growth in new jobs in 2017. This is credit positive, given these sectors are two of the nation's largest employers.
− The gap between metropolitan and nonmetropolitan arrears is narrowing as jobs growth spreads beyond capital cities.
− RMBS portfolios' high seasoning--i.e., in excess of 60 months--shows many borrowers have a demonstrated repayment history. Most of the losses for prime borrowers occur by month 60, and many loans are at or approaching this point.
− A total of 61% of loans in RMBS transactions are secured by properties in Sydney and Melbourne. As many of these loans are well seaonsed (older), they have benefited from property price appreciation of 73% in Sydney and 53% in Melbourne during the five-year period. This will have enhanced their LTV ratio profiles, given the property price valuation in many loan files are based on the original valuation at loan origination.
What Are The Risks?
− Rising interest rates will put pressure on arrears, given most of the loans are variable rate and household debt is high.
− A gradual rise in interest rates is important because borrowers require time to adjust their spending behavior. For example, interest rates increased 2.05 percentage points to 7.80% between May 2009 and November 2010. Arrears quickly shot up more than 50%, peaking at 1.66% in April 2011. With household indebtedness 16% higher now, a rate increase of this magnitude would likely cause arrears to overtake this peak.
− Softening property prices would make it harder for some borrowers to refinance their loans, particularly those with higher LTV ratios, which make up around 16% of RMBS portfolios.
− A transition from interest-only to amortizing loans could be tougher in a softening property market. Offsetting this would be the price differential benefit of interest-only loan rates in relation to amortizing rates in the current lending environment. Currently interest only loans make up around 25 % of the RMBS market. Around 50% of interest-only loans underlying Australian RMBS transactions will reach their interest-only maturity end date by 2019.
Data And Analysis
The mortgage arrears analysis that follows is based on loan-level data as of Dec. 31, 2017, underlying prime and nonconforming Australian RMBS transactions rated by S&P Global Ratings.
Annual property price growth statistics used in this analysis are from the Australian Bureau of Statistics as at September 2017.
The population centers used in this analysis are based on the Australian Bureau of Statistics' (ABS) "Australian Geography Standard." The geographical areas used in this analysis are classified as Statistical Area Level 4s (SA4s) in the "Australian Geography Standard."
As defined by the ABS, SA4s are designed to reflect one or more whole labor market for the release of Labour Force Survey data. This is because workforce data have two geographic components: the labor supply (where people live) and demand (where people work). SA4s are required to have populations of more than 100,000 people. This enables accurate workforce survey data to be generated on each SA4.
State Of The Nation: Australian Mortgage Arrears
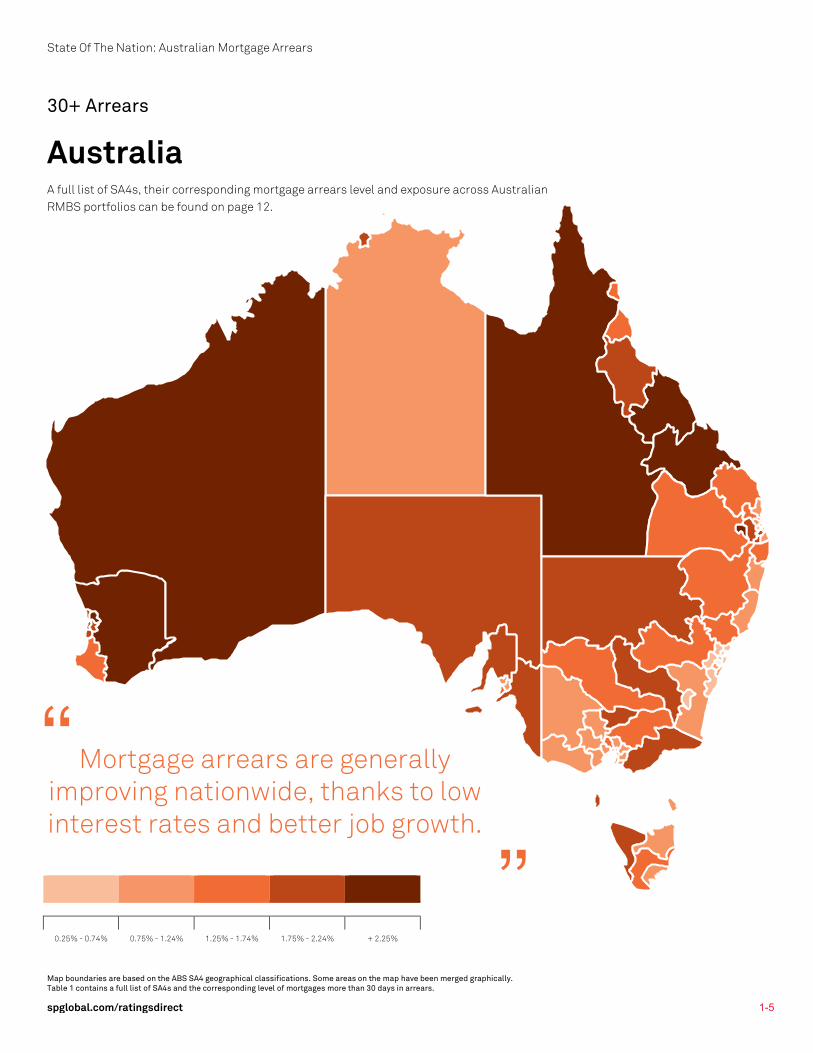
Map boundaries are based on the ABS SA4 geographical classifications. Some areas on the map have been merged graphically. Table 1 contains a full list of SA4s and the corresponding level of mortgages more than 30 days in arrears.
spglobal.com/ratingsdirect 1-5
30+ Arrears
Australia A full list of SA4s, their corresponding mortgage arrears level and exposure across Australian RMBS portfolios can be found on page 12.
0.25% - 0.74% 0.75% - 1.24% 1.25% - 1.74% 1.75% - 2.24% + 2.25%
Mortgage arrears are generally improving nationwide, thanks to low interest rates and better job growth.
“
”
State Of The Nation: Australian Mortgage Arrears
Map boundaries are based on the ABS SA4 geographical classifications. Some areas on the map have been merged graphically. Table 1 contains a full list of SA4s and the corresponding level of mortgages more than 30 days in arrears.
spglobal.com/ratingsdirect 1-6
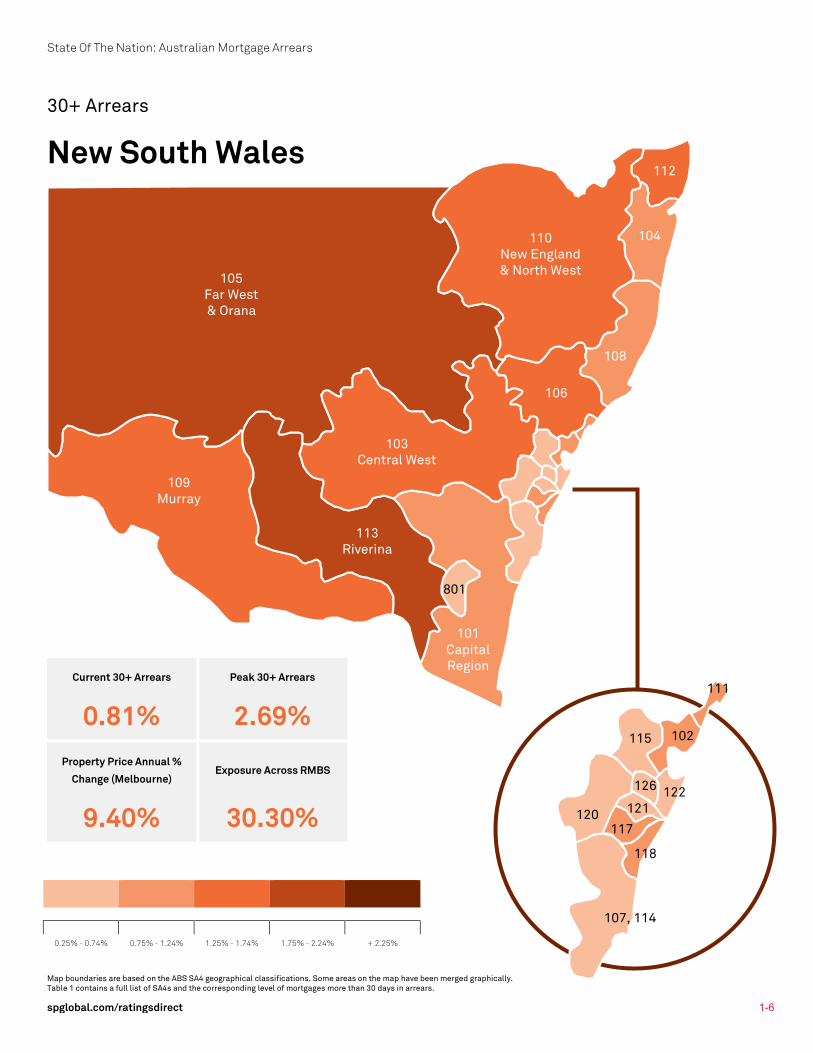
30+ Arrears
New South Wales
Current 30+ Arrears Peak 30+ Arrears
0.81% 2.69% Property Price Annual %
Change (Melbourne) Exposure Across RMBS
9.40% 30.30%
0.25% - 0.74% 0.75% - 1.24% 1.25% - 1.74% 1.75% - 2.24% + 2.25%
105 Far West & Orana
109 Murray
110 New England & North West
113 Riverina
101 Capital Region
103 Central West
801
106
108
104
112
107, 114
120
115
118
121 117
126 122
102
111
State Of The Nation: Australian Mortgage Arrears
Map boundaries are based on the ABS SA4 geographical classifications. Some areas on the map have been merged graphically. Table 1 contains a full list of SA4s and the corresponding level of mortgages more than 30 days in arrears.
spglobal.com/ratingsdirect 1-7
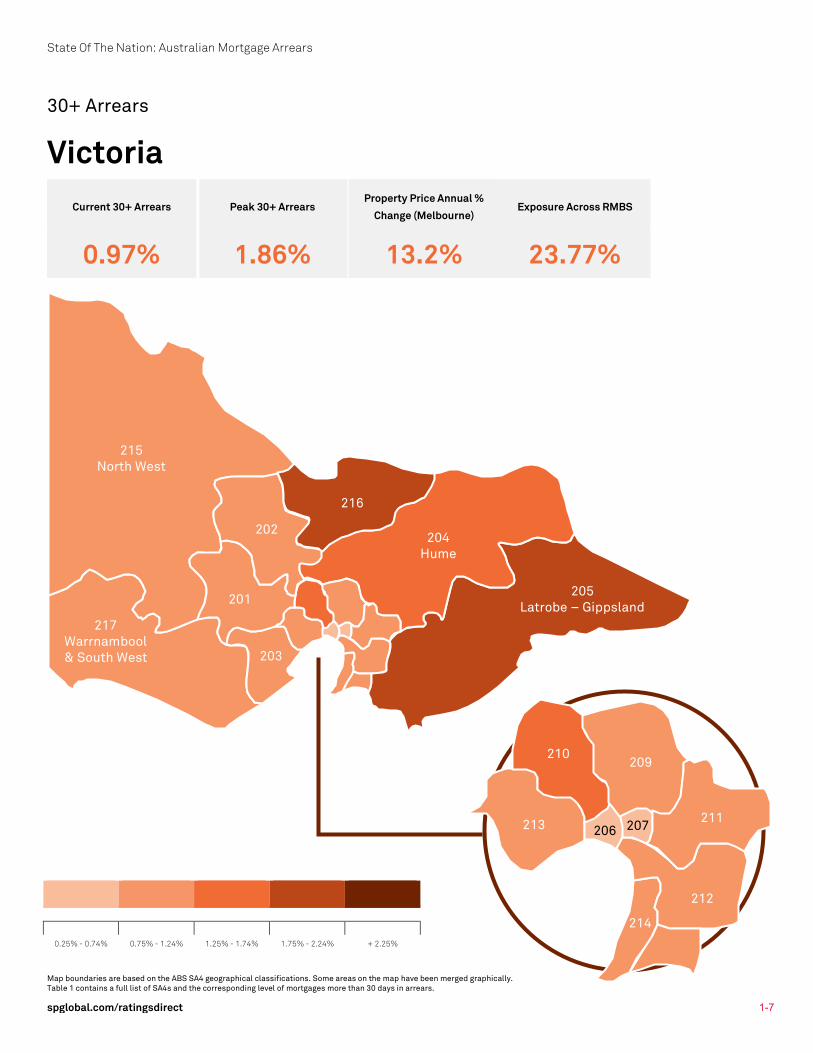
30+ Arrears
Victoria Current 30+ Arrears Peak 30+ Arrears
Property Price Annual %
Change (Melbourne) Exposure Across RMBS
0.97% 1.86% 13.2% 23.77%
0.25% - 0.74% 0.75% - 1.24% 1.25% - 1.74% 1.75% - 2.24% + 2.25%
215 North West
217 Warrnambool & South West
205 Latrobe – Gippsland
204 Hume
201
202
216
203
213
210 209
211
212
206
214
207
State Of The Nation: Australian Mortgage Arrears
Map boundaries are based on the ABS SA4 geographical classifications. Some areas on the map have been merged graphically. Table 1 contains a full list of SA4s and the corresponding level of mortgages more than 30 days in arrears.
spglobal.com/ratingsdirect 1-8
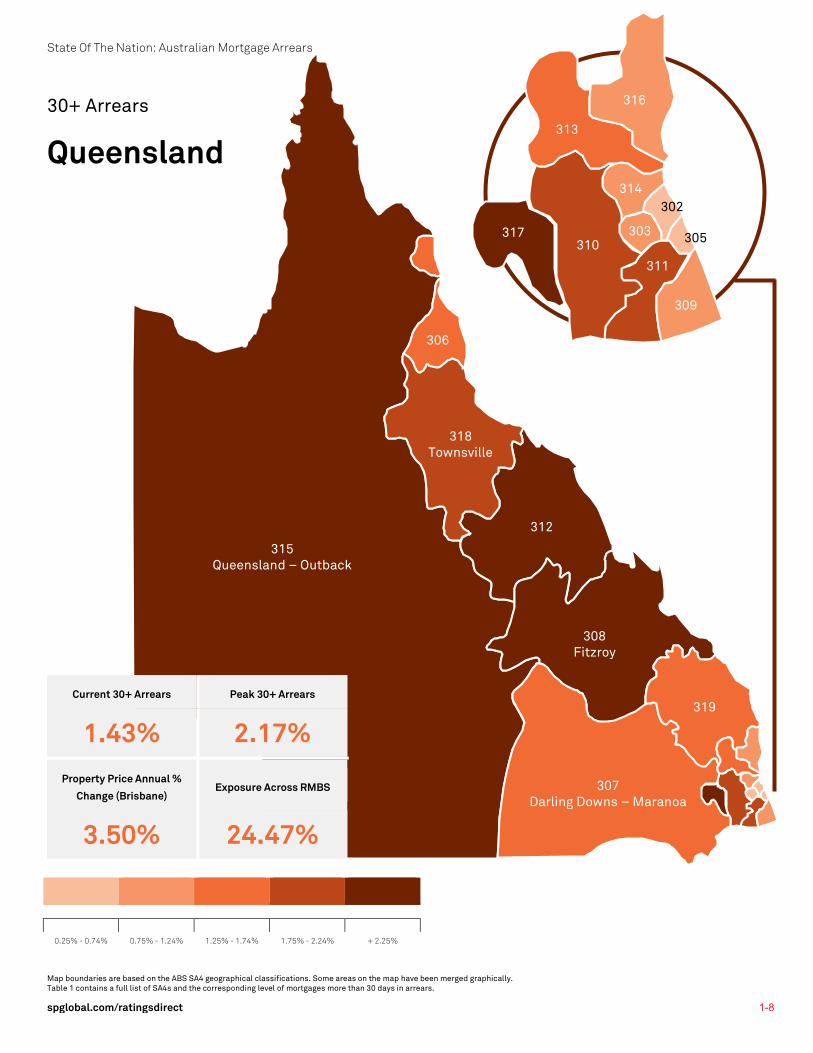
315 Queensland – Outback
307 Darling Downs – Maranoa
319
308 Fitzroy
312
318 Townsville
306
30+ Arrears
Queensland
Current 30+ Arrears Peak 30+ Arrears
1.43% 2.17% Property Price Annual %
Change (Brisbane) Exposure Across RMBS
3.50% 24.47%
0.25% - 0.74% 0.75% - 1.24% 1.25% - 1.74% 1.75% - 2.24% + 2.25%
317
313
310
316
309
311
314
303 305
302
State Of The Nation: Australian Mortgage Arrears
Map boundaries are based on the ABS SA4 geographical classifications. Some areas on the map have been merged graphically. Table 1 contains a full list of SA4s and the corresponding level of mortgages more than 30 days in arrears.
spglobal.com/ratingsdirect 1-9
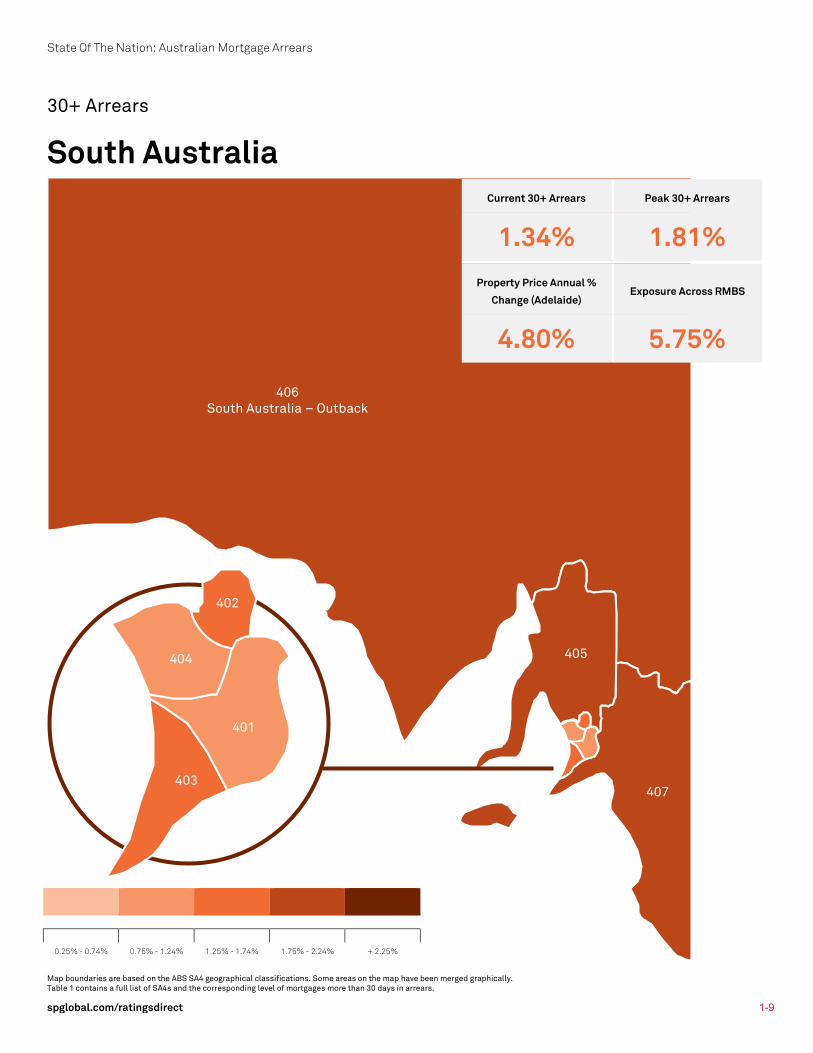
406 South Australia – Outback
405
407 403
401
404
402
30+ Arrears
South Australia
Current 30+ Arrears Peak 30+ Arrears
1.34% 1.81% Property Price Annual %
Change (Adelaide) Exposure Across RMBS
4.80% 5.75%
0.25% - 0.74% 0.75% - 1.24% 1.25% - 1.74% 1.75% - 2.24% + 2.25%
State Of The Nation: Australian Mortgage Arrears
Map boundaries are based on the ABS SA4 geographical classifications. Some areas on the map have been merged graphically. Table 1 contains a full list of SA4s and the corresponding level of mortgages more than 30 days in arrears.
spglobal.com/ratingsdirect 1-10
30+ Arrears
Western Australia Current 30+ Arrears Peak 30+ Arrears
2.08% 2.37% Property Price Annual %
Change (Perth) Exposure Across RMBS
-2.40% 10.83%
0.25% - 0.74% 0.75% - 1.24% 1.25% - 1.74% 1.75% - 2.24% + 2.25%
508 Western Australia – Outback
509 Western Australia
– Wheat Belt
505
504
506 &
507
501
503
502
State Of The Nation: Australian Mortgage Arrears
Map boundaries are based on the ABS SA4 geographical classifications. Some areas on the map have been merged graphically. Table 1 contains a full list of SA4s and the corresponding level of mortgages more than 30 days in arrears.
spglobal.com/ratingsdirect 1-11
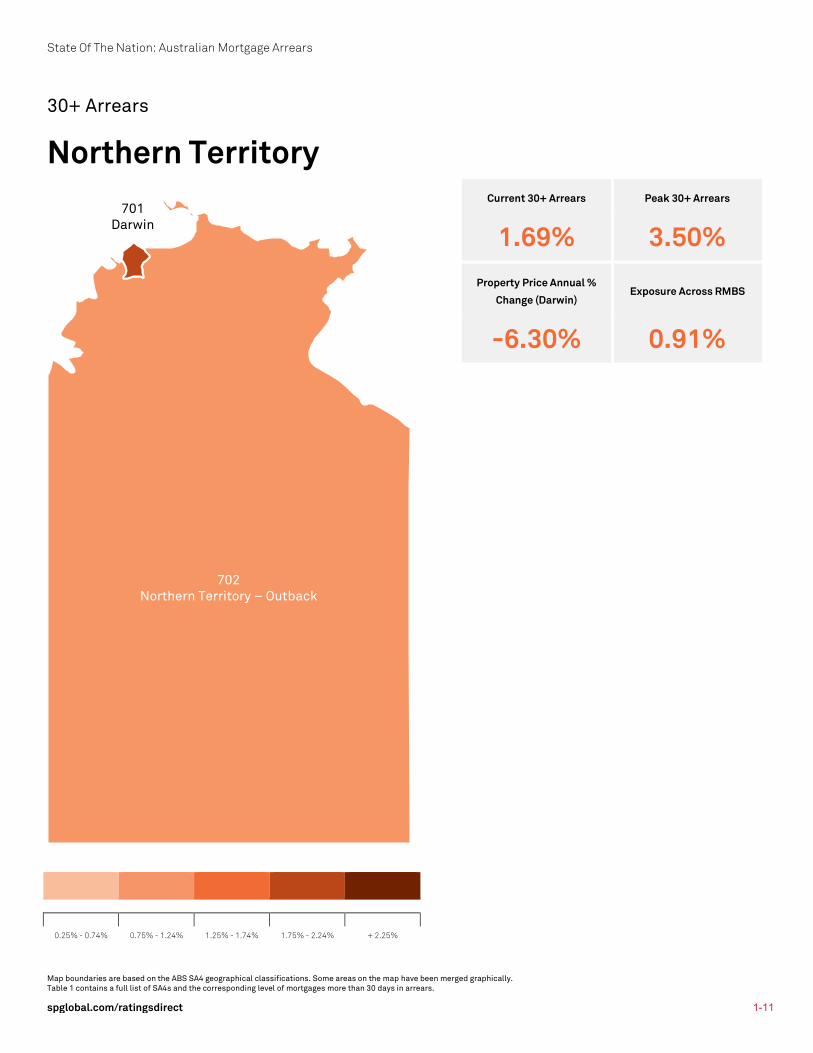
30+ Arrears
Northern Territory
Current 30+ Arrears Peak 30+ Arrears
1.69% 3.50% Property Price Annual %
Change (Darwin) Exposure Across RMBS
-6.30% 0.91%
0.25% - 0.74% 0.75% - 1.24% 1.25% - 1.74% 1.75% - 2.24% + 2.25%
702 Northern Territory – Outback
701 Darwin
State Of The Nation: Australian Mortgage Arrears
Map boundaries are based on the ABS SA4 geographical classifications. Some areas on the map have been merged graphically. Table 1 contains a full list of SA4s and the corresponding level of mortgages more than 30 days in arrears.
spglobal.com/ratingsdirect
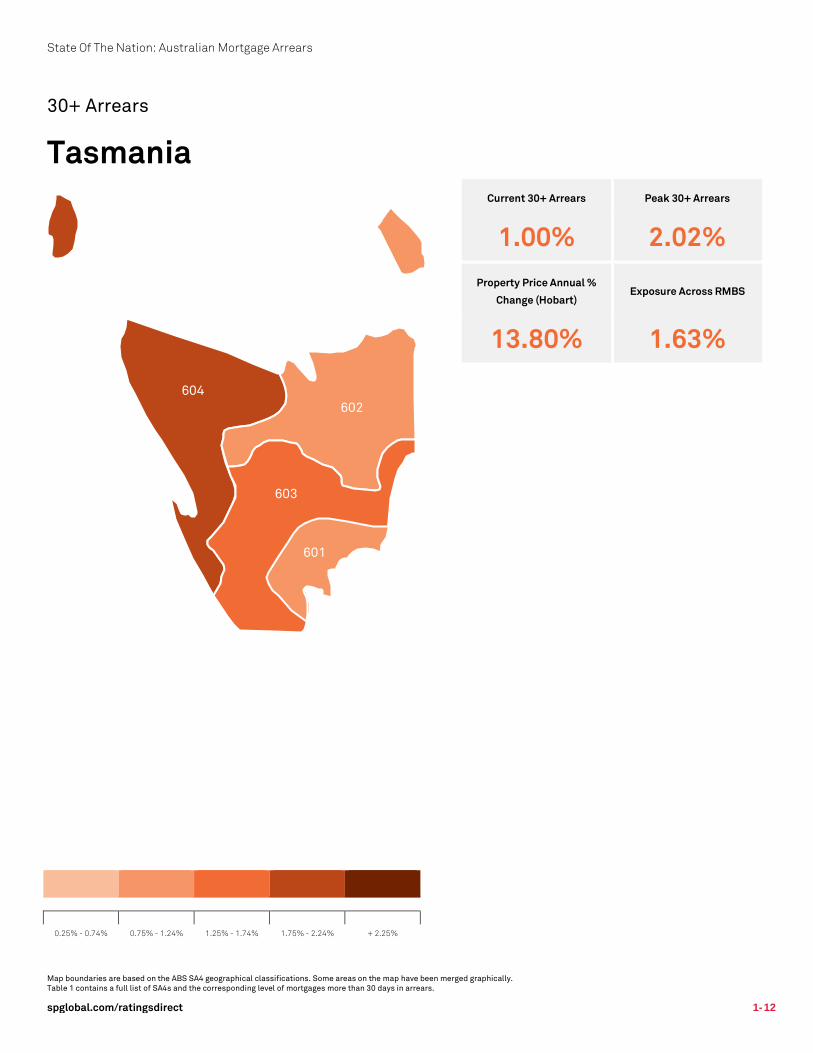
30+ Arrears
Tasmania
Current 30+ Arrears Peak 30+ Arrears
1.00% 2.02% Property Price Annual %
Change (Hobart) Exposure Across RMBS
13.80% 1.63%
0.25% - 0.74% 0.75% - 1.24% 1.25% - 1.74% 1.75% - 2.24% + 2.25%
604 602
603
601
State Of The Nation: Australian Mortgage Arrears
spglobal.com/ratingsdirect 1-13
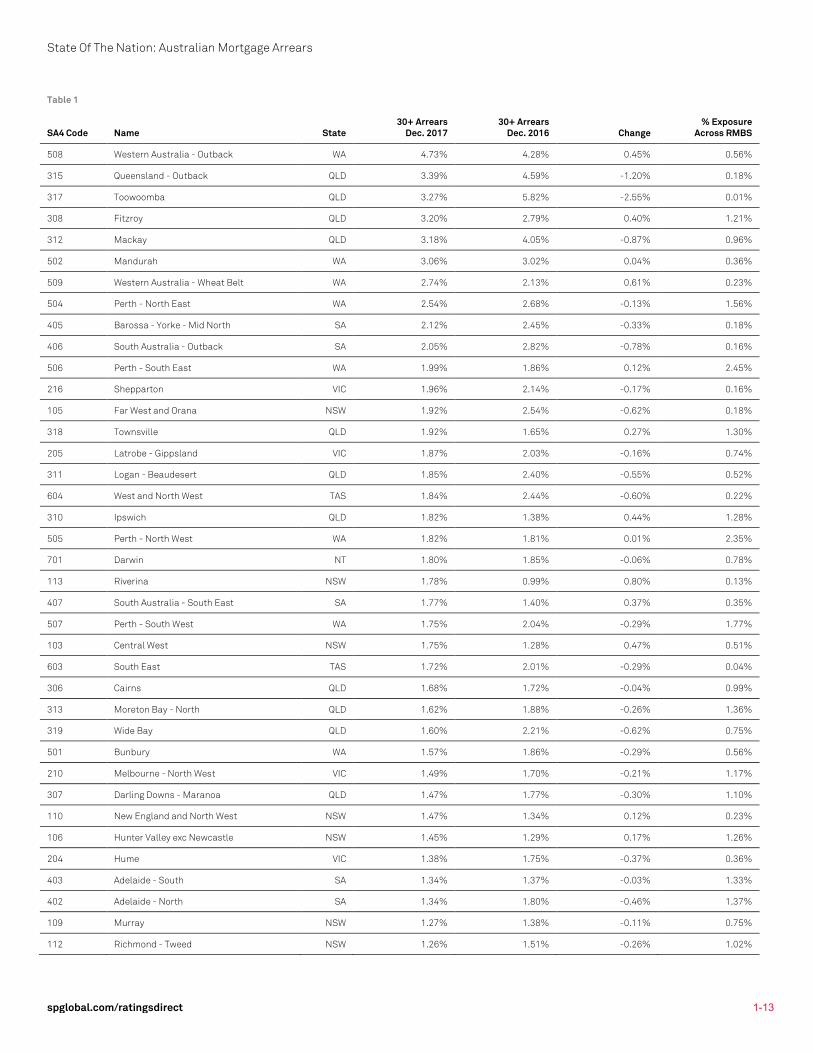
Table 1
SA4 Code Name State 30+ Arrears
Dec. 2017 30+ Arrears
Dec. 2016 Change % Exposure
Across RMBS
508 Western Australia - Outback WA 4.73% 4.28% 0.45% 0.56%
315 Queensland - Outback QLD 3.39% 4.59% -1.20% 0.18%
317 Toowoomba QLD 3.27% 5.82% -2.55% 0.01%
308 Fitzroy QLD 3.20% 2.79% 0.40% 1.21%
312 Mackay QLD 3.18% 4.05% -0.87% 0.96%
502 Mandurah WA 3.06% 3.02% 0.04% 0.36%
509 Western Australia - Wheat Belt WA 2.74% 2.13% 0.61% 0.23%
504 Perth - North East WA 2.54% 2.68% -0.13% 1.56%
405 Barossa - Yorke - Mid North SA 2.12% 2.45% -0.33% 0.18%
406 South Australia - Outback SA 2.05% 2.82% -0.78% 0.16%
506 Perth - South East WA 1.99% 1.86% 0.12% 2.45%
216 Shepparton VIC 1.96% 2.14% -0.17% 0.16%
105 Far West and Orana NSW 1.92% 2.54% -0.62% 0.18%
318 Townsville QLD 1.92% 1.65% 0.27% 1.30%
205 Latrobe - Gippsland VIC 1.87% 2.03% -0.16% 0.74%
311 Logan - Beaudesert QLD 1.85% 2.40% -0.55% 0.52%
604 West and North West TAS 1.84% 2.44% -0.60% 0.22%
310 Ipswich QLD 1.82% 1.38% 0.44% 1.28%
505 Perth - North West WA 1.82% 1.81% 0.01% 2.35%
701 Darwin NT 1.80% 1.85% -0.06% 0.78%
113 Riverina NSW 1.78% 0.99% 0.80% 0.13%
407 South Australia - South East SA 1.77% 1.40% 0.37% 0.35%
507 Perth - South West WA 1.75% 2.04% -0.29% 1.77%
103 Central West NSW 1.75% 1.28% 0.47% 0.51%
603 South East TAS 1.72% 2.01% -0.29% 0.04%
306 Cairns QLD 1.68% 1.72% -0.04% 0.99%
313 Moreton Bay - North QLD 1.62% 1.88% -0.26% 1.36%
319 Wide Bay QLD 1.60% 2.21% -0.62% 0.75%
501 Bunbury WA 1.57% 1.86% -0.29% 0.56%
210 Melbourne - North West VIC 1.49% 1.70% -0.21% 1.17%
307 Darling Downs - Maranoa QLD 1.47% 1.77% -0.30% 1.10%
110 New England and North West NSW 1.47% 1.34% 0.12% 0.23%
106 Hunter Valley exc Newcastle NSW 1.45% 1.29% 0.17% 1.26%
204 Hume VIC 1.38% 1.75% -0.37% 0.36%
403 Adelaide - South SA 1.34% 1.37% -0.03% 1.33%
402 Adelaide - North SA 1.34% 1.80% -0.46% 1.37%
109 Murray NSW 1.27% 1.38% -0.11% 0.75%
112 Richmond - Tweed NSW 1.26% 1.51% -0.26% 1.02%
State Of The Nation: Australian Mortgage Arrears
spglobal.com/ratingsdirect 1-14
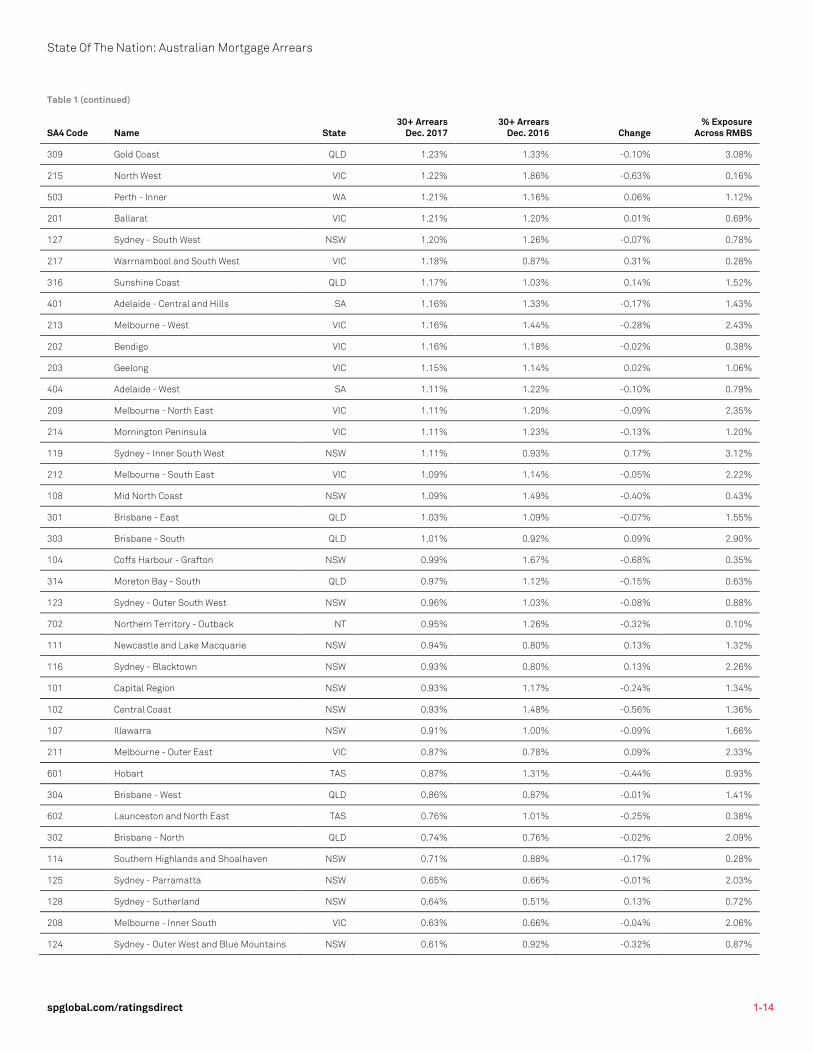
Table 1 (continued)
SA4 Code Name State 30+ Arrears
Dec. 2017 30+ Arrears
Dec. 2016 Change % Exposure
Across RMBS
309 Gold Coast QLD 1.23% 1.33% -0.10% 3.08%
215 North West VIC 1.22% 1.86% -0.63% 0.16%
503 Perth - Inner WA 1.21% 1.16% 0.06% 1.12%
201 Ballarat VIC 1.21% 1.20% 0.01% 0.69%
127 Sydney - South West NSW 1.20% 1.26% -0.07% 0.78%
217 Warrnambool and South West VIC 1.18% 0.87% 0.31% 0.28%
316 Sunshine Coast QLD 1.17% 1.03% 0.14% 1.52%
401 Adelaide - Central and Hills SA 1.16% 1.33% -0.17% 1.43%
213 Melbourne - West VIC 1.16% 1.44% -0.28% 2.43%
202 Bendigo VIC 1.16% 1.18% -0.02% 0.38%
203 Geelong VIC 1.15% 1.14% 0.02% 1.06%
404 Adelaide - West SA 1.11% 1.22% -0.10% 0.79%
209 Melbourne - North East VIC 1.11% 1.20% -0.09% 2.35%
214 Mornington Peninsula VIC 1.11% 1.23% -0.13% 1.20%
119 Sydney - Inner South West NSW 1.11% 0.93% 0.17% 3.12%
212 Melbourne - South East VIC 1.09% 1.14% -0.05% 2.22%
108 Mid North Coast NSW 1.09% 1.49% -0.40% 0.43%
301 Brisbane - East QLD 1.03% 1.09% -0.07% 1.55%
303 Brisbane - South QLD 1.01% 0.92% 0.09% 2.90%
104 Coffs Harbour - Grafton NSW 0.99% 1.67% -0.68% 0.35%
314 Moreton Bay - South QLD 0.97% 1.12% -0.15% 0.63%
123 Sydney - Outer South West NSW 0.96% 1.03% -0.08% 0.88%
702 Northern Territory - Outback NT 0.95% 1.26% -0.32% 0.10%
111 Newcastle and Lake Macquarie NSW 0.94% 0.80% 0.13% 1.32%
116 Sydney - Blacktown NSW 0.93% 0.80% 0.13% 2.26%
101 Capital Region NSW 0.93% 1.17% -0.24% 1.34%
102 Central Coast NSW 0.93% 1.48% -0.56% 1.36%
107 Illawarra NSW 0.91% 1.00% -0.09% 1.66%
211 Melbourne - Outer East VIC 0.87% 0.78% 0.09% 2.33%
601 Hobart TAS 0.87% 1.31% -0.44% 0.93%
304 Brisbane - West QLD 0.86% 0.87% -0.01% 1.41%
602 Launceston and North East TAS 0.76% 1.01% -0.25% 0.38%
302 Brisbane - North QLD 0.74% 0.76% -0.02% 2.09%
114 Southern Highlands and Shoalhaven NSW 0.71% 0.88% -0.17% 0.28%
125 Sydney - Parramatta NSW 0.65% 0.66% -0.01% 2.03%
128 Sydney - Sutherland NSW 0.64% 0.51% 0.13% 0.72%
208 Melbourne - Inner South VIC 0.63% 0.66% -0.04% 2.06%
124 Sydney - Outer West and Blue Mountains NSW 0.61% 0.92% -0.32% 0.87%
State Of The Nation: Australian Mortgage Arrears
spglobal.com/ratingsdirect 1-15
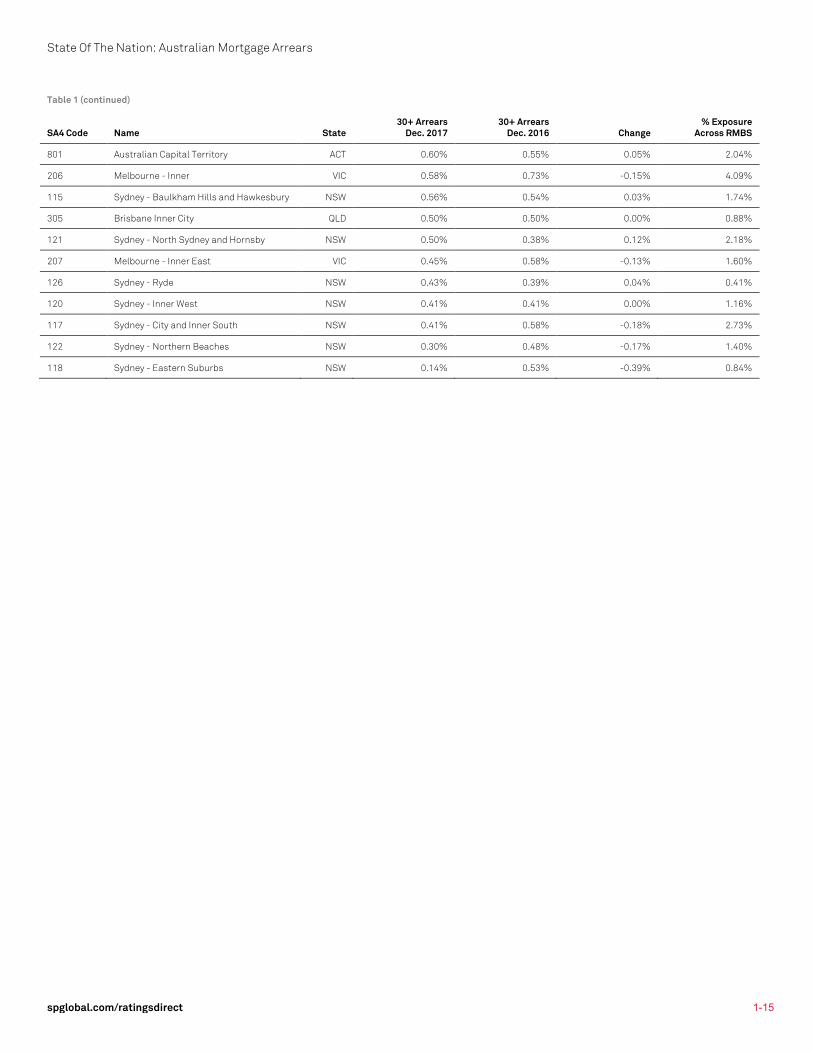
Table 1 (continued)
SA4 Code Name State 30+ Arrears
Dec. 2017 30+ Arrears
Dec. 2016 Change % Exposure
Across RMBS
801 Australian Capital Territory ACT 0.60% 0.55% 0.05% 2.04%
206 Melbourne - Inner VIC 0.58% 0.73% -0.15% 4.09%
115 Sydney - Baulkham Hills and Hawkesbury NSW 0.56% 0.54% 0.03% 1.74%
305 Brisbane Inner City QLD 0.50% 0.50% 0.00% 0.88%
121 Sydney - North Sydney and Hornsby NSW 0.50% 0.38% 0.12% 2.18%
207 Melbourne - Inner East VIC 0.45% 0.58% -0.13% 1.60%
126 Sydney - Ryde NSW 0.43% 0.39% 0.04% 0.41%
120 Sydney - Inner West NSW 0.41% 0.41% 0.00% 1.16%
117 Sydney - City and Inner South NSW 0.41% 0.58% -0.18% 2.73%
122 Sydney - Northern Beaches NSW 0.30% 0.48% -0.17% 1.40%
118 Sydney - Eastern Suburbs NSW 0.14% 0.53% -0.39% 0.84%
RMBS Performance Watch | Australia Part 1 – Market Overview As of Dec. 31, 2017
S&P GLOBAL RATINGS 1-16
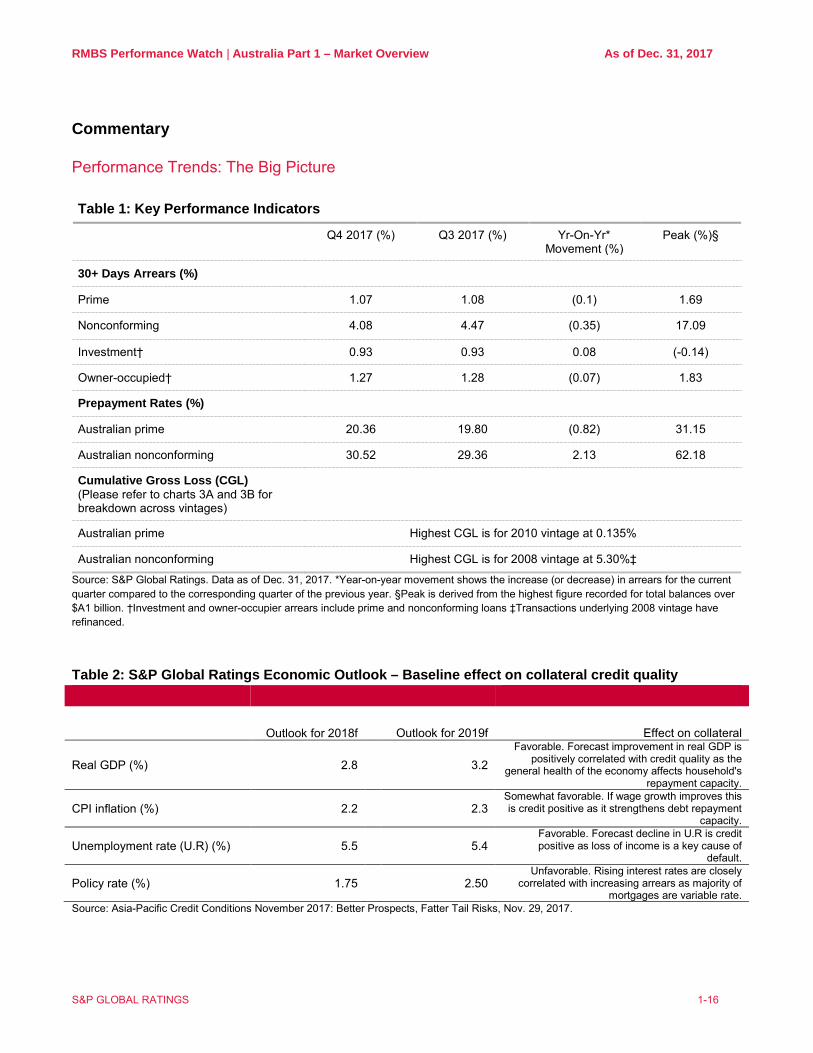
Commentary
Performance Trends: The Big Picture
Table 1: Key Performance Indicators
Q4 2017 (%) Q3 2017 (%) Yr-On-Yr* Movement (%)
Peak (%)§
30+ Days Arrears (%)
Prime 1.07 1.08 (0.1) 1.69
Nonconforming 4.08 4.47 (0.35) 17.09
Investment† 0.93 0.93 0.08 (-0.14)
Owner-occupied† 1.27 1.28 (0.07) 1.83
Prepayment Rates (%)
Australian prime 20.36 19.80 (0.82) 31.15
Australian nonconforming 30.52 29.36 2.13 62.18
Cumulative Gross Loss (CGL) (Please refer to charts 3A and 3B for breakdown across vintages)
Australian prime Highest CGL is for 2010 vintage at 0.135%
Australian nonconforming Highest CGL is for 2008 vintage at 5.30%‡
Source: S&P Global Ratings. Data as of Dec. 31, 2017. *Year-on-year movement shows the increase (or decrease) in arrears for the current quarter compared to the corresponding quarter of the previous year. §Peak is derived from the highest figure recorded for total balances over $A1 billion. †Investment and owner-occupier arrears include prime and nonconforming loans ‡Transactions underlying 2008 vintage have refinanced. Table 2: S&P Global Ratings Economic Outlook – Baseline effect on collateral credit quality
Outlook for 2018f
Outlook for 2019f Effect on collateral
Real GDP (%) 2.8
3.2 Favorable. Forecast improvement in real GDP is
positively correlated with credit quality as the general health of the economy affects household's
repayment capacity.
CPI inflation (%) 2.2
2.3 Somewhat favorable. If wage growth improves this is credit positive as it strengthens debt repayment
capacity.
Unemployment rate (U.R) (%) 5.5
5.4 Favorable. Forecast decline in U.R is credit positive as loss of income is a key cause of
default.
Policy rate (%) 1.75
2.50 Unfavorable. Rising interest rates are closely
correlated with increasing arrears as majority of mortgages are variable rate.
Source: Asia-Pacific Credit Conditions November 2017: Better Prospects, Fatter Tail Risks, Nov. 29, 2017.
RMBS Performance Watch | Australia Part 1 – Market Overview As of Dec. 31, 2017
S&P GLOBAL RATINGS 1-17
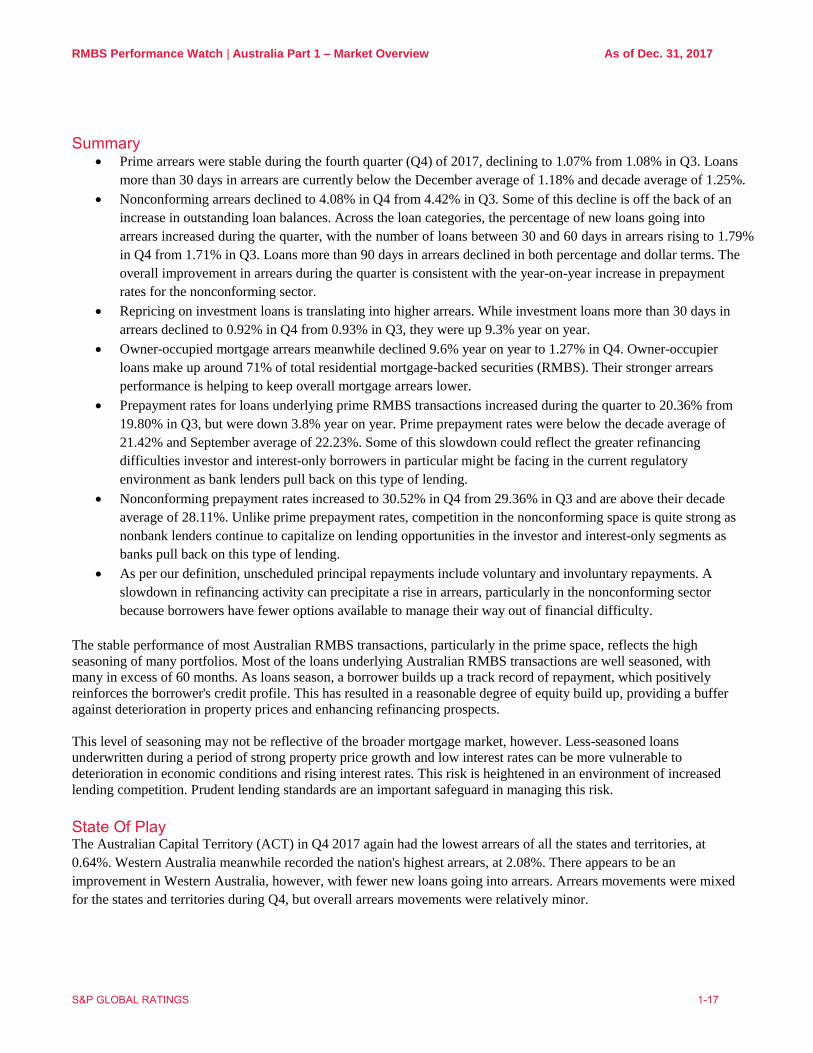
Summary • Prime arrears were stable during the fourth quarter (Q4) of 2017, declining to 1.07% from 1.08% in Q3. Loans
more than 30 days in arrears are currently below the December average of 1.18% and decade average of 1.25%. • Nonconforming arrears declined to 4.08% in Q4 from 4.42% in Q3. Some of this decline is off the back of an
increase in outstanding loan balances. Across the loan categories, the percentage of new loans going into arrears increased during the quarter, with the number of loans between 30 and 60 days in arrears rising to 1.79% in Q4 from 1.71% in Q3. Loans more than 90 days in arrears declined in both percentage and dollar terms. The overall improvement in arrears during the quarter is consistent with the year-on-year increase in prepayment rates for the nonconforming sector.
• Repricing on investment loans is translating into higher arrears. While investment loans more than 30 days in arrears declined to 0.92% in Q4 from 0.93% in Q3, they were up 9.3% year on year.
• Owner-occupied mortgage arrears meanwhile declined 9.6% year on year to 1.27% in Q4. Owner-occupier loans make up around 71% of total residential mortgage-backed securities (RMBS). Their stronger arrears performance is helping to keep overall mortgage arrears lower.
• Prepayment rates for loans underlying prime RMBS transactions increased during the quarter to 20.36% from 19.80% in Q3, but were down 3.8% year on year. Prime prepayment rates were below the decade average of 21.42% and September average of 22.23%. Some of this slowdown could reflect the greater refinancing difficulties investor and interest-only borrowers in particular might be facing in the current regulatory environment as bank lenders pull back on this type of lending.
• Nonconforming prepayment rates increased to 30.52% in Q4 from 29.36% in Q3 and are above their decade average of 28.11%. Unlike prime prepayment rates, competition in the nonconforming space is quite strong as nonbank lenders continue to capitalize on lending opportunities in the investor and interest-only segments as banks pull back on this type of lending.
• As per our definition, unscheduled principal repayments include voluntary and involuntary repayments. A slowdown in refinancing activity can precipitate a rise in arrears, particularly in the nonconforming sector because borrowers have fewer options available to manage their way out of financial difficulty.
The stable performance of most Australian RMBS transactions, particularly in the prime space, reflects the high seasoning of many portfolios. Most of the loans underlying Australian RMBS transactions are well seasoned, with many in excess of 60 months. As loans season, a borrower builds up a track record of repayment, which positively reinforces the borrower's credit profile. This has resulted in a reasonable degree of equity build up, providing a buffer against deterioration in property prices and enhancing refinancing prospects. This level of seasoning may not be reflective of the broader mortgage market, however. Less-seasoned loans underwritten during a period of strong property price growth and low interest rates can be more vulnerable to deterioration in economic conditions and rising interest rates. This risk is heightened in an environment of increased lending competition. Prudent lending standards are an important safeguard in managing this risk.
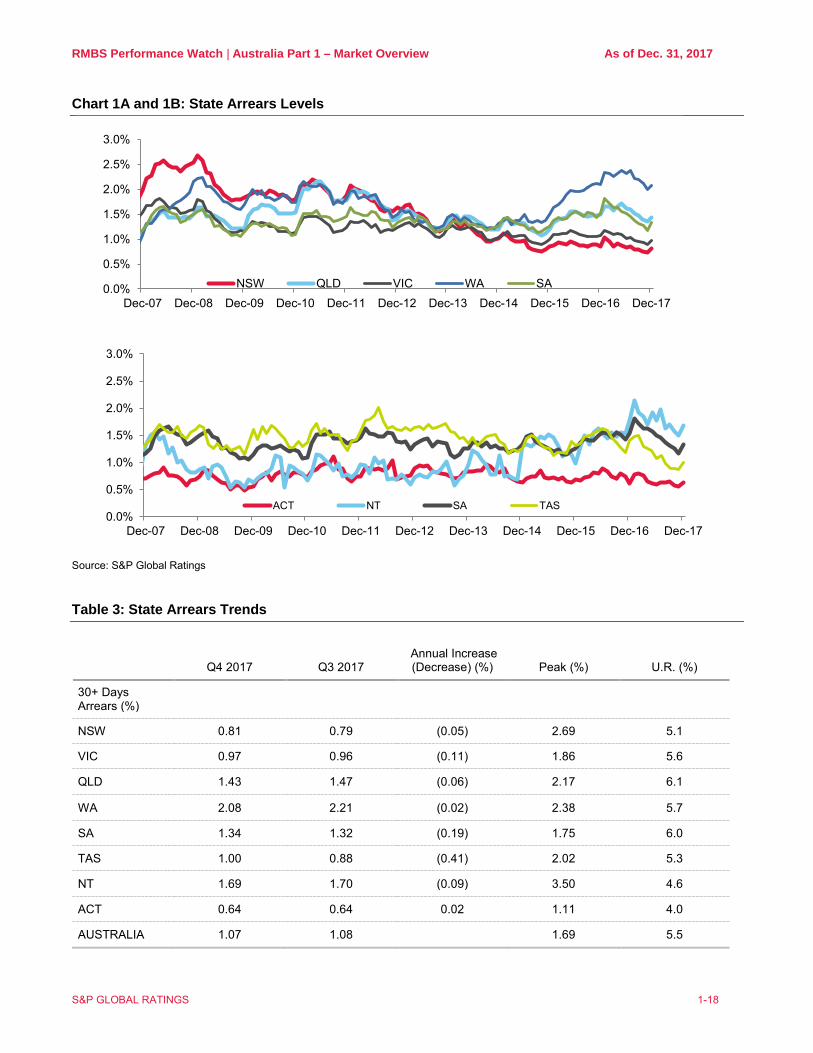
State Of Play The Australian Capital Territory (ACT) in Q4 2017 again had the lowest arrears of all the states and territories, at 0.64%. Western Australia meanwhile recorded the nation's highest arrears, at 2.08%. There appears to be an improvement in Western Australia, however, with fewer new loans going into arrears. Arrears movements were mixed for the states and territories during Q4, but overall arrears movements were relatively minor.
RMBS Performance Watch | Australia Part 1 – Market Overview As of Dec. 31, 2017
S&P GLOBAL RATINGS 1-18
Chart 1A and 1B: State Arrears Levels
Source: S&P Global Ratings Table 3: State Arrears Trends
Q4 2017 Q3 2017 Annual Increase (Decrease) (%) Peak (%) U.R. (%)
30+ Days Arrears (%)
NSW 0.81 0.79 (0.05) 2.69 5.1
VIC 0.97 0.96 (0.11) 1.86 5.6
QLD 1.43 1.47 (0.06) 2.17 6.1
WA 2.08 2.21 (0.02) 2.38 5.7
SA 1.34 1.32 (0.19) 1.75 6.0
TAS 1.00 0.88 (0.41) 2.02 5.3
NT 1.69 1.70 (0.09) 3.50 4.6
ACT 0.64 0.64 0.02 1.11 4.0
AUSTRALIA 1.07 1.08 1.69 5.5
0.0%
0.5%
1.0%
1.5%
2.0%
2.5%
3.0%
Dec-07 Dec-08 Dec-09 Dec-10 Dec-11 Dec-12 Dec-13 Dec-14 Dec-15 Dec-16 Dec-17NSW QLD VIC WA SA
0.0%
0.5%
1.0%
1.5%
2.0%
2.5%
3.0%
Dec-07 Dec-08 Dec-09 Dec-10 Dec-11 Dec-12 Dec-13 Dec-14 Dec-15 Dec-16 Dec-17
ACT NT SA TAS
RMBS Performance Watch | Australia Part 1 – Market Overview As of Dec. 31, 2017
S&P GLOBAL RATINGS 1-19
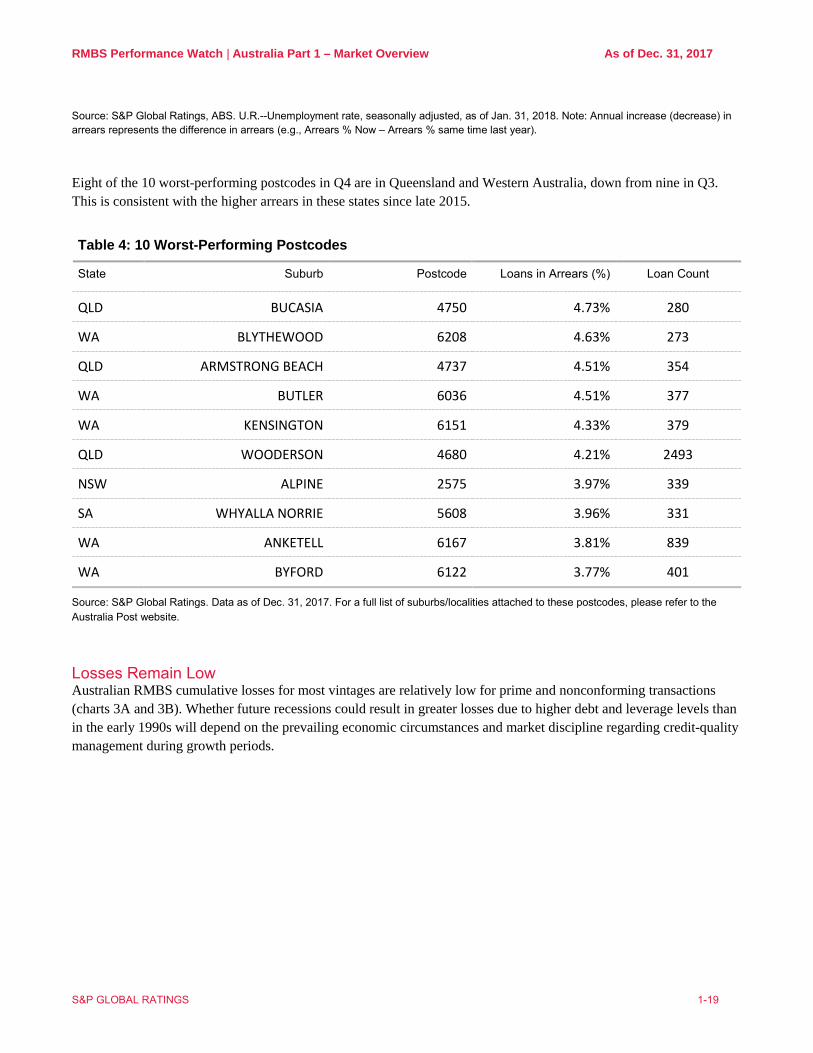
Source: S&P Global Ratings, ABS. U.R.--Unemployment rate, seasonally adjusted, as of Jan. 31, 2018. Note: Annual increase (decrease) in arrears represents the difference in arrears (e.g., Arrears % Now – Arrears % same time last year). Eight of the 10 worst-performing postcodes in Q4 are in Queensland and Western Australia, down from nine in Q3. This is consistent with the higher arrears in these states since late 2015.
Table 4: 10 Worst-Performing Postcodes
State Suburb Postcode Loans in Arrears (%) Loan Count
QLD BUCASIA 4750 4.73% 280
WA BLYTHEWOOD 6208 4.63% 273
QLD ARMSTRONG BEACH 4737 4.51% 354
WA BUTLER 6036 4.51% 377
WA KENSINGTON 6151 4.33% 379
QLD WOODERSON 4680 4.21% 2493
NSW ALPINE 2575 3.97% 339
SA WHYALLA NORRIE 5608 3.96% 331
WA ANKETELL 6167 3.81% 839
WA BYFORD 6122 3.77% 401
Source: S&P Global Ratings. Data as of Dec. 31, 2017. For a full list of suburbs/localities attached to these postcodes, please refer to the Australia Post website.
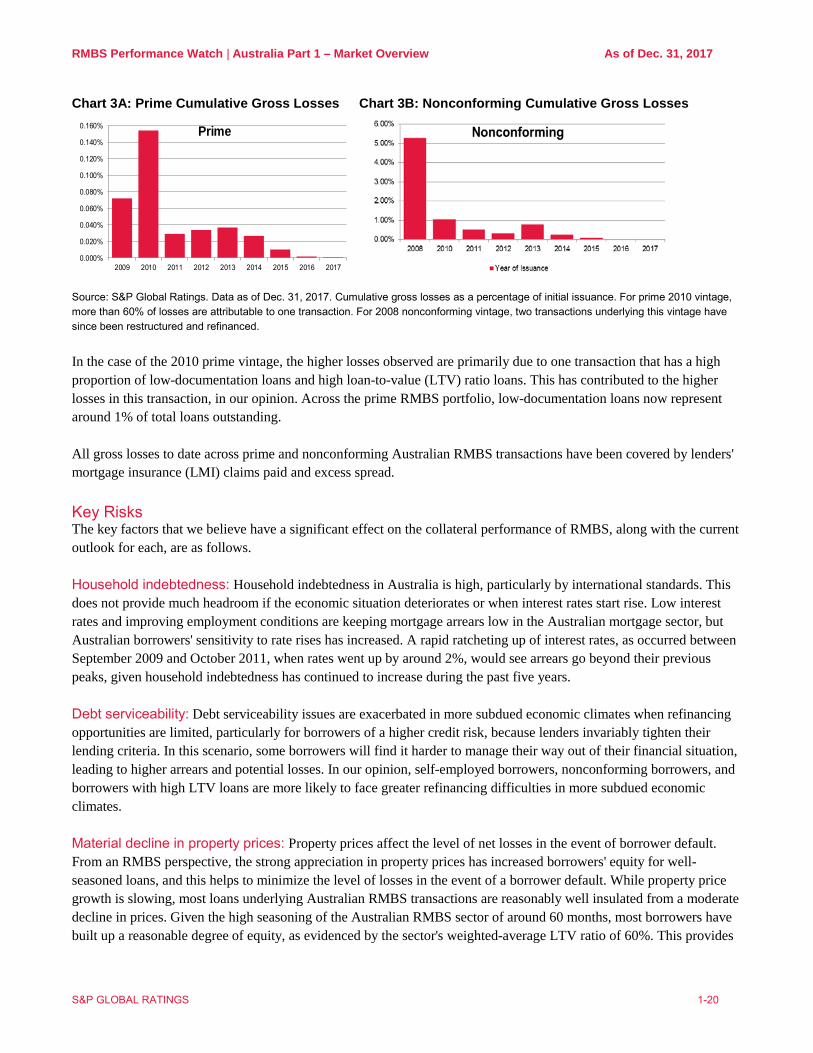
Losses Remain Low Australian RMBS cumulative losses for most vintages are relatively low for prime and nonconforming transactions (charts 3A and 3B). Whether future recessions could result in greater losses due to higher debt and leverage levels than in the early 1990s will depend on the prevailing economic circumstances and market discipline regarding credit-quality management during growth periods.
RMBS Performance Watch | Australia Part 1 – Market Overview As of Dec. 31, 2017
S&P GLOBAL RATINGS 1-20
Chart 3A: Prime Cumulative Gross Losses Chart 3B: Nonconforming Cumulative Gross Losses
0.000%
0.020%
0.040%
0.060%
0.080%
0.100%
0.120%
0.140%
0.160%
2009 2010 2011 2012 2013 2014 2015 2016 2017
Prime
Source: S&P Global Ratings. Data as of Dec. 31, 2017. Cumulative gross losses as a percentage of initial issuance. For prime 2010 vintage, more than 60% of losses are attributable to one transaction. For 2008 nonconforming vintage, two transactions underlying this vintage have since been restructured and refinanced. In the case of the 2010 prime vintage, the higher losses observed are primarily due to one transaction that has a high proportion of low-documentation loans and high loan-to-value (LTV) ratio loans. This has contributed to the higher losses in this transaction, in our opinion. Across the prime RMBS portfolio, low-documentation loans now represent around 1% of total loans outstanding. All gross losses to date across prime and nonconforming Australian RMBS transactions have been covered by lenders' mortgage insurance (LMI) claims paid and excess spread.
Key Risks The key factors that we believe have a significant effect on the collateral performance of RMBS, along with the current outlook for each, are as follows. Household indebtedness: Household indebtedness in Australia is high, particularly by international standards. This does not provide much headroom if the economic situation deteriorates or when interest rates start rise. Low interest rates and improving employment conditions are keeping mortgage arrears low in the Australian mortgage sector, but Australian borrowers' sensitivity to rate rises has increased. A rapid ratcheting up of interest rates, as occurred between September 2009 and October 2011, when rates went up by around 2%, would see arrears go beyond their previous peaks, given household indebtedness has continued to increase during the past five years. Debt serviceability: Debt serviceability issues are exacerbated in more subdued economic climates when refinancing opportunities are limited, particularly for borrowers of a higher credit risk, because lenders invariably tighten their lending criteria. In this scenario, some borrowers will find it harder to manage their way out of their financial situation, leading to higher arrears and potential losses. In our opinion, self-employed borrowers, nonconforming borrowers, and borrowers with high LTV loans are more likely to face greater refinancing difficulties in more subdued economic climates. Material decline in property prices: Property prices affect the level of net losses in the event of borrower default. From an RMBS perspective, the strong appreciation in property prices has increased borrowers' equity for well-seasoned loans, and this helps to minimize the level of losses in the event of a borrower default. While property price growth is slowing, most loans underlying Australian RMBS transactions are reasonably well insulated from a moderate decline in prices. Given the high seasoning of the Australian RMBS sector of around 60 months, most borrowers have built up a reasonable degree of equity, as evidenced by the sector's weighted-average LTV ratio of 60%. This provides
RMBS Performance Watch | Australia Part 1 – Market Overview As of Dec. 31, 2017
S&P GLOBAL RATINGS 1-21
a buffer against a moderate property price decline. Higher LTV ratio loans are more exposed to a decline in property prices because they have not built up as much equity to absorb potential losses. Around 16 % of total RMBS loans have high LTV ratios of more than 80%. Tail-end risk: Adverse selection remains a risk in RMBS transactions, particularly when the originator/servicer has gone out of business and the RMBS are unlikely to be redeemed on their call dates. However, the mitigating factors include a build-up of credit enhancement in percentage terms as the repayment speed outpaces the loss rate. Subordinated tranches of RMBS transactions are more exposed to this risk, particularly those that have no hard credit support available and rely exclusively on LMI and excess spread to cover any losses. Counterparty risks: Counterparty risk is a key rating-transition risk for Australian RMBS transactions. LMI providers and financial institutions are common counterparties in Australian and New Zealand RMBS transactions.
Current Outlook The current outlook is stable for Australian RMBS transactions, from a collateral performance perspective. Low interest rates and stable employment conditions are supporting strong arrears performance and low levels of losses. Our forecast (table 2) of continued stability in employment conditions is fundamental to our stable collateral outlook for Australian RMBS because loss of income is a key cause of default. The credit enhancement available to most 'AAA (sf)' rated tranches of Australian RMBS transactions provides a buffer to withstand a moderate deterioration in collateral performance, in our opinion. High prepayment rates for prime and nonconforming loans have contributed to this build-up in credit enhancement, particularly for transactions that are paying sequentially.
RMBS Performance Watch | Australia Part 1 – Market Overview As of Dec. 31, 2017
S&P GLOBAL RATINGS 1-22
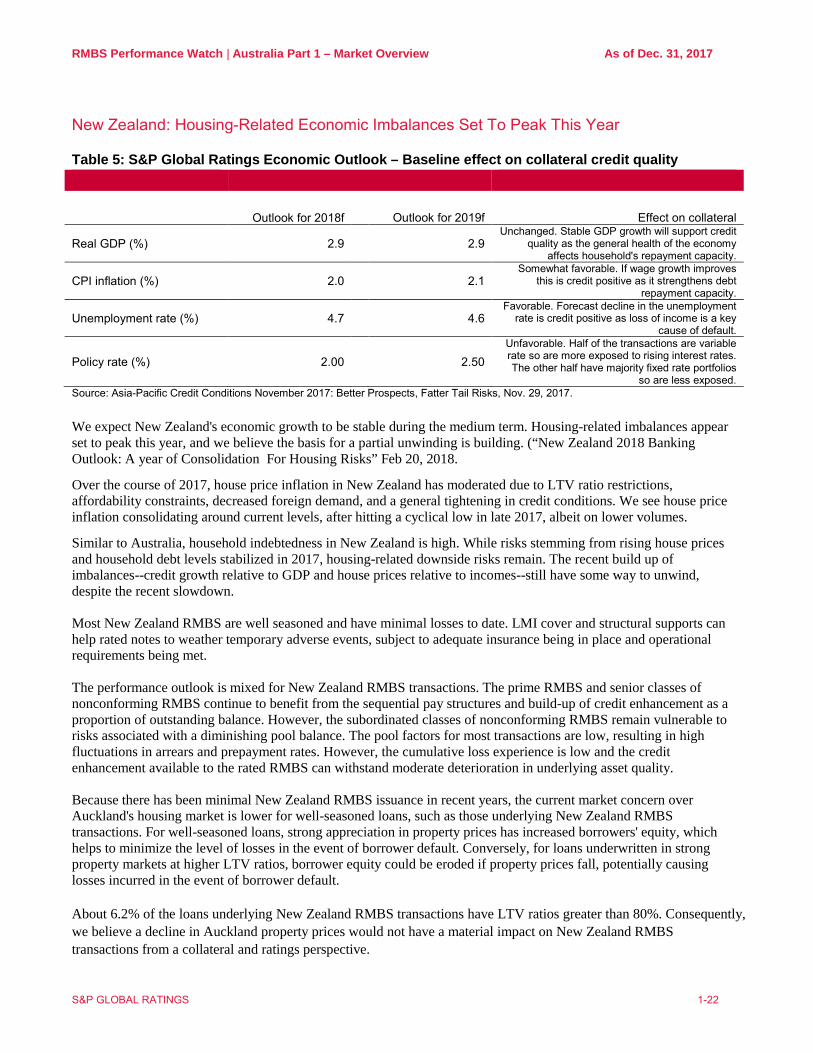
New Zealand: Housing-Related Economic Imbalances Set To Peak This Year Table 5: S&P Global Ratings Economic Outlook – Baseline effect on collateral credit quality
Outlook for 2018f
Outlook for 2019f Effect on collateral
Real GDP (%) 2.9
2.9 Unchanged. Stable GDP growth will support credit
quality as the general health of the economy affects household's repayment capacity.
CPI inflation (%) 2.0
2.1 Somewhat favorable. If wage growth improves
this is credit positive as it strengthens debt repayment capacity.
Unemployment rate (%) 4.7
4.6 Favorable. Forecast decline in the unemployment
rate is credit positive as loss of income is a key cause of default.
Policy rate (%) 2.00
2.50 Unfavorable. Half of the transactions are variable rate so are more exposed to rising interest rates. The other half have majority fixed rate portfolios
so are less exposed. Source: Asia-Pacific Credit Conditions November 2017: Better Prospects, Fatter Tail Risks, Nov. 29, 2017. We expect New Zealand's economic growth to be stable during the medium term. Housing-related imbalances appear set to peak this year, and we believe the basis for a partial unwinding is building. (“New Zealand 2018 Banking Outlook: A year of Consolidation For Housing Risks” Feb 20, 2018.
Over the course of 2017, house price inflation in New Zealand has moderated due to LTV ratio restrictions, affordability constraints, decreased foreign demand, and a general tightening in credit conditions. We see house price inflation consolidating around current levels, after hitting a cyclical low in late 2017, albeit on lower volumes.
Similar to Australia, household indebtedness in New Zealand is high. While risks stemming from rising house prices and household debt levels stabilized in 2017, housing-related downside risks remain. The recent build up of imbalances--credit growth relative to GDP and house prices relative to incomes--still have some way to unwind, despite the recent slowdown. Most New Zealand RMBS are well seasoned and have minimal losses to date. LMI cover and structural supports can help rated notes to weather temporary adverse events, subject to adequate insurance being in place and operational requirements being met. The performance outlook is mixed for New Zealand RMBS transactions. The prime RMBS and senior classes of nonconforming RMBS continue to benefit from the sequential pay structures and build-up of credit enhancement as a proportion of outstanding balance. However, the subordinated classes of nonconforming RMBS remain vulnerable to risks associated with a diminishing pool balance. The pool factors for most transactions are low, resulting in high fluctuations in arrears and prepayment rates. However, the cumulative loss experience is low and the credit enhancement available to the rated RMBS can withstand moderate deterioration in underlying asset quality. Because there has been minimal New Zealand RMBS issuance in recent years, the current market concern over Auckland's housing market is lower for well-seasoned loans, such as those underlying New Zealand RMBS transactions. For well-seasoned loans, strong appreciation in property prices has increased borrowers' equity, which helps to minimize the level of losses in the event of borrower default. Conversely, for loans underwritten in strong property markets at higher LTV ratios, borrower equity could be eroded if property prices fall, potentially causing losses incurred in the event of borrower default. About 6.2% of the loans underlying New Zealand RMBS transactions have LTV ratios greater than 80%. Consequently, we believe a decline in Auckland property prices would not have a material impact on New Zealand RMBS transactions from a collateral and ratings perspective.
RMBS Performance Watch | Australia Part 1 – Market Overview As of Dec. 31, 2017
S&P GLOBAL RATINGS 1-23
The key performance trends for the New Zealand RMBS sector during Q4 include the following:
• The Standard & Poor's Performance Index (SPIN) for New Zealand prime mortgages increased to 1.18% in Q4 2017 from 0.95% in Q3.
• Prepayment levels for New Zealand prime mortgages increased to 20.51% in Q4 from 20.49% in Q3. • Cumulative gross loss levels are low for prime RMBS, with the highest vintage (2010) recording a cumulative
gross loss of 0.682%. Losses for this vintage are significantly higher than all other vintages, but have stabilized at this level since Q3 2014.
• The current weighted-average LTV ratio across RMBS portfolios is 61.70%. • The current weighted-average seasoning across RMBS portfolios is 47 months.
Resimac Ltd. issued RESIMAC Versailles Trust Series 2017-1 in November 2017. It was the second New Zealand RMBS transaction issued in 2017. There are currently six outstanding prime New Zealand RMBS transactions and one nonconforming RMBS transaction, with New Zealand RMBS outstandings just over NZ$651 million as of Dec. 31, 2017. The Reserve Bank of New Zealand (RBNZ) initiated a consultation process in November 2017 and is proposing an enhanced mortgage bond standard. The aim of this standard is to improve the quality and liquidity of collateral instruments through simple, transparent, and comparable mortgage bond standards. The RBNZ is currently seeking feedback on the terms under which it accepts mortgage bonds as collateral and the proposed new Residential Mortgage Obligations standard. All gross losses to date in prime and nonconforming New Zealand RMBS transactions have been covered by LMI claims paid and excess spread. The performance of New Zealand RMBS has been stable, and we expect this trend to continue throughout 2018.
at December 31, 2017RMBS Performance Watch | Australia Part 1 - Overview
Market Overview
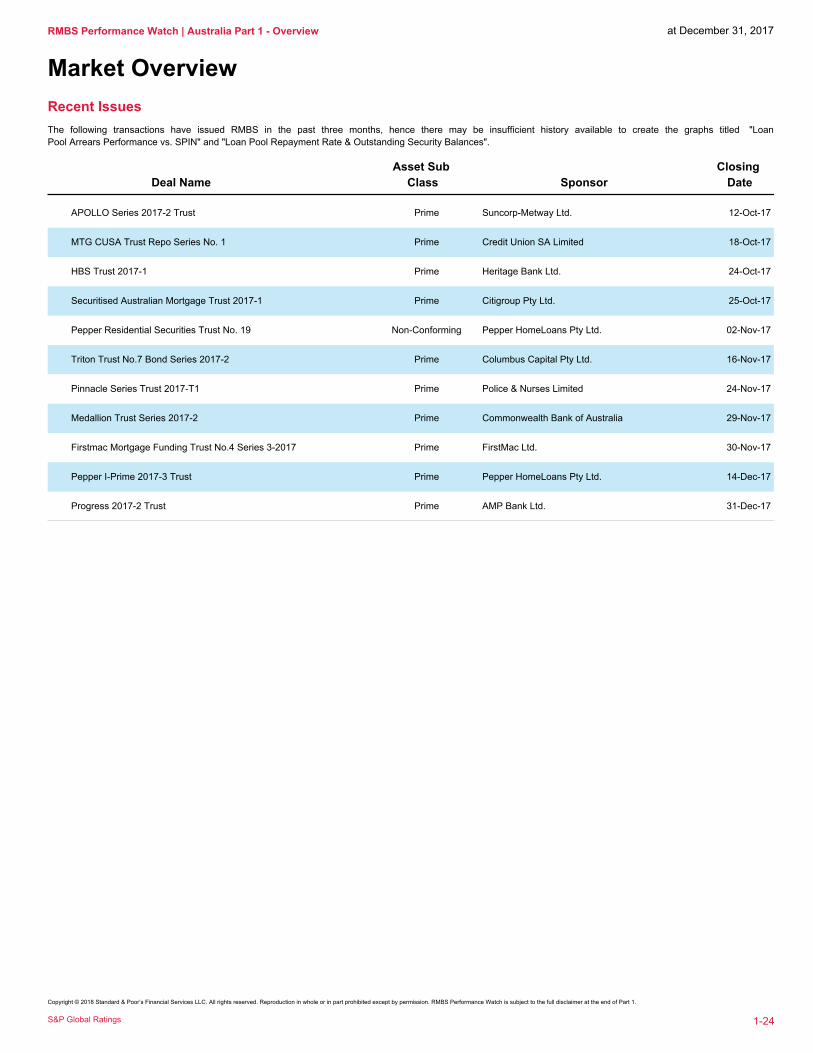
Recent Issues
The following transactions have issued RMBS in the past three months, hence there may be insufficient history available to create the graphs titled "Loan
Pool Arrears Performance vs. SPIN" and "Loan Pool Repayment Rate & Outstanding Security Balances".
Asset Sub
Class
Closing
DateDeal Name Sponsor
APOLLO Series 2017-2 Trust 12-Oct-17 Suncorp-Metway Ltd.Prime
MTG CUSA Trust Repo Series No. 1 18-Oct-17 Credit Union SA LimitedPrime
HBS Trust 2017-1 24-Oct-17 Heritage Bank Ltd.Prime
Securitised Australian Mortgage Trust 2017-1 25-Oct-17 Citigroup Pty Ltd.Prime
Pepper Residential Securities Trust No. 19 02-Nov-17 Pepper HomeLoans Pty Ltd.Non-Conforming
Triton Trust No.7 Bond Series 2017-2 16-Nov-17 Columbus Capital Pty Ltd.Prime
Pinnacle Series Trust 2017-T1 24-Nov-17 Police & Nurses LimitedPrime
Medallion Trust Series 2017-2 29-Nov-17 Commonwealth Bank of AustraliaPrime
Firstmac Mortgage Funding Trust No.4 Series 3-2017 30-Nov-17 FirstMac Ltd.Prime
Pepper I-Prime 2017-3 Trust 14-Dec-17 Pepper HomeLoans Pty Ltd.Prime
Progress 2017-2 Trust 31-Dec-17 AMP Bank Ltd.Prime
S&P Global Ratings
Copyright © 2018 Standard & Poor’s Financial Services LLC. All rights reserved. Reproduction in whole or in part prohibited except by permission. RMBS Performance Watch is subject to the full disclaimer at the end of Part 1.
1-24
at December 31, 2017RMBS Performance Watch | Australia Part 1 - Overview
Market Overview
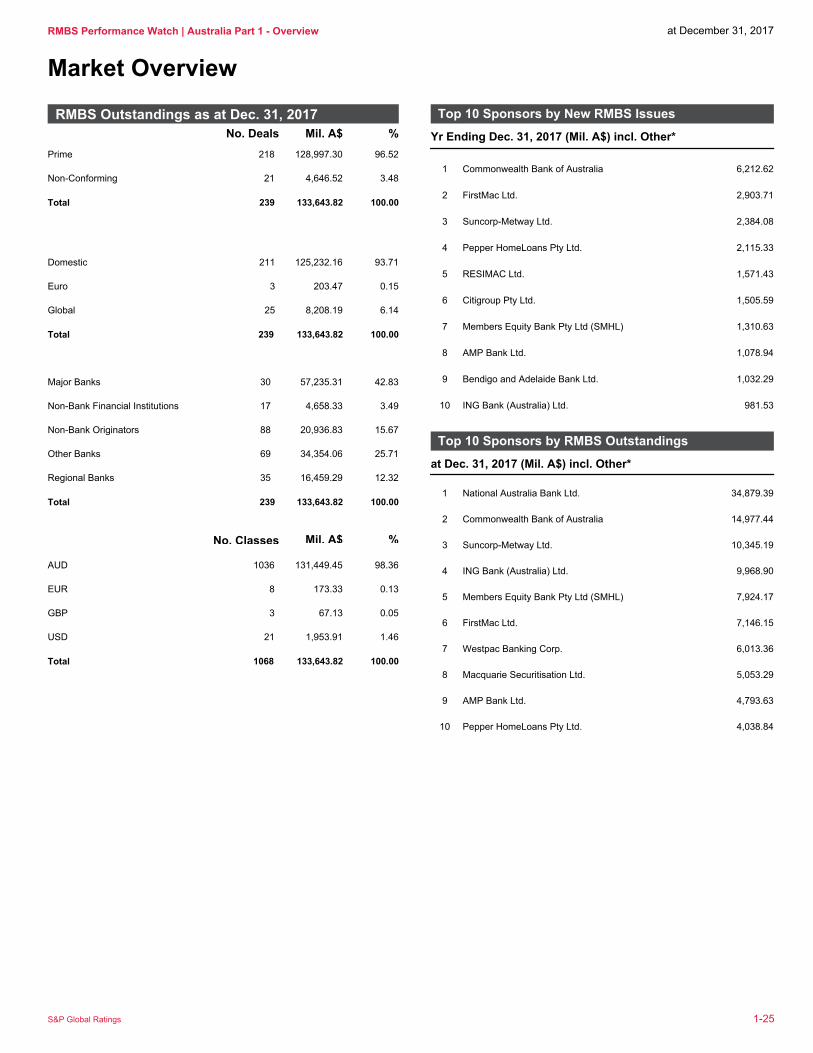
211 125,232.16 93.71Domestic
3 203.47 0.15Euro
25 8,208.19 6.14Global
Total 239 133,643.82 100.00
Mil. A$ %No. Deals
Prime 218 128,997.30 96.52
Non-Conforming 21 4,646.52 3.48
239 133,643.82 100.00Total
Top 10 Sponsors by New RMBS Issues
Yr Ending Dec. 31, 2017 (Mil. A$) incl. Other*
1 Commonwealth Bank of Australia 6,212.62
2 FirstMac Ltd. 2,903.71
3 Suncorp-Metway Ltd. 2,384.08
4 Pepper HomeLoans Pty Ltd. 2,115.33
5 RESIMAC Ltd. 1,571.43
6 Citigroup Pty Ltd. 1,505.59
7 Members Equity Bank Pty Ltd (SMHL) 1,310.63
8 AMP Bank Ltd. 1,078.94
9 Bendigo and Adelaide Bank Ltd. 1,032.29
10 ING Bank (Australia) Ltd. 981.53
RMBS Outstandings as at Dec. 31, 2017
Major Banks 30 57,235.31 42.83
Non-Bank Financial Institutions 17 4,658.33 3.49
Non-Bank Originators 88 20,936.83 15.67
Other Banks 69 34,354.06 25.71
Regional Banks 35 16,459.29 12.32
Total 239 133,643.82 100.00
Top 10 Sponsors by RMBS Outstandings
at Dec. 31, 2017 (Mil. A$) incl. Other*
1 National Australia Bank Ltd. 34,879.39
2 Commonwealth Bank of Australia 14,977.44
3 Suncorp-Metway Ltd. 10,345.19
4 ING Bank (Australia) Ltd. 9,968.90
5 Members Equity Bank Pty Ltd (SMHL) 7,924.17
6 FirstMac Ltd. 7,146.15
7 Westpac Banking Corp. 6,013.36
8 Macquarie Securitisation Ltd. 5,053.29
9 AMP Bank Ltd. 4,793.63
10 Pepper HomeLoans Pty Ltd. 4,038.84
Mil. A$No. Classes %
AUD 1036 131,449.45 98.36
EUR 8 173.33 0.13
GBP 3 67.13 0.05
USD 21 1,953.91 1.46
Total 133,643.82 100.00 1068
S&P Global Ratings 1-25
at December 31, 2017RMBS Performance Watch | Australia Part 1 - Overview
Market Overview
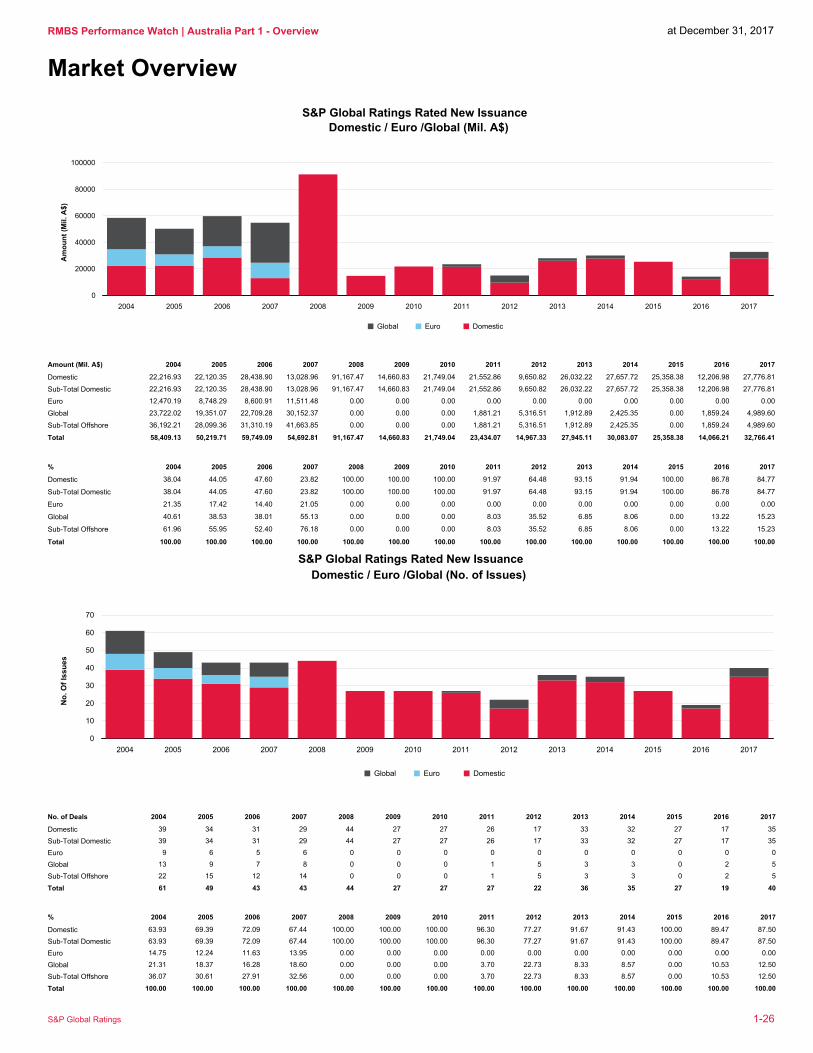
S&P Global Ratings Rated New Issuance
Domestic / Euro /Global (Mil. A$)
0
20000
40000
60000
80000
100000
2004 2005 2006 2007 2008 2009 2010 2011 2012 2013 2014 2015 2016 2017
Global Euro Domestic
Am
ou
nt
(Mil. A
$)
2004 2005 2006 2007 2008 2009 2010 2011 2012 2013 2014 2015 2016 2017
Domestic 22,216.93 22,120.35 28,438.90 13,028.96 91,167.47 14,660.83 21,749.04 21,552.86 9,650.82 26,032.22 27,657.72 25,358.38 12,206.98 27,776.81
Sub-Total Domestic 22,216.93 22,120.35 28,438.90 13,028.96 91,167.47 14,660.83 21,749.04 21,552.86 9,650.82 26,032.22 27,657.72 25,358.38 12,206.98 27,776.81
Euro 12,470.19 8,748.29 8,600.91 11,511.48 0.00 0.00 0.00 0.00 0.00 0.00 0.00 0.00 0.00 0.00
Global 23,722.02 19,351.07 22,709.28 30,152.37 0.00 0.00 0.00 1,881.21 5,316.51 1,912.89 2,425.35 0.00 1,859.24 4,989.60
Sub-Total Offshore 36,192.21 28,099.36 31,310.19 41,663.85 0.00 0.00 0.00 1,881.21 5,316.51 1,912.89 2,425.35 0.00 1,859.24 4,989.60
Total 58,409.13 50,219.71 59,749.09 54,692.81 91,167.47 14,660.83 21,749.04 23,434.07 14,967.33 27,945.11 30,083.07 25,358.38 14,066.21 32,766.41
Amount (Mil. A$)
2004 2005 2006 2007 2008 2009 2010 2011 2012 2013 2014 2015 2016 2017
Domestic 38.04 44.05 47.60 23.82 100.00 100.00 100.00 91.97 64.48 93.15 91.94 100.00 86.78 84.77
Sub-Total Domestic 38.04 44.05 47.60 23.82 100.00 100.00 100.00 91.97 64.48 93.15 91.94 100.00 86.78 84.77
Euro 21.35 17.42 14.40 21.05 0.00 0.00 0.00 0.00 0.00 0.00 0.00 0.00 0.00 0.00
Global 40.61 38.53 38.01 55.13 0.00 0.00 0.00 8.03 35.52 6.85 8.06 0.00 13.22 15.23
Sub-Total Offshore 61.96 55.95 52.40 76.18 0.00 0.00 0.00 8.03 35.52 6.85 8.06 0.00 13.22 15.23
Total 100.00 100.00 100.00 100.00 100.00 100.00 100.00 100.00 100.00 100.00 100.00 100.00 100.00 100.00
%
S&P Global Ratings Rated New Issuance
Domestic / Euro /Global (No. of Issues)
0
10
20
30
40
50
60
70
2004 2005 2006 2007 2008 2009 2010 2011 2012 2013 2014 2015 2016 2017
Global Euro Domestic
No
. O
f Is
su
es
2004 2005 2006 2007 2008 2009 2010 2011 2012 2013 2014 2015 2016 2017
Domestic 39 34 31 29 44 27 27 26 17 33 32 27 17 35
Sub-Total Domestic 39 34 31 29 44 27 27 26 17 33 32 27 17 35
Euro 9 6 5 6 0 0 0 0 0 0 0 0 0 0
Global 13 9 7 8 0 0 0 1 5 3 3 0 2 5
Sub-Total Offshore 22 15 12 14 0 0 0 1 5 3 3 0 2 5
Total 61 49 43 43 44 27 27 27 22 36 35 27 19 40
No. of Deals
2004 2005 2006 2007 2008 2009 2010 2011 2012 2013 2014 2015 2016 2017
Domestic 63.93 69.39 72.09 67.44 100.00 100.00 100.00 96.30 77.27 91.67 91.43 100.00 89.47 87.50
Sub-Total Domestic 63.93 69.39 72.09 67.44 100.00 100.00 100.00 96.30 77.27 91.67 91.43 100.00 89.47 87.50
Euro 14.75 12.24 11.63 13.95 0.00 0.00 0.00 0.00 0.00 0.00 0.00 0.00 0.00 0.00
Global 21.31 18.37 16.28 18.60 0.00 0.00 0.00 3.70 22.73 8.33 8.57 0.00 10.53 12.50
Sub-Total Offshore 36.07 30.61 27.91 32.56 0.00 0.00 0.00 3.70 22.73 8.33 8.57 0.00 10.53 12.50
Total 100.00 100.00 100.00 100.00 100.00 100.00 100.00 100.00 100.00 100.00 100.00 100.00 100.00 100.00
%
S&P Global Ratings 1-26
at December 31, 2017RMBS Performance Watch | Australia Part 1 - Overview
Market Overview
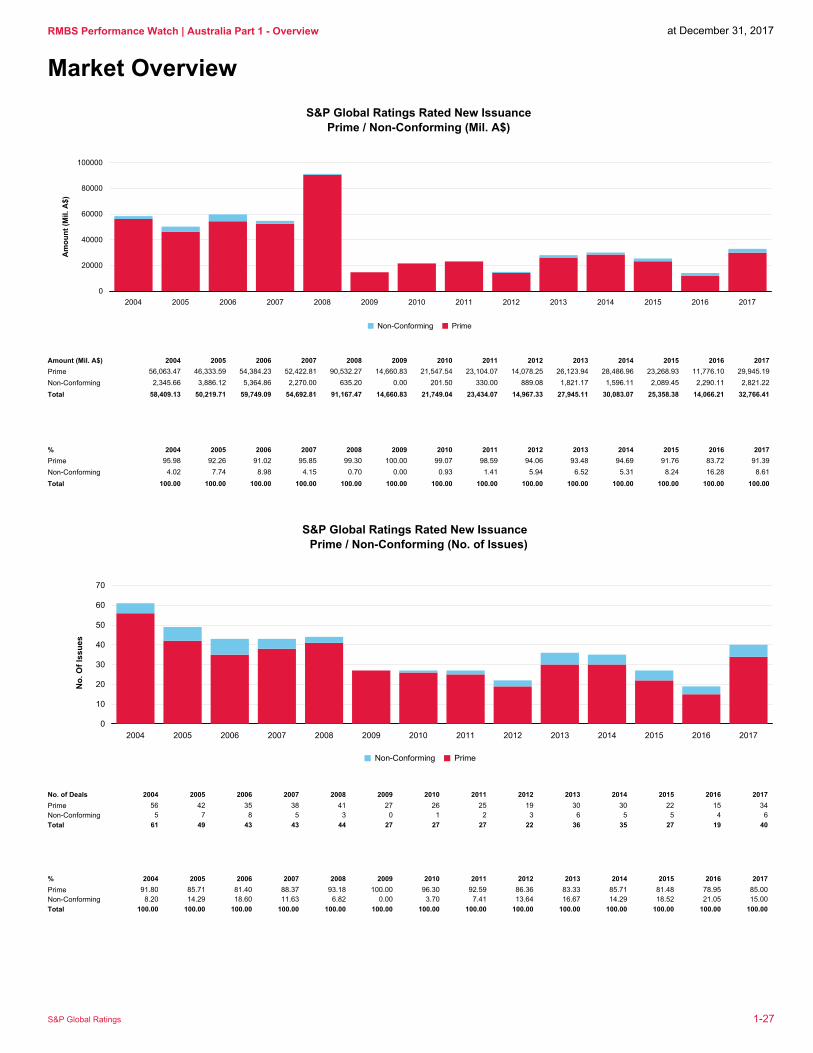
S&P Global Ratings Rated New Issuance
Prime / Non-Conforming (Mil. A$)
0
20000
40000
60000
80000
100000
2004 2005 2006 2007 2008 2009 2010 2011 2012 2013 2014 2015 2016 2017
Non-Conforming Prime
Am
ou
nt
(Mil. A
$)
2004 2005 2006 2007 2008 2009 2010 2011 2012 2013 2014 2015 2016 2017
Prime 56,063.47 46,333.59 54,384.23 52,422.81 90,532.27 14,660.83 21,547.54 23,104.07 14,078.25 26,123.94 28,486.96 23,268.93 11,776.10 29,945.19
Non-Conforming 2,345.66 3,886.12 5,364.86 2,270.00 635.20 0.00 201.50 330.00 889.08 1,821.17 1,596.11 2,089.45 2,290.11 2,821.22
Total 58,409.13 50,219.71 59,749.09 54,692.81 91,167.47 14,660.83 21,749.04 23,434.07 14,967.33 27,945.11 30,083.07 25,358.38 14,066.21 32,766.41
Amount (Mil. A$)
2004 2005 2006 2007 2008 2009 2010 2011 2012 2013 2014 2015 2016 2017
Prime 95.98 92.26 91.02 95.85 99.30 100.00 99.07 98.59 94.06 93.48 94.69 91.76 83.72 91.39
Non-Conforming 4.02 7.74 8.98 4.15 0.70 0.00 0.93 1.41 5.94 6.52 5.31 8.24 16.28 8.61
Total 100.00 100.00 100.00 100.00 100.00 100.00 100.00 100.00 100.00 100.00 100.00 100.00 100.00 100.00
%
S&P Global Ratings Rated New Issuance
Prime / Non-Conforming (No. of Issues)
0
10
20
30
40
50
60
70
2004 2005 2006 2007 2008 2009 2010 2011 2012 2013 2014 2015 2016 2017
Non-Conforming Prime
No
. O
f Is
su
es
2004 2005 2006 2007 2008 2009 2010 2011 2012 2013 2014 2015 2016 2017
Prime 56 42 35 38 41 27 26 25 19 30 30 22 15 34
Non-Conforming 5 7 8 5 3 0 1 2 3 6 5 5 4 6
Total 61 49 43 43 44 27 27 27 22 36 35 27 19 40
No. of Deals
2004 2005 2006 2007 2008 2009 2010 2011 2012 2013 2014 2015 2016 2017
Prime 91.80 85.71 81.40 88.37 93.18 100.00 96.30 92.59 86.36 83.33 85.71 81.48 78.95 85.00
Non-Conforming 8.20 14.29 18.60 11.63 6.82 0.00 3.70 7.41 13.64 16.67 14.29 18.52 21.05 15.00
Total 100.00 100.00 100.00 100.00 100.00 100.00 100.00 100.00 100.00 100.00 100.00 100.00 100.00 100.00
%
S&P Global Ratings 1-27
RMBS Performance Watch | Australia Part 1 – Market Overview As of Dec. 31, 2017
S&P GLOBAL RATINGS 1-28
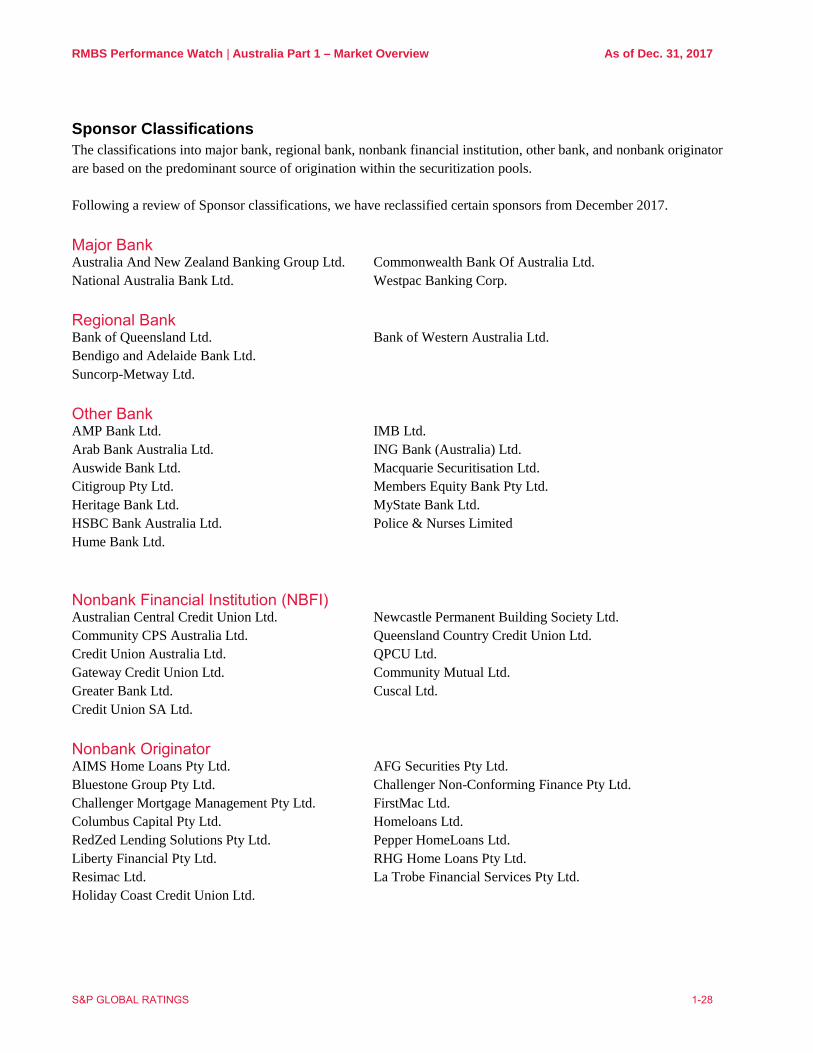
Sponsor Classifications The classifications into major bank, regional bank, nonbank financial institution, other bank, and nonbank originator are based on the predominant source of origination within the securitization pools. Following a review of Sponsor classifications, we have reclassified certain sponsors from December 2017.
Major Bank Australia And New Zealand Banking Group Ltd. Commonwealth Bank Of Australia Ltd. National Australia Bank Ltd. Westpac Banking Corp.
Regional Bank Bank of Queensland Ltd. Bank of Western Australia Ltd. Bendigo and Adelaide Bank Ltd. Suncorp-Metway Ltd.
Other Bank AMP Bank Ltd. IMB Ltd. Arab Bank Australia Ltd. ING Bank (Australia) Ltd. Auswide Bank Ltd. Macquarie Securitisation Ltd. Citigroup Pty Ltd. Members Equity Bank Pty Ltd. Heritage Bank Ltd. MyState Bank Ltd. HSBC Bank Australia Ltd. Police & Nurses Limited Hume Bank Ltd.
Nonbank Financial Institution (NBFI) Australian Central Credit Union Ltd. Newcastle Permanent Building Society Ltd. Community CPS Australia Ltd. Queensland Country Credit Union Ltd. Credit Union Australia Ltd. QPCU Ltd. Gateway Credit Union Ltd. Community Mutual Ltd. Greater Bank Ltd. Cuscal Ltd. Credit Union SA Ltd.
Nonbank Originator AIMS Home Loans Pty Ltd. AFG Securities Pty Ltd. Bluestone Group Pty Ltd. Challenger Non-Conforming Finance Pty Ltd. Challenger Mortgage Management Pty Ltd. FirstMac Ltd. Columbus Capital Pty Ltd. Homeloans Ltd. RedZed Lending Solutions Pty Ltd. Pepper HomeLoans Ltd. Liberty Financial Pty Ltd. RHG Home Loans Pty Ltd. Resimac Ltd. La Trobe Financial Services Pty Ltd. Holiday Coast Credit Union Ltd.
RMBS Performance Watch | Australia Part 1 – Market Overview As of Dec. 31, 2017
S&P GLOBAL RATINGS 1-29
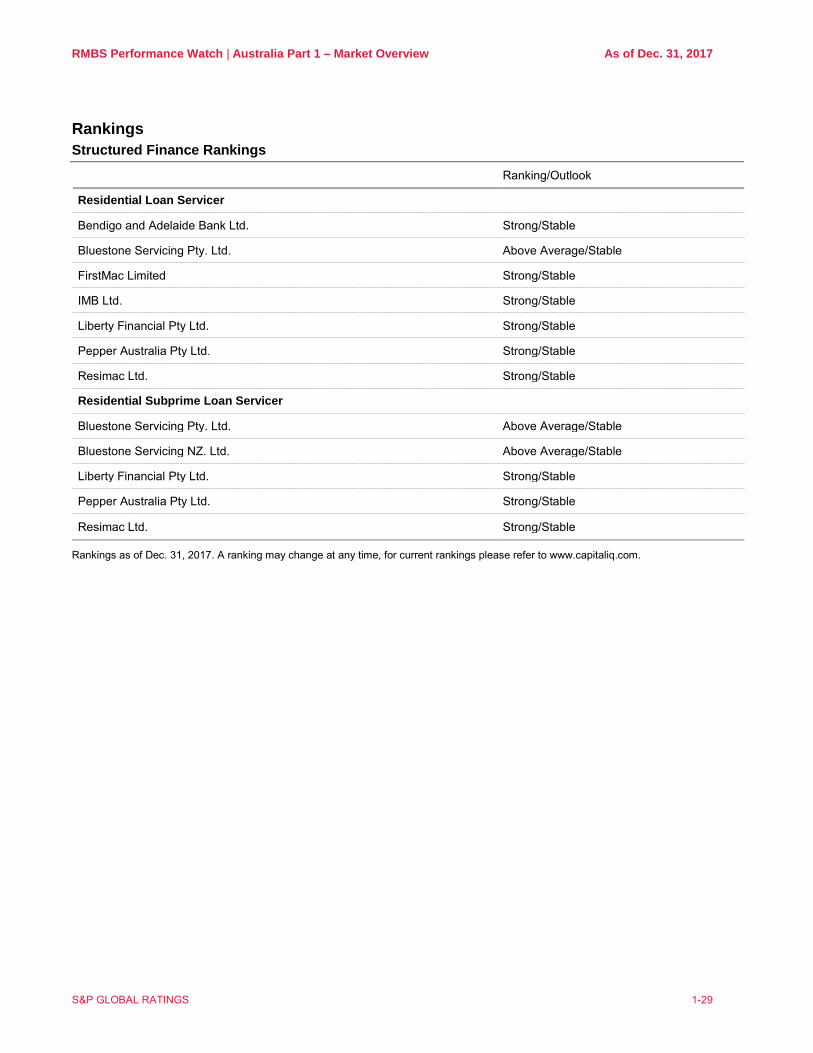
Rankings Structured Finance Rankings
Ranking/Outlook
Residential Loan Servicer
Bendigo and Adelaide Bank Ltd. Strong/Stable
Bluestone Servicing Pty. Ltd. Above Average/Stable
FirstMac Limited Strong/Stable
IMB Ltd. Strong/Stable
Liberty Financial Pty Ltd. Strong/Stable
Pepper Australia Pty Ltd. Strong/Stable
Resimac Ltd. Strong/Stable
Residential Subprime Loan Servicer
Bluestone Servicing Pty. Ltd. Above Average/Stable
Bluestone Servicing NZ. Ltd. Above Average/Stable
Liberty Financial Pty Ltd. Strong/Stable
Pepper Australia Pty Ltd. Strong/Stable
Resimac Ltd. Strong/Stable
Rankings as of Dec. 31, 2017. A ranking may change at any time, for current rankings please refer to www.capitaliq.com.
RMBS Performance Watch | Australia Part 1 – Market Overview As of Dec. 31, 2017
S&P GLOBAL RATINGS 1-30
Descriptions
About this Publication Australian RMBS Performance Watch is a quarterly review of the performance of residential mortgage pools that collateralize Australian term securities. If you or your colleagues would like to receive a copy of Australian RMBS Performance Watch, please visit www.sfsurveillance.com.au or contact S&P Global Ratings Client Services on (61) 1300-732-553 or by e-mail at: [email protected].
Comparative Pool Characteristics We have calculated comparative pool statistics using outstanding loan balances. All data are provided as of or as near as possible to December 31, 2017, unless otherwise stated.
Data Collection To allow the timely delivery of information to the market, we do not include in the Australian RMBS Performance Watch statistics any data that are not received by the 15th day after the end of a quarter. Any late data will be included in updated statistics and subsequent publications.
Definitions S&P Global Ratings has compiled the information in this publication using information received from the issuer, manager, or servicer of each program. S&P Global Ratings has endeavoured to provide data on a basis that is comparable among programs. However, users of the information in this publication should exercise caution because there may be inconsistencies in the way that each of the programs is reported to S&P Global Ratings. The descriptions below highlight how S&P Global Ratings interprets general terminology; they are not intended to be industry-standard definitions.
10 Worst-Performing Postcodes For the purpose of this analysis, we have excluded postcodes with fewer than 250 loans. In line with our RMBS Rating Methodology and Assumptions, the archetypical pool, which underpins our credit analysis, is comprised of at least 250 consolidated Australian residential mortgage loans because our analysis suggests that a pool of this size is statistically valid. Our parameters for the 10 worst-performing postcodes therefore are consistent with this assumption.
Annualized Quarterly Prepayment Rate We calculate the annualized QPR by compounding the rate using the following formula: 1-(1-QPR)4
Annualized Quarterly Repayment Rate We calculate the annualized QRR by compounding the rate using the following formula: 1-(1-QRR)4
Australian Prime Full-Doc SPIN The Australian prime full-doc SPIN is a measure of arrears on full-doc residential mortgage loans underlying Australian prime RMBS transactions, both publicly and privately rated by S&P Global Ratings.
Australian Prime Low-Doc SPIN The Australian prime low-doc SPIN is a measure of arrears on low-doc residential mortgage loans underlying Australian prime RMBS transactions, both publicly and privately rated by S&P Global Ratings.
Australian Prime SPIN The Australian prime SPIN is a measure of arrears on residential mortgage loans underlying Australian prime RMBS transactions, both publicly and privately rated by S&P Global Ratings.
RMBS Performance Watch | Australia Part 1 – Market Overview As of Dec. 31, 2017
S&P GLOBAL RATINGS 1-31
Australian Prime SPPI The Australian prime SPPI is a measure of prepayment rates on residential mortgage loans underlying Australian prime RMBS transactions, both publicly and privately rated by S&P Global Ratings.
Australian Subprime SPIN The Australian subprime SPIN is a measure of arrears on residential mortgage loans underlying Australian subprime RMBS transactions, both publicly and privately rated by S&P Global Ratings.
Australian Subprime SPPI The Australian subprime SPPI is a measure of prepayment rates on residential mortgage loans underlying Australian subprime RMBS transactions, both publicly and privately rated by S&P Global Ratings.
Cumulative Gross Losses Cumulative gross losses refer to the aggregate amount of losses in a pool of mortgage loans after recognizing the proceeds from the sale of the underlying security properties, but before including other loss support, such as claims paid under lenders' mortgage insurance policies or the application of excess spread. The cumulative gross loss percentage is expressed as a percentage of Australian dollar equivalent note balance, including further issuances from the same transaction at a later date. Warehouses are excluded from this calculation.
Domestic, Global, And Euro We determine the categorization of an RMBS transaction by market by the legislation under which the notes are offered and the stock exchanges on which the notes are listed. Transactions with a securities and exchange commission (SEC)-registered or 144A tranche are classified as “global.” Transactions that are not global, but which are Euroclear- and/or Clearstream-settled and have a tranche listed on a European exchange, are classified as “euro.” All other transactions generally will be classified as “domestic.”
Full–Documentation Loans A full-doc loan is a loan for which the borrower's income has been fully verified by the lender through reference to relevant source documents, such as payslips or tax returns.
Lenders' Mortgage Insurance (LMI) The lenders' mortgage insurers distribution graphs display only those mortgage insurers that provide mortgage insurance for 1% or more of the pool. For a more detailed breakdown of mortgage insurer distribution, refer to the Lenders' Mortgage Insurers Distribution table in part 2 of this publication. The mortgage insurer short-names used in the pie charts are as listed in the table below.
RMBS Performance Watch | Australia Part 1 – Market Overview As of Dec. 31, 2017
S&P GLOBAL RATINGS 1-32
Mortgage Insurer Short-Names Used In Charts
LMI Short Name Public Rating
HLIC (guaranteed by Commonwealth of Australia) HLIC AAA/Negative
Genworth Financial Mortgage Insurance Pty Ltd. GFM Ins. A+/Negative
QBE Lenders Mortgage Insurance Ltd.* QBE A+/Stable
Westpac Lenders Mortgage Insurance Ltd. § WLMI AA-/Negative
Prime Insurance Group Ltd. PIGL NR**
*QBE Lenders Mortgage Insurance was formerly known as PMI Mortgage Insurance Ltd. **NR--Not rated. § Westpac Lenders Mortgage Insurance Ltd includes the former St George Insurance Australia Pty Ltd. Ratings at August , 2017. A rating may change at any time, for current ratings please refer to www.standardandpoors.com.au.
Low-Documentation Loans A low-doc loan is a loan for which the borrower's income has not been fully verified by the lender. Low-doc loans are often referred to by a variety of terms, including self-certified and stated income loans.
Missed-Payments Basis The measurement of arrears on a missed-payments basis means that a loan is in arrears when a scheduled payment is missed, despite the fact that the borrower may be ahead of the scheduled payment curve.
Mortgage Arrears Data The mortgage arrears data depict the proportionate value of loans 31-60 days, 61-90 days, and 90+ days in arrears. We calculate the percentages using the outstanding balance of loans in arrears as a proportion of the aggregate outstanding balance of total loans at the end of each month. We note the reporting method used by issuers in reporting arrears (scheduled-balance basis or missed-payments basis) on the loan pool arrears performance graph for each transaction. Non-Conforming Loans Non-Conforming loans are residential mortgage loans that would not typically qualify for a loan from a traditional prime lender and are generally not eligible to be covered by lenders' mortgage insurance from a nonassociated mortgage insurer. Non-Conforming loans may include LoDoc loans and subprime loans.
Note Balances All note balances are based on invested amounts. The term “note” refers to a note, bond, security, or any other instrument issued by the issuer.
Prime Prime loans are residential mortgage loans that generally would be made by traditional residential-mortgage lenders in the Australian market and usually would be eligible to be covered by a primary lenders' mortgage insurance policy from a nonassociated and rated mortgage insurer. Prime loans are usually to borrowers with clean credit histories, though some pools may include a small percentage of loans of a minor nonconforming nature. Prime loans can include low-documentation (low-doc) loans.
Quarterly Prepayment Rate We calculate the QPR using the following formula:
U – R – F
O + (S+P)2 – I
RMBS Performance Watch | Australia Part 1 – Market Overview As of Dec. 31, 2017
S&P GLOBAL RATINGS 1-33
Where: U = unscheduled principal repayments R = redraws F = further advances O = mortgage pool balance at the beginning of the quarter S = loans added during a substitution period P = loans added during a prefunding period I = capitalized interest
Quarterly Repayment Rate We calculate the quarterly repayment rate (QRR) using the following formula:
(Sc+U) – R – F
O + (S+P)2 – I
Where: Sc = scheduled principal repayments U = unscheduled principal repayments R = redraws F = further advances O = mortgage pool balance at the start of the quarter S = loans added during a substitution period P = loans added during a prefunding period I = capitalized interest
Scheduled-Balance Basis The measurement of arrears on a scheduled-balance basis means that a loan is in arrears when the current loan balance less the scheduled loan balance is a positive number.
Sponsor The sponsor is the party that has the primary commercial or beneficial interest in the residential mortgage-backed securities (RMBS) transaction.
S&P Global Ratings Performance Index S&P Global Ratings Performance Index (SPIN) is a measure of arrears on residential mortgage loans underlying RMBS transactions, both publicly and privately rated by S&P Global Ratings. We calculate the SPIN for Australian prime and subprime asset classes, as well as Australian prime low-doc and prime full-doc loans. It is the weighted-average balance of loans in arrears in each of the 31-60 days, 61-90 days, and 90+ day categories. We calculate the SPIN on a monthly basis from information provided to us for each transaction.
S&P Global Ratings Prepayment Index S&P Global Ratings Prepayment Index (SPPI) is a measure of prepayment rates on residential mortgage loans underlying RMBS transactions, both publicly and privately rated by S&P Global Ratings. We calculate the SPPI for Australian prime and subprime loans. It is the weighted-average of the annualized quarterly prepayment rates (QPRs) across the asset subclass. We calculate the SPPI monthly from information provided to us for each transaction.
Subprime Subprime loans are loans to borrowers with adverse credit histories.

RMBS Performance Watch | Australia Part 1 – Market Overview As of Dec. 31, 2017
S&P GLOBAL RATINGS 1-34
Total Current Loan Balance The total current loan balance (TCLB) is the outstanding dollar amount of the underlying loans as of the report date.
RMBS Performance Watch | Australia Part 1 – Market Overview As of Dec. 31, 2017
S&P GLOBAL RATINGS 1-35
Contacts
Key RMBS Analytical Contacts Kate Thomson, Lead Analytical Manager | Melbourne | + 61 3 9631 2104 | [email protected] Narelle Coneybeare, Surveillance Analytical Manager | Sydney | + 61 2 9255 9838 | [email protected] Luke Elder, New Issuance Analytical Manager | Melbourne | + 61 3 9631 2168 | [email protected]
Analytical Team Erin Kitson | Melbourne | + 61 3 9631 2166 | [email protected] Alisha Treacy | Melbourne | + 61 3 9631 2182 | [email protected] Calvin Leong | Melbourne | + 61 3 9631 2142 | [email protected] Fiona Otway | Melbourne | + 61 3 9631 2060 | [email protected] Elizabeth Steenson | Melbourne | + 61 3 9631 2162 | [email protected] Mei Lee Da Silva | Melbourne | + 61 3 9631 2053 | [email protected] Paul Prajogo | Melbourne | + 61 3 9631 2069 | [email protected] Justin Rockman | Melbourne | + 61 3 9631 2183 | [email protected] Catherine Chooi | Melbourne | + 61 3 9631 2135 | [email protected] Mark Symes | Melbourne | + 61 3 9631 2051| mark.symes @spglobal.com Leslie Wong | Melbourne | + 61 3 9631 2932| leslie.wong @spglobal.com James Page | Melbourne | + 61 3 9631 2013| [email protected]
RMBS Performance Watch | Australia Part 1 – Market Overview As of Dec. 31, 2017
S&P GLOBAL RATINGS 1-36
Under S&P Global Ratings' policies, only a Rating Committee can determine a Credit Rating Action (including a Credit Rating change, affirmation or withdrawal, Rating Outlook change, or CreditWatch action). This commentary and its subject matter have not been the subject of a Rating Committee action and should not be interpreted as a change to, or affirmation of, a Credit Rating or Rating Outlook. No content (including ratings, credit-related analyses and data, valuations, model, software or other application or output therefrom) or any part thereof (Content) may be modified, reverse engineered, reproduced or distributed in any form by any means, or stored in a database or retrieval system, without the prior written permission of Standard & Poor's Financial Services LLC or its affiliates (collectively, S&P). The Content shall not be used for any unlawful or unauthorized purposes. S&P and any third-party providers, as well as their directors, officers, shareholders, employees or agents (collectively S&P Parties) do not guarantee the accuracy, completeness, timeliness or availability of the Content. S&P Parties are not responsible for any errors or omissions (negligent or otherwise), regardless of the cause, for the results obtained from the use of the Content, or for the security or maintenance of any data input by the user. The Content is provided on an “as is” basis. S&P PARTIES DISCLAIM ANY AND ALL EXPRESS OR IMPLIED WARRANTIES, INCLUDING, BUT NOT LIMITED TO, ANY WARRANTIES OF MERCHANTABILITY OR FITNESS FOR A PARTICULAR PURPOSE OR USE, FREEDOM FROM BUGS, SOFTWARE ERRORS OR DEFECTS, THAT THE CONTENT'S FUNCTIONING WILL BE UNINTERRUPTED OR THAT THE CONTENT WILL OPERATE WITH ANY SOFTWARE OR HARDWARE CONFIGURATION. In no event shall S&P Parties be liable to any party for any direct, indirect, incidental, exemplary, compensatory, punitive, special or consequential damages, costs, expenses, legal fees, or losses (including, without limitation, lost income or lost profits and opportunity costs or losses caused by negligence) in connection with any use of the Content even if advised of the possibility of such damages. Credit-related and other analyses, including ratings, and statements in the Content are statements of opinion as of the date they are expressed and not statements of fact. S&P's opinions, analyses and rating acknowledgment decisions (described below) are not recommendations to purchase, hold, or sell any securities or to make any investment decisions, and do not address the suitability of any security. S&P assumes no obligation to update the Content following publication in any form or format. The Content should not be relied on and is not a substitute for the skill, judgment and experience of the user, its management, employees, advisors and/or clients when making investment and other business decisions. S&P does not act as a fiduciary or an investment advisor except where registered as such. While S&P has obtained information from sources it believes to be reliable, S&P does not perform an audit and undertakes no duty of due diligence or independent verification of any information it receives. To the extent that regulatory authorities allow a rating agency to acknowledge in one jurisdiction a rating issued in another jurisdiction for certain regulatory purposes, S&P reserves the right to assign, withdraw or suspend such acknowledgement at any time and in its sole discretion. S&P Parties disclaim any duty whatsoever arising out of the assignment, withdrawal or suspension of an acknowledgment as well as any liability for any damage alleged to have been suffered on account thereof. S&P keeps certain activities of its business units separate from each other in order to preserve the independence and objectivity of their respective activities. As a result, certain business units of S&P may have information that is not available to other S&P business units. S&P has established policies and procedures to maintain the confidentiality of certain non-public information received in connection with each analytical process. S&P may receive compensation for its ratings and certain analyses, normally from issuers or underwriters of securities or from obligors. S&P reserves the right to disseminate its opinions and analyses. S&P's public ratings and analyses are made available on its Web sites, www.standardandpoors.com (free of charge), and www.ratingsdirect.com and www.globalcreditportal.com (subscription), and may be distributed through other means, including via S&P publications and third-party redistributors. Additional information about our ratings fees is available at www.standardandpoors.com/usratingsfees. Permissions: To reprint, translate, or quote S&P Global Ratings' publications, contact: Client Services, 120 Collins Street, Melbourne, Vic 3000 Australia, (61) 1300-792-553. This report and the ratings contained within it are based on published information as of December 31, 2017. Subsequent information may result in the assignment of ratings that differ from the ratings published here. Please call Standard & Poor's Client Services at (61) 1300-792-553 for the most recent rating assigned. For Australian Users— S&P Global Ratings Australia Pty Ltd holds Australian financial services licence number 337565 under the Corporations Act 2001. Standard & Poor's credit ratings and related research are not intended for and must not be distributed to any person in Australia other than a wholesale client (as defined in Chapter 7 of the Corporations Act). S&P Global Ratings 17g-7 Disclosure Report SEC Rule 17g-7 requires an NRSRO, for any report accompanying a credit rating relating to an asset-backed security as defined in the Rule, to include a description of the representations, warranties and enforcement mechanisms available to investors and a description of how they differ from the representations, warranties and enforcement mechanisms in issuances of similar securities. The Rule applies to in-scope securities initially rated (including preliminary ratings) on or after Sept. 26, 2011. Copyright © 2018 by Standard & Poor's Financial Services LLC. All rights reserved. STANDARD & POOR'S, S&P and RATINGSDIRECT are registered trademarks of Standard & Poor's Financial Services LLC. Reproduction in whole or in part prohibited except by permission.

www.SPRatings.com.au