Embed Size (px)
Citation preview
1
Annual Report 2012-13
ANNUAL REPORT
2012-13
RMSA
RASHTRIYA MADHYAMIK SHIKSHA ABHIYAN,STATE PROJECT DIRECTORATE, DPI CAMPUS,
COLLEGE ROAD, CHENNAI – 600 006TAMIL NADU
2
Annual Report 2012-13

3
Annual Report 2012-13CONTENT
1. Certificate of Registration of Societies 5
2. Foreword 2
3. Introduction 4
4. Geophysical features and Administrative divisions 6
5. Population – Demographic profile at a glance 7
6. Growth Rate - Proportion of population - Sex Ratio -Literacy Rate 8
7. Figures at a Glance – Tamil Nadu - Number of Districts / 9CD Blocks, Urban Agglomerations, Revenue Villages,Habitations / Hamlets
8. Economy on over view 10
9. Snapshots of key indicators, Tamil Nadu 2011 11
10. Human Development Index and Education Development Index 11
11. Economic Prosperity 12
12. Secondary Education: At a Glance 12
13. Enrolment (Secondary level) 14
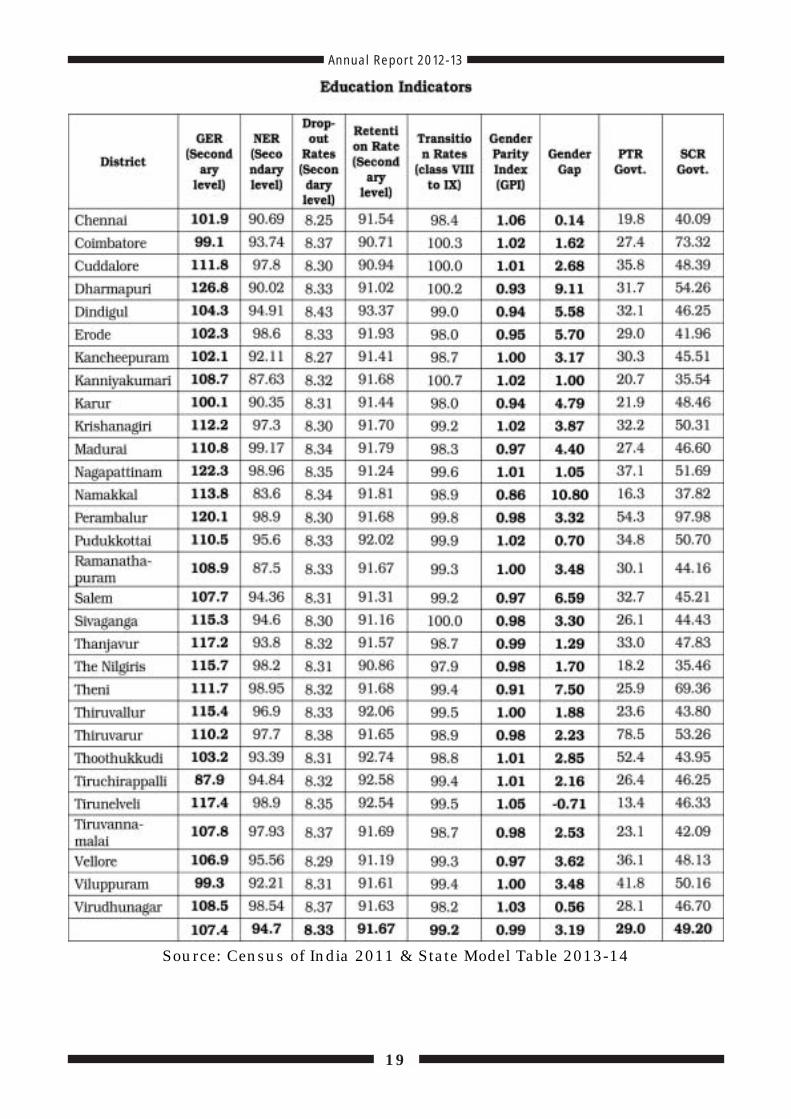
14. Drop-out Rate (Secondary level) Transition Rate:(Class VIII to IX) Education Indicators 14
15. Rashtriya Madhyamik Shiksha AbhiyanVision –Objectives – Target Group 16
16. Financial Pattern - Approach and Strategy 16
17. Access – Quality -Equity 17
18. Institutional Reforms & Strengthening of Resource Institutions 17
Chapter – 1
Chapter – 2
Chapter – 3
Particulars Sl. No.
PageNo.
4
Annual Report 2012-13
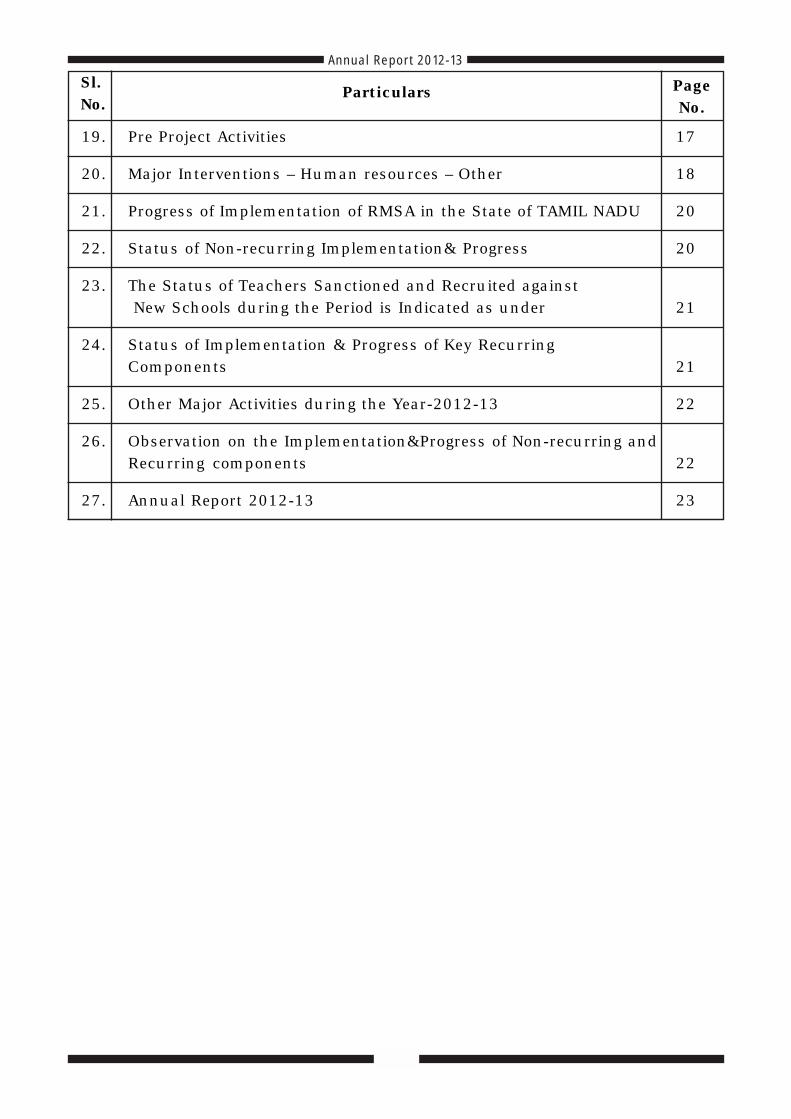
19. Pre Project Activities 17
20. Major Interventions – Human resources – Other 18
21. Progress of Implementation of RMSA in the State of TAMIL NADU 20
22. Status of Non-recurring Implementation& Progress 20
23. The Status of Teachers Sanctioned and Recruited against New Schools during the Period is Indicated as under 21
24. Status of Implementation & Progress of Key RecurringComponents 21
25. Other Major Activities during the Year-2012-13 22
26. Observation on the Implementation&Progress of Non-recurring andRecurring components 22
27. Annual Report 2012-13 23
Sl. No.
Particulars PageNo.

5
Annual Report 2012-13
Certificate of Registration of Societies

6
Annual Report 2012-13

7
Annual Report 2012-13Foreword
Tamil Nadu School Education Society, is bringing out its Annual Report ofRashtriya Madhyamik Shiksha Abhiyan for the year 2012-13
Rashtriya Madhyamik Shiksha Abhiyan is being implemented in the State forthe secondary level classes IX & X w.e.f. the academic year 2009-10 through theexisting Tamil Nadu School Education Society and administrative set up of SarvaShiksha Abhiyan as per the guidelines issued by the Govt. of India. The project willbe implemented on 75:25 sharing pattern of Centre and State respectively in theeleventh five year plan 2007-12 and 50 : 50 sharing pattern from the twelfth five yearplan 2012-17.
In order to meet the challenge of Universalisation of Secondary Education(USE), guiding principles are; Universal Access, Equality and Social Justice, Relevanceand Development and Curricular and Structural Aspects. Universalisation of SecondaryEducation gives opportunity, to move towards equity.
The Programme aims at Universalisation of Secondary Education by 2017 andUniversalisation of Retention by 2020. The vision for Secondary education is to makegood quality education available, accessible and affordable.
Towards improving quality in secondary education:
Model Schools:
1. The proposal has been sent to the Government regarding set up 26 ModelSchools and creating 17 teaching post and 7 non teaching post in each of theModel Schools in Tamil Nadu
2. The State Government issued another G.O. 1(D) (Ms) No. 173, dt.04.06.2012to Construct 26 Model Schools with the Tamil Nadu Police Housing Corporation.
3. On 17.11.2011 Project Approval Board for Recurring Grant for 18 Model Schoolsand sanctioned 12.11 Crores.
Girls Hostels
1. The Government of India have launched a new centrally sponsored schemecalled scheme for “construction and running of Girls Hostels” for students ofSecondary and Higher Secondary schools.
2. The main objective is to bring girl children to school and to retain them withboarding and lodging facilities in Educationally Backward Blocks
3. The beneficiaries will be girl children of 14-18 age group in standards IX-XIIclass.
4. 44 Girls Hostels will be established in 44 EBBs of Tamil Nadu. Out of which 34hostels in plain area and 10 in hilly area will be established.
5. The Expenditure on this project will be shared between the Central and StateGovernment in the ratio of 90:10.
6. Each hostel is allotted with a non-recurring grant of Rs. 42.50 lakh and recurringgrant of Rs. 14.27 lakh.

8
Annual Report 2012-13To bridge the residual gaps in the equal distribution of education facilities for
secondary students, school mapping exercises is being carried out by the SPO withactive involvement of the school education department. The state prepared the modelperspective plan framework with the assistance from DFID and drafted the detailedperspective plan and Annual Work plan and Budget for the year 2012-13.
As per RMSA framework guidelines, three-tier monitoring committees wereformed and made functional in all school heads. To further strengthen this programmeof Universalisation of Secondary Education in the State, district level and educationaldistrict level office structure was formed and all the necessary planning processeswere duly carried out for implementation of the gross roots level. SCHOOLIMPROVMENT PLAN, COHORT, TIME OF TASK, ACHIEVEMENT TEST are theimportant tasks carried out for assessing the needs for the plan. All the teachers atthe secondary level were given State level training.
The annual report of Rashtriya Madhyamik Shiksha Abhiyan as prepared bythe TNSES highlights the achievements of RMSA during the year 2012-13 while atthe same time bringing areas of concern also so that these could be remedied duringthe subsequent years.
D. SABITHA, IAS Principal Secretary (Education)
-Cum- Chairman TNSES, Chennai, Tamil Nadu.
9
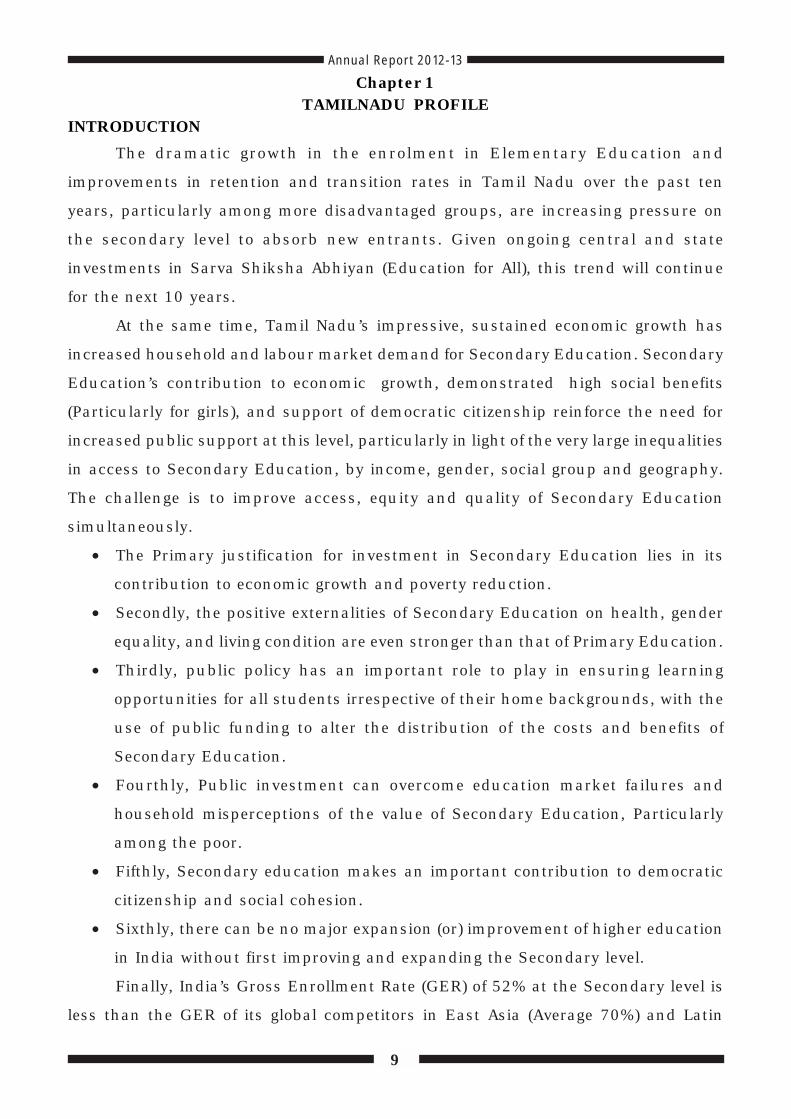
Annual Report 2012-13Chapter 1
TAMILNADU PROFILEINTRODUCTION
The dramatic growth in the enrolment in Elementary Education and
improvements in retention and transition rates in Tamil Nadu over the past ten
years, particularly among more disadvantaged groups, are increasing pressure on
the secondary level to absorb new entrants. Given ongoing central and state
investments in Sarva Shiksha Abhiyan (Education for All), this trend will continue
for the next 10 years.
At the same time, Tamil Nadu’s impressive, sustained economic growth has
increased household and labour market demand for Secondary Education. Secondary
Education’s contribution to economic growth, demonstrated high social benefits
(Particularly for girls), and support of democratic citizenship reinforce the need for
increased public support at this level, particularly in light of the very large inequalities
in access to Secondary Education, by income, gender, social group and geography.
The challenge is to improve access, equity and quality of Secondary Education
simultaneously.
• The Primary justification for investment in Secondary Education lies in its
contribution to economic growth and poverty reduction.
• Secondly, the positive externalities of Secondary Education on health, gender
equality, and living condition are even stronger than that of Primary Education.
• Thirdly, public policy has an important role to play in ensuring learning
opportunities for all students irrespective of their home backgrounds, with the
use of public funding to alter the distribution of the costs and benefits of
Secondary Education.
• Fourthly, Public investment can overcome education market failures and
household misperceptions of the value of Secondary Education, Particularly
among the poor.
• Fifthly, Secondary education makes an important contribution to democratic
citizenship and social cohesion.
• Sixthly, there can be no major expansion (or) improvement of higher education
in India without first improving and expanding the Secondary level.
Finally, India’s Gross Enrollment Rate (GER) of 52% at the Secondary level is
less than the GER of its global competitors in East Asia (Average 70%) and Latin

10
Annual Report 2012-13
America (average 82%). India is underperforming at the Secondary level but given its
current (and projected) GDP per capita, She has scope for significant improvement
in providing access to Quality Secondary Education. However, India needs to increase
public investment in Secondary Education to remain globally competitive. Based on
the “CABE” guidelines, the Tamil Nadu School Education Department defined the
following road map of reforms for Universalisation Secondary Education.
Tamil Nadu envisages providing Universal Elementary and Secondary Education for
all school-age children. The Government of Tamil Nadu, with a record allotment of
Rs. 14,552.82 crore, the highest allocation for any Department, in its Budget 2012-
13 ensured this noble vision. In the “Vision Tamil Nadu 2023”, the Hon’ble Chief
Minister has stated, “Tamil Nadu will provide the best infrastructure services in
India in terms of Universal Access to Education”. A Roadmap is on the anvil to
make Tamil Nadu the Numero-Uno State in the country by providing,
1. Access to schools,
2. Qualified Teachers,
3. Quality Education, and
4. Adequate Infrastructure
The Department of School Education, with 7 Directorates, 2 Societies [SSA &
RMSA] formed exclusively for the promotion of Elementary and Secondary Education,
Teacher Recruitment Board and Tamil Nadu Text Book Corporation have been striving
hard to achieve the goals of Universalisation of Elementary Education.
Further, to ensure the Vision, the State has enhanced the budgetary provision
for School Education in 2012-13 to Rs.14552.82 Crore, which is 9.15% higher than
that of 2011-12. (Rs. 13333.66 Crore)
The real growth of the State is reflected only through the well-being of the
people. The traditional indicator of economy, GSDP, does not reveal the actual
condition of human well-being. Any indicator reflecting the development not only
illustrates the present situation but also creates an environment to frame future
policies. Thus, the concept of human development focuses on the people who form
the society and human development must be the major objective of planning.
The Vision for Tamil Nadu for 2023 is to become the India’s most prosperous
and progressive State with no poverty, and where its people enjoy all the basic service

11
Annual Report 2012-13
of a modern society, and live in harmonious engagement with the environment and
with the rest of the world.
1.1 Geophysical features and Administrative divisions
Tamil Nadu, the Southern-most State of India, nestles in the Indian Peninsula
between the Bay of Bengal in the East, the Indian Ocean in the South and the
Western Ghats and the Arabian Sea on the West. In the North and West, the State
adjoins Karnataka, Andhra Pradesh and Kerala.
Tamil Nadu shows rich variety and diversity in its geography and climate with
coastal plains co-existing with tropical rain forests, river valleys and hill stations. The
Eastern extremity of the State is Point Claimer situated 80020’E Longitude while the
Western tip is the Mudumalai Sanctuary at 71015’E Longitude. The Northern and
Southern extremities are defined by Pulicat Lake (13035’N Latitude) and Cape Comorin
in Kanyakumari (805’N Latitude).
Traditionally, the State has been divided in to five physiographic divisions Viz.Kurinji (Mountain Area), Mullai (forest), Palai (Arid Zone), Marudham (Fertile Region)and Neidhal (Coastal Area). Apart from the Western Ghats that separate Tamil Nadufrom Kerala, the State has another Mountain chain, the Eastern Ghats that comprisemainly low rocky fills.
The main river is the 760 km long Cauvery, which flows along the entire breadth
of Tamil Nadu. Other Major rivers are the Palar, the Pennar, the Vaigai and the
Tamiraparani.
Administrative Divisions
In Tamil Nadu, there are 32 districts, 215-sub districts, 1097 towns and 15,979
villages as per the census 2011. The corresponding figures of census 2001 were 30
districts, 201 sub districts, 832 towns and 16,317 villages. There is an increase of 2
districts, 14 sub districts, and 265 Towns (All census Towns). In respect of villages,
the number has come down from 16317 to 15979. Of 16,317 revenue villages, 295
revenue villages fall under the newly categorized 217 census towns, 96 villages were
accommodated in 67 revenue villages (which includes 6 declassified CT) 14 villages
are identified as out-growths in 2011 census (16317-295-96-14+67=15979).
Population
The total population of Tamilnadu is 7, 21, 38,958 as per (Provisional) 2011
census. Of this, rural population stands at 37.19 million and the urban population
34.95 million. In absolute numbers, the rural population has increased by 2.27
million and the urban population increased by 7.47 million in the last decade.

12
Annual Report 2012-13
Villupuram District has the largest rural population of 2.95 million (7.94 % of the
State rural population) where as Chennai has the highest urban population of 4.68
million (13.39% of the States urban population).
Demographic profile at a glance
Growth Rate
The growth rate of population for Tamil Nadu in the last decade was 15.60%.
The growth rate of population in rural and urban areas was 6.49% and 27.16%
respectively. Villupuram District (16.58%) exhibited the highest growth rate in urban
population 65.33%.
Proportion of population
In percentage terms, the rural population formed 51.55% of the total population
with the urban population constituting 48.45% (increase of 4.41%). Ariyalur (88.88%)
has the largest proportion of rural population, while Kanchipuram (82.47%) has the
highest proportion of urban population, apart from Chennai, which is 100% urban
Sex Ratio
The sex Ratio in the State, which was 987 in 2001, has risen by 8 points to
995 in 2011. The increase in rural areas has been 1 point from 992 to 993. The
Nilgiris has the highest Sex Ratio in total (1041), rural (1055) and in respect of
urban sex Ratio. Thanjavur district stands next (1038). Salem (934) and
Ramanathapuram (960) show the lowest Sex Ratio in the State, in respect of rural
and urban areas respectively.
Literacy Rate
Population ( in Crore)
Gender IndiaTamilNadu
All
Male
Female
102.70
49.57
6.24
53.13 3.14
3.10
SC Population (in Crore) All 16.66 1.19ST Population (in Crore) All 8.43 0.065
Growth Rate All 21.34 11.19Sex Ratio (ALL) All 933 987
Literacy Rate(ALL)
AllMale
Female
65.3875.8554.16
73.4782.3364.55
Density per sq.km. 324 467
The literacy rate of the State as per the Provisional Population 2011 is 80.33.

13
Annual Report 2012-13
In the rural areas, the literacy rate is 73.80 and in urban areas, it is 87.24. The
decadal change works out to 6.88 points with 7.59 points in rural areas and 4.71
points in urban areas.
The male literacy rate which is 86.81 (Rural 82.08; urban 91.82) is higher
than the female literacy rate of 73.86 (Rural 65.52 urban 82.67). The increase in
female literacy rate is significantly higher in all areas i.e., Total (9.43 points), rural
(10.24 points), urban (6.68 points) over the decade. It is significant to note that gap
in literacy rate among males and females, has come down to 12.95 in the State. The
gap is 16.56 points in rural areas and 9.16 in urban areas.
Kanniyakumari (Rural 90.95; urban 92.40) ranks first both in rural and urban
areas, where as Dharmapuri (Rural 62.69; urban 74.23) has recorded the lowest
literacy rates both in rural and urban areas. As far as the male literacy rate is
concerned, Kanniyakumari (92.49) has recorded the highest literacy rate in rural
areas. Pudukottai & Sivaganga (94.17) have recorded the highest male literacy rural
in urban areas. Lowest male literacy rate in rural and urban areas has been recorded
in Dharmapuri (Rural 67.30; urban 78.17). Salem (56.71) has recorded the lowest
female literacy rate in rural areas, where as Dharmapuri (70.25) has recorded the
lowest female literacy rate in urban areas.
Figures at a Glance – Tamil Nadui. Number of Districts 32ii Area in Sq.km 1,30,058
iii Total PopulationPerson
7,21,38,958Male
3,61,58,871Female
3,59,80,087iv
Decadal population Growth1) Absolute Number 97,33,279
2) Percentage 15.60
v Population Density (Persons persq.km)
555
vi Sex Ratio (Females per 1000 males) 995
vii(0-6) Population Persons Males Females
1) Absolute Numbers 68,94,821 35,42,351 33,52,4702) percentage to Total population 9.56 9.80 9.32
viiiChild Sex ratio (Girls per 1000 boysin (0-6 age group)
946
ix Literates Persons Males Females
1) Absolute Numbers
2) Literacy Rate
5,24,13,116 2,83,14,595 2,40,98,521
80.33 86.81 73.86

14
Annual Report 2012-13
CD Blocks, Educational Districts, Revenue Villages and Village Panchayats
Number of Districts / CD Blocks, Urban Agglomerations, Revenue
Villages, Habitations / Hamlets
The major administrative units of the State are 39 Lok Sabha Constituencies, 234
Assembly Constituencies, 32 Districts, 10 City Corporations, 152 Municipalities,611 Town Panchayats and 12,618 Village Panchayats. Chennai (formerly knownas Madras) is the State capital. It is the fourth largest city in India and is one of thefive A-1 Metropolitan Cities of India.

15
Annual Report 2012-13Economy on over view:Tamil Nadu is the 11th largest and the seventh most populous State in India andthe second most economically important State in Southern India. Bordered by theBay of Bengal on its East, it has the second largest coastline in India with a lengthof 1076 km. It is an important centre for sea trade, and has a national high way of2002 km in length. Chennai is the capital city and a strategic point for trade andan important Port. Along with a vibrant manufacturing sector, the State leads thecountry in IT, it is the second largest software exporter, and boasts of sound healthcare services, being the chosen location for medical tourism in India.
Snapshots of key indicators, Tamil Nadu 2011
Human Development Index and Education Development Index
Human Development Index (HDI) and Education Development Index (EDI) have
been used for cross-country comparisons in overall human development and VEE
respectively. Based on the DISE data, an effort has also been made by NUEPA and
MHRD to complete an EDI, separately for Primary and Upper Primary levels of
Education and a Composite Index for the entire Elementary EducationAs far as the
composite Primary and Upper Primary education EDI amongst 21 States is concerned,
the five ranking States are Kerala (EDI 0.772) Delhi (EDI 0.757) Tamil Nadu(EDI
0.741) HP (EDI 0.707), Karnataka (EDI 0.680). Tamil Nadu, at Primary level, conceded
its second position to Kerala, and EDI at Primary level in case of Tamil Nadu is higher
in 2006-07 (0.724) than the same in 2005-06 (0.672)

16
Annual Report 2012-13
Economic Prosperity
Tamil Nadu will increase its Per capita income by 6 times from Rs. 73,278 in
2010-11 to Rs. 4, 50,000 in 2023, in line with per capita income of Upper middle
income (UMI) countries. Over the next 11 years, Tamil Nadu, given its factor
endowments and the combination of strength and opportunities, will aim to grow its
GSDP at 11% or more per annum – about 20% more than the expected Growth rate
of India’s GDP over the same period.
Given the expected increase in population of 15% over the next 11 years, the
increase in per capita income would amount to 6 times over this period. Several
countries in Asia (in particular Thailand, Malaysia and China) have grown around
7% to 10% per annum for more than 20 years during the 1980’s and later. The fast
growing States of India, namely Maharashtra and Gujarat, have grown at double-
digit rates over the past 10 years. Considering the aspiration to increase real incomes
by six times and the fact that several countries in Asia and a few States in India have
consistently grown at high rates, the aspiration for Tamil Nadu is to grow its economy
at over 11% per annum (in real terms) over the next 11 years and become a prosperous
State.

17
Annual Report 2012-13
Chapter-2
Secondary Education: At a Glance

18
Annual Report 2012-13
Source: Census of India 2011 & State Model Table 2013-14
19
Annual Report 2012-13
Source: Census of India 2011 & State Model Table 2013-14
20
Annual Report 2012-13
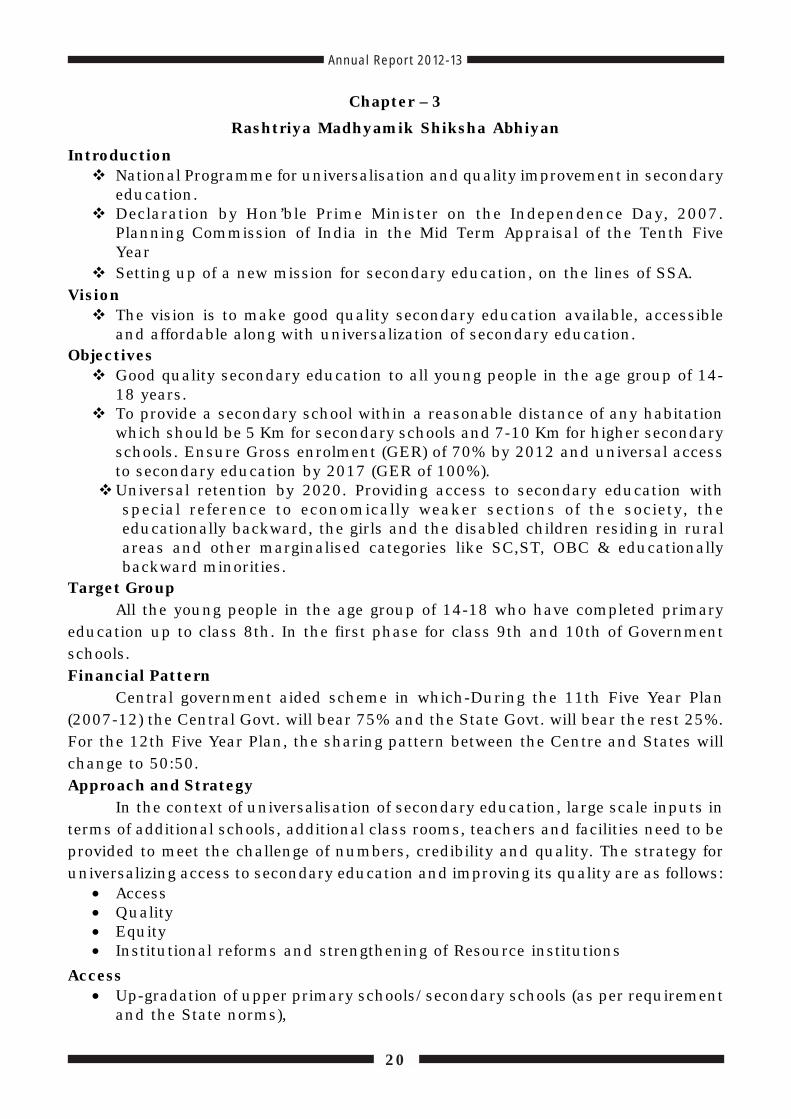
Chapter – 3
Rashtriya Madhyamik Shiksha Abhiyan
Introduction! National Programme for universalisation and quality improvement in secondary
education.! Declaration by Hon’ble Prime Minister on the Independence Day, 2007.
Planning Commission of India in the Mid Term Appraisal of the Tenth FiveYear
! Setting up of a new mission for secondary education, on the lines of SSA.Vision
! The vision is to make good quality secondary education available, accessibleand affordable along with universalization of secondary education.
Objectives! Good quality secondary education to all young people in the age group of 14-
18 years.! To provide a secondary school within a reasonable distance of any habitation
which should be 5 Km for secondary schools and 7-10 Km for higher secondaryschools. Ensure Gross enrolment (GER) of 70% by 2012 and universal accessto secondary education by 2017 (GER of 100%).
!Universal retention by 2020. Providing access to secondary education withspecial reference to economically weaker sections of the society, theeducationally backward, the girls and the disabled children residing in ruralareas and other marginalised categories like SC,ST, OBC & educationallybackward minorities.
Target GroupAll the young people in the age group of 14-18 who have completed primary
education up to class 8th. In the first phase for class 9th and 10th of Governmentschools.Financial Pattern
Central government aided scheme in which-During the 11th Five Year Plan(2007-12) the Central Govt. will bear 75% and the State Govt. will bear the rest 25%.For the 12th Five Year Plan, the sharing pattern between the Centre and States willchange to 50:50.Approach and Strategy
In the context of universalisation of secondary education, large scale inputs interms of additional schools, additional class rooms, teachers and facilities need to beprovided to meet the challenge of numbers, credibility and quality. The strategy foruniversalizing access to secondary education and improving its quality are as follows:
• Access• Quality• Equity• Institutional reforms and strengthening of Resource institutions
Access• Up-gradation of upper primary schools/secondary schools (as per requirement
and the State norms),
21
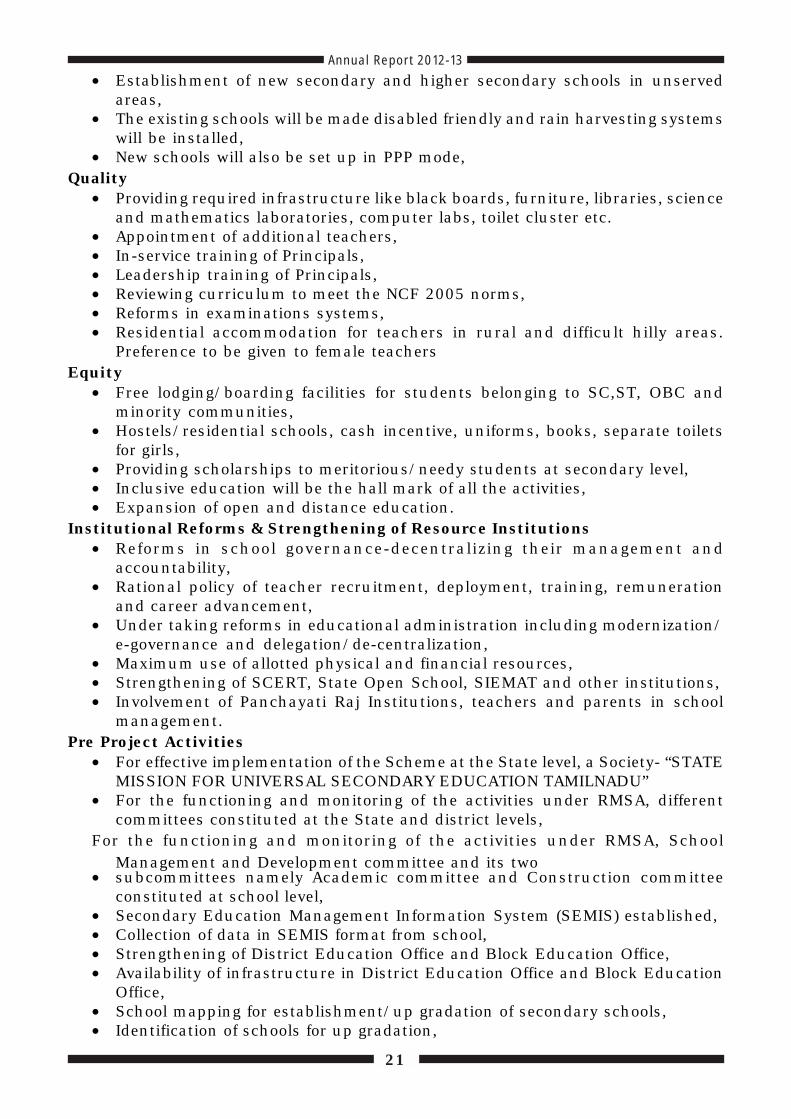
Annual Report 2012-13• Establishment of new secondary and higher secondary schools in unserved
areas,• The existing schools will be made disabled friendly and rain harvesting systems
will be installed,• New schools will also be set up in PPP mode,
Quality• Providing required infrastructure like black boards, furniture, libraries, science
and mathematics laboratories, computer labs, toilet cluster etc.• Appointment of additional teachers,• In-service training of Principals,• Leadership training of Principals,• Reviewing curriculum to meet the NCF 2005 norms,• Reforms in examinations systems,• Residential accommodation for teachers in rural and difficult hilly areas.
Preference to be given to female teachersEquity
• Free lodging/boarding facilities for students belonging to SC,ST, OBC andminority communities,
• Hostels/residential schools, cash incentive, uniforms, books, separate toiletsfor girls,
• Providing scholarships to meritorious/needy students at secondary level,• Inclusive education will be the hall mark of all the activities,• Expansion of open and distance education.
Institutional Reforms & Strengthening of Resource Institutions• Reforms in school governance-decentralizing their management and
accountability,• Rational policy of teacher recruitment, deployment, training, remuneration
and career advancement,• Under taking reforms in educational administration including modernization/
e-governance and delegation/de-centralization,• Maximum use of allotted physical and financial resources,• Strengthening of SCERT, State Open School, SIEMAT and other institutions,• Involvement of Panchayati Raj Institutions, teachers and parents in school
management.Pre Project Activities
• For effective implementation of the Scheme at the State level, a Society- “STATEMISSION FOR UNIVERSAL SECONDARY EDUCATION TAMILNADU”
• For the functioning and monitoring of the activities under RMSA, differentcommittees constituted at the State and district levels,
For the functioning and monitoring of the activities under RMSA, SchoolManagement and Development committee and its two
• subcommittees namely Academic committee and Construction committeeconstituted at school level,
• Secondary Education Management Information System (SEMIS) established,• Collection of data in SEMIS format from school,• Strengthening of District Education Office and Block Education Office,• Availability of infrastructure in District Education Office and Block Education
Office,• School mapping for establishment/up gradation of secondary schools,• Identification of schools for up gradation,

22
Annual Report 2012-13• Base line survey of schools and districts,• Formation/training of District Core Team,• Environment Building Programme for awareness of the scheme,• Separate bank accounts for RMSA in schools, districts and the State level.
Major Interventions• Physical Resources,
o Construction of class rooms,o Construction of library rooms,o Construction of science laboratories,o Construction of computer rooms,o Construction of art- craft room,o Construction of Headmaster/Principal’s room,o Construction of office room,o Separate toilet blocks and drinking water facilities for girls and boys,o Strengthening of sports fields,o Major repair as per need of the schools,o To provide residential facility for teachers in remote areas,o Arrangement of library, science laboratory and computers in schools, Arrangement of furniture in schools,o To make all schools disabled friendly,o Arrangement of educational equipment in schools.
Human resources• To provide human resources in New/Upgraded schools as per the State Norms.
o Headmaster/Principal,o Regular trained teachers,o Part time teachers,o Office assistant/Duftery,o Laboratory assistant,
• New sections in existing schools,o Arrangement of trained regular teachers as per student teacher ratio i.e. 1:1.5.
Other• Annual recurring school grant of Rs. 50,000.00 (Rs. Fifty thousand only) for
equipment/ goods of educational activity, sports, music and recurring chargesfor school development, electricity, telephone internet, water etc.,
• Annual grant for subscription of news papers & magazines, buying of booksetc.,
• Annual grant for Laboratory apparatuses,• Annual grant of Rs 25000 (Rs. Twenty five thousand only) for maintenance &
repair,• Five days residential training for all regular working teachers,• Arrangement of educational excursion tours and science exhibitions for children,• Programme for dropout/out of school children to bring back and attach them
in main stream of education,• Arrangement of different incentives for special target groups GHS viz. SC/ST/
OBC/minority/girls,• Strengthening of SCERT, State Open School , SIEMAT and other institutions,
• Establishment of guidance and counselling bureau at the State level.

23
Annual Report 2012-13
Progress of Implementation of RMSA in the State of _TAMIL NADU(Referring to the existing sources viz…AWP&B-2013-14, PAB Minutes,
Sanctioned Orders, QPR –March, 2013, State Reportand the concerned TSGunits reports)
1.Status of Non-recurring Implementation& Progress
2. The Status of Teachers Sanctioned and Recruited against New Schoolsduring the Period is Indicated as under:

24
Annual Report 2012-133. Status of Implementation & Progress of Key Recurring Components:
4. Observation on the Implementation & Progress of Non-recurring andRecurring components:
Non-recurring:The state started the 200 new school civil works (2009 sanction) and handed
over the works to SMDC and out of 200 works only 61 works completed. The major

25
Annual Report 2012-13gap between the cost estimate at present and previous sanction is the reason fordelay. Now the state decided to hand over the civil works to Public works departmentand hence the difference in cost to the SOR will be met from the state governmentfunds. Here after the civil works progress will be speeded up.
Recurring:
Except during the year 2010 and 2012 the state cannot able to meet thetargets in training but in all the project periods the state can able to achieve the100% target coverage. The reason is 2011 is the state election year and the 2012 thefund release is too late and the state has to conduct the training in the month ofJAN-FEB when the secondary schools are busy preparing for the board examinations.
*****

27
Annual Report 2012-13
AUDITOR’S REPORT2012-13


29
Annual Report 2012-13
INDEX
S No. Particulars
RMSA - Audit Report 2012-13
1. Consolidated Report
2. Recurring Grant
3. Non Recurring Grant
4. Preparatory Grant


31
Annual Report 2012-13
INDEX
S No. Particulars
RMSA - Consolidated Account 2012-13
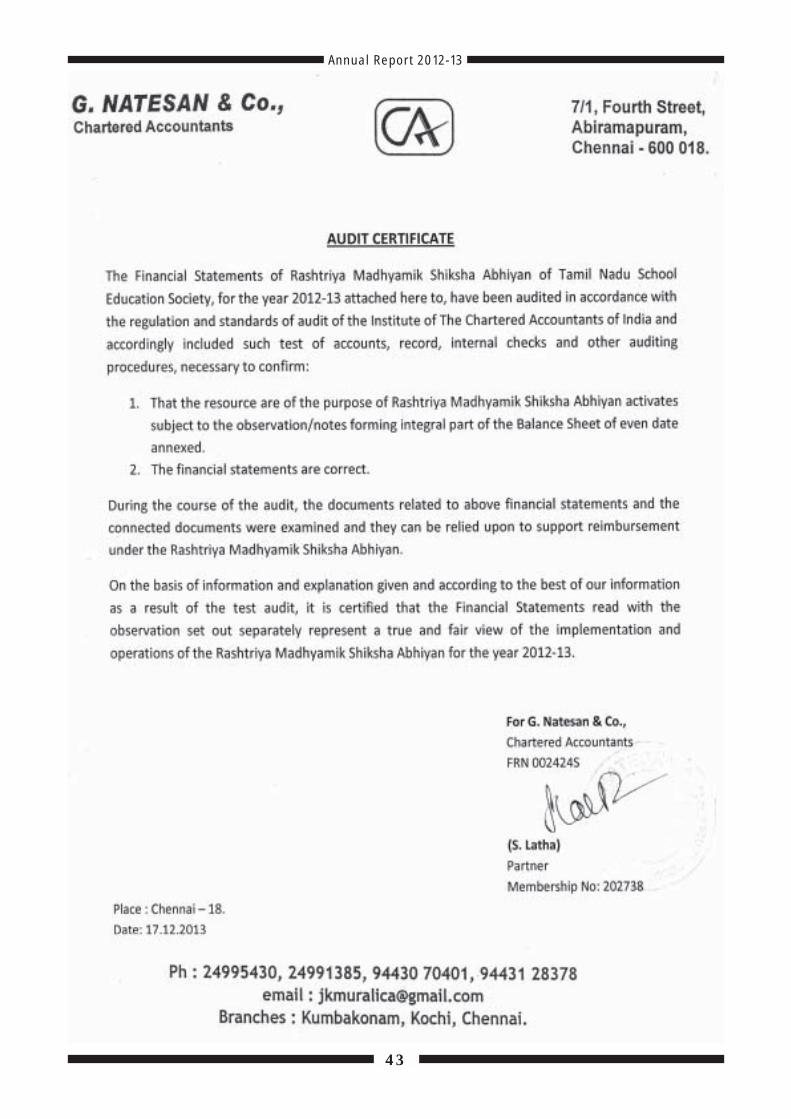
1. Auditors Report
2. Audit Certificate
3. Procurement Certificate
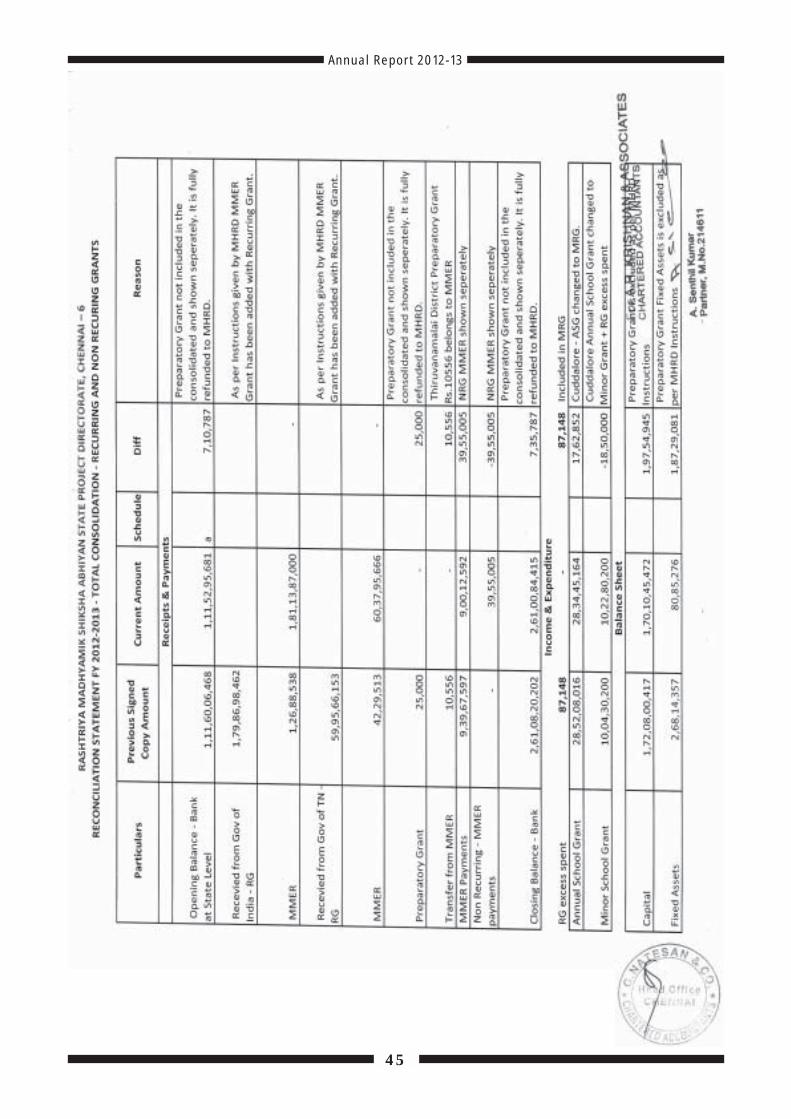
4. Consolidated Receipt & Payment Account
5. Consolidated Income & Expenditure Account
6. Consolidated Balance Sheet
7. Consolidated Financial Statement
8. Utilisation Certificate


33
Annual Report 2012-13

34
Annual Report 2012-13

35
Annual Report 2012-13

36
Annual Report 2012-13

37
Annual Report 2012-13

38
Annual Report 2012-13

39
Annual Report 2012-13

40
Annual Report 2012-13

41
Annual Report 2012-13

42
Annual Report 2012-13
43
Annual Report 2012-13

44
Annual Report 2012-13
45
Annual Report 2012-13

46
Annual Report 2012-13

47
Annual Report 2012-13

48
Annual Report 2012-13

49
Annual Report 2012-13

50
Annual Report 2012-13

51
Annual Report 2012-13

52
Annual Report 2012-13
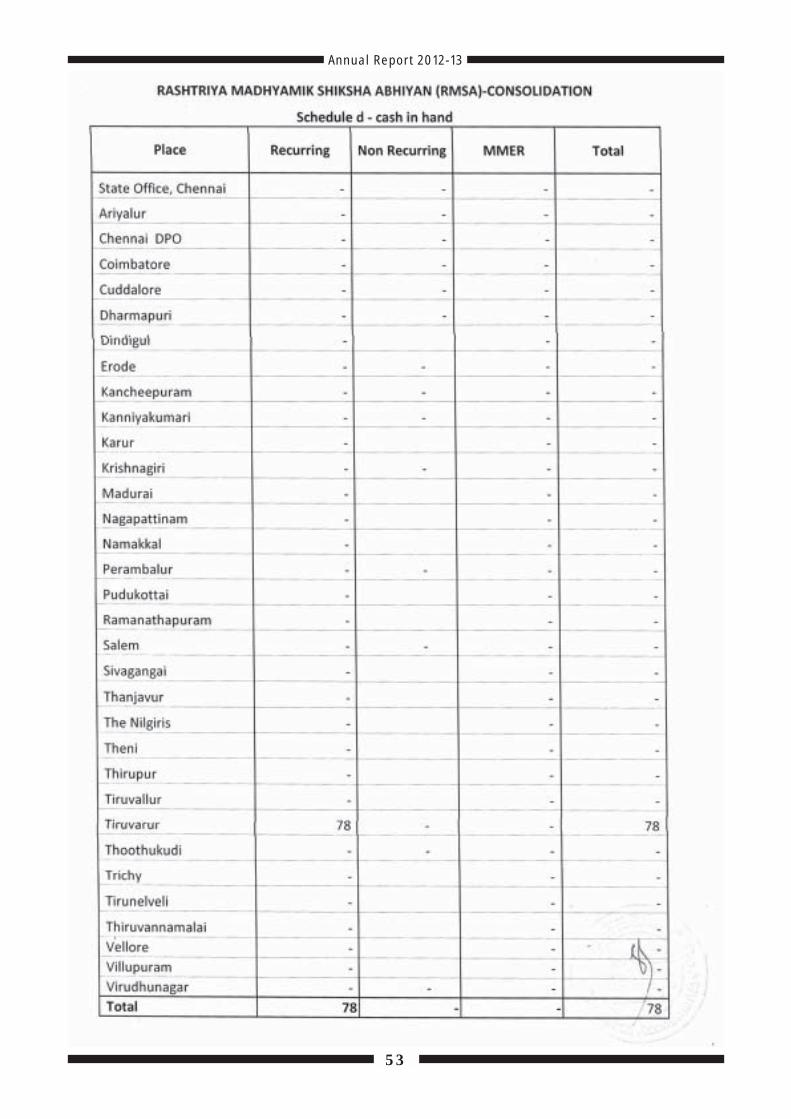
53
Annual Report 2012-13

54
Annual Report 2012-13

55
Annual Report 2012-13

56
Annual Report 2012-13

57
Annual Report 2012-13

58
Annual Report 2012-13
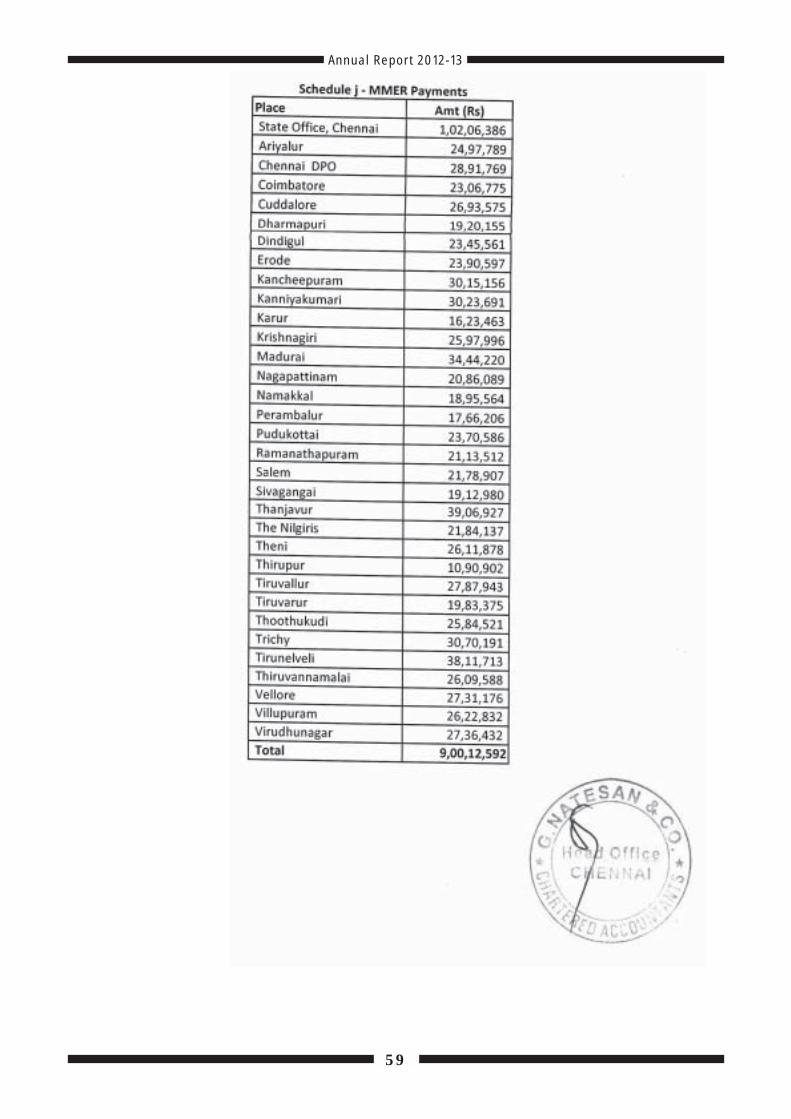
59
Annual Report 2012-13

60
Annual Report 2012-13

61
Annual Report 2012-13
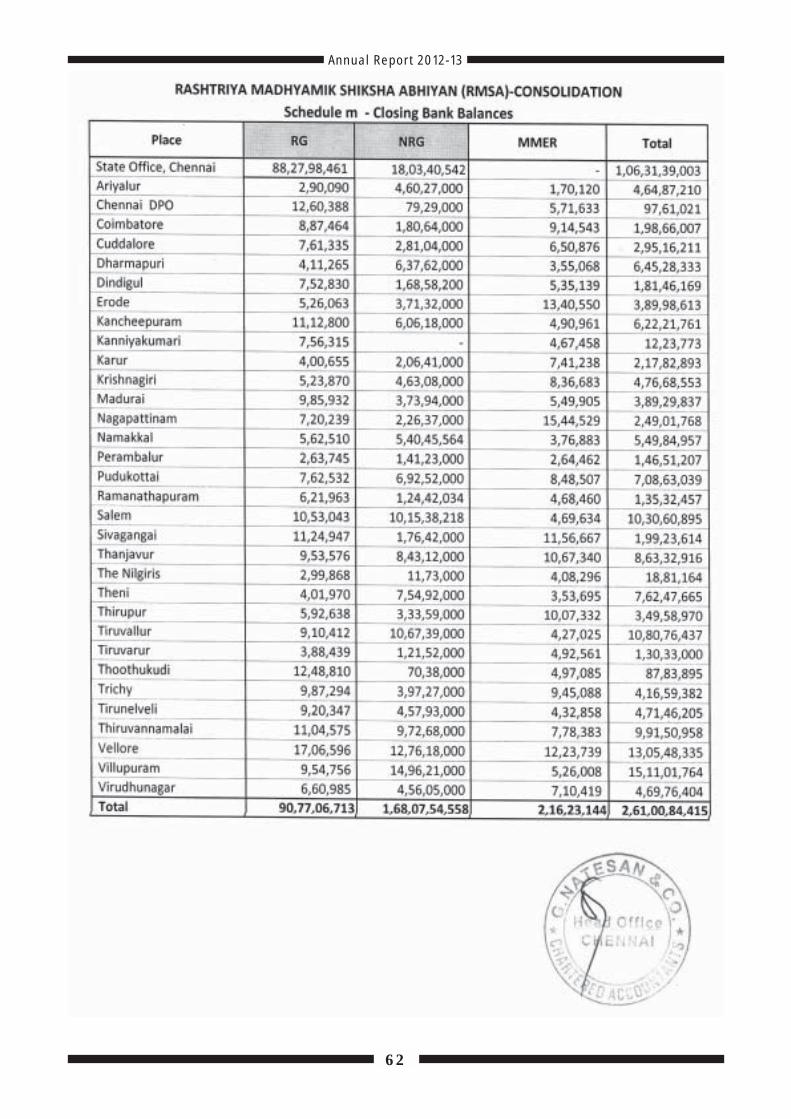
62
Annual Report 2012-13

63
Annual Report 2012-13
64
Annual Report 2012-13

65
Annual Report 2012-13

66
Annual Report 2012-13

67
Annual Report 2012-13

68
Annual Report 2012-13

69
Annual Report 2012-13


71
Annual Report 2012-13
INDEX
S No. Particulars
RMSA - Recurring Grant 2012-13
1. Receipts & Payments Account
2. Income & Expenditure Account
3. Balance Sheet
4. Financial Statement
5. Utilisation Certificate


73
Annual Report 2012-13

74
Annual Report 2012-13

75
Annual Report 2012-13

76
Annual Report 2012-13
77
Annual Report 2012-13

78
Annual Report 2012-13

79
Annual Report 2012-13

80
Annual Report 2012-13

81
Annual Report 2012-13

82
Annual Report 2012-13

83
Annual Report 2012-13

84
Annual Report 2012-13

85
Annual Report 2012-13
86
Annual Report 2012-13

87
Annual Report 2012-13

88
Annual Report 2012-13

89
Annual Report 2012-13

90
Annual Report 2012-13
91
Annual Report 2012-13

92
Annual Report 2012-13

93
Annual Report 2012-13

94
Annual Report 2012-13
95
Annual Report 2012-13
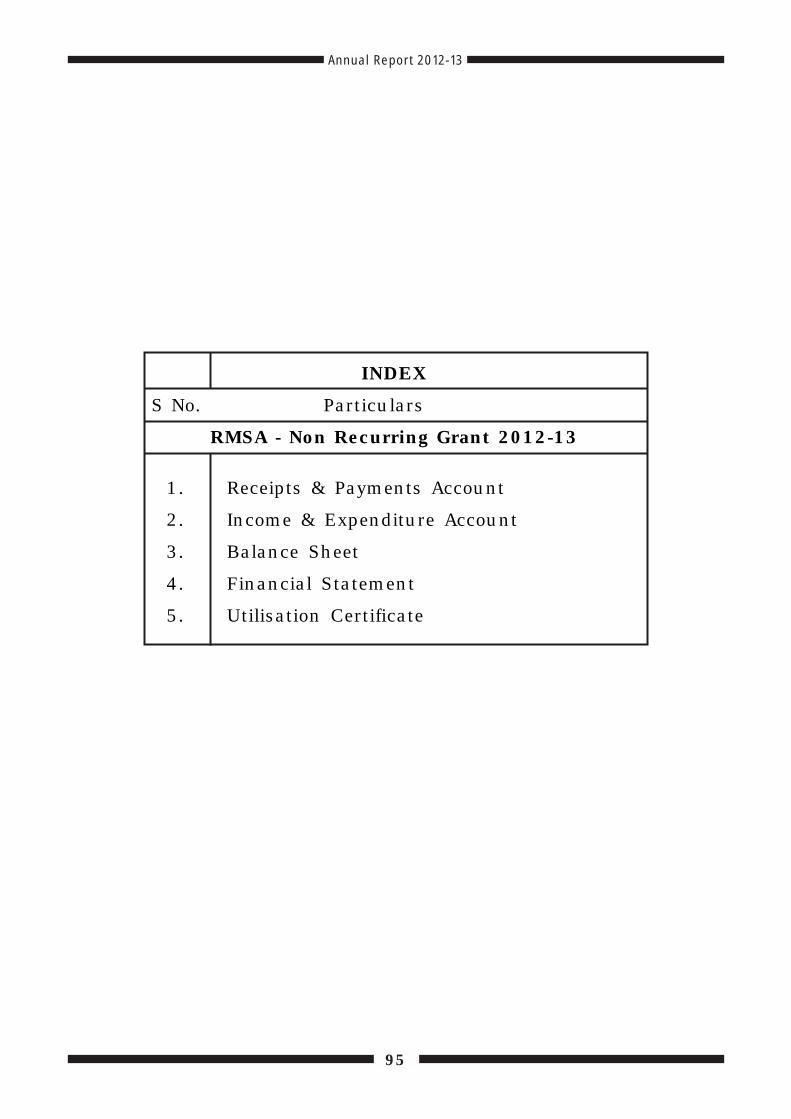
INDEX
S No. Particulars
RMSA - Non Recurring Grant 2012-13
1. Receipts & Payments Account
2. Income & Expenditure Account
3. Balance Sheet
4. Financial Statement
5. Utilisation Certificate


97
Annual Report 2012-13

98
Annual Report 2012-13

99
Annual Report 2012-13

100
Annual Report 2012-13

101
Annual Report 2012-13
102
Annual Report 2012-13

103
Annual Report 2012-13

104
Annual Report 2012-13

105
Annual Report 2012-13

106
Annual Report 2012-13

107
Annual Report 2012-13
108
Annual Report 2012-13

109
Annual Report 2012-13
INDEX
S No. Particulars
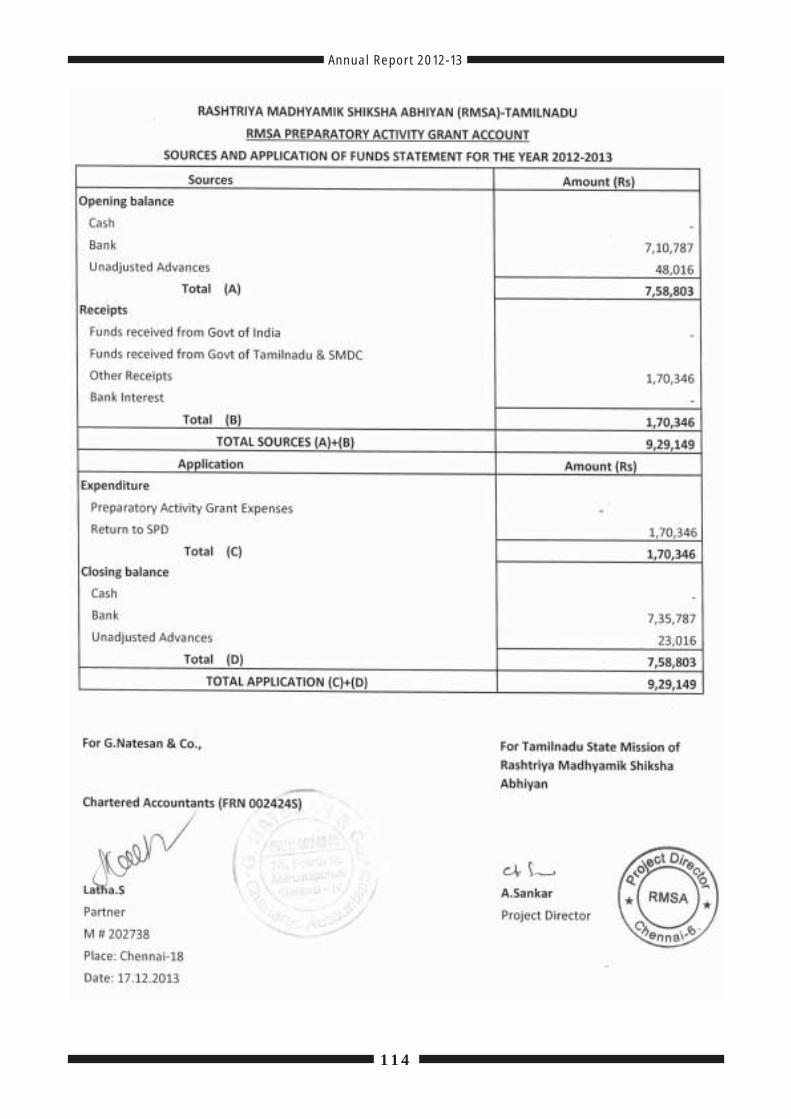
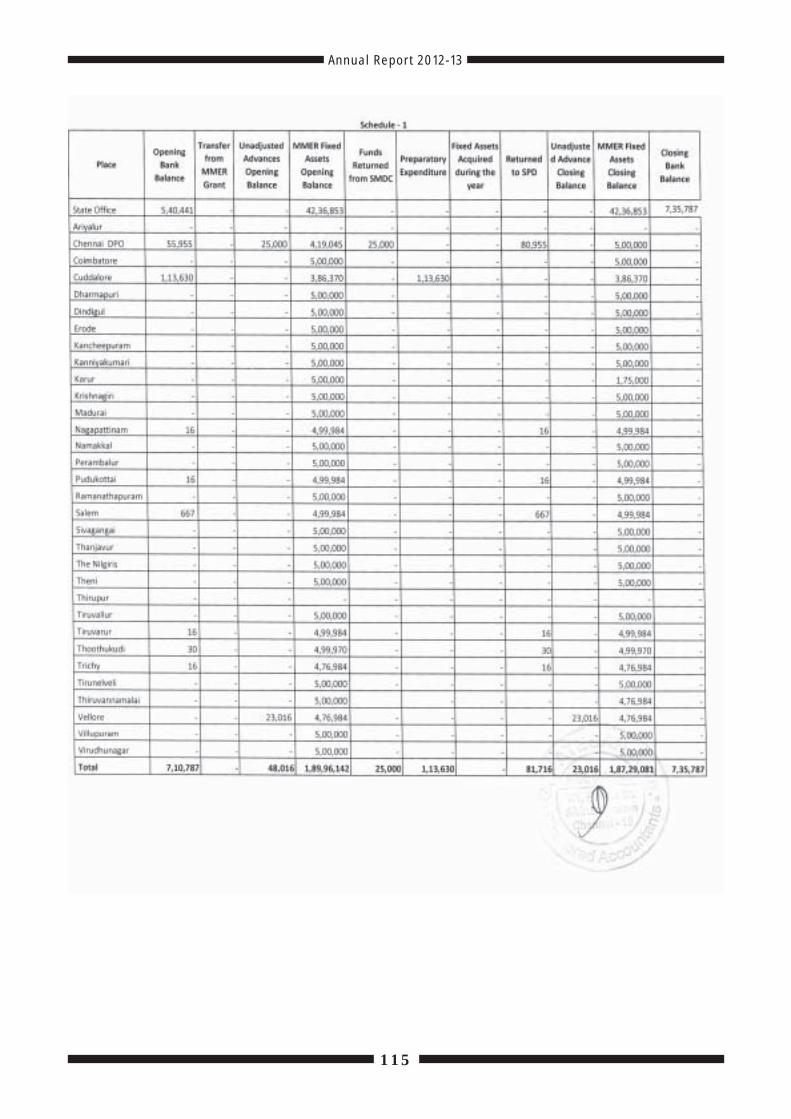
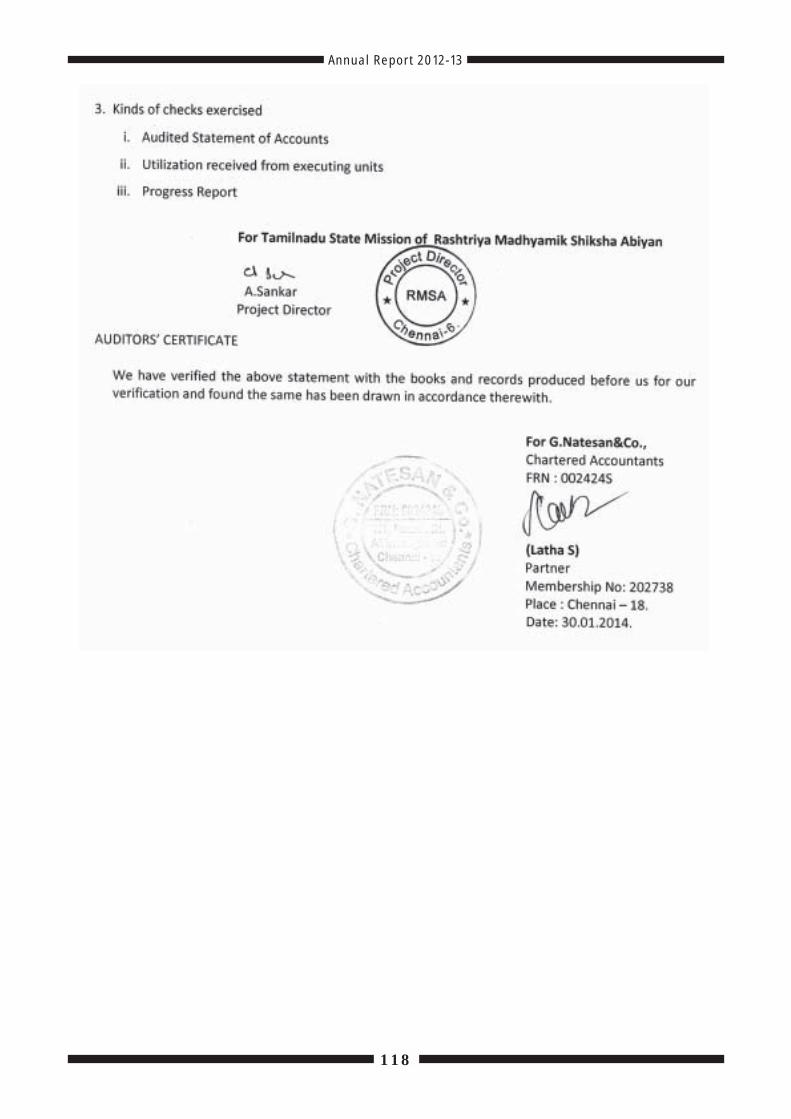
RMSA - Preparatory Grant 2012-13
1. Receipts & Payments Account
2. Income & Expenditure Account
3. Balance Sheet
4. Financial Statement
5. Utilisation Certificate


111
Annual Report 2012-13
112
Annual Report 2012-13

113
Annual Report 2012-13
114
Annual Report 2012-13
115
Annual Report 2012-13

116
Annual Report 2012-13

117
Annual Report 2012-13
118
Annual Report 2012-13