Embed Size (px)
Citation preview
Development Plan for Greater Mumbai 2014-2034
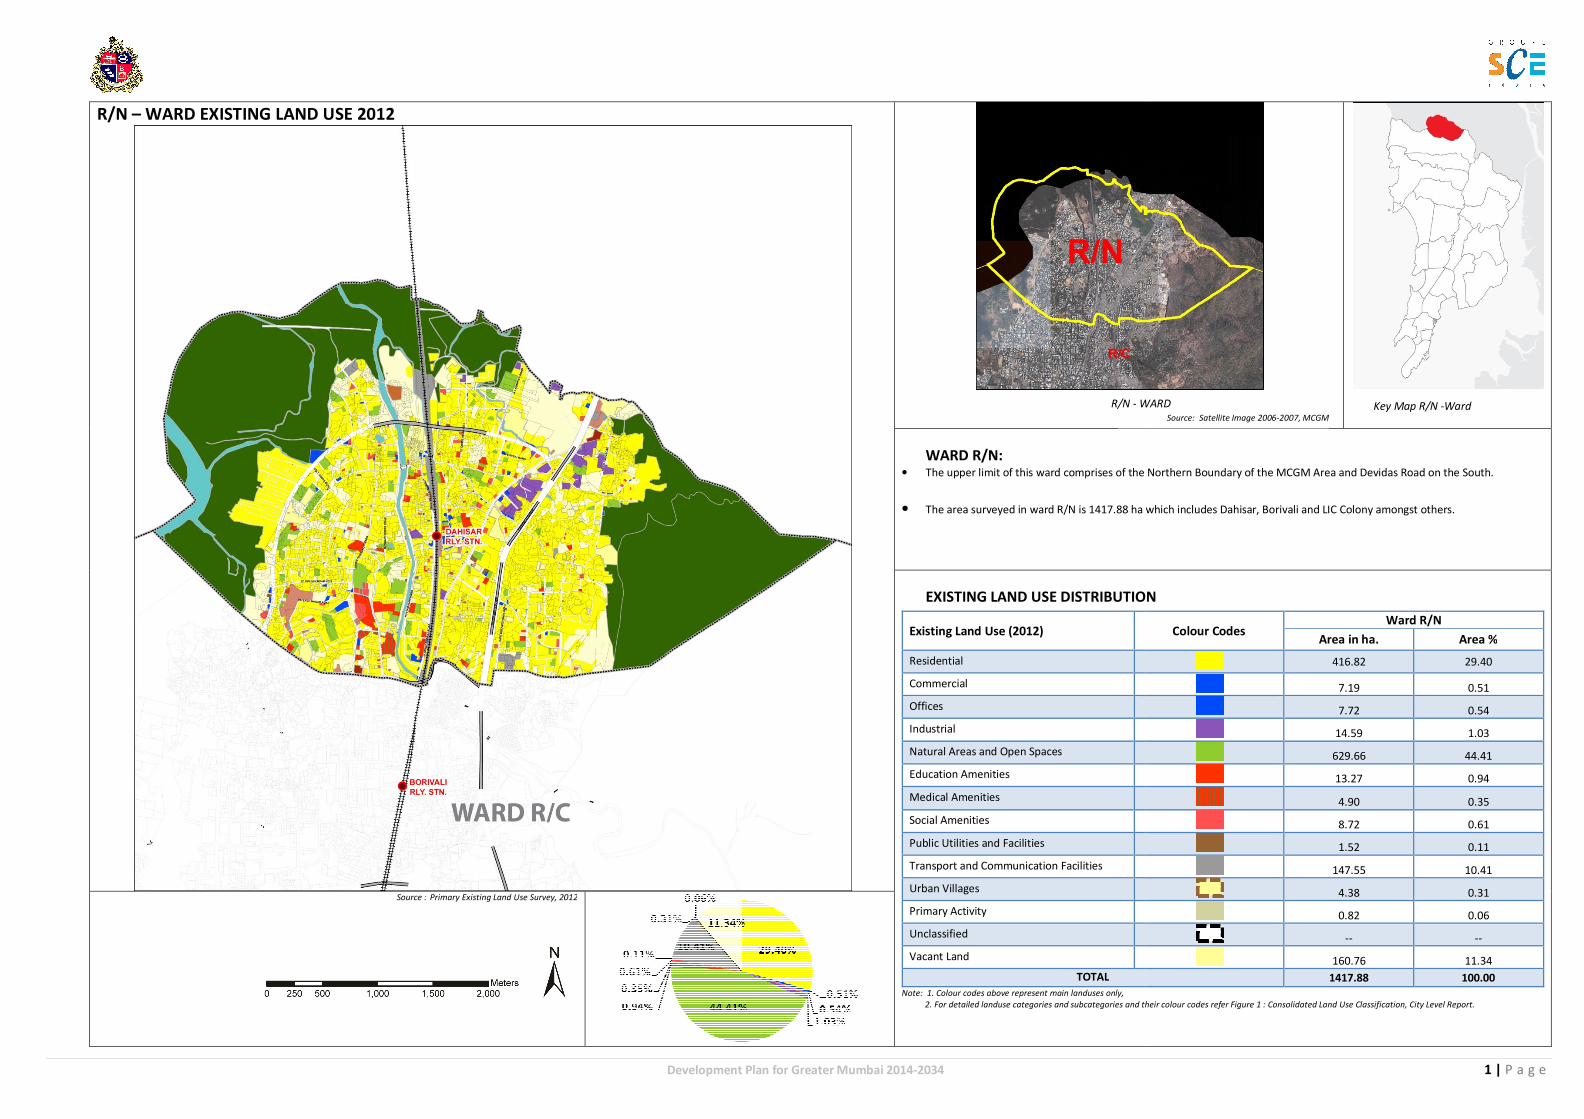
R/N – WARD EXISTING LAND USE 2012
WARD R/N: • The upper limit of this ward comprises of the
• The area surveyed in ward R/N is 1417.88 ha which includes
EXISTING LAND USE DISTRIBUTION
Note: 1. Colour codes above represent main landuses only,
2. For detailed landuse categories and subcategories and their colour codes refer
Existing Land Use (2012)
Residential
Commercial
Offices
Industrial
Natural Areas and Open Spaces
Education Amenities
Medical Amenities
Social Amenities
Public Utilities and Facilities
Transport and Communication Facilities
Urban Villages
Primary Activity
Unclassified
Vacant Land
TOTAL
Source : Primary Existing Land Use Survey, 2012
R/N - WARD
1 | P a g e
comprises of the Northern Boundary of the MCGM Area and Devidas Road on the South.
ha which includes Dahisar, Borivali and LIC Colony amongst others.
EXISTING LAND USE DISTRIBUTION
2. For detailed landuse categories and subcategories and their colour codes refer Figure 1 : Consolidated Land Use Classification, City Level Report.
Colour Codes Ward R/N
Area in ha. Area %
416.82 29.40
7.19 0.51
7.72 0.54
14.59 1.03
629.66 44.41
13.27 0.94
4.90 0.35
8.72 0.61
1.52 0.11
147.55 10.41
4.38 0.31
0.82 0.06
-- --
160.76 11.34
1417.88 100.00
Key Map R/N -Ward WARD Source: Satellite Image 2006-2007, MCGM
Development Plan for Greater Mumbai 2014-2034
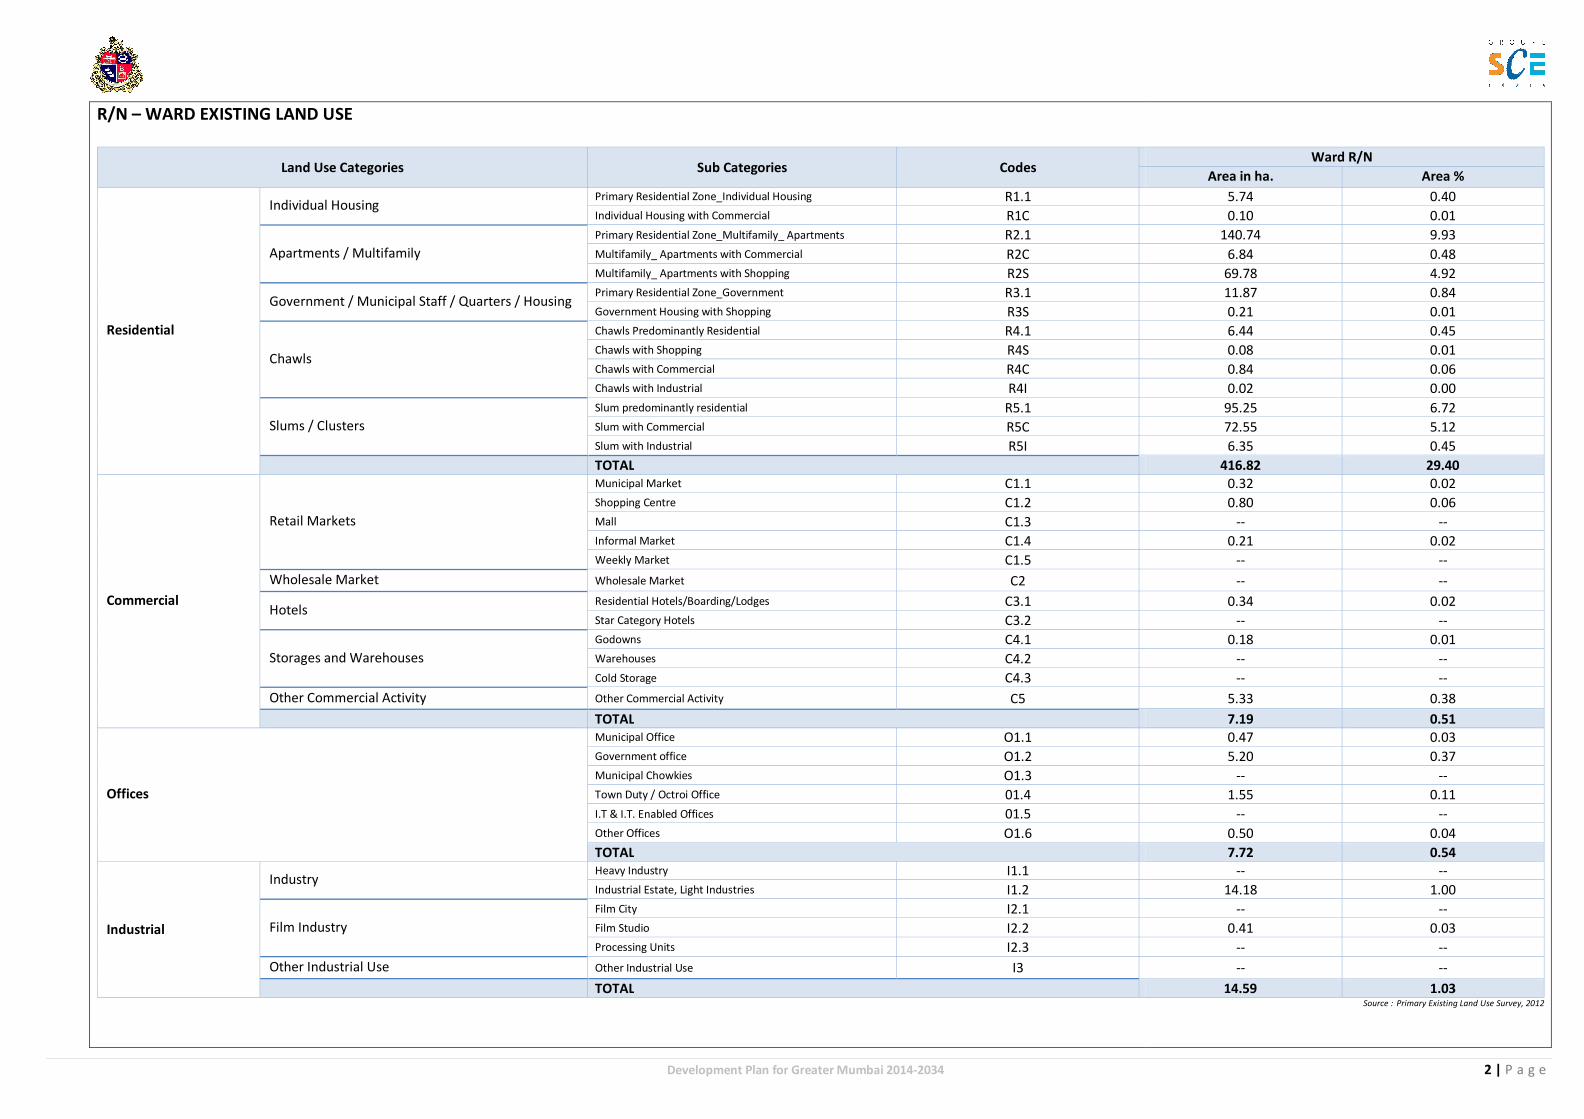
R/N – WARD EXISTING LAND USE
Land Use Categories Sub Categories Codes
Residential
Individual Housing Primary Residential Zone_Individual Housing R1.1
Individual Housing with Commercial R1C
Apartments / Multifamily
Primary Residential Zone_Multifamily_ Apartments R2.1
Multifamily_ Apartments with Commercial R2C
Multifamily_ Apartments with Shopping R2S
Government / Municipal Staff / Quarters / Housing Primary Residential Zone_Government R3.1
Government Housing with Shopping R3S
Chawls
Chawls Predominantly Residential R4.1
Chawls with Shopping R4S
Chawls with Commercial R4C
Chawls with Industrial R4I
Slums / Clusters
Slum predominantly residential R5.1
Slum with Commercial R5C
Slum with Industrial R5I
TOTAL
Commercial
Retail Markets
Municipal Market C1.1
Shopping Centre C1.2
Mall C1.3
Informal Market C1.4
Weekly Market C1.5
Wholesale Market Wholesale Market C2
Hotels Residential Hotels/Boarding/Lodges C3.1
Star Category Hotels C3.2
Storages and Warehouses
Godowns C4.1
Warehouses C4.2
Cold Storage C4.3
Other Commercial Activity Other Commercial Activity C5
TOTAL
Offices
Municipal Office O1.1
Government office O1.2
Municipal Chowkies O1.3
Town Duty / Octroi Office 01.4
I.T & I.T. Enabled Offices 01.5
Other Offices O1.6
TOTAL
Industrial
Industry Heavy Industry I1.1
Industrial Estate, Light Industries I1.2
Film Industry
Film City I2.1
Film Studio I2.2
Processing Units I2.3
Other Industrial Use Other Industrial Use I3
TOTAL
2 | P a g e
Source : Primary Existing Land Use Survey, 2012
Ward R/N
Area in ha. Area %
5.74 0.40
0.10 0.01
140.74 9.93
6.84 0.48
69.78 4.92
11.87 0.84
0.21 0.01
6.44 0.45
0.08 0.01
0.84 0.06
0.02 0.00
95.25 6.72
72.55 5.12
6.35 0.45
416.82 29.40
0.32 0.02
0.80 0.06
-- --
0.21 0.02
-- --
-- --
0.34 0.02
-- --
0.18 0.01
-- --
-- --
5.33 0.38
7.19 0.51
0.47 0.03
5.20 0.37
-- --
1.55 0.11
-- --
0.50 0.04
7.72 0.54
-- --
14.18 1.00
-- --
0.41 0.03
-- --
-- --
14.59 1.03
Development Plan for Greater Mumbai 2014-2034
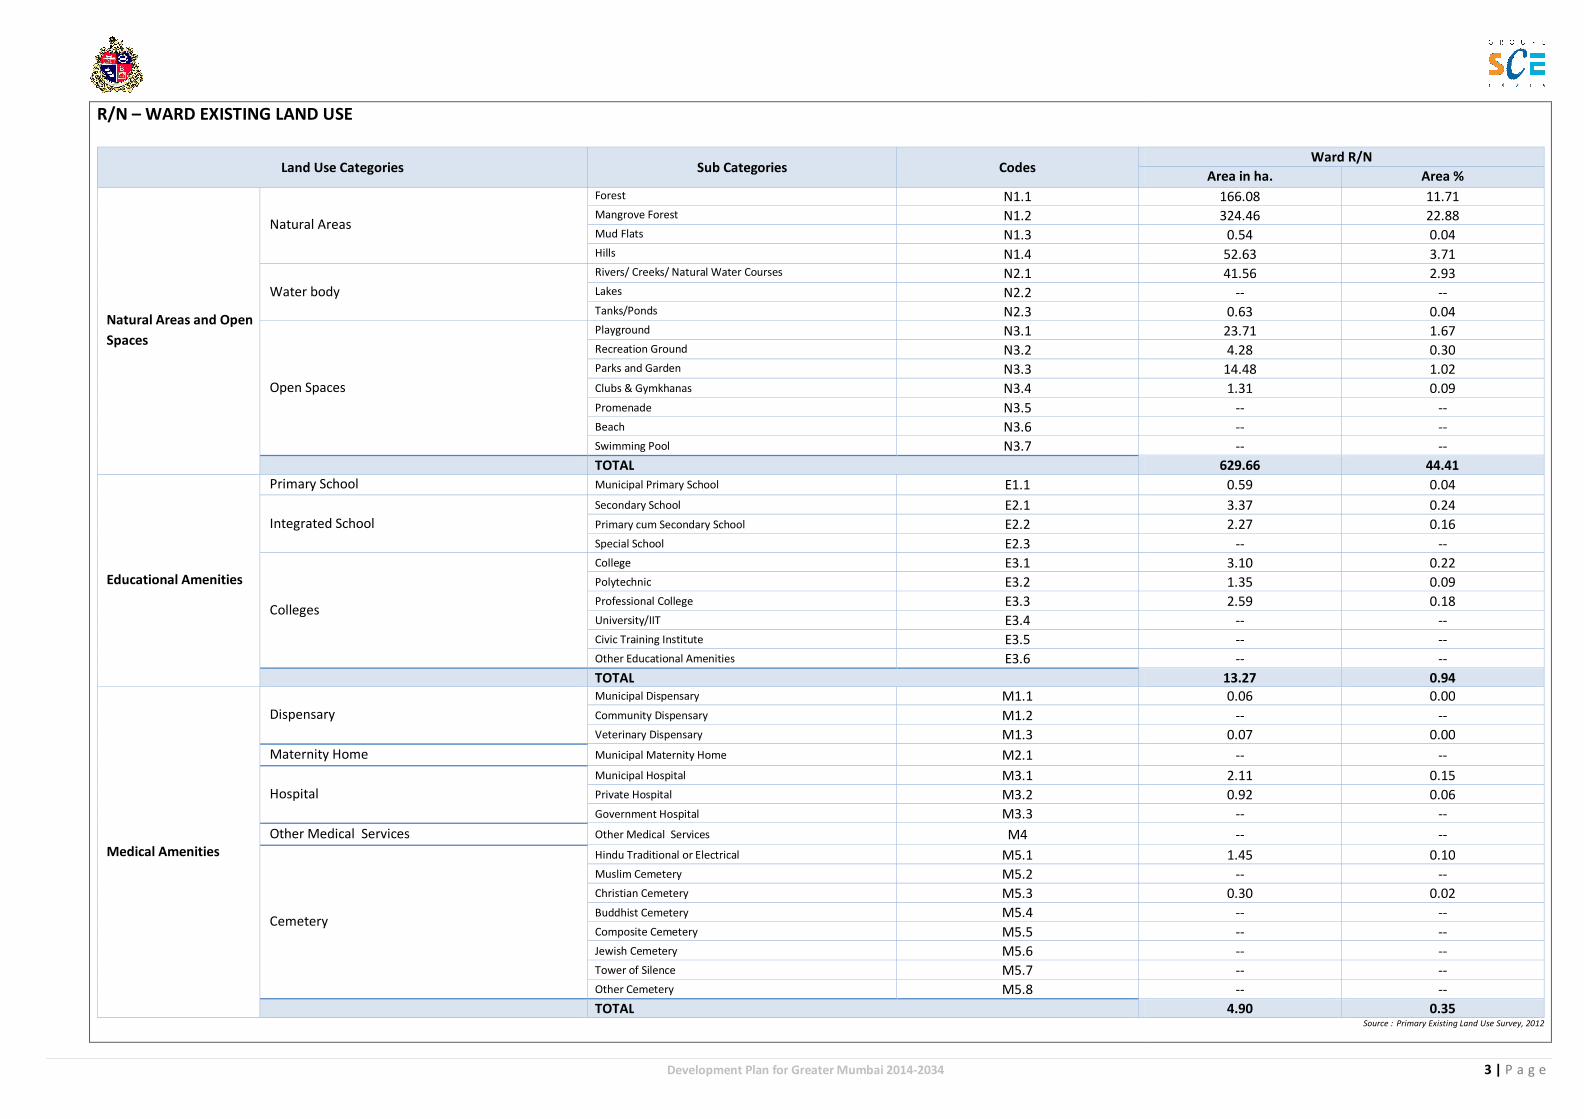
R/N – WARD EXISTING LAND USE
Land Use Categories Sub Categories Codes
Natural Areas and Open
Spaces
Natural Areas
Forest N1.1
Mangrove Forest N1.2
Mud Flats N1.3
Hills N1.4
Water body
Rivers/ Creeks/ Natural Water Courses N2.1
Lakes N2.2
Tanks/Ponds N2.3
Open Spaces
Playground N3.1
Recreation Ground N3.2
Parks and Garden N3.3
Clubs & Gymkhanas N3.4
Promenade N3.5
Beach N3.6
Swimming Pool N3.7
TOTAL
Educational Amenities
Primary School Municipal Primary School E1.1
Integrated School
Secondary School E2.1
Primary cum Secondary School E2.2
Special School E2.3
Colleges
College E3.1
Polytechnic E3.2
Professional College E3.3
University/IIT E3.4
Civic Training Institute E3.5
Other Educational Amenities E3.6
TOTAL
Medical Amenities
Dispensary
Municipal Dispensary M1.1
Community Dispensary M1.2
Veterinary Dispensary M1.3
Maternity Home Municipal Maternity Home M2.1
Hospital
Municipal Hospital M3.1
Private Hospital M3.2
Government Hospital M3.3
Other Medical Services Other Medical Services M4
Cemetery
Hindu Traditional or Electrical M5.1
Muslim Cemetery M5.2
Christian Cemetery M5.3
Buddhist Cemetery M5.4
Composite Cemetery M5.5
Jewish Cemetery M5.6
Tower of Silence M5.7
Other Cemetery M5.8
TOTAL
3 | P a g e
Source : Primary Existing Land Use Survey, 2012
Ward R/N
Area in ha. Area %
166.08 11.71
324.46 22.88
0.54 0.04
52.63 3.71
41.56 2.93
-- --
0.63 0.04
23.71 1.67
4.28 0.30
14.48 1.02
1.31 0.09
-- --
-- --
-- --
629.66 44.41
0.59 0.04
3.37 0.24
2.27 0.16
-- --
3.10 0.22
1.35 0.09
2.59 0.18
-- --
-- --
-- --
13.27 0.94
0.06 0.00
-- --
0.07 0.00
-- --
2.11 0.15
0.92 0.06
-- --
-- --
1.45 0.10
-- --
0.30 0.02
-- --
-- --
-- --
-- --
-- --
4.90 0.35
Development Plan for Greater Mumbai 2014-2034
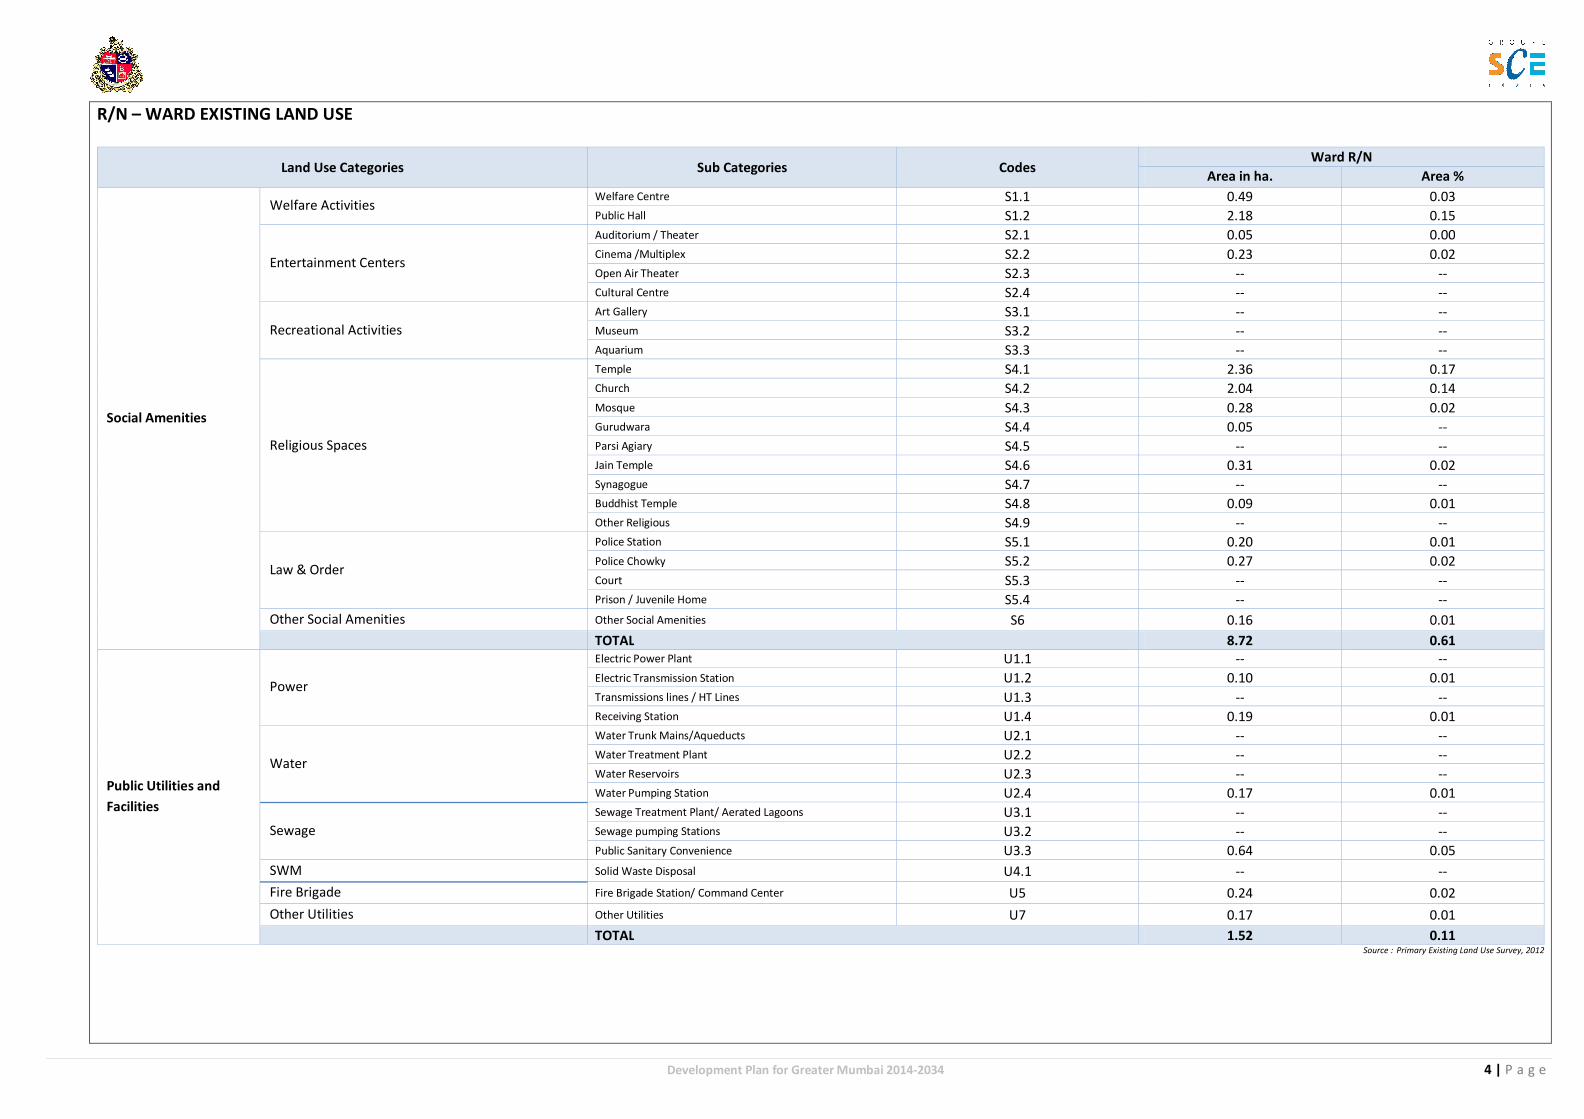
R/N – WARD EXISTING LAND USE
Land Use Categories Sub Categories Codes
Social Amenities
Welfare Activities Welfare Centre S1.1
Public Hall S1.2
Entertainment Centers
Auditorium / Theater S2.1
Cinema /Multiplex S2.2
Open Air Theater S2.3
Cultural Centre S2.4
Recreational Activities
Art Gallery S3.1
Museum S3.2
Aquarium S3.3
Religious Spaces
Temple S4.1
Church S4.2
Mosque S4.3
Gurudwara S4.4
Parsi Agiary S4.5
Jain Temple S4.6
Synagogue S4.7
Buddhist Temple S4.8
Other Religious S4.9
Law & Order
Police Station S5.1
Police Chowky S5.2
Court S5.3
Prison / Juvenile Home S5.4
Other Social Amenities Other Social Amenities S6
TOTAL
Public Utilities and
Facilities
Power
Electric Power Plant U1.1
Electric Transmission Station U1.2
Transmissions lines / HT Lines U1.3
Receiving Station U1.4
Water
Water Trunk Mains/Aqueducts U2.1
Water Treatment Plant U2.2
Water Reservoirs U2.3
Water Pumping Station U2.4
Sewage
Sewage Treatment Plant/ Aerated Lagoons U3.1
Sewage pumping Stations U3.2
Public Sanitary Convenience U3.3
SWM Solid Waste Disposal U4.1
Fire Brigade Fire Brigade Station/ Command Center U5
Other Utilities Other Utilities U7
TOTAL
4 | P a g e
Source : Primary Existing Land Use Survey, 2012
Ward R/N
Area in ha. Area %
0.49 0.03
2.18 0.15
0.05 0.00
0.23 0.02
-- --
-- --
-- --
-- --
-- --
2.36 0.17
2.04 0.14
0.28 0.02
0.05 --
-- --
0.31 0.02
-- --
0.09 0.01
-- --
0.20 0.01
0.27 0.02
-- --
-- --
0.16 0.01
8.72 0.61
-- --
0.10 0.01
-- --
0.19 0.01
-- --
-- --
-- --
0.17 0.01
-- --
-- --
0.64 0.05
-- --
0.24 0.02
0.17 0.01
1.52 0.11
Development Plan for Greater Mumbai 2014-2034
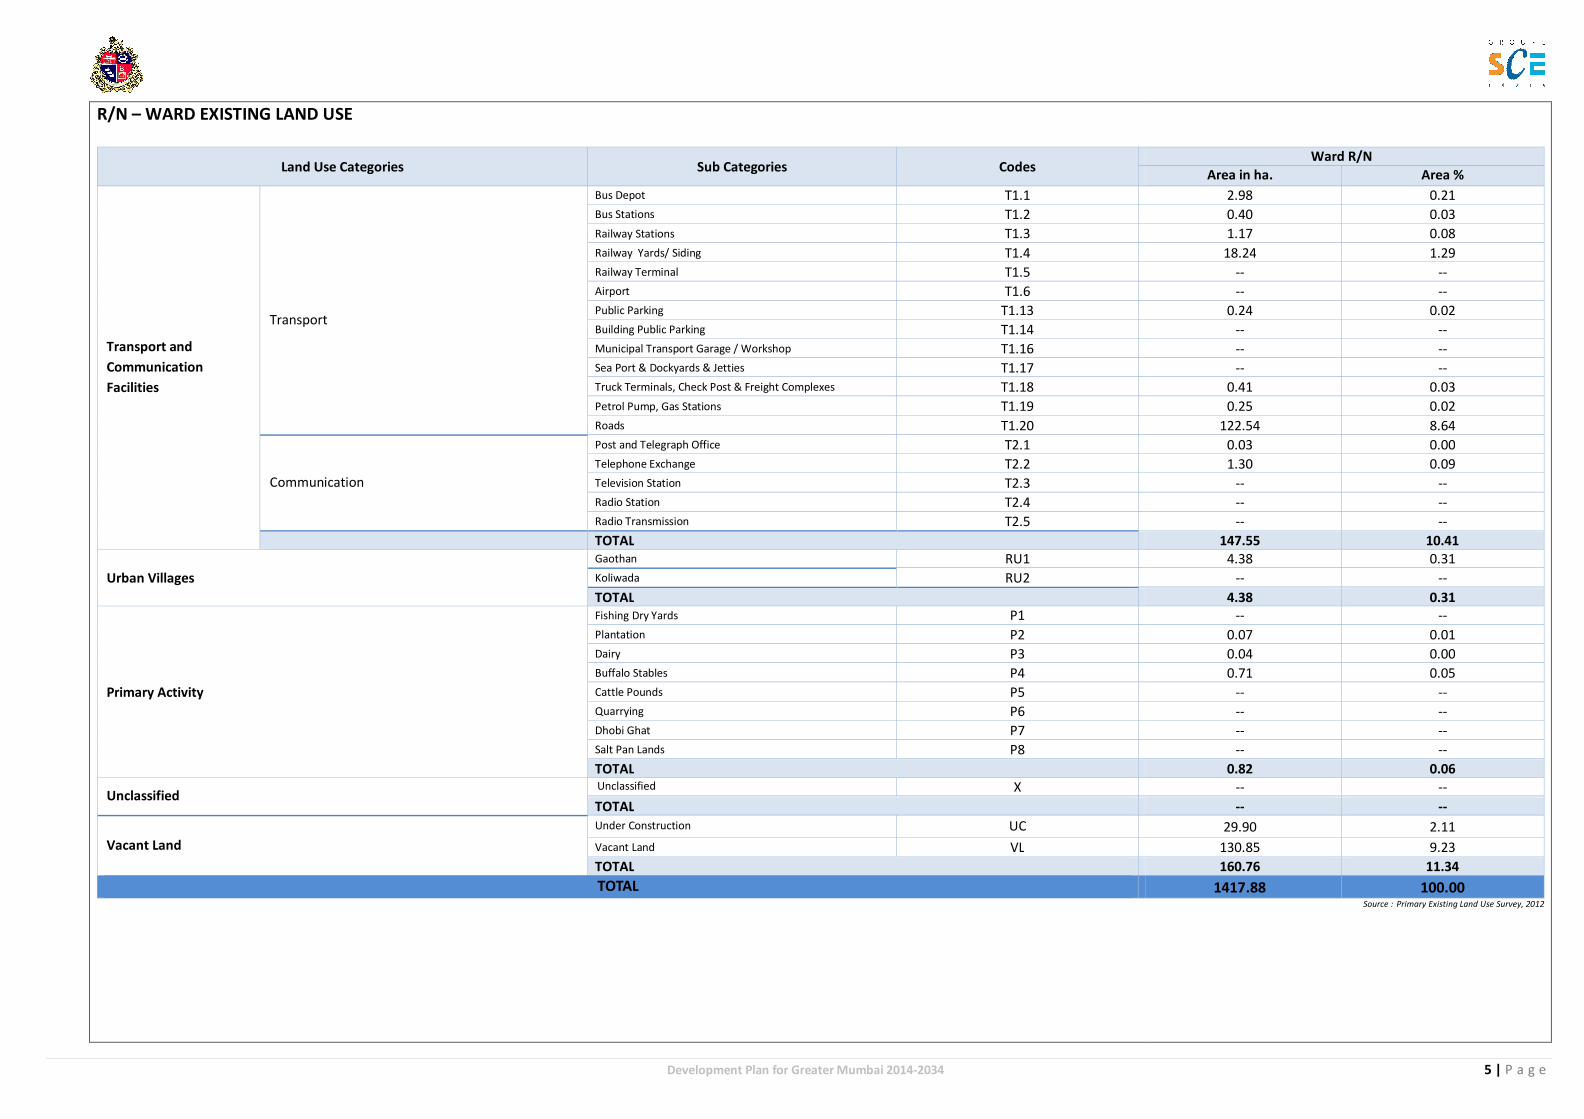
R/N – WARD EXISTING LAND USE
Land Use Categories Sub Categories Codes
Transport and
Communication
Facilities
Transport
Bus Depot T1.1
Bus Stations T1.2
Railway Stations T1.3
Railway Yards/ Siding T1.4
Railway Terminal T1.5
Airport T1.6
Public Parking T1.13
Building Public Parking T1.14
Municipal Transport Garage / Workshop T1.16
Sea Port & Dockyards & Jetties T1.17
Truck Terminals, Check Post & Freight Complexes T1.18
Petrol Pump, Gas Stations T1.19
Roads T1.20
Communication
Post and Telegraph Office T2.1
Telephone Exchange T2.2
Television Station T2.3
Radio Station T2.4
Radio Transmission T2.5
TOTAL
Urban Villages
Gaothan RU1
Koliwada RU2
TOTAL
Primary Activity
Fishing Dry Yards P1
Plantation P2
Dairy P3
Buffalo Stables P4
Cattle Pounds P5
Quarrying P6
Dhobi Ghat P7
Salt Pan Lands P8
TOTAL
Unclassified Unclassified X
TOTAL
Vacant Land
Under Construction UC
Vacant Land VL
TOTAL
TOTAL
5 | P a g e
Source : Primary Existing Land Use Survey, 2012
Ward R/N
Area in ha. Area %
2.98 0.21
0.40 0.03
1.17 0.08
18.24 1.29
-- --
-- --
0.24 0.02
-- --
-- --
-- --
0.41 0.03
0.25 0.02
122.54 8.64
0.03 0.00
1.30 0.09
-- --
-- --
-- --
147.55 10.41
4.38 0.31
-- --
4.38 0.31
-- --
0.07 0.01
0.04 0.00
0.71 0.05
-- --
-- --
-- --
-- --
0.82 0.06
-- --
-- --
29.90 2.11
130.85 9.23
160.76 11.34
1417.88 100.00
Development Plan for Greater Mumbai 2014-2034
6 | P a g e