Embed Size (px)
Citation preview

RNA-Seq primer
Sequencing: applications Counting applications • Profiling
– microRNAs – Immunogenomics – Transcriptomics
• Epigenomics – Map histone modifications – Map DNA methylation – 3D genome conformation
• Nucleic acid Interactions
Polymorphism/mutation discovery – Bacteria – Genome dynamics – Exon (and other target) sequencing – Disease gene sequencing
• Variation and association studies • Genetics and gene discovery
• Cancer genomics
– Map translocations, CNVs, structural changes
– Profile somatic mutations • Genome assembly • Ancient DNA (Neanderthal) • Pathogen discovery • Metagenomics
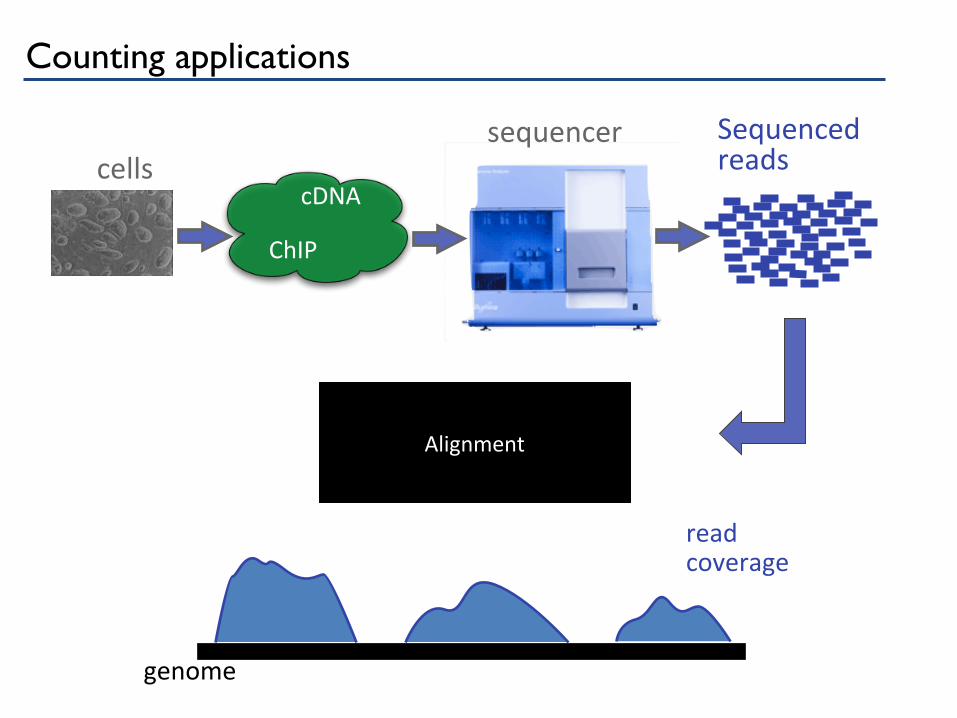
Sequenced reads cells
sequencer
cDNA
ChIP
genome
read coverage
Alignment
Counting applications
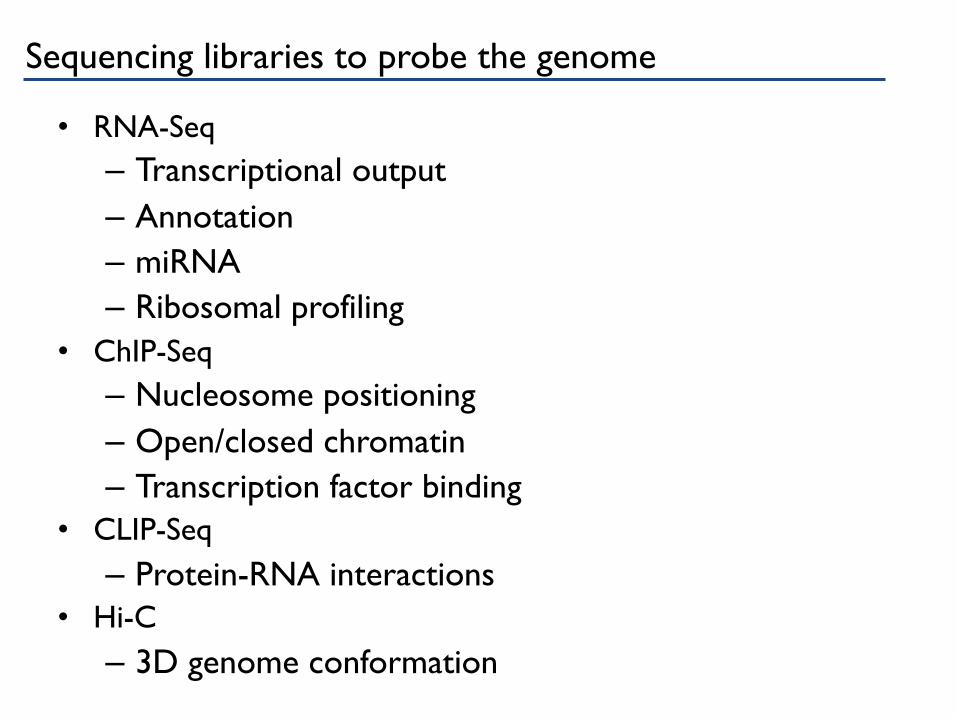
Sequencing libraries to probe the genome
• RNA-Seq – Transcriptional output – Annotation – miRNA – Ribosomal profiling
• ChIP-Seq – Nucleosome positioning – Open/closed chromatin – Transcription factor binding
• CLIP-Seq – Protein-RNA interactions
• Hi-C – 3D genome conformation
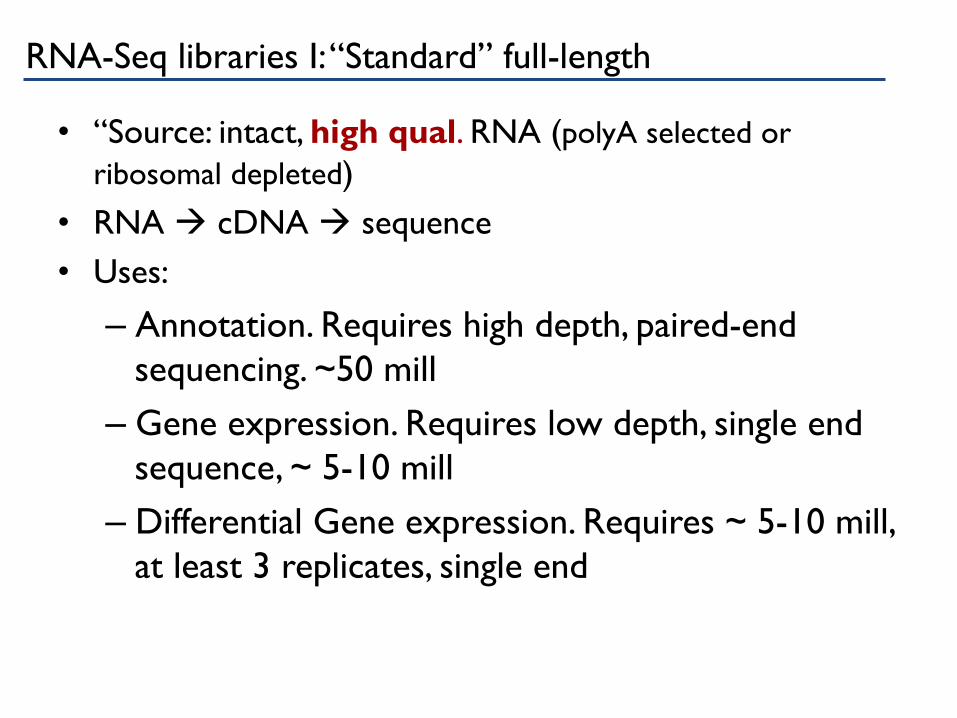
RNA-Seq libraries I: “Standard” full-length
• “Source: intact, high qual. RNA (polyA selected or ribosomal depleted)
• RNA à cDNA à sequence • Uses:
– Annotation. Requires high depth, paired-end sequencing. ~50 mill
– Gene expression. Requires low depth, single end sequence, ~ 5-10 mill
– Differential Gene expression. Requires ~ 5-10 mill, at least 3 replicates, single end
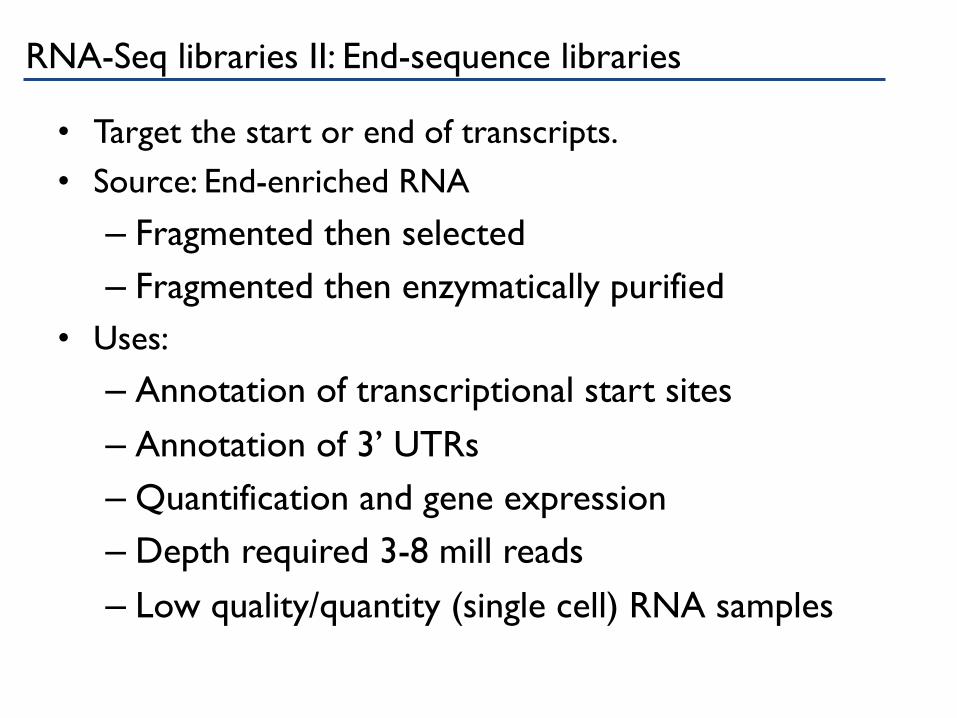
RNA-Seq libraries II: End-sequence libraries
• Target the start or end of transcripts. • Source: End-enriched RNA
– Fragmented then selected – Fragmented then enzymatically purified
• Uses:
– Annotation of transcriptional start sites – Annotation of 3’ UTRs – Quantification and gene expression – Depth required 3-8 mill reads – Low quality/quantity (single cell) RNA samples
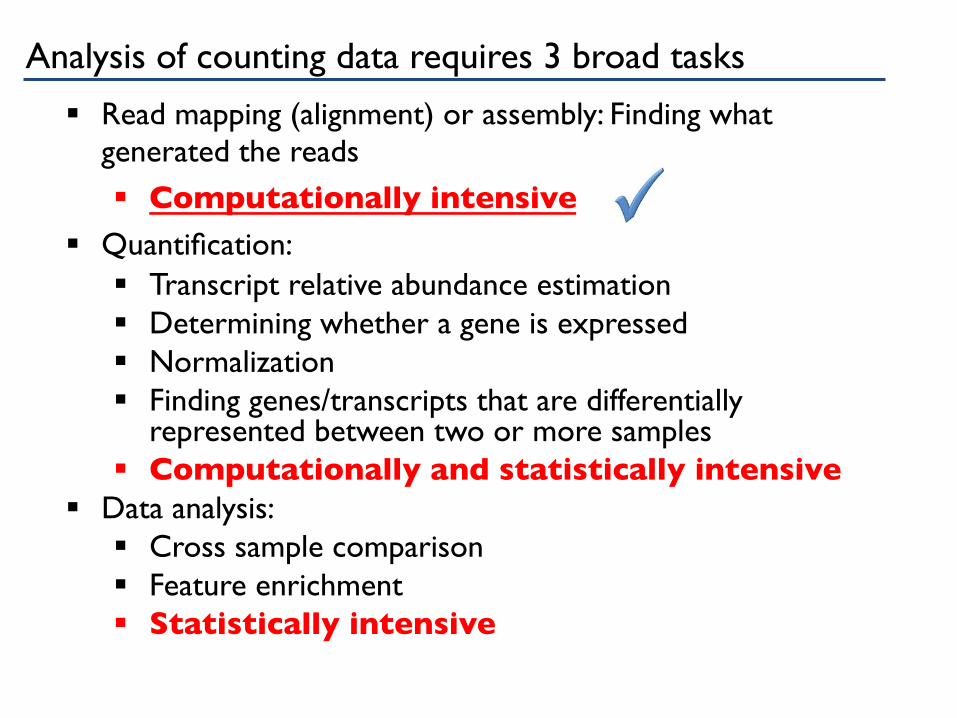
§ Read mapping (alignment) or assembly: Finding what generated the reads
§ Computationally intensive § Quantification:
§ Transcript relative abundance estimation§ Determining whether a gene is expressed § Normalization§ Finding genes/transcripts that are differentially
represented between two or more samples§ Computationally and statistically intensive
§ Data analysis:§ Cross sample comparison§ Feature enrichment§ Statistically intensive
Analysis of counting data requires 3 broad tasks
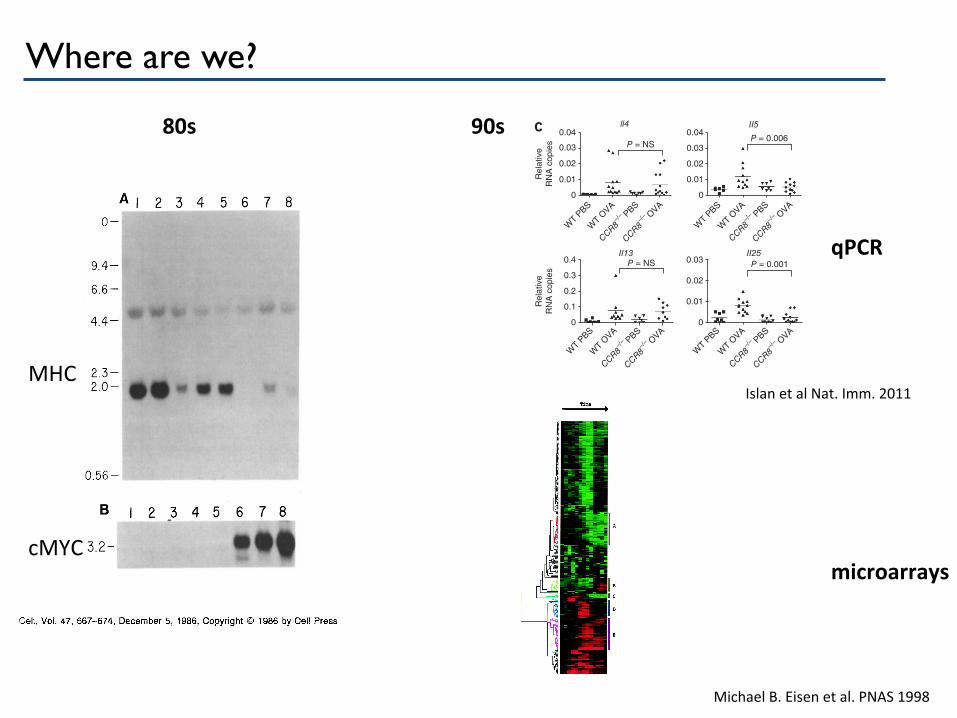
Where are we? Cell 668
9.4-
6.6-
4.4-
2.3- 2.0-
0.56-
B 12345678
cl2345678
Figure 1. Northern Slot Analysis of RNA Isolated from Human Neuro- blastoma Cell Lines Twenty micrograms of total cytoplasmic RNA from the following cell lines was used: lane 1, human colon carcinoma SW480; lane 2, human kidney carcinoma ACHN; lane 3, neuroblastoma Nf369; lane 4, neuro- blastoma SK-N-SH; lane 5, neuroblastoma SK-N-MC; lane 6, neuro- blastoma IMR32; lane 7, neuroblastoma LAN-5; lane 8, neuroblastoma NGP. The positions of the molecular weight markers are indicated. (A) Filter probed with a human MHC class I heavy chain gene probe. (B) Filter shown in (A) reprobed with a human N-myc probe. (C) Filter shown in (A) reprobed with a mouse c-myc probe.
class l heavy chain in neuroblastoma cells is indeed cor- related with a high level of expression of the N-myc gene. One line presented an apparent exception to this. The NB69 cell line showed a low level of MHC class I mRNA but no increase in N-myc expression. Upon further analy- sis, however, these cells were found to have a high level of expression of the c-myc gene (Figure 1C). We thus ex- tended the hypothesis, associating this ability to affect the expression of MHC class I antigens with both members of the myc gene family. In the subsequent experiments, we focused our study on the effects of the N-myc gene on ex- pression of MHC class I antigens in neuroblastoma cells.
Transfection sf Rat Neuroblastoma Cells with the N-myc Gene The above-mentioned results indicated an inverse reia- tionship between N-myc and MHC class l antigen expres- sion Such data could be correlative or might suggest a causal relationship. We therefore designed experiments to determine whether manipulation of N-myc levels could be used to modulate the expression of MHC class l an- tigens.
As a model system, we chose the rat neuroblastoma ceil line 6104 (Schubert et al., 1974). This ceil line was gener- ated by transplacental mutagenesis of pregnant rats with the chemical carcinogen ENU, causing activation of the neu-oncogene in these cells (Schechter et al., 1984). We specifically chose this cell line because it expresses very tow amounts of c-myc and N-myc transcripts (not shown) and displays a substantial amount of MHC class I antigens at the cell surface (see below). Furthermore, we consid- ered it advantageous that the B104 cell line was generated from a readily available inbred rat strain, BDIX, which would enable us to study the growth of transfectants in im- munocompetent, syngeneic animals.
We developed derivatives of the 8104 neuroblastoma cell line, each of which expressed the N-myc gene at a different level. To achieve this, we cotransfected the 8104 cells with the plasmids pSV2neo and pmp34.1. The latter plasmid contains a genomic DNA fragment spanning the entire human N-myc gene and a murine leukemia virus enhancer segment in the 5’-flanking region of the gene to increase its expression (Schwab et al., 1985). Individual colonies of G418-resistant cells were picked and tested for their expression of the N-myc gene by Northern blot analy- sis. As can be seen in Figure 2A, this resulted in the generation of a series of stable transfectants having differ- ent expression levels of the N-myc gene.
We then determined whether the transfectants showed any modulation of the steady state level of the MHC class I heavy chain mRNA or in the transcription of the gene for f3s-microglobulin with which the 45 kd MHC class I heavy chain protein is complexed at the cell surface. For this analysis, the filter shown in Figure 2A was stripped of probe and reanalyzed with a cDNA fragment from the mouse H-2Kd gene (Figure 2B). Subsequently, the filter was reprobed yet once more with a mouse f3P-microgiob- ulin probe (Figure 2C).
The results of these experiments clearly indicate that those cells that express a high level of the transfected N-myc gene exhibit decreased expression of MHC class I heavy chain mRNA. The effect of the N-myc gene prod- uct seems to be specific for the class I heavy chain, since no effect on the level of the BTmicroglobuiin mRNA was observed in any of the transfected cell lines (Figure PC).
We corroborated these results by measuring the levels of MHC class I antigens on the surface of the various cell tines. This was done by incubating the cells with a mouse monoclonal antibody that recognizes rat MHC class I anti- gens (Fukumoto et al., 1982) and then treating these cells with fluoresceinated second antibody that reacts with mouse immunoglobulins. Cell-surface fluorescence was measured using a cytofluorograph.
Cell, Vol. 47, 667-674, December 5, 1986, Copyright 0 1986 by Cell Press
N-myc Amplification Causes Down-Modulation MHC Class I Antigen Expression in Neuroblastoma
Rene Bernards: Scott K. Dessain,’ and Robert A. Weinberg”7 * Whitehead Institute for Biomedical Research, Cambridge, Massachusetts 02142 tDepartment of Biology Massachusetts Institute of Technology Cambridge, Massachusetts 02139
Summary
Amplification of the N-myc gene is correlated with in- creased metastatic ebility of human neuroblastomas. We show here that overexpression of the N-myc gene in a rat neuroblastoma cell line following gene transfer causes down-modulation of class I histocompatibility antigen expression and increases in the in vivo growth rate and metastatic ability of these cells. N-myc-medi- ated down-modulation of MHC class I antigen expres- sion could be reversed by treatment with interferon without affecting the steady state level of N-myc mRNA. No effect on MHC class I antigen expression was found when the N-myc gene was expressed in rat fibroblasts, indicating that some of the effects caused
ene amplification are cell-type-specific.
introduction
Substantial evidence exists that implicates activated cellu- lar oncogenes in the genesis of malignant disease. These oncogenes arise because of mutations that deregulate ex- pression of the proto-oncogene or affect the structure of the encoded protein (Bishop, 1985; Weinberg, 1985). Once created, oncogenes are thought to confer a growth advantage, thus facilitating clonal expansion of the mutant cell.
During tumor development, sequential selection of vari- ant cell subpopulations results in the preferential out-
rowth of increasingly more malignant cells (Nowell, 1986). Cncogene activation is postulated to play a key role in triggering the clonal expansion of these subpopula- tions. However, the precise role of cellular oncogenes in this process of tumor progression is poorly understood.
Evidence suggesting that cellular oncogenes are in- volved in specific stages of tumor development comes from several sources. Study of chemically induced rat mammary carcinomas strongly implicates activation of the H-ras oncogene in the initiating event of tumorigene- sis (Sukumar et al., 1983). Work on human neuroblastoma implicates amplification of the N-myc proto-oncogene in the later stages of tumor progression. These latter studies rely on diagnostic staging of the tumors. Thus, classifica- tion of a tumor as stage 1 indicates a tumor mass that is completely confined to the organ or structure in which it originated. Stages 2, 3, and 4 indicate progressive degrees of metastatic spread of tumor cells beyond the orimary site (Evans et al., 1971). Analysis of tumor DNAs
from patients having different stages of neuroblastoma disease has clearly shown that genomic amplification of the N-myc gene is more frequent in the more advanced stages of disease (Brodeur et al., 1984; Seeger et al., i985). This suggests that the N-myc gene plays a crucial part in determining the degree of malignancy of neuro- blastomas.
We have concentrated on this neuroblastoma model in an attempt to see whether N-myc amplification plays a causal role in tumor progression. To do this, we used a rat neuroblastoma cell line into which we introduced the N-myc gene by transfection. The traits of the transfectants were studied and found to undergo dramatic changes af- fecting cell antigenicity, growth rate, and metastatic ability.
Results
MHC Class i Antigen Expression in Neuroblastoma Cells MHC class I antigens are cell-surface glycoproteins that are required for the recognition of target celts by cytotoxic T lymphocytes (Zinkernagel and Doherty, 1979). The anti- gens are expressed on virtually all cell types and are con- sequently also expressed on almost all tumor cells. Neu- roblastoma and small-cell lung cancer are exceptions to this rule in that they often express very low levels of MHC class I antigens (Trowsdale et al., f980; Lampson et al., 1983; Doyle et al., 1985). These two types of tumors are also unique in that they often show amplification of one of the genes of the myc gene family (Schwab et al., 1983; Kohl et al., 1983; Little et al., 1983; Nau et al., 1985, 1986). We speculated that a connection might exist between these two separate sets of observations; namely, that the low expression of MHC class I antigens in these two types of tumors could be caused by the high expression of the myc genes in these cells. This speculation was also in- spired by earlier work that showed that expression of an adenovirus Ela oncogene could result in decrease of MHC class I antigen expression (Schrier et al., 1983).
To begin to document the relation between N-myc and MHC class I expression in human neuroblastomas, we ex- tracted RNA from a number of tumor cell lines having different degrees of amplification of the N-myc gene. These RNAs were then analyzed by Northern blotting for the expression of both the HLA class I heavy chain gene (Figure 1A) and the N-myc gene (Figure 1B). The three neuroblastoma lines having amplification of the N-myc gene, IMR32 (25-fold amplified), LAN-5 (50-fold ampli- fied), and NGP (120-fold amplified), all showed a dramati- cally reduced amount of MHC class t heavy chain tran- scripts when compared with two representative solid tumors of nonneuronal origin. In contrast, two of the three neuroblastoma cell lines with no N-myc gene amplification and no detectable N-myc expression (Figure IB) showed significant amounts of MHC class 1 heavy chain mRNA (Figure lA, lanes 4 and 5).
These results indicated that the low expression of MHC
NATURE IMMUNOLOGY VOLUME 12 NUMBER 2 FEBRUARY 2011 173
A RT I C L E S
Further supporting these in vitro observations, significantly less Tnf and Tnfrsf4 was evident in OVA-sensitized skin of Ccr8-deficient mice relative to wild-type mice in the model of chronic atopic dermatitis (Fig. 8f).
We also examined fresh human peripheral blood CD4+ T cells from healthy individuals for TH2 cytokine production by ICS. CCR8+CD4+ T cells produced markedly more IL-5 than did total bulk CD4+ T cells (Fig. 8g). Circulating steady-state CCR8+CD4+ T cells also produced more IL-5 than IL-4, a pattern shared by IL-25R– and IL1RL1-expressing CD4+ T cell subsets and opposite to the IL-4–predominant TH2 cytokine expression profiles of CCR4+ and CRTH2+CD4+ T cell subsets (Fig. 8h). Moreover, very little IL-5 was produced ex vivo by CCR4+CD4+ T cell subsets. Of note, in healthy individuals, CCR8+IL-5+CD4+ T cells also did not produce IL-13 (data not shown).
DISCUSSIONWe have described here the functional characterization of mouse CCL8 and established it as a second mammalian agonist for the chemokine receptor CCR8. We showed that mouse CCL8 was con-stitutively expressed in the skin and lymph nodes of normal mice in a pattern distinct from that of other related chemokines, reflecting its unique role in regulating immune responses. We determined that recombinant mouse CCL8 was chemotactic for activated, highly dif-ferentiated TH2 (TH2-R2A) cells specifically through CCR8, and that these cells were enriched for IL-5 and IL-25R, cytokines implicated in eosinophilic inflammation. CCR8+ TH2 cells were also enriched for OX40 and TNF. The absence of CCR8 or mouse CCL8 was protective, whereas the absence of CCR4 had no impact in a model of chronic allergic dermatitis. Adoptive transfer studies indicated that the mouse CCL8-CCR8 chemokine pathway mediates TH2 cell recruitment to
Ccl11a
b
c
e
f
h
i
d gCcl24
P PP
P
P
P
P
ll4
CCR8
Ccl27
Ccl8 Ccl1Ccl1
7Ccl2
2Ccl2
4Ccl1
1Ccl2
7Ccl8 Ccl1
Ccl17Ccl2
2Ccl2
4Ccl1
1
CCR8
Ccr8 Ccl1 Ccl8 Ccl27
CCR8
CCR8
CCR8
CCR8CCR8
CCR8CCR8
CCR8CCR8
CCR8
Ccl17 Ccl22
CCR8
CCR8CCR8
CCR8
Ccr8
CCR8
CCR8
P
P
II5
II25II13
CCR8
CCR8
CCR8
CCR8CCR8
CCR8
CCR8
CCR8
P
P
P
Figure 6 Ccr8−/− mice have decreased production of IL-5, IL-25 and eosinophil-active chemokines in allergen-sensitized skin. (a) QPCR measurements of transcripts for eosinophil-attracting chemokines. (b) Summary of QPCR measurements of chemokine mRNA expression in skin biopsies of wild-type (WT; *P = 0.01, **P = 0.0004 and ***P = 0.003 for PBS versus OVA) and Ccr8−/− (*P = 0.04 and **P = 0.03 for PBS versus OVA) mice after topical sensitization. (c) QPCR measurements of transcripts for TH2 cytokines. NS, not significant. (d) Serum OVA-specific IgE and IgG1 concentrations measured by enzyme-linked immunosorbent assay (ELISA) in sensitized mice. (e) QPCR of transcripts for CCR8 ligands. (f) Representative immuno-fluorescence analysis of mouse CCL8 protein expression in PBS-sensitized epidermis (epi) and dermis (derm) and OVA-sensitized epidermis and dermis of wild-type and Ccr8−/− mice from two experiments; n = 4 mice per group. (g,h) QPCR measurements of CCR4 and CCR10 ligands in skin biopsies of wild-type and Ccr8−/− mice after topical sensitization. (i) TH2 cytokine production by DLN cells after ex vivo stimulation with OVA protein and CD3, measured by ELISA (n = 8–10 mice per group). Pooled data from three experiments are shown. Results in b and i are shown as mean s.e.m. All data were obtained 50 d after the initiation of sensitization and are reflective of at least three experiments, except for f.
Islan et al Nat. Imm. 2011
Michael B. Eisen et al. PNAS 1998
80s 90s
MHC
cMYC
qPCR
microarrays
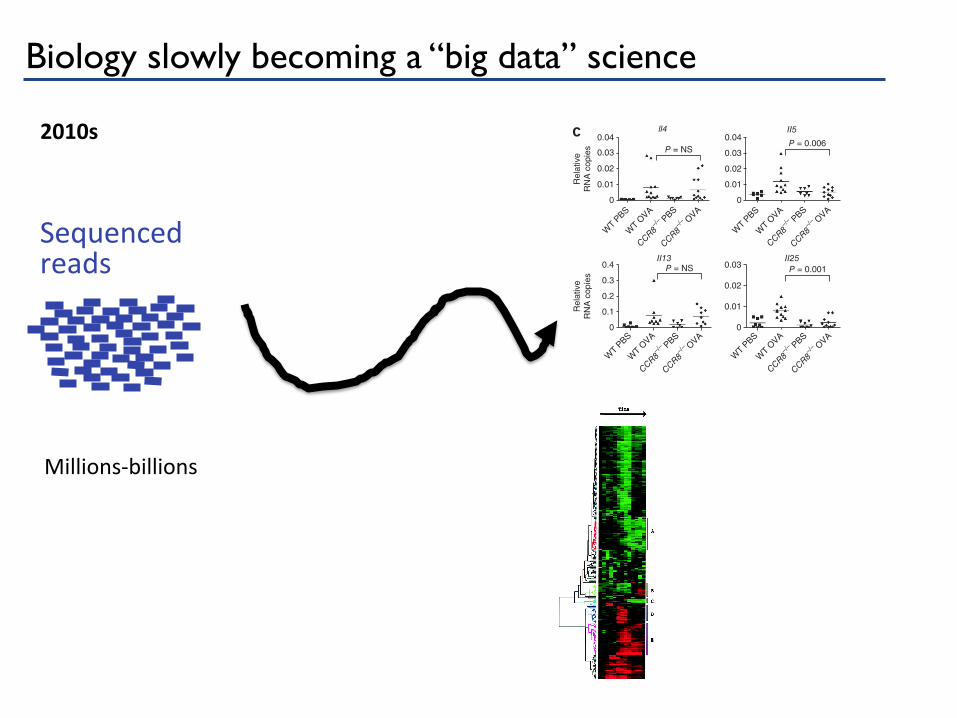
Biology slowly becoming a “big data” science
Sequenced reads
2010s
NATURE IMMUNOLOGY VOLUME 12 NUMBER 2 FEBRUARY 2011 173
A RT I C L E S
Further supporting these in vitro observations, significantly less Tnf and Tnfrsf4 was evident in OVA-sensitized skin of Ccr8-deficient mice relative to wild-type mice in the model of chronic atopic dermatitis (Fig. 8f).
We also examined fresh human peripheral blood CD4+ T cells from healthy individuals for TH2 cytokine production by ICS. CCR8+CD4+ T cells produced markedly more IL-5 than did total bulk CD4+ T cells (Fig. 8g). Circulating steady-state CCR8+CD4+ T cells also produced more IL-5 than IL-4, a pattern shared by IL-25R– and IL1RL1-expressing CD4+ T cell subsets and opposite to the IL-4–predominant TH2 cytokine expression profiles of CCR4+ and CRTH2+CD4+ T cell subsets (Fig. 8h). Moreover, very little IL-5 was produced ex vivo by CCR4+CD4+ T cell subsets. Of note, in healthy individuals, CCR8+IL-5+CD4+ T cells also did not produce IL-13 (data not shown).
DISCUSSIONWe have described here the functional characterization of mouse CCL8 and established it as a second mammalian agonist for the chemokine receptor CCR8. We showed that mouse CCL8 was con-stitutively expressed in the skin and lymph nodes of normal mice in a pattern distinct from that of other related chemokines, reflecting its unique role in regulating immune responses. We determined that recombinant mouse CCL8 was chemotactic for activated, highly dif-ferentiated TH2 (TH2-R2A) cells specifically through CCR8, and that these cells were enriched for IL-5 and IL-25R, cytokines implicated in eosinophilic inflammation. CCR8+ TH2 cells were also enriched for OX40 and TNF. The absence of CCR8 or mouse CCL8 was protective, whereas the absence of CCR4 had no impact in a model of chronic allergic dermatitis. Adoptive transfer studies indicated that the mouse CCL8-CCR8 chemokine pathway mediates TH2 cell recruitment to
Ccl11a
b
c
e
f
h
i
d gCcl24
P PP
P
P
P
P
ll4
CCR8
Ccl27
Ccl8 Ccl1Ccl1
7Ccl2
2Ccl2
4Ccl1
1Ccl2
7Ccl8 Ccl1
Ccl17Ccl2
2Ccl2
4Ccl1
1
CCR8
Ccr8 Ccl1 Ccl8 Ccl27
CCR8
CCR8
CCR8
CCR8CCR8
CCR8CCR8
CCR8CCR8
CCR8
Ccl17 Ccl22
CCR8
CCR8CCR8
CCR8
Ccr8
CCR8
CCR8
P
P
II5
II25II13
CCR8
CCR8
CCR8
CCR8CCR8
CCR8
CCR8
CCR8
P
P
P
Figure 6 Ccr8−/− mice have decreased production of IL-5, IL-25 and eosinophil-active chemokines in allergen-sensitized skin. (a) QPCR measurements of transcripts for eosinophil-attracting chemokines. (b) Summary of QPCR measurements of chemokine mRNA expression in skin biopsies of wild-type (WT; *P = 0.01, **P = 0.0004 and ***P = 0.003 for PBS versus OVA) and Ccr8−/− (*P = 0.04 and **P = 0.03 for PBS versus OVA) mice after topical sensitization. (c) QPCR measurements of transcripts for TH2 cytokines. NS, not significant. (d) Serum OVA-specific IgE and IgG1 concentrations measured by enzyme-linked immunosorbent assay (ELISA) in sensitized mice. (e) QPCR of transcripts for CCR8 ligands. (f) Representative immuno-fluorescence analysis of mouse CCL8 protein expression in PBS-sensitized epidermis (epi) and dermis (derm) and OVA-sensitized epidermis and dermis of wild-type and Ccr8−/− mice from two experiments; n = 4 mice per group. (g,h) QPCR measurements of CCR4 and CCR10 ligands in skin biopsies of wild-type and Ccr8−/− mice after topical sensitization. (i) TH2 cytokine production by DLN cells after ex vivo stimulation with OVA protein and CD3, measured by ELISA (n = 8–10 mice per group). Pooled data from three experiments are shown. Results in b and i are shown as mean s.e.m. All data were obtained 50 d after the initiation of sensitization and are reflective of at least three experiments, except for f.
Millions-‐billions
Statistical methods are deeply embedded – two concepts
Multiple testing problemsModeling count data
“One” slide probability review – Experimental data
• An experimental design consists of a choice of populations and a measurable property
– Two or more populations: • Cell types • Developmental times • Affected / not affected individuals • WT / KO / KD
– Measurements • # of cells • Gene expression • Fluorescence
“One” slide probability review – Measurements
• Measurements are what we do statistics on. We can usually look for “outliers”. Things out of the ordinary
• When we do comparisons we use “test statistics” built on the original measurements, similarly we look for values of the test statistics that are “out of the ordinary”
• What is an “outlier”? When is a measurement or a test statistic “out of the ordinary”?
“One” slide probability review – Distributions
• Measurements values follow a “distribution”, that is, some values are more likely than others. The probability of observing a value is described by the measurement “distribution”
• The number of mRNAs per cell for each gene ranges from a handful to thousands of copies. Overall, the “distribution” of expression is similar between cells
• “Shotgun” sequencing a genome results in a roughly uniform coverage of the original genome. In many cases we care about the “number of reads that land on a given region” the distribution of this counts have important properties
“One” slide probability review – Distributions (cont.)
Brain Gene Expression
Expression
Probability
0 1000 2000 3000 4000
0.000
0.002
0.004
0.006
0.008 Hummmm
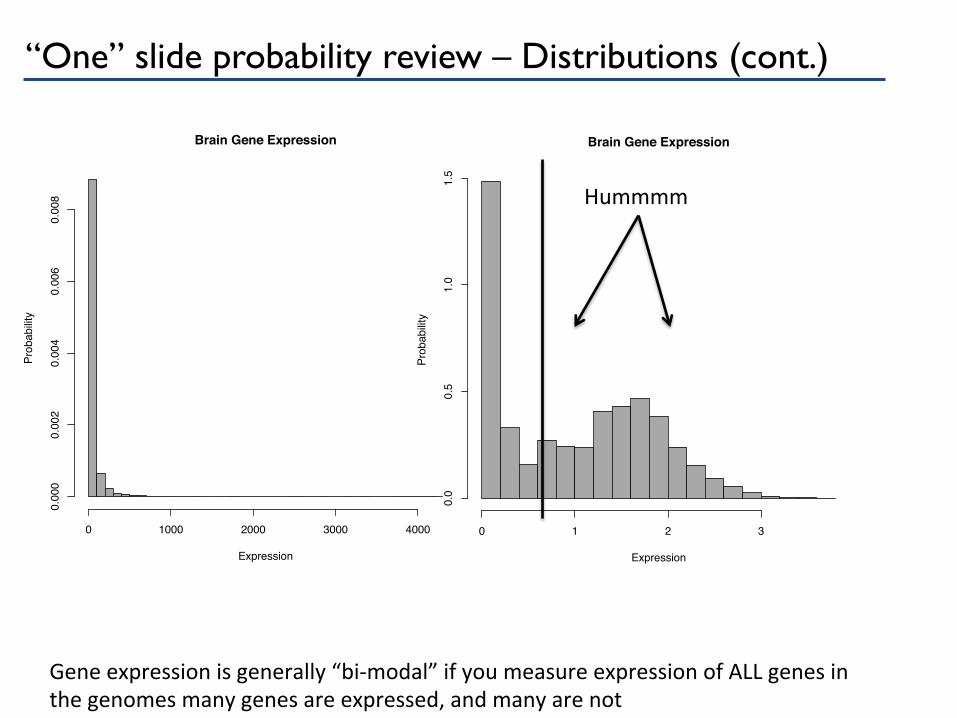
Gene expression is generally “bi-‐modal” if you measure expression of ALL genes in the genomes many genes are expressed, and many are not
Brain Gene Expression
Expression
Probability
0 1 2 3
0.0
0.5
1.0
1.5
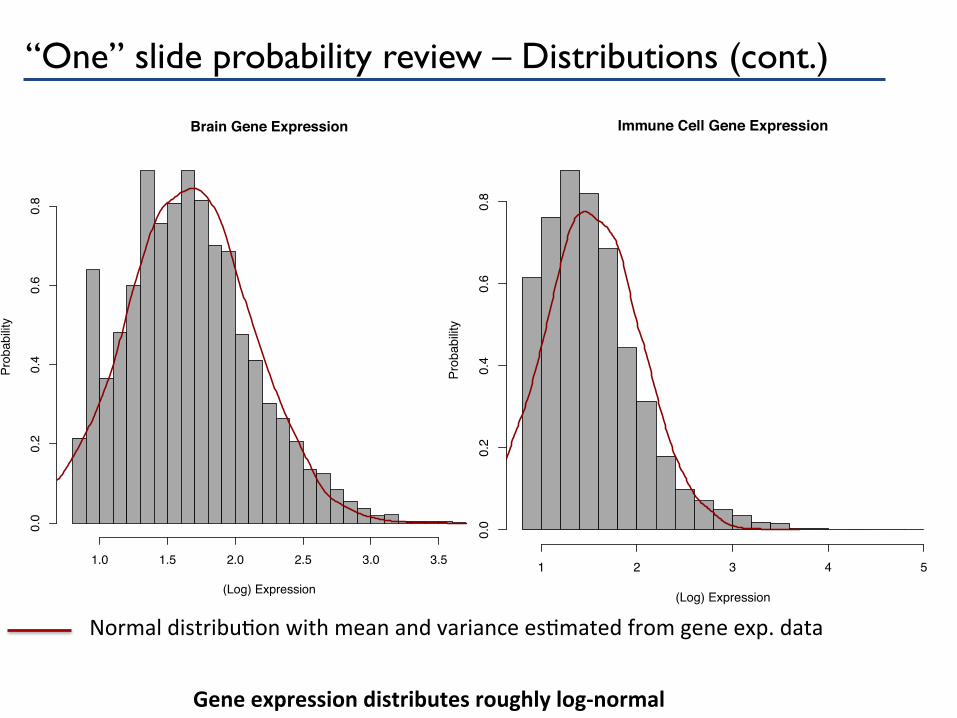
“One” slide probability review – Distributions (cont.)
Gene expression distributes roughly log-‐normal
Normal distribuPon with mean and variance esPmated from gene exp. data
Immune Cell Gene Expression
(Log) Expression
Prob
abilit
y
1 2 3 4 5
0.0
0.2
0.4
0.6
0.8
Brain Gene Expression
(Log) Expression
Prob
abilit
y
1.0 1.5 2.0 2.5 3.0 3.5
0.0
0.2
0.4
0.6
0.8
“One” slide probability review – p-values
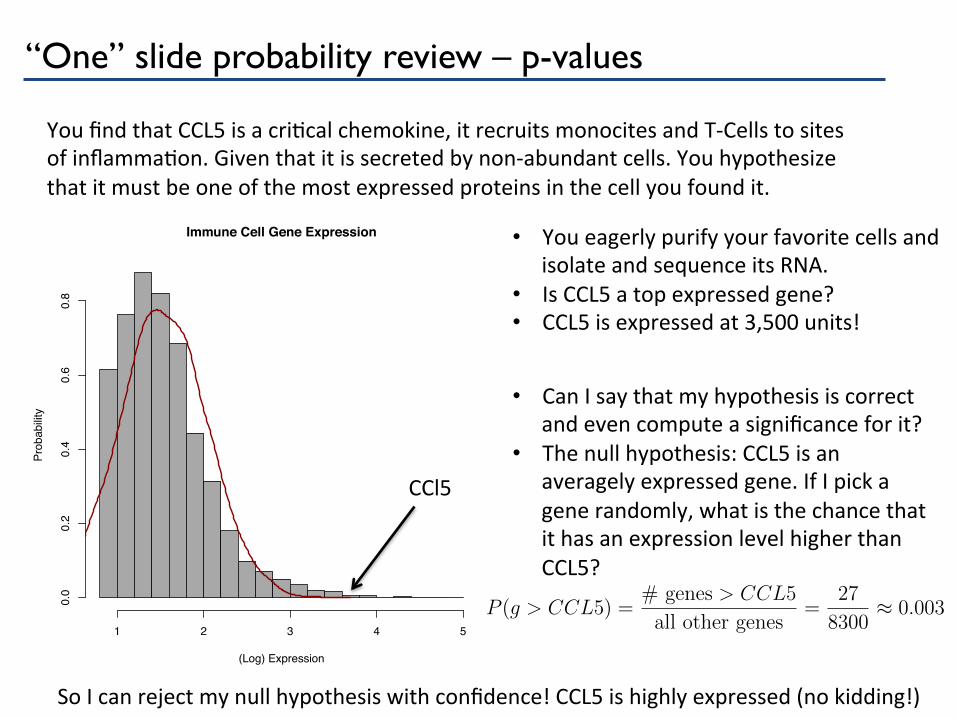
You find that CCL5 is a criPcal chemokine, it recruits monocites and T-‐Cells to sites of inflammaPon. Given that it is secreted by non-‐abundant cells. You hypothesize that it must be one of the most expressed proteins in the cell you found it.
• You eagerly purify your favorite cells and isolate and sequence its RNA.
• Is CCL5 a top expressed gene? • CCL5 is expressed at 3,500 units!
Immune Cell Gene Expression
(Log) Expression
Prob
abilit
y
1 2 3 4 5
0.0
0.2
0.4
0.6
0.8
CCl5
• Can I say that my hypothesis is correct and even compute a significance for it?
• The null hypothesis: CCL5 is an averagely expressed gene. If I pick a gene randomly, what is the chance that it has an expression level higher than CCL5?
So I can reject my null hypothesis with confidence! CCL5 is highly expressed (no kidding!)
⇡ N
G
G!
✓g
M
◆G(1 +
�g
M
)
N
(1� g
M
)
�G
=
g
G
G! (1 +�g
M
)
N
and remember(1 +
x
n
)
n ⇡ e
x
P (G|N) ⇡ 1
G!gGe
�g
max {d(r, s), s 2 S, r 2 R}
mean {d(r, s), s 2 S, r 2 R}
min {d(r, s), s 2 S, r 2 R}
P (i | q) = P (q | i)P (i)
P (q)
=
P (q | i)P (i)
Pj
P (q | j)
P (g > CCL5) =
# genes > CCL5
all other genes
=
27
8300
⇡ 0.003
2
More interesting example: Modeling sequencing data
Lets try a simple simulation
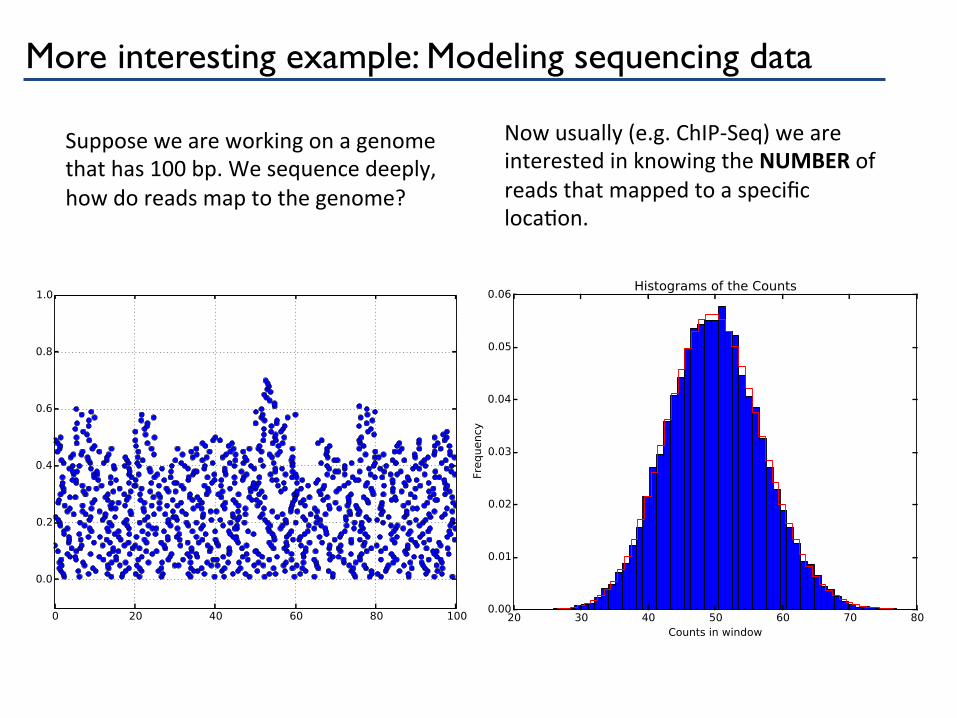
More interesting example: Modeling sequencing data
Suppose we are working on a genome that has 100 bp. We sequence deeply, how do reads map to the genome?
Now usually (e.g. ChIP-‐Seq) we are interested in knowing the NUMBER of reads that mapped to a specific locaPon.
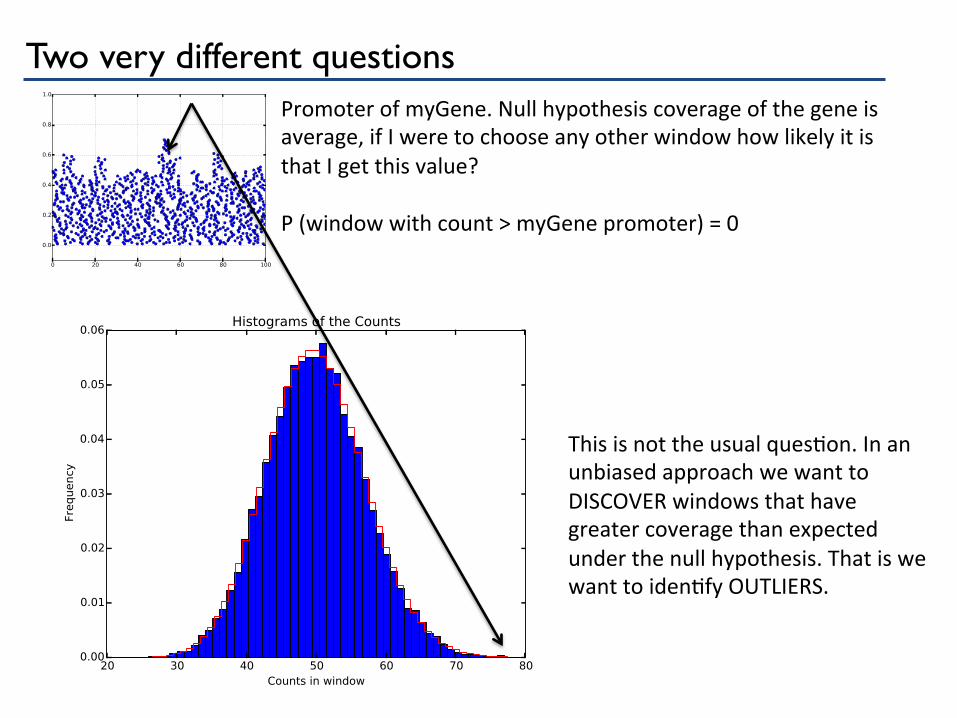
Two very different questions Promoter of myGene. Null hypothesis coverage of the gene is average, if I were to choose any other window how likely it is that I get this value? P (window with count > myGene promoter) = 0
This is not the usual quesPon. In an unbiased approach we want to DISCOVER windows that have greater coverage than expected under the null hypothesis. That is we want to idenPfy OUTLIERS.
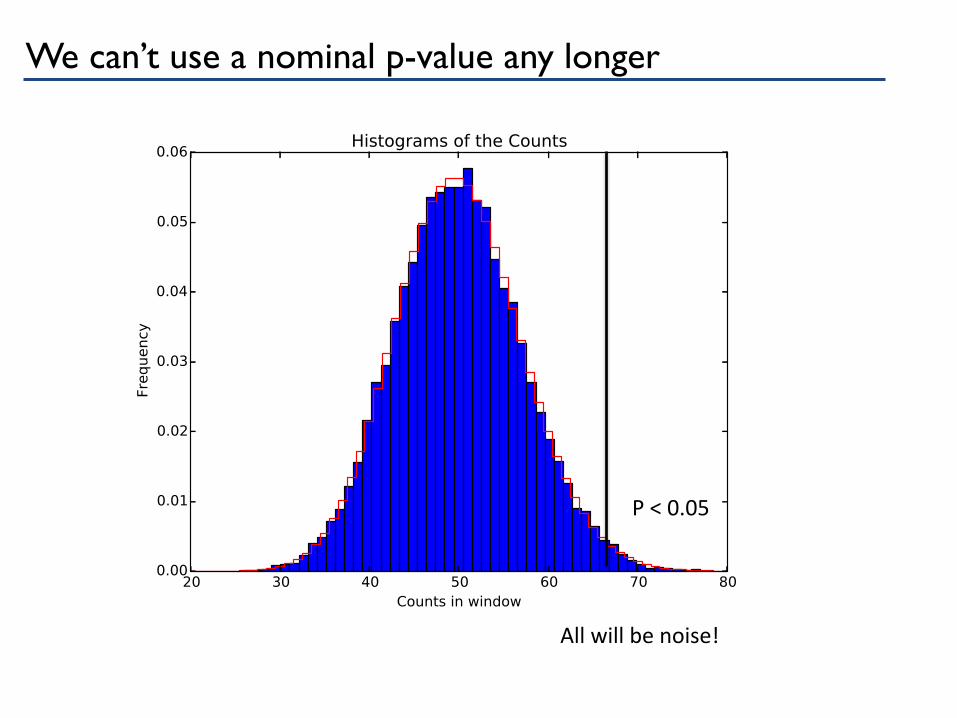
We can’t use a nominal p-value any longer
P < 0.05
All will be noise!
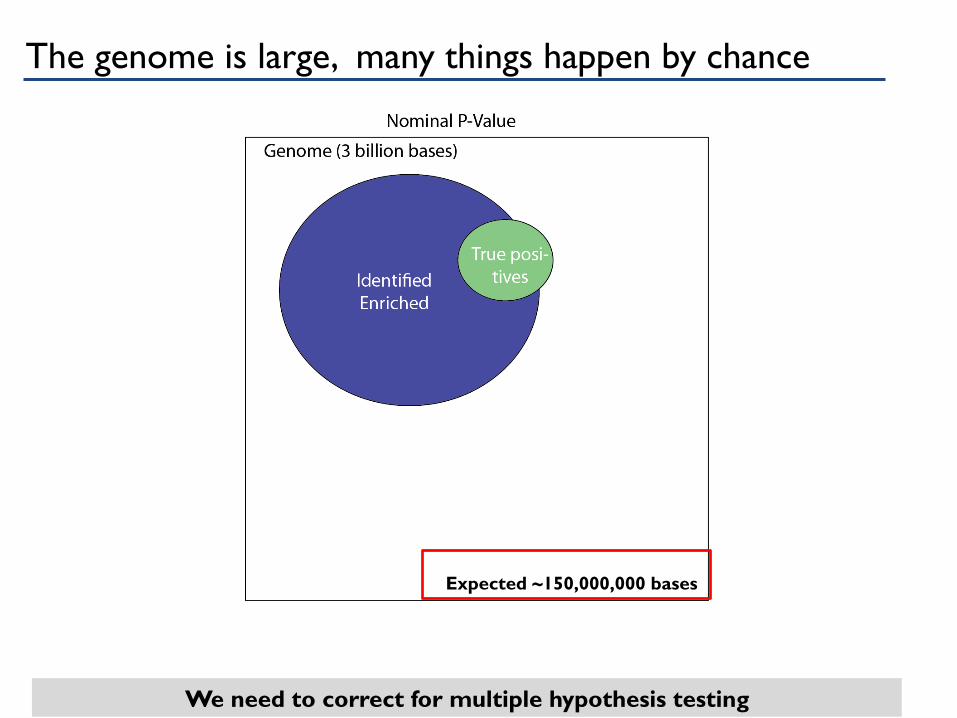
We need to correct for multiple hypothesis testing
Expected ~150,000,000 bases
The genome is large, many things happen by chance
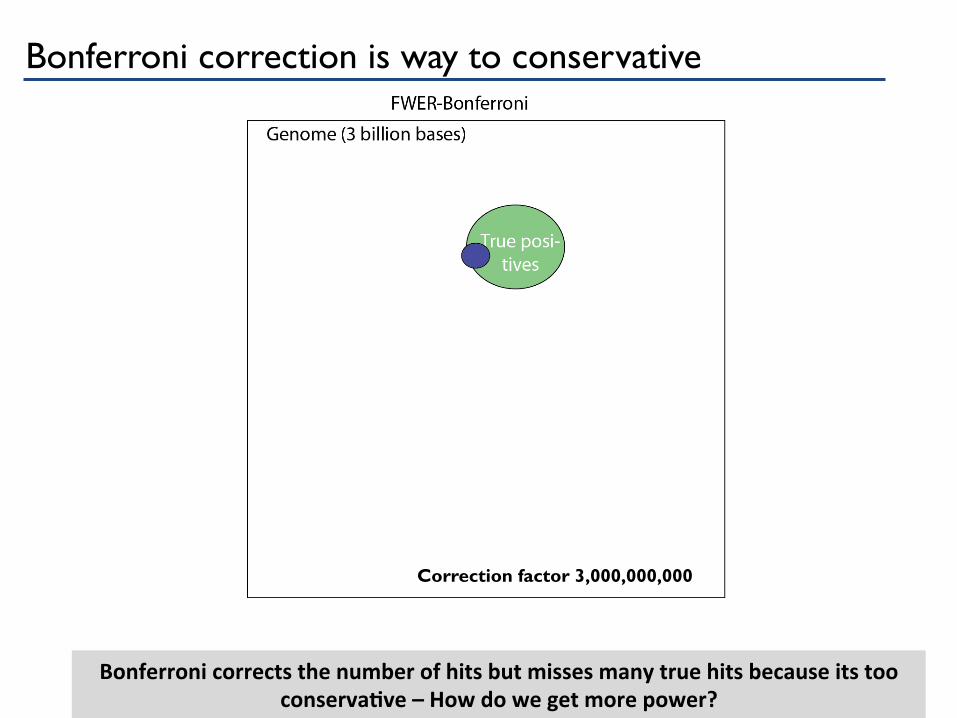
Bonferroni corrects the number of hits but misses many true hits because its too conservaGve – How do we get more power?
Correction factor 3,000,000,000
Bonferroni correction is way to conservative

How do we compute significance when we have this much data?
Downloadable from: hgp://garberlab.umassmed.edu/bootcamp.2015/BH.pdf