Embed Size (px)
Citation preview

ROAD FREIGHT ELECTRONIC DATA - DISCOVERY
DEPARTMENT FOR TRANSPORT -
Version: 1.3
Recipients: Paul McEvoy, Lucy Mills and Darren Williams - Department for Transport
Authors: Stephen Hale, Helen Taylor, Chris Oates, Liam King, John Gribbin - Lagom Strategy
Issued: 19 August 2019

TABLE OF CONTENTS
1. DISCOVERY OVERVIEW
1.1. EXECUTIVE SUMMARY
1.2. DISCOVERY PHASE GOALS
1.3. THE SCOPE OF THE DISCOVERY
1.4. PROJECT TEAM
1.5. DISCOVERY PHASE ACTIVITIES
1.6. KEY ASSOCIATED DOCUMENTS
1.7. BACKGROUND TO THIS DISCOVERY
2. STAKEHOLDER PERSPECTIVE ANALYSIS
2.1. OVERVIEW
2.2. KEY FINDINGS
3. USER RESEARCH
3.1. METHOD
3.2. SERVICE USER ROLES
3.3. KEY FINDINGS FROM THE USER RESEARCH
3.4. VALIDATING THE USER NEEDS
3.5. PRIORITISING THE USER STORY BACKLOG
4. JOURNEY SERVICE MAPPING
5. ASSISTED DIGITAL IMPACT ASSESSMENT
6. TECHNOLOGY REVIEW
7. LANDSCAPE ANALYSIS
7.1. CASE STUDY - PORT FREIGHT
7.2. CASE STUDY - STATISTICS AUSTRIA
Road Freight Electronic Data Discovery Report Page 2 of 79

7.3. CASE STUDY - STATISTICS DENMARK
7.4. CASE STUDY - GSS DATA PROJECT
8. RECOMMENDATIONS
8.1. THE CONTEXT FOR OUR RECOMMENDATIONS
8.2. OVERARCHING RECOMMENDATIONS
8.3. USER EXPERIENCE RECOMMENDATIONS
8.4. TECHNICAL RECOMMENDATIONS
8.5. DATA RECOMMENDATIONS
8.6. GOVERNANCE RECOMMENDATIONS
9. ANNEX I - DISCOVERY RESEARCH
10. ANNEX II - DISCOVERY OUTPUTS
Road Freight Electronic Data Discovery Report Page 3 of 79

1. DISCOVERY OVERVIEW
1.1. EXECUTIVE SUMMARY
The Discovery was conducted by Lagom Strategy (a digital service Discovery phase
specialist agency) from the beginning of May to the beginning of July 2019.
The Discovery focussed on three mandatory paper surveys currently used to collect
Road Freight Statistics from hauliers. In particular, it focused on understanding the
user needs (of both survey participants and data users), and what practical,
accessibility and attitudinal issues there might be to adopting a digital approach.
The research activities were conducted in line with the definition and guidance of a
digital service Discovery phase mandated by the Government Digital Service (GDS)
Digital Service Design Manual.
All publicly funded digital services are subject to such a Discovery phase before
proceeding to the next phase of technical development and design, and passing
subsequent service assessments.
The Discovery has concluded with a validated, and prioritised user story backlog and a
set of recommendations and experiments for the Road Freight Statistics team to
consider when progressing the service.
1.1.1. Summary of recommendations
The report’s recommendations for the Road Freight Statistics digital service range
across user experience, technology, data, and governance.
Overarching recommendations
➔ Proceed to Alpha for a digital survey
➔ Start with digital collection
➔ Use the Alpha to explore automated collection
➔ Complete the conversation with hauliers
Road Freight Electronic Data Discovery Report Page 4 of 79

User experience recommendations
➔ Offer hauliers a range of options to submit data, depending on their capacity
and capability
➔ Provide support (and validation) at the point of collection
➔ Do the work to enable survey respondents to check and confirm data already
held
➔ Redesign the communications around the survey
➔ Address hauliers motivation to complete the survey
➔ Redesign the support service
➔ Enable collaboration and workflow in the completion of a survey
Technology recommendations
➔ Start with a new architecture guided by the DfT Digital Service Architecture
➔ Use this as an opportunity to begin the creation of a digital platform
➔ Separate the survey respondent and analyst needs within the architecture
➔ Consider the analyst workflow as part of the core work
➔ Establish a standardised approach to technical work
➔ Favour a bespoke over commoditised solution for the Digital survey
➔ Considerations for selecting a technology
➔ Start with the GOV.UK Design System
Data recommendations
➔ Validate data at the point of collection
➔ Validate post-submission data
➔ Link to other data sets
➔ Explore the possibility of richer data sets
Road Freight Electronic Data Discovery Report Page 5 of 79

➔ Make use of new metadata
➔ Explore opportunities for machine learning in the data collection process
➔ Explore new opportunities for modelling
Governance recommendations
➔ Assemble a multidisciplinary team
➔ Learn from other service delivery teams
Note: all of these recommendations are explored in detail in Section 8.
1.2. DISCOVERY PHASE GOALS
At the start of the Discovery we agreed on these goals with the Road Freight Statistics
team. They align with the GDS definition of the Discovery process, with some
additional goals:
1.Understand the triggers, experience, context, behaviour and needs of your
priority user roles (e.g. survey respondents and data users) with the current
survey and a prospective digital survey.
2.Explore what you, wider stakeholders, and survey data users want to achieve,
where that does and does not overlap with user need, and how the survey can
support those goals.
3.Examine the actual survey data and its life-cycle process. How much is there?
Where is it stored? Who can see it? Who should see it? When? How is it shared
and accessed? How is it secured?
4.Understand the attitudes (positive and negative) of shi�ing to a digitised
experience, especially the impact and considerations of accessibility, and
supporting assisted digital need users.
5.Develop a prioritised backlog of evidence-driven, validated user stories for a
prospective digital survey (ready to develop in an Alpha).
6.Explore the internal and external technology constraints and opportunities for a
digital survey, including alignment with the DfT Digital Strategy.
Road Freight Electronic Data Discovery Report Page 6 of 79

7.Develop user experience concepts for a digital survey to communicate the
direction of technology and user experience to stakeholders (ready to test with
users for early feedback).
8.Make clear actionable recommendations on how to proceed to an Alpha in line
with the GDS Digital Service Standard so you can pass future, strict GDS Service
Assessments.
1.3. THE SCOPE OF THE DISCOVERY
The following Road Freight Travel Surveys were in scope for this Discovery.
➔ Continuing Survey of Road Goods Transport Great Britain (CSRGT GB)
➔ Continuing Survey of Road Goods Transport Northern Ireland (CSRGT NI)
➔ International Road Haulage Survey (IRHS)
1.4. PROJECT TEAM
1.4.1. Lagom Strategy
➔ Stephen Hale - Lead Digital Strategist and Project Lead
➔ Dr Helen Taylor - User Researcher and Delivery Manager
➔ Liam King - Digital Strategist
➔ Dr John Gribbin - User Researcher
➔ Chris Oates - Technical Lead
➔ Gordon Squire - Data Consultant
1.4.2. Department for Transport
➔ Paul McEvoy - Head of Road Freight Statistics
➔ Lucy Mills - Road Freight Statistics
➔ Darren Williams - Road Freight Statistics
Road Freight Electronic Data Discovery Report Page 7 of 79

1.5. DISCOVERY PHASE ACTIVITIES
The Discovery was conducted from early May to early July 2019.
These activities allowed us to generate the insights and recommendations in this
report and the other Discovery outputs:
1.Kick-off workshop with key project stakeholders (8th May 2019)
2.Reviewed numerous online and documentary sources (see Annex I)
3.Conducted 8 stakeholder interviews (see Annex I)
4.Conducted 17 one-to-one user interviews with Haulers and Data Users
5.Ran a user needs workshop with a range of stakeholders and 6 end user role
representatives, to generate proto-personas and user journey scenarios (3rd
June 2019)
6.Analysis of a user feedback survey with 47 responses
7.Analysis of a user needs survey with 37 responses (see section 3.4)
8.Observed 3 field visits including visits to hauliers and a visit to the Hastings
Capture Team
9.Developed a journey service map of the current service
10. Created and prioritised 37 user stories with the Road Freight Team (20th June
2019)
11. Presented a project show-and-tell (26th June 2019)
12. Conducted a technology review (see section 6)
13. Performed a landscape analysis including 4 interviews (see section 7)
14. Assessed the assisted digital impact (see section 5)
15. Developed concept prototypes
1.5.1. User research participation levels
Road Freight Electronic Data Discovery Report Page 8 of 79

Participation levels in the user research activities were satisfactory for the level needed
for a thorough Discovery process.
It is important to consider the Discovery the start and not the end of ongoing user
research. Do ongoing research is one of GDS’s 18 Digital Service Standard checks and
critical to passing future assessments.
1.6. KEY ASSOCIATED DOCUMENTS
➔ Proto-persona profiles
➔ User story backlog
Note: all project documentation has been gathered and exported for the Department
to store on their SharePoint server.
1.7. BACKGROUND TO THIS DISCOVERY
Road Freight Statistics are collected by the Department for Transport via 3 mandatory
paper surveys requiring approximately 16,000 paper forms to be completed each year.
There is a broad range of survey respondents. They might be transport managers,
compliance managers, drivers, or chief executives, depending on the size and nature
of the haulage firm.
Policy makers working within government, and transport consultants and modellers
outside of government use the published data to inform their evidence base for
transport planning and policy.
The Road Freight Statistics team are concerned about inherent disadvantages of the
current methods of data collection, including poor data quality, respondent burden,
high costs and lag time.
Previous work includes a limited piece of research conducted by Systra in 2015, which
made some recommendations to improve collection methods, and highlighted some
of the potential opportunities of shi�ing to more digital methods in the future.
Road Freight Electronic Data Discovery Report Page 9 of 79

2. STAKEHOLDER PERSPECTIVE
ANALYSIS
2.1. OVERVIEW
We conducted structured interviews with stakeholders of the Road Freight Survey to
ensure that their needs and views were understood and accounted for in the research
process.
We completed eight interviews with stakeholders all of which were employees of the
Department of Transport.
The interviews took place in May 2019.
See Annex I for a full list of interview participants. Detailed notes from each interview
are available in the project’s Basecamp space:
https://3.basecamp.com/3606110/projects/12068489
Stakeholders are open and honest about the advantages and disadvantages of current
methods. Many rightly express pride in the rigour of current processes, and the efforts
devoted to achieving usable data. But there is considerable appetite to shi� to
methods that might lead to faster, more accurate and richer data.
2.2. KEY FINDINGS
2.2.1. Purpose and demand
2.2.1.1. The purpose of collecting road freight statistics is clear, and
there is significant demand for this data from data users
Stakeholders are clear that road freight statistics are necessary to provide evidence for
policy decisions.
This is confirmed by the policy makers we interviewed, who also noted that recent
work to plan for EU Exit scenarios had highlighted the importance of all data relating to
trade, including road freight statistics.
Road Freight Electronic Data Discovery Report Page 10 of 79

Brexit has created an urgent need for data, and highlighted the importance of what we collect.
The UK is obliged to publish statistics in a consistent way to other EU member states, but stakeholders recognise that users of road freight statistics would actually like more granular, and more regular statistics than Eurostat require.
There is a legislative requirement from Eurostat to provide them with road freight data.
I’d like to be able to look at monthly or weekly data rather than quarterly.
Stakeholders also recognise the value of road freight statistics for users outside government. And data users themselves confirm that they have no alternative source for this kind of comprehensive data.
Freight is strongly important for our models, particularly around things like air quality or noise. But it’s where our data is weakest.
2.2.1.2. Stakeholders are aware that the current survey methods limit how well they can meet the demand for more granular data
Stakeholders are well aware of the limitations of some of the current survey methods.
In particular, they recognise that the Eurostat categories for goods carried lack the granularity demanded by users of the data.
We can’t code for ‘chicken’, we code for ‘food products’.
Similarly, the current sample size limits the level of geographical insight available to data users. This has been a particular issue for policy makers working on EU Exit scenarios, for example seeking insight into road freight at the Northern Ireland border.
Stakeholders also recognise that the current survey methods are labour intensive for hauliers and the department, and limit the potential to increase the scale of the survey in its current form.
Road Freight Electronic Data Discovery Report Page 11 of 79 -

If they want a specific commodity like ‘nuclear material’ we might not have enough to be statistically significant.
Some data users expressed a desire for the published road freight statistics to include additional data, including data about the value of goods carried.
2.2.1.3. There is unmet demand for data about the complete journey of goods, including via road, rail, air and boat
Both stakeholders and data users would ultimately like to be able to track the entire journey of goods, including when the mode of travel changes.
Those working on road freight statistics are frustrated that they are unable to meet this demand.
We capture it if the lorry drives onto a ferry and drives off it, but not if it drops the trailer off at a port. We’ve no idea what happens to that at the moment.
Category lists for goods carried by different modes are currently different, and so stakeholders do not see any straightforward way of meeting this demand.
Intermodal data is hard to do at the moment. I’m not aware of any easy way of linking the data. There would need to be additional data captured to do this.
But, while this discovery may not solve this issue directly, stakeholders hope that a shi� to digital methods might provide greater opportunity to meet the demand for intermodal data in the future.
It’s complex, and it’s frustrating how hard this is [...] Shi�ing to digital methods won’t solve it, but it would be a step towards intermodal data.
2.2.2. Issues in the current process
2.2.2.1. Interpreting handwriting, and possible errors during manual data entry, cause concerns about the accuracy of the data
Stakeholders mention the opportunities for errors throughout the current process.
Road Freight Electronic Data Discovery Report Page 12 of 79 -

The need to interpret handwriting is a direct consequence of paper methods of collection.
Some of them have handwriting like doctors prescriptions. -
Quite o�en we’re working out what people meant.
The capture team currently follow up 10% of surveys with hauliers to check details included in the survey.
We have to contact 2 or 3 out of every 30 forms to check something. It’s o�en to check the weight, or the cargo type, or the description of goods. We can’t guess these things.
The capture team are experienced and conscientious, but interpreting the meaning of handwritten surveys has clearly brings the possibility of error.
Similarly, stakeholders acknowledge that there is opportunity for keystroke errors, or other human errors, throughout the process, as hauliers and then officials manually copy data from one format to another.
There’s opportunity at every stage for things to go wrong. We’re manually entering the data, transferring it from SQL to Excel and back to SQL.
2.2.2.2. Stakeholders are frustrated by the protracted nature of the current processes
Stakeholders recognise the demand from data users for current data. They point out that changes to the service that could speed up the process, or reduce some of the need to clean and validate the data a�er collection would be welcome to those using the data.
Seven months for a statistical service is quite good, but from a policy sense it may not meet the need.
2.2.3. Opportunities for improvement
Road Freight Electronic Data Discovery Report Page 13 of 79 -

2.2.3.1. Stakeholders recognise the opportunity that digital methods provide to validate data at the point of collection
Stakeholders point out that a�er-the-fact validation adds time and frustration to the process, and has the potential to lead to inaccuracy.
Quite a lot of effort goes into helping survey respondents input correct data at the moment, including through written guidance. But stakeholders recognise that however well written the guidance is, they cannot guarantee that hauliers will follow it.
You can tell who has read the guidance notes and who hasn’t when you look at the form. People sometimes insist on writing 10 rows of data when they don’t need to.
Stakeholders expect that a shi� to digital methods will enable more efficient and earlier validation, including validation of the data at the point of collection.
Some stakeholders have quite well developed ideas about how this kind of up-front validation could save time and effort in the current process, leading to cleaner data much earlier.
It could do validation up front by using drop down lists, or selectable images or other user controls, based upon agreed master and reference data.
Stakeholders expect digital methods to also make it possible to provide guidance to survey respondents at the point that they need it, as they are completing the form, rather than in a separate document.
We should provide real time automated prompts and guidance to hauliers.
2.2.3.2. Stakeholders recognise that processing the data is currently labour intensive, and that more automated methods have the potential to redirect capacity to more valuable tasks
Stakeholders, including those outside the immediate team, praise the diligence of the current efforts to process the data.
Road Freight Electronic Data Discovery Report Page 14 of 79 -

The current validation process is good. They’re putting a lot of effort into doing this well. But it sounds like it requires a lot of resources.
However there seems to be consensus that there is opportunity to automate some processes in order to address the risk of errors and speed up the current process.
The current process contains multiple steps, and multiple methods and tools (see Service Journey Mapping section).
Stakeholders recognise the opportunity for inaccuracy inherent in the current process.
Movever, more efficient processing of the data, may create more capacity in the team for analysis of the data.
We could do more with the data ourselves. If we had capacity, we could route it through a mapping system and analyse the trends in the data ourselves.
2.2.3.3. Stakeholders recognise the opportunity to reduce the burden on users and increase accuracy by pre-populating data that the state already holds, rather than asking users to input it
All stakeholders express concern about the burden the process places on hauliers. Some see opportunities to reduce the current burden by using data that government already holds.
Filling in contact details could be easier. We already know these details because we sent them the survey.
A lot of the survey asks for things which we get/hold from DVLA. We know the actual configuration of the vehicle and weight limits, but we still ask for it on the form.
Some stakeholders foresee a future solution in which hauliers are simply asked to check and confirm details, rather than enter them themselves. This could include details about journeys if they were collected automatically.
It’d be great to have an online tool that prompted the user to answer questions “it looks like you’ve done this journey, could you confirm that?” validating what has already been collected.
Road Freight Electronic Data Discovery Report Page 15 of 79 -

2.2.3.4. Mobile and tracking technology has the potential to automate the collection of origin, destination and route
Stakeholders express hopes that a future solution could automate the collection of journey information. If possible, this could reduce the burden on hauliers, and ensure accurate data with reduced need for processing.
Automating origin and destination would reduce our workload processing it quite a lot.
Stakeholders mentioned the possibility of using a variety of existing or bespoke tracking solutions. However, some expressed concern about the Department encouraging drivers to use mobile phones to track journeys.
We don’t want to encourage driving whilst using a phone.
2.2.3.5. Stakeholders are conscious of the need to be inclusive to all hauliers, and are concerned that some hauliers may lack the digital skills to shift from paper to digital
Stakeholders take the issue of inclusion very seriously, and point out that the haulage industry includes all kinds of operators, from very small businesses with one or two employees, to huge international businesses.
Smaller operators might be working from their kitchen tables from pieces of paper.
Those working in the team point out the low take up of the current Excel version of the survey form, and the possibility that this indicates a preference for paper, or even a lack of digital skills in the industry.
They don’t seem to use the Excel version, and they respond by letter when we give them a digital alternative.
2.2.3.6. Stakeholders suspect that hauliers might be reluctant to share additional data with the department
Road Freight Electronic Data Discovery Report Page 16 of 79 -

Some stakeholders see the potential to automate the collection of some road freight statistics from hauliers.
However, those working in the team are not confident that hauliers would willingingly share additional data with the department, citing possible commercial sensitivity, and a general desire to control what government knows about their businesses.
Fleet management and tracking data is incredibly unexplored. We think haulage companies might be reticent to provide this data.
2.2.3.7. The department appears to have little routine contact with hauliers
It is clear that the Capture Team in Hastings have regular contact with hauliers relating to the completion of surveys, and that this is a valued service.
But stakeholders acknowledge the criticism that the Department has limited direct contact with hauliers.
When our policy colleagues have engaged with hauliers the criticism has been that they don’t understand the haulage industry.
We don’t really talk to them. -
Road Freight Electronic Data Discovery Report Page 17 of 79 -

3. USER RESEARCH
3.1. METHOD
Our researchers consulted with a range of Road Freight Survey users during the Discovery to explore their context, needs, emotions, and behaviours.
3.1.1. Qualitative research
➔ 17 one-to-one interviews with user representatives (survey respondents and
data users)
➔ 6 user participants in a user needs workshop
➔ Observed 3 field visits with haulage companies and with the Hastings Capture
Team
➔ Reviewed open text comments in 84 online surveys
3.1.2. Quantitative research
➔ 47 respondents to the user feedback survey
➔ 37 respondents to the online user needs survey
➔ Reviewed published and unpublished Road Freight statistics
Note: due to time restraints, all surveys were online surveys in which links were sent to
email addresses. It is appreciated that this brings in a bias toward users with a higher
level of digital literacy. This was considered when interpreting the results and
balanced by interviewing users with lower digital literacy.
3.2. SERVICE USER ROLES
The Discovery has explored and validated these user roles:
3.2.1. Primary roles
3.2.1.1. Survey Respondents
Road Freight Electronic Data Discovery Report Page 18 of 79

➔ These are people who complete the surveys (either the domestic, international
or Northern Ireland)
➔ Typically from haulage companies including small, medium and large -
companies and includes hire companies -
➔ Survey respondents include transport managers, drivers, and compliance
managers
3.2.1.2. Data Users
➔ These are people who use the data and include policy makers and transport modellers
3.3. KEY FINDINGS FROM THE USER RESEARCH
3.3.1. Demand from data users
3.3.1.1. Data users are frustrated by the lack of granularity in the data
Data users, including government policy makers and external transport consultants and modellers, rely on road freight statistics collected and published by the Department.
Some data users increasingly combine DfT road freight statistics with other sources of data (including mobile phone and other sources of ‘big’ data) to derive insights. But they have no comparable source of comprehensive road freight statistics.
Most data users expressed a desire for more granular road freight data, particularly more granular data about goods carried.
It would be helpful to have more detail about what goods are being transported. We might just get “food” or “metals” which would be more useful if we could break it down.
This is currently of particular importance to policy makers planning for EU Exit scenarios.
Road Freight Electronic Data Discovery Report Page 19 of 79 -

We’re particularly interested in perishable goods, because they will be affected by any delays.
We need some really specific details about how UK hauliers move between different member states, and how to break down the different parts of the same journey with multiple stops.
Some data users also expressed a demand for more detailed data about journeys than exists at the moment, and suggested additional data that would be useful to them.
I’d like the survey to capture the value of the goods, the category of the goods, where the start and finish points are, and possibly the value of the insurance on the goods transported.
3.3.1.2. The demand from data users for consistent time series data, is outweighed by the demand for more detailed and more accurate data
Some data users mentioned the importance of a consistent time series for road freight statistics.
However, all of the data users we spoke to placed a higher value on achieving more accurate and timely data for the last year.
You’d have to make a significant improvement to justify breaking the series. But I’m more interested in accurate data now, than previous data.
3.3.2. Context for hauliers
3.3.2.1. Unlike data users, survey respondents are vague on the purpose of collecting road freight statistics, regarding it simply as an administrative necessity
None of the hauliers we have spoken to fully understood what happens to their data once they had sent it to the Department, or the wider process.
I haven’t got a clue what happens to the data once I’ve sent it away. -
Road Freight Electronic Data Discovery Report Page 20 of 79 -

Survey respondents don’t recall being told about the purpose of the survey (in the letter they receive), and don’t have any contact with the Department, unless contacted by the Hastings Capture Team to make corrections to their survey form.
However, hauliers do express an interest in what their data is used for, and wider data about the industry.
It’s good to understand our industry, as a market rather than what our competitors are doing. I run a business, and I want to make sure the haulage industry works well.
Some hauliers made unsolicited suggestions for data that the Department could collect in order to better understand the challenges faced in the industry, rather than (or in addition to) the data currently collected. For example, hauliers mentioned evidence about emissions or permits for international road freight.
I would like to see the emissions status of the vehicles on the form, this would provide vital data to prove the industry has and continues to lower emissions.
They [the Department] should also be asking about the experience and details of the border crossings we go through, like: ‘what permits did you need to make each journey’?
3.3.2.2. Survey respondents tend to regard the Department as remote, with little understanding of the issues facing hauliers
Survey respondents say the department lacks empathy for those working in the haulage industry.
They don’t really understand our business.
Some welcomed the field research methods used during this discovery, whilst lamenting the general absence of similar approaches by the Department.
It would be nice if they came out to see some transport companies to see what it is really like.
Road Freight Electronic Data Discovery Report Page 21 of 79 -

Some expressed surprise that those responsible for making policy decisions about the haulage industry were not cognisant of the information that hauliers are asked to provide.
Don’t take this the wrong way, but it’s incredible that the policy maker responsible for dangerous goods has never seen the form.
3.3.3. The current process
3.3.3.1. Survey respondents don’t regard the current survey as being a significant burden, but smaller hauliers in particular operate under time pressure, and are resistant to any additional tasks
Survey respondents tend to regard the current survey as an inconvenience, but not a significant burden.
They report that the survey might take 90 minutes to complete.
Our survey seems to confirm a relatively low level of burden amongst hauliers. However, hauliers were clear that they do not welcome new tasks from government that take valuable time whilst providing little benefit in return, and they use colourful rhetoric to illustrate this point.
The letter comes through and the colour drains from our faces. -
Imagine you’re being stung by a swarm of wasps. This is one of the wasps.
There are some businesses for whom this survey represents a more significant burden. Interestingly these include small businesses (who may rely on a very small number of employees covering a wide range of responsibilities), and larger businesses (who may receive a larger number of surveys, but all filtered through a single person or role).
It’s quite an onerous process, for something that seems quite simple, because of the people involved. It might be two, or three, or four people filling it in and we’re all busy people.
Road Freight Electronic Data Discovery Report Page 22 of 79 -

Those working in vehicle hire companies report higher levels of burden, almost certainly because the current process was not designed for an intermediary acting as a proxy for the person with responsibility for the vehicle at the time of the survey.
3.3.6 Survey respondents motivation to complete the survey is to remain compliant and avoid a fine, but little else
The (mandatory) survey currently achieves a high completion rate.
I just look at is as one of those things that you need to do in life.
Survey respondents report that their motivation to complete the survey is o�en related to the threat of a fine for non-completion, although hauliers resent the threat.
Government bodies are always willing to hit you with a fine. If I’m willing to take the time to do it, I don’t want to be threatened.
Hauliers also describe a culture of compliance within the industry that may contribute to high completion rates.
Some also describe other imagined consequences.
I hope by doing it it’s going to do my reputation good with the Department and the DVSA. I don’t know whether they make a note of how cooperative we’ve been, or whether we get a tick in the box.
points with the DVSA.
More worryingly, some imagine consequences that may limit the accuracy of the data they provide.
It would be more of an incentive if it had some benefit to me, like bonus -
The more information I provide the more likely I am to get asked for more.
Given the apparent culture of grudging completion, it would be interesting to further test and understand the impact of hauliers attitude on the accuracy of their response, as well as completion rate.
Road Freight Electronic Data Discovery Report Page 23 of 79 -

3.3.3.2. Copying data from digital systems to paper introduces the potential for error, as well as increasing the burden on survey respondents and resentment about the process
Some survey respondents report that they are unsure about the accuracy of their responses to the survey.
Some report possible errors in recall. Some talk about the possibility of human error when copying data from one system to another. Some report possible errors caused by the current format.
and keep it neat and tidy.
And some report that would be possible to complete the survey with entirely incorrect data at the moment in order to remain compliant, although we have found no evidence of this happening.
There’s a lot of information to cram into the form. You have to write small -
You could fill in the form and put a load of old rubbish in, and it’s done.
In our survey 93% of survey respondents were confident about the accuracy of their responses.
Interestingly all of those who expressed doubt about the completeness or accuracy of their survey completed the survey at the end of the process, suggesting that this may be related to problems of recall, or possibly difficulties coordinating the work input of others.
3.3.3.3. Survey respondents welcome the support provided by the Department through reminders, written guidance and telephone support, although they don’t always use it
Hauliers expect and value the support they get from the dDepartment, including reminders, written guidance and telephone and email support from the Capture Team.
I’ve been doing these for quite a few years. I sometimes check the guidance to remind myself of something. It works quite well.
Road Freight Electronic Data Discovery Report Page 24 of 79 -

However this support does not prevent all errors (10% of surveys require further checks with the respondent a�er submission).
And, although they value the help, survey respondents also say that the support is easy to miss or ignore.
3.3.4. Opportunity for improvement
3.3.4.1. Some hauliers value the convenience of current process and are wary of change, but they are digitally capable and there is little evidence that hauliers are digitally excluded
Hauliers work in a wide range of environments. Survey respondents are not always office-based, and some say that they are not particularly digitally savvy.
We’re in the Steptoe and Son era. Smaller companies are more advanced than we are.
However, although some survey respondents expressed a preference for paper over digital methods, we found no evidence that these groups of survey respondents are incapable of using digital methods, or digitally excluded.
In fact, we heard that haulage is an industry that relies on digital and data technologies to operate, and that hauliers place a high value on the digital competence of staff.
IT and logistics skills are key in their sector. If you don’t keep up then you will be struggling.
When we asked survey respondents which digital sources they have access to, we received a range of digital and data sources. Notably, nobody said that they didn’t use any digital sources at all.
What sources of digital data does your business have?
Road Freight Electronic Data Discovery Report Page 25 of 79 -
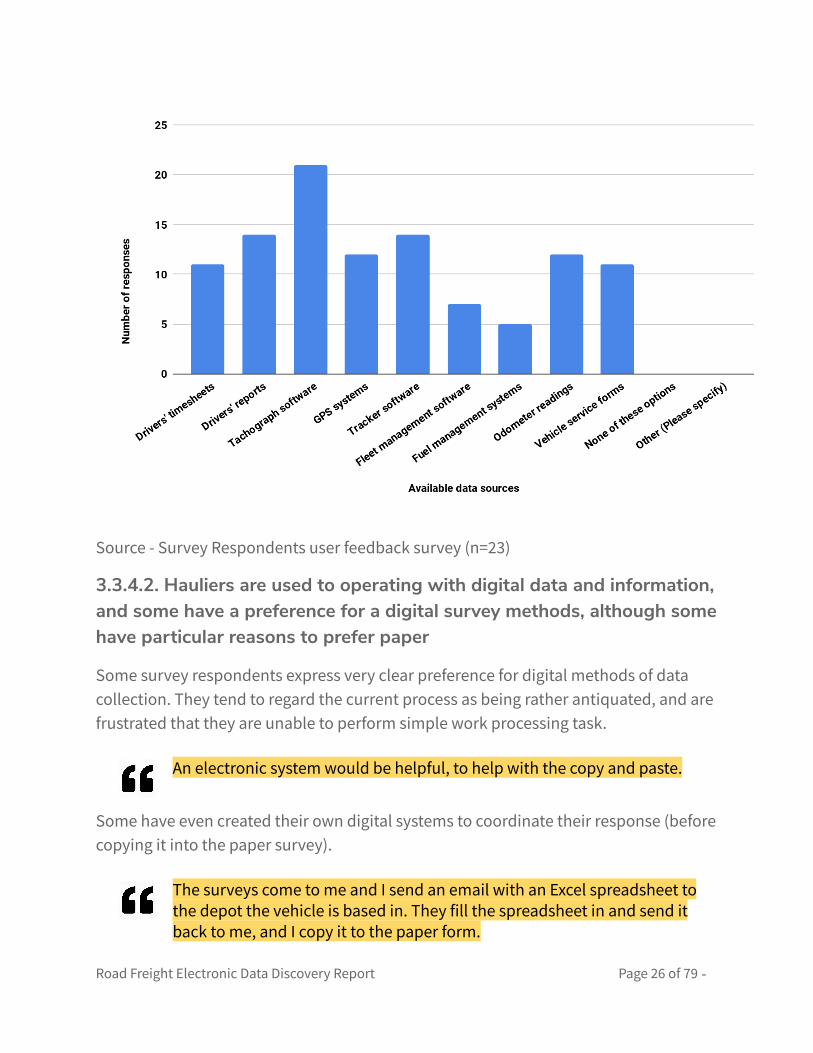
Source - Survey Respondents user feedback survey (n=23)
3.3.4.2. Hauliers are used to operating with digital data and information, and some have a preference for a digital survey methods, although some have particular reasons to prefer paper
Some survey respondents express very clear preference for digital methods of data collection. They tend to regard the current process as being rather antiquated, and are frustrated that they are unable to perform simple work processing task.
An electronic system would be helpful, to help with the copy and paste.
Some have even created their own digital systems to coordinate their response (before copying it into the paper survey).
The surveys come to me and I send an email with an Excel spreadsheet to the depot the vehicle is based in. They fill the spreadsheet in and send it back to me, and I copy it to the paper form.
Road Freight Electronic Data Discovery Report Page 26 of 79 -

But some survey respondents have particular reasons to prefer paper collection methods, for example infrequent time in the office or access to the internet.
Notably, this preference appears to relate to practical issues, and possibly a resistance to change, rather than an absence of skills.
When I’m parked up at night I can set aside five minutes to complete the [paper] form. I have an iPad and iPhone which I take with me. I get work emails sent through to the iPad, so I do use it for work.
Which of these options would you have preferred?
Source - Survey Respondents user feedback survey (n=18)
3.3.4.3. Some users are wary of sharing additional data, and would need reassurances about how the data is stored, used and reused if the Department were to collect additional data
The majority of survey respondents would welcome more automated collection of data if it reduced the burden on them to manually provide the data.
Road Freight Electronic Data Discovery Report Page 27 of 79 -
They don’t typically have concerns about the sensitivity of the data they provide at the moment.
The questions at the moment aren’t really commercially sensitive. But if you went into more depth, we’d have to think about it.
However, some survey respondents do seem instinctively wary of government. -
And some have particular commercial or security concerns about sharing their data. -
Next day delivery is a cut throat industry so we’re careful about sharing data about what we’re doing.
We carry seized goods and other sensitive materials. We’ve had to have armed vehicles travelling with some of our vehicles to keep our drivers and vehicles safe. It might be a government agency but the more that’s out there the more chance it has to get into the wrong hands.
These survey respondents may need further reassurances from the Department about how their data is used, particularly if additional data is captured in future.
3.4. VALIDATING THE USER NEEDS Survey Respondents were invited to validate the list of 24 user needs identified from the user interviews, stakeholder interviews, field visits, a user feedback survey and a user needs workshop.
Full data is in the User needs validation survey.
37 users completed the user needs validation surveys:
➔ 86% were transport managers (or equivalent), 14% head/own a haulage -company, 11% hired out HGVs and 8% drove HGVs* -
➔ 86% had completed the Continuing Survey of Road Goods Transport Great Britain (CSRGT GB), 19% had completed the International Road Haulage Survey (IRHS) and 14% had completed the Continuing Survey of Road Goods Transport Northern Ireland (CSRGT NI)*
➔ 46% had between 5-49 haulage vehicles, 35% had 100 or more haulage vehicles, 16% had been 50-99 haulage vehicles and 3% had less than 5 vehicles
Road Freight Electronic Data Discovery Report Page 28 of 79 -

*some survey respondents who completed the user needs validation survey had more than one role and some had
completed more than one survey. Therefore the percentages will not add up to 100%.
Data users were not invited to validate any user needs specific to them, as the total
number of data users the Team are aware of are quite small. Any response to a user
needs validation survey and subsequence analysis would have been limited by these
small numbers.
3.4.1. Analysis method and outputs
24 user needs were scored by users on a range from 0 - I have no need to 4 - I definitely
need the Road Freight Survey to…
(Example) … Enable me to capture details about a journey in advance, for me to check
and edit later
Each need was then categorised into Very high, High, Medium and Low priority user
needs depending on the average score of the responses.
Key: yellow = Low need, orange = Medium need, red = High need, purple = Very
high need
Please refer to the Analysis pages for the analysis to score the user needs.
The levels of user need are shown in the table below.
Road Freight Electronic Data Discovery Report Page 29 of 79

The level of response to the user needs validation survey was sufficient to draw out
some insights into a general level of need across the needs which were put into the
survey.
However the level of response to the user needs validation survey was not high
enough to look at the difference between groups e.g. between number of haulage
vehicles a company has, or the survey they completed.
The 24 user needs were themed and the level of need across these themes are shown
in the table below:
Road Freight Electronic Data Discovery Report Page 30 of 79

3.4.1.1. Lower level of need for Automatic Capture and Complete
themed user needs
All the needs (4) which were themed under Automatic Capture were scored as low and
all the needs (9) which were themed under Complete were either scored as low or
medium.
3.4.1.2. Higher level of need for Store themed user needs
All the needs (3) which were themed under Store were scored as high or very high .
There is a very high level of user need for Retain a copy of the completed survey, which I
can look at if I am asked to make corrections a�er submitting it.
3.4.1.3. Mixed level of need for Collaborate and Communication themed
user needs
2 out of 3 needs which were themed under Collaborate were scored as medium and
one need was scored as high.
Road Freight Electronic Data Discovery Report Page 31 of 79

2 out of 5 needs which were themed under Communications were scored as medium
and 2 needs were scored as high.
There is a very high level of user need for Alert me in advance when I will need to
complete the survey, and for which vehicle.
3.5. PRIORITISING THE USER STORY BACKLOG
The evidence from this survey and other user research was used by the Road Freight
Statistics team to directly inform their initial round of user story prioritisation (20th
June 2019), setting a user-centred approach.
Road Freight Electronic Data Discovery Report Page 32 of 79

Road Freight Electronic Data Discovery Report Page 33 of 79 -

4. JOURNEY SERVICE MAPPING
During the Discovery we mapped out the end-to-end journey for both the domestic
and international surveys to better understand how they fit into wider processes.
We used our user and stakeholder research and review of technical documentation to
map out the distinct steps in the process.
We captured what happens at each step, who is involved, what technologies and
sources of data are involved, and highlighted pain points and risks.
➔ There are 31 distinct steps in the process
➔ There are 7 distinct actors / roles in the journey
➔ There are 29 technologies and sources of data involved
➔ We identified 21 identified potential points for improvement
The evidence gathered through this process was used to inform the discovery findings
and recommendations.
PDFs of the journey service maps are available as an output of the discovery.
Road Freight Electronic Data Discovery Report Page 34 of 79

5. ASSISTED DIGITAL IMPACT
ASSESSMENT
5.1. SCALE OF ASSISTED DIGITAL NEED
The research to date has shown that survey respondents who complete the Road
Freight Survey are doing so within a professional role, within the competitive haulage
and vehicle hire industries.
The research was conducted with survey respondents across job role (drivers,
transport managers, business owners) and business size (one person business to
business with 100s of HGVs).
Participant recruitment to the research was from a pool of survey respondents who
were not biased towards digital as the majority had volunteered to participate through
a paper participant recruitment form (81%) rather than an electronic participant
recruitment form (19%).
The research has found little evidence of low digital literacy across this range of users.
However, the research has shown that some indicate a preference for paper.
The latest Digital Inclusion Scale figures on the UK population are taken from the
Government Digital Inclusion Strategy, updated in December 2014.
Road Freight Electronic Data Discovery Report Page 35 of 79

This shows that currently 79% of the UK population are 7 (basic digital skills), 8
(confident) or 9 (expert). This group of the population should be capable of using any
Digital Service Standard level digital service offered to them to use this service if they
have access to the internet. The research has concluded that the majority of survey
respondents would fall within this group.
14% of the UK population are a 1 (never have, never will), 2 (was online, but no longer)
or 3 (willing and unable). This section of the population will have assisted digital need.
However it is unlikely that survey respondents will fall within this group as the majority
of this group are older than working age and it would be difficult for a business within
this competitive industry to survive without any digital skills. There was no evidence in
the research of users who fall within this group.
A further 7% of the UK population are a 4 (reluctantly online), 5 (learning the ropes) or
6 (task specific). Within this Discovery research project 1 person was identified who fell
within this group, but would be on the higher end of it.
Road Freight Electronic Data Discovery Report Page 36 of 79

5.1.1. The estimated level of assisted digital need for the
Road Freight Survey
We have tried to use these figures to help estimate how much assisted digital need you
may need to support with this service. However as there was no evidence from the
research of low digital literacy we can’t put a figure on it. Although we can be confident
that the level of assisted digital need is low.
The research has demonstrated some reluctance towards digital and a preference
towards paper which will be a factor to address alongside considering assisted digital
need.
5.2. HOW TO MEET ASSISTED DIGITAL NEED FOR THE ROAD FREIGHT STATISTICS SERVICE
To comply with the GDS Service Standard, an entirely paper based option could not be
offered as an alternative. The data must be submitted into the digital service.
Furthermore, retaining the option of a paper survey in its current format risks
undermining the advantages of shi�ing to digital methods.
We recommend working towards a range of options to capture data (see 8.3.1),
including:
➔ Browser based form
➔ API for automated collection
➔ Manual upload option
➔ Telephone
So we only recommend retaining a paper survey to be used as a possible memory
jogger, to support the submission of digital data.
During the development phases we recommend testing how the assisted digital need
can best be supported by an enhanced support service (see 8.3.6). Either by:
Road Freight Electronic Data Discovery Report Page 37 of 79

➔ Submission of data directly by the support service acting as a proxy for the
survey respondent; or
➔ Providing telephone assistance during digital submission for those who need
support
Road Freight Electronic Data Discovery Report Page 38 of 79

6. TECHNOLOGY REVIEW
Note: this review was made through the lens of the Technical Code of Practice and
Digital Service Standards outlined by GDS, and the DfT Digital Service Architecture
Principles & Standards.
Specific recommendations to come out of this review are made in the
Recommendations (section 8.4).
6.1. KEY FINDINGS FROM THE TECHNOLOGY REVIEW
6.1.1. Technology and architecture
6.1.1.1. The main application is a desktop-based, Citrix distributed
system with characteristics of a small, internal system
The questionnaire and data entry application is built on top of a MS Access local
database that syncs back to a centrally hosted MS SQL Server instance. The application
is delivered to the users via a Citrix virtualised desktop, effectively creating a secure,
walled garden approach.
Overall it’s a coherent, if less modern, approach to application development and
distribution, that suits a low scale, limited user environment. It’s characteristics are
more of an internal workflow system than a scalable broad use application.
It’s also a closed architecture and does not integrate well, if at all, into a web-based,
service oriented environment.
6.1.1.2. Security is well considered
The closed nature of the desktop application and Citrix environment means it is a
walled garden and secured from unauthorised usage if administered correctly.
With Microso� Active Directory used for centralised domain management and
database logins controlling data access, a good level of security provisions are in place
for a system of this configuration.
Road Freight Electronic Data Discovery Report Page 39 of 79

In terms of ongoing management, security patches are applied on a monthly basis for
both hosting and database.
6.1.1.3. Hosting environment and administration are good
Given the relative simplicity of the overall architecture and high quality industry
standard tools used we only need to look to the basics here:
➔ The database is backed up on a daily basis
➔ For monitoring, a system report is generated, again on a daily basis
➔ The hardware setup uses RAID for redundancy
➔ Outages are managed according to the Digital Service standard procedures
6.1.1.4. System has no interoperability
The flip side of the closed architecture approach is that no data is available via APIs,
and therefore the service cannot be easily integrated with any other systems.
6.1.2. Data Workflow
6.1.2.1. Sample data is delivered on a CD
The DVLA send cuts of data to the Department on a CD for sampling on a monthly
basis.
Given the sensitivity of the data, this may be entirely reasonable, but having it
available via automatable APIs would be preferable from a technical perspective.
6.1.2.2. Data processing workflow places responsibility for integrity on
the individual analyst
Analysts work by extracting raw data from the SQL Server database, processing it in
Excel and syncing it back to the database.
Since there is no data integrity / business logic layer between the analyst and the
database, this workflow requires care by the analyst to make sure data is cleaned and
processed carefully, and that they maintain integrity as they go.
Road Freight Electronic Data Discovery Report Page 40 of 79

6.1.2.3. The actively processed data from each issue of the survey is
isolated from finalised data
Given the processing workflow uses direct access to the database, it’s important that
actively processed data remains separate from finalised data to avoid undesirable side
effects.
The organisation of the tables within the database is such that:
➔ Finalised data resides in its own table
➔ Each issue of the survey has its own separate table, isolating it from the
finalised data while cleaning and processing is completed
➔ At the end of the process, finalised data is then appended to the finalised data
table
Overall, this setup should minimise risk of data corruption and side effects, while daily
backups also provide a safety net. Again, this practice is indicative of a closely held
internal system with minimal actors interacting with the information.
6.1.3. Contractual landscape is very simple
The contractual and procurement landscape is very simple, with a simple set of tools
used to build the application, no off-the-shelf systems and the Department
responsible for the hosting and database environment.
6.1.4. Our understanding of the technical workflow is
incomplete
The developer of the data entry application stated that no formalised procedure for
managing system improvements was followed from his perspective.
In terms of a QA and release process, there are UAT and Test database environments
available, but it’s not entirely clear how these are used as he was not forthcoming with
those details or any insights into aspects such as code management.
Given our recommendations and likely future state of the service, these missing details
are only impactful to the completeness of the findings.
Road Freight Electronic Data Discovery Report Page 41 of 79

7. LANDSCAPE ANALYSIS
7.1. CASE STUDY - PORT FREIGHT
The Department’s Port Freight service is at the beta stage. The service it will replace is
already digital, with browser based forms and an Excel version. The beta version uses
improved browser forms and APIs for automated collection.
7.1.1. Insights and lessons
➔ 15 users use the APIs, but they are the bigger operators, and so account for a
third of the volume of data
➔ The remaining two thirds is collected via browser forms, and they have retained
a paper form for a very small number of users
➔ They have used the opportunity to review the questions and the language used,
and to remove unnecessary questions - the new surveys take half the time to
complete as a result
➔ They now pre-populate the form as much as possible based on the IMO number
of the ship (equivalent to vehicle registration)
➔ They use drop down boxes to code to categories in the form, and collect free
text alongside categories to enable users to further explain their answers
➔ They worked really hard to ensure that they retained comparable data through
the change in collection method - this was discussed at length at service
assessment
➔ The biggest challenge has been meeting the needs of a wide range of users, and
their initial resistance to change, although people were capable, and willing to
try.
◆ They had a persona called “Comfortable Chris” who didn’t want anything
to change because he’d done the same job for 15 years, and was happy
with the way things were.
Road Freight Electronic Data Discovery Report Page 42 of 79

➔ Passing the Service Assessment was hard - they had to do additional
accessibility testing, and penetration testing
7.2. CASE STUDY - Statistics Austria
Statistics Austria are in the process of creating a smartphone app and supporting
desktop application for capturing road freight statistics.
They currently use a mixture of methods, including a paper survey, web browser
survey and an Excel version.
They would be very happy to share their experience of implementing the smartphone
app in a few months time. They plan to present their experience at the next meeting of
the Eurostat working group.
7.2.1. Insights and lessons
Current service:
➔ 40% use the paper survey, 60% use digital versions (of which half use the Excel
version)
➔ They have decreased the sample size to reduce the level of burden on hauliers,
and would face a lot of opposition if they increased the level of burden
➔ Hauliers have a legal duty to respond - they receive two reminders before it goes
to court, and 1% pay a fine
➔ A new law will make the submission of electronic data mandatory for Aurstrian
businesses
Smartphone app and desktop application (in development):
➔ Drivers will use the app to track journey details automatically
➔ Drivers will then add additional data about the goods carried manually in the
app
➔ Drivers will then submit data to a desktop application (in the haulier’s office)
➔ Hauliers will then submit data from desktop application to Statistics Austria
Road Freight Electronic Data Discovery Report Page 43 of 79

7.3. CASE STUDY - Statistics Denmark
Statistics Denmark used a paper survey to collect road freight statistics until two years
ago. They now use a browser based questionnaire, and a smartphone app, and are
exploring gathering larger volumes of data automatically from fleet management
systems via APIs.
They have legislation that means all communications between government and
business of this type must be digital.
They are also motivated by a desire to reduce burden, and a desire to increase the
accuracy of data by reducing errors.
They have found that businesses are using online systems routinely, and are used to
sharing data and willing to do it automatically in order to avoid an administrative
burden.
They would welcome opportunities to share their experiences as they do this.
7.3.1. Insights and lessons
The current service (since 2015) incorporates
➔ A reporting portal
◆ Hauliers receive an email containing one link
◆ The link takes them to a page with a big blue button: “START
REPORTING”
◆ The button takes them to a browser based questionnaire
➔ Smartphone app
◆ Drivers use a smartphone app to automatically capture journeys
◆ 20% of hauliers use this option
They are working towards more automated collection from fleet management systems
via APIs:
Road Freight Electronic Data Discovery Report Page 44 of 79

➔ They are exploring working with two central operators who could provide data
on behalf of smaller firms (rather than working with every operator directly)
➔ They only code to Eurostat categories at the moment, but see the opportunity
collect richer data about goods if they can collect directly from fleet
management systems
➔ They see the opportunity to increase the scale of the data without increasing
the sample size using this approach
7.4. CASE STUDY - GSS Data Project
The GSS Data Project aims to improve the findability and interoperability of
government data.
Their focus has been to develop a platform for trade data, by transforming the data
(rather than the interface).
7.4.1. Insights and lessons
➔ Visualisation becomes easy once the data is in the right structure
➔ Their visualisations of trade data (the kind that might be more accessible to
non-statisticians like hauliers) were created in 1 hour.
Road Freight Electronic Data Discovery Report Page 45 of 79

ONS Alpha for visualising trade and migration data
https://swirrl.shinyapps.io/ONS Alpha Plus Exports Vs Immigration/
Road Freight Electronic Data Discovery Report Page 46 of 79

8. RECOMMENDATIONS
8.1. THE CONTEXT FOR OUR RECOMMENDATIONS
8.1.1. A protracted process
The demand for faster, accurate freight data is heightened given the current focus on
EU Exit for policy makers in the department, and it is likely to remain heightened for
some time.
But the current process for processing survey responses takes seven months from
collection to publication, and involves some 31 distinct steps.
Our recommendations provide opportunities to reduce the necessity to devote so
much time in the process to the cleaning of data, enabling faster production of data
whilst also reducing the opportunity for errors.
8.1.2. A desire for more granular data (without additional
burden on hauliers)
Data users want more timely data, but they would also like that data to be more
detailed than is possible using the current process.
The Department is meeting its obligations by publishing data with goods coded using
the Eurostat category list. But these broad categories do not currently meet the needs
of data using inside and outside government.
A shi� to digital methods provides an opportunity to provide more granular data in
addition to meeting Eurostat requirements.
Stakeholders are right to be concerned about any additional steps the Department
asks hauliers to make to provide additional data. But a shi� to digital methods should
make it possible to gather additional data without any increase to the current burden
on hauliers.
8.1.3. Technology that inhibits the service
Road Freight Electronic Data Discovery Report Page 47 of 79

Current technology choices are effective to a point, but they limit what is possible to
achieve through this service.
We recommend replacing much of the current technology to enable a modern, web
based service approach that can achieve the wider potential benefits described in this
Discovery.
The technology recommendations are described in detail in 8.4.
8.1.4. A disconnect between the hauliers and the Department
The current survey has a c. 85% response rate. But hauliers complete it grudgingly, and
significant work is then needed to complete and correct their data before it is usable.
Hauliers recall the threat of a fine, but they don’t recall other messages about the road
freight statistics purpose and process.
We recommend redesigning the communications around the survey to help address
this disconnect, and the possibility that it undermines the quality of the data hauliers
provide.
8.2. OVERARCHING RECOMMENDATIONS
8.2.1. Proceed to Alpha for a digital survey
This service satisfies the criteria to continue to Alpha.
There is sufficient and demonstrable user need from data users that a road freight
statistics service should continue to meet. Data users have no alternative source of this
data; nothing else is meeting the need.
And, while some users express a preference for paper, there is sufficient evidence and
expectation from survey respondents that a shi� to more digital methods would lead
to a more efficient process for hauliers, whilst also enhancing the value to the
Department.
The format of the current survey limits the support that hauliers can receive to submit
accurate data, and it places limits on the value of the data collected for data users.
Road Freight Electronic Data Discovery Report Page 48 of 79

Moreover, a shi� to digital methods for road freight statistics should be regarded in the
context of wider service transformation, and in particular the demand from data users
to understand the movement of goods across different modes of transport.
We recommend proceeding to an Alpha stage covering both the domestic and
international surveys. While there are differences between the two surveys, the issues
that we recommend addressing at Alpha are actually fundamental to both.
8.2.2. Start with digital collection
We recommend exploring how the collection and validation of road freight data could
be automated.
But we recommend starting by enabling digital collection via a simple web browser
based survey. This alone has the potential to provide significant enhancements to the
current service.
In particular, this change will make it possible to validate much of the data up front, at
the point it is collected, rather than interpreting hand written notes some time a�er.
We would expect this browser based survey to be built in a way that is entirely
complementary to our recommendations to explore more automated collection.
Key features should include:
➔ Browser based submission
➔ Compatible with any device including desktop, tablet and phone
➔ APIs to allow the storage and retrieval of data based on current data structures
➔ Simple validation to prevent the submission of errors or missing fields
➔ Automatic coding to category lists
This relatively simple step should make it possible to simplify current processes
needed to input and clean data and significantly reduce the number of steps in the
service journey (currently 31).
Road Freight Electronic Data Discovery Report Page 49 of 79

At a stroke it will remove the need to post copies of the form and guidance, scan paper
copies, store physical copies of surveys, manually enter data and interpret
handwriting.
This simple browser based form will be the minimum viable product (MVP), replicating
the features of the current survey. Importantly, it will meet all priority user stories.
Many survey respondents are digitally and data savvy, and have high expectations for
the services they use. A shi� to a simple browser based survey should go some of the
way towards meeting these expectations.
This discovery has also identified several opportunities for an enhanced service to help
meet the full range of user stories, including enabling collaboration features for
businesses with more than one person contributing to the completion of a survey,
automating the collection and processing of data, and coding for more granular data.
These and other enhancement to the MVP are described below.
8.2.3. Use the Alpha to explore automated collection
We recommend taking a platform approach to the digital survey, starting only with
what you need to deliver the digital survey, but architected in such a way that enables
possible automated collection.
The Alpha can then be used to explore how more automated collection might also be
achieved, alongside the digital survey.
We recommend establishing a set of secure APIs using open standards (see 8.4).
But creating the platform alone will not guarantee take up, so we also recommend
targeting some of the operators with larger fleets (e.g. Royal Mail), and working with
them to find ways to automate the collection of data via secure APIs from their
established fleet management systems.
The Port Freight experience is notable here, with a small number of operators working
with the Department to automate the collection of their data (see 7.1).
We do not recommend using bespoke GPS trackers or smartphone apps to track
journeys. These solutions are attractive on the face of it, and it will be interesting to
learn from the Statistics Austria experience (7.3). But given that UK hauliers already
seems to have such sophisticated systems in place to track their vehicles and journeys,
Road Freight Electronic Data Discovery Report Page 50 of 79

we think a more sensible approach is to explore how these existing sources of data can
be exploited for the purposes of road freight statistics.
8.2.4. Complete the conversation with hauliers
We have found a significant gap in understanding and empathy between the
Department and hauliers that may ultimately have an impact on the quality of the data
collected.
Most survey respondents grudgingly complete the form, while some indicate that they
provide as little information as possible in order to meet they mandatory obligation.
Moreover, the survey respondents we spoke to during this discovery are passionate
and interested in the state of their industry, but none of them have a clear
understanding about what their survey data is used for.
We recommend redesigning the communications around the survey to help address
the attitude of hauliers towards the process, guiding them through what they need to
do, and involving them in the wider purpose.
We did not find significant levels of user need from data users for additional interfaces
to access the data, so we do not recommend creating self-service tools to visualise or
present the data differently as a priority. But we do advise following good practice for
the publication of data to enable others to reuse the published data (see 7.3).
And we recommend exploring ways to publish the data in ways that are accessible to
hauliers. This may mean finding new ways to share summaries or visualisations of the
data with hauliers.
8.3. USER EXPERIENCE RECOMMENDATIONS
8.3.1. Offer hauliers a range of options to submit data,
depending on their capacity and capability
A huge range of types of business contribute to road freight statistics, from very large
multinational businesses, to very small businesses with one or two employees.
Road Freight Electronic Data Discovery Report Page 51 of 79

Survey respondents also vary in the roles they occupy, and in their capability
(although we found no evidence of evidence of digital exclusion amongst this group).
So it makes sense to provide options for submitting data that meet the needs of this
wide range of survey respondents, and their associated behaviors.
We have found a wide range of behaviours associated with the current paper service.
Some complete the form in advance, some at the end of each day, some at the end of
the process. Some complete it on paper, some use the Excel version. Some send it in
the post, some scan it and email it in.
There is no need for a single method of collection for this service. Rather, we
recommend working towards a range of options to provide data, including:
➔ Browser based form
➔ API for automated collection
➔ Manual upload option
➔ Telephone
Note: This range of options is consistent with the approach taken for the Port Freight
service, who are collecting one third of their data via APIs, but have retained web and
paper survey forms.
8.3.2. Provide support (and validation) at the point of
collection
The current process makes it inevitable that significant time and effort is needed to
clean and correct data a�er it is collected.
This is a time consuming and labour intensive process, despite best efforts to provide
written guidance and support to survey respondents.
We recommend implementing validation to prevent the submission of data that needs
to be cleaned and corrected. And we recommend building guidance directly into the
submission process, rather than providing it in a separate document.
Road Freight Electronic Data Discovery Report Page 52 of 79

Getting the data right first time in these ways should significantly reduce the time
needed to process data. We recommend achieving this by:
1.Using rules to prevent the submission of empty fields or incorrect data (for
example invalid distances)
2.Building hints and tips into the collection form so that the survey respondent
sees them at the point that they need help, integrating the stand alone guidance
document into the form itself
3.As far as possible, coding to category lists at this point by interpreting free text
(e.g. of goods carried) automatically
4.Simplifying the experience of adding data to the form, by adopting the GOV.UK
pattern of only showing “one thing per page”
Concept prototype showing free text capture of goods carried.
Road Freight Electronic Data Discovery Report Page 53 of 79

Concept prototype showing clarification follow up question to help code free text data.
We recommend you use the GOV.UK Design System as many of these design patterns
will be immediately available to develop an Alpha prototype with.
8.3.3. Do the work to enable survey respondents to check
and confirm data already held
We encountered understandable frustration from hauliers who felt the survey asked
them to manually enter data that they had previously provided to the Department (or
another part of government that they may not distinguish from the Department).
We recommend exploring how far it is possible to prepopulate the survey with data
already held, and asking hauliers to confirm details rather than provide them again.
This should be relatively straightforward for details held by the road freight service
(e.g. contact details).
And if the vehicle registration is known, it may be possible to pre-populate further
details about the vehicle rather than ask hauliers to provide this information.
Road Freight Electronic Data Discovery Report Page 54 of 79

The Port Freight experience suggests that this will not be straightforward (they were
unable to link Home Office data). But their experience also suggests significant
benefits if it is possible to use related data sets to feed the back end of the survey.
Note: We highlight the current importance placed in the Government Service Standard
on doing the hard work to link government services for the benefit of the end user.
Concept prototype: User chooses from a limited list of options for UK port of departure,
rather than using free text.
Road Freight Electronic Data Discovery Report Page 55 of 79

Concept prototype: User only shown possible destination ports to choose from, rather
than free text, or a full list of ports.
Road Freight Electronic Data Discovery Report Page 56 of 79

Concept prototype: Form suggests locations (from an authoritative register such as the
Gazeteer) as a user starts typing. It also provides a list of recent locations to choose from
to enable easier collection of repeated data.
8.3.4. Redesign the communications around the survey
Current communications from the Department to hauliers about road freight statistics
are successful in achieving a high completion rate for the (mandatory) survey. But
other communications messages are currently o�en missed or ignored.
Survey respondent simply don’t recall seeing information about the purpose of the
survey in the letter that informs them they have been selected to participate. And very
few of the survey respondents that we spoke to recalled being informed about the
option to use an Excel version of the survey form.
Road Freight Electronic Data Discovery Report Page 57 of 79

We recommend redesigning the communications to:
➔ Reduce the information contained in the initial letter
➔ Provide other messages at the point that survey respondents need them and
are able to act on them
➔ Close the feedback loop so that the survey respondent can see the value of the
data they provide
This should have practical benefits for hauliers, and help to address negative attitude
towards the survey and the Department, which may in turn increase the response rate
and the quality of response.
We recommend testing how current information could better be provided to better
meet the needs of survey respondents. For example what it currently provided via a
letter could be broken down as:
➔ Initial formal letter, with minimum viable content
➔ Email reminder at the start of the survey period
➔ Hints and tips built into the fields of the survey, rather than sent with the letter
➔ Telephone support for those that need it
➔ Email receipt thanking them for completing the survey
➔ Email with the published data and narrative
8.3.5. Address hauliers motivation to complete the survey
Survey respondents have no real incentive to complete the survey, other than the
avoidance of a fine.
The threat of a £2,500 fine seems to be working given the high response rate.
But we think it is worth testing whether more a more positive reframing of this
message could achieve a similar response rate, without the negative impact on the
attitude of the survey respondents towards the process.
Road Freight Electronic Data Discovery Report Page 58 of 79

Or testing whether other less punitive incentives might have a similar impact when
used alongside, or in place of, the fine.
Some simple A/B testing of messages in correspondence with hauliers should provide
clear evidence about which messages are effective.
Messages to test might include for example:
➔ Peer pressure: ‘96% of hauliers complete the survey on time’
➔ Benefit to the industry: ‘Road freight statistics were used for…’
➔ Incentive: ‘Once you complete the survey we will…’
The DVLA/NHSBT collaboration on messages about the organ donor register is a well
told government story about the success of this kind of behavioural insight
experiment: https://gds.blog.gov.uk/2014/03/18/organ-donor-register/
8.3.6. Redesign the support service
The Hastings based Capture Team play an essential role in the current process, both to
process the paper surveys, and to manage the relationships with hauliers.
Shi�ing to digital collection (and validation at the point of collection) will reduce the
need for manually capturing the data in a digital format.
But there will be a continuing need to liaise with hauliers, particularly in the context of
a need to address the current negative attitude of hauliers towards the Department
(see 3.3.4).
We recommend enhancing the support service offered to hauliers.
It is considered essential that road freight statistics are fully representative of the
industry. Digital solutions have the potential to be far more inclusive and accessible
than paper service. But there will be some who need additional support to provide
data.
Initially there may be significant need to support hauliers as they shi� from paper to
digital surveys, and are encouraged to shi� to automated collection. And there will be
a new need to proactively follow up with hauliers when the service identifies outliers
in the data (see 7.1) .
Road Freight Electronic Data Discovery Report Page 59 of 79

But there will also be an ongoing need to provide a support service for those unwilling
or unable to move to digital methods (see Assisted Digital Impact Assessment 5.1) .
We recommend only retaining a paper version of the survey as a memory jogger, in
order to support telephone submission of data for those that need it.
Telephone submitted data would then be entered using the same browser form as
other users, via the proxy of the support service, which would ensure validation at the
point of collection, and remove the need for post-submission cleaning of data from the
process entirely.
8.3.7. Enable collaboration and workflow in the completion of
a survey
It’s clear from hauliers that there are many different behaviors involved in the
completion of a survey.
Many are completed by a single survey respondent, who has access to all the sources
of information needed to complete the survey.
But it is quite common for multiple actors to be involved in the completion of a survey.
In larger businesses in particular surveys are o�en received at a central point and then
distributed to those who are able to contribute to the completion of the survey.
Some have even created local digital systems to enable collaboration within a
business.
We recommend enabling this collaborative behaviour in the design of the browser
survey.
Common behaviours that are not straightforward with a paper survey, but could be
built into a digital survey:
➔ Distribute the survey from a central point to one or more other users
➔ Assign particular tasks to particular users (e.g. to complete journey details)
➔ Discuss the data with colleagues
➔ Edit the data added by others in the organisation
Road Freight Electronic Data Discovery Report Page 60 of 79

➔ Save an incomplete survey and return to it later
➔ Remind survey respondents that the survey is due for submission
➔ Access and check multiple surveys to quality assure them before submission
Each of these behaviours could be enabled with a digital solution that includes
common collaboration and workflow features.
Concept prototype showing a dashboard for a survey respondent managing multiple
surveys.
These features would be of particular value for hire companies, for whom the
distribution of surveys causes real difficulties at the moment.
Road Freight Electronic Data Discovery Report Page 61 of 79
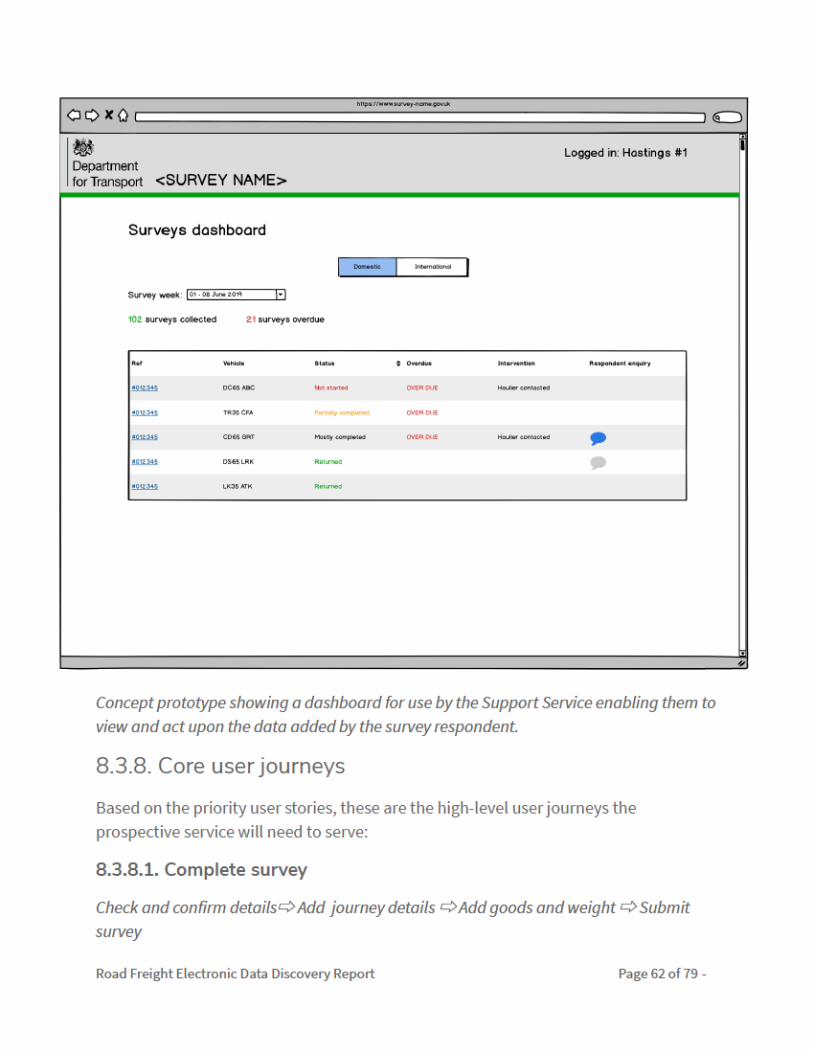
Concept prototype showing a dashboard for use by the Support Service enabling them to
view and act upon the data added by the survey respondent.
8.3.8. Core user journeys
Based on the priority user stories, these are the high-level user journeys the
prospective service will need to serve:
8.3.8.1. Complete survey
Check and confirm details⇨ Add journey details ⇨ Add goods and weight ⇨ Submit
survey
Road Freight Electronic Data Discovery Report Page 62 of 79

8.3.8.2. Coordinate completion of survey
Check and confirm details⇨ Assign task ⇨ Check, comment, and edit ⇨ Submit survey
8.4. TECHNICAL RECOMMENDATIONS
8.4.1. Start with a new architecture guided by the DfT Digital
Service Architecture
The existing technology selection and architecture is almost entirely unsuitable for
supporting a modern, web based service approach. As such you are starting with a
blank state. The only potential value we can see extracting is business knowledge
contained within the various parts of the system.
While MS SQL Server is a valid choice, the Digital Service standard states that “Data
should be stored and managed centrally within the Google Cloud Platform” directing
any new system towards a Google based architecture for which Microso� solutions are
not a good fit.
Overall, the Department’s Digital Service Architecture Principles & Standards provides
strong and appropriate direction from which to make technology and architecture
choices. We have included some specific guidance and recommendations that apply
directly to this project in 8.4.6 Approach and technology.
8.4.2. Use this as an opportunity to begin the creation of a
digital platform
Creating a digital platform to underpin the digital survey would provide an appropriate
foundation for taking road freight statistics forward into the future.
We recommend starting only with what you need to deliver the digital survey, but
architected in such a way that provides a solid first step towards the future state.
The platform would:
➔ Contain core business rules and be responsible for data integrity and validation
Road Freight Electronic Data Discovery Report Page 63 of 79

➔ Establish a set of secure APIs using open standards that allow data to flow in
and out in a timely manner
➔ Be built on top of a modern cloud-based architecture to allow cost effective
scaling and usage-based charging
This model will provide the basis that enables you to integrate either the
commoditised or bespoke solutions you require, and support opening up the data in a
secure and controlled way.
It also enables specialist providers to be engaged to solve specific problems, and
commoditised solutions to be more easily integrated where appropriate.
8.4.3. Separate the survey respondent and analyst needs
within the architecture
Based on our experience, it’s likely that the survey respondent and the analysts will
have significantly different needs, particularly with respect to data structures.
The survey respondent will be best served by an OLTP approach, whereas the analyst
will benefit from an OLAP one. While an Alpha might not produce both, we recommend
the architectural approach accounts for them. Additionally, an OLAP solution means
that moving forward analysts will not interact directly with the underlying data store,
which is better.
The requirement for and needs of any data migration should also be considered within
the Alpha, but you should not base new data structures on the current ones for the
sake of consistency.
We recommend engaging an experienced Senior Developer or Technical Architect to
complete this work.
8.4.4. Consider the analyst workflow as part of the core work
Moving to an entirely different architecture will render the current analyst workflow
obsolete. Given their work is a core part of delivering the outputs of the survey, their
needs should be considered alongside those of the survey participants.
Road Freight Electronic Data Discovery Report Page 64 of 79

There is also an opportunity here for them to evaluate their tooling. The use of
off-the-shelf data analysis systems, should that be desirable, will be better supported
by a platform based approach.
8.4.5. Establish a standardised approach to technical work
At the heart of a well run service is good technical workflow, standards and process.
Moving forward, we recommend best practices including, but not limited to:
➔ Implementing a consistent workflow for managing project and system
improvements
➔ Creating standards for code management and tooling
➔ Developing a formalised release process with high levels of automation
8.4.6. Approach and technology
8.4.6.1. Favour a bespoke over commoditised solution for the Digital
survey
The DfT Digital & Technology Strategy rightly looks in the first instance towards
commoditised, off the shelf services. While the final decision lies with the team
responsible for delivering the survey, from our perspective we see a stronger case for a
bespoke solution.
The digital survey and related platform is a core competency of Road Freight Statistics
that will need to evolve based on ongoing user research and testing. Being dependent
on a vendor’s product priorities and feature timelines is far from ideal, and indeed
risks hampering progress.
Bespoke, however, should not mean doing everything from scratch. As covered below,
choosing a good base technology with a healthy community, maximises the
opportunity to integrate high quality libraries and components, increasing
productivity while retaining full control.
8.4.6.2. Considerations for selecting a technology
When selecting an appropriate technology, the technical needs of the system are of
course a key driver. However, by selecting a technology you are also selecting the
Road Freight Electronic Data Discovery Report Page 65 of 79

ecosystem around that technology which can have as much impact on how effectively
you are able to execute your vision.
Based on that, these are our considerations for selecting technologies:
➔ Overall profile of the system - for example, is it more a data-driven web
application or content publishing platform?
➔ The significant product needs now and into the foreseeable future
➔ Ease of hiring – availability, quality and cost of the developers
➔ How actively developed, mature, well maintained and documented the
technology is
➔ The community around the technology – how widely used and supported it is,
and what libraries, resources are available to help speed up development
➔ The technical architecture it imposes and how appropriate is that for the needs
of the system
8.4.6.3. Favour open source over proprietary
Open source technology is the clear recommendation.
While Microso� SQL Server has many excellent qualities, there are no project
requirements we can see that only Microso� SQL Server can fulfil, and so there’s no
justification for its licensing cost or to go against the DfT Digital Service open source
first policy.
8.4.6.4. Start with the GOV.UK Design System
GDS have already researched, designed, coded, tested, and iterated many of
components, design patterns, and style you will need in the digital survey.
The GOV.UK Design System is a framework that allows a multidisciplinary team to
rapidly produce working and part-working prototypes of digital services.
As GDS say: ‘Use this design system to make your service consistent with GOV.UK.
Learn from the research and experience of other service teams and avoid repeating
work that’s already been done.’
Road Freight Electronic Data Discovery Report Page 66 of 79

Use the Alpha to test and validate the suitability of the GOV.UK Design System as the
basis for your service.
8.5. DATA RECOMMENDATIONS
A shi� to a digital platform, and more digital methods of collection, will lead to a
larger, higher quality data set. This will provide benefits to analysts who will have
faster access to more accurate data, as well as increased capacity.
And it will benefit survey respondents by making possible the pre-population of
surveys from the Department (and potentially other) data sets, as well as automated
validation at the point of collection, rather than a�er-the-fact manual checks.
We recommend starting with simple browser based digital collection (the MVP) and a
digital platform built with future opportunities in mind, and then using the Alpha to
explore these opportunities further.
These data opportunities to explore are described below.
8.5.1. Validate data at the point of collection
We recommend data validation at the point of data entry, for example by enforcing
data input checks on a web form, ensuring that potential errors are averted and
corrections are made by the person entering the data who has access to the source
information. This will remove the reliance on assumptions that are inherent in
validation at subsequent stages.
Validation to explore includes:
➔ Avoid missing data: prevent users from submitting data without completing all
relevant fields
➔ Ensure consistency: only allow values from a list of valid options, e.g. select
from category lists
➔ Reduce errors: check that input values are a valid format
➔ Reduce errors: check that values are valid, e.g. check that the weight of goods or
distances entered are within the bounds of possibility
Road Freight Electronic Data Discovery Report Page 67 of 79

➔ Ensure logical inputs, e.g. one trailer type per journey
8.5.2. Validate post-submission data
Validation will continue to be needed a�er submission as part of an automated data
processing pipeline, building on current methods, and including:
➔ Use anomaly detection algorithms to identify outliers (see 8.3.6)
➔ Remove duplicate entries
➔ Identify un-returned surveys
8.5.3. Link to other data sets
A digital platform has the potential to more easily link to other data sources, which can
enable a greater scope for modelling.
Potential linked data sources to explore include:
➔ Freight at ports, rail and air (see 2.2.3)
➔ Data relating to emissions performance of vehicles
➔ DVLA/DVSA records
8.5.4. Explore the possibility of richer data sets
A digital platform has the potential to enable upload approaches and integration of
data sources that are not currently possible. Potential opportunities to explore
include:
➔ Bulk upload from existing digital systems via an API, which has the potential to
increase the scale of the road freight data with little additional effort for the
business
➔ Additional forms of data, including routing data, which could be used to create a
national freight heatmap
➔ Greater granularity in the data capture in free text, in additional to pre-set
category lists
Road Freight Electronic Data Discovery Report Page 68 of 79

8.5.5. Make use of new metadata
The digital platform will enable the collection of metadata, such as how long the
haulier took to fill out the form.
This has potential to be used by a redesigned support service (see 8.3.5), for example
by identifying forms that have been filled out suspiciously quickly.
8.5.6. Explore opportunities for machine learning in the data
collection process
The digital platform will provide opportunities to use machine learning to improve
data collection. Opportunities to explore include:
➔ Automated classification: assign responses to categories without explicit
manual coding, e.g. automatically code free text to Eurostat categories
➔ Anomaly detection: identify unusual values in the data set, that may be caused
by incorrect input
8.5.7. Explore new opportunities for modelling
The digital platform will provide benefits to analysts and data users. Potential benefits
enabled by this approach might include:
➔ Linking road freight to other modes to model intermodal data
➔ Linking road freight statistics to vehicle emissions data could enable improved
air quality modelling
➔ Using the data in combination with routing algorithms could improve network
demand forecasting
➔ Real time analysis could be undertaken, with quick requests for information
sent out in response to evolving situations
➔ Anomalous behavior or step changes in behavior can be identified, for example
in response to major policy changes or events
Road Freight Electronic Data Discovery Report Page 69 of 79

8.6. GOVERNANCE RECOMMENDATIONS
8.6.1. Assemble a multidisciplinary team
According to the GDS Service Standard you must: ‘Put in place a sustainable
multidisciplinary team that can design, build and operate the service, led by a suitably
skilled and senior service manager with decision-making responsibility.’
The service will fail its service assessments without such a team. Read more detail on
the GDS Service Manual.
We recommend assembling these roles to be able to design and deliver an Alpha
prototype of the Road Freight Statistics service. The table highlights the likely source of
each role.
TEAM ROLE WHO / WHERE FROM NOTES
Service owner Senior figure in the RFS Overall decision making team responsibility for the service.
Product manager From the RFS team Day to day ownership and responsibility for the product.
Statistician DfT/technical partner To advise on the sampling or contractor methodology.
Technical architect DfT/technical partner See 8.4.3 or contractor
Data modeller DfT/technical partner To ensure the data model is designed or contractor to be logical, efficient and aligned to
the DfT Data Strategy.
Delivery manager Technical partner or To monitor and keep the project on contractor track.
User researcher Specialist supplier / Plan and conduct ongoing user contractor research activities (including usability
testing).
Road Freight Electronic Data Discovery Report Page 70 of 79
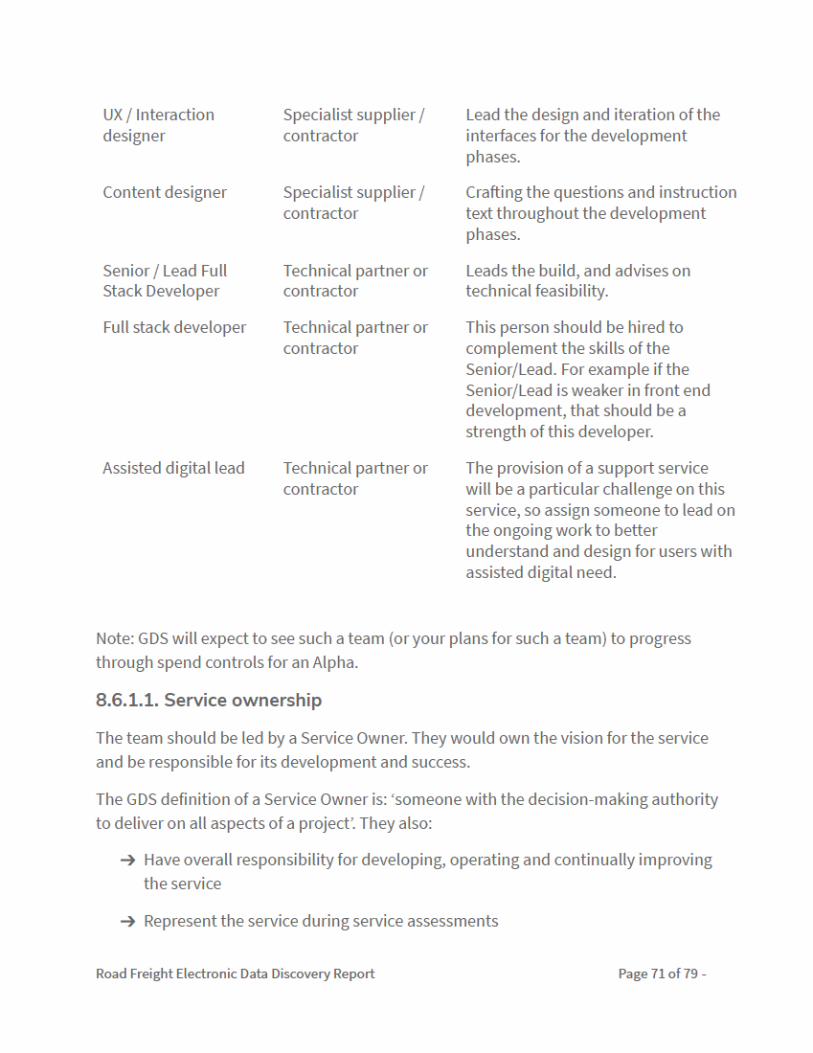
UX / Interaction Specialist supplier / Lead the design and iteration of the designer contractor interfaces for the development
phases.
Content designer Specialist supplier / Cra�ing the questions and instruction contractor text throughout the development
phases.
Senior / Lead Full Technical partner or Leads the build, and advises on Stack Developer contractor technical feasibility.
Full stack developer Technical partner or This person should be hired to contractor complement the skills of the
Senior/Lead. For example if the Senior/Lead is weaker in front end development, that should be a strength of this developer.
Assisted digital lead Technical partner or The provision of a support service contractor will be a particular challenge on this
service, so assign someone to lead on the ongoing work to better understand and design for users with assisted digital need.
Note: GDS will expect to see such a team (or your plans for such a team) to progress
through spend controls for an Alpha.
8.6.1.1. Service ownership
The team should be led by a Service Owner. They would own the vision for the service
and be responsible for its development and success.
The GDS definition of a Service Owner is: ‘someone with the decision-making authority
to deliver on all aspects of a project’. They also:
➔ Have overall responsibility for developing, operating and continually improving
the service
➔ Represent the service during service assessments
Road Freight Electronic Data Discovery Report Page 71 of 79

➔ Make sure the necessary project and approval processes are followed
➔ Identify and mitigate risks to the project
➔ Have responsibility for the service’s assisted digital support
The GDS Service Manual further outlines the Service Owner role.
8.6.1.2. Product management
Such a service needs a dedicated Product Manager to make the day-to-day decisions
about the development and iteration of the digital survey platform. This is in line with
the GDS Service Manual.
A Product Owner:
➔ Ensures their product fits in with the organisation’s priorities
➔ Defines the goals and ‘product vision’
➔ Prioritises user stories and ensures their product meets user needs
➔ Comments on technical, content and design solutions
The nominated Product Owner should be empowered to achieve this.
View the detailed GDS Product manager: role description and consider attending the
three day GDS Digital Academy Working level for product managers course.
8.6.2. Learn from other service delivery teams
Engage with other multidisciplinary teams at different stages of their own service
life-cycles to benefit from their experiences:
➔ Observe their show and tells, sprint planning sessions, and retrospectives
➔ Ask for feedback on your approach and work
Start with the Port Freight team.
8.7. ALPHA EXPERIMENTS
Road Freight Electronic Data Discovery Report Page 72 of 79
The Alpha is largely an experiment or proof of concept of the potential service. It is also
a big learning opportunity for what Delivery Team is required and how it should
operate going forwards.
We strongly recommend the Delivery Team approach the Alpha with a shared set of
questions you are attempting to answer (or much better understand) over the course
of the Alpha.
Depending on the recommendations you adopt and the packages you prioritise for
Alpha, questions could include:
1.How far is it possible to reduce burden through the design of a browser based
form?
2.What is the appetite to work with the Department on automated collection,
amongst hauliers with large fleets?
3.What format of published data would be most suitable for communicating with
hauliers?
4.What is the actual level of need for the assisted digital service?
5.What sources of data can be integrated to enable users to check and confirm
data that is already held?
6.What communications messages achieve the best results in A/B testing to
motivate survey respondents to a) complete the survey and b) complete the
survey accurately?
7.How far can collaboration and workflow features help satisfy the particular
needs of hire companies?
8.How far can machine learning increase the effectiveness of validation at the
point of collection over time?
9.How far is it possible to reduce the need for post collection validation by
validating at the point of collection?
10. Can anomaly detection effectively identify intervention opportunities for the
support team?
Road Freight Electronic Data Discovery Report Page 73 of 79

11. How far is it possible to link and integrate other data sources?
12. What opportunities can be realised through the collection of richer data sets?
These are in addition to the standard set that GDS recommends using the experience
of building prototypes in the Alpha to:
1.Find the problems with the design of your service and decide how you’ll solve
them
2.Make some estimates about how much your service will cost
3.Identify the biggest risks for the Beta stage, as early as possible
8.8. EARLY EVALUATION PLAN
An initial set of high-level KPIs have been listed to focus the project team on what
success would look like for a digital road freight service.
Potential KPIs Why measure this? Measuring this
GDS Service Standard metrics
Hauliers rate their level of It is a good metric to indicate Method: a GDS-style satisfaction satisfaction with their the general performance of survey embedded in the service interaction as satisfied or very the survey satisfied Who: Product manager / User
This is a Service Standard researcher metric
Benchmark: TBD
Increase completion rates Completion in this definition Method: see GDS guidance on how could be successfully recorded to calculate journey or a fully completed survey Who: Product manager / User
researcher
Benchmark: TBD depending on the definition of a completion
Cost per transaction The definition of a transaction Method: see GDS guidance on how could either be fully to calculate completed survey
Who: Product manager
Road Freight Electronic Data Discovery Report Page 74 of 79

Benchmark: TBD
Digital uptake Note: this may not be relevant Method: see GDS guidance on how as there are no other channels to calculate for this transaction (once the paper version is removed) Who: Product manager
Benchmark: TBD
9. ANNEX I - DISCOVERY RESEARCH
9.1. RESEARCH SOURCES
A range of existing material has been reviewed during the Discovery phase:
➔ Experience of Completing the Continuing Survey of Road Goods Transport,
Systra, 2015
➔ Continuing Survey of Road Goods Transport Great Britain (CSRGT GB)
➔ Continuing Survey of Road Goods Transport Northern Ireland (CSRGT NI)
➔ International Road Haulage Survey (IRHS)
➔ DfTc Digital Service Architecture Principles and Standards 12 March 2019
9.2. STAKEHOLDER INTERVIEWS
A range of stakeholders have been interviewed during the Discovery phase, including:
1.Lucy Mills - Road Freight Statistics, Statistics Roads and Freight, Department for
Transport
2.Nayim Ahmed -Statistical Officer, Road Freight Statistics, Department for
Transport
3.Peter McArdle - Senior Database Administrator, Digital Service, Department for
Transport
Road Freight Electronic Data Discovery Report Page 75 of 79

4. Matthew Johnson - Higher Statistical Officer, Road Freight Statistics,
Department for Transport
5.Paul McEvoy - Head of Road Freight Statistics, Statistics Roads and Freight,
Department for Transport
6.Darren Williams - Road Freight Statistics, Statistics Road and Freight,
Department for Transport
7.Richard Barron - Data Architect, Digital Service, Department for Transport
8.Jack Stanley - EU Exit Analysis Lead, Road Freight Statistics, Department for
Transport
Notes of all the interviews are available as text documents in the project’s Basecamp
space https://3.basecamp.com/3606110/buckets/12068489/vaults/1793917049.
9.2.1. Landscape stakeholder interviewees
1.Nicola George - Port Freight, Department for Transport
2.Dr Thomas Karner - Statistics Austria
3.Carsten Zornig - Statistics Denmark
4.John Lewis - GSS Data Project, ONS
9.3. USER PARTICIPANTS (IN MODERATED ACTIVITIES)
All the users below were involved in phone interviews, field observations or the user
needs workshop.
9.3.1. User interviews
1.Survey respondent, hire company - GB survey
2.Survey respondent, haulage transport manager (medium sized) - GB survey
3.Survey respondent, Haulier (small sized) - IRHS survey
Road Freight Electronic Data Discovery Report Page 76 of 79

4. Survey respondent, Haulier (small to medium sized) - NI survey
5. Survey respondent, Haulier (medium sized) - IRHS survey
6. Survey respondent, Haulier - GB survey
7. Survey respondent , Haulier - GB survey
8. Survey respondent, Haulier - GB survey
9. Survey respondent, Haulier (small) - GB survey
10. Survey respondent, Haulier (large) - GB survey
11. Data user - Transport Scotland
12. Data user - Office for National Statistics
13. Data user - Transport Ireland
14. Data user - AECOM
15. Data user - EU Exit Roads, Department for Transport
16. Data users (2) - Roads & EU Exit, Department for Transport
17. Data user - Department for Exiting the European Union
9.3.2. Workshop
1. Survey respondent, Haulier (medium) - GB survey
2. Survey respondent, Haulier (large) - GB survey
3. Survey respondent, Haulier (large) - GB survey
4. Survey respondent, Haulier (large) - GB survey
5. Data User - EU Exit Transport Analysis Team, Department for Transport
6. Data User - Policy Advisor, Dangerous Goods Division, Department for Transport
9.3.3. Field visits
Road Freight Electronic Data Discovery Report Page 77 of 79

1. Survey respondent, Haulier (medium) - GB survey
2. Survey respondent, Haulier (large) - IRHS survey
3. Hastings Capture Team, Hastings
Road Freight Electronic Data Discovery Report Page 78 of 79

10. ANNEX II - DISCOVERY OUTPUTS These outputs have been delivered in accordance with the project proposal:
1.Kick-off meeting: RACI names, project plan - (captured in Basecamp)
2.Stakeholder interview log
3.Notes from stakeholder interviews (captured in Basecamp)
4.User research participants log
5.User research notes and analysis from user interviews, field visits, workshop,
and qualitative survey data
6.User needs workshop run sheet, prompt sheets and photos
7.User proto-persona profiles
8.User feedback survey results and analysis
9.User needs survey results and analysis
10. Field observations (photos)
11. User stories backlog
12. Technology review - (see section 6)
13. Landscape analysis - (see section 7)
14. Assisted digital impact assessment - (see section 5)
15. Journey service map (PDF export)
16. Show and tell presentation
17. Concept prototypes
18. Discovery report (this document)
19. Discovery presentation deck
Road Freight Electronic Data Discovery Report Page 79 of 79


![Electronic Discovery Preparedness Checklist [Ober|Kaler]](https://img.pdfslide.net/doc/110x75/61f4b9049fb7614dc939e2b9/electronic-discovery-preparedness-checklist-oberkaler.jpg)