Embed Size (px)
Citation preview
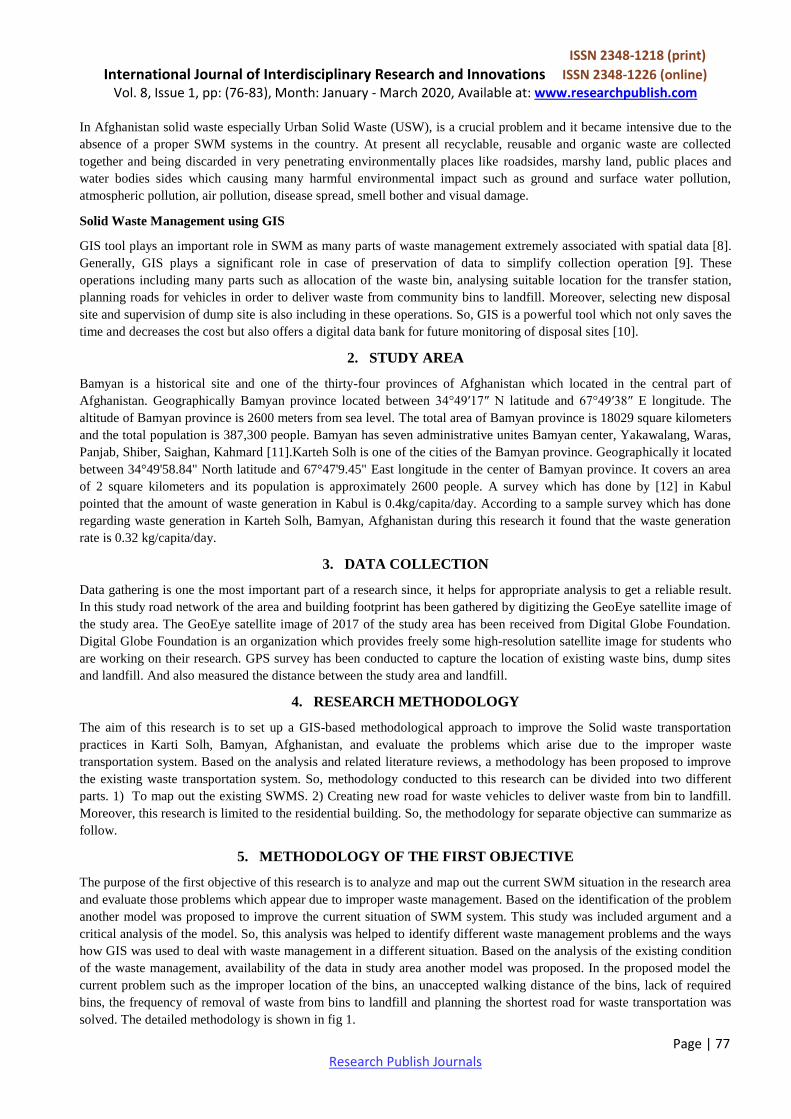
ISSN 2348-1218 (print)
International Journal of Interdisciplinary Research and Innovations ISSN 2348-1226 (online) Vol. 8, Issue 1, pp: (76-83), Month: January - March 2020, Available at: www.researchpublish.com
Page | 76 Research Publish Journals
Road optimization for waste transportation
using GIS: A Case Study for Karteh Solh,
Bamyan, Afghanistan
Assistant Professor Mohammad Jawed Nabizada
Head of Geodesy Department, Bamyan University, Bamyan, Afghanistan
E-mail: [email protected], Mobile: (+93) 775693732
Abstract: Solid waste transportation is one of the most important parts of solid waste management system which
consume approximately 70-80% of overall cost of solid waste management system. The aim of this study is to
develop a GIS based methodological approach to reduce the overall travel distance for transportation of municipal
solid waste from residential area to landfill which result less fuel consumption. The shortest collection roads for
transportation of municipal solid waste has been created using network analyst extension. All those bins which
must visit for clearing purpose divided into clusters based on the capacity of the collection vehicle, the average rate
of filling of bins and their proximity distance. Here, it assumed that the filling rate of all bins are equal during the
collection period and considered to be 80%. After creating new road for transportation of urban solid waste has
been found that the Total annual travelled distance in proposed waste collection system is 30% lesser than the total
annual travelled distance covered by waste collection vehicle in current waste collection system.
Keywords: Urban Solid Waste Management (USWM), Geographic Information System (GIS), Global Positioning
System (GPS), network analyst, waste transportation, shortest road.
1. INTRODUCTION
Solid Waste Management (SWM) is a component of multiple activities such as collection, transportation, and disposal of
solid waste [1]. On the other hand, it also includes processing and treatment of the solid waste before disposing [2]. The
aim of SWM is to create an unpolluted environment for human without annoying natural resource [3]. Solid Waste
Management is one of the fundamental and vital services provided by municipal authorities to preserve cities clean and
sanitary [4]. However, waste management is a crucial problem as a rise in urbanization and economic development is
leading to a big increase in amounts of waste materials. Lack of a proper waste management resulting open dumping,
burning, and burying leads to crucial environmental and health problems. In order to reduce the increase in the amount of
waste and to reduce the impact of waste on the environment and public health, we need to develop a wide-ranging waste
management system. This can be only achieved by joining new technologies. GIS is one of the powerful technologies that
have a huge involvement in planning and management of waste. SWM fundamentally involves the collection of waste,
transportation of waste and disposal of waste [5].
The overall objective of this research is to set up a GIS-based methodological approach to improve the Solid waste
transportation in Karti Solh, Bamyan, Afghanistan.
In Thailand, the waste management system is like this to sort the waste in three types’ recyclable, food and toxic waste
and dispose them in three different waste bins. Then these wastes are transported with different color trucks. The
recyclable waste is transported to sorting plants in order to classify it again to get different recyclable materials. Food
waste is transported to composting plants and then disposals are transported to a landfill. And toxic waste will treat by
incinerating [6]. Similarly, in many India cities, solid waste is normally disposed of in open dump. That led to an
environmental hazard and ecological imbalances [7].
ISSN 2348-1218 (print)
International Journal of Interdisciplinary Research and Innovations ISSN 2348-1226 (online) Vol. 8, Issue 1, pp: (76-83), Month: January - March 2020, Available at: www.researchpublish.com
Page | 77 Research Publish Journals
In Afghanistan solid waste especially Urban Solid Waste (USW), is a crucial problem and it became intensive due to the
absence of a proper SWM systems in the country. At present all recyclable, reusable and organic waste are collected
together and being discarded in very penetrating environmentally places like roadsides, marshy land, public places and
water bodies sides which causing many harmful environmental impact such as ground and surface water pollution,
atmospheric pollution, air pollution, disease spread, smell bother and visual damage.
Solid Waste Management using GIS
GIS tool plays an important role in SWM as many parts of waste management extremely associated with spatial data [8].
Generally, GIS plays a significant role in case of preservation of data to simplify collection operation [9]. These
operations including many parts such as allocation of the waste bin, analysing suitable location for the transfer station,
planning roads for vehicles in order to deliver waste from community bins to landfill. Moreover, selecting new disposal
site and supervision of dump site is also including in these operations. So, GIS is a powerful tool which not only saves the
time and decreases the cost but also offers a digital data bank for future monitoring of disposal sites [10].
2. STUDY AREA
Bamyan is a historical site and one of the thirty-four provinces of Afghanistan which located in the central part of
Afghanistan. Geographically Bamyan province located between 34°49′17″ N latitude and 67°49′38″ E longitude. The
altitude of Bamyan province is 2600 meters from sea level. The total area of Bamyan province is 18029 square kilometers
and the total population is 387,300 people. Bamyan has seven administrative unites Bamyan center, Yakawalang, Waras,
Panjab, Shiber, Saighan, Kahmard [11].Karteh Solh is one of the cities of the Bamyan province. Geographically it located
between 34°49'58.84" North latitude and 67°47'9.45" East longitude in the center of Bamyan province. It covers an area
of 2 square kilometers and its population is approximately 2600 people. A survey which has done by [12] in Kabul
pointed that the amount of waste generation in Kabul is 0.4kg/capita/day. According to a sample survey which has done
regarding waste generation in Karteh Solh, Bamyan, Afghanistan during this research it found that the waste generation
rate is 0.32 kg/capita/day.
3. DATA COLLECTION
Data gathering is one the most important part of a research since, it helps for appropriate analysis to get a reliable result.
In this study road network of the area and building footprint has been gathered by digitizing the GeoEye satellite image of
the study area. The GeoEye satellite image of 2017 of the study area has been received from Digital Globe Foundation.
Digital Globe Foundation is an organization which provides freely some high-resolution satellite image for students who
are working on their research. GPS survey has been conducted to capture the location of existing waste bins, dump sites
and landfill. And also measured the distance between the study area and landfill.
4. RESEARCH METHODOLOGY
The aim of this research is to set up a GIS-based methodological approach to improve the Solid waste transportation
practices in Karti Solh, Bamyan, Afghanistan, and evaluate the problems which arise due to the improper waste
transportation system. Based on the analysis and related literature reviews, a methodology has been proposed to improve
the existing waste transportation system. So, methodology conducted to this research can be divided into two different
parts. 1) To map out the existing SWMS. 2) Creating new road for waste vehicles to deliver waste from bin to landfill.
Moreover, this research is limited to the residential building. So, the methodology for separate objective can summarize as
follow.
5. METHODOLOGY OF THE FIRST OBJECTIVE
The purpose of the first objective of this research is to analyze and map out the current SWM situation in the research area
and evaluate those problems which appear due to improper waste management. Based on the identification of the problem
another model was proposed to improve the current situation of SWM system. This study was included argument and a
critical analysis of the model. So, this analysis was helped to identify different waste management problems and the ways
how GIS was used to deal with waste management in a different situation. Based on the analysis of the existing condition
of the waste management, availability of the data in study area another model was proposed. In the proposed model the
current problem such as the improper location of the bins, an unaccepted walking distance of the bins, lack of required
bins, the frequency of removal of waste from bins to landfill and planning the shortest road for waste transportation was
solved. The detailed methodology is shown in fig 1.
ISSN 2348-1218 (print)
International Journal of Interdisciplinary Research and Innovations ISSN 2348-1226 (online) Vol. 8, Issue 1, pp: (76-83), Month: January - March 2020, Available at: www.researchpublish.com
Page | 78 Research Publish Journals
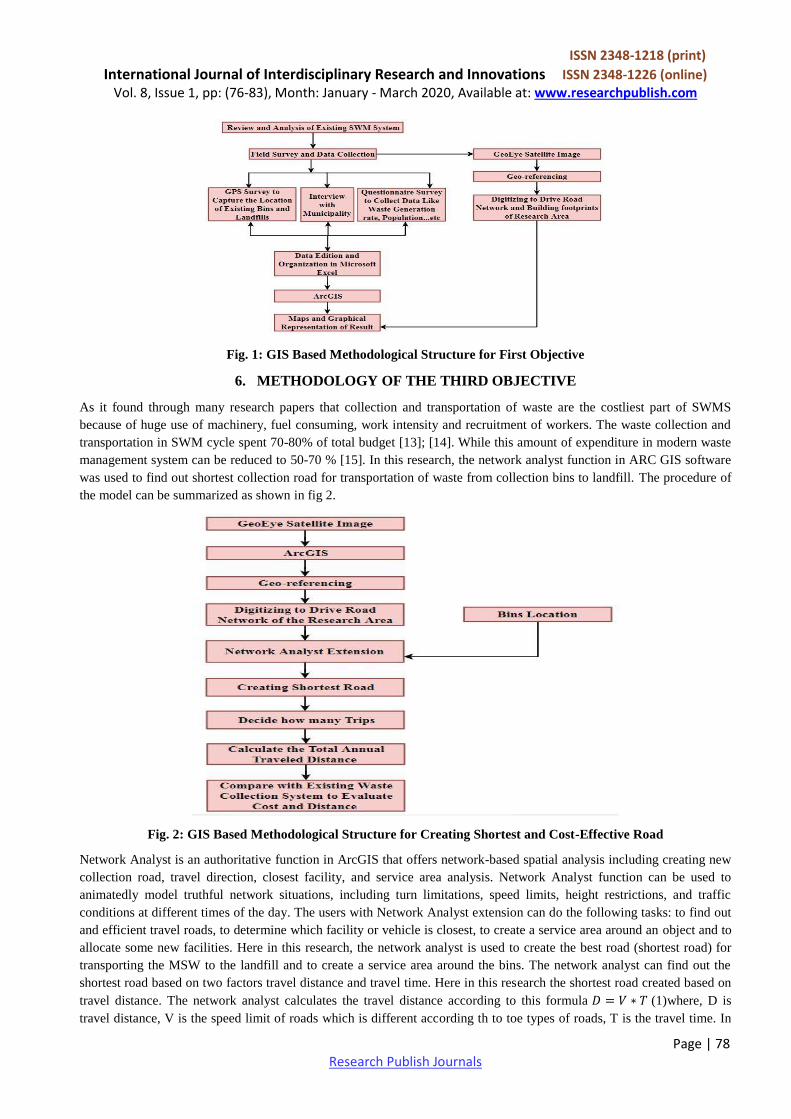
Fig. 1: GIS Based Methodological Structure for First Objective
6. METHODOLOGY OF THE THIRD OBJECTIVE
As it found through many research papers that collection and transportation of waste are the costliest part of SWMS
because of huge use of machinery, fuel consuming, work intensity and recruitment of workers. The waste collection and
transportation in SWM cycle spent 70-80% of total budget [13]; [14]. While this amount of expenditure in modern waste
management system can be reduced to 50-70 % [15]. In this research, the network analyst function in ARC GIS software
was used to find out shortest collection road for transportation of waste from collection bins to landfill. The procedure of
the model can be summarized as shown in fig 2.
Fig. 2: GIS Based Methodological Structure for Creating Shortest and Cost-Effective Road
Network Analyst is an authoritative function in ArcGIS that offers network-based spatial analysis including creating new
collection road, travel direction, closest facility, and service area analysis. Network Analyst function can be used to
animatedly model truthful network situations, including turn limitations, speed limits, height restrictions, and traffic
conditions at different times of the day. The users with Network Analyst extension can do the following tasks: to find out
and efficient travel roads, to determine which facility or vehicle is closest, to create a service area around an object and to
allocate some new facilities. Here in this research, the network analyst is used to create the best road (shortest road) for
transporting the MSW to the landfill and to create a service area around the bins. The network analyst can find out the
shortest road based on two factors travel distance and travel time. Here in this research the shortest road created based on
travel distance. The network analyst calculates the travel distance according to this formula (1)where, D is
travel distance, V is the speed limit of roads which is different according th to toe types of roads, T is the travel time. In
ISSN 2348-1218 (print)
International Journal of Interdisciplinary Research and Innovations ISSN 2348-1226 (online) Vol. 8, Issue 1, pp: (76-83), Month: January - March 2020, Available at: www.researchpublish.com
Page | 79 Research Publish Journals
order to calculate solve this equation have the value of V and T for each segment of the road. A network service can be
defined as an area which include all those available roads that are crossing through that area and have a definite length.
The service area around the bins were created according to the convenient distance that was gathered during field survey.
Network analyst extension solve all these problems by combining both spatial and non-spatial data.
In this analysis, the collection frequencies are proposed for the collection of mixed wastes based on the size of the bin and
amount of generated waste. The number of trips calculated based on the amount of generated waste in the area and
capacity of trucks. All the collection bins that should be visited emptied divided into clusters based on the capacity of the
waste collection vehicle and their proximity distance, according to this formula
where, N- clusters number,
V1- bins capacity in , N1- the total number of bins in the study area and V- waste vehicle collection capacity. And the
total distance has calculated based on this formula D = n*d (3) where D- is the total distance in one year, n- is the number
of trip and d- is the round-trip haul distance. Then the total distance traveled by the collection vehicle in the present
system was measured by GPS trucking. And finally, the total expenditure has been calculated based on the fuel
consumption by this formula where T is total annual vehicle running cost, P is vehicle running cost per
kilometer and D is annual total traveled distance.
7. RESULT AND DISCUSSIONS
Current MSW Collection System of Study Area
Presently, the most common method of waste collection which practice in the study area is a door to door method but, the
side street also practices. Currently, totally there are 23 official bins (18 bins with 0.45 cubic meter volume, 4 open
official dump sites and 1 concrete bin with 6.5 cubic meter volume). On the other hand, there are 3 more nonofficial open
dump sites. The current dustbins are not allocated properly over the entire area. Furthermore, there is no any scientific
method followed to allocate the bins. Due to improperly distribution of dustbins in the study area, there is an
inconvenience distance for the households to throw their MSW into collection bins in the study area. Eventually, this
leads to more dumping of MSW besides roads, drainage, and any other sensitive areas.
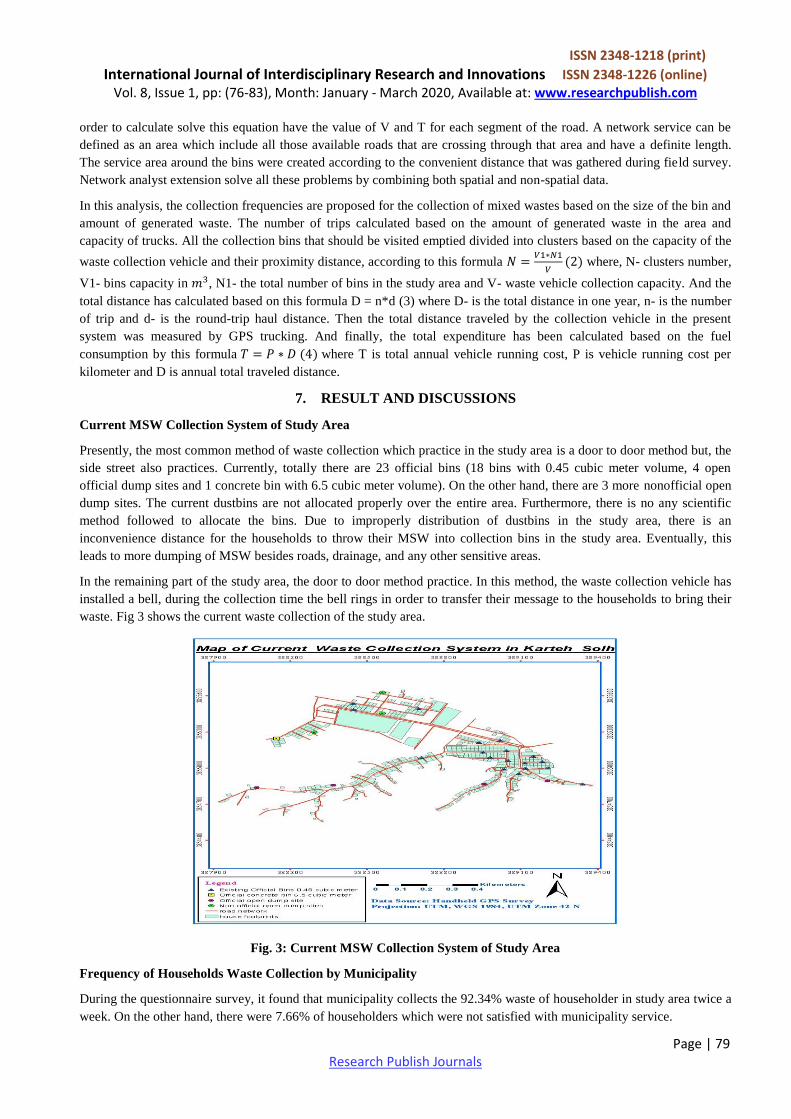
In the remaining part of the study area, the door to door method practice. In this method, the waste collection vehicle has
installed a bell, during the collection time the bell rings in order to transfer their message to the households to bring their
waste. Fig 3 shows the current waste collection of the study area.
Fig. 3: Current MSW Collection System of Study Area
Frequency of Households Waste Collection by Municipality
During the questionnaire survey, it found that municipality collects the 92.34% waste of householder in study area twice a
week. On the other hand, there were 7.66% of householders which were not satisfied with municipality service.
ISSN 2348-1218 (print)
International Journal of Interdisciplinary Research and Innovations ISSN 2348-1226 (online) Vol. 8, Issue 1, pp: (76-83), Month: January - March 2020, Available at: www.researchpublish.com
Page | 80 Research Publish Journals
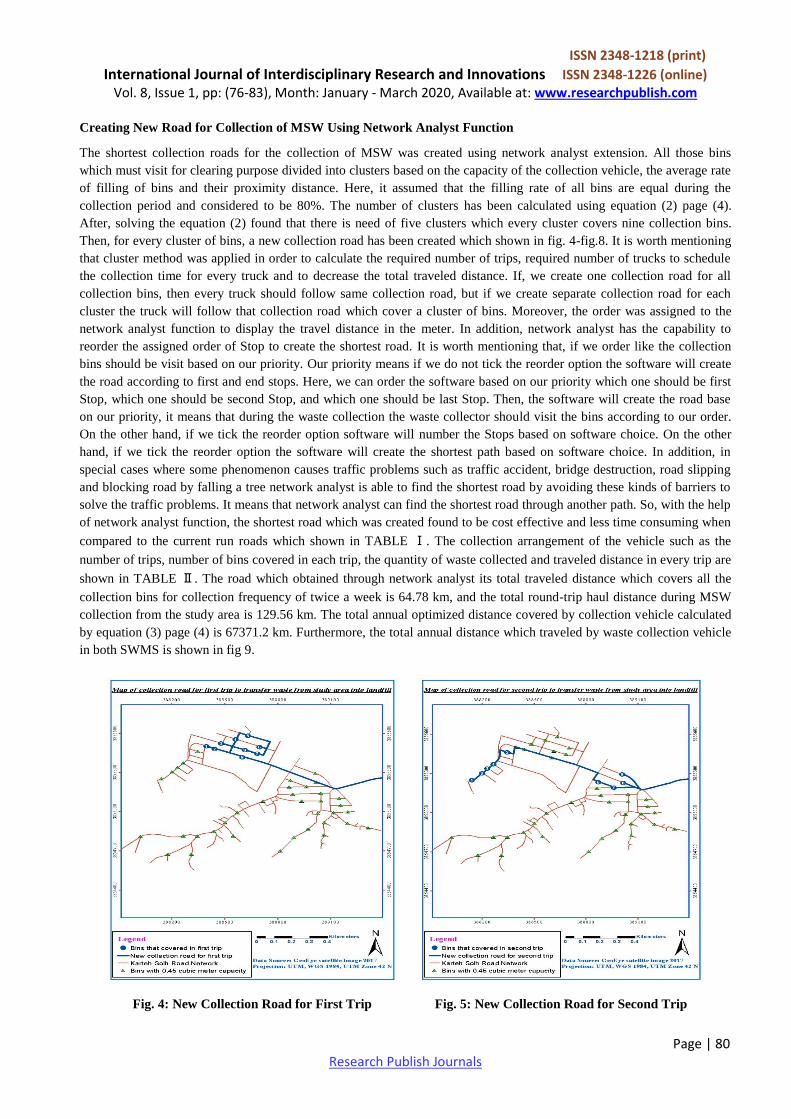
Creating New Road for Collection of MSW Using Network Analyst Function
The shortest collection roads for the collection of MSW was created using network analyst extension. All those bins
which must visit for clearing purpose divided into clusters based on the capacity of the collection vehicle, the average rate
of filling of bins and their proximity distance. Here, it assumed that the filling rate of all bins are equal during the
collection period and considered to be 80%. The number of clusters has been calculated using equation (2) page (4).
After, solving the equation (2) found that there is need of five clusters which every cluster covers nine collection bins.
Then, for every cluster of bins, a new collection road has been created which shown in fig. 4-fig.8. It is worth mentioning
that cluster method was applied in order to calculate the required number of trips, required number of trucks to schedule
the collection time for every truck and to decrease the total traveled distance. If, we create one collection road for all
collection bins, then every truck should follow same collection road, but if we create separate collection road for each
cluster the truck will follow that collection road which cover a cluster of bins. Moreover, the order was assigned to the
network analyst function to display the travel distance in the meter. In addition, network analyst has the capability to
reorder the assigned order of Stop to create the shortest road. It is worth mentioning that, if we order like the collection
bins should be visit based on our priority. Our priority means if we do not tick the reorder option the software will create
the road according to first and end stops. Here, we can order the software based on our priority which one should be first
Stop, which one should be second Stop, and which one should be last Stop. Then, the software will create the road base
on our priority, it means that during the waste collection the waste collector should visit the bins according to our order.
On the other hand, if we tick the reorder option software will number the Stops based on software choice. On the other
hand, if we tick the reorder option the software will create the shortest path based on software choice. In addition, in
special cases where some phenomenon causes traffic problems such as traffic accident, bridge destruction, road slipping
and blocking road by falling a tree network analyst is able to find the shortest road by avoiding these kinds of barriers to
solve the traffic problems. It means that network analyst can find the shortest road through another path. So, with the help
of network analyst function, the shortest road which was created found to be cost effective and less time consuming when
compared to the current run roads which shown in TABLE Ⅰ. The collection arrangement of the vehicle such as the
number of trips, number of bins covered in each trip, the quantity of waste collected and traveled distance in every trip are
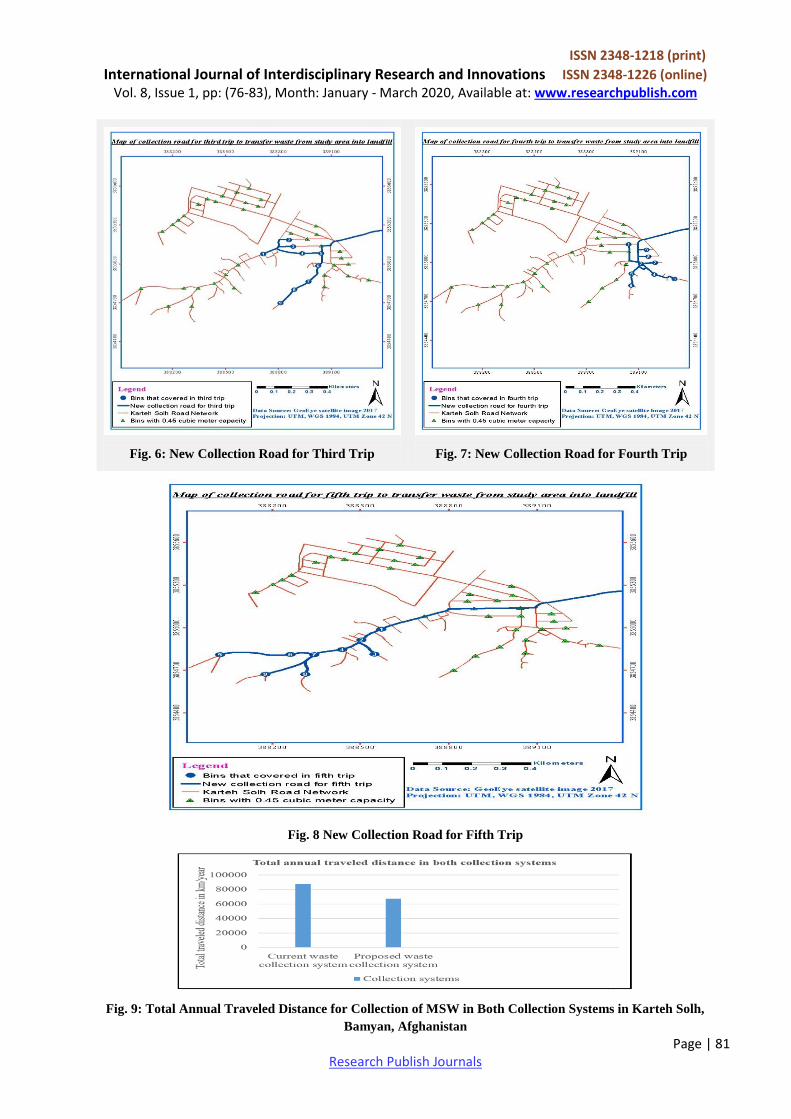
shown in TABLE Ⅱ. The road which obtained through network analyst its total traveled distance which covers all the
collection bins for collection frequency of twice a week is 64.78 km, and the total round-trip haul distance during MSW
collection from the study area is 129.56 km. The total annual optimized distance covered by collection vehicle calculated
by equation (3) page (4) is 67371.2 km. Furthermore, the total annual distance which traveled by waste collection vehicle
in both SWMS is shown in fig 9.
Fig. 4: New Collection Road for First Trip
Fig. 5: New Collection Road for Second Trip
ISSN 2348-1218 (print)
International Journal of Interdisciplinary Research and Innovations ISSN 2348-1226 (online) Vol. 8, Issue 1, pp: (76-83), Month: January - March 2020, Available at: www.researchpublish.com
Page | 81 Research Publish Journals
Fig. 6: New Collection Road for Third Trip
Fig. 7: New Collection Road for Fourth Trip
Fig. 8 New Collection Road for Fifth Trip
Fig. 9: Total Annual Traveled Distance for Collection of MSW in Both Collection Systems in Karteh Solh,
Bamyan, Afghanistan
ISSN 2348-1218 (print)
International Journal of Interdisciplinary Research and Innovations ISSN 2348-1226 (online) Vol. 8, Issue 1, pp: (76-83), Month: January - March 2020, Available at: www.researchpublish.com
Page | 82 Research Publish Journals
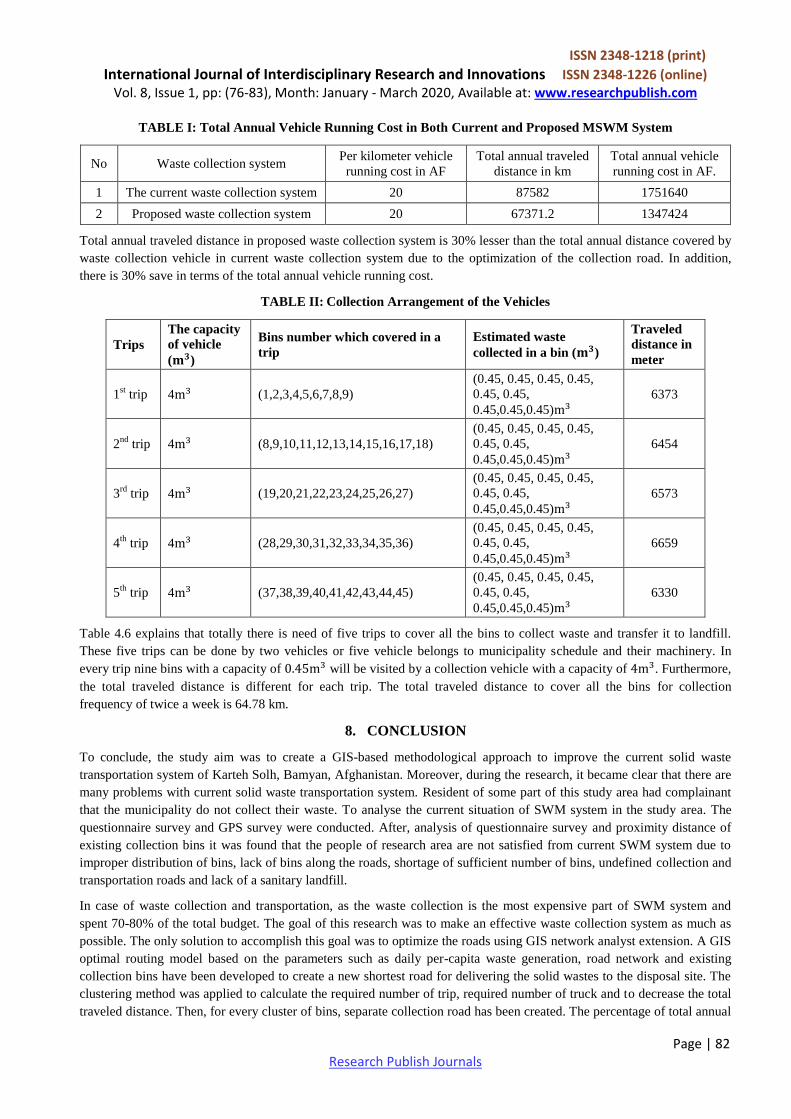
TABLE I: Total Annual Vehicle Running Cost in Both Current and Proposed MSWM System
No Waste collection system Per kilometer vehicle
running cost in AF
Total annual traveled
distance in km
Total annual vehicle
running cost in AF.
1 The current waste collection system 20 87582 1751640
2 Proposed waste collection system 20 67371.2 1347424
Total annual traveled distance in proposed waste collection system is 30% lesser than the total annual distance covered by
waste collection vehicle in current waste collection system due to the optimization of the collection road. In addition,
there is 30% save in terms of the total annual vehicle running cost.
TABLE II: Collection Arrangement of the Vehicles
Trips
The capacity
of vehicle
( )
Bins number which covered in a
trip
Estimated waste
collected in a bin ( )
Traveled
distance in
meter
1st trip 4 (1,2,3,4,5,6,7,8,9)
(0.45, 0.45, 0.45, 0.45,
0.45, 0.45,
0.45,0.45,0.45)
6373
2nd
trip 4 (8,9,10,11,12,13,14,15,16,17,18)
(0.45, 0.45, 0.45, 0.45,
0.45, 0.45,
0.45,0.45,0.45)
6454
3rd
trip 4 (19,20,21,22,23,24,25,26,27)
(0.45, 0.45, 0.45, 0.45,
0.45, 0.45,
0.45,0.45,0.45)
6573
4th
trip 4 (28,29,30,31,32,33,34,35,36)
(0.45, 0.45, 0.45, 0.45,
0.45, 0.45,
0.45,0.45,0.45)
6659
5th
trip 4 (37,38,39,40,41,42,43,44,45)
(0.45, 0.45, 0.45, 0.45,
0.45, 0.45,
0.45,0.45,0.45)
6330
Table 4.6 explains that totally there is need of five trips to cover all the bins to collect waste and transfer it to landfill.
These five trips can be done by two vehicles or five vehicle belongs to municipality schedule and their machinery. In
every trip nine bins with a capacity of will be visited by a collection vehicle with a capacity of . Furthermore,
the total traveled distance is different for each trip. The total traveled distance to cover all the bins for collection
frequency of twice a week is 64.78 km.
8. CONCLUSION
To conclude, the study aim was to create a GIS-based methodological approach to improve the current solid waste
transportation system of Karteh Solh, Bamyan, Afghanistan. Moreover, during the research, it became clear that there are
many problems with current solid waste transportation system. Resident of some part of this study area had complainant
that the municipality do not collect their waste. To analyse the current situation of SWM system in the study area. The
questionnaire survey and GPS survey were conducted. After, analysis of questionnaire survey and proximity distance of
existing collection bins it was found that the people of research area are not satisfied from current SWM system due to
improper distribution of bins, lack of bins along the roads, shortage of sufficient number of bins, undefined collection and
transportation roads and lack of a sanitary landfill.
In case of waste collection and transportation, as the waste collection is the most expensive part of SWM system and
spent 70-80% of the total budget. The goal of this research was to make an effective waste collection system as much as
possible. The only solution to accomplish this goal was to optimize the roads using GIS network analyst extension. A GIS
optimal routing model based on the parameters such as daily per-capita waste generation, road network and existing
collection bins have been developed to create a new shortest road for delivering the solid wastes to the disposal site. The
clustering method was applied to calculate the required number of trip, required number of truck and to decrease the total
traveled distance. Then, for every cluster of bins, separate collection road has been created. The percentage of total annual
ISSN 2348-1218 (print)
International Journal of Interdisciplinary Research and Innovations ISSN 2348-1226 (online) Vol. 8, Issue 1, pp: (76-83), Month: January - March 2020, Available at: www.researchpublish.com
Page | 83 Research Publish Journals
distance which has been saved due to road optimization is 30% and the total cost which has been saved due to road
optimization is 404216 AF. Furthermore, optimizations of collection roads reduce the emission due to vehicles running
and traffic volume on the roads. Finally, the proposed SWM system can be used as the decision support model by
municipal authorities for a proper waste management in any part of the country.
ACKNOWLEDGEMENT
I would like to express my deepest respects and gratitude to my colleagues, Faculty members, and members of research
committee of Bamyan University for their constructive advice, suggestions, continuous encouragement and invaluable
support in completing my research paper.
REFERENCES
[1] Robinson, W.D. (1986). The Solid Waste Handbook: A Practical Guide, John Wiley and Sons, Chichester.
[2] Velumani, A. (2013). GIS based optimal collection routing model for municipal solid waste : case study in
Singanallur , India. International Journal of Engineering and Innovative Technology, 3(5), 1–5.
[3] McDougall, F., White, P., Franke, M., & Hindle, P. (2001). Integrated solid waste management: a life cycle
inventory. In P. R. W. Forbes R McDougall & M. F. and P. Hindle (Eds.), Chemistry & … (second edi). Blackwell
Science. https://doi.org/10.1007/978-1-4615-2369-7
[4] Shohel, M., Rafizul, I., & Roy, S. (2013). Gis Application for Suitable Location of Waste Bin for Solid Waste
Management in Khulna CITY. International Journal of …, 1(1), 26–34. http://www.ijoer.in/IJOER 1.1.2013/4.pdf
[5] Shrivastava, P., Mishra, S., & Katiyar, S. K. (2015). A Review of Solid Waste Management Techniques Using GIS
and Other Technologies. In 2015 International Conference on Computational Intelligence and Communication
Networks (CICN) (pp. 1456–1459). https://doi.org/10.1109/CICN.2015.281
[6] Illeperuma, I. A. K. S., Samarakoon, L. (2010). Locating Bins using GIS. International Journal of Engineering &
Technology IJET-IJENS Vol:10 No:02, (2).
[7] Sharholy, M., Ahmad, K., Mahmood, G., & Trivedi, R. C. (2008). Municipal solid waste management in Indian
cities - A review. Waste Management, 28(2), 459–467.
[8] Kallel, A., Serbaji, M. M., & Zairi, M. (2016). Using GIS-Based Tools for the Optimization of Solid Waste
Collection and Transport: Case Study of Sfax City, Tunisia. Journal of Engineering (United Kingdom), 2016.
https://doi.org/10.1155/2016/4596849
[9] Paul, K., Dutta, A., & Krishna, A. P. (2017). Corporation area. International Journal on Emerging Technologies,
8(1), 511–520.
[10] Oyinloye, M. A. (2013). Using GIS and Remote Sensing in Urban Waste Disposal and Management: A Focus on
Owo L.G.A, Ondo State, Nigeria. European International Journal of Science and Technology, 2(7), 106–118.
[11] CSO (Central Statistics Organization). 2013. Socio-Demographic and Economic Survey Bamyan. Retrieved July 12,
2017, from. Retrieved from http://cso.gov.af/Content/files/Afghanistan SDES Bamiyan Final Report - 24 April
2013.pdf
[12] NEPA (National Environmental Protection Agency). (2010). National Waste Management Policy Retrieved July 10,
2017, from http://faolex.fao.org/docs/pdf/afg63169E.pdf
[13] Nithya, R., Velumani, A., & Senthil Kumar, S. R. R. (2012). Optimal location and proximity distance of municipal
solid waste collection bin using GIS: A case study of Coimbatore city. WSEAS Transactions on Environment and
Development, 8(4), 107–119. https://doi.org/10.11648/j.ajaf.20140206.20
[14] Bhambulkar, A. (2011). Municipal Solid Waste Collection Routes Optimized With ARC GIS Network Analyst.
International Journal of Advanced Engineering Sciences and Technologies, 11(1), 202–207.
[15] Sonesson, U. (2000). Modeling of the waste collection a general approach to calculate fuel consumption and time.
Waste Management and Research, 18(2), 115–123.