Embed Size (px)
Citation preview
U.S. Trunk Highway 8:
I-35 to MN/WI Border
Road Safety Audit: Technical Report February 2014
MnCMAT data 2008-2012: Crashes
Prepared By
Chisago City
Lindstrom Shafer
Center City Taylors Falls
Wisconsin
Table of Contents 1. Introduction .......................................................................................................................................... 4
1.1. Audit Limits ................................................................................................................................... 4
1.2. Road Safety Audit Review Process ................................................................................................ 5
1.3. Road Safety Audit (RSA) Review Team ......................................................................................... 5
1.4. US TH 8 Task Force Meeting ......................................................................................................... 6
2. Background ........................................................................................................................................... 7
2.1. Safety Improvement Projects ....................................................................................................... 7
2.2. Traffic Volumes ............................................................................................................................. 9
2.3. Crash History ............................................................................................................................... 10
2.4. Crashes (2008-2012) ................................................................................................................... 11
2.4.1 Segments Crash Analysis ..................................................................................................... 12
2.4.2 Intersection Crash Analysis ................................................................................................. 18
3. Field Review Observations .................................................................................................................. 21
4. Potential Improvement Strategies ...................................................................................................... 23
4.1. Short, Medium and Long Term Strategies .................................................................................. 23
4.2. Behavior Strategies ..................................................................................................................... 37
5. Conclusion ........................................................................................................................................... 38
March 31, 2014 2
Table of Figures Figure 1: Road Safety Audit Study Area ........................................................................................................ 4 Figure 2: CSAH 25/TH 8 Intersection............................................................................................................. 7 Figure 3: City of Lindstrom 1-way Separated Pair......................................................................................... 8 Figure 4: City of Lindstrom 1-way Separated Pair......................................................................................... 8 Figure 5: Number of Crashes from 1986 to 2012 ....................................................................................... 10 Figure 6: Number of Fatal (K) and Severe (A) Crashes from 1984 to 2012 ................................................. 10 Figure 7: Crash Rates per Million Vehicle Miles (MVM) ............................................................................. 11 Figure 8: Percentage of Fatal (K) and Severe (A) Crashes ........................................................................... 12 Figure 9: TH 8 Segments ............................................................................................................................. 13 Figure 10: Crash Types - By Segment .......................................................................................................... 17 Figure 11: Crash Types - By Intersection ..................................................................................................... 20 Figure 12: CSAH 25 and TH 8 intersection .................................................................................................. 21 Figure 13: TH 95 and TH 8 intersection....................................................................................................... 22 Figure 14: Safe Following Dots .................................................................................................................... 28 Figure 15: Verify Non-motorized Sign Placement ....................................................................................... 29 Figure 16: Backplate for Signal .................................................................................................................... 29 Figure 17: 2+1 Road Section ....................................................................................................................... 30 Figure 18: "QuickChange" Removable Barrier ............................................................................................ 30 Figure 19: Dynamic Speed Sign ................................................................................................................... 31 Figure 20: Roundabout ............................................................................................................................... 31 Figure 21: Continuous Green T- Intersection .............................................................................................. 32 Figure 22: Example of curb extension delineation ..................................................................................... 32 Figure 23: U-turn in Lindstrom .................................................................................................................... 33 Figure 24: RFB ............................................................................................................................................. 33 Figure 25: HAWK System ............................................................................................................................ 33 Figure 26: Centerline Rumble strips............................................................................................................ 34 Figure 27: Break in Guardrail Needed for Non-motorized User Access ..................................................... 35 Figure 28: TH 8/ TH 95 Intersection in Taylors Falls ................................................................................... 36
March 31, 2014 3
1. Introduction The corridor of United States Highway 8, also known as Trunk Highway (TH) 8 from I-35 to the Minnesota and Wisconsin Border, has undergone numerous improvements to address mobility and safety problems experienced along the corridor. As a result of the history of crashes, corridor improvements and concerns expressed by area residents, the Minnesota Department of Transportation (MnDOT) decided to conduct a road safety investigation. The investigation was to determine if the number and severity of crashes is unusual, if the number and severity of crashes has improved as a result of the years of improvements, and to develop and evaluate future potential short, medium, and long term safety improvement strategies for this corridor. HNTB was retained by MnDOT to gather road conditions and safety data, assist in completing a road safety audit and analysis, and provide safety recommendations. This report documents the results of the investigation.
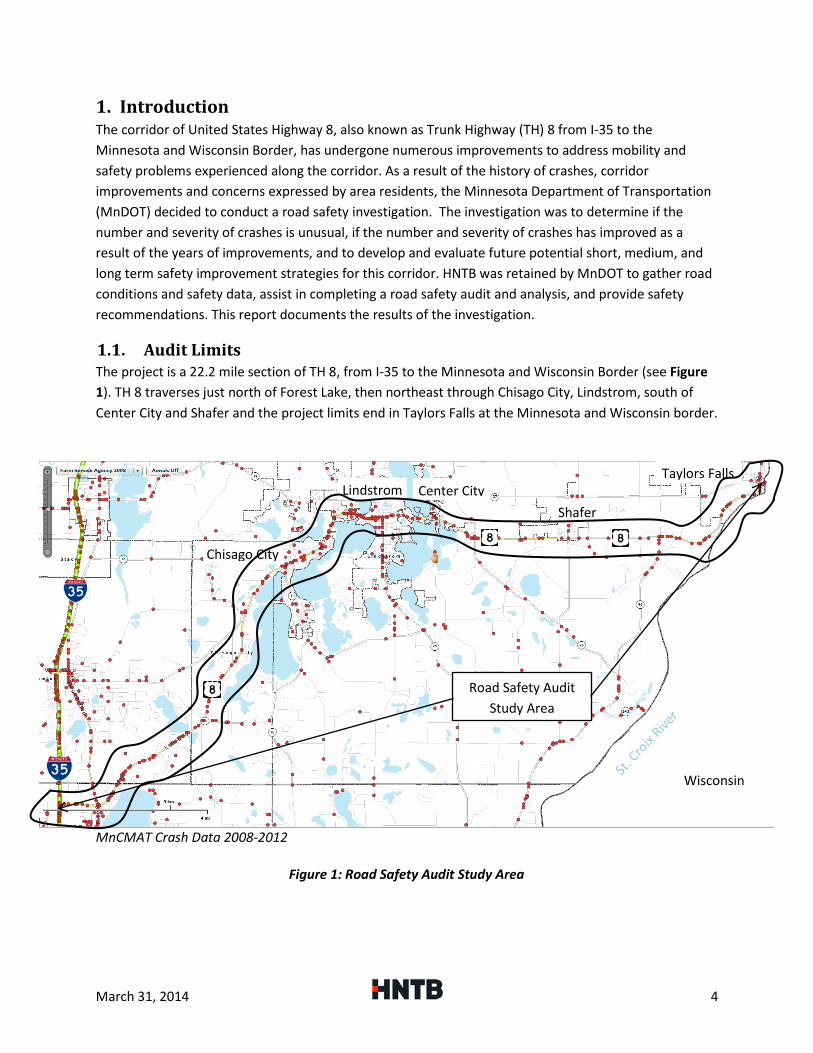
1.1. Audit Limits The project is a 22.2 mile section of TH 8, from I-35 to the Minnesota and Wisconsin Border (see Figure 1). TH 8 traverses just north of Forest Lake, then northeast through Chisago City, Lindstrom, south of Center City and Shafer and the project limits end in Taylors Falls at the Minnesota and Wisconsin border.
MnCMAT Crash Data 2008-2012
Chisago City
Lindstrom Shafer
Center City Taylors Falls
Road Safety Audit Study Area
Wisconsin
Figure 1: Road Safety Audit Study Area
March 31, 2014 4
1.2. Road Safety Audit Review Process The TH 8 Road Safety Audit (RSA) review process included the following steps:
1. Crash data from 2008 to 2012 was assembled using Minnesota Crash Mapping Analysis Tool (MnCMAT) and analyzed for location, severity, year, frequency, type, alcohol/chemical use, age, cause, time of day, day of the week, lighting conditions, weather, and road conditions (see TH 8 I-35 to WI/MN Border Briefing Book).
2. Construction history of the corridor was reviewed and documented. 3. Traffic volumes for the corridor were documented. 4. Detailed crash sheets for each road segment, and for intersections above a calculated
critical crash rate were prepared. 5. Two meetings were held, one pre-audit meeting with MnDOT and HNTB staff, and another
with the US 8 Task Force Coalition, including MnDOT staff. 6. After the meetings, the team examined the corridor in the field, recorded observations,
suggestions and discussed short, medium, and long term mitigation strategies.
1.3. Road Safety Audit (RSA) Review Team MnDOT chose HNTB to assist in the assembly of a review team and the Road Safety Audit Review of the TH 8 corridor. See Table 1.
Name Agency and Position
Brad Estochen MnDOT State Traffic Safety Engineer
Derek Leuer MnDOT Traffic Safety Engineer
Dmitry Tomasevich MnDOT Area Engineer for Chisago County
Darwin Yasis MnDOT Geometric Engineer
Melissa Barnes MnDOT Bicycle and Pedestrian Engineer
Will Stein FHWA Safety Engineer - Minnesota Division
Kevin Skalsky Minnesota State Patrol
Brandi Popenhagen HNTB, Project Manager
Pam Brushaber HNTB, Project Engineer
Table 1: RSA Review Team
March 31, 2014 5
1.4. US TH 8 Task Force Meeting A meeting with the TH 8 Task Force was held early in the process on Monday, November 18th, 2013 at Lindstrom City Hall, from 7:00 to 8:00 pm, prior to the field review. This Task Force consists of a coalition of elected officials, volunteers, and staff from the various communities along TH 8. At this meeting their key corridor issues were identified which provided a foundation of the concerns noted by those living along the corridor. A presentation was given, similar to the TH 8 I-35 to WI/MN Border Briefing Book, and including topics in the discussion during the pre-audit meeting with MnDOT and HNTB staff. Additional issues, or concerns, raised and discussed by the task force members included:
• Intersection near the new McDonalds, Sportsman Drive. Crossing is potentially dangerous. More development is expected to increase traffic volumes at this intersection.
• “Your Speed Is” signs near Lindstrom city limits are desired • U-turn signing in Lindstrom is confusing • Area by Dairy Queen has merging issues • Agriculture traffic and semi-trucks presents issues; i.e. speed differentials, widths, and heavy
volumes • Curves and Geometrics
o Traversing the curve on the TH 8 flyover ramp bridge to SB I-35 is difficult during snow and ice events
o The lane drop prior to the merge onto SB I-35 from TH 8 is sudden also causing problems on the flyover ramp bridge described above
o The lane drop for WB TH 8 in Lindstrom where the one-way pair merges is confusing to motorists
• Advanced Warning Flashers at signals are desired • Pedestrian Crossings ( i.e. signalization) near Grand Avenue is desired • Pleasant View Road at TH 8 experiences substantial heavy gravel trucks traffic • Turn lanes are desired at the Elkton Restaurant near Iris Street in Shaffer • Consider that the summertime recreational traffic is substantially greater (Fridays and
Sundays) resulting in difficult travel throughout the corridor
March 31, 2014 6
2. Background The following describes Trunk Highway (TH) 8’s existing conditions. This includes recent safety improvement projects, volume to capacity analysis, and an analysis of historic and recent crashes. This data provides the context along the corridor in determining safety concerns and recommendations for safety improvements.
TH 8 is a MnDOT interregional corridor that connects the Minneapolis/St. Paul metropolitan area to Rice Lake, WI (Level 2 Trade Center).1 TH 8 is a major east-west corridor for traffic from I-35 to the Minnesota border and into Wisconsin, providing one of only a few St. Croix River crossings with a bridge in Taylor Falls. The corridor is predominately a rural, 2-lane roadway with frequent access points within city limits. Two grade separated interchanges exist on the west end of the project at I-35 and TH 61 while the remainder accesses are at-grade intersections. Eight intersections along the corridor are signalized, mostly with higher volume county roads. The speed limit for the majority of the road is 55, except on entrance and exit ramps, in the urban segments of Lindstrom and Chisago City, and at the intersection with TH 95 in Taylors Falls and the approaching segments. Shoulders, of bituminous or concrete and 4’ or greater, exist for approximately 80% of the roadway, along with rumble strips at various sections of the roadway. Both centerline and edgeline rumbles are present along the corridor. The corridor has been under study for multiple years and has received construction upgrades at a variety of locations as detailed below.
2.1. Safety Improvement Projects MnDOT has implemented a number of lower cost safety improvements along TH 8 corridor between I-35 and the MN/WI border. The following list summarizes each improvement:
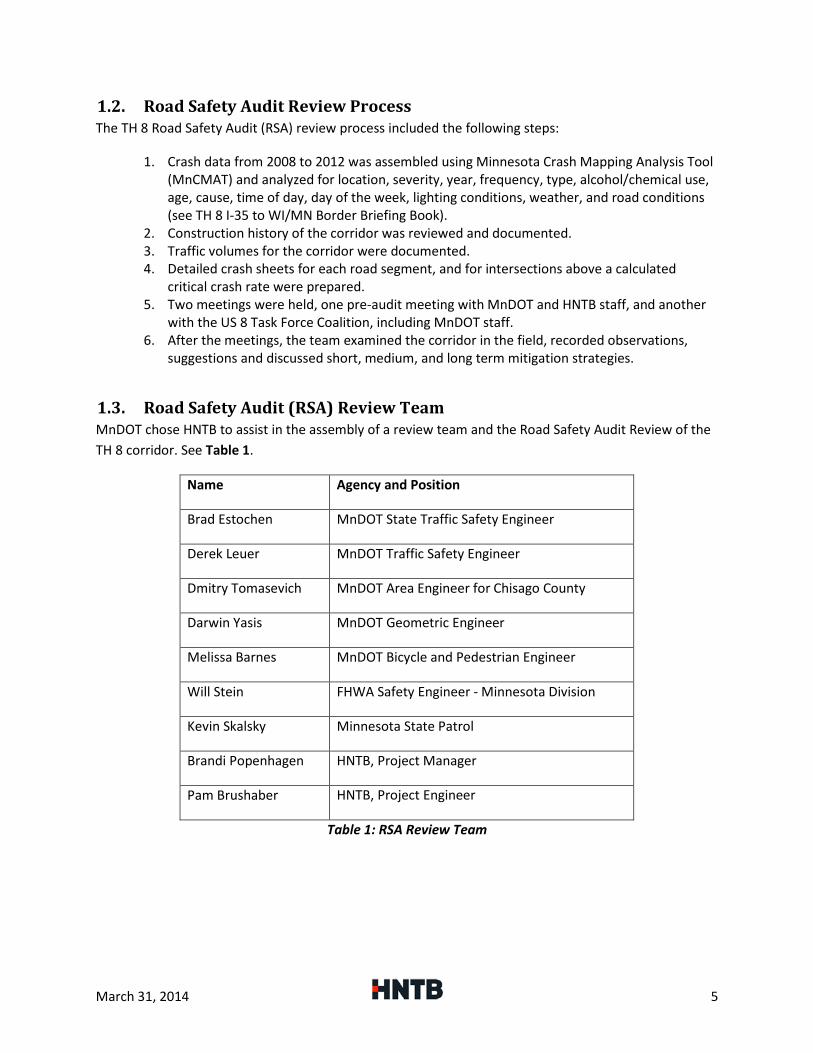
• 2012 o At CSAH 26(Pleasant Valley Road)
and TH 8 intersection right and left turn lanes and street lighting were added.
o At CSAH 21(Redwing Ave) and TH 8 intersection, just south of the City of Shafer, left turn lanes and lighting were added to improve highway access, safety and congestion.
1 MnDOT Interregional Corridor System (IRC). http://www.dot.state.mn.us/planning/program/IRC.html
Figure 2: CSAH 25/TH 8 Intersection
March 31, 2014 7
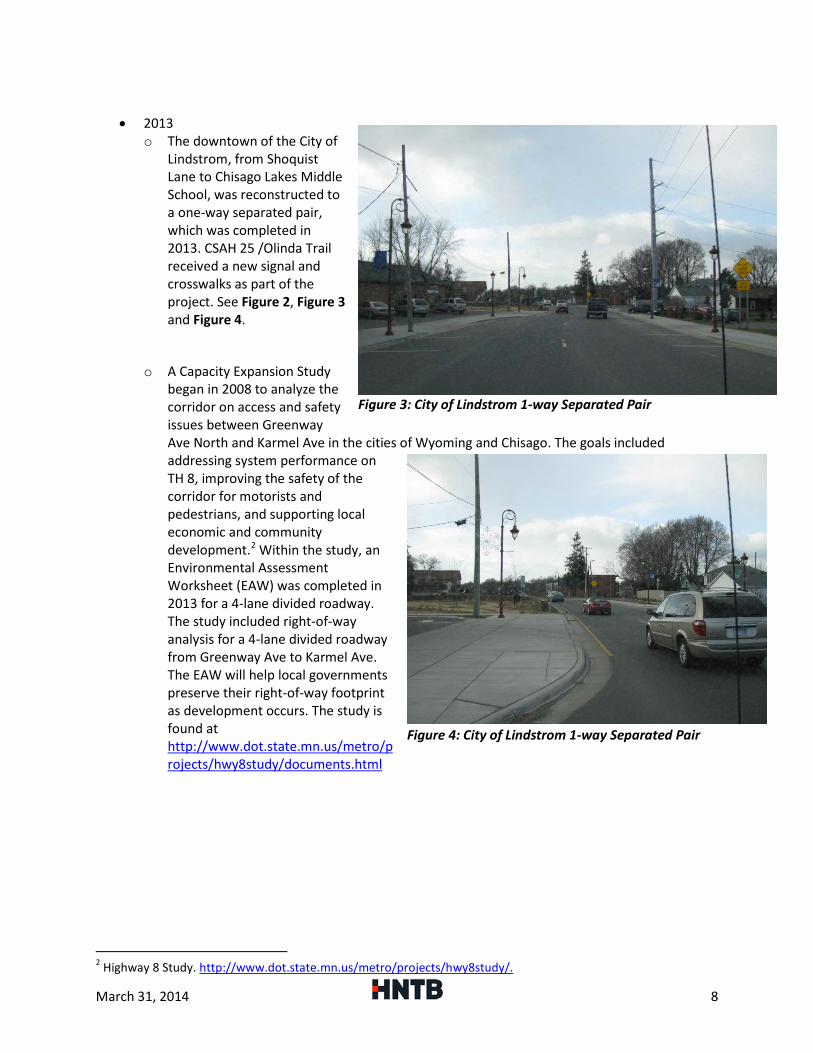
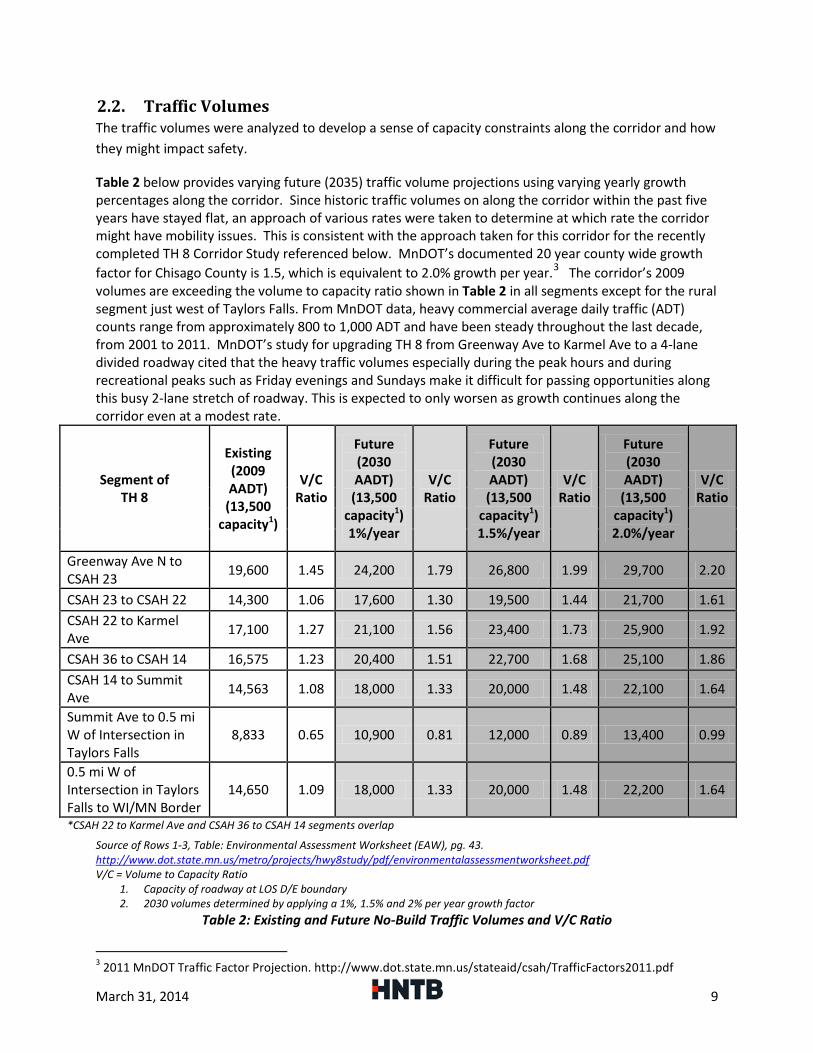
• 2013
o The downtown of the City of Lindstrom, from Shoquist Lane to Chisago Lakes Middle School, was reconstructed to a one-way separated pair, which was completed in 2013. CSAH 25 /Olinda Trail received a new signal and crosswalks as part of the project. See Figure 2, Figure 3 and Figure 4.
o A Capacity Expansion Study began in 2008 to analyze the corridor on access and safety issues between Greenway Ave North and Karmel Ave in the cities of Wyoming and Chisago. The goals included addressing system performance on TH 8, improving the safety of the corridor for motorists and pedestrians, and supporting local economic and community development.2 Within the study, an Environmental Assessment Worksheet (EAW) was completed in 2013 for a 4-lane divided roadway. The study included right-of-way analysis for a 4-lane divided roadway from Greenway Ave to Karmel Ave. The EAW will help local governments preserve their right-of-way footprint as development occurs. The study is found at http://www.dot.state.mn.us/metro/projects/hwy8study/documents.html
2 Highway 8 Study. http://www.dot.state.mn.us/metro/projects/hwy8study/.
Figure 3: City of Lindstrom 1-way Separated Pair
Figure 4: City of Lindstrom 1-way Separated Pair
March 31, 2014 8
2.2. Traffic Volumes The traffic volumes were analyzed to develop a sense of capacity constraints along the corridor and how they might impact safety.
Table 2 below provides varying future (2035) traffic volume projections using varying yearly growth percentages along the corridor. Since historic traffic volumes on along the corridor within the past five years have stayed flat, an approach of various rates were taken to determine at which rate the corridor might have mobility issues. This is consistent with the approach taken for this corridor for the recently completed TH 8 Corridor Study referenced below. MnDOT’s documented 20 year county wide growth factor for Chisago County is 1.5, which is equivalent to 2.0% growth per year.3 The corridor’s 2009 volumes are exceeding the volume to capacity ratio shown in Table 2 in all segments except for the rural segment just west of Taylors Falls. From MnDOT data, heavy commercial average daily traffic (ADT) counts range from approximately 800 to 1,000 ADT and have been steady throughout the last decade, from 2001 to 2011. MnDOT’s study for upgrading TH 8 from Greenway Ave to Karmel Ave to a 4-lane divided roadway cited that the heavy traffic volumes especially during the peak hours and during recreational peaks such as Friday evenings and Sundays make it difficult for passing opportunities along this busy 2-lane stretch of roadway. This is expected to only worsen as growth continues along the corridor even at a modest rate.
Segment of TH 8
Existing (2009 AADT)
(13,500 capacity1)
V/C Ratio
Future (2030 AADT) (13,500
capacity1) 1%/year
V/C Ratio
Future (2030 AADT) (13,500
capacity1) 1.5%/year
V/C Ratio
Future (2030 AADT)
(13,500 capacity1) 2.0%/year
V/C Ratio
Greenway Ave N to CSAH 23 19,600 1.45 24,200 1.79 26,800 1.99 29,700 2.20
CSAH 23 to CSAH 22 14,300 1.06 17,600 1.30 19,500 1.44 21,700 1.61 CSAH 22 to Karmel Ave 17,100 1.27 21,100 1.56 23,400 1.73 25,900 1.92
CSAH 36 to CSAH 14 16,575 1.23 20,400 1.51 22,700 1.68 25,100 1.86 CSAH 14 to Summit Ave 14,563 1.08 18,000 1.33 20,000 1.48 22,100 1.64
Summit Ave to 0.5 mi W of Intersection in Taylors Falls
8,833 0.65 10,900 0.81 12,000 0.89 13,400 0.99
0.5 mi W of Intersection in Taylors Falls to WI/MN Border
14,650 1.09 18,000 1.33 20,000 1.48 22,200 1.64
*CSAH 22 to Karmel Ave and CSAH 36 to CSAH 14 segments overlap
Source of Rows 1-3, Table: Environmental Assessment Worksheet (EAW), pg. 43. http://www.dot.state.mn.us/metro/projects/hwy8study/pdf/environmentalassessmentworksheet.pdf V/C = Volume to Capacity Ratio
1. Capacity of roadway at LOS D/E boundary 2. 2030 volumes determined by applying a 1%, 1.5% and 2% per year growth factor
Table 2: Existing and Future No-Build Traffic Volumes and V/C Ratio
3 2011 MnDOT Traffic Factor Projection. http://www.dot.state.mn.us/stateaid/csah/TrafficFactors2011.pdf
March 31, 2014 9
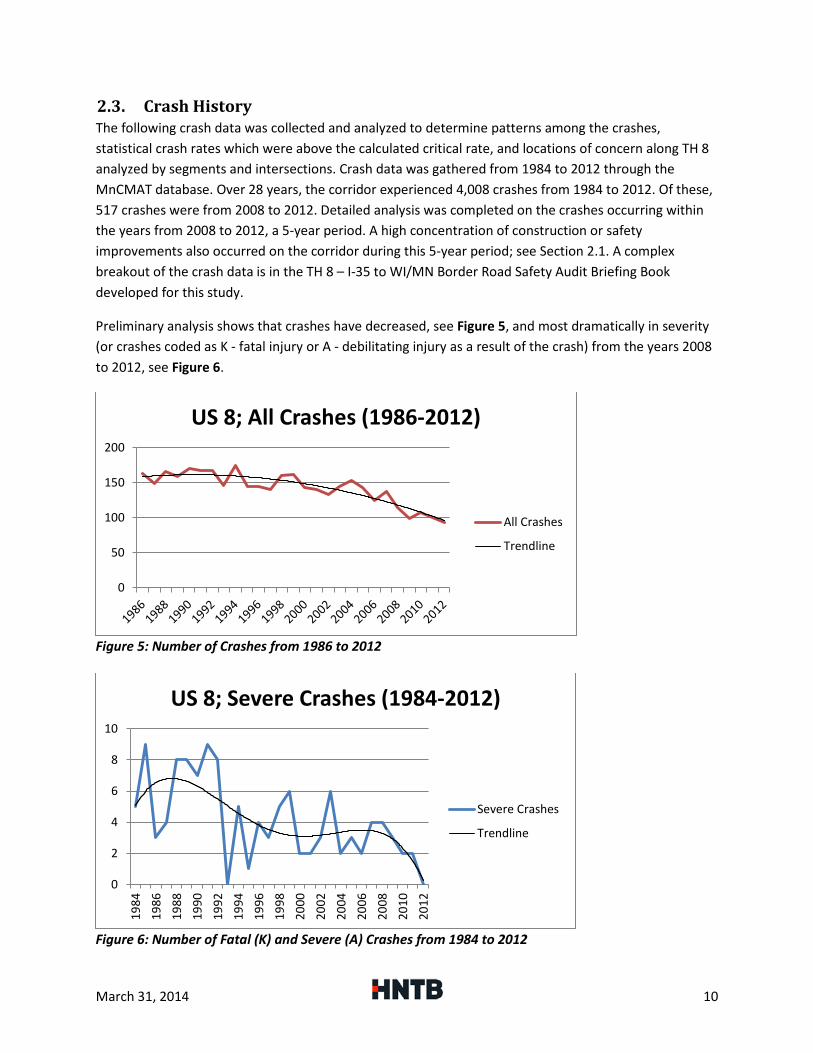
2.3. Crash History The following crash data was collected and analyzed to determine patterns among the crashes, statistical crash rates which were above the calculated critical rate, and locations of concern along TH 8 analyzed by segments and intersections. Crash data was gathered from 1984 to 2012 through the MnCMAT database. Over 28 years, the corridor experienced 4,008 crashes from 1984 to 2012. Of these, 517 crashes were from 2008 to 2012. Detailed analysis was completed on the crashes occurring within the years from 2008 to 2012, a 5-year period. A high concentration of construction or safety improvements also occurred on the corridor during this 5-year period; see Section 2.1. A complex breakout of the crash data is in the TH 8 – I-35 to WI/MN Border Road Safety Audit Briefing Book developed for this study.
Preliminary analysis shows that crashes have decreased, see Figure 5, and most dramatically in severity (or crashes coded as K - fatal injury or A - debilitating injury as a result of the crash) from the years 2008 to 2012, see Figure 6.
Figure 5: Number of Crashes from 1986 to 2012
Figure 6: Number of Fatal (K) and Severe (A) Crashes from 1984 to 2012
0
50
100
150
200
US 8; All Crashes (1986-2012)
All Crashes
Trendline
0
2
4
6
8
10
1984
1986
1988
1990
1992
1994
1996
1998
2000
2002
2004
2006
2008
2010
2012
US 8; Severe Crashes (1984-2012)
Severe Crashes
Trendline
March 31, 2014 10
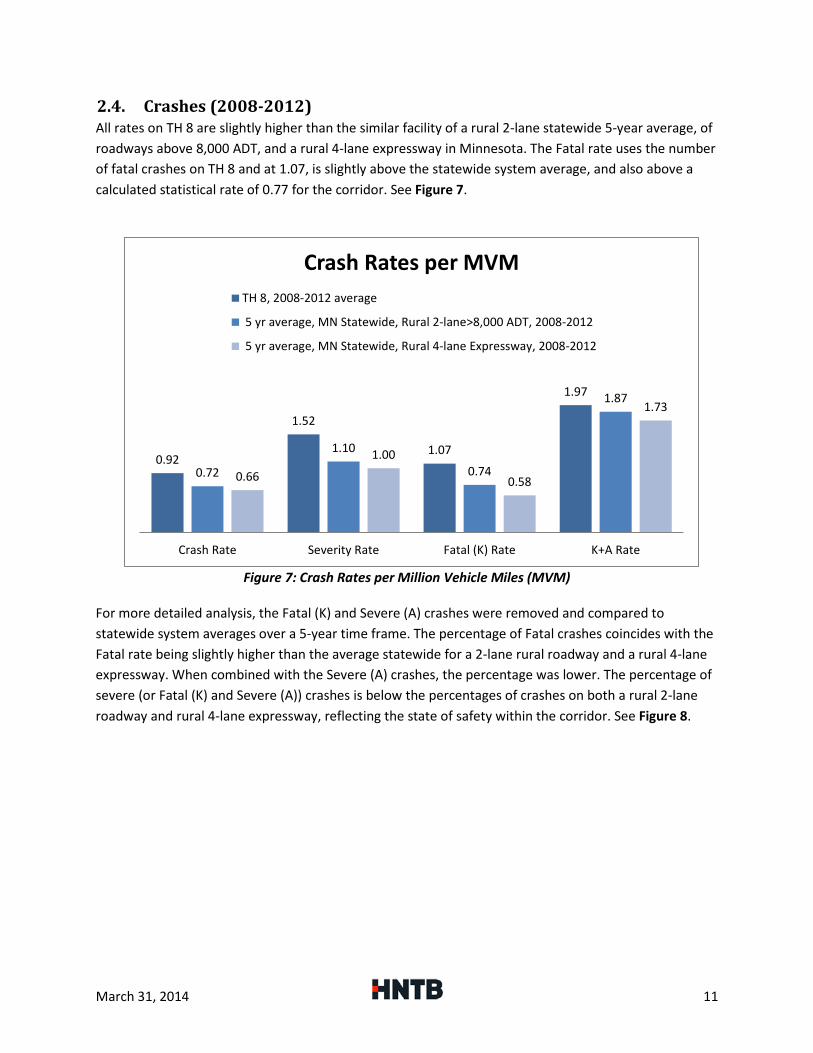
2.4. Crashes (2008-2012) All rates on TH 8 are slightly higher than the similar facility of a rural 2-lane statewide 5-year average, of roadways above 8,000 ADT, and a rural 4-lane expressway in Minnesota. The Fatal rate uses the number of fatal crashes on TH 8 and at 1.07, is slightly above the statewide system average, and also above a calculated statistical rate of 0.77 for the corridor. See Figure 7.
Figure 7: Crash Rates per Million Vehicle Miles (MVM) For more detailed analysis, the Fatal (K) and Severe (A) crashes were removed and compared to statewide system averages over a 5-year time frame. The percentage of Fatal crashes coincides with the Fatal rate being slightly higher than the average statewide for a 2-lane rural roadway and a rural 4-lane expressway. When combined with the Severe (A) crashes, the percentage was lower. The percentage of severe (or Fatal (K) and Severe (A)) crashes is below the percentages of crashes on both a rural 2-lane roadway and rural 4-lane expressway, reflecting the state of safety within the corridor. See Figure 8.
0.92
1.52
1.07
1.97
0.72
1.10
0.74
1.87
0.66
1.00
0.58
1.73
Crash Rate Severity Rate Fatal (K) Rate K+A Rate
Crash Rates per MVM TH 8, 2008-2012 average
5 yr average, MN Statewide, Rural 2-lane>8,000 ADT, 2008-2012
5 yr average, MN Statewide, Rural 4-lane Expressway, 2008-2012
March 31, 2014 11
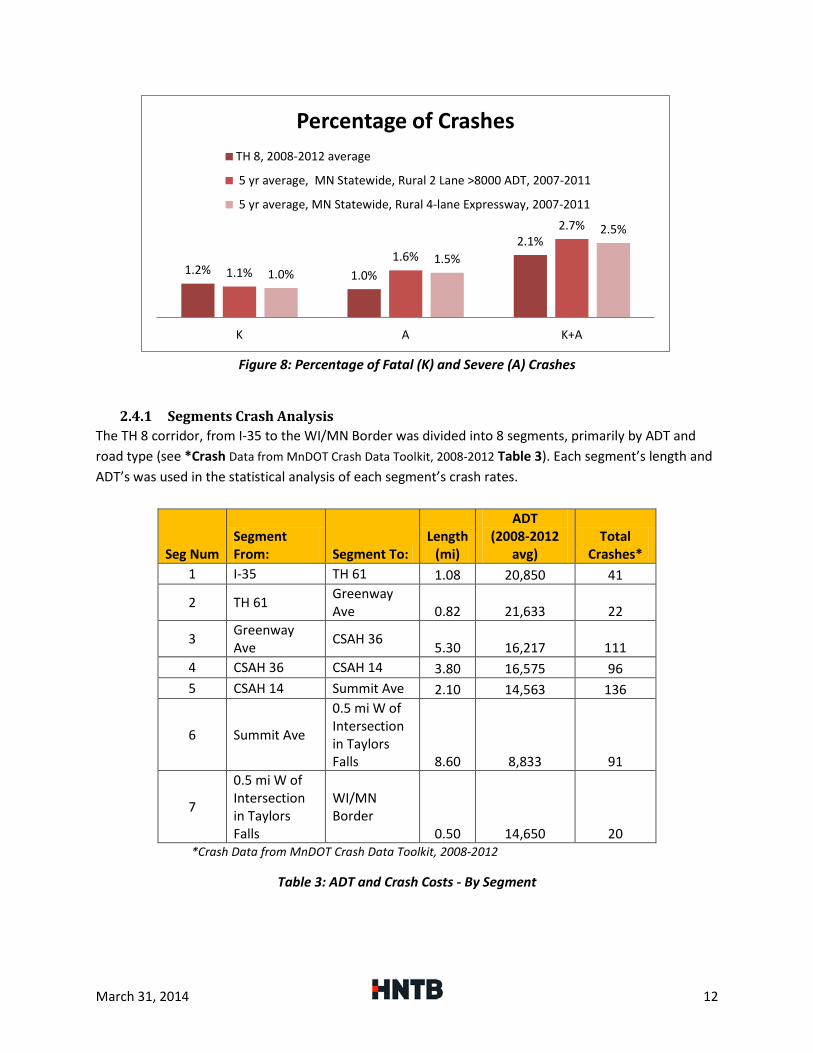
Figure 8: Percentage of Fatal (K) and Severe (A) Crashes
2.4.1 Segments Crash Analysis The TH 8 corridor, from I-35 to the WI/MN Border was divided into 8 segments, primarily by ADT and road type (see *Crash Data from MnDOT Crash Data Toolkit, 2008-2012 Table 3). Each segment’s length and ADT’s was used in the statistical analysis of each segment’s crash rates.
Seg Num Segment From: Segment To:
Length (mi)
ADT (2008-2012
avg) Total
Crashes* 1 I-35 TH 61 1.08 20,850 41
2 TH 61 Greenway Ave 0.82 21,633 22
3 Greenway Ave CSAH 36 5.30 16,217 111
4 CSAH 36 CSAH 14 3.80 16,575 96 5 CSAH 14 Summit Ave 2.10 14,563 136
6 Summit Ave
0.5 mi W of Intersection in Taylors Falls 8.60 8,833 91
7
0.5 mi W of Intersection in Taylors Falls
WI/MN Border
0.50 14,650 20 *Crash Data from MnDOT Crash Data Toolkit, 2008-2012
Table 3: ADT and Crash Costs - By Segment
1.2% 1.0%
2.1%
1.1% 1.6%
2.7%
1.0% 1.5%
2.5%
K A K+A
Percentage of Crashes TH 8, 2008-2012 average
5 yr average, MN Statewide, Rural 2 Lane >8000 ADT, 2007-2011
5 yr average, MN Statewide, Rural 4-lane Expressway, 2007-2011
March 31, 2014 12
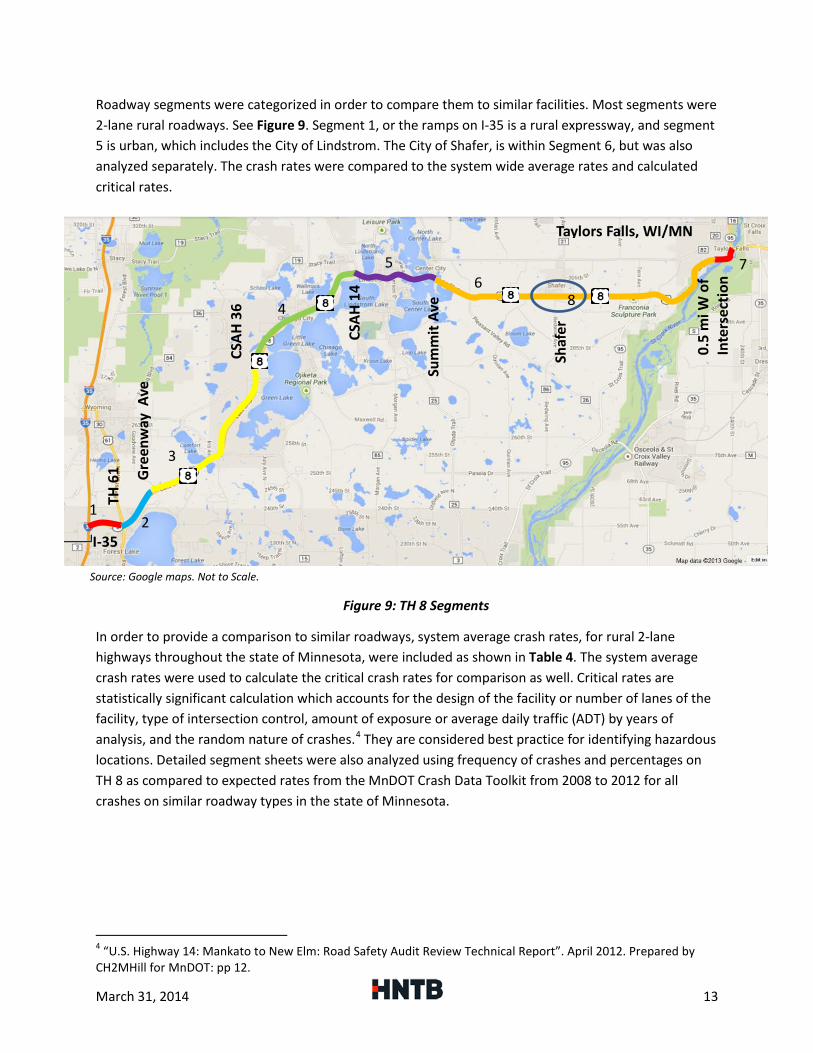
Roadway segments were categorized in order to compare them to similar facilities. Most segments were 2-lane rural roadways. See Figure 9. Segment 1, or the ramps on I-35 is a rural expressway, and segment 5 is urban, which includes the City of Lindstrom. The City of Shafer, is within Segment 6, but was also analyzed separately. The crash rates were compared to the system wide average rates and calculated critical rates.
In order to provide a comparison to similar roadways, system average crash rates, for rural 2-lane highways throughout the state of Minnesota, were included as shown in Table 4. The system average crash rates were used to calculate the critical crash rates for comparison as well. Critical rates are statistically significant calculation which accounts for the design of the facility or number of lanes of the facility, type of intersection control, amount of exposure or average daily traffic (ADT) by years of analysis, and the random nature of crashes.4 They are considered best practice for identifying hazardous locations. Detailed segment sheets were also analyzed using frequency of crashes and percentages on TH 8 as compared to expected rates from the MnDOT Crash Data Toolkit from 2008 to 2012 for all crashes on similar roadway types in the state of Minnesota.
4 “U.S. Highway 14: Mankato to New Elm: Road Safety Audit Review Technical Report”. April 2012. Prepared by CH2MHill for MnDOT: pp 12.
Taylors Falls, WI/MN
Gre
enw
ay A
ve
CSAH
36
CSAH
14
Sum
mit
Ave
0.5
mi W
of
Inte
rsec
tion
TH 6
1
Shaf
er
1 2
3
4
5 6
7
I-35
8
Source: Google maps. Not to Scale.
Figure 9: TH 8 Segments
March 31, 2014 13
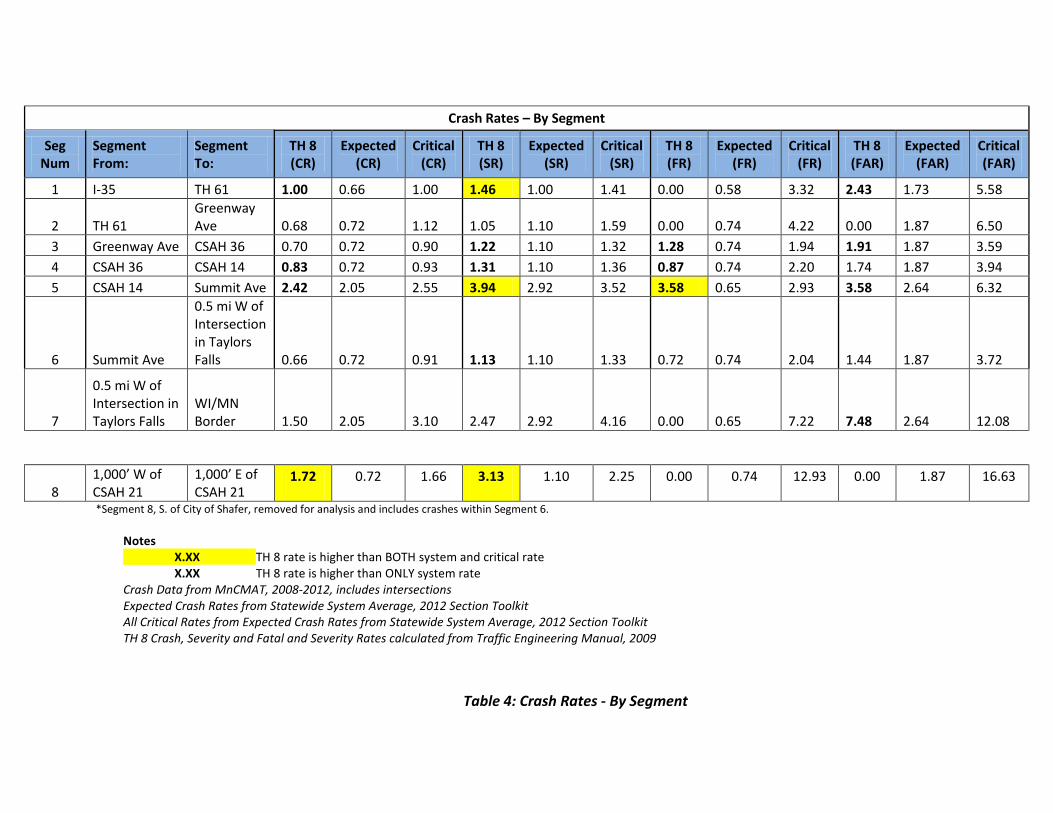
*Segment 8, S. of City of Shafer, removed for analysis and includes crashes within Segment 6. Notes X.XX TH 8 rate is higher than BOTH system and critical rate X.XX TH 8 rate is higher than ONLY system rate Crash Data from MnCMAT, 2008-2012, includes intersections Expected Crash Rates from Statewide System Average, 2012 Section Toolkit All Critical Rates from Expected Crash Rates from Statewide System Average, 2012 Section Toolkit TH 8 Crash, Severity and Fatal and Severity Rates calculated from Traffic Engineering Manual, 2009
Crash Rates – By Segment
Seg Num
Segment From:
Segment To:
TH 8 (CR)
Expected (CR)
Critical (CR)
TH 8 (SR)
Expected (SR)
Critical (SR)
TH 8 (FR)
Expected (FR)
Critical (FR)
TH 8 (FAR)
Expected (FAR)
Critical (FAR)
1 I-35 TH 61 1.00 0.66 1.00 1.46 1.00 1.41 0.00 0.58 3.32 2.43 1.73 5.58
2 TH 61 Greenway Ave 0.68 0.72 1.12 1.05 1.10 1.59 0.00 0.74 4.22 0.00 1.87 6.50
3 Greenway Ave CSAH 36 0.70 0.72 0.90 1.22 1.10 1.32 1.28 0.74 1.94 1.91 1.87 3.59 4 CSAH 36 CSAH 14 0.83 0.72 0.93 1.31 1.10 1.36 0.87 0.74 2.20 1.74 1.87 3.94 5 CSAH 14 Summit Ave 2.42 2.05 2.55 3.94 2.92 3.52 3.58 0.65 2.93 3.58 2.64 6.32
6 Summit Ave
0.5 mi W of Intersection in Taylors Falls 0.66 0.72 0.91 1.13 1.10 1.33 0.72 0.74 2.04 1.44 1.87 3.72
7
0.5 mi W of Intersection in Taylors Falls
WI/MN Border 1.50 2.05 3.10 2.47 2.92 4.16 0.00 0.65 7.22 7.48 2.64 12.08
8 1,000’ W of CSAH 21
1,000’ E of CSAH 21
1.72 0.72 1.66 3.13 1.10 2.25 0.00 0.74 12.93 0.00 1.87 16.63
Table 4: Crash Rates - By Segment
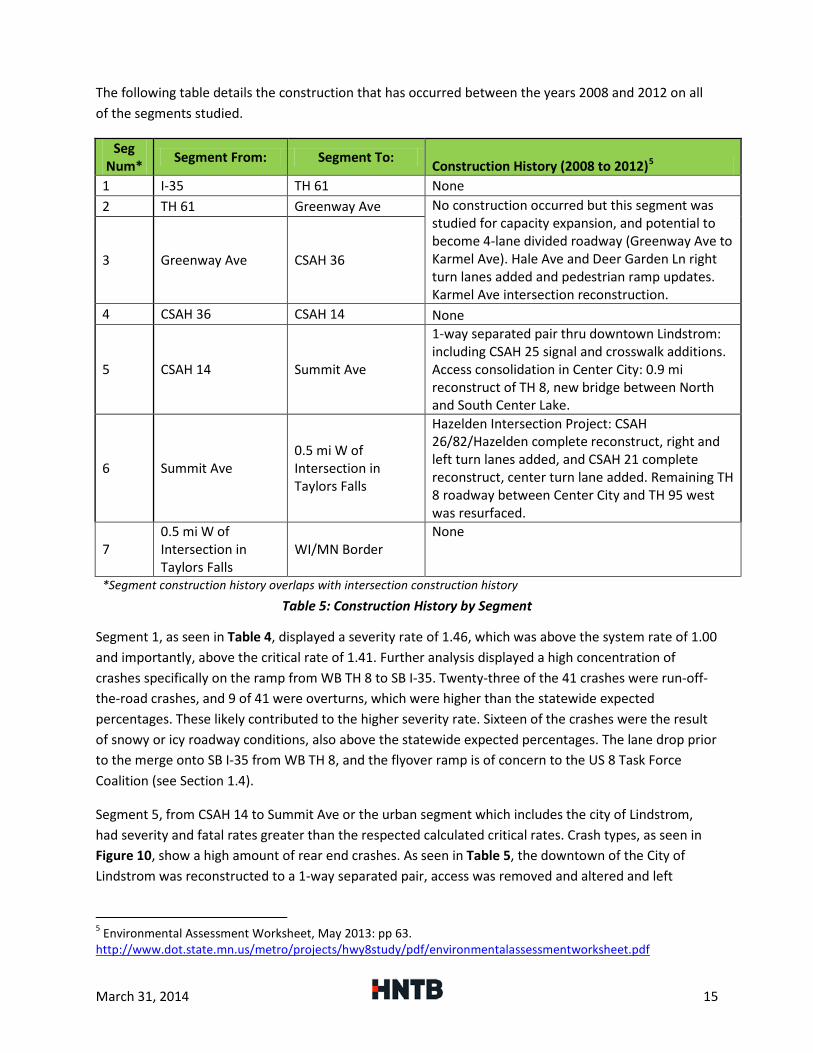
The following table details the construction that has occurred between the years 2008 and 2012 on all of the segments studied.
Seg Num* Segment From: Segment To: Construction History (2008 to 2012)5
1 I-35 TH 61 None 2 TH 61 Greenway Ave No construction occurred but this segment was
studied for capacity expansion, and potential to become 4-lane divided roadway (Greenway Ave to Karmel Ave). Hale Ave and Deer Garden Ln right turn lanes added and pedestrian ramp updates. Karmel Ave intersection reconstruction.
3 Greenway Ave CSAH 36
4 CSAH 36 CSAH 14 None
5 CSAH 14 Summit Ave
1-way separated pair thru downtown Lindstrom: including CSAH 25 signal and crosswalk additions. Access consolidation in Center City: 0.9 mi reconstruct of TH 8, new bridge between North and South Center Lake.
6 Summit Ave 0.5 mi W of Intersection in Taylors Falls
Hazelden Intersection Project: CSAH 26/82/Hazelden complete reconstruct, right and left turn lanes added, and CSAH 21 complete reconstruct, center turn lane added. Remaining TH 8 roadway between Center City and TH 95 west was resurfaced.
7 0.5 mi W of Intersection in Taylors Falls
WI/MN Border None
*Segment construction history overlaps with intersection construction history
Table 5: Construction History by Segment
Segment 1, as seen in Table 4, displayed a severity rate of 1.46, which was above the system rate of 1.00 and importantly, above the critical rate of 1.41. Further analysis displayed a high concentration of crashes specifically on the ramp from WB TH 8 to SB I-35. Twenty-three of the 41 crashes were run-off-the-road crashes, and 9 of 41 were overturns, which were higher than the statewide expected percentages. These likely contributed to the higher severity rate. Sixteen of the crashes were the result of snowy or icy roadway conditions, also above the statewide expected percentages. The lane drop prior to the merge onto SB I-35 from WB TH 8, and the flyover ramp is of concern to the US 8 Task Force Coalition (see Section 1.4).
Segment 5, from CSAH 14 to Summit Ave or the urban segment which includes the city of Lindstrom, had severity and fatal rates greater than the respected calculated critical rates. Crash types, as seen in Figure 10, show a high amount of rear end crashes. As seen in Table 5, the downtown of the City of Lindstrom was reconstructed to a 1-way separated pair, access was removed and altered and left
5 Environmental Assessment Worksheet, May 2013: pp 63. http://www.dot.state.mn.us/metro/projects/hwy8study/pdf/environmentalassessmentworksheet.pdf
March 31, 2014 15
turning conflict points were eliminated in 2013. The crash data is not current enough to determine if a safety problem continues to exist.
The City of Shafer (segment 8) was isolated for segment analysis, and includes two intersections of Redfield Blvd and CSAH 21 with TH 8, just south of Shafer. The crashes are also included in Segment 6. See Table 4. The crash and severity rates are higher than the critical rates, the crash rate at 1.72 as compared to 1.66, and the severity rate 3.13 as compared to 2.25. Segment 8 experienced 4 type B and 1 type C (or injury) crashes. From Table 5, center turn lanes were added at CSAH 21 and TH 8 in this location, which could decrease the rates in the future.
Segment 7, or Summit Ave to 0.5 miles west of the intersection of TH 95 and TH 8 in Taylors Falls, experienced 14 out of 91 right angle crashes, or 15% compared to the statewide expected of 8%. Right angles usually result in more severe injuries. This segment also saw the most amount of illegal or unsafe speed crashes (8 out of 91) and alcohol/chemical use crashes (9 out of 91) of any segment in the corridor, although the rates did not exceed the critical rate.
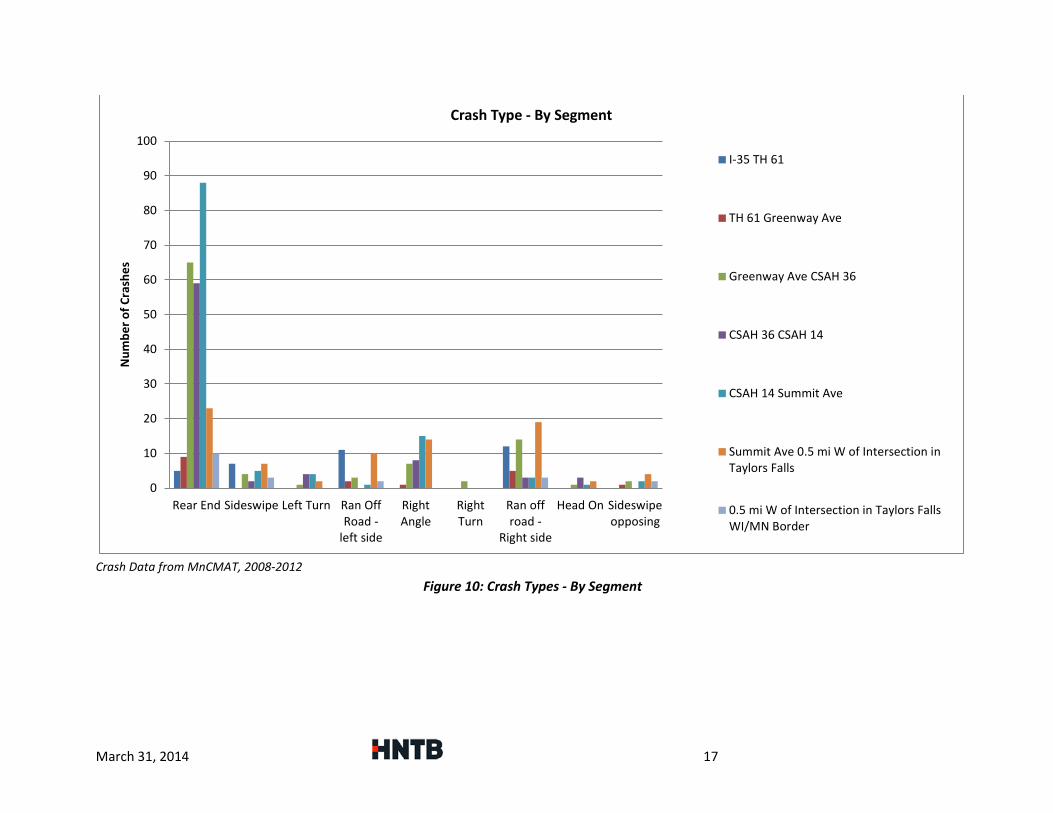
Analyzing all segments in detail, driver inattention was a factor in crashes, with the percentages of these types of crashes normally at or exceeding the expected statewide percentages. Figure 10 below displays crash types by segment and the number of crashes, with rear ends being a primary crash type experienced along the corridor.
March 31, 2014 16
Crash Data from MnCMAT, 2008-2012
Figure 10: Crash Types - By Segment
0
10
20
30
40
50
60
70
80
90
100
Rear End Sideswipe Left Turn Ran OffRoad -
left side
RightAngle
RightTurn
Ran offroad -
Right side
Head On Sideswipeopposing
Num
ber o
f Cra
shes
Crash Type - By Segment
I-35 TH 61
TH 61 Greenway Ave
Greenway Ave CSAH 36
CSAH 36 CSAH 14
CSAH 14 Summit Ave
Summit Ave 0.5 mi W of Intersection inTaylors Falls
0.5 mi W of Intersection in Taylors FallsWI/MN Border
March 31, 2014 17
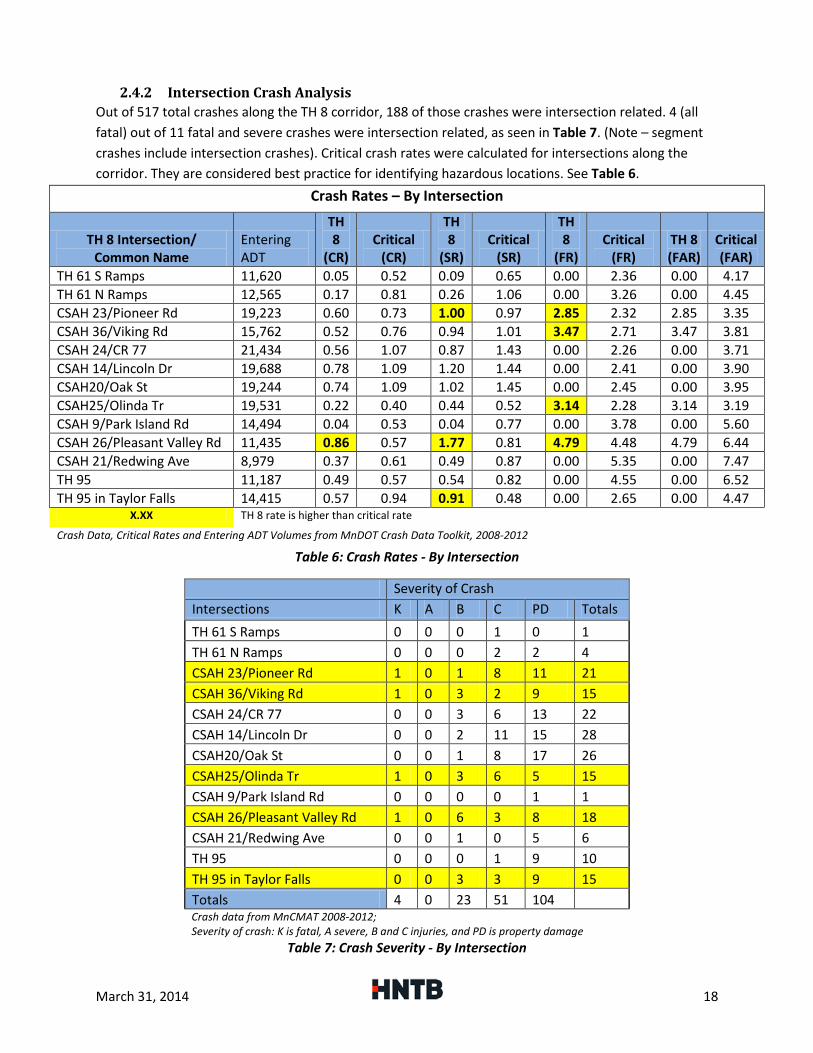
2.4.2 Intersection Crash Analysis Out of 517 total crashes along the TH 8 corridor, 188 of those crashes were intersection related. 4 (all fatal) out of 11 fatal and severe crashes were intersection related, as seen in Table 7. (Note – segment crashes include intersection crashes). Critical crash rates were calculated for intersections along the corridor. They are considered best practice for identifying hazardous locations. See Table 6.
Crash Rates – By Intersection
TH 8 Intersection/ Common Name
Entering ADT
TH 8
(CR) Critical
(CR)
TH 8
(SR) Critical
(SR)
TH 8
(FR) Critical
(FR) TH 8 (FAR)
Critical (FAR)
TH 61 S Ramps 11,620 0.05 0.52 0.09 0.65 0.00 2.36 0.00 4.17 TH 61 N Ramps 12,565 0.17 0.81 0.26 1.06 0.00 3.26 0.00 4.45 CSAH 23/Pioneer Rd 19,223 0.60 0.73 1.00 0.97 2.85 2.32 2.85 3.35 CSAH 36/Viking Rd 15,762 0.52 0.76 0.94 1.01 3.47 2.71 3.47 3.81 CSAH 24/CR 77 21,434 0.56 1.07 0.87 1.43 0.00 2.26 0.00 3.71 CSAH 14/Lincoln Dr 19,688 0.78 1.09 1.20 1.44 0.00 2.41 0.00 3.90 CSAH20/Oak St 19,244 0.74 1.09 1.02 1.45 0.00 2.45 0.00 3.95 CSAH25/Olinda Tr 19,531 0.22 0.40 0.44 0.52 3.14 2.28 3.14 3.19 CSAH 9/Park Island Rd 14,494 0.04 0.53 0.04 0.77 0.00 3.78 0.00 5.60 CSAH 26/Pleasant Valley Rd 11,435 0.86 0.57 1.77 0.81 4.79 4.48 4.79 6.44 CSAH 21/Redwing Ave 8,979 0.37 0.61 0.49 0.87 0.00 5.35 0.00 7.47 TH 95 11,187 0.49 0.57 0.54 0.82 0.00 4.55 0.00 6.52 TH 95 in Taylor Falls 14,415 0.57 0.94 0.91 0.48 0.00 2.65 0.00 4.47
X.XX TH 8 rate is higher than critical rate
Crash Data, Critical Rates and Entering ADT Volumes from MnDOT Crash Data Toolkit, 2008-2012
Table 6: Crash Rates - By Intersection
Severity of Crash Intersections K A B C PD Totals TH 61 S Ramps 0 0 0 1 0 1 TH 61 N Ramps 0 0 0 2 2 4 CSAH 23/Pioneer Rd 1 0 1 8 11 21 CSAH 36/Viking Rd 1 0 3 2 9 15 CSAH 24/CR 77 0 0 3 6 13 22 CSAH 14/Lincoln Dr 0 0 2 11 15 28 CSAH20/Oak St 0 0 1 8 17 26 CSAH25/Olinda Tr 1 0 3 6 5 15 CSAH 9/Park Island Rd 0 0 0 0 1 1 CSAH 26/Pleasant Valley Rd 1 0 6 3 8 18 CSAH 21/Redwing Ave 0 0 1 0 5 6 TH 95 0 0 0 1 9 10 TH 95 in Taylor Falls 0 0 3 3 9 15 Totals 4 0 23 51 104 Crash data from MnCMAT 2008-2012; Severity of crash: K is fatal, A severe, B and C injuries, and PD is property damage
Table 7: Crash Severity - By Intersection
March 31, 2014 18
The number and severity of crashes occurring in specific intersections are noted in Table 7. The intersections with rates exceeding the system rate and calculated critical rate are highlighted in yellow within Table 7 and Table 6. The following was discovered from the highlighted intersections
• CSAH 23 (Pioneer Rd)/TH 8: This four-legged signalized and lighted intersection had severity and fatal rates that exceeded statewide expected and the calculated critical rates. It had one fatality in the last five years. It experienced a higher percentage (than the statewide expected percentage) of rear end crashes, and 8 out of the 21 were C injury crashes.
• CSAH 36 (Viking Rd)/TH 8: This four -legged signalized and lighted intersection had a fatal rate that exceeded statewide expected and the calculated critical rates. It had one fatality in the last five years.
• CSAH 25 (Olinda Ave)/TH 8: This four-legged signalized and lighted intersection is within the City of Lindstrom. Its fatal rate exceeds the expected statewide and calculated critical rate. In 2013, a new signals and crosswalks for all pedestrian movements were added.
• CSAH 26 (Pleasant Valley Rd)/TH 8: This four-legged unsignalized intersection had crash, severity and fatal rates that exceeded statewide expected and the calculated critical rates. It had one fatality in the last five years. It experienced seven (out of 18) right angle crashes, a higher percentage compared to the statewide expected percentage, which most likely contributed to the higher severity rate. The US 8 Task Force Coalition identified a large amount of gravel trucks from the local quarry using the intersection. Within the five years of crash data, CSAH 26 (Pleasant Valley Road) intersection received a complete reconstruct with left and right turn lanes added to WB and EB TH 8.
• TH 95/TH 8 in Taylors Falls: This complex, four-legged intersection, with a signal and lighting. There is a state park entrance on the south side and a gas station in the NE quadrant. CSAH 20/82 intersects TH 95 at a skewed angle, approximately 100 feet prior to the intersection with TH 8. This intersection has experienced a high severity rate, above the critical severity rate, as seen in Table 6. The crashes were for a variety of factors, but 4 out of 15 crashes involved semi-trucks, and 4 of 15 crashes were in wet conditions. The majority were rear end crashes (9 out of 15).
Similar to the segment analysis, crash types by intersection show a high amount of rear end crashes, which is common for a 2-lane rural roadway. See Figure 11. The addition of turn lanes on TH 8, added to multiple intersections, is expected to decrease the number of rear end crashes. The addition of left turn lanes has a proven relationship with reducing the amount and severity of intersection crashes.6
6 “MnDOT Metro District: Highway Safety Plan”. May 2012. Prepared by CH2MHill for MnDOT. pp 56, Section 3-5.
March 31, 2014 19
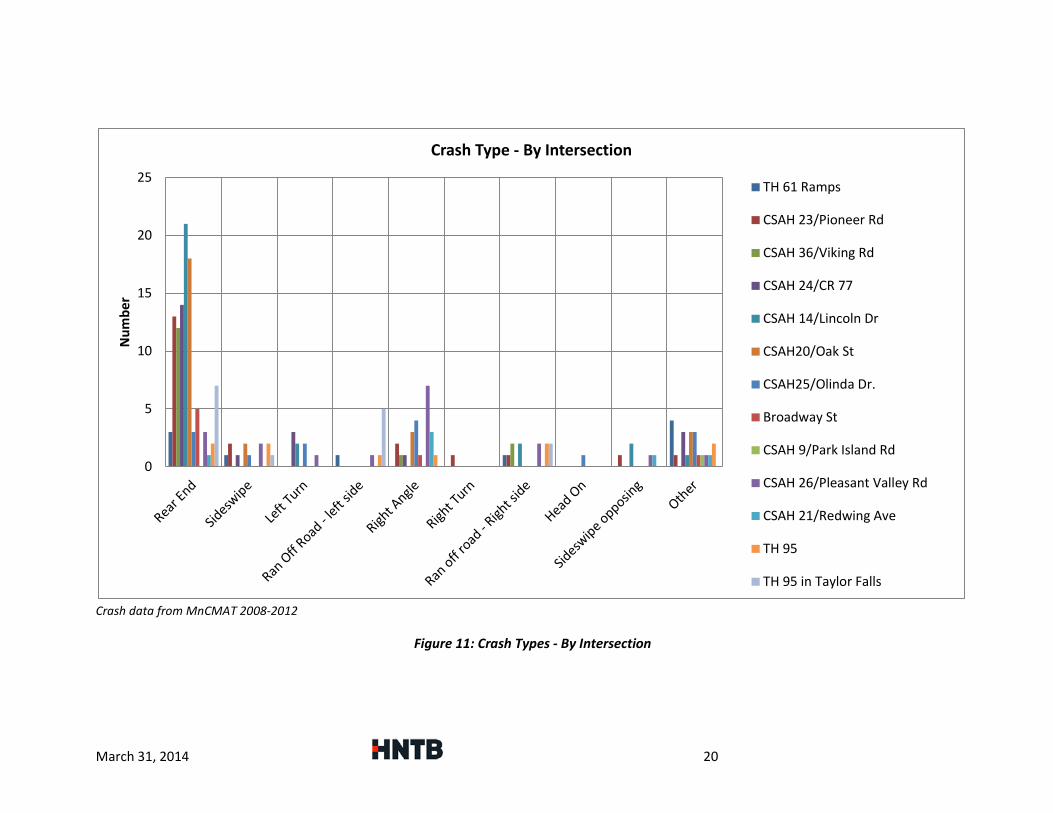
Crash data from MnCMAT 2008-2012
Figure 11: Crash Types - By Intersection
0
5
10
15
20
25
Num
ber
Crash Type - By Intersection
TH 61 Ramps
CSAH 23/Pioneer Rd
CSAH 36/Viking Rd
CSAH 24/CR 77
CSAH 14/Lincoln Dr
CSAH20/Oak St
CSAH25/Olinda Dr.
Broadway St
CSAH 9/Park Island Rd
CSAH 26/Pleasant Valley Rd
CSAH 21/Redwing Ave
TH 95
TH 95 in Taylor Falls
March 31, 2014 20
3. Field Review Observations The Road Safety Audit (RSA) Review team met Tuesday November 26th, 2013, after the TH 8 Task Force Coalition meeting and the pre-audit MnDOT Staff meeting. Recommendations were discussed, and observations noted, but not analyzed to their fullest extent during the field review. See Section 5.0, for a complete synopsis of recommendations for the corridor.
At the CSAH 23/ Pioneer Rd. and TH 8 intersection, the super elevation and clear line of sight allows drivers to easily navigate the horizontal curve at the posted speed of 55 mph as they approach and exit the intersection. However, the team did not observe any red light non-compliance and law enforcement stated this was not a high occurrence. It was noted that driving in the summer months could be more aggressive, especially on weekends. Sample recommendations from the field review included a review of the signal timing and addition of a median to assist the pedestrian crossing.
Sportsman Drive was discussed per comments that were raised in the TH 8 Task Force Coalition meeting of the desire for a signal. Development is expected in the vicinity, prompting the discussion that street lights be added, a ¾ intersection or roundabout considered and adjusting signals of other intersections. It was concluded that all options should be analyzed. It was noted that the primary motivation for the signal would be solely because of the development. It was concluded that a signal was not appropriate for the intersection from a safety standpoint.
At CSAH 36/ Johnson Ln and TH 8 intersection, a continuous green T- intersection was discussed to help with capacity. It was noted this was not primarily a safety solution. A case study was scheduled for St. Cloud next year of an intersection of this type. It could be included in the recommended access management plan for the corridor. Access to Johnson Lane would need to be addressed. Though this is a potential option, the RSA team did not recommend the option at this time.
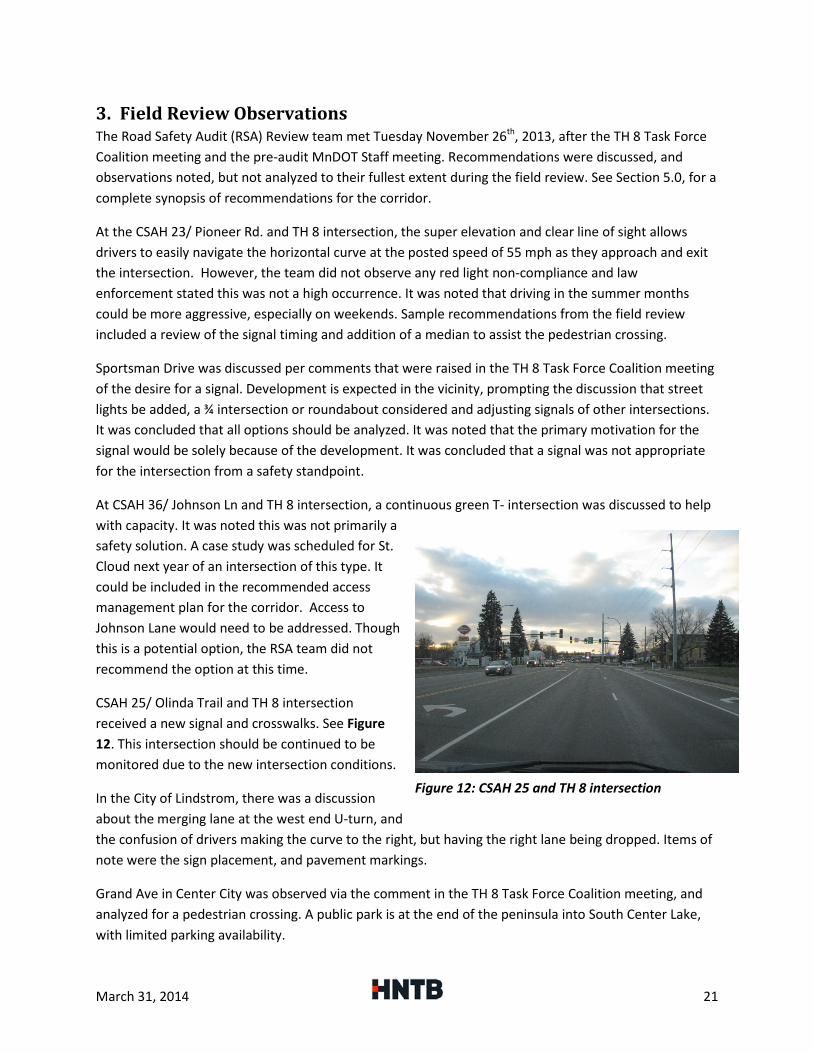
CSAH 25/ Olinda Trail and TH 8 intersection received a new signal and crosswalks. See Figure 12. This intersection should be continued to be monitored due to the new intersection conditions.
In the City of Lindstrom, there was a discussion about the merging lane at the west end U-turn, and the confusion of drivers making the curve to the right, but having the right lane being dropped. Items of note were the sign placement, and pavement markings.
Grand Ave in Center City was observed via the comment in the TH 8 Task Force Coalition meeting, and analyzed for a pedestrian crossing. A public park is at the end of the peninsula into South Center Lake, with limited parking availability.
Figure 12: CSAH 25 and TH 8 intersection
March 31, 2014 21
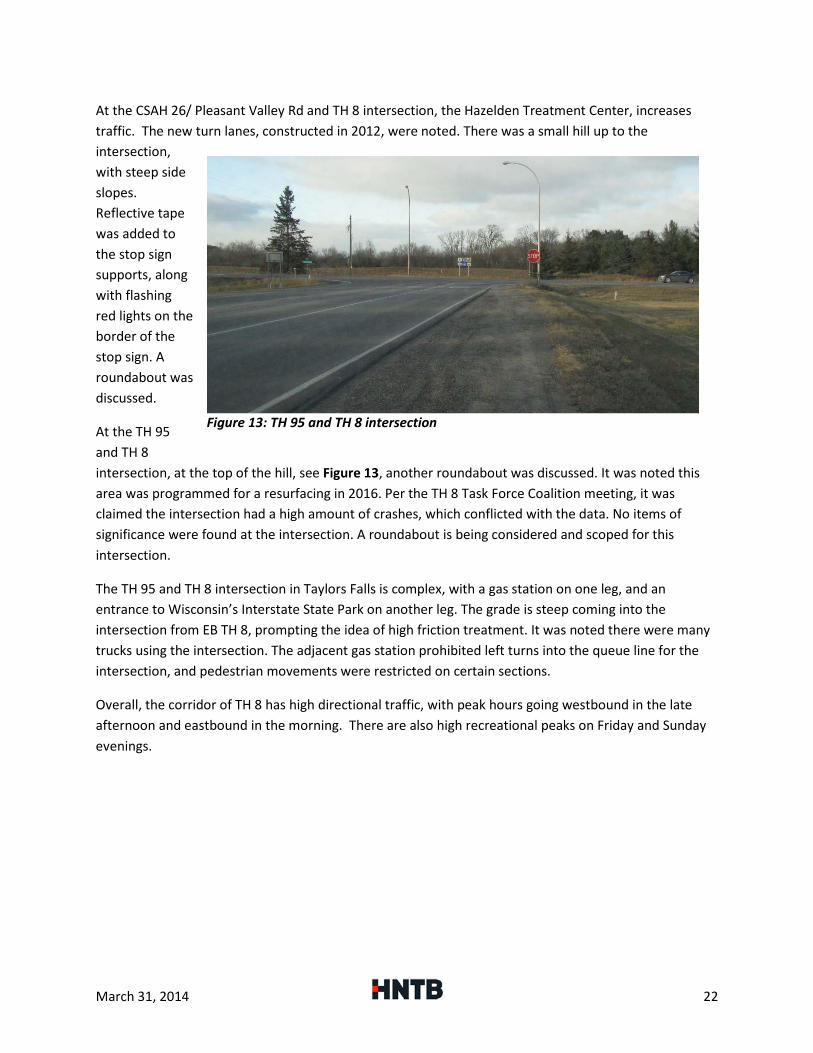
At the CSAH 26/ Pleasant Valley Rd and TH 8 intersection, the Hazelden Treatment Center, increases traffic. The new turn lanes, constructed in 2012, were noted. There was a small hill up to the intersection, with steep side slopes. Reflective tape was added to the stop sign supports, along with flashing red lights on the border of the stop sign. A roundabout was discussed.
At the TH 95 and TH 8 intersection, at the top of the hill, see Figure 13, another roundabout was discussed. It was noted this area was programmed for a resurfacing in 2016. Per the TH 8 Task Force Coalition meeting, it was claimed the intersection had a high amount of crashes, which conflicted with the data. No items of significance were found at the intersection. A roundabout is being considered and scoped for this intersection.
The TH 95 and TH 8 intersection in Taylors Falls is complex, with a gas station on one leg, and an entrance to Wisconsin’s Interstate State Park on another leg. The grade is steep coming into the intersection from EB TH 8, prompting the idea of high friction treatment. It was noted there were many trucks using the intersection. The adjacent gas station prohibited left turns into the queue line for the intersection, and pedestrian movements were restricted on certain sections.
Overall, the corridor of TH 8 has high directional traffic, with peak hours going westbound in the late afternoon and eastbound in the morning. There are also high recreational peaks on Friday and Sunday evenings.
Figure 13: TH 95 and TH 8 intersection
March 31, 2014 22
4. Potential Improvement Strategies Strategies are recommended as a countermeasure for an issue noted either in the field review, in the US 8 Task Force Coalition meeting, or from analyzing the crash diagram sheets, which recorded frequency of crashes by intersection and segment, in the field. After each recommended strategy, the safety problem or type of crashes occurring on the segment or intersection in which the problem or crashes occurred is noted. The recommended strategy or countermeasure is intended to mitigate or solve the safety problem. If the strategy is mentioned as “’proven’, the strategy has been widely implemented, subject to rigorous statistical testing, and consistent results from statistical tests. If it is ‘tried’, it has been widely implemented but either lacking the statistical testing or with inconclusive results. Finally, if it is ‘experimental’, it is too narrowly implemented to provide statistically significant results”.7
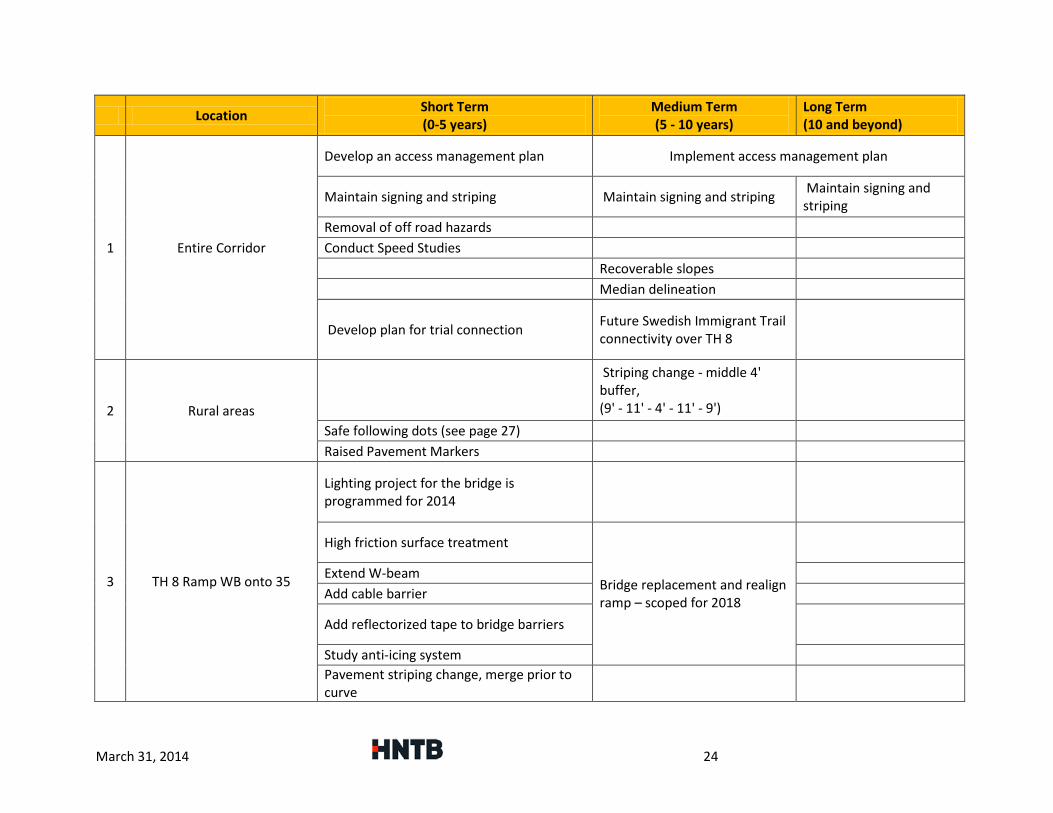
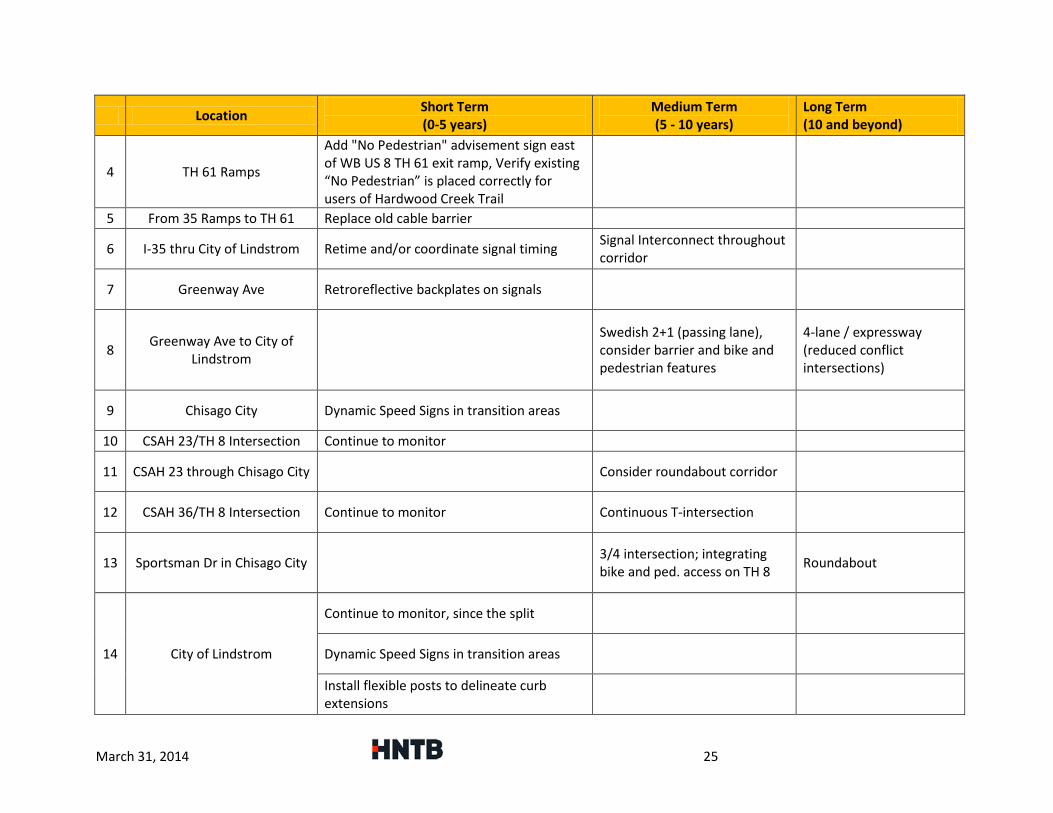
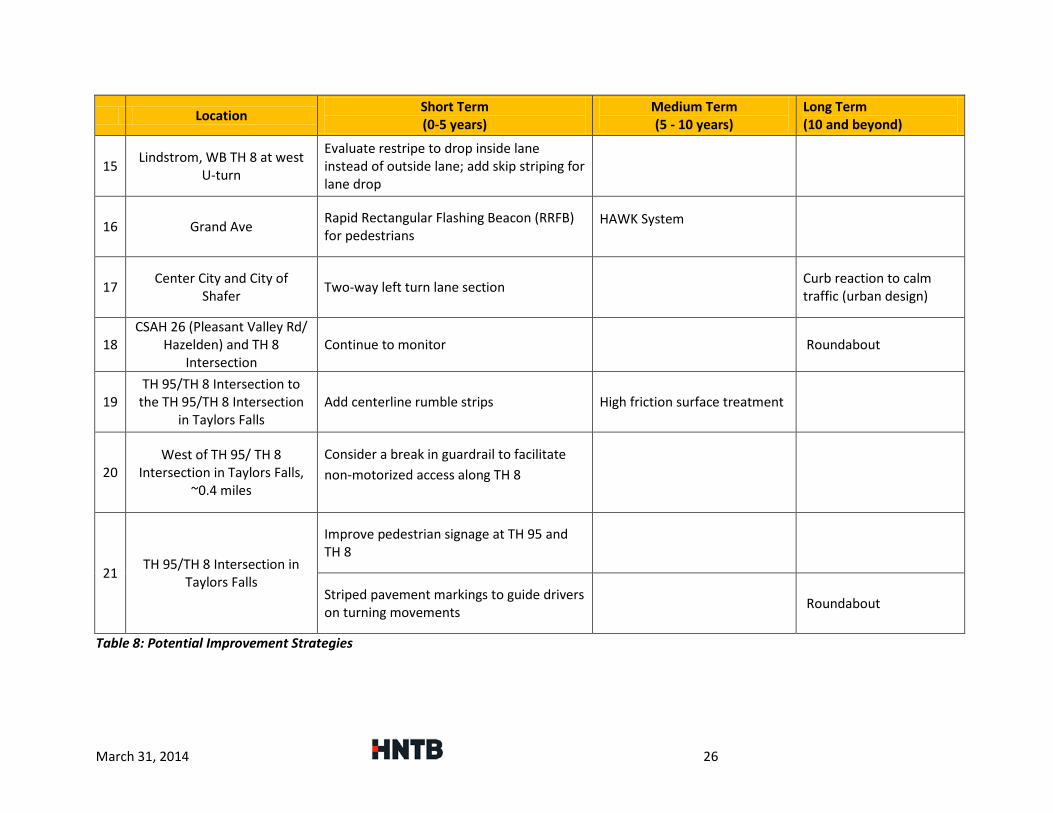
Table 8 on the following pages lists the recommendations by short, medium and long term potential improvement strategies, by location - either specific intersections, segments or the entire corridor. The short term strategies can be implemented in 0 to 5 years, and are intended to be lower cost, high benefit. The medium term strategies can be implemented in 5 to 10 years, and long term 10 years and beyond. The final section in potential improvement strategies focuses on options for behavioral alterations.
4.1. Short, Medium and Long Term Strategies It is recommended the crash data continue to be monitored by MnDOT for trends, as many improvements occurred during 2008 to 2012 on TH 8. Besides full corridor improvements, short, medium and long term strategies can be employed at specific locations along the corridor. Short term solutions are highly recommended, as they can sometimes be implemented quickly and/or at little cost. Below is a description of short term strategies that could be employed on TH 8 within 0 to 5 years, and if applicable, subsequent medium and long term strategies, or stand-alone medium or long term strategies. Reference Table 8 by number.
7 “MnDOT Metro District: Highway Safety Plan”. May 2012. Prepared by CH2MHill for MnDOT. pp 52, Section 3-1.
March 31, 2014 23
Location Short Term (0-5 years)
Medium Term (5 - 10 years)
Long Term (10 and beyond)
1 Entire Corridor
Develop an access management plan Implement access management plan
Maintain signing and striping Maintain signing and striping Maintain signing and striping
Removal of off road hazards Conduct Speed Studies Recoverable slopes Median delineation
Develop plan for trial connection Future Swedish Immigrant Trail connectivity over TH 8
2 Rural areas
Striping change - middle 4' buffer, (9' - 11' - 4' - 11' - 9')
Safe following dots (see page 27) Raised Pavement Markers
3 TH 8 Ramp WB onto 35
Lighting project for the bridge is programmed for 2014
High friction surface treatment
Bridge replacement and realign ramp – scoped for 2018
Extend W-beam Add cable barrier
Add reflectorized tape to bridge barriers
Study anti-icing system Pavement striping change, merge prior to curve
March 31, 2014 24
Location Short Term (0-5 years)
Medium Term (5 - 10 years)
Long Term (10 and beyond)
4 TH 61 Ramps
Add "No Pedestrian" advisement sign east of WB US 8 TH 61 exit ramp, Verify existing “No Pedestrian” is placed correctly for users of Hardwood Creek Trail
5 From 35 Ramps to TH 61 Replace old cable barrier
6 I-35 thru City of Lindstrom Retime and/or coordinate signal timing Signal Interconnect throughout corridor
7 Greenway Ave Retroreflective backplates on signals
8 Greenway Ave to City of Lindstrom
Swedish 2+1 (passing lane), consider barrier and bike and pedestrian features
4-lane / expressway (reduced conflict intersections)
9 Chisago City Dynamic Speed Signs in transition areas
10 CSAH 23/TH 8 Intersection Continue to monitor
11 CSAH 23 through Chisago City Consider roundabout corridor
12 CSAH 36/TH 8 Intersection Continue to monitor Continuous T-intersection
13 Sportsman Dr in Chisago City 3/4 intersection; integrating bike and ped. access on TH 8 Roundabout
14 City of Lindstrom
Continue to monitor, since the split
Dynamic Speed Signs in transition areas
Install flexible posts to delineate curb extensions
March 31, 2014 25
Location Short Term (0-5 years)
Medium Term (5 - 10 years)
Long Term (10 and beyond)
15 Lindstrom, WB TH 8 at west U-turn
Evaluate restripe to drop inside lane instead of outside lane; add skip striping for lane drop
16 Grand Ave Rapid Rectangular Flashing Beacon (RRFB) for pedestrians
HAWK System
17 Center City and City of Shafer Two-way left turn lane section Curb reaction to calm
traffic (urban design)
18 CSAH 26 (Pleasant Valley Rd/
Hazelden) and TH 8 Intersection
Continue to monitor Roundabout
19 TH 95/TH 8 Intersection to
the TH 95/TH 8 Intersection in Taylors Falls
Add centerline rumble strips High friction surface treatment
20 West of TH 95/ TH 8
Intersection in Taylors Falls, ~0.4 miles
Consider a break in guardrail to facilitate non-motorized access along TH 8
21 TH 95/TH 8 Intersection in Taylors Falls
Improve pedestrian signage at TH 95 and TH 8
Striped pavement markings to guide drivers on turning movements Roundabout
Table 8: Potential Improvement Strategies
March 31, 2014 26
1. For the entire corridor, a strong recommendation includes developing an access management
plan. An increase in access density, or access to TH 8 at intersections, driveways and other connections, increases crash rates in a statistical relationship in both urban and rural areas. Access density is the number of private and public access points per mile. Closing access, or restricting turning movements to one direction, and forcing traffic to use other routes, is an option. The Environmental Assessment Worksheet, identified a long term solution for a segment of the corridor to become a 4-lane divided roadway, which reduces head on crashes.8 A medium term solution is delineating medians for proper separation of high speed traffic and turning movements. Whether the 4-lane capacity expansion option is constructed, or another, to accommodate mobility needs and future growth, access should be mitigated or addressed in a systematic manner for the entire corridor. Per the Environmental Assessment Worksheet, (pg. 44), “one of the main deficiencies causing traffic safety problems in this corridor is the lack of access control.” The number of vehicles using the roadway in the future will increase along the corridor, therefore potentially increasing crashes, but the largest cause of traffic safety problems is lack of access control. Developing an access management plan is recommended within the next five years. This strategy is beneficial for decreasing the 188 intersection related crashes in the corridor. The plan could also address the US 8 Task Force Coalition concerns of merging issues by the Dairy Queen in downtown Lindstrom, as well as no turn lanes to accommodate the Elkton Restaurant just south of the City of Shafer. Other strategies for the entire corridor include maintaining the signing and striping in good working condition, which plays a critical role in driver awareness and compliance to the desired vehicle path. They can keep vehicles from encroaching on the wrong side of the roadway, and prevent road departure crashes. If a vehicle does accidentally venture off the roadway, it is best practice to remove unnecessary potential hazards or fixed objects the vehicle could strike. A draft list of such fixed object hazards on TH 8 has been identified by Metro District staff. A final medium term solution for the entire corridor is maintaining or re-grading slopes on driveway and/or road edges, tapering them to a more gradual slope, in order for cars accidentally exiting the roadway to recover. This is a proven safety countermeasure, and minimizes the likelihood of crashing into a fixed object or overturning if the vehicle travels off the shoulder.9 Finally, a non-motorized pathway, the Swedish Immigrant Trail, is partially complete.10 The long term vision of the trail is to run from Wyoming to Taylors Falls. A plan for trail expansion should be developed, and within the plan address future trail connectivity for bicycles and pedestrians to cross TH 8 safely.
8 Environmental Assessment Worksheet, May 2013. pp 44. http://www.dot.state.mn.us/metro/projects/hwy8study/pdf/environmentalassessmentworksheet.pdf 9 “MnDOT Metro District: Highway Safety Plan”. May 2012. Prepared by CH2MHill for MnDOT. pp 54, Section 3-3. 10 Rails to Trails Conservancy. http://www.traillink.com/project/swedish-immigrant-trail.aspx
March 31, 2014 27
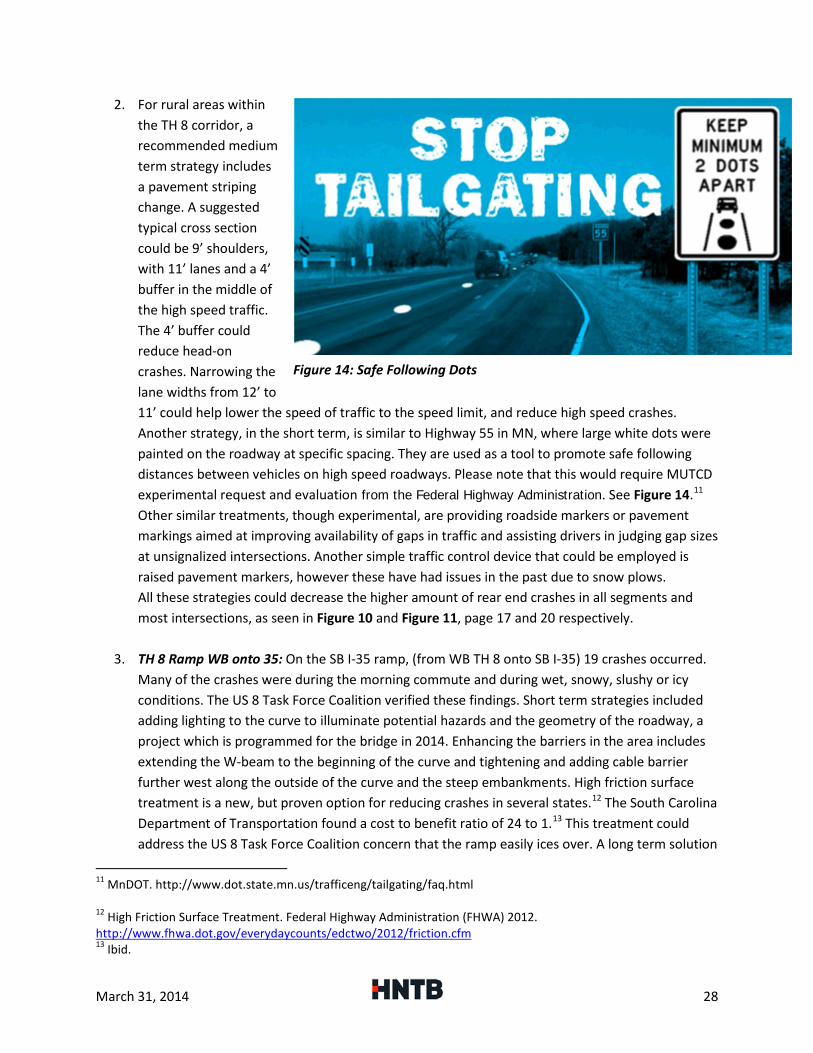
2. For rural areas within the TH 8 corridor, a recommended medium term strategy includes a pavement striping change. A suggested typical cross section could be 9’ shoulders, with 11’ lanes and a 4’ buffer in the middle of the high speed traffic. The 4’ buffer could reduce head-on crashes. Narrowing the lane widths from 12’ to 11’ could help lower the speed of traffic to the speed limit, and reduce high speed crashes. Another strategy, in the short term, is similar to Highway 55 in MN, where large white dots were painted on the roadway at specific spacing. They are used as a tool to promote safe following distances between vehicles on high speed roadways. Please note that this would require MUTCD experimental request and evaluation from the Federal Highway Administration. See Figure 14.11 Other similar treatments, though experimental, are providing roadside markers or pavement markings aimed at improving availability of gaps in traffic and assisting drivers in judging gap sizes at unsignalized intersections. Another simple traffic control device that could be employed is raised pavement markers, however these have had issues in the past due to snow plows. All these strategies could decrease the higher amount of rear end crashes in all segments and most intersections, as seen in Figure 10 and Figure 11, page 17 and 20 respectively.
3. TH 8 Ramp WB onto 35: On the SB I-35 ramp, (from WB TH 8 onto SB I-35) 19 crashes occurred. Many of the crashes were during the morning commute and during wet, snowy, slushy or icy conditions. The US 8 Task Force Coalition verified these findings. Short term strategies included adding lighting to the curve to illuminate potential hazards and the geometry of the roadway, a project which is programmed for the bridge in 2014. Enhancing the barriers in the area includes extending the W-beam to the beginning of the curve and tightening and adding cable barrier further west along the outside of the curve and the steep embankments. High friction surface treatment is a new, but proven option for reducing crashes in several states.12 The South Carolina Department of Transportation found a cost to benefit ratio of 24 to 1.13 This treatment could address the US 8 Task Force Coalition concern that the ramp easily ices over. A long term solution
11 MnDOT. http://www.dot.state.mn.us/trafficeng/tailgating/faq.html 12 High Friction Surface Treatment. Federal Highway Administration (FHWA) 2012. http://www.fhwa.dot.gov/everydaycounts/edctwo/2012/friction.cfm 13 Ibid.
Figure 14: Safe Following Dots
March 31, 2014 28
is to realign the ramp to reduce the run off the road and fixed object crashes. The bridge over I-35 is scheduled to be replaced in 2018. With the bridge replacement coming soon, all these options should be examined knowing they will have a shorter life span.
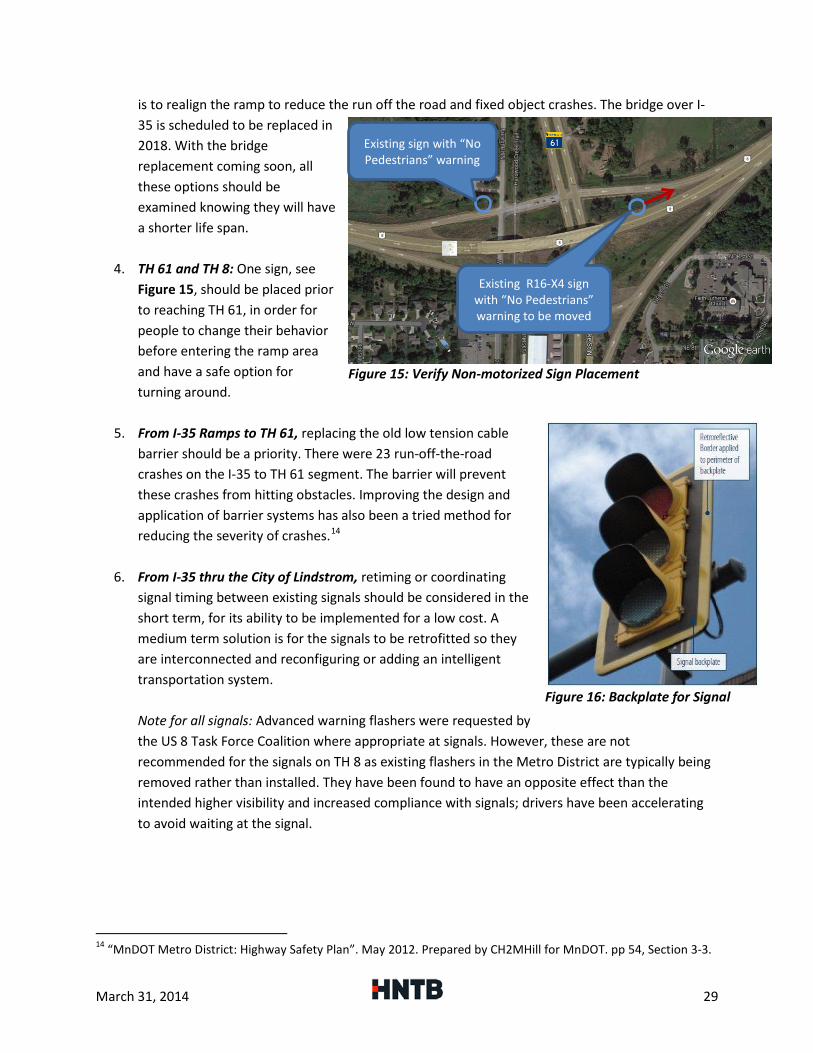
4. TH 61 and TH 8: One sign, see Figure 15, should be placed prior to reaching TH 61, in order for people to change their behavior before entering the ramp area and have a safe option for turning around.
5. From I-35 Ramps to TH 61, replacing the old low tension cable barrier should be a priority. There were 23 run-off-the-road crashes on the I-35 to TH 61 segment. The barrier will prevent these crashes from hitting obstacles. Improving the design and application of barrier systems has also been a tried method for reducing the severity of crashes.14
6. From I-35 thru the City of Lindstrom, retiming or coordinating signal timing between existing signals should be considered in the short term, for its ability to be implemented for a low cost. A medium term solution is for the signals to be retrofitted so they are interconnected and reconfiguring or adding an intelligent transportation system.
Note for all signals: Advanced warning flashers were requested by the US 8 Task Force Coalition where appropriate at signals. However, these are not recommended for the signals on TH 8 as existing flashers in the Metro District are typically being removed rather than installed. They have been found to have an opposite effect than the intended higher visibility and increased compliance with signals; drivers have been accelerating to avoid waiting at the signal.
14 “MnDOT Metro District: Highway Safety Plan”. May 2012. Prepared by CH2MHill for MnDOT. pp 54, Section 3-3.
Figure 16: Backplate for Signal
Existing sign with “No Pedestrians” warning
Existing R16-X4 sign with “No Pedestrians” warning to be moved
Figure 15: Verify Non-motorized Sign Placement
March 31, 2014 29
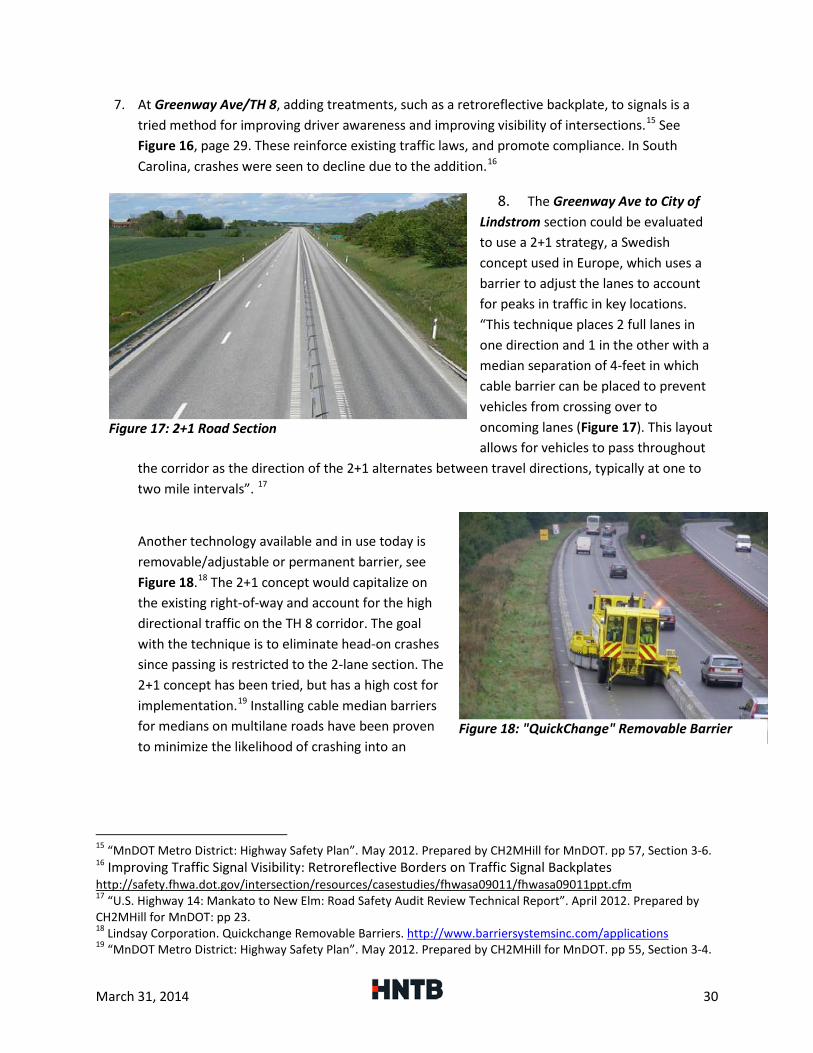
7. At Greenway Ave/TH 8, adding treatments, such as a retroreflective backplate, to signals is a tried method for improving driver awareness and improving visibility of intersections.15 See Figure 16, page 29. These reinforce existing traffic laws, and promote compliance. In South Carolina, crashes were seen to decline due to the addition.16
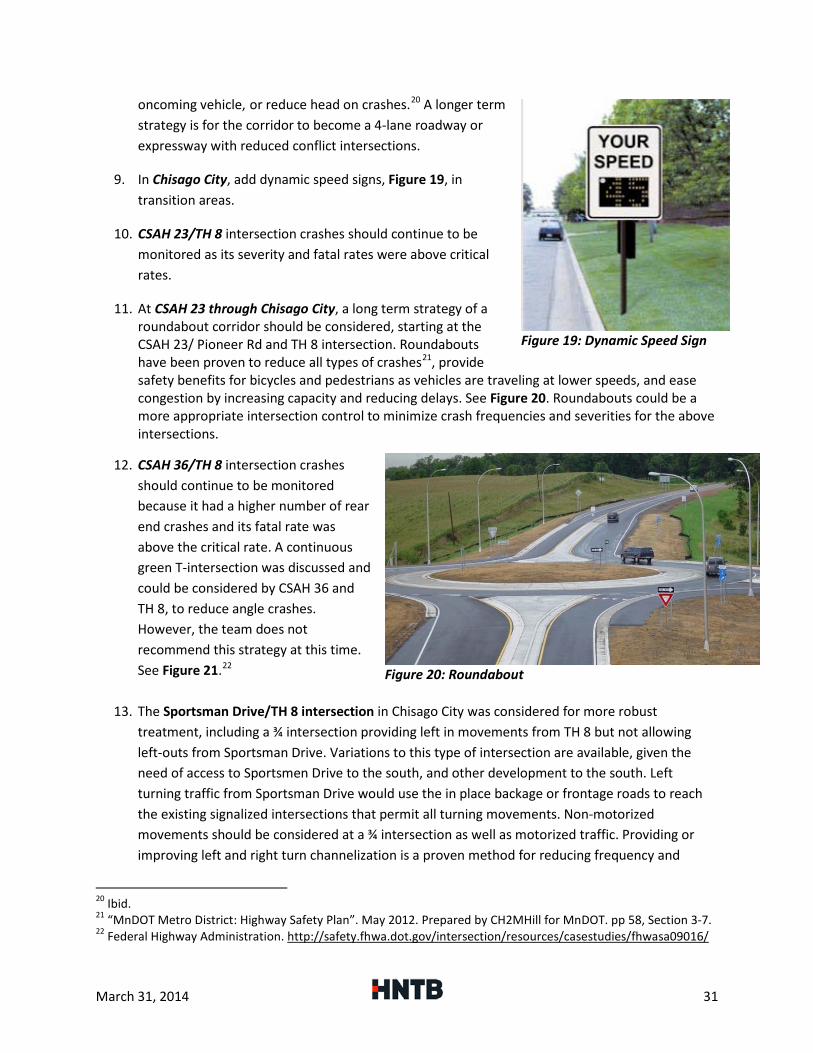
8. The Greenway Ave to City of Lindstrom section could be evaluated to use a 2+1 strategy, a Swedish concept used in Europe, which uses a barrier to adjust the lanes to account for peaks in traffic in key locations. “This technique places 2 full lanes in one direction and 1 in the other with a median separation of 4-feet in which cable barrier can be placed to prevent vehicles from crossing over to oncoming lanes (Figure 17). This layout allows for vehicles to pass throughout
the corridor as the direction of the 2+1 alternates between travel directions, typically at one to two mile intervals”. 17
Another technology available and in use today is removable/adjustable or permanent barrier, see Figure 18.18 The 2+1 concept would capitalize on the existing right-of-way and account for the high directional traffic on the TH 8 corridor. The goal with the technique is to eliminate head-on crashes since passing is restricted to the 2-lane section. The 2+1 concept has been tried, but has a high cost for implementation.19 Installing cable median barriers for medians on multilane roads have been proven to minimize the likelihood of crashing into an
15 “MnDOT Metro District: Highway Safety Plan”. May 2012. Prepared by CH2MHill for MnDOT. pp 57, Section 3-6. 16 Improving Traffic Signal Visibility: Retroreflective Borders on Traffic Signal Backplates http://safety.fhwa.dot.gov/intersection/resources/casestudies/fhwasa09011/fhwasa09011ppt.cfm 17 “U.S. Highway 14: Mankato to New Elm: Road Safety Audit Review Technical Report”. April 2012. Prepared by CH2MHill for MnDOT: pp 23. 18 Lindsay Corporation. Quickchange Removable Barriers. http://www.barriersystemsinc.com/applications 19 “MnDOT Metro District: Highway Safety Plan”. May 2012. Prepared by CH2MHill for MnDOT. pp 55, Section 3-4.
Figure 17: 2+1 Road Section
Figure 18: "QuickChange" Removable Barrier
March 31, 2014 30
oncoming vehicle, or reduce head on crashes.20 A longer term strategy is for the corridor to become a 4-lane roadway or expressway with reduced conflict intersections.
9. In Chisago City, add dynamic speed signs, Figure 19, in transition areas.
10. CSAH 23/TH 8 intersection crashes should continue to be monitored as its severity and fatal rates were above critical rates.
11. At CSAH 23 through Chisago City, a long term strategy of a roundabout corridor should be considered, starting at the CSAH 23/ Pioneer Rd and TH 8 intersection. Roundabouts have been proven to reduce all types of crashes21, provide safety benefits for bicycles and pedestrians as vehicles are traveling at lower speeds, and ease congestion by increasing capacity and reducing delays. See Figure 20. Roundabouts could be a more appropriate intersection control to minimize crash frequencies and severities for the above intersections.
12. CSAH 36/TH 8 intersection crashes should continue to be monitored because it had a higher number of rear end crashes and its fatal rate was above the critical rate. A continuous green T-intersection was discussed and could be considered by CSAH 36 and TH 8, to reduce angle crashes. However, the team does not recommend this strategy at this time. See Figure 21.22
13. The Sportsman Drive/TH 8 intersection in Chisago City was considered for more robust treatment, including a ¾ intersection providing left in movements from TH 8 but not allowing left-outs from Sportsman Drive. Variations to this type of intersection are available, given the need of access to Sportsmen Drive to the south, and other development to the south. Left turning traffic from Sportsman Drive would use the in place backage or frontage roads to reach the existing signalized intersections that permit all turning movements. Non-motorized movements should be considered at a ¾ intersection as well as motorized traffic. Providing or improving left and right turn channelization is a proven method for reducing frequency and
20 Ibid. 21 “MnDOT Metro District: Highway Safety Plan”. May 2012. Prepared by CH2MHill for MnDOT. pp 58, Section 3-7. 22 Federal Highway Administration. http://safety.fhwa.dot.gov/intersection/resources/casestudies/fhwasa09016/
Figure 19: Dynamic Speed Sign
Figure 20: Roundabout
March 31, 2014 31
severity of intersection conflicts. Prohibiting westbound left turns and providing a median access on TH 8 could be considered. In the long term, a roundabout, in conjunction with the access management plan, could be used with other intersections in the vicinity.
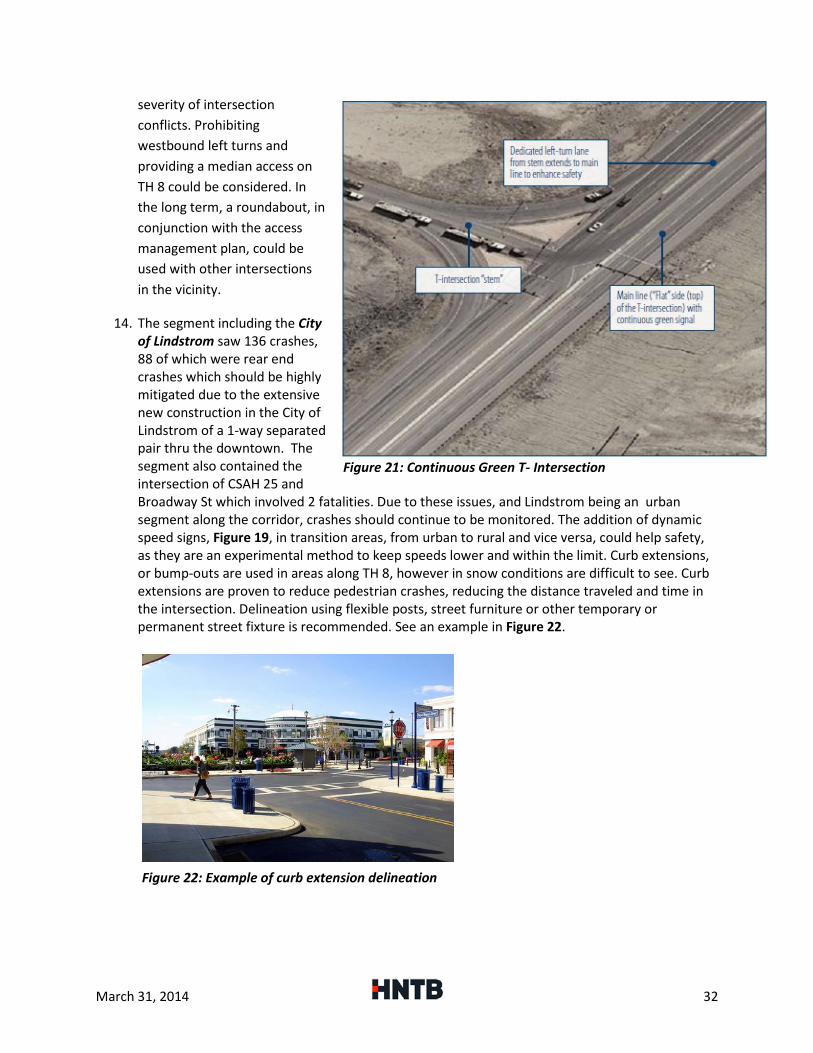
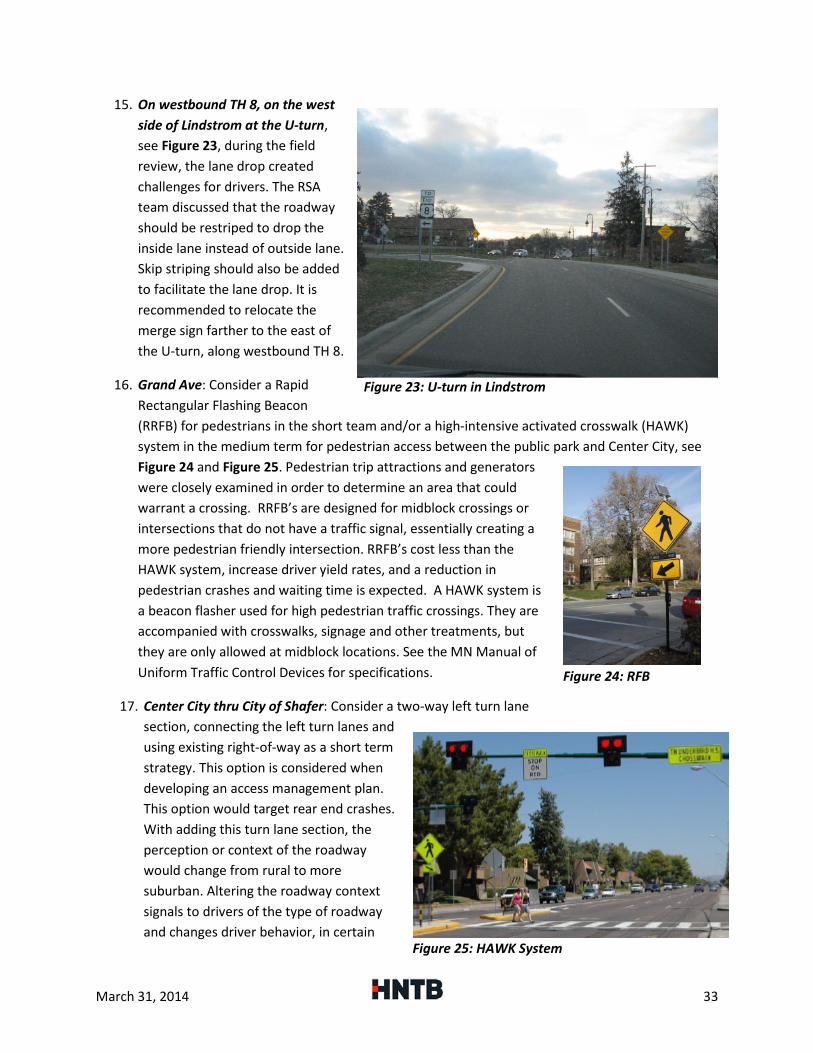
14. The segment including the City of Lindstrom saw 136 crashes, 88 of which were rear end crashes which should be highly mitigated due to the extensive new construction in the City of Lindstrom of a 1-way separated pair thru the downtown. The segment also contained the intersection of CSAH 25 and Broadway St which involved 2 fatalities. Due to these issues, and Lindstrom being an urban segment along the corridor, crashes should continue to be monitored. The addition of dynamic speed signs, Figure 19, in transition areas, from urban to rural and vice versa, could help safety, as they are an experimental method to keep speeds lower and within the limit. Curb extensions, or bump-outs are used in areas along TH 8, however in snow conditions are difficult to see. Curb extensions are proven to reduce pedestrian crashes, reducing the distance traveled and time in the intersection. Delineation using flexible posts, street furniture or other temporary or permanent street fixture is recommended. See an example in Figure 22.
Figure 21: Continuous Green T- Intersection
Figure 22: Example of curb extension delineation
March 31, 2014 32
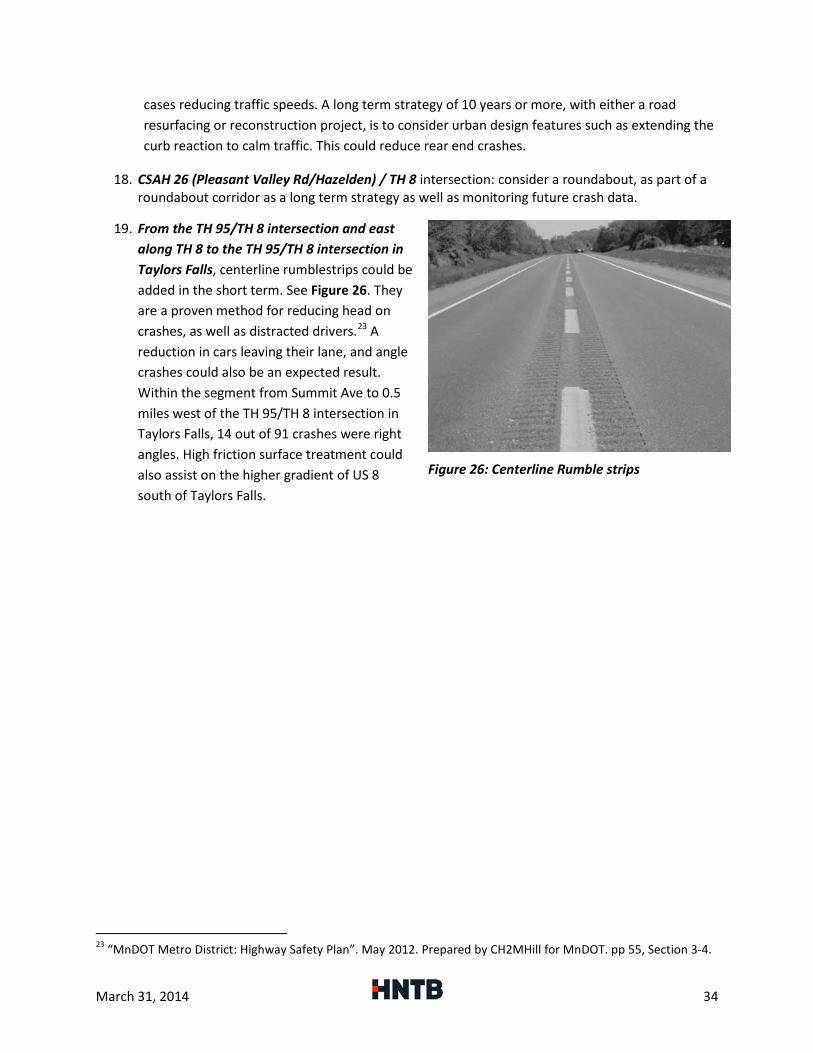
15. On westbound TH 8, on the west side of Lindstrom at the U-turn, see Figure 23, during the field review, the lane drop created challenges for drivers. The RSA team discussed that the roadway should be restriped to drop the inside lane instead of outside lane. Skip striping should also be added to facilitate the lane drop. It is recommended to relocate the merge sign farther to the east of the U-turn, along westbound TH 8.
16. Grand Ave: Consider a Rapid Rectangular Flashing Beacon (RRFB) for pedestrians in the short team and/or a high-intensive activated crosswalk (HAWK) system in the medium term for pedestrian access between the public park and Center City, see Figure 24 and Figure 25. Pedestrian trip attractions and generators were closely examined in order to determine an area that could warrant a crossing. RRFB’s are designed for midblock crossings or intersections that do not have a traffic signal, essentially creating a more pedestrian friendly intersection. RRFB’s cost less than the HAWK system, increase driver yield rates, and a reduction in pedestrian crashes and waiting time is expected. A HAWK system is a beacon flasher used for high pedestrian traffic crossings. They are accompanied with crosswalks, signage and other treatments, but they are only allowed at midblock locations. See the MN Manual of Uniform Traffic Control Devices for specifications.
17. Center City thru City of Shafer: Consider a two-way left turn lane section, connecting the left turn lanes and using existing right-of-way as a short term strategy. This option is considered when developing an access management plan. This option would target rear end crashes. With adding this turn lane section, the perception or context of the roadway would change from rural to more suburban. Altering the roadway context signals to drivers of the type of roadway and changes driver behavior, in certain
Figure 25: HAWK System
Figure 24: RFB
Figure 23: U-turn in Lindstrom
March 31, 2014 33
cases reducing traffic speeds. A long term strategy of 10 years or more, with either a road resurfacing or reconstruction project, is to consider urban design features such as extending the curb reaction to calm traffic. This could reduce rear end crashes.
18. CSAH 26 (Pleasant Valley Rd/Hazelden) / TH 8 intersection: consider a roundabout, as part of a roundabout corridor as a long term strategy as well as monitoring future crash data.
19. From the TH 95/TH 8 intersection and east along TH 8 to the TH 95/TH 8 intersection in Taylors Falls, centerline rumblestrips could be added in the short term. See Figure 26. They are a proven method for reducing head on crashes, as well as distracted drivers.23 A reduction in cars leaving their lane, and angle crashes could also be an expected result. Within the segment from Summit Ave to 0.5 miles west of the TH 95/TH 8 intersection in Taylors Falls, 14 out of 91 crashes were right angles. High friction surface treatment could also assist on the higher gradient of US 8 south of Taylors Falls.
23 “MnDOT Metro District: Highway Safety Plan”. May 2012. Prepared by CH2MHill for MnDOT. pp 55, Section 3-4.
Figure 26: Centerline Rumble strips
March 31, 2014 34
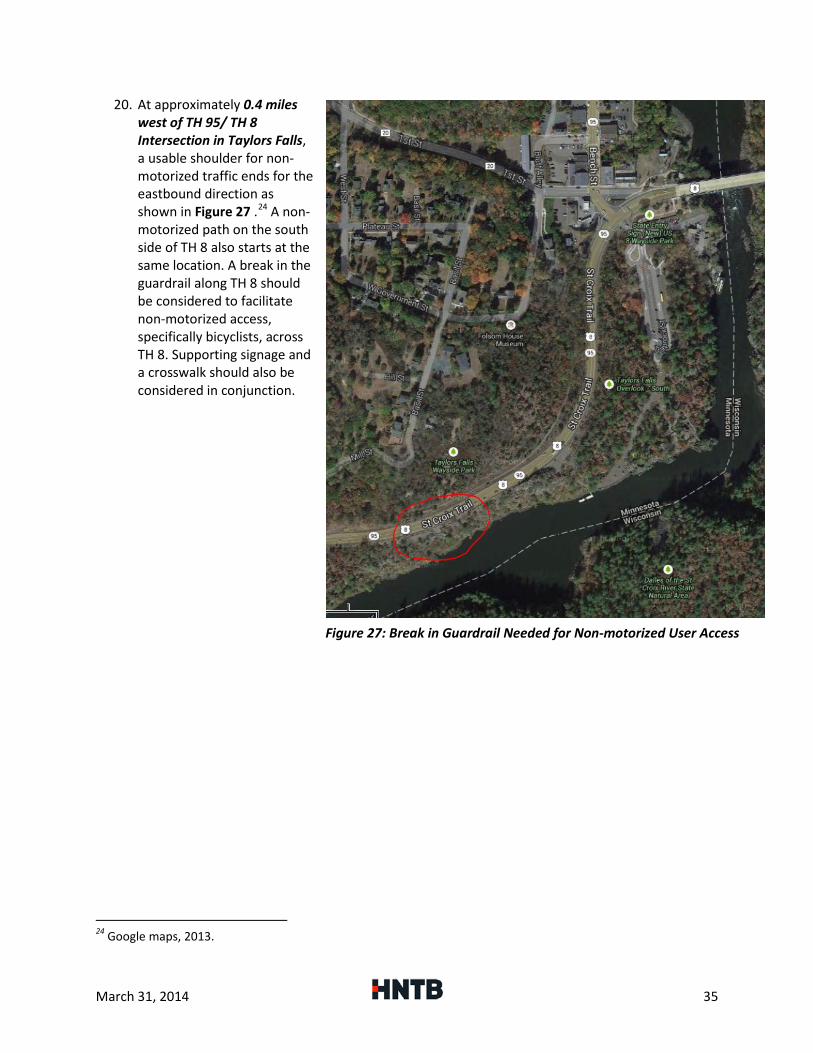
20. At approximately 0.4 miles west of TH 95/ TH 8 Intersection in Taylors Falls, a usable shoulder for non-motorized traffic ends for the eastbound direction as shown in Figure 27 .24 A non-motorized path on the south side of TH 8 also starts at the same location. A break in the guardrail along TH 8 should be considered to facilitate non-motorized access, specifically bicyclists, across TH 8. Supporting signage and a crosswalk should also be considered in conjunction.
24 Google maps, 2013.
Figure 27: Break in Guardrail Needed for Non-motorized User Access
March 31, 2014 35
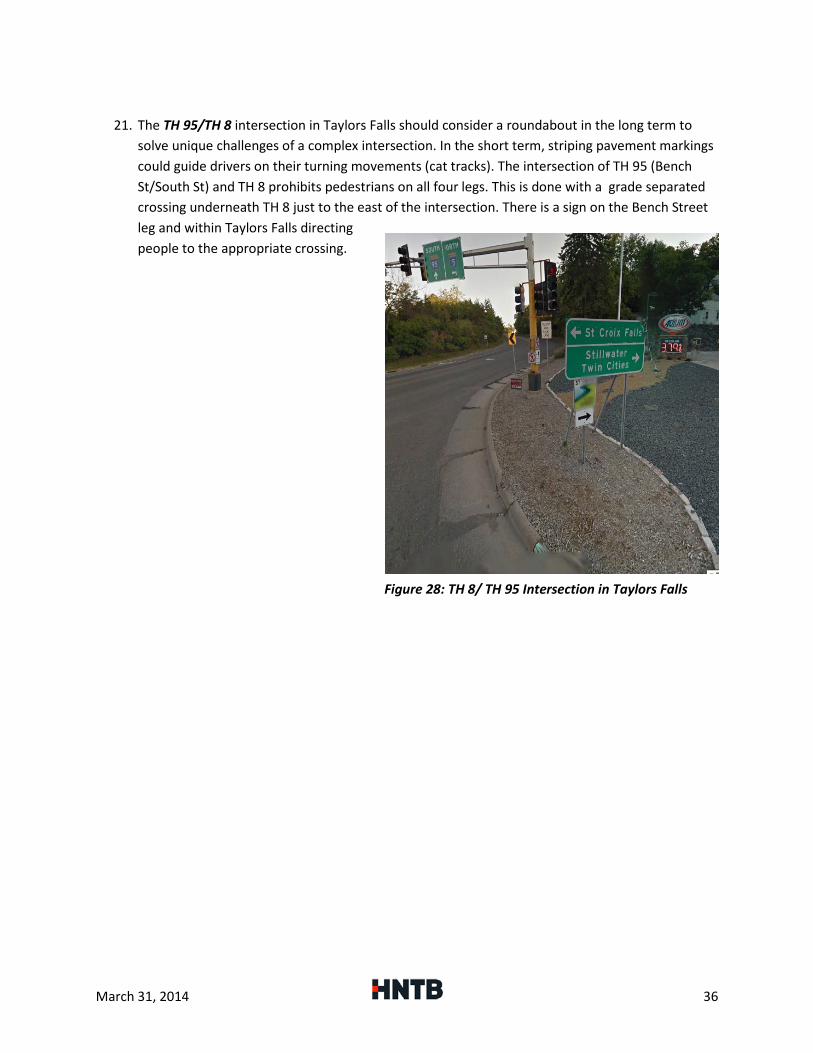
21. The TH 95/TH 8 intersection in Taylors Falls should consider a roundabout in the long term to
solve unique challenges of a complex intersection. In the short term, striping pavement markings could guide drivers on their turning movements (cat tracks). The intersection of TH 95 (Bench St/South St) and TH 8 prohibits pedestrians on all four legs. This is done with a grade separated crossing underneath TH 8 just to the east of the intersection. There is a sign on the Bench Street leg and within Taylors Falls directing people to the appropriate crossing.
Figure 28: TH 8/ TH 95 Intersection in Taylors Falls
March 31, 2014 36
4.2. Behavior Strategies Enforcement of existing traffic laws is an effective safety strategy. “Highly visible and sustained enforcement is designed to increase the public’s perception of enforcement presence and educate the public on the consequences of non-compliance with traffic laws”. 25
Enforcement along the corridor of study is provided by District 2400 of the Minnesota State Patrol and Chisago County Sherriff’s Office. It was suggested by the officer on the TH 8 Road Safety Audit team that a ‘target team’ be deployed to change speed behavior. He stated high speeds are common on the straight, rural segment of TH 8 between Summit Ave and 0.5 miles west of the TH 95 intersection in Taylors Falls, verified by a higher number of illegal speed crashes in the crash data. The targeted speed enforcement is a proven method to reducing operating speeds on specific intersection approaches as well.26 However, while enforcement can be an effective tool, resources are limited and behaviors can return to the previous condition when enforcement stops. “The Minnesota Department of Public Safety’s Office of Traffic Safety (OTS) offers federally funded grants to state and local agencies to increase enforcement of traffic laws....The OTS Towards Zero Deaths (TZD) Enforcement Program leverages officers’ availability for traffic enforcement through requiring multiple agency cooperation and providing funding for officer overtime27….To execute the grant, one agency is designated as the lead agency to coordinate and administer the grant among the agencies involved.” 28 The agency submitting for the grant is required to be a government entity. Therefore, this could include the cities along TH 8, Chisago County public works, or Chisago County Sheriff office. The US 8 Task Force Coalition and public are encouraged to inform these agencies of safety needs, and applicable programs available.
Highly visible, saturated and sustained enforcement could also improve driver inattention or distraction.29 Driver inattention was a common cause of crashes along the entire corridor. It was normally at or exceeding expected rates (as reported from the MnDOT Crash Data Toolkit for 2012) along the entire corridor in segments. Driver distraction is difficult to determine for law enforcement. Suggested countermeasures for distracted driving using laws and enforcement, in order of effectiveness are: Graduated Drivers Licenses (GDL) requirements for beginning drivers, which has been proven, high visibility cell phone/text messaging enforcement, and cell phone and text messaging laws.30 Implementing strategies from the Network of Employers for Traffic Safety could also reduce distracted driving.31 “The U.S. Department of Transportation offers a variety of creative outreach campaigns for teens, parents, educators, employers, and communities to raise awareness about the dangers of
25 “U.S. Highway 14: Mankato to New Elm: Road Safety Audit Review Technical Report”. April 2012. Prepared by CH2MHill for MnDOT: pp 32. 26 “MnDOT Metro District: Highway Safety Plan”. May 2012. Prepared by CH2MHill for MnDOT. pp 58, Section 3-7. 27 Enforcement Grant Programs, 2014. Office of Traffic and Safety, MnDOT. https://dps.mn.gov/divisions/ots/law-enforcement/Pages/enforcement-programs.aspx 28 TZD Safe Roads. https://dps.mn.gov/divisions/ots/tzd-safe-roads/Pages/default.aspx 29 “U.S. Highway 14: Mankato to New Elm: Road Safety Audit Review Technical Report”. April 2012. Prepared by CH2MHill for MnDOT: pp 32. 30 “Highway Safety Countermeasure Guide For State Highway Safety Offices Seventh Edition, 2013”. Chapter 4: pp. 194. https://dps.mn.gov/divisions/ots/tzd-safe-roads/Documents/countermeasure-2013.pdf 31 Network of Employers for Traffic Safety. http://www.minnesotasafetycouncil.org/nets/DistractedDriving.cfm
March 31, 2014 37
distracted driving. The use of compelling outreach materials is most effective when coupled with an enhanced enforcement campaign. For further information on the NHTSA enforcement campaign and the U.S. DOT distraction campaign resources, see: http://distraction.gov/”.32
The communities along the TH 8 corridor should consider a Safe Roads program grant, which are funded by the OTS, and administered by a local lead coalition.33 The coalition could use grants for funding, but also to stimulate ideas and provide momentum for action on safety issues within the corridor. 34
5. Conclusion This Road Safety Audit report provides strategies or suggested improvements that are beyond those that have previously been studied, implemented or constructed to date. Solutions may have occurred that overlap or create redundant solutions presented here. The overlap should be discovered as the crash data from segments and intersections continue to be monitored. Some strategies will not be necessary as the original problem may be resolved. The best solutions and use of resources for the corridor should be continually reevaluated, using this report as a tool. A hierarchy of priorities should be continually evaluated, although it is recommended to follow the short, medium and long term strategies.
Crashes have declined over the years, especially severe crashes between the years 2008 to 2012. This is assumed to be a result of the safety improvements constructed on the TH 8 corridor throughout 2008 to 2012.
The fatal rate is slightly higher than on similar roadways, or the rural system average for 2-lane roadways in Minnesota. The crash rate, severity and fatal plus severity rates are lower. Most segment rates are below the critical rates, with two segments above. There are five intersections with at least one or more rate above the critical rates.
The SB I-35 ramp from WB TH 8 showed an usually higher severity rate. A short term solution of high friction surface treatment should be considered, as implemented in other U.S. states. This could mitigate or eliminate the run-off-the-road crashes and overturn crashes. Other solutions are barrier replacement, modification or upgrades, additional lighting, and recoverable slopes. In the long term new ramp configurations and realignments are being considered with the I-35 bridge replacement project scheduled for 2018. Rear end crashes are high in the corridor. However, most intersections with high ADT were retrofitted in the years 2008 to 2012 with turn lanes, with the intention of reducing these types of crashes. Other additional intersection treatments, including short, medium and long term solutions specific to the intersection, should be considered.
32 “U.S. Highway 14: Mankato to New Elm: Road Safety Audit Review Technical Report”. April 2012. Prepared by CH2MHill for MnDOT: pp 36. 33 Office of Traffic and Safety, MnDOT, Safe Roads Grant program. http://www.minnesotatzd.org/initiatives/saferoads/ 34 Office of Traffic and Safety, MnDOT, grants. https://dps.mn.gov/divisions/ots/Pages/traffic-safety-grants.aspx
March 31, 2014 38
Most crashes occurred in the urban segment through Lindstrom, the area with the highest access density. An access management plan is recommended for the entire corridor, specifically from Chisago City through the City of Lindstrom.
TH 95/TH 8 intersection to the west of Taylors Falls should continue to be monitored for crashes, which was a concern of the US 8 Task Force Coalition. Other intersections to monitor are TH 8 and CSAH 23(Pioneer Rd), CSAH20(Oak St), CSAH 21(Redwing Ave), CSAH 36(Viking Rd), CSAH25(Olinda Tr), and CSAH 26(Pleasant Valley Rd) due to recent construction history and unavailable post construction data, as well as some higher severity and fatal rates.
A future transition to a roundabout corridor should be considered, involving current signalized intersections of CSAH 23(Pioneer Rd), TH 95 in Taylors Falls, TH 8, and unsignalized intersections of Sportsman Drive, CSAH 26(Pleasant Valley Rd), and TH 8. Within this examination, the intersection of TH 95 and TH 8 in Taylors Falls should be analyzed for a robust reconfiguration or enhanced intersection treatments for its more complex elements. Roundabouts have the least delay and best safety record, however, they can require large amounts of right-of-way and generally cost around $1 million per intersection to implement.35
Application for safety program grants from MnDOT and outside sources should be considered, primarily for behavior modifications, but with crossover benefits of reducing specific types of crashes as intersections and segments.
35 “U.S. Highway 14: Mankato to New Elm: Road Safety Audit Review Technical Report”. April 2012. Prepared by CH2MHill for MnDOT: pp 39.
March 31, 2014 39