Embed Size (px)
DESCRIPTION
Chief Scientist NSW publication of 2014 on options for treating tunnel air in NSW.
Citation preview
Advisory Committee on Tunnel Air Quality
TP08: Options for treating
road tunnel emissionsAuthor: Roads and Maritime Services
JULY 2014

Options for treating road tunnel emissions | 1
Summary1. Options for treating road tunnel emissions
Very few tunnels around the world are equipped with air treatment systems. There are around 60 installations of electro-static precipitators (ESP) to remove particulate matter (PM).
There are five installations of de-nitrification systems to remove nitrogen dioxide (NO2).
Evidence to date suggests that the effectiveness of such controls when applied to road tunnels is limited to specific situations, and that the technologies are rarely used.
The M5 East filtration trial removed 200 kilograms of particulate matter (PM) at a cost of $760,000 (operating costs only) (AMOG, 2012). In comparison, the estimated health benefit of removing 200kg PM is $56,000.
An assessment of a range of other PM reduction measures found that the introduction of Euro5/6 standards for new passenger vehicles would reduce emission of PM by 131 tonnes annually at a cost of $209,000 per tonne, with a health benefit of $280,000 per tonne.
This is consistent with the conclusions of the National Health and Medical Research Council that the most effective way to manage air quality both in and around tunnels is through vehicle fleet emission reductions.
Since the late 1980’s, technology has been developed for cleaning tunnel air. This development has been mainly in Norway, Austria, Germany and Japan.
The use of these technologies to help achieve external air quality goals in the past was experimental or extremely rare (PIARC 2008). Very few tunnels around the world are equipped with air treatment systems. There are around 60 installations around the world, 35 of which are in Japan and eight in Norway (CETU 2011).
The use of these technologies remains rare – however some improvements in their efficiency and reliability now place them as another ‘option’ that can be evaluated in the range of tools for managing air quality on some specific target pollutants.
Filtration of tunnel air in general terms is used to either;
• treat in-tunnel air to improve the air quality for tunnel users, or
• treat air at the ventilation outlet point to remove pollutants to improve ambient air quality around the tunnel.
Regardless of whether in-tunnel or ambient air quality is to be managed, the current available systems are used for both cases.
2 | Advisory Committee on Tunnel Air Quality
There are two types of pollutant removal systems for tunnel air filtration;
1. Electro-static precipitation
An electro-static precipitator (ESP) is used to remove particulate matter (PM).
The first installation of an ESP for air cleaning in road tunnels was in the Tsuruga tunnel (Japan) in 1979. Typically an ESP was installed to manage haze within a tunnel due to smoky vehicles which was considered a safety issue in terms of visibility.
There are 9,000 road tunnels in Japan with an approximate combined length of around 3,000 kilometres of which 35 have ESP’s (PIARC 2008).
There are approximately 1,000 tunnels in Norway – of these 8 have installed electrostatic precipitators over the past 15 years. Installation of ESP’s in Norway was driven by the need to improve visibility due to the studded tyres used in cold climate conditions.
Germany, Austria, Italy, Spain, France, South Korea and Vietnam have all installed either small pilot systems or more extensive systems such as within the M30 in Madrid.
There are approximately 60 ESP installations around the world in total. It is difficult to obtained information on the operating time of these systems. However, available information indicates they are rarely used. For example, the Tokyo Bay “Aqualine” tunnel only records 12 to 13 hours of operation per year (CETU 2011).
2. De-Nitrification (Denox)
De-Nitrification (Denox) is primarily for the removal nitrogen dioxide (NO2).
Denox is used even less than electro-static and remains a little used system implemented in five tunnels worldwide: Laerdal (Norway), Chuo-Kanjo-Shjinjuku (Japan), Umberto (Italy), M30 (Spain) and M5 East (Australia) (CETU 2011).
There is little published independently reviewed evidence available regarding the performance of tunnel air treatment systems.
Technologies are pollutant specific, only address local and not regional road transport-related air pollution, generate chemical waste and have significant capital and operational costs (NZ Transport Agency 2013).
Options for treating road tunnel emissions
Options for treating road tunnel emissions | 3
Australia has a single ESP and Denox installation within the M5 East tunnel. This was installed and trialled from March 2010 to September 2011.
The system was installed with the intention of improving the air quality at the western end of the westbound tunnel by reducing haze caused by particulate pollution.
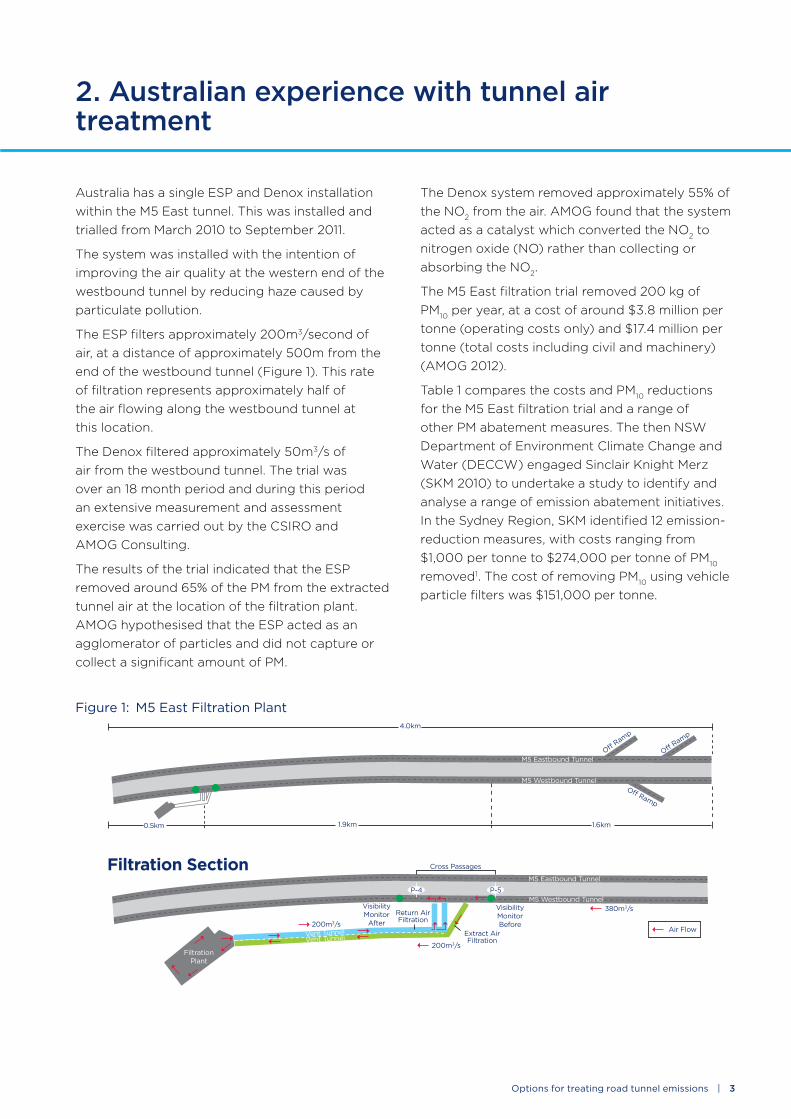
The ESP filters approximately 200m3/second of air, at a distance of approximately 500m from the end of the westbound tunnel (Figure 1). This rate of filtration represents approximately half of the air flowing along the westbound tunnel at this location.
The Denox filtered approximately 50m3/s of air from the westbound tunnel. The trial was over an 18 month period and during this period an extensive measurement and assessment exercise was carried out by the CSIRO and AMOG Consulting.
The results of the trial indicated that the ESP removed around 65% of the PM from the extracted tunnel air at the location of the filtration plant. AMOG hypothesised that the ESP acted as an agglomerator of particles and did not capture or collect a significant amount of PM.
The Denox system removed approximately 55% of the NO2 from the air. AMOG found that the system acted as a catalyst which converted the NO2 to nitrogen oxide (NO) rather than collecting or absorbing the NO2.
The M5 East filtration trial removed 200 kg of PM10 per year, at a cost of around $3.8 million per tonne (operating costs only) and $17.4 million per tonne (total costs including civil and machinery) (AMOG 2012).
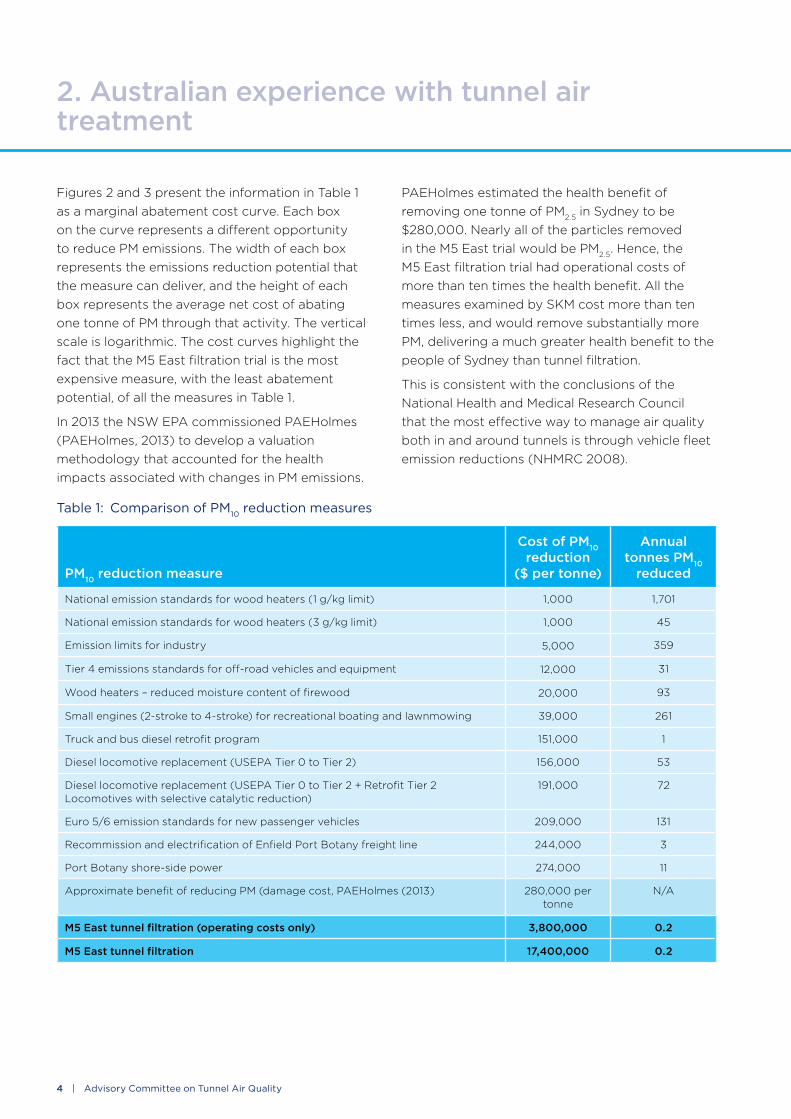
Table 1 compares the costs and PM10 reductions for the M5 East filtration trial and a range of other PM abatement measures. The then NSW Department of Environment Climate Change and Water (DECCW) engaged Sinclair Knight Merz (SKM 2010) to undertake a study to identify and analyse a range of emission abatement initiatives. In the Sydney Region, SKM identified 12 emission-reduction measures, with costs ranging from $1,000 per tonne to $274,000 per tonne of PM10 removed1. The cost of removing PM10 using vehicle particle filters was $151,000 per tonne.
2. Australian experience with tunnel air treatment
Figure 1: M5 East Filtration Plant
Cross Passages
1.6km1.9km0.5km
4.0km
M5 Eastbound Tunnel
M5 Westbound Tunnel
M5 Eastbound Tunnel
M5 Westbound Tunnel
Visibility Monitor Before
Visibility Monitor
After
Filtration Plant
Extract Air Filtration
Return Air Filtration
P-4 P-5
380m3/s
Air Flow
200m3/s
200m3/sVent TunnelVent Tunnel
O� Ramp
O� Ramp
O� Ramp
Filtration Section
4 | Advisory Committee on Tunnel Air Quality
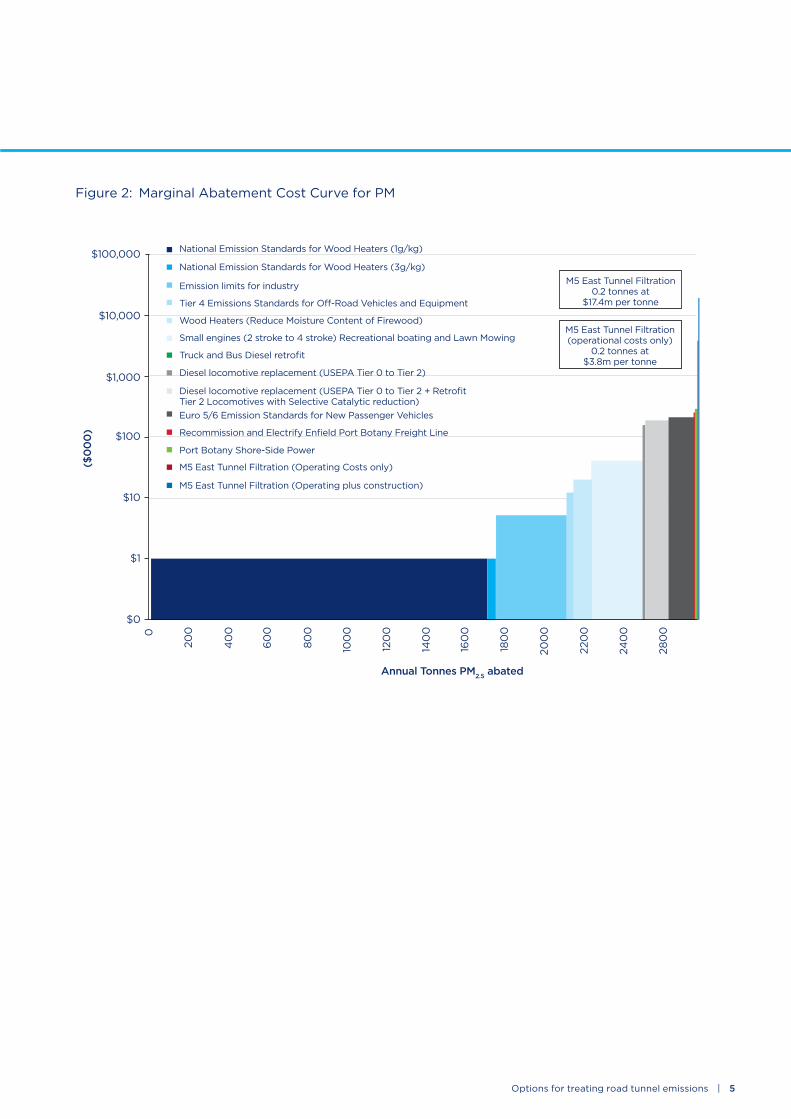
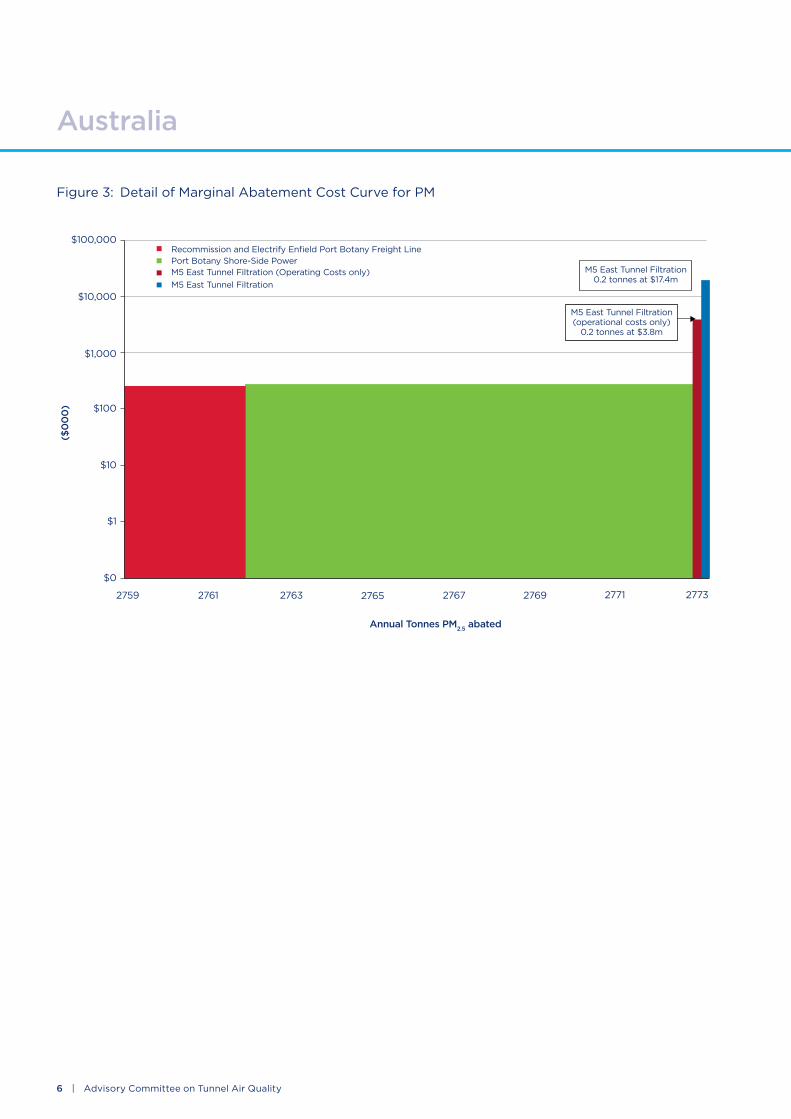
Figures 2 and 3 present the information in Table 1 as a marginal abatement cost curve. Each box on the curve represents a different opportunity to reduce PM emissions. The width of each box represents the emissions reduction potential that the measure can deliver, and the height of each box represents the average net cost of abating one tonne of PM through that activity. The vertical scale is logarithmic. The cost curves highlight the fact that the M5 East filtration trial is the most expensive measure, with the least abatement potential, of all the measures in Table 1.
In 2013 the NSW EPA commissioned PAEHolmes (PAEHolmes, 2013) to develop a valuation methodology that accounted for the health impacts associated with changes in PM emissions.
PAEHolmes estimated the health benefit of removing one tonne of PM2.5 in Sydney to be $280,000. Nearly all of the particles removed in the M5 East trial would be PM2.5. Hence, the M5 East filtration trial had operational costs of more than ten times the health benefit. All the measures examined by SKM cost more than ten times less, and would remove substantially more PM, delivering a much greater health benefit to the people of Sydney than tunnel filtration.
This is consistent with the conclusions of the National Health and Medical Research Council that the most effective way to manage air quality both in and around tunnels is through vehicle fleet emission reductions (NHMRC 2008).
Table 1: Comparison of PM10 reduction measures
PM10 reduction measure
Cost of PM10 reduction
($ per tonne)
Annual tonnes PM10
reduced
National emission standards for wood heaters (1 g/kg limit) 1,000 1,701
National emission standards for wood heaters (3 g/kg limit) 1,000 45
Emission limits for industry 5,000 359
Tier 4 emissions standards for off-road vehicles and equipment 12,000 31
Wood heaters – reduced moisture content of firewood 20,000 93
Small engines (2-stroke to 4-stroke) for recreational boating and lawnmowing 39,000 261
Truck and bus diesel retrofit program 151,000 1
Diesel locomotive replacement (USEPA Tier 0 to Tier 2) 156,000 53
Diesel locomotive replacement (USEPA Tier 0 to Tier 2 + Retrofit Tier 2 Locomotives with selective catalytic reduction)
191,000 72
Euro 5/6 emission standards for new passenger vehicles 209,000 131
Recommission and electrification of Enfield Port Botany freight line 244,000 3
Port Botany shore-side power 274,000 11
Approximate benefit of reducing PM (damage cost, PAEHolmes (2013) 280,000 per tonne
N/A
M5 East tunnel filtration (operating costs only) 3,800,000 0.2
M5 East tunnel filtration 17,400,000 0.2
2. Australian experience with tunnel air treatment
Options for treating road tunnel emissions | 5
Figure 2: Marginal Abatement Cost Curve for PM
($0
00
)
$0
0
200
40
0
60
0
800
100
0
120
0
140
0
160
0
180
0
200
0
220
0
240
0
280
0
$1
$10
$100
$1,000
$10,000
$100,000
Annual Tonnes PM2.5 abated
National Emission Standards for Wood Heaters (1g/kg)
M5 East Tunnel Filtration 0.2 tonnes at
$17.4m per tonne
M5 East Tunnel Filtration (operational costs only)
0.2 tonnes at $3.8m per tonne
National Emission Standards for Wood Heaters (3g/kg)
Emission limits for industry
Tier 4 Emissions Standards for O�-Road Vehicles and Equipment
Wood Heaters (Reduce Moisture Content of Firewood)
Small engines (2 stroke to 4 stroke) Recreational boating and Lawn Mowing
Truck and Bus Diesel retrofit
Diesel locomotive replacement (USEPA Tier 0 to Tier 2)
Diesel locomotive replacement (USEPA Tier 0 to Tier 2 + Retrofit Tier 2 Locomotives with Selective Catalytic reduction)Euro 5/6 Emission Standards for New Passenger Vehicles
Recommission and Electrify Enfield Port Botany Freight Line
Port Botany Shore-Side Power
M5 East Tunnel Filtration (Operating Costs only)
M5 East Tunnel Filtration (Operating plus construction)
6 | Advisory Committee on Tunnel Air Quality
Figure 3: Detail of Marginal Abatement Cost Curve for PM
Australia
($0
00
)
$0
2759 2761 2763 2765 2767 2769 2771 2773
$1
$10
$100
$1,000
$10,000
$100,000
Annual Tonnes PM2.5 abated
Recommission and Electrify Enfield Port Botany Freight Line
M5 East Tunnel Filtration 0.2 tonnes at $17.4m
M5 East Tunnel Filtration (operational costs only)
0.2 tonnes at $3.8m
Port Botany Shore-Side PowerM5 East Tunnel Filtration (Operating Costs only)M5 East Tunnel Filtration
Options for treating road tunnel emissions | 7
References
AMOG (2012). M5 East Tunnel Filtration Trial Evaluation Program – Review of Operational Performance. www.rms.nsw.gov.au/environment/cleanerair/air_filtration_reports/m5e_tunnel_air_filtration_trial_evaluation_amog_report_february_2012.pdf
CETU (Cente d’Etudes des Tunnels) (2010). The treatment of air in road tunnels, State-of-the-art studies and works, www.cetu.developpement-durable.gouv.fr/IMG/pdf/CETU_DocInfo_Air_treatment_EN_2011.pdf, accessed 20 February 2104.
NHMRC (National Health and Medical Research Council) (2008). Air quality in and around traffic tunnels final report, EH42, www.nhmrc.gov.au/guidelines/publications/eh42
NZ Transport Agency Guide to road tunnels (2013), NZ Transport Agency, www.nzta.govt.nz/resources/guide-to-road-tunnels/, accessed 20 February 2014
PAEHolmes (2013), Methodology for Valuing the Health Impacts of Changes in Particle Emissions, www.epa.nsw.gov.au/resources/air/HealthPartEmiss.pdf, accessed 13 may 2014.
PIARC (2008), Road tunnels: A guide to optimising their air quality impact on the environment, PIARC Technical Committee C3.3 Road Tunnel Operations www.piarc.org/en/order-library/5885-en-Road%20tunnels:%20a%20guide%20to%20optimising%20the%20air%20quality%20impact%20upon%20the%20environment.htm
Sinclair Knight Merz (2010) Department of Environment, Climate Change and Water (DECCW) – Cost Abatement Curves for Air Emission Reduction Actions, www.epa.nsw.gov.au/resources/air/CostCurveAirEmissionRedn.pdf accessed 6 February 2014

8 | Advisory Committee on Tunnel Air Quality