Embed Size (px)
Citation preview

Roadmap of the session:Systems Resilience and Economic Impact
Hirokazu Tatano
Disaster Prevention Research
Institute Kyoto University
Resilience Research• Socio/Eco-Systems Research
– Holling(1973) “Resilience and Stability of Ecological Systems” Resilience determines the persistence of relationships within a system and is a
measure of the ability of these systems to absorb changes of state variables, driving variables, and parameters, and still persist.
• Disaster research(Geography)– Cutter, etal (2008) “A place-based model for understanding community
resilience to natural disasters” Global Env. Change
• Economic Resilience– Rose&Liao (2005) “Modeling Regional Economic Resilience to Disasters: A
Computable General Equilibrium Analysis of Water Service Disruptions”, J. Regional Science economic resilience—reduced consequences of failure through the innate aspects of the
economic system at all levels to cushion itself against losses in a given period.
• Engineering– Breneu, et.al.,(2003) “A Framework to Quantitatively Assess and Enhance
the Seismic Resilience of Communities”, Earthquake Spectra, 19(4) Resilience can be understood as the ability of the system to reduce the chances of
a shock, to absorb a shock if it occurs (abrupt reduction of performance) and to recover quickly after a shock (re-establish normal performance).
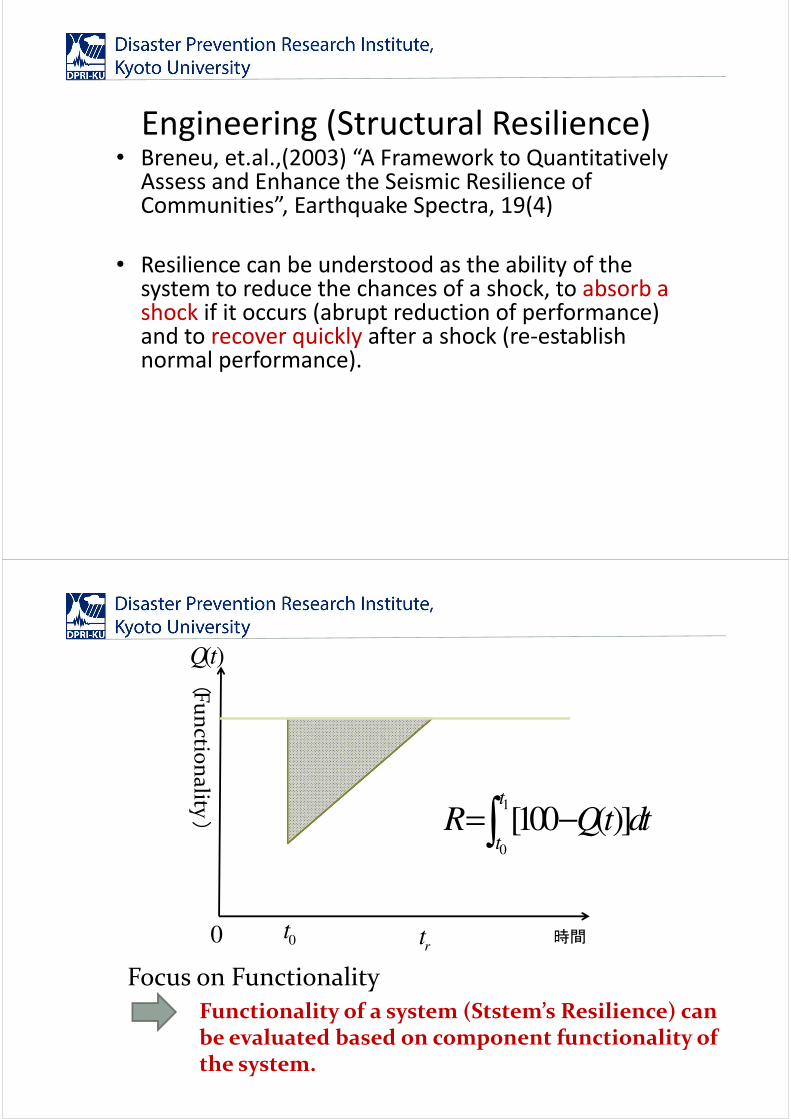
Engineering (Structural Resilience)• Breneu, et.al.,(2003) “A Framework to Quantitatively
Assess and Enhance the Seismic Resilience of Communities”, Earthquake Spectra, 19(4)
• Resilience can be understood as the ability of the system to reduce the chances of a shock, to absorb a shock if it occurs (abrupt reduction of performance) and to recover quickly after a shock (re-establish normal performance).
(
Fu
nctio
nality
)
時間0t rt
( )Qt
0
Focus on Functionality
Functionality of a system (Ststem’s Resilience) can be evaluated based on component functionality of the system.
1
0
[100 ( )]t
tR Qt dt= −

1O D2
0t 1t
( )Qt
0
0t 1t
( )Qt
00t
1t
( )Qt
0
( )Qt
0t 1
t
( )Qt
00t
1t
( )Qt
0
1
O D
2
{ } { }min ( ) ,( ) ( ) max ( )iT N i P i N i
Q t Q t QQ t t∈ ∈= =
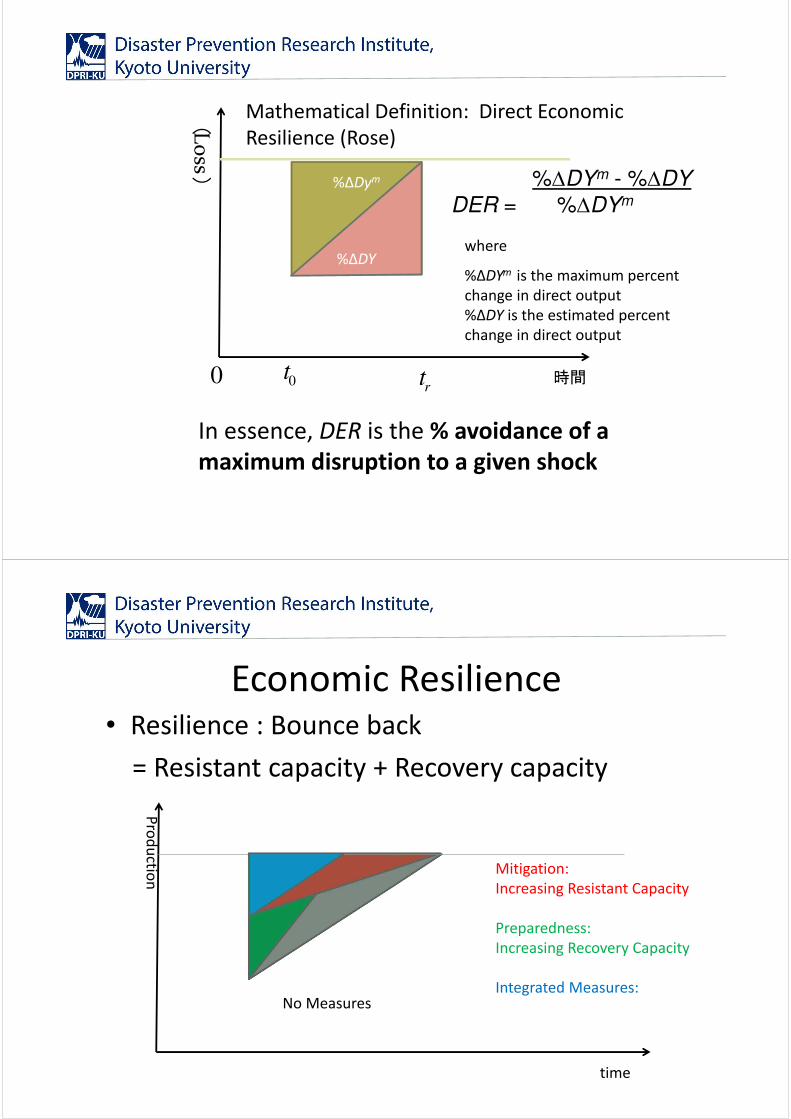
Economic Resilience(Rose 2004)
• Static: – General Definition: Ability of a system to maintain function
when shocked.
– Econ Definition: Efficient use of remaining resources at a given point in time to produce as much as possible.
• Dynamic – General: Ability & speed of a system to recover.
– Economic: Efficient use of resources over time for investment in repair and reconstruction, including expediting the process & adapting to change
• Metric: averted losses as % of potential losses
(
Lo
ss
)
時間0t rt0
%∆Dym
%∆DY
DER =
%∆DYm - %∆DY
%∆DYm
In essence, DER is the % avoidance of a
maximum disruption to a given shock
where
%∆DYm is the maximum percent
change in direct output
%∆DY is the estimated percent
change in direct output
Mathematical Definition: Direct Economic
Resilience (Rose)
Economic Resilience • Resilience : Bounce back
= Resistant capacity + Recovery capacity
Pro
du
ction
time
Mitigation:
Increasing Resistant Capacity
Preparedness:
Increasing Recovery Capacity
Integrated Measures:No Measures

Resilience • “Functionality” in stead of “production”
Fu
nctio
na
lity
time
Mitigation:
Increasing Resistant Capacity
Preparedness:
Increasing Recovery Capacity
Integrated Measures:No Measures
How can we measure economic resilience
in the outcome bases?
Is it really significant?

Total Loss = Direct Loss + Indirect Loss
What are the direct and indirect losses?
How can we estimate them?
time
Reg
ion
al Pro
du
ction
Conventional Framework of Loss Estimation
Damages in “STOCK”
• STOCKS:infrastructure, building, production capital,
etc
- used repeatedly for producing services
• Value of STOCK:
– Present value of a flow of services which will be produced
in the future by the stock
• Economic losses in “STOCK”:
– Lost present value of services which could be produced by
the damaged / lost stock

Direct Loss=Stock Loss• 80% of “Stocks” are supposed to be lost by a disaster
Time
Pro
ductio
n
Stock Loss=
Present value of
this area
Indirect Loss• Forgone flow of benefit (profit) which could be
earned if the stock were not damaged, e.g.,
business interruption losses.
Time
Poductio
n
Indirect Loss:Present Value of this
area

Indirect Loss
=Direct lossーBenefit of Restoration
• When we often talk about total losses,
effects of two different events together:
Earthquake and Restoration.
= -
Indirect Loss Direct Loss Benefit of Restoration
time time time
pro
ductio
n
pro
ductio
n
pro
ductio
n
Therefore,
• Total Loss (Economic Effect of the Earthquake
and Restoration actions)
=Direct Loss-Net Benefit of Restoration
=Indirect Loss+Cost of Restoration
Restoration cost should be regarded as the direct loss!!
Hanshin Awaji Earthquake:Restoration cost of highway bridges’ pillars were 2-
10 times larger than the construction cost.

Aggregation in a region
• During some sector will increase because of
restoration, e.g., construction.
Question:
• Should we add the negative economic loss
(=positive benefit) in such sectors to estimate
consistent total economic loss in industrial
sectors?

Restoration Demand and Loss estimation
Business interruption
loss
(foregone revenue)
Cost for Restoration
(opportunity cost of labors and
capitals used for
restoration)
・・・
gainers
+
restoration cost of victims= increased revenue of gainers
cancel out in regional aggregation
victims
→Actual opportunity cost of a disaster
Summing up difference of discounted cash flows
ADDCL=foregone revenue + restoration expenses
- revenue increase by restoration demand
+ increase in production cost of restoration
Business interruption
loss (foregone
revenue)
Cost for Restoration
(opportunity cost of labors and
capitals used for restoration)+
Answer : yes
Difference of discounted cash flows aggregated
over a region (ADDCL)
=Regional opportunity cost of a disaster
Avtural opportunity cost of a disaster

Outcome of resilience
• Resilience ↑
• Economic Loss (Total) ↓
• We regards the outcome based measure of
resilience could be decrease of (total)
economic loss (=BI loss + recovery cost).
How significant?
• Resistance capacity vs Recovery capacity?

Post-Disaster Business Surveysin the area affected by the Great
East Japan Earthquake: Summary of the regional and
sectorial impacts
Hirokazu Tatano(1) , Yoshio Kajitani(1), Tetsuya Tamaki(1),
Makoto Okumura(2)
(1) DPRI, Kyoto University(2) IRIDeS, Tohoku University
Survey ① Survey ②area Iwate, Miyagi Akita, Aomori,
Fukushima, Yamagata, Ibaragi, Tochigi, Chiba
Period Nov.-Dec. 2011 Nov.-Dec. 2012Method Questionnaire mail
survey Questionnaire mail survey
List (address)
Teikoku Data Bank TelephoneBook 2012
Sampling Random Sampling Random SamplingDistribution 12,836 8,000Answered 2,669 1,289Ratio 20.8% 16.1%Surveyors DPRI, KU & CRIEPI DPRI, KU & IRIDeS
Tohoku U.
Post event surveys
※Survey did not include Tsunami and nuclear accident affected areas.
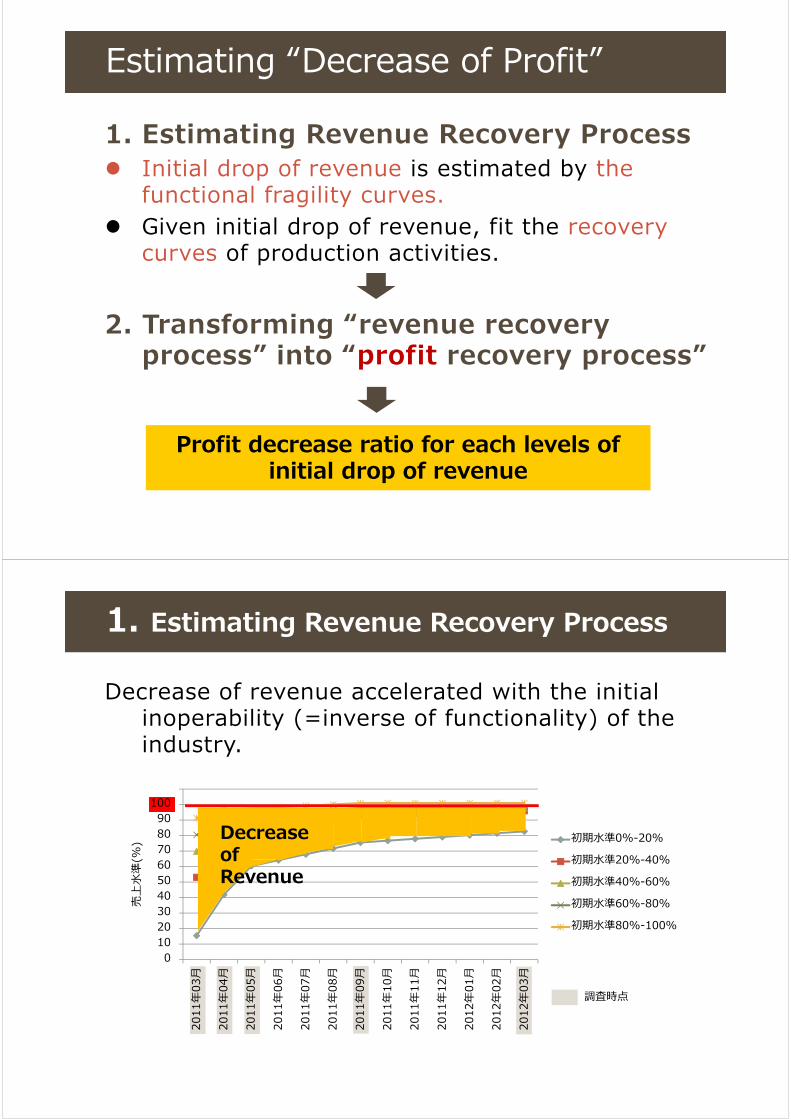
Estimating “Decrease of Profit”
1. Estimating Revenue Recovery Process Initial drop of revenue is estimated by the
functional fragility curves. Given initial drop of revenue, fit the recovery
curves of production activities.
2. Transforming “revenue recovery process” into “profit recovery process”
Profit decrease ratio for each levels of initial drop of revenue
Decrease of revenue accelerated with the initial inoperability (=inverse of functionality) of the industry.
0102030405060708090
100110
2011
年03
月
2011
年04
月
2011
年05
月
2011
年06
月
2011
年07
月
2011
年08
月
2011
年09
月
2011
年10
月
2011
年11
月
2011
年12
月
2012
年01
月
2012
年02
月
2012
年03
月
売上
水準
(%) 初期水準0%-20%
初期水準20%-40%
初期水準40%-60%
初期水準60%-80%
初期水準80%-100%
1. Estimating Revenue Recovery Process
調査時点
Decrease of Revenue
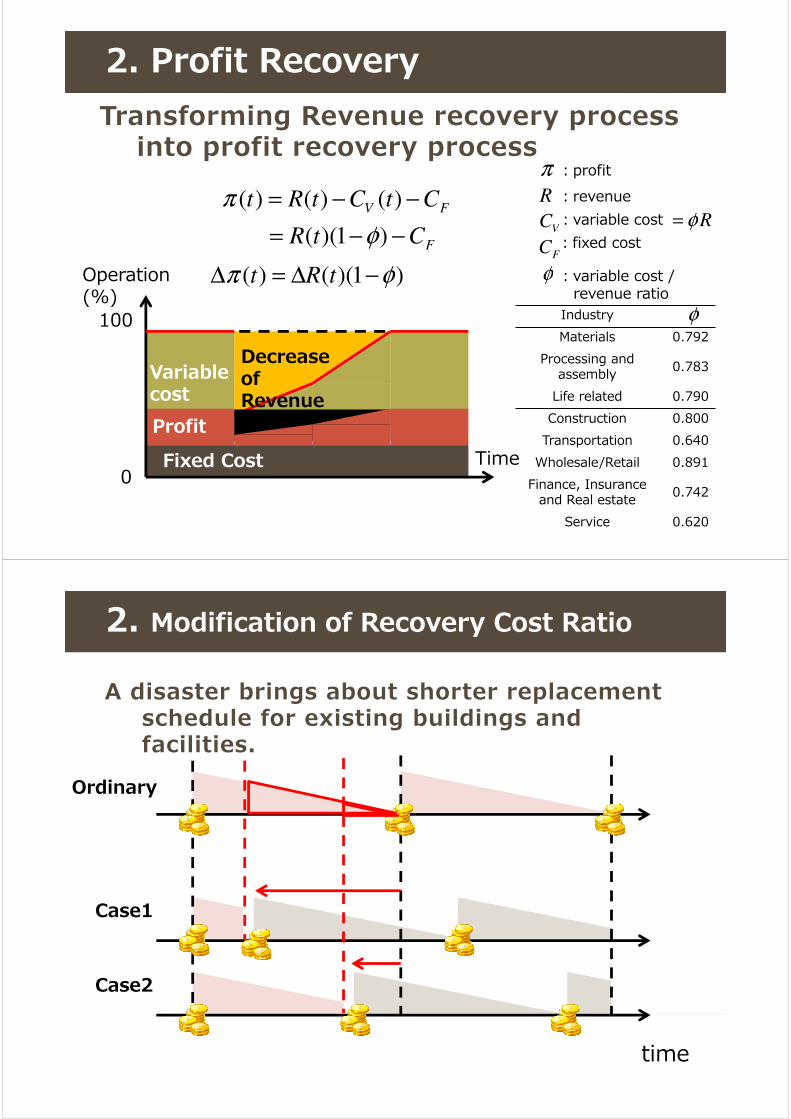
Transforming Revenue recovery process into profit recovery process
2. Profit Recovery
0
100
Time
Operation (%)
Variable cost
Fixed CostProfit
)1)(()( φπ −∆=∆ tRt
F
FV
CtR
CtCtRt
−−=
−−=
)1)((
)()()(
φ
π
π ︓profit︓revenue︓variable cost︓fixed cost
R
VC
FC
IndustryMaterials 0.792
Processing and assembly 0.783
Life related 0.790Construction 0.800
Transportation 0.640Wholesale/Retail 0.891
Finance, Insurance and Real estate 0.742
Service 0.620
︓variable cost / revenue ratio
φ
φ
Rφ=
Decrease of Revenue
2. Modification of Recovery Cost Ratio
A disaster brings about shorter replacement schedule for existing buildings and facilities.
time
Ordinary
Case1
Case2

Estimated Profit Decrease RatioGiven initial functionality(=1-initial drop ratio of
revenue), Profit Decrease Ratio for each industry is estimated.
IndustriesInitial Functionality
0%-20%
20%-40%
40%-60%
60%-80%
80%-100%
Manufacturing
Materials 7.06 2.81 1.99 1.08 0.187Processing and
assembly 7.37 2.93 2.08 1.13 0.196
Life related 7.13 2.83 2.01 1.09 0.189
Non-Manufacturing
Construction 7.14 2.79 2.41 1.15 0.0343Transportation 12.9 5.02 4.35 2.08 0.0618
Wholesale/Retail 3.89 1.52 1.32 0.629 0.0187Finance, Insurance and
Real estate 9.21 3.60 3.11 4.19 0.0443
Service 13.6 5.30 4.59 2.19 0.0652
Estimated Profit Decrease Ratio
Estimated economic loss is 3.418 trillion JP Yen (Furuhashi, et.al.2013)
Decrease of Profit
Recovery Cost
Retirementcost Total
Aomori 40,222 1,963 246 42,431Iwate 154,736 16,656 2,264 174,017Miyagi 355,694 50,089 9,703 415,186Akita 17,581 907 97 18,585
Yamagata 65,341 5,902 763 72,006Fukushima 449,909 45,259 7,828 502,996
Ibaragi 897,150 69,164 11,955 978,270Tochigi 484,427 35,410 5,423 525,260Chiba 642,059 40,475 6,414 688,949Total 3,107,120 265,826 45,054 3,418,000
Estimated impact(Ground motion)
(Million JPYen)
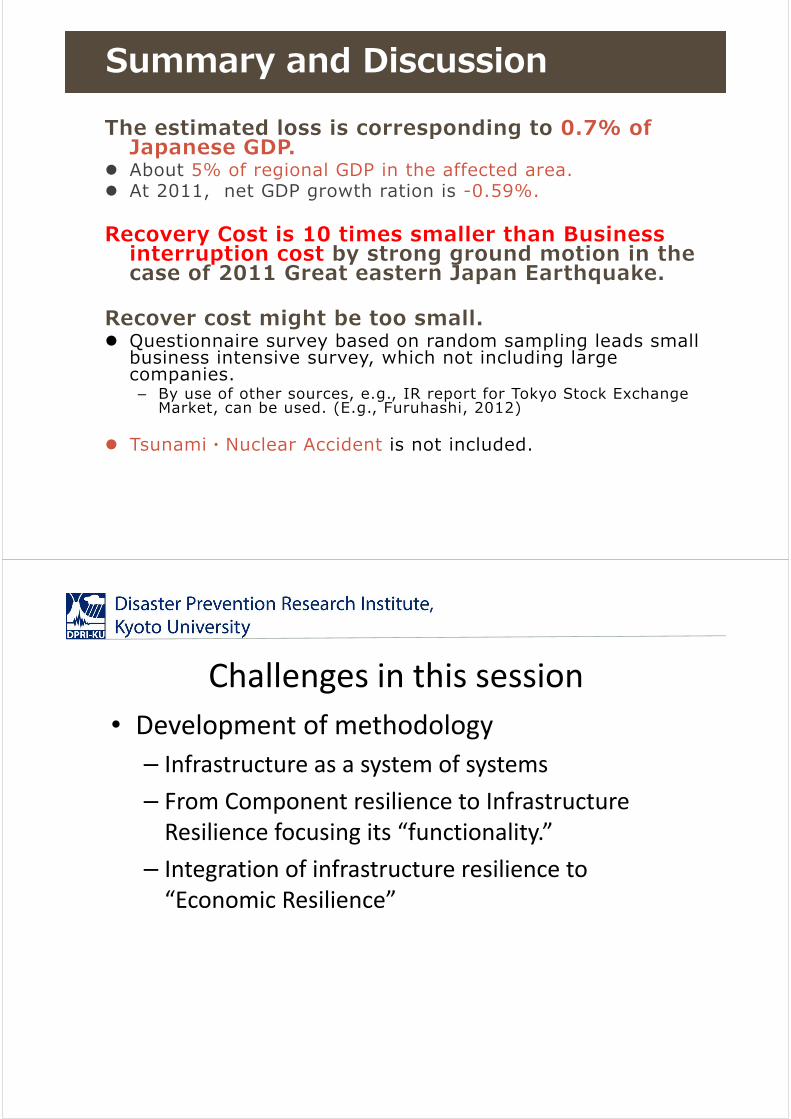
The estimated loss is corresponding to 0.7% of Japanese GDP.
About 5% of regional GDP in the affected area. At 2011, net GDP growth ration is -0.59%.
Recovery Cost is 10 times smaller than Business interruption cost by strong ground motion in the case of 2011 Great eastern Japan Earthquake.
Recover cost might be too small. Questionnaire survey based on random sampling leads small
business intensive survey, which not including large companies.
– By use of other sources, e.g., IR report for Tokyo Stock Exchange Market, can be used. (E.g., Furuhashi, 2012)
Tsunami・Nuclear Accident is not included.
Summary and Discussion
Challenges in this session
• Development of methodology
– Infrastructure as a system of systems
– From Component resilience to Infrastructure
Resilience focusing its “functionality.”
– Integration of infrastructure resilience to
“Economic Resilience”

Topics to be discussed セッションのねらいと進行方法
Roadmap of the session By Hirokazu Tatano
個別要素のレジリエンスから,システムのレジリエンスを構成するための方法と課題Understanding the infrastructure resilience framework: interactions between system
functionality, operability, service provision and economic activity
By Craig Davis
システムのシステムとしてみたインフラシステムのレジリエンス計量化の可能性と課題Challenges for assessing infrastructure resilience from the System of Systems perspective
By Nobuoto Nojima
ライフラインシステムの機能低下に伴う経済影響の計量化の方法と課題Challenges in economic impact analysis to reflect lifeline resilience
By Yoshio Kajitani
学術上・実務上の課題と取り組みの優先順位(総合討論)Discussion on academic and practical challenges and priority areas of collaboration
Discussion on challenges and priority
areas of collaboration
• What are the key challenges for us to tackle
with?
– Identify the most important challenges in each
areas
• What is the goal for us to set for the ASCE-
JSCE research collaboration in this field?