Embed Size (px)
DESCRIPTION
Roadmapping as a Planning Tool to Assess Strategies in a Rapidly Changing Market Bob McCarthy, Ph.D. Director, Strategic Market Planning Roche Molecular Biochemicals Phone: 317-576-7475, Fax: 317-576-7317 e mail: [email protected]. - PowerPoint PPT Presentation
Citation preview
r
Roadmapping as a Planning Tool to Assess Strategies in a Rapidly Changing Market
Bob McCarthy, Ph.D.
Director, Strategic Market Planning
Roche Molecular Biochemicals
Phone: 317-576-7475, Fax: 317-576-7317
e mail: [email protected]
r
“We used to think the future was in the stars. Now we know its in our genes.”
James Watson, Visions (1997)
“Commentators have sought to set the project in a historical context by likening to the..Manhattan Project and the moon shot...Rather, the Human Genome project aims to produce biology’s periodic table- not 100 elements, but 100,000 genes…. The challenge ahead is to turn the periodic table produced by the era of structural genomics into tools for the coming era of functional genomics”
Eric S. Lander, Science 274:536 (1996)
r
“We used to think the future was in the stars. Now we know its in our genes.”
James Watson, Visions (1997)
“There’s a gene rush on out there. In the next three years or so, the entire human genome will be known, and all the interesting targets claimed. Companies that don’t invest and secure rights to disease-modifying gene discoveries will be shut out.”
J Hartwig,WSJ 24 Sept. 1998

rScale of Human Genome Project
World 5.8 billion
peopleNucleus
23 chromosomes3 billion base
pairs6 billion basesUSA
270 million
Indiana5.8
million
1 Chromosome200 million bp
400 million bases
Marion County
Marion County800 K
Genes withinchromosome1.5 to 2000 K
bases
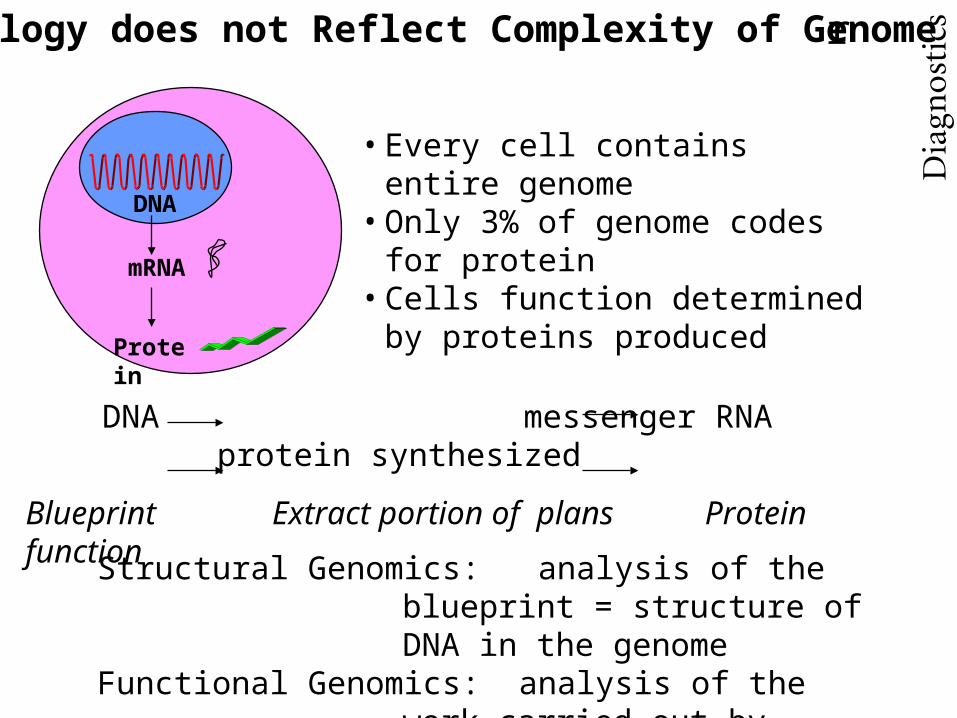
rAnalogy does not Reflect Complexity of Genome
Protein
DNA
mRNA
• Every cell contains entire genome
• Only 3% of genome codes for protein
• Cells function determined by proteins produced
DNA messenger RNA protein synthesized
Blueprint Extract portion of plans Protein function
Structural Genomics: analysis of the blueprint = structure of DNA in the genome
Functional Genomics: analysis of the work carried out by subcontractors = biology
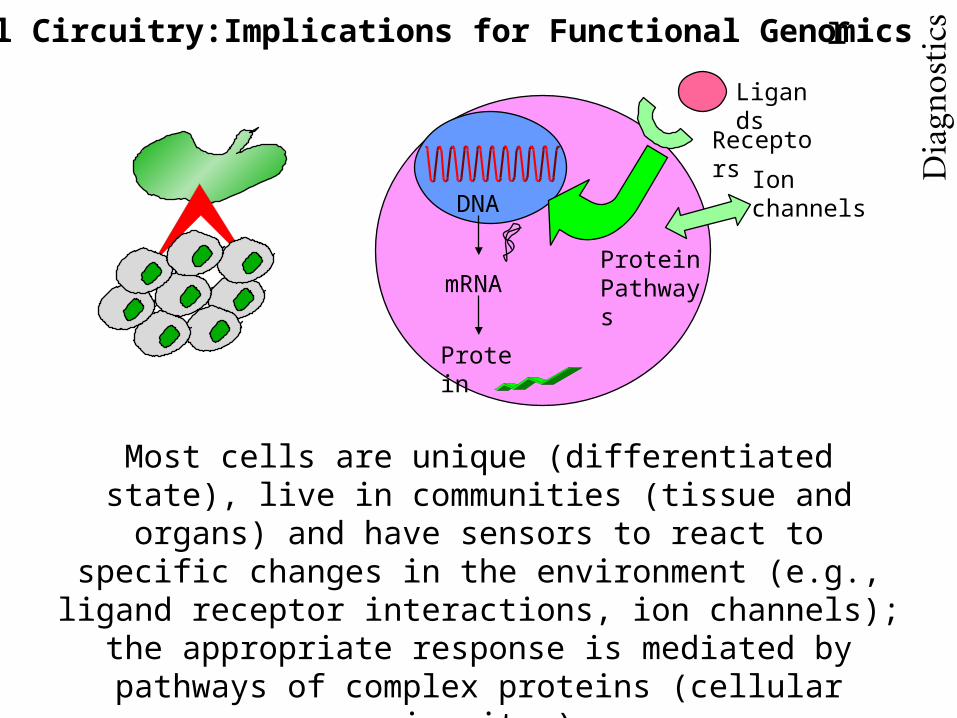
rCell Circuitry:Implications for Functional Genomics
Protein
DNA
mRNA
Ligands
Receptors Ion
channels
Protein Pathways
Most cells are unique (differentiated state), live in communities (tissue and organs) and have sensors to react to specific changes in the environment (e.g., ligand receptor interactions, ion channels);
the appropriate response is mediated by pathways of complex proteins (cellular circuitry)
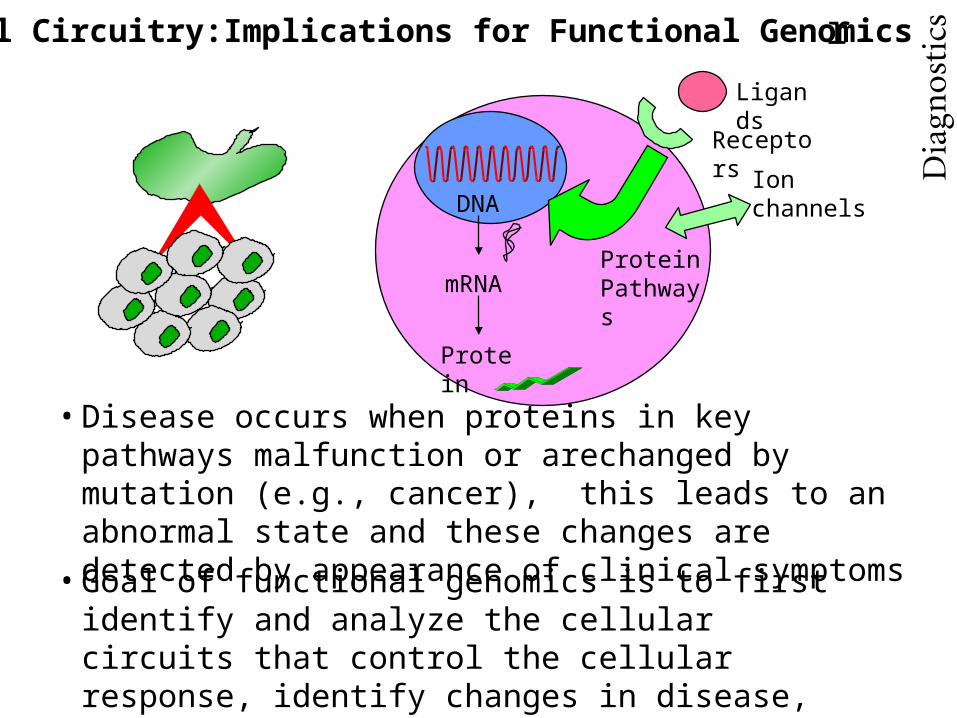
rCell Circuitry:Implications for Functional Genomics
Protein
DNA
mRNA
Ligands
Receptors Ion
channels
Protein Pathways
• Disease occurs when proteins in key pathways malfunction or arechanged by mutation (e.g., cancer), this leads to an abnormal state and these changes are detected by appearance of clinical symptoms
• Goal of functional genomics is to first identify and analyze the cellular circuits that control the cellular response, identify changes in disease, then manipulate this circuitry with drugs to control the disease

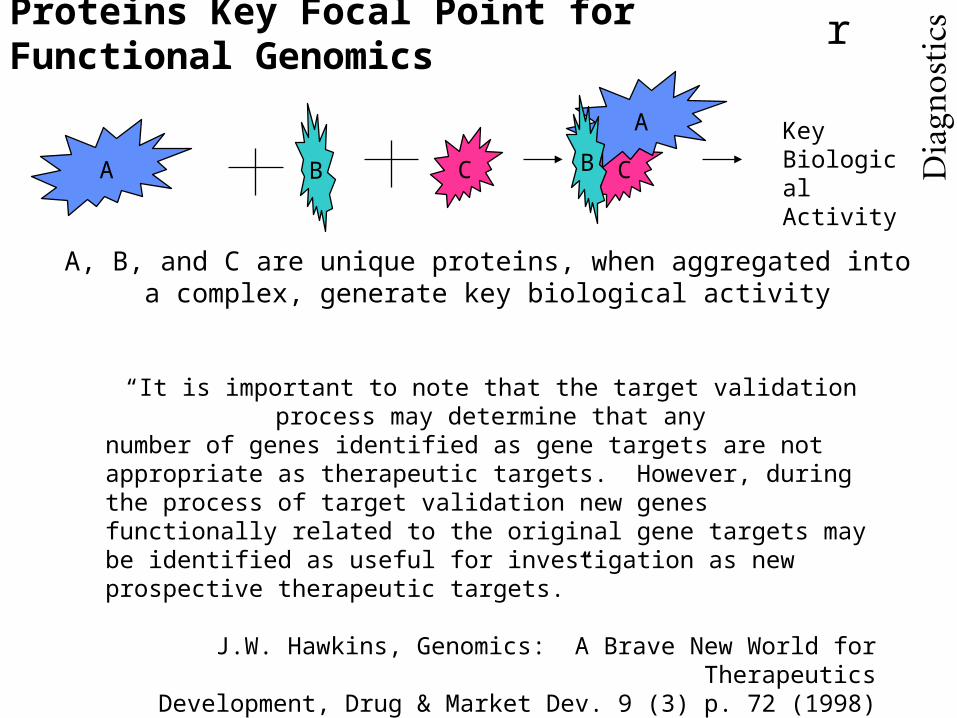
rProteins Key Focal Point for Functional Genomics
• Key proteins can be identified by an increasing number of methods• The ultimate goal in genomic biology is to identify all the proteins that participate in key biological pathways
A B C C
A
BKey Biological Activity
A, B, and C are unique proteins, when aggregated into a complex, generate key biological activity
rProteins Key Focal Point for Functional Genomics
A B C C
A
BKey Biological Activity
A, B, and C are unique proteins, when aggregated into a complex, generate key biological activity
“It is important to note that the target validation process may determine that anynumber of genes identified as gene targets are not appropriate as therapeutic targets. However, during the process of target validation new genes functionally related to the original gene targets may be identified as useful for investigation as new prospective therapeutic targets.”
J.W. Hawkins, Genomics: A Brave New World for Therapeutics Development, Drug & Market Dev. 9 (3) p. 72 (1998)
r
E. coli S.
cerevisiae
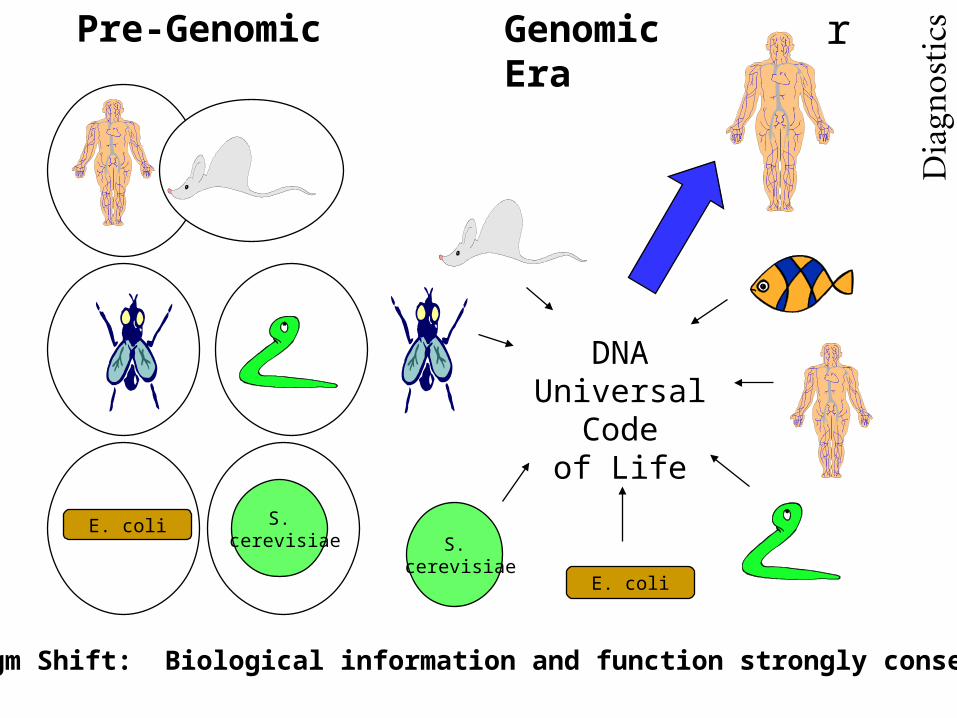
Pre-Genomic
E. coli
S. cerevisiae
Genomic Era
DNAUniversal Code
of Life
Paradigm Shift: Biological information and function strongly conserved

r
1970 1975 1980 1985 1990 1995 2000 2005
Regulatory
Technology/Milestones
Funding/CommericalDevelopment
Asi
lom
ar C
onf.
Gui
deli
nes
rela
xed
Gui
deli
nes
rela
xed
Gen
e T
hera
py
Gud
ieli
nes
DN
A S
V40
seq
5 K
b
DN
A s
eq. I
mpr
oved
Som
atos
tati
n pr
oduc
ed
Lam
bda
DN
A s
eq 4
8 K
b
PC
R, p
hage
dis
play
Aut
omat
ed D
NA
seq
.
Tw
o hy
brid
sys
tem
in y
east
Com
bina
tori
al c
hem
istr
y
Yea
set c
hrom
o. 3
3.
2 M
b
DN
A M
icro
chip
, H
. Inf
l 1.8
M
S c
erev
. Seq
. 12
Mb.
icro
rg. S
eq
6 m
icro
rg. s
eq
PE
/Ven
tner
targ
et f
or H
GP
NIH
targ
et f
or H
GP
Gen
ente
ch f
rom
ed
Hyb
rite
ch f
orm
ed
Gen
ente
ch I
PO
Hum
ulin
mar
kete
d
HG
P in
itia
ted
SK
B-H
GS
all
ianc
e
Pha
rmac
ogen
omic
s
Abb
ott-
Gen
set
PE
/Ven
tner
col
labo
rati
on
Pace for Development is Accelerating

r
NSAID’s
H-2 AntgonistsBeta blockers
Lipid LowerersACE inhibitors
Biotech Drugs
Chronic degenernativedisease associatedwith aging, inflammation, & cancer
ReceptorsEnzymes
GeneticEngineering
Cell pharmacology/molecular biology
New Therapeutic Cycles
Innovations
500 drug targets
3000-10,000 drug targets
0
10
20
30
40
50
60
70
80
90
1970 1975 1980 1985 1990 1995 2000 2005 2010 2015 2020
U.S. Sales $ billions
0.0%
5.0%
10.0%
15.0%
20.0%
25.0%
30.0%
35.0%
40.0%
45.0%
50.0%
R&D as % Sales
Pharmaceutical Growth Knowledge
Dependent

rChanges in the Pharmaceutical Industry
Big Pharma
Vertical industry 1950-1970’s
• Expertise kept in house
• Drug development based on serendipity
Biotech era 1980’s
• Collaborations established to protect existing markets and expand into new markets
• Drug development move towards applying fruits of biotechnology
Genomic era 1990’s
• Collaborations essential to gain knowledge about key biological pathways
• Drug development restructured to gain knowledge faster than competition

rChanges in the Pharmaceutical Industry
Animal/clinical studiesTesting drug librariesRegulat. & reimbursementSales and marketing
Assemblers
GeneHunters
TestingServices
Combinat.Chem.
I.d. biological targetsProvide chem. librariesToxicology testing
Tier 1
Collaborationsbased on focus
& speed
RBReagent
Anal.Instrum.
RBReag/Inst.
Chem.Company
Special reagent/instrum.Platforms increase thruput
Tier 2
Big Pharma

rAndy Grove’s Strategic Inflection Point
InflectionPoint
BusinessDeclines
Business goes tonew heights
“Let’s not mince words: A strategic inflection point can be deadly when unattended to. Companies that begin a decline as a result of its changesrarely recover their previous greatness.” (p. 4, Only the Paranoid Survive) 1993 2010?
Genomic Era

rComposition of Roadmap Teams
Roadmap Working
TeamInternal
Recommend & approve experts
Review format of surveys
Review raw & condensed data
Input conclusions into roadmap
Functions
R&D, Marketing (central)Team Composition
German & U.S. Biounit (country)
Molecular biologists
Proteomics experts
Developmental biologistsCell biologists
Bioinformatics experts
Team Composition
Respond to surveysReview drafts of roadmapParticipate in discussion groupsProvide updated knowledge
Functions
Roadmap Expert GroupInternal-External.
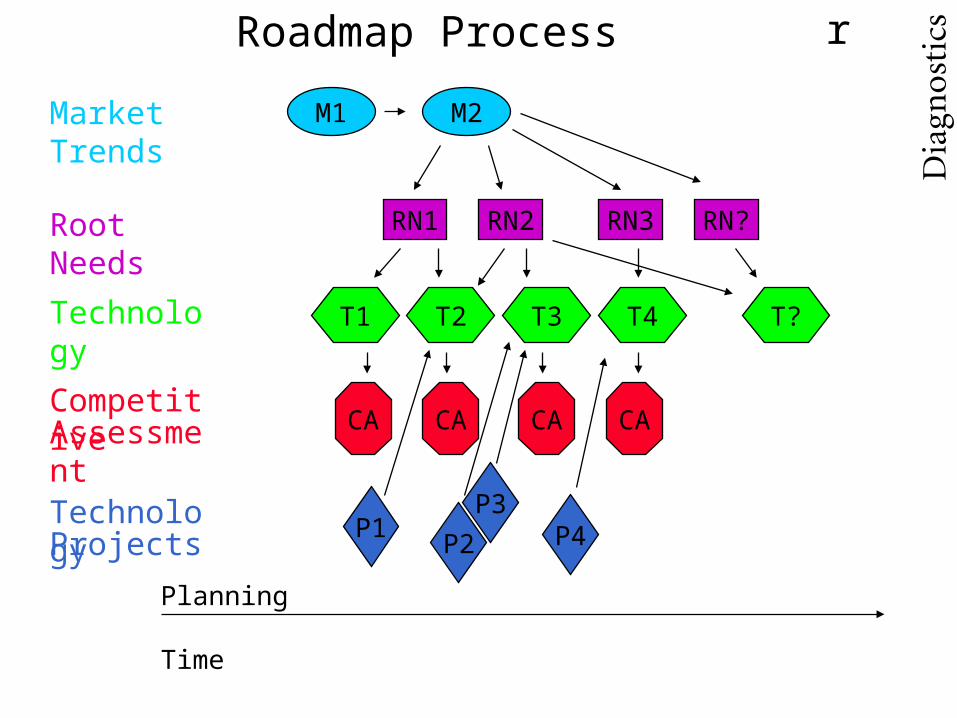
rRoadmap Process
Market Trends M1 M2
Planning Time Years
RN1 RN2 RN?RN3Root Needs
T1 T2 T3 T4 T?Technology
CA CA CA CACompetitiveAssessment
P1P2
P3P4
TechnologyProjects

r
• Biological information restricted to specific applications/model systems
• Biological studies based on phenomenology
• Shotgun mutation methods screened for gross observable changes
• Ultimate goal is to understand function of biological molecules in their proper context
• Assembling biological information infrastructure, data mining to focus on biological and/or disease models
• Developing integrated knowledge of biological pathways and networks in context of cell and organism
• Performing detailed structure-function studies in context of biological disease model
• Goal is to understand differential gene expression in disease states or biological model systems
• Saturation mutagenesis to evaluate function of specific molecules
M1 M2

r
⟨ Manipulate and access relevant biological datajust in time
⟨ Rapid universal system to detect modificationof macromolecules
⟨ Detect changes in biological activity within apathway
⟨ Protein expression systems which allow rapidproduction of recombinant protein withappropriate modifications
⟨ Improved methods to detect differential geneexpression
RN1
RN2
RN4
RN3
RN5
RootNeeds
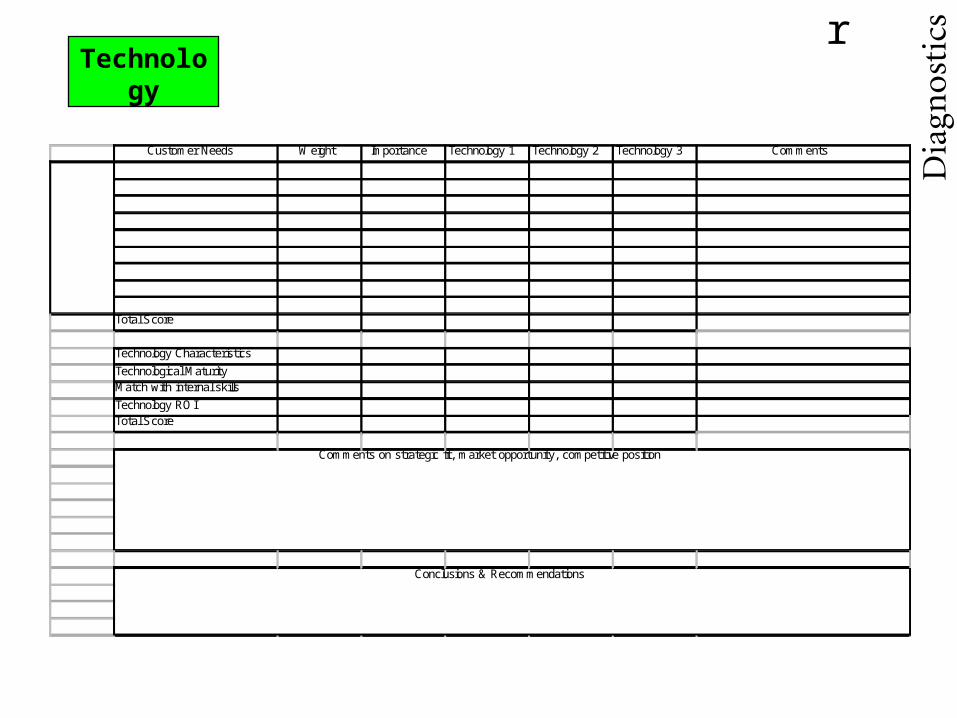
rTechnol
ogy
Customer Needs Weight Importance Technology 1 Technology 2 Technology 3 Comments
Total Score
Technology Characteristics
Technological MaturityMatch with internal skills
Technology ROITotal Score
Protein Expression
Systems
Comments on strategic fit, market opportunity, competitive position
Conclusions & Recommendations
r
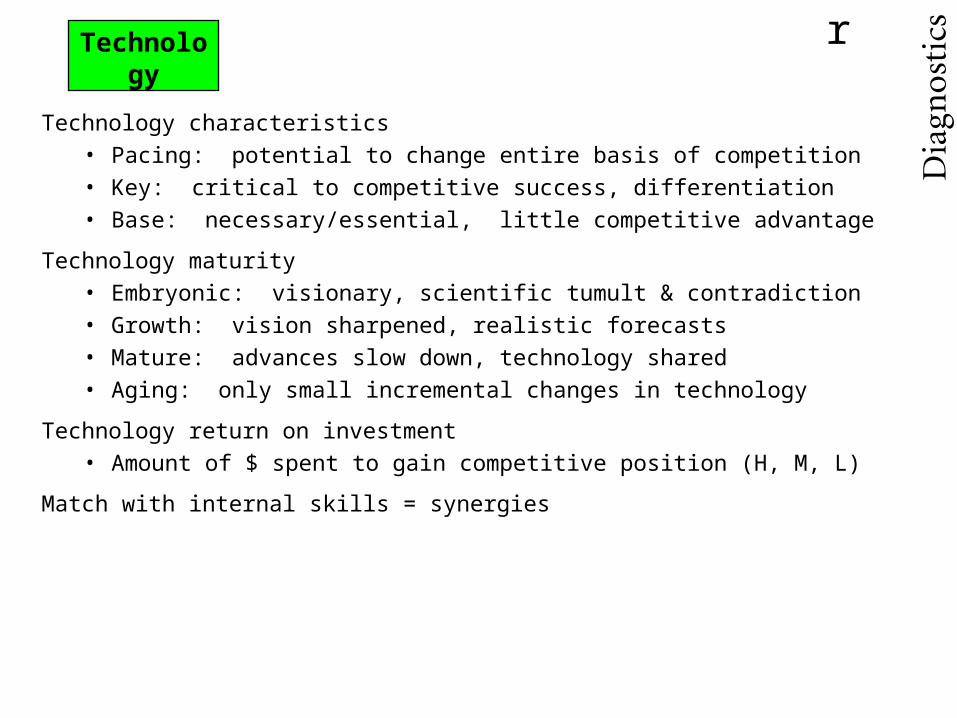
Technology characteristics• Pacing: potential to change entire basis of competition• Key: critical to competitive success, differentiation• Base: necessary/essential, little competitive advantage
Technology maturity• Embryonic: visionary, scientific tumult & contradiction• Growth: vision sharpened, realistic forecasts• Mature: advances slow down, technology shared • Aging: only small incremental changes in technology
Technology return on investment• Amount of $ spent to gain competitive position (H, M, L)
Match with internal skills = synergies
Technology

r
Description & state of technology Characteristics, maturity, ROI, internal synergies
Rationale for technology investment: gaps, unmet needs, etc...
Competitive advantage: ability to influence environment
Preparation of Technology Brief, 1CompetitiveAssess.
DominantDominant
StrongStrong
FavorableFavorable
TenableTenable
WeakWeak
Declining quality of technical output, short term/firefighting
Powerful leader by technology commitment & reputation (dominant design?), others always catching up
Able to set take independent action, set new technological direction; committed to support development and distinguished from competitors by this action
Can sustain technological competitiveness and can exploit technology to improve position, not leader but focus on niche
Catch up mode, unable to set independent course, can maintain competitiveness but weak at differentiation
r
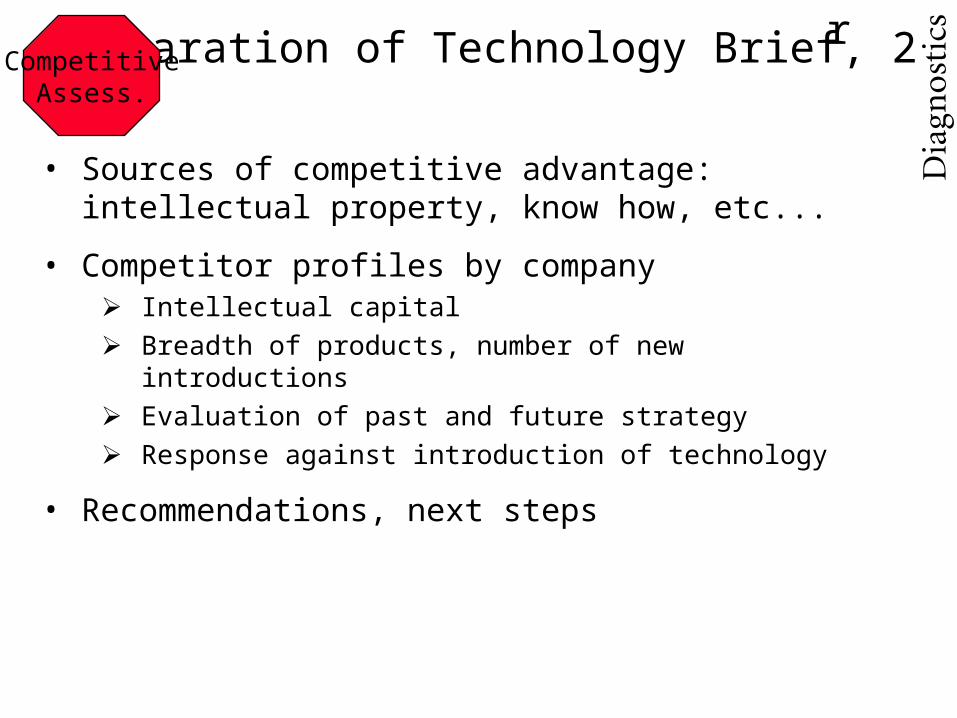
• Sources of competitive advantage: intellectual property, know how, etc...
• Competitor profiles by company Intellectual capital
Breadth of products, number of new introductions
Evaluation of past and future strategy
Response against introduction of technology
• Recommendations, next steps
Preparation of Technology Brief, 2CompetitiveAssess.

r
• Fit with business strategy (excellent to poor)
• Inventive merit, strategic importance to business (high to low) Improves competitive position?
Applicable to more than one business?
Provides foundation for new business?
• Reward: NPV’s: worst, base, and best case
• Competitive impact of technology Technology characteristics and maturity
• Uncertainty Probability of technical success (0.1-0.9)
Probability of commercial success (0.1-0.9)
Probability of overall success (0.1-0.9)
Project Proposal for InvestmentProjects
r
• Implementation plan Proposal for resources and competencies required to complete the
project Propose timing for technology reviews: agreement on specifics that
drives the review (e.g, time, dollars, achievements, etc…)
• Risk R&D costs to first milestone and costs to completion (range if
appropriate)
Time to first milestone and to completion (range if appropriate)
Capital and/or marketing investment required to exploit technical success (range if appropriate)
Project Proposal for Investment, 2Projects
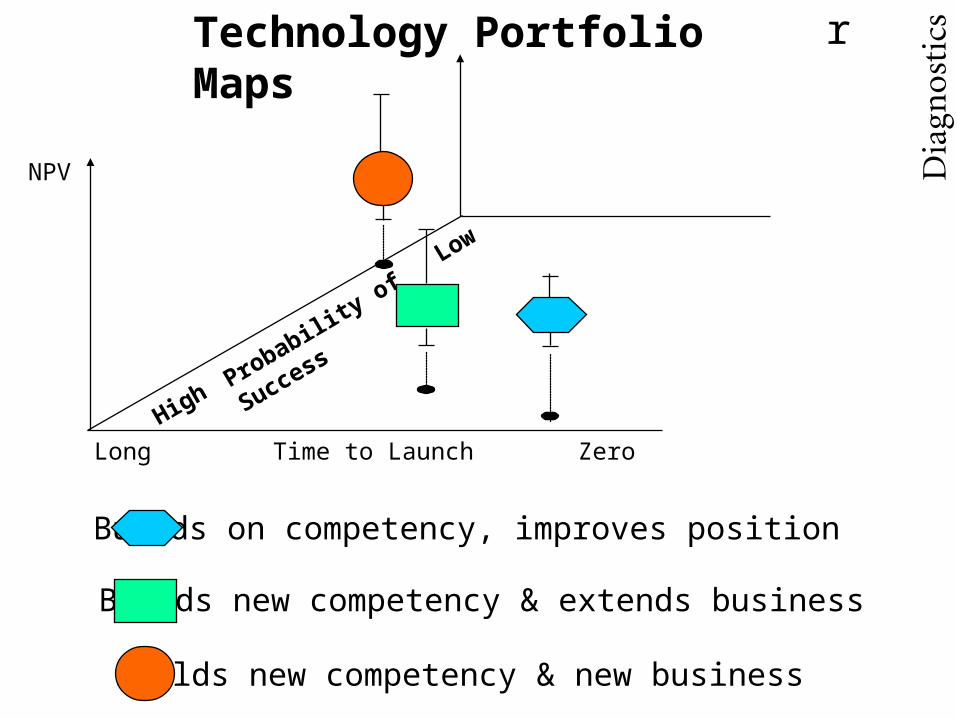
rTechnology Portfolio Maps
NPV
Time to Launch
High
Zero
Low
Probability of S
uccess
Builds on competency, improves position
Builds new competency & extends business
Builds new competency & new business
Long
rBenefits of Roadmaps
• Cross-functional understanding of strategic issues
• Sensitization to following
• Technology trends
• Gaps in technology in meeting needs
• Competitive position for technology
• Easily understood process to communicate issues regarding allocation of resources
• Proposal that includes management of projects through structured technology review
• Learning that can be applied when evaluating future technology opportunities