Embed Size (px)
Citation preview

Annual ReportRoads and Maritime Services2017–18 • Volume 2

INDEPENDENT AUDITOR’S REPORT Roads and Maritime Services
To Members of the New South Wales Parliament
Opinion I have audited the accompanying financial statements of Roads and Maritime Services (RMS), which comprise the Statement of Comprehensive Income for the year ended 30 June 2018, the Statement of Financial Position as at 30 June 2018, the Statement of Changes in Equity and the Statement of Cash Flows for the year then ended, notes comprising a Statement of Significant Accounting Policies and other explanatory information.
In my opinion, the financial statements:
• give a true and fair view of the financial position of RMS as at 30 June 2018, and of its financial performance and its cash flows for the year then ended in accordance with Australian Accounting Standards
• are in accordance with section 41B of the Public Finance and Audit Act 1983 (PF&A Act) and the Public Finance and Audit Regulation 2015.
My opinion should be read in conjunction with the rest of this report.
Basis for Opinion I conducted my audit in accordance with Australian Auditing Standards. My responsibilities under the standards are described in the ‘Auditor’s Responsibilities for the Audit of the Financial Statements’ section of my report.
I am independent of RMS in accordance with the requirements of the:
• Australian Auditing Standards • Accounting Professional and Ethical Standards Board’s APES 110 ‘Code of Ethics for
Professional Accountants’ (APES 110).
I have fulfilled my other ethical responsibilities in accordance with APES 110.
Parliament promotes independence by ensuring the Auditor-General and the Audit Office of New South Wales are not compromised in their roles by:
• providing that only Parliament, and not the executive government, can remove an Auditor-General
• mandating the Auditor-General as auditor of public sector agencies • precluding the Auditor-General from providing non-audit services.
I believe the audit evidence I have obtained is sufficient and appropriate to provide a basis for my audit opinion.

Other Information Other information comprises the information included in RMS’s annual report for the year ended 30 June 2018, other than the financial statements and my Independent Auditor’s Report thereon. The Chief Executive of RMS is responsible for the other information. At the date of this Independent Auditor’s Report, the other information I have received comprises the Statement by the Chief Executive of Road and Maritime Services on the adoption of the financial statements for the year ended 30 June 2018.
My opinion on the financial statements does not cover the other information. Accordingly, I do not express any form of assurance conclusion on the other information.
In connection with my audit of the financial statements, my responsibility is to read the other information and, in doing so, consider whether the other information is materially inconsistent with the financial statements or my knowledge obtained in the audit, or otherwise appears to be materially misstated.
If, based on the work I have performed, I conclude there is a material misstatement of the other information, I must report that fact.
I have nothing to report in this regard.
The Chief Executive’s Responsibilities for the Financial Statements The Chief Executive is responsible for the preparation and fair presentation of the financial statements in accordance with Australian Accounting Standards and the PF&A Act, and for such internal control as the Chief Executive determines is necessary to enable the preparation and fair presentation of the financial statements that are free from material misstatement, whether due to fraud or error.
In preparing the financial statements, the Chief Executive is responsible for assessing RMS’s ability to continue as a going concern, disclosing as applicable, matters related to going concern and using the going concern basis of accounting except where RMS will be dissolved by an Act of Parliament or otherwise cease operations.
Auditor’s Responsibilities for the Audit of the Financial Statements My objectives are to:
• obtain reasonable assurance about whether the financial statements as a whole are free from material misstatement, whether due to fraud or error
• issue an Independent Auditor’s Report including my opinion.
Reasonable assurance is a high level of assurance, but does not guarantee an audit conducted in accordance with Australian Auditing Standards will always detect material misstatements. Misstatements can arise from fraud or error. Misstatements are considered material if, individually or in aggregate, they could reasonably be expected to influence the economic decisions users take based on the financial statements.
A description of my responsibilities for the audit of the financial statements is located at the Auditing and Assurance Standards Board website at: www.auasb.gov.au/auditors_responsibilities/ar4.pdf. The description forms part of my auditor’s report.

My opinion does not provide assurance:
• that RMS carried out its activities effectively, efficiently and economically • about the assumptions used in formulating the budget figures disclosed in the financial
statements • about the security and controls over the electronic publication of the audited financial
statements on any website where they may be presented • about any other information which may have been hyperlinked to/from the financial statements.
Weini Liao Director, Financial Audit
14 September 2018 SYDNEY

Roads and Maritime Services
Annual Financial Statements
for the year ended 30 June 2018

TABLE OF CONTENTS
2
Statement by the Chief Executive ............................................................................................................................................................... 3
Statement of comprehensive income ......................................................................................................................................................... 4
Statement of financial position ..................................................................................................................................................................... 5
Statement of changes in equity ................................................................................................................................................................... 6
Statement of cash flows ................................................................................................................................................................................ 7
1. Summary of significant accounting policies ................................................................................................................................ 8
2. Expenses excluding losses.......................................................................................................................................................... 15
3. Revenue.......................................................................................................................................................................................... 19
4. Gain/(loss) on disposal ................................................................................................................................................................. 23
5. Other gains/(losses) ...................................................................................................................................................................... 23
6. Write-off/down of land & buildings and infrastructure assets ................................................................................................. 24
7. Program Group Statements for the year ended 30 June 2018.............................................................................................. 25
8. Cash and cash equivalents.......................................................................................................................................................... 29
9. Receivables .................................................................................................................................................................................... 30
10. Financial assets at fair value ....................................................................................................................................................... 31
11. Other financial assets ................................................................................................................................................................... 32
12. Property, plant and equipment .................................................................................................................................................... 33
13. Non-current assets - intangibles assets and other .................................................................................................................. 49
14. Non-current assets held for sale ................................................................................................................................................. 57
15. Fair value measurement of non-financial assets...................................................................................................................... 58
16. Restricted Assets........................................................................................................................................................................... 63
17. Payables ......................................................................................................................................................................................... 64
18. Borrowings...................................................................................................................................................................................... 65
19. Provisions ....................................................................................................................................................................................... 66
20. Other liabilities ............................................................................................................................................................................... 67
21. Increase in net assets from equity transfers ............................................................................................................................. 69
22. Commitments for expenditure ..................................................................................................................................................... 70
23. Contingent assets and contingent liabilities .............................................................................................................................. 72
24. Budget Review............................................................................................................................................................................... 72
25. Reconciliation of cash flows from operating activities to net result ....................................................................................... 75
26. Non-cash financing and investing activities .............................................................................................................................. 75
27. Administered income and expenses .......................................................................................................................................... 76
28. Administered assets and liabilities.............................................................................................................................................. 76
29. Native title ....................................................................................................................................................................................... 77
30. Financial instruments .................................................................................................................................................................... 77
31. Related Party Disclosures............................................................................................................................................................ 85
32. Events after the reporting period ................................................................................................................................................ 85

Roads and Maritime Services Statement by the Chief Executive for the year ended 30 June 2018
Pursuant to Section 41C (1B) and (10) of the Public Finance and Audit Act 1983, we declare that in our opinion:
1. The accompanying financial statements and notes thereto exhibit a true and fair view of Roads and Maritime
Services financial position as at 30 June 2018 and financial performance for the year ended 30 June 2018
2. The statements have been prepared in accordance with the provisions of applicable Accounting Standards (which include Australian Accounting Interpretations), the Public Finance and Audit Act 1983, the Public Finance and Audit Regulation 2015, and the Financial Reporting Directions mandated by the Treasurer.
Further we are not aware of any circumstances which would render any particulars included in the financial statements to be misleading or inaccurate.
19v\9\9\-0/kAz./\1
Ken Kanofski Fiona Trussell
Chief Executive Chief Financial Officer
Vt September 2018 NI September 2018

Roads and Maritime Services Statement of comprehensive income for the year ended 30 June 2018
4
Actual Budget Actual
2018 2018 2017 Notes $'000 $'000 $'000 Expenses excluding losses
Operating expenses
- Personnel services expenses 2(a) 413,258 534,414 435,300 - Other operating expenses 2(b) 1,003,721 828,893 710,790 - Maintenance 2(c) 424,093 477,111 474,545 Depreciation and amortisation 2(d) 1,632,294 2,050,932 1,638,951 Grants and subsidies 2(e) 683,273 431,352 440,591 Finance costs 2(f) 25,635 27,308 36,172 Total expenses excluding losses 4,182,274 4,350,010 3,736,349 Revenue
Sale of goods and services 3(a) 690,683 569,156 631,347 Personnel service revenue 1,778 - 1,126 Investment revenue 3(b) 40,788 13,540 38,235 Retained taxes, fees and fines 3(c) 71,814 - 70,660 Operating grant received from Transport for NSW (TfNSW) 3(d) 1,568,356 1,509,657 1,282,828 Capital grant received from TfNSW 3(d) 4,304,181 6,393,662 4,264,278 Other grants and contributions 3(e) 1,021,716 131,134 116,557 Other income 3(f) 394,464 455,095 336,380 Total revenue 8,093,780 9,072,244 6,741,411 Gain/(losses) on disposal of property, plant and equipment 4 2,894 2,000 127,940 Other gains/(losses) 5 (594,960) (226,725) (633,613) Net result 3,319,440 4,497,509 2,499,389 Other comprehensive income Items that will not be reclassified to net result Net increase/(decrease) in property, plant and equipment revaluation surplus 12 7,665,386 2,681,203 929,538
Total other comprehensive income 7,665,386 2,681,203 929,538 Total comprehensive income 10,984,826 7,178,712 3,428,927 Statement of comprehensive income The accompanying notes form part of these financial statements.

Roads and Maritime Services Statement of financial position as at 30 June 2018
5
Actual Budget Actual
2018 2018 2017
Notes $'000 $'000 $'000 ASSETS
Current assets
Cash and cash equivalents 8 886,839 618,551 748,652 Receivables 9 580,309 352,046 512,597 Inventories 4,762 6,341 5,676 Financial assets at fair value 10 111,565 102,439 104,857 Other financial assets (at amortised cost) 11 146,887 - - 1,730,362 1,079,377 1,371,782 Non-current assets classified as Held for Sale 14 1,121 25,000 275 Total current assets 1,731,483 1,104,377 1,372,057 Non-current assets
Receivables 9 1,426,816 689,252 396,659 Other financial assets (at amortised cost) 11 222,992 377,662 390,532 Property plant & equipment
- Land and buildings 12(a) 3,660,886 3,906,814 3,630,252 - Plant and equipment 12(b) 105,371 89,020 110,389 - Infrastructure systems 12(c) 88,383,377 85,229,749 78,803,046 Total property, plant and equipment 92,149,634 89,225,583 82,543,687 Private sector provided infrastructure 13(a) 2,075,417 2,091,184 1,834,908 Intangible assets 13(b) 153,796 133,119 169,166 Total non-current assets 96,028,655 92,516,800 85,334,952 Total assets 97,760,138 93,621,177 86,707,009 LIABILITIES
Current liabilities
Payables 17 1,337,375 983,314 1,238,319 Borrowings 18 60,558 60,558 53,680 Provisions 19 16,500 7,338 7,108 Other 20 292,131 207,252 243,579 Total current liabilities 1,706,564 1,258,462 1,542,686 Non-current liabilities
Payables 17 9,160 7,106 15,092 Borrowings 18 244,575 244,575 305,133 Provisions 19 26,103 11,120 10,605 Other 20 634,617 641,182 652,121 Total non-current liabilities 914,455 903,983 982,951 Total liabilities 2,621,019 2,162,445 2,525,637 Net assets 95,139,119 91,458,732 84,181,372 EQUITY
Accumulated funds 75,493,532 76,734,346 72,146,225 Reserves 19,645,587 14,724,386 12,035,147 Total equity 95,139,119 91,458,732 84,181,372 Statement of financial position The accompanying notes form part of these financial statements.

Roads and Maritime Services Statement of changes in equity for the year ended 30 June 2018
6
Accumulated
funds Asset
revaluation surplus
Total equity
Notes $ '000 $ '000 $ '000 Balance at 1 July 2017 72,146,225 12,035,147 84,181,372 Net result for the year 3,319,440 - 3,319,440 Other comprehensive income
Net increase/(decrease) in property, plant and equipment revaluation surplus
12 & 13(a) - 7,665,386 7,665,386
Total other comprehensive income for the year - 7,665,386 7,665,386 Total comprehensive income for the year 3,319,440 7,665,386 10,984,826 Transfers within equity
Asset revaluation reserve balance transferred to accumulated funds on disposal of assets 54,946 (54,946) -
Transactions with owners in their capacity as owners
Increase/(decrease) in net assets from equity transfers 21 (27,079) - (27,079) Balance at 30 June 2018 75,493,532 19,645,587 95,139,119 Balance at 1 July 2016 69,399,065 11,310,315 80,709,380 Net result for the year 2,499,389 - 2,499,389 Other comprehensive income
Net increase/(decrease) in property, plant and equipment revaluation surplus 12 - 929,538 929,538
Total other comprehensive income for the year - 929,538 929,538 Total comprehensive income for the year 2,499,389 929,538 3,428,927 Transfers within equity
Asset revaluation reserve balance transferred to accumulated funds on disposal of assets 204,706 (204,706) -
Transactions with owners in their capacity as owners
Increase/(decrease) in net assets from equity transfers 21 43,065 - 43,065 Balance at 30 June 2017 72,146,225 12,035,147 84,181,372 Statement of changes in equity The accompanying notes form part of these financial statements.

Roads and Maritime Services Statement of cash flows for the year ended 30 June 2018
7
Actual Budget Actual
2018 2018 2017
Notes $'000 $'000 $'000 Cash flows from operating activities
Payments
Personnel services and employee related
(387,476) (517,408) (463,527) Grants and subsidies
(483,910) (360,530) (399,912)
Finance costs
(25,583) (27,308) (29,390) Other
(2,122,898) (2,419,647) (1,865,262)
Total payments (3,019,867) (3,324,893) (2,758,091) Receipts
Sale of goods and services
790,675 668,664 799,865
Retained taxes, fees and fines
71,813 - 70,660 Interest received
9,509 3,008 5,363
Other grants and contributions
1,021,717 131,134 115,689 Other
584,392 868,191 498,650
Operating grants received from TfNSW
1,568,357 1,509,657 1,282,828 Capital grants received from TfNSW
4,226,614 6,232,544 4,176,127
Total receipts 8,273,077 9,413,198 6,949,182 Net cash flows from operating activities 25 5,253,210 6,088,305 4,191,091 Cash flows from investing activities
Proceeds from sale of land and buildings, plant and equipment and infrastructure systems
114,949 109,192 110,986
Purchases of land and buildings, plant and equipment and infrastructure systems
(5,212,584) (6,026,915) (4,124,251)
Other
45,000 35,000 - Net cash flows from investing activities (5,052,635) (5,882,723) (4,013,265) Cash flows from financing activities
Payment of finance lease liabilities 18 (53,680) (54,510) (47,117) Net cash flows from financing activities (53,680) (54,510) (47,117) Net increase / (decrease) in cash 146,895 151,072 130,709 Opening cash and cash equivalents 8 748,652 469,970 617,943 Cash and cash equivalents transferred (out)/in as a result of administrative restructure 21 (8,708) - -
Reclassification of cash equivalents
- (2,491) - Closing cash and cash equivalents 8 886,839 618,551 748,652 Statement of cash flows The Budget statement of cash flows was not reported to parliament in 2017-18 Budget Paper No.3 and instead published online at
www.budget.nsw.gov.au
The accompanying notes form part of these financial statements.
Roads and Maritime Services
Notes to the financial statements
for the year ended 30 June 2018
1. Summary of significant accounting policies
(a) Reporting entity
Roads and Maritime Services (RMS) is a NSW government entity and is controlled by the State of New South Wales, which is the ultimate parent. RMS is a not-for-profit entity (as profit is not its principal objective) and it has no cash generating units. The reporting entity is consolidated as part of the NSW Total State Sector Accounts.
The financial statements for the year ended 30 June 2018 have been authorised for issue by the Chief Executive of RMS on \\\ September 2018, the date when the accompanying statement under s.41C (1C) of the Public Finance and Audit Act 1983
was signed.
(b) Basis of preparation
The RMS financial statements are general purpose financial statements which have been prepared on an accruals basis and in accordance with: • Applicable Australian Accounting Standards (including Australian Accounting Interpretations).• the requirements of the Public Finance and Audit Act 1983 and Public Finance and Audit Regulation 2015 and• the Financial Reporting Directions mandated by the Treasurer.
Fair value
Property, plant and equipment, financial assets at 'fair value through profit or loss' and available for sale are measured at fair value. Non-current assets held for sale are valued at the lower of carrying amount and fair value less costs to sell.
Historical cost convention
Other financial statement items are prepared in accordance with the historical cost convention except where specified otherwise.
Estimates
Judgements, key assumptions and estimates made by management about carrying values of assets and liabilities are disclosed in the relevant notes to the financial statements. Refer to note 1 (k) for a summary of critical accounting estimates, judgements and assumptions determined when preparing the financial statements.
Rounding of amounts
Unless otherwise stated, all amounts are rounded to the nearest one thousand dollars ($'000) and are expressed in Australian dollars.
(c) Statement of compliance
The financial statements and notes comply with Australian Accounting Standards, which include Australian Accounting Interpretations.
(d) Accounting for the Goods and Services Tax (GST)
Income, expenses and assets are recognised net of the amount of GST, except that the: • Amount of GST incurred by RMS as a purchaser that is not recoverable from the Australian Taxation Office {ATO)
is recognised as part of an asset's cost of acquisition or as part of an item of expense.• Receivables, payables, accruals and commitments are stated with the amount of GST included.• Cash flows are included in the Statement of Cash Flows on a gross basis. However, the GST components of cash
flows arising from investing and financing activities which is recoverable from, or payable to, the ATO are classifiedas operating cash flows.
---- --- ______________________________ _J8L__

Roads and Maritime Services Notes to the financial statements for the year ended 30 June 2018
1. Summary of significant accounting policies (Continued)
9
(e) Comparative information Except when an Australian Accounting Standard permits or requires otherwise, comparative information is presented in respect of the previous period for all amounts reported in the financial statements. (f) Changes in accounting policy, including new or revised Australian Accounting Standards
(i) Effective for the first time in 2017-18
The accounting policies applied in 2017-18 are consistent with those of the previous financial year except as a result of the following new or revised Australian Accounting Standards that have been applied for the first time in 2017-18. The impact of these Standards in the period of initial application is set out below:
Standard Summary of key requirements of new/revised
standard Impact on Reporting Entity’s 2017-18 financial statements
AASB 2016-2 Amendments to Australian Accounting Standards – Disclosure Initiative: Amendments to AASB 107
The amendments to AASB 107 Statement of Cash Flows are part of the IASB’s Disclosure Initiative and help users of financial statements better understand changes in an entity’s debt. The amendments require entities to provide disclosures about changes in their liabilities arising from financing activities, including both changes arising from cash flows and non-cash changes (such as foreign exchange gains or losses).
An additional disclosure has been included in Note 18 to detail the change in liabilities arising from financing activities under the amended AASB 107. The disclosure is limited to RMS’ finance lease liability.
AASB 2016-7 Amendments to Australian Accounting Standards – Deferral of AASB 15 for Not-for-Profit Entities
This Standard amends the mandatory effective date (application date) of AASB 15 for not-for-profit entities so that AASB 15 is required to be applied by such entities for annual reporting periods beginning on or after 1 January 2019 instead of 1 January 2018.
The impact of this standard, as mandated by NSW Treasury is to defer the application date of AASB 15 for not-for-profit entities to annual reporting periods beginning on or after 1 January 2019. Accordingly, RMS will apply AASB 15 from 1 July 2019.
(ii) Issued but not yet effective
NSW public sector entities are not permitted to early adopt new Australian Accounting Standards, unless Treasury determines otherwise.
The following new Australian Accounting Standards have not been applied, and are not yet effective and the entity’s assessment of the impact of these new standards in the period of initial application is set out below:
Standard Summary of key requirements/changes Applicable to annual reporting periods beginning on or after
Expected Impact on Reporting Entity’s financial statements on initial application
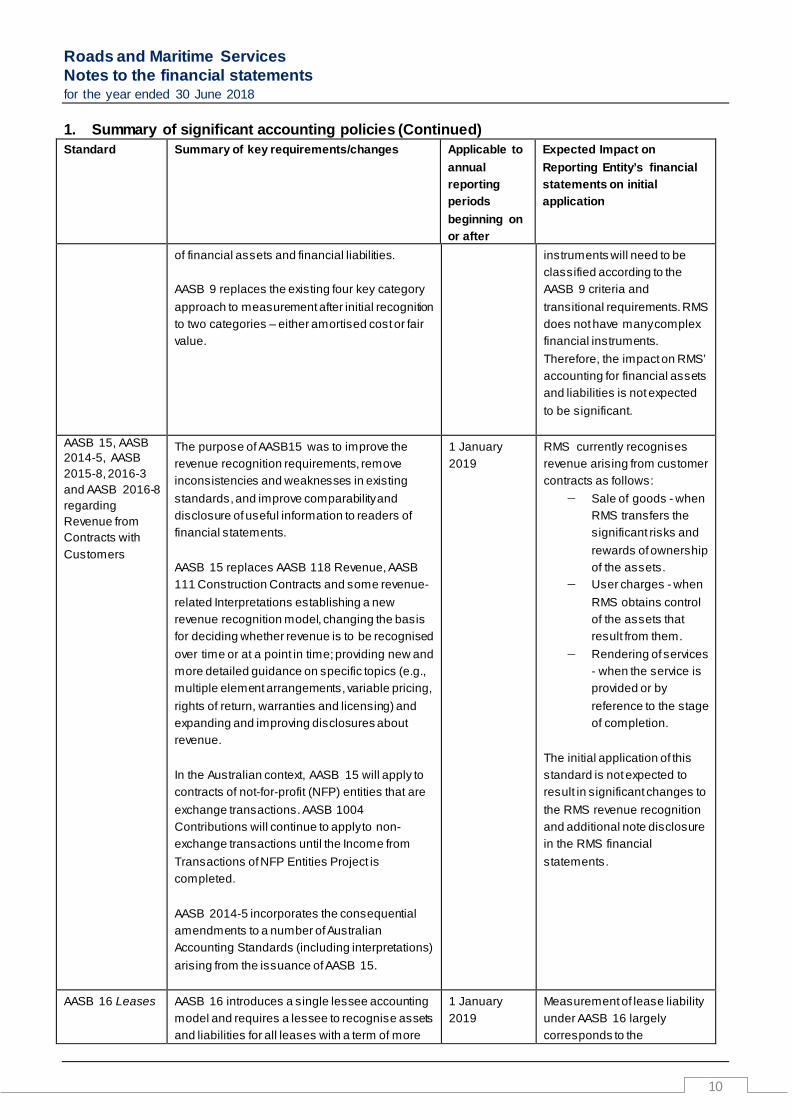
AASB 9 Financial Instruments
AASB 9 introduces new requirements for the classification, measurement and de-recognition
1 January 2018
On initial application of AASB 9, all existing financial
Roads and Maritime Services Notes to the financial statements for the year ended 30 June 2018
1. Summary of significant accounting policies (Continued)
10
Standard Summary of key requirements/changes Applicable to annual reporting periods beginning on or after
Expected Impact on Reporting Entity’s financial statements on initial application
of financial assets and financial liabilities. AASB 9 replaces the existing four key category approach to measurement after initial recognition to two categories – either amortised cost or fair value.
instruments will need to be classified according to the AASB 9 criteria and transitional requirements. RMS does not have many complex financial instruments. Therefore, the impact on RMS’ accounting for financial assets and liabilities is not expected to be significant.
AASB 15, AASB 2014-5, AASB 2015-8, 2016-3 and AASB 2016-8 regarding Revenue from Contracts with Customers
The purpose of AASB15 was to improve the revenue recognition requirements, remove inconsistencies and weaknesses in existing standards, and improve comparability and disclosure of useful information to readers of financial statements. AASB 15 replaces AASB 118 Revenue, AASB 111 Construction Contracts and some revenue-related Interpretations establishing a new revenue recognition model, changing the basis for deciding whether revenue is to be recognised over time or at a point in time; providing new and more detailed guidance on specific topics (e.g., multiple element arrangements, variable pricing, rights of return, warranties and licensing) and expanding and improving disclosures about revenue. In the Australian context, AASB 15 will apply to contracts of not-for-profit (NFP) entities that are exchange transactions. AASB 1004 Contributions will continue to apply to non-exchange transactions until the Income from Transactions of NFP Entities Project is completed. AASB 2014-5 incorporates the consequential amendments to a number of Australian Accounting Standards (including interpretations) arising from the issuance of AASB 15.
1 January 2019
RMS currently recognises revenue arising from customer contracts as follows:
− Sale of goods - when RMS transfers the significant risks and rewards of ownership of the assets.
− User charges - when RMS obtains control of the assets that result from them.
− Rendering of services - when the service is provided or by reference to the stage of completion.
The initial application of this standard is not expected to result in significant changes to the RMS revenue recognition and additional note disclosure in the RMS financial statements.
AASB 16 Leases AASB 16 introduces a single lessee accounting model and requires a lessee to recognise assets and liabilities for all leases with a term of more
1 January 2019
Measurement of lease liability under AASB 16 largely corresponds to the

Roads and Maritime Services Notes to the financial statements for the year ended 30 June 2018
1. Summary of significant accounting policies (Continued)
11
Standard Summary of key requirements/changes Applicable to annual reporting periods beginning on or after
Expected Impact on Reporting Entity’s financial statements on initial application
than 12 months, unless the underlying asset is of low value. A lessee is required to recognise a right-of-use asset representing its right to use the underlying leased asset and a lease liability representing its obligations to make lease payments. AASB 16 substantially carries forward the lessor accounting requirements in AASB 117 Leases. Accordingly, a lessor continues to classify its leases as operating leases or finance leases, and to account for those two types of leases differently.
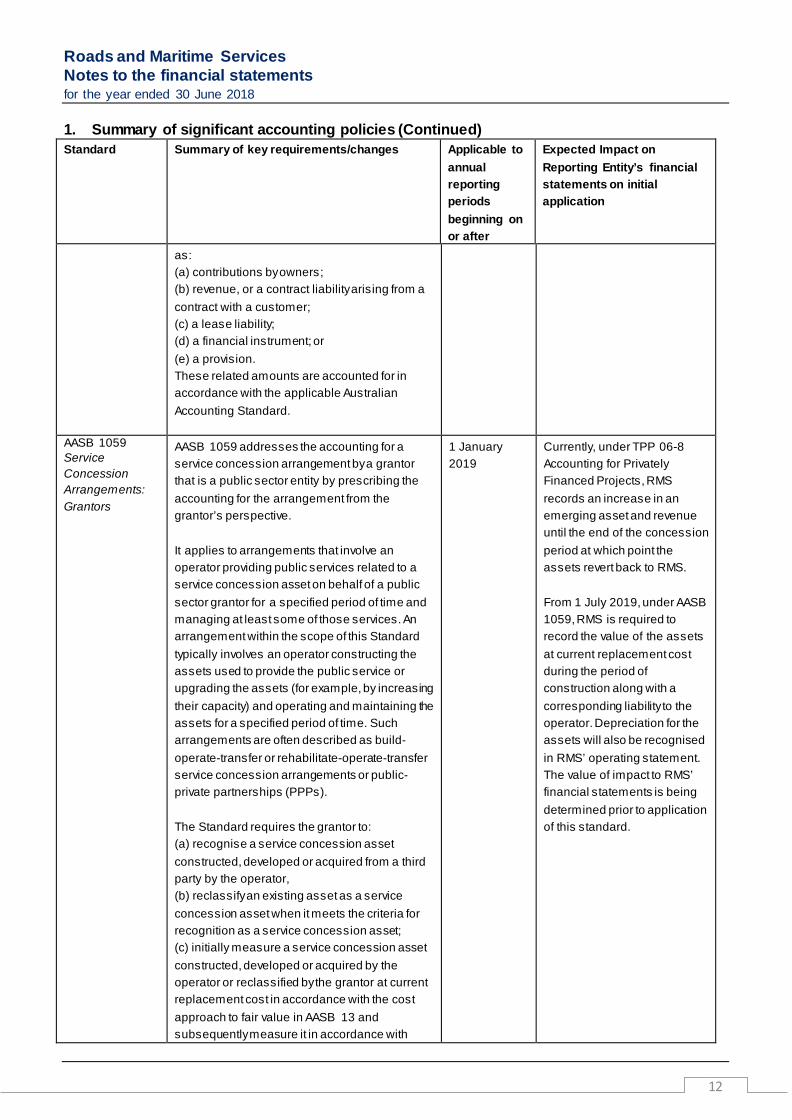
measurement of a finance lease liability under the current AASB 117. Under that standard RMS recognises an asset and liability relating to the Sydney Harbour Tunnel finance lease. AASB 16 will have no impact on this accounting treatment. RMS currently accounts for the use of fleet and property rental as operating leases in accordance with AASB 117. The initial application of AASB 16 will result in RMS bringing into account the right-to- use asset and liability to represent the lease payment obligation for its operating leases. The quantitative impact of the standard is not yet known.
AASB 1058 Income of Not-for-Profit Entities
AASB 1058 clarifies and simplifies the income recognition requirements that apply to not-for-profit (NFP) entities. Particularly when a NFP entity:
- receives volunteer services, or - acquires an asset where the
consideration is significantly less than the fair value of the asset, principally to enable the entity to further its objectives.
Local governments, government departments, general government sectors (GGSs) and whole of governments are required to recognise volunteer services if they would have been purchased and the fair value of those services can be measured reliably. Upon initial recognition of an asset, this Standard requires the entity to consider whether any other financial statement elements (called ‘related amounts’) should be recognised, such
1 January 2019
RMS currently recognises grants and contributions received from NSW government agencies and other bodies as income when RMS obtains control over the assets comprising the grants. Control over grants is normally obtained upon the receipt of cash or when the right to receive the cash/asset arises. RMS also accounts for any assets vested between NSW government agencies as equity transfers. The quantitative impact of the standard is not yet known.
Roads and Maritime Services Notes to the financial statements for the year ended 30 June 2018
1. Summary of significant accounting policies (Continued)
12
Standard Summary of key requirements/changes Applicable to annual reporting periods beginning on or after
Expected Impact on Reporting Entity’s financial statements on initial application
as: (a) contributions by owners; (b) revenue, or a contract liability arising from a contract with a customer; (c) a lease liability; (d) a financial instrument; or (e) a provision. These related amounts are accounted for in accordance with the applicable Australian Accounting Standard.
AASB 1059 Service Concession Arrangements: Grantors
AASB 1059 addresses the accounting for a service concession arrangement by a grantor that is a public sector entity by prescribing the accounting for the arrangement from the grantor’s perspective. It applies to arrangements that involve an operator providing public services related to a service concession asset on behalf of a public sector grantor for a specified period of time and managing at least some of those services. An arrangement within the scope of this Standard typically involves an operator constructing the assets used to provide the public service or upgrading the assets (for example, by increasing their capacity) and operating and maintaining the assets for a specified period of time. Such arrangements are often described as build-operate-transfer or rehabilitate-operate-transfer service concession arrangements or public-private partnerships (PPPs). The Standard requires the grantor to: (a) recognise a service concession asset constructed, developed or acquired from a third party by the operator, (b) reclassify an existing asset as a service concession asset when it meets the criteria for recognition as a service concession asset; (c) initially measure a service concession asset constructed, developed or acquired by the operator or reclassified by the grantor at current replacement cost in accordance with the cost approach to fair value in AASB 13 and subsequently measure it in accordance with
1 January 2019
Currently, under TPP 06-8 Accounting for Privately Financed Projects, RMS records an increase in an emerging asset and revenue until the end of the concession period at which point the assets revert back to RMS. From 1 July 2019, under AASB 1059, RMS is required to record the value of the assets at current replacement cost during the period of construction along with a corresponding liability to the operator. Depreciation for the assets will also be recognised in RMS’ operating statement. The value of impact to RMS’ financial statements is being determined prior to application of this standard.

Roads and Maritime Services Notes to the financial statements for the year ended 30 June 2018
1. Summary of significant accounting policies (Continued)
13
Standard Summary of key requirements/changes Applicable to annual reporting periods beginning on or after
Expected Impact on Reporting Entity’s financial statements on initial application
AASB 116 or AASB 138; (d) recognise a corresponding liability measured initially at the fair value
(g) Personnel services income Personnel Services Income represents the provision of RMS staff to TfNSW to undertake work on behalf of Transport Shared Services.
(h) Inventories held-for-distribution Inventories consist mainly of raw materials and supplies used for the construction and maintenance of roads, bridges and traffic signals. Inventories held for distribution are initially measured at cost, adjusted when applicable, for any loss of service potential. A loss of service potential is identified and measured based on the existence of a current replacement cost that is lower than the carrying amount. Cost is calculated using either the weighted average cost or “first in first out” method. The cost of inventories acquired at no cost or for nominal consideration is the current replacement cost as at the date of acquisition. Current replacement cost is the cost the agency would incur to acquire the asset. Net realisable value is the estimated selling price in the ordinary course of business less the estimated costs of completion and the estimated costs necessary to make the sale. (i) Equity and reserves
(i) Asset revaluation reserve
The asset revaluation reserve is used to record increments and decrements on the revaluation of non-current assets. This accords with the agency’s policy on the revaluation of property, plant and equipment as discussed in Note 12 and 13(a).
(ii) Accumulated Funds
The category of ‘Accumulated Funds’ includes all current and prior period retained funds.
(j) Changes in accounting estimates RMS has incorporated asset condition assessment in the 2018 valuation of road and bridge assets to determine their fair value which has also extended the remaining useful lives of the asset components. The external valuer engaged for the comprehensive revaluation has considered obsolescence in its valuation approach and has incorporated asset conditions in the revised valuation methodology for assets where condition data is available. The main drivers of this result are the incorporation of the asset condition to determine the fair value, and certain methodology refinements from the previous valuation methodology. In addition, the method for calculating depreciation has also changed from an age based straight line method to an condition based straight line method.
Roads and Maritime Services Notes to the financial statements for the year ended 30 June 2018
1. Summary of significant accounting policies (Continued)
14
The change in the useful life assumptions is recognised as change in estimates and recognised prospectively in accordance with AASB108: Accounting policies, Changes in Accounting Estimates and Errors. Management's estimate is that this has resulted in a decrease of roads and bridges depreciation expense of approximately $46 million for the year ended 30 June 2018 and expected depreciation in 2018-19 by approximately $235 million. (k) Critical accounting estimates, judgements and assumptions In the application of accounting standards, management is required to make judgements, estimates and assumptions about the carrying values of assets and liabilities that are not readily apparent from other sources. The estimates and associated assumptions are based on historical experience and various factors that are believed to be reasonable under the current set of circumstances. Actual results may differ from these estimates. Management evaluates these judgements, estimates and assumptions on an ongoing basis. Revisions to estimates are recognised in the period in which the estimate is revised if the revision affects only that period – or in the period of the revision and future periods if the revision affects both current and future periods. Significant judgements, estimates and assumptions made by management in the preparation of the financial statements are outlined below: Property, plant and equipment & Intangible assets
Note 12 and note 13(b)
Private sector provided infrastructure Note 13(a) Non-current assets held for sale Note 14 Provisions Note 19

Roads and Maritime Services Statement of cash flows for the year ended 30 June 2018
15
2. Expenses excluding losses (a) Personnel services expenses
2018 2017
$'000 $'000
Personnel services expenses comprise the following specific items:
Salaries and wages (including annual leave) 326,344 350,832 Superannuation - defined benefit plans 8,179 7,180 Superannuation - defined contribution plans 28,029 27,541 Long service leave 9,268 4,633 Payroll tax and fringe benefits tax 23,703 22,984 Redundancy payments 14,718 14,464 Workers' compensation insurance 3,017 7,666 Personnel services expenses 413,258 435,300 Allocations of personnel service costs to programs:
- Capitalised to infrastructure 296,258 250,808 - Operating programs (including maintenance costs) 413,258 435,300 709,516 686,108
Note 12 details the nature of personnel services capitalised. Included in the above are personnel services expenses of $94.0 million (2017: $127.4 million) related to maintenance.

Roads and Maritime Services Statement of cash flows for the year ended 30 June 2018
16
2. Expenses excluding losses (continued) (b) Other operating expenses
2018 2017
$'000 $'000
Auditor's remuneration - audit of financial statements 784 765 Advertising 3,271 5,026 Contract payments 144,030 84,027 Data processing 56,853 60,275 Contingent rent 1,036 2,422 Fleet hire and lease charges 31,190 18,360 Lease and property expenses 26,516 23,891 M5 Cashback refund 114,208 108,848 Office expenses 41,710 33,243 Payments to councils and external bodies 29,421 20,639 Special number plates concession fees 27,045 26,079 Sydney Harbour Tunnel operating fees 32,882 31,924 Travel, insurance and legal expenses 37,658 35,608 Consultants 2,237 1,621 Professional fees 141,309 145,176 Other 28,934 39,237 Share services charges 284,637 73,649 Other operating expenses 1,003,721 710,790 Recognition and Measurement Share services charges Shared services charges represent services provided by Service NSW and TfNSW Shared Services to RMS. The charges are recognised as incurred. Insurance RMS’ insurance activities are conducted through the NSW Treasury Managed Fund Scheme of self-insurance for government agencies. The expense (premium) is determined by the Fund Manager based on past claims experience. Compulsory third party insurance is with a private sector provider arranged by NSW Treasury. RMS also arranges Principal Arranged Insurance (PAI) which provides cover for all parties involved in its construction projects. The premium cost is amortised on a straight-line basis over the term of the contract for all insurance policies. Fleet hire and lease charges (Operating leases) An operating lease is a lease other than a finance lease. Operating lease payments are recognised as an expense in the Statement of Comprehensive Income on a straight-line basis over the lease term. Professional fees (includes labour hire contractors) Labour hire contractors employed through a labour hire agency are not classified as employees. There is no contractual relationship between the government entity and the individual in the arrangement. Consistent with TPP 18-01 Accounting Policy: Financial Reporting Code for NSW General Government Sector Entities, such arrangements are classified as Other operating expenses. As a result, RMS has reclassified $28.9 million (2017: $31.6 million) in the current year from ‘skilled hire contractors’ in note 2(a) to ‘professional fees’ in note 2(b).

Roads and Maritime Services Statement of cash flows for the year ended 30 June 2018
17
2. Expenses excluding losses (continued)
(c) Maintenance
2018 2017
Notes $'000 $'000
Maintenance expense in Statement of comprehensive income 424,093 474,545 Maintenance related to personnel services expenses 93,951 127,363 Total maintenance expense including personnel services related 518,044 601,908 Maintenance grants to councils 312,927 290,807 Capitalised maintenance 745,351 601,945 Total maintenance program 1,576,322 1,494,660
Recognition and Measurement
Major reconstruction costs for road segments on State roads are capitalised and as such not charged against maintenance expenditure. RMS capitalised $745.4 million (2017: $601.9 million) of such works during the year.

Roads and Maritime Services Statement of cash flows for the year ended 30 June 2018
18
2. Expenses excluding losses (continued) (d) Depreciation and amortisation
2018 2017
Notes $'000 $'000
Depreciation of operational and property assets 35,511 34,933 Depreciation of infrastructure assets 1,559,423 1,569,172 Depreciation of property, plant and equipment 12 1,594,934 1,604,105 Amortisation of intangible assets 13(b) 37,360 34,846 Depreciation and amortisation 1,632,294 1,638,951
Refer to Note 12, 13(b) and 15(b) for recognition and measurement policies on depreciation and amortisation.
(e) Grants and subsidies
2018 2017
Notes $'000 $'000
Grants to councils 418,127 346,399 Roads and bridges transferred to councils 12(c) 199,364 40,678 Other grants and subsidies 23,082 10,814 Contribution to National Heavy Vehicle Regulator 42,700 42,700 Grants and subsidies 683,273 440,591 Recognition and Measurement Grants and subsidies generally comprise contributions in cash or kind to various local government authorities and not-for-profit community organisations. These contributions include transfers of roads and bridges, cash grants for road maintenance and the provision of transport services. The grants and subsidies are expensed on the transfer of cash or assets. The transferred assets are measured at their fair value and transferred for nil consideration. Of the $418.1 million (2017: $346.4 million) in Grants to Councils, RMS expensed $91.5 million in the year ended 30 June 2018 (2017: $78.1 million) on natural disaster restoration works from State funds, and $249.7 million in the year ended 30 June 2018 (2017: $298.8 million) on block grants and other maintenance grants to councils for regional and local roads. (f) Finance costs
2018 2017
$'000 $'000
Finance lease interest charges 25,452 29,168 M2 promissory notes - 6,719 Other 183 285 Finance costs 25,635 36,172
Recognition and Measurement Finance costs are recognised as expenses in the period in which they are incurred, in accordance with Treasury’s Mandate to not-for-profit NSW general government sector agencies. They include interest expenses calculated using the effective interest method as described in AASB 139 Financial Instruments: Recognition and Measurements and the unwinding of discount rate that is applied to provisions.

Roads and Maritime Services Statement of cash flows for the year ended 30 June 2018
19
3. Revenue Recognition and Measurement Income is measured at the fair value of the consideration or contribution received or receivable. Comments regarding the accounting policies for the recognition of income are discussed below. (a) Sale of goods and services
2018 2017
$'000 $'000
Sale of goods Number plates 148,628 140,445 Publications 9,115 9,499 Rendering of services Advertising 17,357 16,281 Boat licenses 27,682 24,178 Boat registrations 24,934 26,541 Channel fees 8,986 8,580 Fees for services 116,705 119,986 Heavy vehicle permit fees 812 711 Miscellaneous services 12,854 18,669 Moorings 8,837 9,961 General maritime revenue 2,700 2,950 Rental income 59,313 55,350 Third party insurance data access charges 5,183 3,638 Toll and tag revenue 165,585 152,703 Works and services 81,992 41,855 Sale of goods and services 690,683 631,347 Recognition and Measurement Sale of goods Revenue from the sale of goods is recognised when RMS transfers the significant risks and rewards of ownership of the assets. User charges are recognised as revenue when RMS obtains control of the assets that result from them. Rendering of services Revenue from the rendering of services is recognised when the service is provided or by reference to the stage of completion.

Roads and Maritime Services Statement of cash flows for the year ended 30 June 2018
20
3. Revenue (continued) (b) Investment revenue
2018 2017
$'000 $'000
Interest 18,548 15,575 Amortisation of zero interest Sydney Harbour Tunnel loan 10,532 9,862 TCorp Investment Facilities Designated at Fair Value Through Profit and Loss 6,708 7,339 M2 and Eastern Distributor promissory notes 5,000 5,459 Investment revenue 40,788 38,235 Recognition and Measurement Interest revenue is recognised using the effective interest method. The effective interest rate method is the rate that exactly discounts the estimated future cash receipts over the expected life of the financial instrument or a shorter period, where appropriate, to the net carrying amount of the financial asset.
(c) Retained taxes, fees and fines
2018 2017
$'000 $'000
Sanction fees payable under the Fines Act 15,312 14,160 National Heavy Vehicle Regulator charges 56,502 56,500 Retained taxes, fees and fines 71,814 70,660
Recognition and Measurement Retained taxes, fines and fees are recognised when cash is received.

Roads and Maritime Services Statement of cash flows for the year ended 30 June 2018
21
3. Revenue (continued)
(d) Grants from Transport for NSW (TfNSW)
2018 2017
$'000 $'000 Operating grant Grant to fund general operations including maintenance 1,568,356 1,282,828 Capital grant Grants to fund investment in infrastructure network development* 4,304,181 4,264,278 Grants from Transport for NSW (TfNSW) 5,872,537 5,547,106
Recognition and Measurement RMS receives capital and operating grants from TfNSW instead of receiving budget appropriations directly from NSW Treasury. RMS also receives grants and contributions from other NSW government agencies and other bodies as per note 3(e). These grants are generally recognised as income when RMS obtains control over the assets comprising the grants. Control over grants is normally obtained upon the receipt of cash or when the right to receive the cash arises. Of the $4,304.2 million capital grant above, $2,014.9 million relates to federal funding (2017: $1,608.6 million of $4,264.3 million). The equivalent figure for the federal recurrent grant is $198.9 million (2017: $168.3 million). Federal funding is appropriated to TfNSW through NSW Treasury. (e) Other grants and contributions
2018 2017
$'000 $'000
NSW Government agencies
- TfNSW* 894,800 8,066 - Other 116,524 87,215 Local government 2,026 2,229 Other government agencies - 10,011 Private firms and individuals 8,366 9,036 Other grants and contributions 1,021,716 116,557 Recognition and Measurement Contributions received during the year ended 30 June 2018 were recognised as revenue during the period. Contributions are recognised at their fair value. *RMS has reclassified Restart NSW capital grants received in the year ended 30 June 2018 of $889.7 million from Capital grants received from TfNSW in note 3(d) to Other grants and contributions from TfNSW in note 3(e), whilst the amount received in the year ended 30 June 2017 of $603.1 million remains disclosed in note 3(d). This reclassification is due to a directive from NSW Treasury and is effective prospectively from 1 July 2017.

Roads and Maritime Services Statement of cash flows for the year ended 30 June 2018
22
3. Revenue (continued) (f) Other income
2018 2017
Notes $'000 $'000
Value of emerging interest of Private Sector Provided Infrastructure (PSPI)
- M2 Motorway/M2 Widening 13(a) 40,318 38,285 - M4 Motorway Service Centre 13(a) 1,010 1,603 - M4 Motorway/M4 Widening 13(a) 7,060 - - M5 South-West Motorway 13(a) 44,434 41,839 - Eastern Distributor 13(a) 22,269 20,898 - Cross City Tunnel 13(a) 30,832 29,230 - Westlink M7 Motorway 13(a) 66,705 63,162 - Lane Cove Tunnel 13(a) 40,709 38,395 Amortisation of deferred revenue on PSPI projects 19,030 19,030 Fuel tax credits - 515 Principal arranged insurance refund 25,407 1,530 Property revenue 1,294 2,822 Recognition of infrastructure assets 12(c) 49,345 34,014 Other boating fees 1,525 1,698 Resources received free of charge 26 27,036 22,980 Other (including professional services revenue) 17,490 20,379 Other income 394,464 336,380
Recognition and Measurement Emerging interests in private sector provided infrastructure (PSPI) projects The value of the emerging right to receive a PSPI asset is treated as the compound value of an annuity that accumulates as a series of receipts together with a calculated notional compound interest. The discount rate used is the NSW Treasury Corporation 10-year government bond rate at the commencement of the concession period. The revenue recognition is on a progressive basis relative to the concession period. Amortisation of deferred revenue on PSPI Projects Reimbursement of development costs in the form of upfront cash payments are treated as deferred revenue with an annual amortisation amount recognised on a straight-line basis over the life of the concession period. Resources received free of charge Resources received free of charge is recognised for personnel services assumed by the Crown including long service leave and defined benefit superannuation.

Roads and Maritime Services Statement of cash flows for the year ended 30 June 2018
23
4. Gain/(loss) on disposal
2018 2017
Notes $'000 $'000
Net gain/(loss) on sale of property, plant and equipment Proceeds from sale 3,079 1,027 Carrying amount of assets sold 12 (2,825) (7,760) Net gain/(loss) on sale of property, plant and equipment 254 (6,733) Net gain/(loss) on disposal of intangible assets Carrying amount of assets disposed 13(b) (437) (271) Net gain/(loss) on disposal of intangible assets (437) (271) Net gain / (loss) on sale of property, plant and equipment and Intangibles (183) (7,004) Net gain/(loss) on sale of non-current assets held for sale Proceeds from sales 23,767 361,541 Carrying amount of assets sold 14 (20,690) (226,597) Net gain/(loss) on sale of non-current assets held for sale 3,077 134,944 Net gain/(loss) on disposal 2,894 127,940 5. Other gains/(losses)
2018 2017
Notes $'000 $'000 Allowance for impairment of receivables 9 (6,769) (3,552) Carrying amount of Infrastructure assets written off 6 (198,593) (262,709) Net revaluation increment/(decrement) recognised in net result 6 (389,598) (367,352) Other gains/(losses) (594,960) (633,613) Recognition and Measurement Gains and losses include gains and losses on disposals and fair value adjustments to physical and financial assets, and financial liabilities. Other gains and losses disclosed are those recognised in the net result arising from property, plant and equipment revaluations, write down of inventories, gain/loss resulting from financial assets and liabilities and reversal of unused provisions. In regards to infrastructure assets written off, in cases where RMS constructs a new infrastructure asset that substantially replaces an existing asset (rather than performing work to maintain the existing asset), the capitalised value of the original asset is written off and the new asset is included within the additions to infrastructure assets (Note 12(c)).

Roads and Maritime Services Statement of cash flows for the year ended 30 June 2018
24
6. Write-off/down of land & buildings and infrastructure assets
2018 2017
Notes $'000 $'000
Carrying amount of Infrastructure assets written off 5 and 12(c) 198,593 262,709
The following infrastructure assets were written off in the periods ended 30 June 2018 and 30 June 2017:
Replacement costs
Accumulated depreciation
Carrying value
Replacement costs
Accumulated depreciation
Carrying value
$'000 $'000 $'000 $'000 $'000 $'000
2018 2018 2018 2017 2017 2017
$'000 $'000 $'000 $'000 $'000 $'000 Roads 159,203 (62,640) 96,563 322,721 (203,942) 118,779 Bridges 31,795 (18,348) 13,447 9,941 (5,232) 4,709 Maritime assets 2,373 (1,105) 1,268 3,410 (2,293) 1,117 Work in progress 82,613 - 82,613 134,654 - 134,654 Traffic signals network 901 (689) 212 205 (129) 76 Traffic controls network 14,928 (10,438) 4,490 16,105 (12,731) 3,374 Infrastructure assets written off 291,813 (93,220) 198,593 487,036 (224,327) 262,709
2018 2017
Notes $'000 $'000
Net revaluation increment/(decrement) recognised in net result 5 (389,598) (367,352) The following land & buildings and infrastructure assets were written down and/ or written back through the net result in the year ended 30 June 2018:
Carrying value
Carrying value
2018 2017
Notes $'000 $'000
Traffic signals network 1,470 733 Infrastructure systems 12(c) 1,470 733 Land and buildings acquired for future roadworks (391,068) (368,085) Land & buildings 12(a) (391,068) (368,085) Land & buildings and infrastructure assets (written down)/written back (389,598) (367,352)

Roads and Maritime Services Service group statements for the year ended 30 June 2018
25
7. Program Group Statements for the year ended 30 June 2018 Roads and Maritime Services expenses and income
Asset Maintenance Services & Operations Growth & Improvement Not attributable Total 2018 2017 2018 2017 2018 2017 2018 2017 2018 2017 $'000 $'000 $'000 $'000 $'000 $'000 $'000 $'000 $'000 $'000 Expenses excluding losses Operating expenses - Personnel serv ices expenses 92,702 126,540 294,996 286,298 25,560 22,462 - - 413,258 435,300 - Other operating expenses 53,365 80,842 876,167 590,055 74,189 39,893 - - 1,003,721 710,790 - Maintenance 326,373 403,882 97,041 70,226 679 437 - - 424,093 474,545 Depreciation and amortisation - - 1,632,294 1,638,951 - - - - 1,632,294 1,638,951 Grants and subsidies 312,894 236,017 303,380 110,198 66,999 94,376 - - 683,273 440,591 Finance costs - - 25,635 36,172 - - - - 25,635 36,172
Total expenses excluding losses 785,334 847,281 3,229,513 2,731,900 167,427 157,168 - - 4,182,274 3,736,349 Revenue Sale of goods and serv ices 26,033 21,487 655,864 593,037 8,786 16,823 - - 690,683 631,347 Personnel serv ice rev enue - - 1,778 1,126 - - - - 1,778 1,126 Inv estment rev enue - - 40,788 38,235 - - - - 40,788 38,235 Retained taxes, f ees and f ines 56,501 56,500 15,313 14,160 - - - - 71,814 70,660 Operating grant receiv ed f rom Transport f or NSW (Tf NSW) 484,566 503,831 980,485 685,537 103,305 93,460 - - 1,568,356 1,282,828
Capital grant receiv ed f rom Tf NSW 638,650 583,993 119,752 126,437 3,545,779 3,553,848 - - 4,304,181 4,264,278 Other grants and contributions 150,733 27,616 34,112 82,763 836,871 6,178 - - 1,021,716 116,557 Other rev enue 11,389 13,487 379,741 316,378 3,334 6,515 - - 394,464 336,380 Total revenue 1,367,872 1,206,914 2,227,833 1,857,673 4,498,075 3,676,824 - - 8,093,780 6,741,411 Gain/(loss) on disposal of property , plant and equipment - - 2,894 102,560 - 25,380 - - 2,894 127,940 Other gains/(losses) - - (594,960) (633,613) - - - - (594,960) (633,613)
Net result 582,538 359,633 (1,593,746) (1,405,280) 4,330,648 3,545,036 - - 3,319,440 2,499,389 Other comprehensive income Net increase/(decrease) in asset rev aluation reserv e - - 7,665,386 929,538 - - - - 7,665,386 929,538
Total other comprehensive income for the year - - 7,665,386 929,538 - - - - 7,665,386 929,538 Total comprehensive income 582,538 359,633 6,071,640 (475,742) 4,330,648 3,545,036 - - 10,984,826 3,428,927

Roads and Maritime Services Service group statements for the year ended 30 June 2018
26
7. Program Group Statements for the year ended 30 June 2018 (continued)
Administered expenses and income
Asset Maintenance Services & Operations Growth & Improvement Not attributable Total
2018 2017 2018 2017 2018 2017 2018 2017 2018 2017
$'000 $'000 $'000 $'000 $'000 $'000 $'000 $'000 $'000 $'000
Administered expenses
Other - - - - - - - - - -
Transf er pay ments - - - - - - - - - -
Administered expenses - - - - - - - - - -
Administered income
Transf er receipts - - - - - - 3,668,529 3,564,978 3,710,207 3,564,978
Administered income - - - - - - 3,668,529 3,564,978 3,710,207 3,564,978
Administered income less expenses - - - - - - 3,668,529 3,564,978 3,710,207 3,564,978
Administered assets and liabilities are disclosed in Note 28.

Roads and Maritime Services Service group statements for the year ended 30 June 2018
27
7. Program Group Statements for the year ended 30 June 2018 (continued) Roads and Maritime Services assets and liabilities
Asset Maintenance Services & Operations Growth & Improvement Not attributable Total 2018 2017 2018 2017 2018 2017 2018 2017 2018 2017 $'000 $'000 $'000 $'000 $'000 $'000 $'000 $'000 $'000 $'000 ASSETS Current assets Cash and cash equiv alents - - 886,839 748,652 - - - - 886,839 748,652 Receiv ables 21,873 17,446 551,054 481,492 7,382 13,659 - - 580,309 512,597 Inv entories - - 4,762 5,676 - - - - 4,762 5,676 Financial assets at f air v alue - - 111,565 104,857 - - - - 111,565 104,857 Other f inancial assets - - 146,887 - - - - - 146,887 - Non-current assets classif ied as held f or sale - - 1,121 275 - - - - 1,121 275
Total current assets 21,873 17,446 1,702,228 1,340,952 7,382 13,659 - - 1,731,483 1,372,057 Non-current assets Receiv ables - - 104,587 158,558 1,322,229 238,101 - - 1,426,816 396,659 Other f inancial assets - - 222,992 390,532 - - - - 222,992 390,532 Property , plant and equipment - Land and buildings - - 3,660,886 3,630,252 - - - - 3,660,886 3,630,252 - Plant and equipment - - 105,371 110,389 - - - - 105,371 110,389 - Inf rastructure sy stem - - 81,222,312 73,065,567 7,161,065 5,737,479 - - 88,383,377 78,803,046
Property, plant and equipment - - 84,988,569 76,806,208 7,161,065 5,737,479 - - 92,149,634 82,543,687 Priv ate sector prov ided inf rastructure - - 2,075,417 1,834,908 - - - - 2,075,417 1,834,908 Intangible assets - - 153,796 169,166 - - - - 153,796 169,166
Total non-current assets - - 87,545,361 79,359,372 8,483,294 5,975,580 - - 96,028,655 85,334,952 Total assets 21,873 17,446 89,247,589 80,700,324 8,490,676 5,989,239 - - 97,760,138 86,707,009 LIABILITIES Current liabilities Pay ables 137,861 224,070 1,105,369 946,876 94,145 67,373 - - 1,337,375 1,238,319 Borrowings - - 60,558 53,680 - - - - 60,558 53,680 Prov isions 876 2,066 14,404 4,675 1,220 367 - - 16,500 7,108 Other 15,532 27,704 255,008 202,204 21,591 13,671 - - 292,131 243,579
Total current liabilities 154,269 253,840 1,435,339 1,207,435 116,956 81,411 - - 1,706,564 1,542,686 Non-current liabilities Pay ables 944 2,731 7,571 11,540 645 821 - - 9,160 15,092 Borrowings - - 244,575 305,133 - - - - 244,575 305,133 Prov isions 1,388 3,083 22,786 6,975 1,929 547 - - 26,103 10,605 Other 33,741 74,169 553,969 541,352 46,907 36,600 - - 634,617 652,121
Total non-current liabilities 36,073 79,983 828,901 865,000 49,481 37,968 - - 914,455 982,951 Total liabilities 190,342 333,823 2,264,240 2,072,435 166,437 119,379 - - 2,621,019 2,525,637 Net assets (168,469) (316,377) 86,983,349 78,627,889 8,324,239 5,869,860 - - 95,139,119 84,181,372

Roads and Maritime Services Notes to the financial statements for the year ended 30 June 2018
28
7. Program Group Statements for the year ended 30 June 2018 (continued) Program Group Descriptions (a) Roads, maritime and freight asset maintenance
This program group includes maintenance of road and maritime infrastructure and assets. The primary outcomes of this program group are to ensure the State’s road and maritime assets: • meet required safety, performance and operational standards in the delivery of customer services and access for regional communities • enable safe, efficient and reliable services for passengers and freight customers. (b) Roads, maritime and freight services and operations The primary purpose of this program group is to enable the safe, efficient and reliable movement of people and goods by various transport modes across the State’s road and maritime networks. Activities in this program group include: • delivering solutions to maximise the efficiency of the existing road, freight rail and waterway networks • providing support to ensure motorists, vehicles and vessels are safe and compliant • implementing road, maritime and freight policies and regulation • delivering ongoing network operations to allow for the efficient movement of people and goods • managing incident response, and traffic and waterways for major projects • planning required for journey management and asset maintenance activities (c) Roads, maritime and freight growth and improvement This program group includes developing and delivering new or upgraded road and maritime infrastructure to optimise the safety, efficiency and effectiveness of the road and maritime networks. Activities in this program group include: • delivering new road, maritime and freight infrastructure • delivering enhancements to road, maritime and freight infrastructure • replacing or rebuilding road, maritime and freight infrastructure

Roads and Maritime Services Notes to the financial statements for the year ended 30 June 2018
29
8. Cash and cash equivalents Cash and cash equivalents recognised in the Statement of Financial Position comprise cash on hand, cash at bank and short-term deposits with a maturity of three months or less, which are subject to an insignificant risk of changes in value and includes other at-call deposits that are not quoted in an active market. These are considered to have an insignificant risk of changes in value. In accordance with AASB139 Financial Instruments: Recognition and Measurement, cash and cash equivalents are measured at fair value with interest revenue accrued as earned such that fair value is reflected at no less than the amount payable on demand.
2018 2017
$'000 $'000
RMS operating account** 777,181 614,087 Remitting account, cash in transit and cash on hand* 5,728 27,158 On call deposits** 56,427 55,185 Other** 47,503 52,222 Cash and cash equivalents 886,839 748,652 *The remitting account balance above does not include cash of $38.0 million (2017: $33.7 million) relating to administered revenue held by RMS as at 30 June 2018 (refer to Note 28). ** The cash account balances include restricted cash (refer to Note 16). Cash and cash equivalent assets recognised in the statement of financial position is reconciled at the end of the financial year to the statement of cash flows as follows:
2018 2017
$'000 $'000
Cash and cash equivalents (per statement of financial position) 886,839 748,652 Closing cash and cash equivalents (per statement of cash flows) 886,839 748,652 For the purposes of the statement of cash flows, cash and cash equivalents include cash at bank, cash on hand and on call deposits. Details regarding credit risk, liquidity risk and market risk arising from financial instruments are disclosed in note 30.

Roads and Maritime Services Notes to the financial statements for the year ended 30 June 2018
30
9. Receivables
2018 2017
Notes $'000 $'000
(i) Current receivables
Sale of goods and services 40,196 32,919 Other receivables 122,123 105,239 Less: Allowance for impairment* (9,944) (10,010) Receivables 152,375 128,148 Goods and services tax receivable 146,046 121,908 Goods and Services Tax 146,046 121,908 Prepayments 157,715 132,568 Property and other debtors 16,716 20,864 Prepayments Motorways 11,427 - Other 185,858 153,432 Accrued interest 451 2,578 Property sales 86,699 93,024 Accrued other income 8,880 13,507 Accrued Income 96,030 109,109 Current receivables 580,309 512,597 Movement in the allowance for impairment: Balance at 1 July 10,010 6,442 Increase in allowance recognised in Statement of Comprehensive Income 5 6,769 3,552 Amounts written (off)/back during the period
(6,835) 16
Balance at 30 June 9,944 10,010 (ii) Non-current receivables Prepayments Motorways ̂ 1,322,229 238,101 Property Sales 81,068 158,558 Prepayments 23,519 - Non-current receivables 1,426,816 396,659
*The allow ance for impairment primarily relates to amounts ow ing as a result of commercial transactions (e.g. debts raised for performance of services or sale of goods) and tenants w ho vacate rental premises w ithout notice whilst in arrears. ^Prepayment Motorw ays represents RMS’ contribution in cash and in kind for various Private Sector Provided Infrastructure projects. Details regarding credit risk, liquidity risk and market risk arising from financial instruments are disclosed in note 30.
Recognition and Measurement
Receivables including trade receivables, prepayments, etc, are non-derivative financial assets with fixed or determinable payments that are not quoted in an active market. Receivables are recognised initially at fair value, plus any directly attributable transaction costs. Subsequent measurement is at amortised cost using the effective interest method, less any impairment. Changes are recognised in the net result for the year when impaired, derecognised or through the amortisation process. Short-term receivables with no stated interest rate are measured at the original invoice amount where the effect of discounting is immaterial.

Roads and Maritime Services Notes to the financial statements for the year ended 30 June 2018
31
9. Receivables (continued)
Impairment
Receivables are subject to an annual review for impairment. An allowance for impairment is established when there is objective evidence that the entity will not be able to collect all amounts due. Further details on the process for determining the impairment provision on trade debtors is provided at Note 30(d)(ii). The amount of the impairment loss is recognised in the net result for the year. Any reversals of impairment losses are reversed through the net result for the year, where there is objective evidence. Reversals of impairment losses of financial assets carried at amortised cost cannot result in a carrying amount that exceeds what the carrying amount would have been had there not been an impairment loss.
10. Financial assets at fair value
2018 2017
$'000 $'000
TCorp Hour-Glass Investment Facilities - long-term growth facility 35,002 31,920 TCorp Hour-Glass Investment Facilities - medium-term growth facility 76,563 72,937 Financial assets at fair value through profit or loss 111,565 104,857
Recognition and Measurement
Financial assets at fair value through profit and loss include financial assets held for trading and financial assets designated upon initial recognition at fair value through profit and loss. Financial assets at fair value through profit and loss are initially and subsequently measured at fair value. Gains or losses on these assets are recognised in the net result for the year. Financial assets are classified as “held for trading” if they are acquired for the purpose of selling in the near term. The NSW Treasury Corporation (TCorp) Hour-Glass Investment Facilities are designated at fair value through profit and loss as these financial assets are managed and their performance is evaluated on a fair value basis, in accordance with a documented risk management strategy, and information about these assets is provided internally on that basis to the key management personnel. The movement in the fair value of the NSW TCorp Hour-Glass Investment Facilities incorporates distributions received as well as unrealised movements in fair value and is reported in the line item ‘investment revenue’ at note 3(b). Details regarding credit risk, liquidity risk and market risk arising from financial instruments are disclosed in note 30.

Roads and Maritime Services Notes to the financial statements for the year ended 30 June 2018
32
11. Other financial assets
2018 2017
Notes $'000 $'000
(i) Current other financial assets Lane Cove Tunnel concession payment recoverable 13(a) 146,887 - Current other financial assets 146,887 - (ii) Non-current other financial assets Loan to Sydney Harbour Tunnel Company 165,519 154,987 Lane Cove Tunnel concession payments recoverable 13(a) - 183,072 M2 and Eastern distributor operators Promissory notes 13(a) 57,473 52,473 Non-current other financial assets 222,992 390,532
Recognition and Measurement Loans, promissory notes and other recoverable amounts are non-derivative financial assets with fixed or determinable payments that are not quoted in an active market. These financial assets are recognised initially at fair value. Subsequent measurement is at amortised cost using the effective interest method, less an allowance for any impairment where applicable. Changes are recognised in the Statement of Comprehensive Income in the year impaired, derecognised or through the amortisation process. Details regarding credit risk, liquidity risk and market risk arising from financial instruments are disclosed in note 30.
Impairment
An allowance for impairment is established when there is objective evidence that, as a result of one or more events that occurred after the initial recognition of the asset, the estimated future cash flows have been affected. RMS first assesses whether impairment exists individually for other financial assets that are individually significant, or collectively for those that are not individually significant. Further, other financial assets are assessed for impairment on a collective basis if they were assessed not to be impaired individually. For financial assets carried at amortised cost, the amount of the allowance is the difference between the asset’s carrying amount and the present value of estimated future cash flows, discounted at the effective interest rate. The amount of the impairment loss is recognised in the net result for the year. Any reversals of impairment losses are reversed through the net result for the year, where the decrease in impairment losses can be related objectively to an event occurring after the impairment was recognised. Reversals of impairment losses of financial assets carried at amortised cost cannot result in a carrying amount that exceeds what the carrying amount would have been had there not been an impairment loss.

Roads and Maritime Services Notes to the financial statements for the year ended 30 June 2018
33
12. Property, plant and equipment
Land and buildings
Plant and equipment
Infrastructure systems TOTAL
$ '000 $ '000 $ '000 $ '000 As at 1 July 2017 - fair value Gross carrying amount 3,757,777 256,352 114,805,197 118,819,326 Accumulated depreciation and impairment (127,525) (145,963) (36,002,151) (36,275,639) Net carrying amount 3,630,252 110,389 78,803,046 82,543,687 As at 30 June 2018 - fair value Gross carrying amount 3,806,139 250,483 115,297,957 119,354,579 Accumulated depreciation and impairment (145,253) (145,112) (26,914,580) (27,204,945) Net carrying amount 3,660,886 105,371 88,383,377 92,149,634 As at 1 July 2016 - fair value Gross carrying amount 3,568,643 269,061 110,787,021 114,624,725 Accumulated depreciation and impairment (104,747) (159,770) (34,826,268) (35,090,785) Net carrying amount 3,463,896 109,291 75,960,753 79,533,940 At 30 June 2017 - fair value Gross carrying amount 3,757,777 256,352 114,805,197 118,819,326 Accumulated depreciation and impairment (127,525) (145,963) (36,002,151) (36,275,639) Net carrying amount 3,630,252 110,389 78,803,046 82,543,687 A reconciliation of the carrying amount of each class of property, plant and equipment at the beginning and end of the current reporting period is set out below: Year ended 30 June 2018
Reconciliation
Land and buildings
Plant and equipment
Infrastructure systems TOTAL
Notes $ '000 $ '000 $ '000 $ '000
Net carrying amount at start of year 3,630,252 110,389 78,803,046 82,543,687 Additions 525,374 14,761 4,264,486 4,804,621 Assets recognised for the first time 3(f) - - 49,345 49,345 Net revaluation increments less revaluation decrements recognised in equity (10,493) - 7,675,879 7,665,386
Net revaluation increments less revaluation decrements recognised in net result 6 (391,068) - 1,470 (389,598)
Disposals 4 (504) (2,321) - (2,825) Asset write-off 6 - - (198,593) (198,593) Transfer (to)/from non-current assets held for sale (21,475) (286) - (21,761) Reclassification between PPE classes (513) 529 (16) - Reclassification between land and building classes - - - - Transfer to infrastructure (46,959) - 46,959 - Reclassifications (to)/from intangible assets 13(b) - (375) (3,015) (3,390) Reclassifications (to)/from other assets 12,828 - (497,397) (484,569) Depreciation expense 2(d) (18,185) (17,326) (1,559,423) (1,594,934) Assets transferred in/(out) through equity 21 (18,371) - - (18,371) Transfer to councils 2(e) - - (199,364) (199,364) Net carrying amount at year end 3,660,886 105,371 88,383,377 92,149,634
Roads and Maritime Services Notes to the financial statements for the year ended 30 June 2018
34
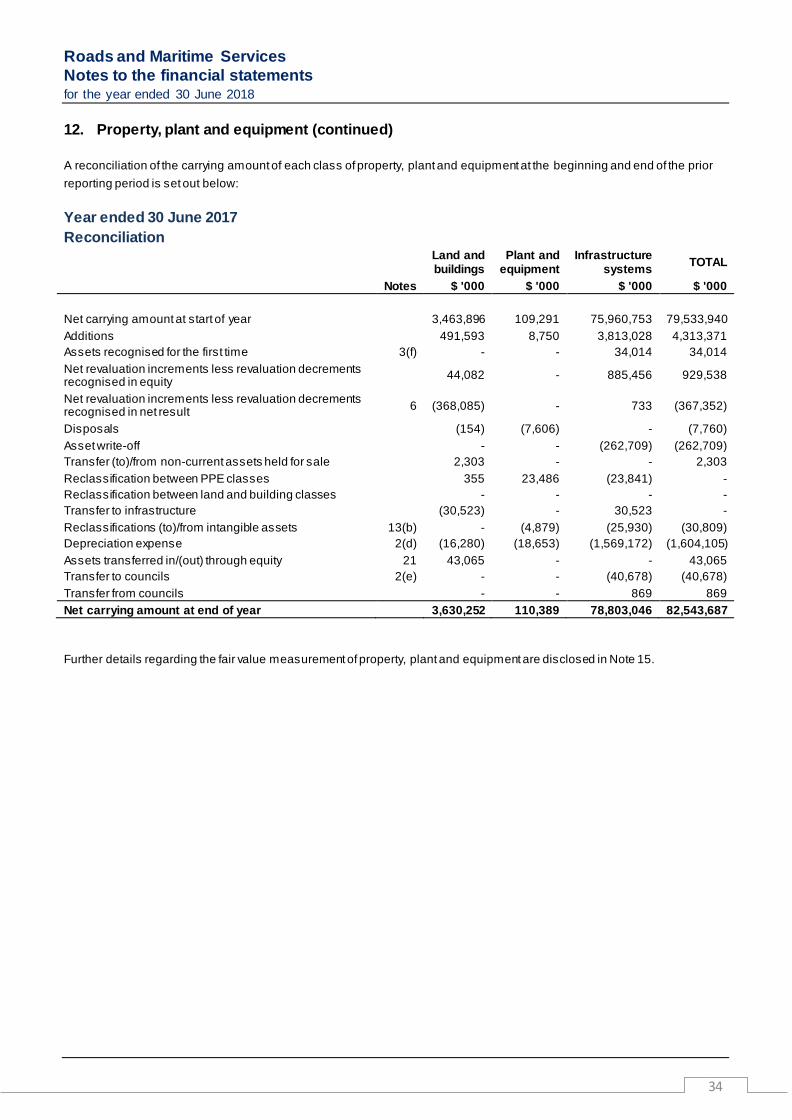
12. Property, plant and equipment (continued) A reconciliation of the carrying amount of each class of property, plant and equipment at the beginning and end of the prior reporting period is set out below: Year ended 30 June 2017
Reconciliation
Land and buildings
Plant and equipment
Infrastructure systems TOTAL
Notes $ '000 $ '000 $ '000 $ '000
Net carrying amount at start of year 3,463,896 109,291 75,960,753 79,533,940 Additions 491,593 8,750 3,813,028 4,313,371 Assets recognised for the first time 3(f) - - 34,014 34,014 Net revaluation increments less revaluation decrements recognised in equity 44,082 - 885,456 929,538
Net revaluation increments less revaluation decrements recognised in net result 6 (368,085) - 733 (367,352)
Disposals (154) (7,606) - (7,760) Asset write-off - - (262,709) (262,709) Transfer (to)/from non-current assets held for sale 2,303 - - 2,303 Reclassification between PPE classes 355 23,486 (23,841) - Reclassification between land and building classes - - - - Transfer to infrastructure (30,523) - 30,523 - Reclassifications (to)/from intangible assets 13(b) - (4,879) (25,930) (30,809) Depreciation expense 2(d) (16,280) (18,653) (1,569,172) (1,604,105) Assets transferred in/(out) through equity 21 43,065 - - 43,065 Transfer to councils 2(e) - - (40,678) (40,678) Transfer from councils - - 869 869 Net carrying amount at end of year 3,630,252 110,389 78,803,046 82,543,687
Further details regarding the fair value measurement of property, plant and equipment are disclosed in Note 15.

Roads and Maritime Services Notes to the financial statements for the year ended 30 June 2018
35
12. Property, plant and equipment (continued) (a) Land and buildings Year ended 30 June 2018
Reconciliation
Land* Administrative Buildings*
Land and buildings
acquired for future
roadworks**
Leasehold improvements TOTAL
Notes $ '000 $ '000 $ '000 $ '000 $ '000
Net carrying amount at start of year 295,410 174,780 3,128,542 31,520 3,630,252 Additions - 15,354 507,455 2,565 525,374 Net revaluation increments less revaluation decrements recognised in equity 9,088 (19,581) - - (10,493) Net revaluation increments less revaluation decrements recognised in net result 6 - - (391,068) - (391,068)
Disposals (89) (209) - (206) (504) Transfer (to)/from non-current assets held for sale - - (21,475) - (21,475) Reclassification between PPE classes - (304) - (209) (513) Reclassification between land and building classes (2,246) (1,944) 2,246 1,944 - Transfer to infrastructure 12(c) - - (46,959) - (46,959) Reclassifications (to)/from other assets 13(a) - - 12,828 - 12,828 Depreciation expense - (8,702) - (9,483) (18,185) Assets transferred in/(out) through equity 21 (1,589) (1,492) (15,290) - (18,371) Net carrying amount at end of year 300,574 157,902 3,176,279 26,131 3,660,886
* Administrative Land and Buildings w ere revalued during 2017-18 resulting in a net asset revaluation decrement of $10.5 million (2017: $44.1 million increment), recognised through equity. In 2017 the increment w as recorded against asset revaluation reserve.
** In 2017-18, Land Acquired for Future Road Works (LAFFRW) w as revalued resulting in an increase in the asset revaluation reserve of approximately $198.7 million (2017: $179.8 million). This increase has been offset with revaluation decrements arising from the transfers of LAFFRW to infrastructure. Total net revaluation decrement of $391.1million (2017: $368.1 million decrement) has been recognised in the net result.

Roads and Maritime Services Notes to the financial statements for the year ended 30 June 2018
36
12. Property, plant and equipment (continued) (a) Land and buildings (cont’d)
Year ended 30 June 2017 Reconciliation
Land* Administrative
buildings*
Land and buildings
acquired for future
roadworks**
Leasehold improvements TOTAL
Notes $ '000 $ '000 $ '000 $ '000 $ '000
Net carrying amount at start of year 234,047 166,701 3,033,597 29,551 3,463,896 Additions - 15,670 472,899 3,024 491,593 Net revaluation increments less revaluation decrements recognised in equity 30,869 13,213 - - 44,082 Net revaluation increments less revaluation decrements recognised in net result 6 - - (368,085) - (368,085)
Disposals - (3) - (151) (154) Transfer (to)/from non-current assets held for sale (6,098) - 8,401 - 2,303 Reclassification between PPE classes - (1) (1) 357 355 Reclassification between land and building classes 36,752 (17,134) (25,654) 6,036 - Transfer to infrastructure 12(c) - 7,529 (38,052) - (30,523) Depreciation expense - (8,983) - (7,297) (16,280) Assets transferred in/(out) through equity 21 (160) (2,212) 45,437 - 43,065 Net carrying amount at end of year 295,410 174,780 3,128,542 31,520 3,630,252

Roads and Maritime Services Notes to the financial statements for the year ended 30 June 2018
37
12. Property, plant and equipment (continued) (b) Plant and equipment
Year ended 30 June 2018
Reconciliation
Plant equipment and motor
vehicles Computer hardware
Electronic office equipment TOTAL
Notes $ '000 $ '000 $ '000 $ '000
Net carrying amount at start of year 101,046 8,322 1,021 110,389 Additions 14,739 6 16 14,761 Disposals (2,321) - - (2,321) Transfer (to)/from non-current assets held for sale (286) - - (286) Reclassification between PPE classes 594 (65) - 529 Reclassifications (to)/from intangible assets 13(b) (375) - - (375) Depreciation expense (12,180) (4,996) (150) (17,326) Net carrying amount at end of year 101,217 3,267 887 105,371 Year ended 30 June 2017
Reconciliation
Plant equipment and motor
vehicles
Computer hardware
Electronic office equipment TOTAL
Notes $ '000 $ '000 $ '000 $ '000
Net carrying amount at start of year 86,557 21,553 1,181 109,291 Additions 5,627 3,111 12 8,750 Disposals (3,964) (3,622) (20) (7,606) Reclassification between PPE classes 24,637 (1,151) - 23,486 Reclassifications (to)/from intangible assets 13(b) 494 (5,373) - (4,879) Depreciation expense (12,305) (6,196) (152) (18,653) Net carrying amount at end of year 101,046 8,322 1,021 110,389
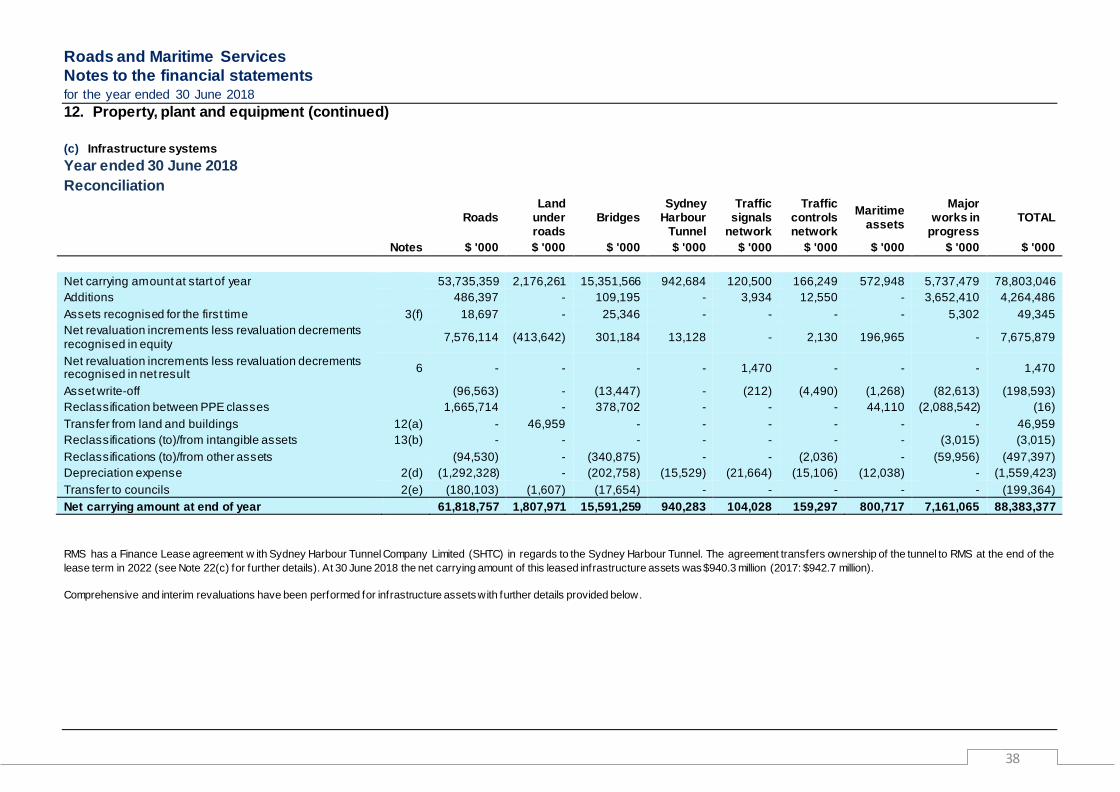
Roads and Maritime Services Notes to the financial statements for the year ended 30 June 2018
38
12. Property, plant and equipment (continued) (c) Infrastructure systems Year ended 30 June 2018
Reconciliation
Roads Land
under roads
Bridges Sydney
Harbour Tunnel
Traffic signals
network
Traffic controls network
Maritime assets
Major works in
progress TOTAL
Notes $ '000 $ '000 $ '000 $ '000 $ '000 $ '000 $ '000 $ '000 $ '000
Net carrying amount at start of year 53,735,359 2,176,261 15,351,566 942,684 120,500 166,249 572,948 5,737,479 78,803,046 Additions 486,397 - 109,195 - 3,934 12,550 - 3,652,410 4,264,486 Assets recognised for the first time 3(f) 18,697 - 25,346 - - - - 5,302 49,345 Net revaluation increments less revaluation decrements recognised in equity 7,576,114 (413,642) 301,184 13,128 - 2,130 196,965 - 7,675,879
Net revaluation increments less revaluation decrements recognised in net result 6 - - - - 1,470 - - - 1,470
Asset write-off (96,563) - (13,447) - (212) (4,490) (1,268) (82,613) (198,593) Reclassification between PPE classes 1,665,714 - 378,702 - - - 44,110 (2,088,542) (16) Transfer from land and buildings 12(a) - 46,959 - - - - - - 46,959 Reclassifications (to)/from intangible assets 13(b) - - - - - - - (3,015) (3,015) Reclassifications (to)/from other assets (94,530) - (340,875) - - (2,036) - (59,956) (497,397) Depreciation expense 2(d) (1,292,328) - (202,758) (15,529) (21,664) (15,106) (12,038) - (1,559,423) Transfer to councils 2(e) (180,103) (1,607) (17,654) - - - - - (199,364) Net carrying amount at end of year 61,818,757 1,807,971 15,591,259 940,283 104,028 159,297 800,717 7,161,065 88,383,377
RMS has a Finance Lease agreement w ith Sydney Harbour Tunnel Company Limited (SHTC) in regards to the Sydney Harbour Tunnel. The agreement transfers ownership of the tunnel to RMS at the end of the lease term in 2022 (see Note 22(c) for further details). At 30 June 2018 the net carrying amount of this leased infrastructure assets was $940.3 million (2017: $942.7 million).
Comprehensive and interim revaluations have been performed for infrastructure assets with further details provided below.

Roads and Maritime Services Notes to the financial statements for the year ended 30 June 2018
39
12. Property, plant and equipment (continued)
Year ended 30 June 2017 Reconciliation
Roads Land
under roads
Bridges Sydney
Harbour Tunnel
Traffic signals
network
Traffic controls network
Maritime assets
Major works in
progress TOTAL
Notes $ '000 $ '000 $ '000 $ '000 $ '000 $ '000 $ '000 $ '000 $ '000
Net carrying amount at start of year 52,974,065 1,957,927 14,965,069 952,578 137,034 153,833 552,841 4,267,406 75,960,753 Additions 687,560 - 210,199 - 4,200 29,993 - 2,881,076 3,813,028 Assets recognised for the first time 3(f) 21,420 - 12,594 - - - - - 34,014 Net revaluation increments less revaluation decrements recognised in equity 588,732 180,406 94,375 5,364 - 807 15,772 - 885,456
Net revaluation increments less revaluation decrements recognised in net result 6 - - - - 733 - - - 733
Asset write-off (118,779) - (4,709) - (76) (3,374) (1,117) (134,654) (262,709) Reclassification between PPE classes 920,736 - 281,485 - - - 16,760 (1,242,822) (23,841) Transfer from land and buildings 12(a) - 38,052 - - - - 68 (7,597) 30,523 Reclassifications (to)/from intangible assets 13(b) - - - - - - - (25,930) (25,930) Depreciation expense 2(d) (1,304,913) - (201,224) (15,258) (21,391) (15,010) (11,376) - (1,569,172) Transfer to councils 2(e) (34,308) (147) (6,223) - - - - - (40,678) Transfer from councils 846 23 - - - - - - 869 Net carrying amount at end of year 53,735,359 2,176,261 15,351,566 942,684 120,500 166,249 572,948 5,737,479 78,803,046

Roads and Maritime Services Notes to the financial statements for the year ended 30 June 2018
40
12. Property, plant and equipment (continued) Recognition and Measurement Acquisition of property, plant and equipment Property, plant and equipment acquired are initially recognised at cost and subsequently revalued at fair value less accumulated depreciation. Cost is the amount of cash or cash equivalents paid or the fair value of the other consideration given to acquire the asset at the time of its acquisition or construction or, where applicable, the amount attributed to that asset when initially recognised in accordance with the requirements of other Australian Accounting Standards. The cost of assets constructed for own use includes the cost of materials and direct labour, as well as an appropriate proportion of variable and fixed overhead costs that can be reliably attributed to the assets. Fair value is the price that would be received to sell an asset in an orderly transaction between market participants at measurement date. Where payment for property, plant and equipment is deferred beyond normal credit terms, its cost is the cash price equivalent; i.e. deferred payment amount is effectively discounted at an asset-specific rate over the period of credit. Assets acquired at no cost, or for nominal consideration, are initially recognised at their fair value at the date of acquisition. Capitalisation thresholds Property, plant and equipment and intangible assets costing above $5,000 individually, or forming part of a network costing more than $5,000, are capitalised. Items below these amounts are expensed in the period in which they are incurred. Major inspection costs The labour cost of performing major inspections for faults is recognised in the carrying amount of an asset as a replacement of a part, if the recognition criteria are satisfied. Restoration costs The present value of the expected cost for the restoration or cost of dismantling of an asset after its use is included in the cost of the respective asset if the recognition criteria for a provision are met. Assets not able to be reliably measured RMS has minor cultural collection items such as prints, drawings and artefacts that cannot be reliably valued and are considered immaterial that have not been recognised in the statement of financial position. Valuation and depreciation Physical non-current assets are valued in accordance with the 'Valuation of Physical Non-Current Assets at Fair Value' Policy and Guidelines Paper (TPP 14-01). This policy adopts fair value in accordance with AASB 13 Fair Value Measurement and AASB 116 Property, Plant and Equipment.

Roads and Maritime Services Notes to the financial statements for the year ended 30 June 2018
41
12. Property, plant and equipment (continued) Property, plant and equipment is measured at the highest and best use by market participants that is physically possible, legally permissible and financially feasible. The highest and best use must be available at a period that is not remote and take into account the characteristics of the asset being measured, including any socio-political restrictions imposed by government. In most cases, after taking into account these considerations, the highest and best use is the existing use. In limited circumstances, the highest and best use may be a feasible alternative use, where there are no restrictions on use or where there is a feasible higher restricted alternative use. Fair value of property, plant and equipment is based on a market participants’ perspective, using valuation techniques (market approach, cost approach, income approach) that maximise relevant observable inputs and minimise unobservable inputs. Also refer to Note 15 for further information regarding fair value. RMS revalues each class of property, plant and equipment with sufficient regularity to ensure the carrying amount of each asset in the class does not differ materially from its fair value at reporting date. Further details on asset revaluations can be found in note 15. Interim revaluations are performed between comprehensive revaluations where cumulative changes to indicators/indices suggest fair value may differ materially from carrying value. Generally, an interim revaluation is performed by management if the cumulative changes in indicators/indices are less than 20%. An interim formal revaluation is performed by external professionally qualified valuers when the cumulative changes in indicators/indices exceed 20%. In circumstances where asset values are deemed material, management may engage external valuers to perform an interim revaluation where changes in indicators/indices are lower than 20%. Management will assess whether comprehensive revaluations are required more frequently if the interim revaluations indicate movements are generally more than 20%. Non-specialised assets with short useful lives are measured at depreciated historical cost, as an approximation of fair value. The entity has assessed that any difference between fair value and depreciated historical cost is unlikely to be material. For other assets valued using other valuation techniques, any balances of accumulated depreciation at the revaluation date in respect of those assets are credited to the asset accounts to which they relate. The net asset accounts are then increased or decreased by the revaluation increments or decrement. Revaluation increments are credited directly to the asset revaluation reserve, except that, to the extent that an increment reverses a revaluation decrement in respect of that class of asset previously recognised as an expense, the increment is recognised immediately as revenue. Revaluation decrements are recognised immediately as expenses, except that, to the extent that a credit balance exists in the asset revaluation reserve in respect of the same class of assets, they are debited directly to the asset revaluation reserve. As a not-for-profit entity, revaluation increments and decrements are offset against one another within a class of non-current assets, but not otherwise. When revaluing non-current assets using the cost approach, the gross amount and the related accumulated depreciation are separately restated. Where the income approach or market approach is used, accumulated depreciation is eliminated against the gross carrying amount of the asset and the net amount restated to the revalued amount of the asset.

Roads and Maritime Services Notes to the financial statements for the year ended 30 June 2018
42
12. Property, plant and equipment (continued) Where an asset that has previously been revalued is disposed of, any balance remaining in the asset revaluation reserve in respect of that asset is transferred to accumulated funds. The residual values, useful lives and methods of depreciation of property, plant and equipment are subject to annual review. Plant and equipment
Asset Measurement/Valuation Policy Depreciation policy Plant, equipment and vehicles
Depreciated historical cost
Depreciated on the straight-line method over the estimated useful life between 2 and 60 years.
Computer hardware
Depreciated historical cost
Depreciated on the straight-line method over the estimated useful life between 2 and 5 years.
Electronic office equipment
Depreciated historical cost
Depreciated on the straight-line method over the estimated useful life between 5 and 10 years.
The carrying amount is considered to approximate the fair value of these assets. Except for certain non-depreciable assets, depreciation is provided for on a straight-line basis so as to write off the depreciable amount of each asset as it is consumed over its useful life to the entity.
All material identifiable components of assets are depreciated separately over their useful lives.
Estimates of useful life for depreciation and amortisation purposes have been determined with regard to a number of factors including the expected retention period by the entity and the underlying physical, technical and commercial nature of the assets as defined in AASB 116 Property, Plant and Equipment. In accordance with this standard the shortest alternative useful life is applied.

Roads and Maritime Services Notes to the financial statements for the year ended 30 June 2018
43
12. Property, plant and equipment (continued)
Land and buildings
Asset Measurement/Valuation policy Depreciation policy Administrative land and buildings in service Works administration properties
Land and buildings in service are generally valued using the market approach and at depreciated replacement cost (buildings). Where such properties are rented externally they are valued at current market value. Land and buildings in service are subject to comprehensive revaluation every three years by registered valuers. Desktop valuations will be carried out in the two years in between to ensure that carrying amounts do not differ materially from fair value at reporting date.
Buildings – Depreciated on the straight-line basis over the estimated useful life of between 10 and 50 years.
Land and Buildings Acquired for Future Roadworks (LAFFRW)
LAFFRW comprises of untenanted land for road (ULR), public reserves, rental and surplus properties. With the exception of public reserves, LAFFRW are initially valued at acquisition cost and progressively revalued to current market value over a three year cycle by registered valuers. Desktop valuations will be carried out in the two years in between the comprehensive revaluation to ensure that carrying amounts do not differ materially from fair value at reporting date. Public reserves are initially valued at acquisition cost and revalued to the Urban Average Rateable Value per hectare within each Local Government Area (LGA) adjusted by an “open spaces ratio” (OSR).
No depreciation is charged as buildings are not purchased to generate revenue but ultimately to be demolished for roadworks.
Leasehold improvements
Depreciated historical cost. Amortised over the period of the lease, or the useful life of the leasehold improvement, whichever is shorter.
Individual LAFFRW parcels required for road construction are transferred to land under roads WIP when road construction begins. The date of transfer is the construction start date as detailed in the construction contract. At time of transfer, LAFFRW parcels are deemed to have no feasible alternative use and are revalued downwards to restriction in use. Included in the value of land and buildings in service is an amount of $23.3 million (2017: $31.0 million) for both land and buildings on Crown land excluding depreciation on the buildings. As RMS effectively “controls” this Crown land, it has been included in RMS’ Statement of Financial Position. Should such Crown land be transferred or disposed of, associated buildings are written off in the financial year the transfer or disposal takes place.
Land and Buildings Acquired for Future Roadworks comprise of untenanted land for roads (ULR), rental properties and surplus properties. The category is determined by the current use of the property. Land and Buildings will be revalued at market value over a three year cycle and desktop valuations performed in the two years in between to ensure that carrying amounts do not differ materially from fair value at reporting date. In 2017-18, ULR, Rental, Surplus and Administration Properties were subject to a desktop revaluation by registered valuers.

Roads and Maritime Services Notes to the financial statements for the year ended 30 June 2018
44
12. Property, plant and equipment (continued)
Indexation is applied to land and buildings not revalued as part of the current year progressive revaluations to ensure their carrying amounts do not differ materially from their fair value as at 30 June 2018. For details refer to Note 12(a). Infrastructure systems
Asset Measurement/Valuation
policy Depreciation policy
Roads
Earthworks – Not Depreciated Earthworks – Depreciated Pavement Wearing Surface – Asphalt Pavement Wearing Surface – Spray Sealed Pavement Wearing Surface – Concrete Pavement Base and Sub-Base Culverts & Drainage Safety Barriers Fences Retaining Walls and Gabions Noise Walls Medians Rest Areas Other Assets (Footway, Vegetation, Landscaping, Kerbs and Gutters, Guide Posts, Pavement Markings, Signposting, and Street Lighting)
Depreciated replacement cost
Depreciated over estimated useful life using straight-line method.
- Indefinite - 50 years - 18 - 25 years - 7 - 12 years - 18 - 25 years - 81 - 108 years - 50 - 100 years - 40 - 80 years - 40 years - 60 - 100 years - 100 years - 50 years - 10 - 20 years - 20 - 50 years
Bridges Timber structure and timber truss Concrete structures Steel structures Heritage bridges Bridge size culverts/tunnels
Depreciated replacement cost
Depreciated over estimated useful life dependant on bridge type using straight-line method:
- 60-100 years - 100 years - 100 years - 100 years - 100 years
Traffic signals Depreciated replacement cost
Depreciated over estimated useful life of 20 years using straight line method.

Roads and Maritime Services Notes to the financial statements for the year ended 30 June 2018
45
12. Property, plant and equipment (continued)
Asset Measurement/Valuation
policy Depreciation policy
Traffic Control Network Traffic systems Transport Management Centre Variable message signs Variable Speed signs Weather Stations
Depreciated replacement cost
Depreciated over estimated useful life dependant on asset type using straight-line method
- 5-20 years - 5-20 years - 15-50 years - 10-50 years - 10-50 years
Land under roads and within road reserves
The urban Average Rateable Value per hectare within each Local Government Area (LGA) is adjusted by an “open spaces ratio” to approximate fair value (unimproved and pre-subdivision land). The urban Average Rateable Value by LGA is derived from data provided by the Valuer-General.
No depreciation applied as land does not have limited useful life.
Sydney Harbour Tunnel Immersed tube Mechanical and electrical Pavement Earthworks
Depreciated replacement cost
Depreciated over estimate useful life depending on asset type:
- 100 years - 35 years - 35 years - Indefinite life
Maritime roads Depreciated replacement cost
Depreciated over estimated useful life of between 20 and 40 years.
Wharves and jetties Depreciated replacement cost
Depreciated over estimated useful life of between 8 and 45 years.
Moorings and wetlands Income approach Indefinite lives. Dredging assets Replacement cost Indefinite lives. Seawall Depreciated replacement
cost
Depreciated over estimated useful life of between 25 and 40 years.
Navigational aids
Depreciated historical cost
Depreciated on the straight-line method over the estimated useful life between 5 and 20 years.
The determination of unit replacement rates for road, bridge and traffic control signal infrastructure valuations is carried out at least every five years by independent externally engaged qualified valuers, engineering contractors and employees of RMS. These assets are recorded initially at construction cost and the average annual percentage increase in the Australian Bureau of Statistics’ Roads and Bridge Cost Index (RBCI) (2017: Australian Bureau of Statistics’ Roads and Bridge Cost Index (RBCI)) is applied each year until the following unit replacement rate review is undertaken.

Roads and Maritime Services Notes to the financial statements for the year ended 30 June 2018
46
12. Property, plant and equipment (continued) Subsequent to the review, infrastructure is valued using the unit replacement rates, adjusted by the applicable RBCI (2017: RBCI). Land under roads and within road reserves are revalued annually by applying the most recent urban rateable average value per hectare provided by the Valuer-General to the land under roads and within reserves within each Local Government Area. (LGA), and adjusting this value by the “open spaces ratio”. The valuations are based on certain assumptions including property being vacant and therefore do not take into account costs that may be incurred in removing roads and other improvements. The Valuer-General’s urban average rateable values are calculated by reference to land values only and do not include the value of any improvements. Major works-in-progress are valued at construction cost and exclude the cost of land, which is currently disclosed as land under roads. For details refer to Note 15(b). A full valuation of the road and bridge infrastructure assets was carried out by an independent valuer on 31 March 2018. All road and bridge infrastructure assets are stated at fair value using the depreciated replacement cost (DRC) approach. The methods and significant assumptions applied in estimating the ‘Roads’ and ‘Bridges’ asset class fair values include: Valuation methodologies Roads Primary Approach – applied to pavements (wearing surface and base/sub-base), culverts, earthworks, safety barriers and fencing, noise walls, retaining walls, medians and rest areas. This approach involved the following steps:
• Obtaining inventory details for components by Road Asset Management System (RAMS) segment/unique ID • Estimating replacement costs based on quantity/area/length and applying unit rates to the inventory listings • Estimating normal useful lives and remaining useful lives based on asset condition (base/sub-base only) • Applying depreciation (straight line) based on age/life and remaining useful life, and asset condition (base/sub-
base only) analysis to estimate fair value. Secondary Approach – applied to “other” corridor assets categories. This approach involved the following steps:
• Obtaining percentage breakdown of components from RMS’s Project Management Office (PMO) • Converting PMO percentages to “known assets” percentages • Estimating replacement costs based on replacement cost of “known assets” • Estimating normal useful lives • Applying depreciation (straight line) based on age/life analysis to estimate fair value
Hybrid Approach – used for longitudinal and subsoil drainage assets, involving a combination of the Primary and Secondary Approaches. Earthworks assumptions
• Sub-categories for Earthworks have been identified by ‘Region’, ‘Road rank’, and ‘Terrain’ • RMS’s PMO unit rates were only available by region and therefore adjusted to include road rank and terrain,
using assumed typical earthwork depths, to capture the cost variations for all stereotypes Pavement assumptions
• Base/sub-base component ages have been based on the newer of the road construction or rehabilitation dates • The effective age and remaining useful lives of base/sub-base assets to determine their fair value are estimated
based on the asset condition data derived by the RMS pavement engineers. • Wearing surface asset ages have been based on the newer of construction, resurfacing or rehabilitation dates

Roads and Maritime Services Notes to the financial statements for the year ended 30 June 2018
47
12. Property, plant and equipment (continued)
• Remaining life extensions of 2 years have been applied to wearing surface components past their useful lives.
These assumptions are based on RMS’s projected pavement rebuilding/resurfacing estimates. • Sub-categories for Pavements have been identified by ‘Pavement category’, ‘Region’, and ‘Road rank’
Culvert and Drainage assumptions
• Ages for Culverts have been calculated using the road construction date • A remaining life extension of 5 years has been applied to all Culverts and Drainage that were past their useful life • Stereotypes for Culverts have been identified as ‘Culvert type’, ‘Region’, and ‘Pipe diameter / box width’ • Culverts with high risk rating (ARL 1 and 2) have been depreciated on a straight line basis over an effective
remaining useful live of 10 years in accordance with RMS’ current Corridor Asset Management Plan • Longitudinal Drainage assumed to be located in urban terrains in Sydney region only (Hunter region captured in
Culverts inventory), and applied to 50 percent of segment lengths only • 375mm pipe culvert unit rate was deemed most appropriate for Longitudinal Drainage • Subsoil Drainage primary types include edge and trench drains and only concrete pavement types assumed to
include edge drains. Unit rates (per m) were based on 100mm perforated plastic piping. • Major culverts over 6 metres are classified as bridges and included in the Bridge Asset Class.
Safety Barrier and Fence assumptions
• Sub-categories have been identified by ‘Barrier type’, ‘Start and end terminal type’ and ‘Region’ • Age calculations for depreciation were determined using the barrier construction date, if available, or the road
segment construction date as a proxy. • A remaining life extension of 5 years has been applied to all safety barriers and fences that were past their useful
life.
Retaining Walls, Rest Areas and Medians assumptions • The ages of the assets were calculated based on the segment construction date • A remaining life extension of 5 years has been applied to the assets that were past their useful life.
Noise Walls assumptions
• Age calculations for depreciation were determined using the noise wall construction date, if available, or the road segment construction date as a proxy
• A remaining life extension of 5 years has been applied to all noise walls that were past their useful life. Bridges and Tunnels The approach involved the following steps:
- Obtaining bridge asset inventory data from the Bridge Information System (BIS). - Applying unit rates to the inventory listing based on the modern equivalent capitalisation type. - Estimating replacement cost based on the bridge deck area. - Estimating normal useful lives and remaining useful lives based on element condition data. - Applying depreciation (straight line) based on age/life analysis to estimate fair value. The element condition data
collected by RMS bridge maintenance planners was used to assess the effective age and effective remaining lives of the bridge assets
Due to the specialised nature of RMS’ ‘Roads’ asset class, and the fact that RMS’ road assets are not sold or traded, the fair value for this asset class cannot be determined with reference to observable prices in an active market or recent market transactions on arm’s length terms. Instead, the fair value has been determined using the valuation techniques outlined above, primarily with reference to current tendered contract rates produced by the RMS Project Management Office. Capitalisation of expenditure Expenditure (including personnel service costs) in respect of road development and construction, bridge and tunnel replacement and some road safety and traffic management are capitalised as infrastructure systems (refer to Note 2(a)).

Roads and Maritime Services Notes to the financial statements for the year ended 30 June 2018
48
12. Property, plant and equipment (continued) Finance leases A distinction is made between finance leases which effectively transfer from the lessor to the lessee substantially all the risks and rewards incidental to ownership of the leased assets, and operating leases under which the lessor effectively retains all such risks and rewards. Where a non-current asset is acquired by means of a finance lease, the asset is recognised at the lower of its fair value and the present value of minimum lease payments at the commencement of the lease term. The corresponding liability is established at the same amount. Lease payments are allocated between the principal component and the interest expense. Subsequent to initial recognition, the asset is accounted for in accordance with the accounting policy applicable to that class of asset. Impairment of property, plant and equipment As a not-for-profit entity with no cash generating units, impairment under AASB 136 Impairment of Assets is unlikely to arise. Since property, plant and equipment is carried at fair value or an amount that approximates fair value, impairment can only arise in the rare circumstances such as where the costs of disposal are material. Specifically, impairment is unlikely for not-for-profit entities given that AASB 136 modifies the recoverable amount test for non-cash generating assets of not-for-profit entities to the higher of fair value less costs of disposal and depreciated replacement cost, where depreciated replacement cost is also fair value. The entity assesses, during each reporting date, whether there is an indication that an asset may be impaired.

Roads and Maritime Services Notes to the financial statements for the year ended 30 June 2018
49
13. Non-current assets - intangibles assets and other (a) Private sector provided infrastructure
2018 2017Notes $'000 $'000
M2 Motorway/M2 Widening Carrying amount at start of year 235,108 196,823Annual increment - emerging right to receive 3(f) 40,318 38,285Carrying amount at end of year 275,426 235,108
M4 Motorway Service Centre Carrying amount at start of year 11,818 10,215
Annual increment - emerging right to receive 3(f) 1,010 1,603
Transfer to RMS owned Land and Buildings 12(a) (12,828) -
Carrying amount at end of year - 11,818M4 Motorway/M4 Widening Carrying amount at start of year - -
Annual increment - emerging right to receive 7,060 -
Carrying amount at end of year 7,060 -M5 South-West Motorway Carrying amount at start of year 353,966 312,127
Annual increment - emerging right to receive 3(f) 44,434 41,839
Carrying amount at end of year 398,400 353,966Eastern Distributor Carrying amount at start of year 167,008 146,110
Annual increment - emerging right to receive 3(f) 22,269 20,898
Carrying amount at end of year 189,277 167,008Cross City Tunnel Carrying amount at start of year 248,437 219,207
Annual increment - emerging right to receive 3(f) 30,832 29,230
Carrying amount at end of year 279,269 248,437Westlink M7 Motorway Carrying amount at start of year 508,855 445,693
Annual increment - emerging right to receive 3(f) 66,705 63,162
Carrying amount at end of year 575,560 508,855Lane Cove Tunnel Carrying amount at start of year 309,716 271,321
Annual increment - emerging right to receive 3(f) 40,709 38,395
Carrying amount at end of year 350,425 309,716Total carrying amount at the end of period 2,075,417 1,834,908
Total Carrying amount at start of year 1,834,908 1,601,496Annual increment - emerging right to receive 253,337 233,412Transfer to RMS owned assets 12(a) (12,828) -Carrying amount at end of year 2,075,417 1,834,908

Roads and Maritime Services Notes to the financial statements for the year ended 30 June 2018
50
13. Non-current assets - intangibles assets and other (continued) Recognition and Measurement In respect of certain private sector provided infrastructure assets: M2 Motorway, M4 Service Centre, M5 South-West Motorway, the Eastern Distributor, the Cross City Tunnel, the Westlink M7 Motorway, the Lane Cove Tunnel and the M4 Widening of the WestConnex Stage 1A, RMS values each right to receive asset by reference to RMS’ emerging share of the written down replacement cost of each asset apportioned using an annuity approach. Under this approach, the ultimate value of the right to receive the property is treated as the compound value of an annuity that accumulates as a series of equal annual receipts together with an amount representing notional compound interest (refer note 3(f)). RMS initially accounts for any up-front contribution to the private sector operator for the construction of the PSPI as prepayment, and recognises them progressively as expense over the concession period. M2 Motorway RMS entered into a contract with the concession holder to design, construct, operate and maintain the M2 Motorway. Under the terms of the initial Project Deed, ownership of the M2 Motorway will revert to RMS 45 years from the M2 commencement date of 26 May 1997. . To facilitate these works, RMS leased land detailed in the M2 Motorway Project Deed for the term of the Agreement. Until the project realises a real after tax internal rate of return of 12.25 per cent per annum, rent is payable, at the Lessee’s discretion, in cash or by promissory note. On achievement of the required rate, the rent is payable in cash. Under the terms of the lease, RMS must not present any of the promissory notes for payment until the earlier of the end of the term of Agreement or the achievement of the required rate of return. The term of the Agreement ends on the 45th anniversary of the M2 commencement date (i.e. 26 May 2042) subject to the provisions of the M2 Motorway Project Deed. No payments have been made for rents on the leases for the year ended 30 June 2018 (2017: No payments made). RMS, as at 30 June 2018, has received promissory notes for rent on the above leases totalling $204.4 million (2017: $192.6 million). The value of these promissory notes as at 30 June 2018 is $36.8 million (2017: $33.7 million) (Refer to note 11). The NSW Government announced the Hills M2 Upgrade on 26 October 2010. Construction of the upgrade was substantially completed in August 2013. The initial construction cost was $550 million. RMS has recognised an emerging asset for the M2 upgrade until the end of the existing concession period. In 2014-15 the concession period was extended for a further period of four years on the completion of the road widening. The total carrying value of the M2 Motorway emerging asset, including the M2 Upgrade, is $275.4 million as at 30 June 2018 (2017: $235.1 million). An agreement was reached on 31 January 2015 for further integration works to be done to the M2, to connect it with the new NorthConnex motorway. The work was completed in May 2018 which extended the concession term by a further two years to 30 June 2048.

Roads and Maritime Services Notes to the financial statements for the year ended 30 June 2018
51
13. Non-current assets - intangibles assets and other (continued) M4 Motorway Service Centre In October 1992, RMS and the concession holder entered into the M4 Service Centre Project Deed under which RMS agreed to acquire land and lease the land to the concession holder. The concession holder agreed to finance, design, construct, maintain and operate two service centres which are located on each carriageway of the M4 at Eastern Creek. The M4 Service Centres were opened for use on 1 January 1993. The concession holder operated, maintained and repaired the service centres until 31 December 2017, after which the service centres was transferred back to RMS. The total carrying value of the M4 Motorway Service Centre emerging asset was $12.8 million as at 31 December 2017 (2017: $11.8 million) after which it was transferred back to RMS owned land and buildings asset at $51.9 million. M5 South-West Motorway RMS entered into a contract with the concession holder to design, construct, operate and maintain the M5 Motorway. The initial concession period for the M5 Motorway was for the period 14 August 1992 to 14 August 2022. In consideration for the concession holder undertaking construction of an additional interchange at Moorebank (M5 Improvements), the initial concession period has been subsequently extended to 22 August 2023. The M5 South-West Motorway Call Option Deed provides that if, after at least 25 years from the M5 Western Link commencement date of 26 June 1994, RMS determines that the expected financial return has been achieved, RMS has the right to purchase either the business from the concession holder or the shares in the concession holder. The exercise price under the M5 Call Option Deed will be based on open market valuation of the business or shares. In November 2009, the NSW Government announced a proposal to expand the M5 corridor. The M5 West widening would expand the South West Motorway generally from two to three lanes in each direction to reduce travel time for motorists using the motorway and surrounding roads. Major construction started in August 2012 and was completed in December 2014. The end of the concession period has been extended by 3 years and 3 months from 22 August 2023 to 10 December 2026 upon completion of the widening work. RMS has recognised an additional emerging asset for the M5 expansion to the end of the concession period, i.e. to 10 December 2026. The total carrying value of the M5 South-West Motorway emerging asset, including the M5 widening, is $398.4million as at 30 June 2018 (2017: $354.0 million).

Roads and Maritime Services Notes to the financial statements for the year ended 30 June 2018
52
13. Non-current assets - intangibles assets and other (continued) Eastern Distributor An agreement was signed with the concession holder on 27 June 1997 to finance, design, construct, operate, maintain and repair the Eastern Distributor which was opened to traffic on 23 July 2000. In consideration of RMS granting to the concession holder the right to levy and retain tolls on the Eastern Distributor, the concession holder is required to pay concession fees in accordance with the Agreement. From the date of Financial Close, which occurred on 18 August 1997, the concession holder has paid $285 million by way of promissory notes (being $15 million on Financial Close and $15 million on each anniversary of Financial Close). A further $2.2 million was received in cash six months after Financial Close and $8 million in cash on the third anniversary of Financial Close. Under the Agreement, the promissory notes show a payment date (subject to provisions in the Project Deed) of 24 July 2048 and, as at 30 June 2018, the promissory notes have a value of $20.6 million (2017: $18.7million) (refer note 11). Under the terms of the Project Deed, ownership of the Eastern Distributor will revert to RMS on the earlier of the achievement of specified financial returns outlined in the Deed or 48 years from the Eastern Distributor Commencement Date of 23 July 2000. The conservative period of 48 years has been used to calculate RMS’ emerging share of the asset. The total carrying value of the Eastern Distributor emerging asset is $189.3 million as at 30 June 2018 (2017: $167.0 million).
Cross City Tunnel An agreement was signed with the concession holder on 18 December 2002 to design, construct, operate and maintain the Cross City Tunnel. Major construction started on 28 January 2003. The Cross City Tunnel was completed and opened to traffic on 28 August 2005. The construction cost was $642.0 million with the cost being met by the private sector. Under the terms of the agreement, an external party will operate the motorway until 18 December 2035, after which the motorway will be transferred back to RMS. Reimbursement of certain development costs was received by RMS from the operator in the form of an upfront cash payment in August 2005. The amount of this payment was $96.9 million. The total carrying value of the Cross City Tunnel emerging asset is $279.3 million as at 30 June 2018 (2017: $248.4 million).

Roads and Maritime Services Notes to the financial statements for the year ended 30 June 2018
53
13. Non-current assets - intangibles assets and other (continued) Westlink M7 Motorway An agreement was signed with the concession holder on 13 February 2003 to design, construct, operate and maintain the Westlink M7 Motorway. Major construction started on 7 July 2003 and the completed motorway was opened to traffic on 16 December 2005. The construction cost was $1.5 billion. The Federal Government contributed $356.0 million towards the cost of the project with the remainder of the cost being met by the private sector. RMS had responsibility under the contract for the provision of access to property required for the project. As a result of the NSW government entering into agreement with the concession holder to build NorthConnex (refer below), the concession period on the Westlink M7 motorway has been extended from 14 February 2037 to 30 June 2048. Under the terms of the agreement, the concession holder will operate Westlink M7 until 30 June 2048, after which the motorway will be transferred back to RMS. Reimbursement of certain development costs were received by RMS from the operator in the form of an upfront cash payment in January 2006. The amount of this payment was $193.8 million. The total carrying value of the Westlink M7 Motorway emerging asset is $575.6 million as at 30 June 2018 (2017: $508.9 million).
At the time of the modification to the contract for the NorthConnex RMS was expected to receive a further $358.8 million (nominal value) in concession fees over a period from 30 September 2015 to 31 March 2037 (refer to Note 20). The concession receivable was subsequently monetised in October 2015 in which RMS received $174.2 million proceeds.
Lane Cove Tunnel An agreement was signed with the concession holder on 4 December 2003 to finance, design, construct, operate and maintain the Lane Cove Tunnel Project. Major construction started on 24 June 2004 and the tunnel was opened to traffic on 25 March 2007. The construction cost was $1.1 billion, with the cost being met by the private sector. RMS was responsible under the contract for the provision of access to property required for the project, which was identified by the Project Deed. On 31 January 2015, the concession term on the Lane Cove Tunnel was conditionally extended from 9 January 2037 to 30 June 2048. Under the terms of the agreement, the concession holder will operate the Lane Cove Tunnel until 30 June 2048, after which the motorway will be transferred back to RMS. Reimbursement of certain development costs were received by RMS from the operator in the form of an upfront cash payment in April 2007. The amount of this payment was $79.3 million. The total carrying value of the Lane Cove Tunnel emerging asset is $350.4 million as at 30 June 2018 (2017: $309.7 million). In consideration for the extension of the concession term, RMS will receive a further $200 million in concession fees over a period from 31 December 2017 to 30 June 2019 (refer to note 20). As at 30 June 2018, RMS has received $45.0 million in concession fees (2017: $0). RMS values the concession receivable at amortised cost. As at 30 June 2018, these future receipts have a value of $146.9 million (2017: $183.1 million) (refer to Note 11).

Roads and Maritime Services Notes to the financial statements for the year ended 30 June 2018
54
13. Non-current assets - intangibles assets and other (continued) NorthConnex An agreement was signed with the concession holder on 31 January 2015 to finance, design, construct, operate and maintain the NorthConnex motorway. The motorway is estimated to cost approximately $3.0 billion to complete. Under the terms of the agreement, RMS will contribute $992.6 million in cash towards the construction, construction management and property acquisition costs, and the balance will be financed by the concession holder. RMS will receive up to $412.3 million from Restart NSW and up to $405.0 million from the federal government in the form of non-reciprocal cash grants to finance the bulk of its contribution. On completion of construction, which is expected to be in 2019, the project deed stipulates that the concession holder will operate the motorway until 30 June 2048, after which the motorway will be transferred back to RMS. Up until the end of the concession period, RMS will grant the concession holder the right to levy and retain tolls on the motorway. In consideration for building the NorthConnex motorway, the NorthConnex agreement also provides for enhanced concession terms to the operator in the form of an extension of the concession terms on the Westlink M7 motorway, Lane Cove Tunnel and M2 Motorway to 30 June 2048. When the motorway is open to the public, RMS will value the NorthConnex asset by reference to RMS’ emerging share of the depreciated replacement cost of the asset over the period of the concession period calculated using the effective interest rate method (refer note 3(f)). As at 30 June 2018, RMS has not recognised an emerging asset. WestConnex The WestConnex project comprises three stages including M4 Widening and M4 East Tunnel (New M4), construction of the new M5 Tunnel, and the M4-M5 link. M4 Widening and New M4 (Stage 1) The Stage 1 Project Deed was signed with the concession holder on 4 June 2015 to design, construct, operate and maintain part of the WestConnex motorway including widening the M4 West motorway (Stage 1A), and the construction of surface works and new tunnels for M4 East (Stage 1B). Stage 1A was opened to traffic on 4 July 2017 and the completion of Stage 1B construction is expected to be in 2019. The Project Deed stipulates that the concession holder will operate the motorway until 2060, after which the motorway will be transferred back to RMS at no cost. Up until the end of the concession period, RMS will grant the concession holder the right to levy and retain tolls on the motorway. Under the Project Deed, RMS is entitled to a share of tolling revenue above the base revenue threshold. As the revenue is contingent upon the level of traffic on the road, RMS will only recognise the revenue when it has been determined that the actual tolling revenue collected has exceeded the threshold. The total carrying value of the M4 Widening (Stage 1A) emerging asset is $7.1 million as at 30 June 2018 (2017: $Nil).

Roads and Maritime Services Notes to the financial statements for the year ended 30 June 2018
55
13. Non-current assets - intangibles assets and other (continued) New M5 (Stage 2) The Stage 2 Deed was signed on 20 November 2015 to develop and upgrade the existing M5 East from Beverly Hills to St Peters. Under the Stage 2 Project Deed, RMS granted the concession holders a right to design, construct, operate, maintain and collect tolls until 2060. As part of the arrangement, RMS will grant Motorway Stratum Land Leases over New M5 Main Works and M5 East Lease from January 2020 (unless the toll road is opened prior), and M5 West Lease from December 2026 to the termination date of 31 December 2060. Under the Stratum Land Lease, RMS is entitled to a share of tolling revenue above the base revenue threshold. As the revenue is contingent upon the level of traffic on the road, RMS will only recognise the revenue when it has been determined that the actual tolling revenue collected has exceeded the threshold. New M4 and New M5 (Stage 1B and 2) RMS will not recognise any amounts relating to the improvement of the roads during the design and construction phase, as the risks and rewards of the improvements to the road rest with the operator. When the motorways are open to the public, RMS will value the WestConnex assets by reference to RMS’ emerging share of the depreciated replacement cost of the assets over the concession period calculated using the effective interest rate method (refer note 3(f)). As at 30 June 2018, RMS has not recognised an emerging asset. M4-M5 Link (Stage 3) The Stage 3A Deed was signed with the concession holder on 12 June 2018 to design, construct, operate and maintain the main tunnel connecting the M4 East at Haberfield to the New M5 at the St Peters Interchange, via Rozelle and Camperdown. The Project Deed stipulates that the concession holder will operate the motorway until 31 December 2060, after which the motorway will be transferred back to RMS at no cost. Up until the end of the concession period, RMS will grant the concession holder the right to levy and retain tolls on the motorway.
The Stage 3B is currently in the development phase and it is not expected any agreements will be reached with the proposed concession holder until the 2018-19 financial year.

Roads and Maritime Services Notes to the financial statements for the year ended 30 June 2018
56
13. Non-current assets - intangibles assets and other (continued) (b) Other intangible assets
2018 2017
Notes $'000 $'000
Balance at start of year Information technology system: Cost 368,727 333,611 Accumulated amortisation and impairment (199,561) (176,083) Net carrying amount at the start of year 169,166 157,528 Balance at end of year Information technology system: Cost 371,015 368,727 Accumulated amortisation and impairment (217,219) (199,561) Net carrying amount at end of year 153,796 169,166 Net carrying amount at start of year 169,166 157,528 Additions
19,037 15,946
Disposals 4 (437) (271) Transfer (to)/from PPE 12 3,390 30,809 Amortisation expense 2(d) (37,360) (34,846) Net carrying amount at end of year 13(b) 153,796 169,166
Recognition and Measurement RMS recognises intangible assets only if it is probable that future economic benefits will flow to RMS and the cost of the asset can be measured reliably. Intangible assets are measured initially at cost. All research costs are expensed. Development costs are only capitalised when certain criteria are met. Intangible assets are tested for impairment where an indicator of impairment exists. If the recoverable amount is less than its carrying amount, the carrying amount is reduced to recoverable amount and the reduction is recognised as an impairment loss. Following initial recognition, intangible assets are carried at cost less any accumulated amortisation and impairment losses. Asset Valuation policy Depreciation policy Intangible assets Depreciated historical cost Amortised using the straight-line method over the
estimated useful life of between 2 and 10 years.
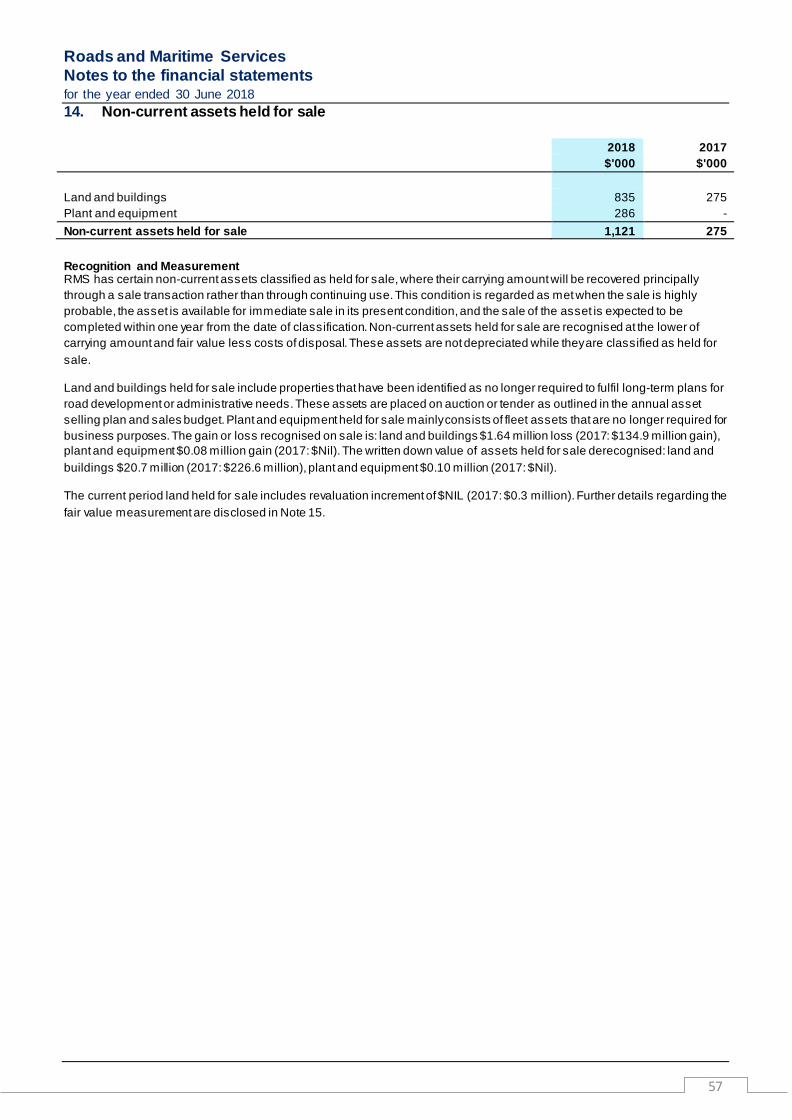
Roads and Maritime Services Notes to the financial statements for the year ended 30 June 2018
57
14. Non-current assets held for sale
2018 2017
$'000 $'000
Land and buildings 835 275 Plant and equipment 286 - Non-current assets held for sale 1,121 275 Recognition and Measurement RMS has certain non-current assets classified as held for sale, where their carrying amount will be recovered principally through a sale transaction rather than through continuing use. This condition is regarded as met when the sale is highly probable, the asset is available for immediate sale in its present condition, and the sale of the asset is expected to be completed within one year from the date of classification. Non-current assets held for sale are recognised at the lower of carrying amount and fair value less costs of disposal. These assets are not depreciated while they are classified as held for sale.
Land and buildings held for sale include properties that have been identified as no longer required to fulfil long-term plans for road development or administrative needs. These assets are placed on auction or tender as outlined in the annual asset selling plan and sales budget. Plant and equipment held for sale mainly consists of fleet assets that are no longer required for business purposes. The gain or loss recognised on sale is: land and buildings $1.64 million loss (2017: $134.9 million gain), plant and equipment $0.08 million gain (2017: $Nil). The written down value of assets held for sale derecognised: land and buildings $20.7 million (2017: $226.6 million), plant and equipment $0.10 million (2017: $Nil).
The current period land held for sale includes revaluation increment of $NIL (2017: $0.3 million). Further details regarding the fair value measurement are disclosed in Note 15.

Roads and Maritime Services Notes to the financial statements for the year ended 30 June 2018
58
15. Fair value measurement of non-financial assets (a) Fair value hierarchy Fair value is the price that would be received to sell an asset or paid to transfer a liability in an orderly transaction between market participants at the measurement date. The fair value measurement is based on the presumption that the transaction to sell the asset or transfer the liability takes place either in the principal market for the asset or liability or in the absence of a principal market, in the most advantageous market for the asset or liability. When measuring fair value, the valuation technique used maximises the use of relevant observable inputs and minimises the use of unobservable inputs. Under AASB 13, the entity categorises, for disclosure purposes, the valuation techniques based on the inputs used in the valuation techniques as follows: • Level 1 - quoted prices in active markets for identical assets / liabilities that the entity can access at the measurement
date. • Level 2 – inputs other than quoted prices included within Level 1 that are observable, either directly or indirectly. • Level 3 – inputs that are not based on observable market data (unobservable inputs). The entity recognises transfers between levels of the fair value hierarchy at the end of the reporting period during which the change has occurred. Refer to note 30 for further disclosures regarding fair value measurements of financial and non-financial assets.
Level 1 Level 2 Level 3 Total fair value
2018 2018 2018 2018
$'000 $'000 $'000 $'000
Property, plant and equipment Land and buildings - 3,660,886 - 3,660,886 Infrastructure systems* - - 81,222,312 81,222,312 Non-current assets held for sale - 1,121 - 1,121 - 3,662,007 81,222,312 84,884,319
Level 1 Level 2 Level 3 Total fair
value
2017 2017 2017 2017
$'000 $'000 $'000 $'000
Property, plant and equipment Land and buildings - 3,630,252 - 3,630,252 Infrastructure systems* - - 73,065,567 73,065,567 Non-current assets held for sale - 275 - 275 - 3,630,527 73,065,567 76,696,094 *Work in progress is measured at cost and has been excluded from Note 15 Fair value measurement of non-financial assets note disclosure.

Roads and Maritime Services Notes to the financial statements for the year ended 30 June 2018 15. Fair value measurement of non-financial assets (continued)
59
(b) Valuation techniques, inputs and processes Valuation Technique Valuation input Roads Depreciated replacement cost of significant road asset components:
Pavements Asphalt Concrete Spray Culverts Drainage Longitudinal Subsoil Safety Barriers Fences Retaining Walls
Medians Rest Areas Noise Walls
Other Assets are depreciated over estimated useful life depending on road component type (Note 12). Fair value is re-valued in interim periods between comprehensive revaluations by movements in the RBCI. The determination of unit replacement rates for road valuations is carried out at least every 5 years by independent externally engaged qualified engineering contractors and employees of RMS.
Replacement cost per unit of road asset component. Cost per unit has been determined by reference to unit prices quoted in the most recent road construction tender documents. The price range is adjusted to eliminate outlier amounts. RBCI is applied to the replacement cost of the components, to ensure that carrying amounts are at fair value. Components are depreciated over their estimated useful life depending on road component type or remaining useful life depending on road assets’ condition as depicted by the pavement health index (PHI) or culvert risk ratings
Land under roads The urban Average Rateable Value per hectare within each Local Government Area (LGA) is adjusted by an “open spaces ratio” to approximate fair value (unimproved and pre-subdivision land). The urban Average Rateable Value by LGA is derived from data provided by the Valuer-General.
Local Government Area rateable land values provided by the NSW Valuer-General. Measurements of land area in situ under roads.
Bridges Depreciated replacement cost for the following bridge types: Timber Structures Concrete structures Steel structures Bridge Trusses (timber and steel) Heritage Bridges Bridge size culverts/tunnels Bridge assets are depreciated over estimated useful depending on bridge type (Note 12).
Replacement cost per unit of bridge assets. Cost per unit has been determined by reference to unit prices quoted in the most recent bridge construction tender documents. The price range is adjusted to eliminate outlier amounts. RBCI is applied to the replacement cost of the assets, to ensure that carrying amounts are at fair value.

Roads and Maritime Services Notes to the financial statements for the year ended 30 June 2018 15. Fair value measurement of non-financial assets (continued)
60
Valuation Technique Valuation input Cost/m2 rates per bridge type are derived from current estimated bridge construction costs. Bridge asset fair value is determined by applying the replacement rate by type to bridge area. Fair value is re-valued in interim periods between comprehensive revaluations by movements in the RBCI. The determination of replacement rates for bridge valuations is carried out at least every 5 years by independent externally engaged qualified engineering contractors and employees of RMS.
Assets are depreciated over their remaining useful life depending on bridges’ condition as depicted by the element condition data or estimated useful life depending on the bridge’s capitalisation type.
Sydney Harbour Tunnel Depreciated replacement cost of major asset components: Immersed Tube Mechanical and Electrical Pavement Earthworks Assets are depreciated over estimated useful life depending on component type (Note 12).
The Sydney Harbour Tunnel (SHT) was initially valued in 2009 as part of a review of the extant accounting treatment of the asset at that time. A key outcome of that review was an initial recognition of the physical asset in the financial statements of the former Roads and Traffic Authority. Thereafter, the SHT has been revalued annually by the RBCI. The RBCI is applied to the replacement cost of the components, to ensure that carrying amounts are at fair value. The fair value at that time was derived by indexing (RBCI) estimates of the initial construction cost of the SHT and the relative proportions of its major component types. Depreciation was applied over estimates of useful lives of those component types. There has been no material change to either the initial estimates or the valuation process.
Traffic Signals Network Depreciated replacement cost. Assets are depreciated over estimated useful life (Note 12). Fair value is re-valued in interim periods between comprehensive revaluations by movements in the RBCI. The determination of traffic signal unit replacement rates for valuations is carried out at least every 5 years by externally engaged qualified engineering contractors and employees of RMS.
Current unit replacement costs. RBCI is applied to the replacement cost of assets to ensure the carrying amounts are at fair value.
Traffic Control Network Depreciated replacement cost of major asset components: Current unit replacement costs.

Roads and Maritime Services Notes to the financial statements for the year ended 30 June 2018 15. Fair value measurement of non-financial assets (continued)
61
Valuation Technique Valuation input Traffic Systems Transport Management Centre Variable Message signs Assets are depreciated over estimated useful life depending on component type (Note 12). Fair value is re-valued in interim periods between comprehensive revaluations by movements in the RBCI. The determination of traffic control system unit replacement rates for valuations is carried out at least every 5 years by externally engaged qualified engineering contractors and employees of RMS.
RBCI is applied to the replacement cost of assets to ensure the carrying amounts are at fair value.
Maritime Assets Depreciated replacement cost for: * Wharves and jetties * Dredging assets * Seawall * Maritime roads Assets are depreciated over estimated useful life depending on asset type (Note 12). Fair value is re-valued in interim periods between comprehensive revaluations by obtaining letter of assurances from the external valuers. The determination of asset replacement rates for valuations is carried out at least every 5 years by externally engaged professionals and employees of RMS. Income Approach for: Moorings and wetlands Estimates of total revenue earned on long term mooring and wetland leases are capitalised at net present value.
Current unit replacement costs. Estimated total lease revenue.

Roads and Maritime Services Notes to the financial statements for the year ended 30 June 2018 15. Fair value measurement of non-financial assets (continued)
62
(c) Reconciliation of recurring Level 3 fair value measurements
Roads Land under roads Bridges
Sydney Harbour
Tunnel
Traffic signals
network
Traffic controls network
Maritime assets TOTAL
$ '000 $ '000 $ '000 $ '000 $ '000 $ '000 $ '000 $ '000 2018 Net carrying amount at start of year 53,735,359 2,176,261 15,351,566 942,684 120,500 166,249 572,948 73,065,567
Additions 486,397 - 109,195 - 3,934 12,550 - 612,076 Assets recognised for the first time 18,697 - 25,346 - - - - 44,043
Net revaluation increments less revaluation decrements recognised in equity 7,576,114 (413,642) 301,184 13,128 - 2,130 196,965 7,675,879
Net revaluation increments less revaluation decrements recognised in net result - - - - 1,470 - - 1,470
Asset write-off (96,563) - (13,447) - (212) (4,490) (1,268) (115,980) Reclassification between PPE classes 1,665,714 - 378,702 - - - 44,110 2,088,526 Transfer from Level 2 - 46,959 - - - - - 46,959 Reclassifications (to)/from other assets (94,530) - (340,875) - - (2,036) - (437,441) Depreciation expense (1,292,328) - (202,758) (15,529) (21,664) (15,106) (12,038) (1,559,423) Transfer to councils (180,103) (1,607) (17,654) - - - - (199,364) Net carrying amount at end of year 61,818,757 1,807,971 15,591,259 940,283 104,028 159,297 800,717 81,222,312
2017 Net carrying amount at start of year 52,974,065 1,957,927 14,965,069 952,578 137,034 153,833 552,841 71,693,347 Additions 687,560 - 210,199 - 4,200 29,993 - 931,952 Assets recognised for the first time 21,420 - 12,594 - - - - 34,014
Net revaluation increments less revaluation decrements recognised in equity 588,732 180,406 94,375 5,364 - 807 15,772 885,456
Net revaluation increments less revaluation decrements recognised in net result - - - - 733 - - 733
Asset write-off (118,779) - (4,709) - (76) (3,374) (1,117) (128,055) Reclassification between PPE classes 920,736 - 281,485 - - - 16,760 1,218,981 Transfer from Level 2 - 38,052 - - - - 68 38,120 Depreciation expense (1,304,913) - (201,224) (15,258) (21,391) (15,010) (11,376) (1,569,172) Transfer to councils (34,308) (147) (6,223) - - - - (40,678) Transfer from councils 846 23 - - - - - 869 Net carrying amount at end of year 53,735,359 2,176,261 15,351,566 942,684 120,500 166,249 572,948 73,065,567
Parcels of land are transferred from LAFFRW (level 2) to Land Under Roads (level 3) w hen construction begins. Refer Note 12 for RMS policy for determining w hen transfers are deemed to have occurred.

Roads and Maritime Services Notes to the financial statements for the year ended 30 June 2018
63
16. Restricted Assets
2018 2017
$'000 $'000
Cash and cash equivalents 369,268 334,013
Holders of E-tags provide an initial amount as a security deposit for the use of the actual E-tag. The deposit is refundable upon closure of the associated E-tag account. Monies received for these deposits of $56.4 million (2017: $55.2 million) are held within the Treasury Banking System. Transactions on this account are restricted to activity relating to E-Tag deposits. Funds administered on behalf of the Maritime Waterways fund are restricted to activity relating to the maritime transactions. The monies of $265.4 million (2017: $226.6 million) are held within Westpac Bank Accounts that are included in the Treasury Banking System. They are controlled by RMS and are covered by Section 42 of the Ports and Maritime Administration Act 1995. Funds relating to land acquisitions by the state, the authority of the state are required to keep the money in a fund for the person entitled to the compensation concerned. Monies received for these deposits of $47.5 million (2017: $43.5 million) are held within the Treasury Banking System. Transactions on this account are restricted to activity relating to land acquisitions. Funds administered on behalf of the Tow Truck Industry Fund and are restricted to activity relating to the fund. The balance of $NIL this financial year (2017: $8.5 million) is due to the Tow Truck account ownership being transferred to the DFSI on 15 October 2017. Transactions on this account are restricted to activity relating to Tow Truck Licensing. Rental bonds are held against RMS properties that are leased to various customers. The funds are interest-bearing and are due to customers at the end of the lease period. Monies received for these deposits of $0.01 million (2017: $0.2 million) are held within Westpac Bank Accounts that are included in the Treasury Banking System. Transactions on these accounts are restricted to rental payments.

Roads and Maritime Services Notes to the financial statements for the year ended 30 June 2018
64
17. Payables
2018 2017
$'000 $'000
(i) Current payables Accrued expenses
- Work carried out by councils 151,776 135,429 - Works contract expenditure 406,475 415,772 - Other (including non-works contracts) 264,512 252,117 Trade creditors* 108,790 169,350 Creditors arising from compulsory acquisitions 236,098 115,176 Personnel services 71,949 61,956 Other 97,775 88,519 Current payables 1,337,375 1,238,319 (ii) Non-current payables Personnel services 5,349 7,469 Other 3,811 7,623 Non-current payables 9,160 15,092 *The average credit period on purchases of goods is 30 days. RMS has financial risk management policies in place to ensure that all payables are paid within the credit timeframe. Recognition and Measurement
Payables represent liabilities for goods and services provided to RMS and other amounts, including interest. Short-term payables with no stated interest rate are measured at the original invoice amount where the effect of discounting is immaterial.
Payables are recognised initially at fair value. Subsequent measurement is at amortised cost using the effective interest method.
Subsequent to the commencement of the Government Sector Employment Act 2013, the RMS Group of employees were transferred to Transport Service. Accordingly, employee related provisions are no longer recognised and instead disclosure reflects the personnel services payable to Transport Service.
Details regarding credit risk, liquidity risk and market risk, including a maturity analysis of the above payables are disclosed in Note 30.

Roads and Maritime Services Notes to the financial statements for the year ended 30 June 2018
65
18. Borrowings
2018 2017
Notes $'000 $'000
(i) Current - Unsecured Finance lease - Sydney Harbour Tunnel 22(c) 60,558 53,680 Current borrowings 60,558 53,680 (ii) Non-current - Unsecured Finance lease - Sydney Harbour Tunnel 22(c) 244,575 305,133 Non-current borrowings 244,575 305,133
Details regarding credit risk, liquidity risk and market risk, including maturity analysis of the above borrowings are disclosed in Note 30. Recognition and Measurement
Finance lease liabilities are recognised in accordance with AASB117 Leases. Minimum lease payments made under finance leases are apportioned between the interest expense and the reduction of the outstanding liability. The finance expense is allocated to each period during the lease term so as to produce a consistent periodic rate of interest on the remaining balance of the liability. Changes in liabilities arising from financing activities:
$’000 1 July 2017 Cash Non-cash 30 June 2018 Lease liability 358,813 (53,680) - 305,133 Total 358,813 (53,680) - 305,133
Financial guarantees A financial guarantee contract is a contract that requires the issuer to make specified payments to reimburse the holder for a loss it incurs because a specified debtor fails to make payment when due in accordance with the original or modified terms of a debt instrument. Financial guarantee contracts are recognised as a liability at the time the guarantee is issued and initially recognised at fair value plus, in the case of financial guarantees not at fair value through profit or loss, directly attributable transaction costs, where material. After initial recognition, the liability is measured at the higher of the amount determined in accordance with AASB 137 Provisions, Contingent Liab ilities and Contingent Assets and the amount initially recognised, less accumulated amortisation, where appropriate. RMS carries out minor works contracts for entities outside of the NSW public sector. In order to tender for the contracts and remain on an equal footing, RMS is required to lodge a security deposit in the form of bank guarantee. Under the Public Authorities and (Financial Arrangements) Act 1987, RMS has an approved limit from TCorp of $3.0 million which expired on 30 June 2018. RMS has reviewed its financial guarantees and determined that there is no material liability to be recognised for financial guarantee contracts as at 30 June 2018 and as at 30 June 2017. Refer to note 23 regarding disclosures on contingent liabilities.

Roads and Maritime Services Notes to the financial statements for the year ended 30 June 2018
66
19. Provisions
2018 2017
$'000 $'000
(i) Current provisions Provision for makegood - leasehold 2,294 2,108 Provision for remediation - land 6,923 5,000 Other 7,283 - Current provisions 16,500 7,108 (ii) Non-current provisions Provision for makegood - leasehold 11,941 10,605 Other 14,162 - Non-current provisions 26,103 10,605 Total provisions 42,603 17,713
Movements in each class of provision during the financial year, other than employee benefits, are set out below:
Provision for
makegood - leasehold
Provision for
remediation - land
Other Total
$'000 $'000 $'000 $'000
Carrying amount at start of year 12,713 5,000 - 17,713 Additional provisions recognised 2,565 2,785 21,445 26,795 Unused amounts reversed (867) - - (867) Unwinding/ change in the discount rate 132 - - 132 Amounts utilised (308) (862) - (1,170) Carrying amount at end of year 14,235 6,923 21,445 42,603 The makegood leaseholds provision is calculated on all leased properties where RMS is the lessee and reflects an estimate of the cost to makegood the premises to their original condition at the end of the lease term. The calculated provision balance as at 30 June 2018 is based on per square metre rates ranging from $103 to $228 (2017: $101 to $222), adjusted by CPI of 2.25% (2017: 2.25%) and discounted at an average rate of 2.14% (2017: 1.85%). The level of the provision is reviewed at the end of each year. Recognition and Measurement Provisions are recognised when RMS has a present legal or constructive obligation as a result of a past event; it is probable that an outflow of resources will be required to settle the obligation; and a reliable estimate can be made of the amount of the obligation.
Any provisions for restructuring are recognised only when the organisation has a detailed formal plan and has raised a valid expectation in those affected by the restructuring that it will carry out the restructuring by starting to implement the plan or announcing its main features to those affected. If the effect of the time value of money is material, provisions are discounted at a pre-tax rate that reflects the current market assessments of the time value of money and the risks specific to the liability. When discounting is used, the increase in the provision due to the passage of time (i.e. unwinding of discount rate) is recognised as a finance cost. A provision has been made for the present value of anticipated costs of future environmental restoration, make good leases and land restorations. The calculation of this provision requires assumptions such as application of environmental legislation, community expectations, available technologies and cost estimates. These uncertainties may result in future actual

Roads and Maritime Services Notes to the financial statements for the year ended 30 June 2018
67
19. Provisions (continued) expenditure differing from the amounts currently provided. The provision recognised is periodically reviewed and updated based on the facts and circumstances available at the time. Changes to the estimated future costs are recognised in the statement of financial position by adjusting both the expense and/or asset (if applicable) and the provision 20. Other liabilities
2018 2017
$'000 $'000
(i) Current liabilities - other Statutory creditors 18,972 11,551 Unearned rent on M5 Motorway 513 513 Sydney Harbour Tunnel tax liabilities 4,525 2,153 Income received in advance 51,245 17,871 Holding accounts 162,216 155,711 Deferred revenue - reimbursement on private sector provided infrastructure 19,030 19,030 Priority list on moorings 487 457 Wetland security deposits* 1,524 1,676 Boating fees in advance** 33,619 34,617 Current liabilities - other 292,131 243,579 (ii) Non-current liabilities - other Unearned rent on M5 motorway 3,823 4,336 Sydney Harbour Tunnel tax liabilities 15,695 19,482 Income received in advance 68,851 70,293 Deferred revenue - reimbursement on private sector provided infrastructure 512,021 531,051 Boating fees in advance 34,227 26,959 Non-current liabilities - other 634,617 652,121
*This amount mainly represents cash deposits, in lieu of bank guarantees, received from the developer of King Street Wharf, as security over the completion of specif ic stages of the construction project. **Boating fees in advance comprises prepayments by customers for licences, registrations and moorings for the service component w hich w ill be provided by NSW Maritime in the future. Additional disclosures relating to specific items of Other Liabilities are detailed below:
2018 2017
Sydney Harbour Tunnel tax liabilities $'000 $'000 Sydney Harbour Tunnel past tax liability 1,865 1,815 Sydney Harbour Tunnel future tax liability 2,660 338 Current 4,525 2,153 Sydney Harbour Tunnel past tax liability 5,069 6,513 Sydney Harbour Tunnel future tax liability 10,626 12,969 Non-current 15,695 19,482 Unearned rent and deferred revenue on motorways
The land acquisition loan of $22.0 million, based on the cost of land under the M5 Motorway originally purchased by RMS, was repaid in June 1997 by the concession holder. The repayment of the loan is considered to be a prepayment of the remaining rental over the period of the concession agreement. In accordance with AASB 117 Leases, this revenue is brought to account over the period of the lease. In consideration for the concession holder undertaking construction of an interchange at Moorebank (M5 Motorway Improvements) on the M5 Motorway, the original concession period (to 14 August 2022) has been extended to 10 December 2026.

Roads and Maritime Services Notes to the financial statements for the year ended 30 June 2018
68
20. Other liabilities (continued)
2018 2017
$ '000 $ '000
Rent earned in prior year 17,150 16,637 Rent earned in current year 513 513 Unearned rent as at year end (current and non-current) 4,337 4,850 Unearned rent 22,000 22,000 NSW Treasury has mandated the adoption of TPP 06–08 "Accounting for Privately Funded Projects" which requires revenue to be brought to account over the period of the concessions. Under the various Private Sector Provided Infrastructure, $369.9 million was received following the letting of the Lane Cove Tunnel, Cross City Tunnel and Western M7 Motorway contracts as reimbursement of development costs. In addition, as a result of the signing of the NorthConnex agreement on 31 January 2015, RMS is to receive concession fees of $358.8 million in relation to the M7 Motorway and $200.0 million in relation to Lane Cove Tunnel (nominal values, refer to Note 13(a)). RMS have recorded the present value of these future cash flows as deferred revenue; reimbursement of development costs of $231.8 million (2017: $240.9 million) and the concession payments of $295.3 million (2017: $305.2 million). RMS will amortise the liability over the concession period. The amortisation and deferred revenue balances are shown in the table below. Promissory notes are to be received in respect of M2 and Eastern Distributor. M2 promissory notes are redeemable in 2046 and Eastern Distributor promissory notes are redeemable in 2048. RMS have recorded the present value of these future cash flows of $3.9 million (2017: $4.0 million) as deferred revenue and will amortise the liability over the concession period. The amortisation and deferred revenue balances are shown in the table below.
2018 2017
$ '000 $ '000
Amortisation of deferred revenue in prior years 129,018 119,961 Amortisation of deferred revenue in current year 9,057 9,057 Unearned reimbursement as at year end 231,841 240,898 Reimbursement of development costs for Lane Cove Tunnel, Gross City Tunnel and Western M7 Motorway 369,916 369,916
Amortisation of deferred revenue in prior years 23,774 13,936 Amortisation of deferred revenue in current year 9,838 9,838 Unearned reimbursement as at year end 295,341 305,179 Lane Cove Tunnel and M7 Motorway Concession Payments 328,953 328,953 Amortisation of deferred revenue in prior years 2,687 2,552 Amortisation of deferred revenue in current year 135 135 Unearned reimbursement as at year end 3,869 4,004 M2 and Eastern Distributor Promissory Notes 6,691 6,691 Total Unearned reimbursement as at year end 531,051 550,081 Classified as:
Current 19,030 19,030 Non-current 512,021 531,051 Total 531,051 550,081
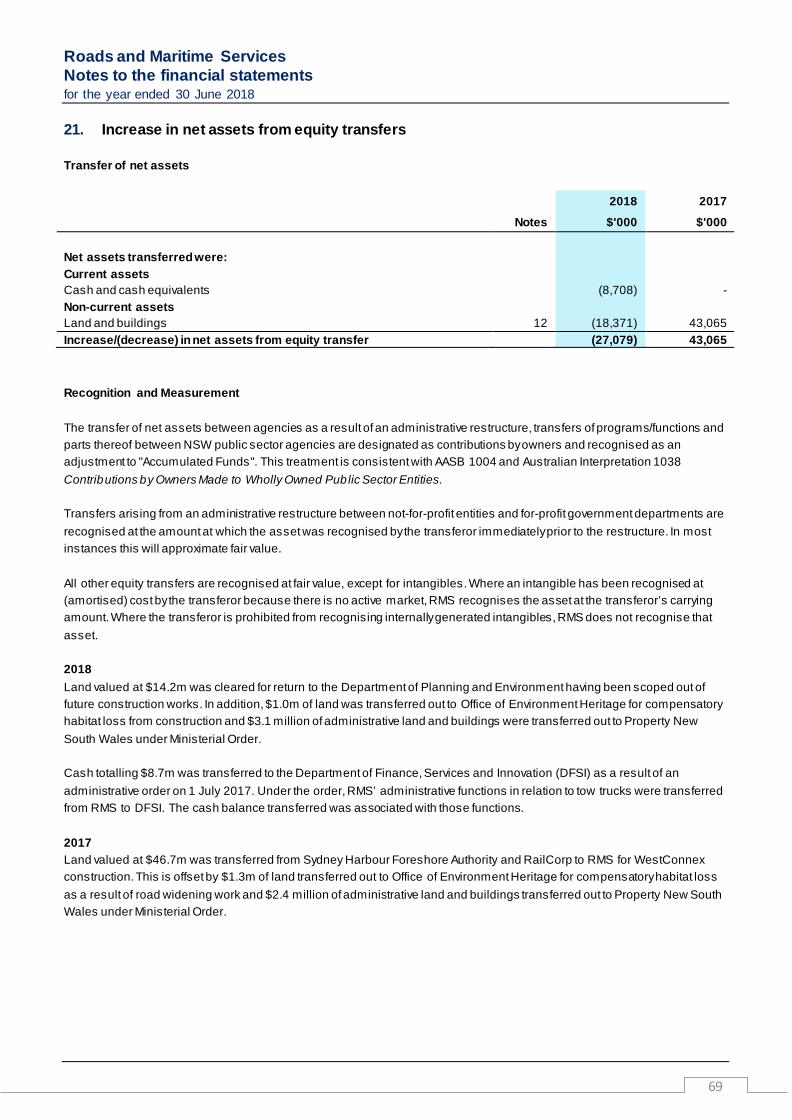
Roads and Maritime Services Notes to the financial statements for the year ended 30 June 2018
69
21. Increase in net assets from equity transfers Transfer of net assets
2018 2017
Notes $'000 $'000 Net assets transferred were: Current assets Cash and cash equivalents (8,708) - Non-current assets Land and buildings 12 (18,371) 43,065 Increase/(decrease) in net assets from equity transfer (27,079) 43,065 Recognition and Measurement The transfer of net assets between agencies as a result of an administrative restructure, transfers of programs/functions and parts thereof between NSW public sector agencies are designated as contributions by owners and recognised as an adjustment to "Accumulated Funds". This treatment is consistent with AASB 1004 and Australian Interpretation 1038 Contributions by Owners Made to Wholly Owned Public Sector Entities. Transfers arising from an administrative restructure between not-for-profit entities and for-profit government departments are recognised at the amount at which the asset was recognised by the transferor immediately prior to the restructure. In most instances this will approximate fair value. All other equity transfers are recognised at fair value, except for intangibles. Where an intangible has been recognised at (amortised) cost by the transferor because there is no active market, RMS recognises the asset at the transferor’s carrying amount. Where the transferor is prohibited from recognising internally generated intangibles, RMS does not recognise that asset. 2018 Land valued at $14.2m was cleared for return to the Department of Planning and Environment having been scoped out of future construction works. In addition, $1.0m of land was transferred out to Office of Environment Heritage for compensatory habitat loss from construction and $3.1 million of administrative land and buildings were transferred out to Property New South Wales under Ministerial Order. Cash totalling $8.7m was transferred to the Department of Finance, Services and Innovation (DFSI) as a result of an administrative order on 1 July 2017. Under the order, RMS’ administrative functions in relation to tow trucks were transferred from RMS to DFSI. The cash balance transferred was associated with those functions. 2017 Land valued at $46.7m was transferred from Sydney Harbour Foreshore Authority and RailCorp to RMS for WestConnex construction. This is offset by $1.3m of land transferred out to Office of Environment Heritage for compensatory habitat loss as a result of road widening work and $2.4 million of administrative land and buildings transferred out to Property New South Wales under Ministerial Order.

Roads and Maritime Services Notes to the financial statements for the year ended 30 June 2018
70
22. Commitments for expenditure (a) Capital Commitments Aggregate capital expenditure for the roadworks contracted for at balance date and not provided for:
2018 2017
$'000 $'000
Within one year 1,554,456 2,739,197 Later than one year and not later than five years 1,716,809 704,005 Later than five years - 151 Total (including GST) 3,271,265 3,443,353 (b) Operating lease commitments
Operating lease commitments relate to property, light and heavy motor vehicles and maritime. Operating lease commitments are not recognised in the financial statements as liabilities. Total operating lease commitments are as follows:
2018 2017
$'000 $'000
Within one year 56,689 51,702 Later than one year and not later than five years 122,202 72,185 Later than five years 13,898 13,464 Total (including GST) 192,789 137,351
The property operating lease commitments are as follows:
2018 2017
$'000 $'000
Within one year 31,686 27,826 Later than one year and not later than five years 82,001 41,684 Later than five years 9,701 12,535 Total (including GST) 123,388 82,045 In respect of property leases, RMS has various lessors with leases that have specific lease periods ranging from one year to 20 years. The light motor vehicle operating lease commitments are as follows:
2018 2017
$'000 $'000
Within one year 8,309 10,537 Later than one year and not later than five years 7,689 9,868 Total (including GST) 15,998 20,405 The light motor vehicle lease is managed by SG Fleet Group Limited, a private fleet leasing company selected under the Prequalification Scheme (Scheme) implemented by the Department of Finance, Services and Innovation. The lease is financed through a panel of six financing companies under the Scheme.

Roads and Maritime Services Notes to the financial statements for the year ended 30 June 2018
71
22. Commitments for expenditure (continued) The heavy motor vehicle and heavy plant vehicle operating lease commitments are as follows:
2018 2017
$'000 $'000
Within one year 16,694 13,339 Later than one year and not later than five years 32,512 20,633 Later than five years 4,197 929 Total (including GST) 53,403 34,901 The heavy motor vehicle lease is held and financed with Fleet Partners, SG Fleet Australia, Atlas Copco Australia, Capital Finance Australia and Kennard’s Hire. The total commitments detailed above include GST input tax credits of $314.9 million (2017: $325.5 million) that are expected to be recoverable from the Australian Taxation Office (ATO). Future property operating lease rental incomes that are not recognised in the financial statements as receivables are as follows:
2018 2017
$'000 $'000
Within one year 43,836 48,167 Later than one year and not later than five years 135,484 130,171 Later than five years 300,678 319,799 Total (including GST) 479,998 498,137 The total commitments detailed above include GST amount of $43.6 million (2017: $45.3 million) that are expected to be payable to the ATO. (c) Sydney Harbour Tunnel – finance lease liability
2018 2017
Notes $'000 $'000
Future minimum lease payments under finance lease, together with the present value of the net minimum lease payments are, as follows:
Within one year 30(g) 81,794 79,132 Later than one year and not later than five years 30(g) 277,613 344,046 Later than five years 30(g) - 15,361 Minimum lease payments 30(g) 359,407 438,539 Less: future finance charges (54,274) (79,726) Present value of minimum lease payments 305,133 358,813
The present value of finance lease commitments is as follows: Within one year
60,558 53,680 Later than one year and not later than five years
244,575 289,980
Later than five years
- 15,153 Present value of finance lease commitments 305,133 358,813 Classified as:
Current 18(i) 60,558 53,680 Non-current 18(ii) 244,575 305,133 Total 305,133 358,813

Roads and Maritime Services Notes to the financial statements for the year ended 30 June 2018
72
22. Commitments for expenditure (continued) In June 1987, RMS and Sydney Harbour Tunnel Corporation (SHTC) entered into an Ensured Revenue Stream (ERS) Agreement, whereby RMS agreed to make payments to SHTC to enable it to meet its financial obligations arising from the operation and maintenance of the tunnel and repayment of principal and interest on the funds it borrowed for the design and construction of the tunnel. Following the guidelines set out in NSW Treasury Policy Paper 06–08 “Accounting for Privately Financed Projects”, RMS has accounted for the Sydney Harbour Tunnel and related ERS Agreement as a finance lease arrangement in accordance with the requirements of AASB 117 Leases. The carrying amount of the Sydney Harbour Tunnel finance lease liability has been calculated based on the present value of the minimum lease liability, discounted at the interest rate implicit in the ERS Agreement. Contingent lease payments include increases in the ERS liability resulting from fluctuations in the weighted index component of the ERS Agreement (e.g. CPI fluctuations) and adjustments to the amount payable resulting from ERS clause 4.1(a) renegotiations such as GST on the tunnel tolls. Contingent lease payments are charged as expenses in the period they are incurred and amounted to $1.0 million for the year ending 30 June 2018 (2017: $2.4 million).
23. Contingent assets and contingent liabilities There are several significant contractual disputes with an estimated total contingent liability of $1.8 million (2017: $25.1 million). There are a number of contractual claims that have arisen from the normal course of business after the balance date, relating to matters occurring during the financial year. There is significant uncertainty as to whether a future liability will arise in respect to these items. The amount of the liability that may arise cannot be measured reliably at this time. Compulsory property acquisition matters under litigation have an estimated contingent liability of $723.1 million (2017: $676.2 million). These amounts are net of Treasury Managed Fund (TMF) reimbursement. RMS has a number of environmental matters emerging from its normal road construction works. There is significant uncertainty as to whether any future liability will emerge in respect of these matters as they are in early state of works, and cannot be reliably measured at this time. RMS has certain obligations under contracts with private sector parties with the performance of these obligations guaranteed by the State. The current guarantees outstanding are for the Sydney Harbour Tunnel, the M2 Motorway, the Eastern Distributor, the Cross City Tunnel, the Western Orbital, the Lane Cove Tunnel, NorthConnex and WestConnex. These guarantees are unlikely to ever be exercised. 24. Budget Review The budgeted amounts are drawn from the original budgeted financial statements presented to Parliament in respect of the reporting period. Subsequent amendments to the original budget (e.g. adjustment for transfers of functions between entities as a result of Administrative Arrangement Orders) are not reflected in the budgeted amounts. Major variances between the original budgeted amounts and the actual amounts disclosed on the primary financial statements are explained below.

Roads and Maritime Services Notes to the financial statements for the year ended 30 June 2018
73
24. Budget Review (continued) Net result The actual net surplus result was lower than budget by $1,178 million. These variances are mainly due to changes that occurred during the year as detailed in the table below. $’M Net surplus result as per the Budget 4,498 Variance between budget and actuals comprises: Lower capital funding from TfNSW and external sources due to lower capital works spend (1,135) Higher than budgeted write-downs of land acquired for future roadworks (163) Higher than budgeted road and bridge assets transferred to councils (129) Lower than budgeted asset transfers from TfNSW, mainly from the B-Line project (84) Reclassification of capital works program from State Roads to Local Roads (74) Lower than budgeted NorthConnex contributions funding from TfNSW (38) Higher than budgeted Service NSW fee for service payments (22) Higher than budgeted non-cash amortisation expenses of IT and other assets (24) Higher than budgeted Bridges Rebuilding Program, mostly from additional Federal funding (16) Lower than budgeted skill hire expense 6 Lower than budgeted Boating NOW Local Council payments, re-profiled into future years 15 Higher than budgeted investment earnings in NSW Treasury and T-Corp investments from positive market performance, and insurance claims interest 13
Unbudgeted insurance claims revenue for the Hunter Expressway 24 Higher than budgeted capitalisation of maintenance works 28 Higher than budgeted Motor Vehicle Weight Tax collections 42 Unbudgeted infrastructure assets recognised for the first time 49 Lower than budgeted asset write-off 79 Lower than budgeted personnel services expense 86 Lower than budgeted depreciation expense, mainly due to the conditions-based assessment in the current year road and bridge assets comprehensive revaluation 164
Other budget variances -
Net surplus result as per the Actuals 3,319
The employee and personnel service related expenses variance is explained below: $’M
Employee related and personnel service expenses as per the Budget 534
Skill hire expenses reclassified to Other Operating Expense (35)
499
Variance comprises: Lower than budgeted non-controllable non-cash actuarial adjustments for personnel service (32) Lower than budgeted employee numbers (68) Higher than budgeted redundancy expense 14
Total variance (86) Actual employee related and personnel service expenses after adjusting variances as per the financial statements
413

Roads and Maritime Services Notes to the financial statements for the year ended 30 June 2018
74
24. Budget Review (continued) Assets and liabilities Total current assets are higher than budget by $627 million largely due to higher cash and cash equivalents of $268 million from the grant funding of $128 million being fully drawn down as at 30 June 2018 and cash held to meet cash flow demands in July ($140 million). Current receivables were higher than budgeted by $228 million mainly due to higher than budgeted prepayment of contract works ($145 million), unbudgeted Natural Disaster funding receivable ($50 million), and recoverables from other state agencies for the Schofields project ($13 million). The re-classification of Lane Cove Tunnel concession fees receivable of $147 million to current has also contributed to the higher than budgeted total current assets, offset by lower than budgeted non-current asset held for sale of $24 million. Total non-current assets are higher than budget by $3,512 million primarily due to unbudgeted revaluation increments of $5.0 billion as a result of the incorporation of condition assessment in the current year comprehensive revaluation of road and bridge assets. This is offset by the carry forward of $1.1b of capital work spend to the 2018-19 financial year. Total liabilities are higher than budget by $459 million. This is largely due to higher than budgeted accrual activities ($169 million), compulsory acquisition activities ($143 million), prepaid E-tag and toll deposits ($24 million), development contributions for major projects ($36 million), and unbudgeted provision of $14m from environmental claims. Cash flows Actual cash position at 30 June 2018 shows $268 million favourable variance. $’M Closing cash and cash equivalents as per the Budget 619
Variance comprises: Lower than budgeted cash flows used in investing activities mainly due to lower cash outlays on capital spending 830
Favourable opening cash position at the beginning of the year due to re-profiling of capital projects in the prior year 280
Lower than budgeted net cash inflows from operating activities mainly due to lower capital grants received due to capital re-profiling (834)
Unbudgeted cash outflow from equity transfer (8)
Closing cash and cash equivalents as per the Actuals 887
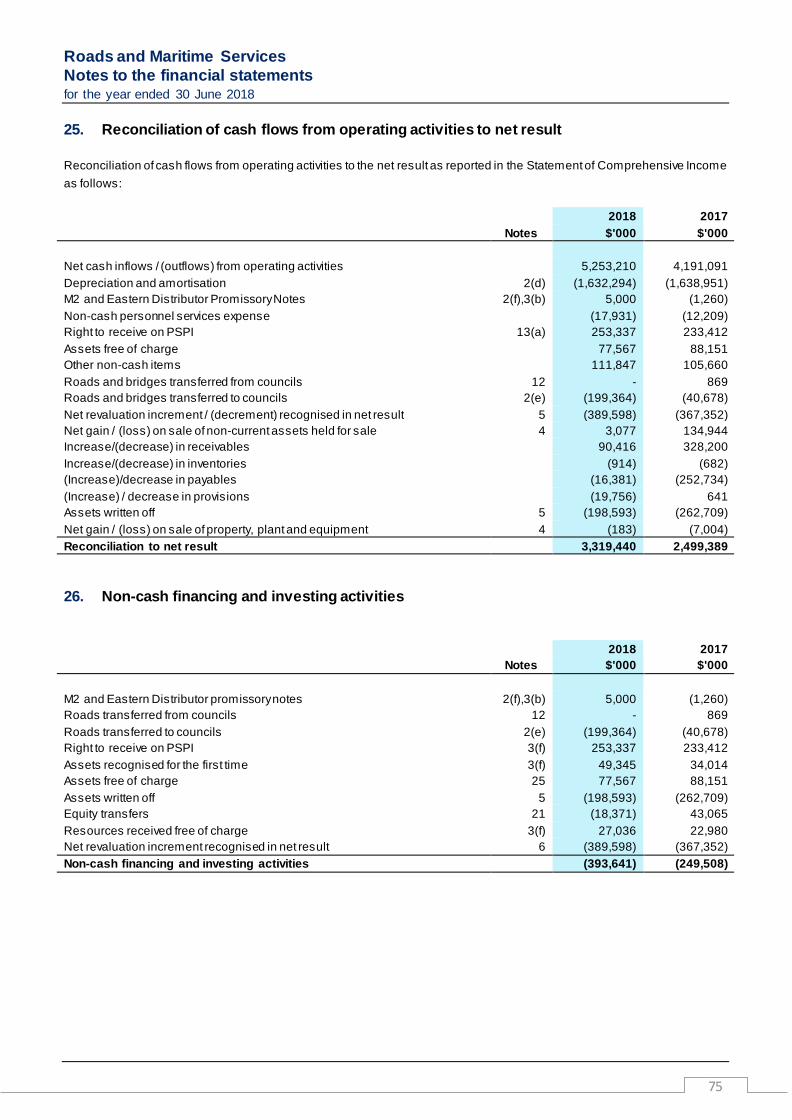
Roads and Maritime Services Notes to the financial statements for the year ended 30 June 2018
75
25. Reconciliation of cash flows from operating activities to net result Reconciliation of cash flows from operating activities to the net result as reported in the Statement of Comprehensive Income as follows:
2018 2017
Notes $'000 $'000
Net cash inflows / (outflows) from operating activities 5,253,210 4,191,091 Depreciation and amortisation 2(d) (1,632,294) (1,638,951) M2 and Eastern Distributor Promissory Notes 2(f),3(b) 5,000 (1,260) Non-cash personnel services expense (17,931) (12,209) Right to receive on PSPI 13(a) 253,337 233,412 Assets free of charge 77,567 88,151 Other non-cash items 111,847 105,660 Roads and bridges transferred from councils 12 - 869 Roads and bridges transferred to councils 2(e) (199,364) (40,678) Net revaluation increment / (decrement) recognised in net result 5 (389,598) (367,352) Net gain / (loss) on sale of non-current assets held for sale 4 3,077 134,944 Increase/(decrease) in receivables 90,416 328,200 Increase/(decrease) in inventories (914) (682) (Increase)/decrease in payables (16,381) (252,734) (Increase) / decrease in provisions (19,756) 641 Assets written off 5 (198,593) (262,709) Net gain / (loss) on sale of property, plant and equipment 4 (183) (7,004) Reconciliation to net result 3,319,440 2,499,389
26. Non-cash financing and investing activities
2018 2017
Notes $'000 $'000
M2 and Eastern Distributor promissory notes 2(f),3(b) 5,000 (1,260) Roads transferred from councils 12 - 869 Roads transferred to councils 2(e) (199,364) (40,678) Right to receive on PSPI 3(f) 253,337 233,412 Assets recognised for the first time 3(f) 49,345 34,014 Assets free of charge 25 77,567 88,151 Assets written off 5 (198,593) (262,709) Equity transfers 21 (18,371) 43,065 Resources received free of charge 3(f) 27,036 22,980 Net revaluation increment recognised in net result 6 (389,598) (367,352) Non-cash financing and investing activities (393,641) (249,508)

Roads and Maritime Services Notes to the financial statements for the year ended 30 June 2018
76
27. Administered income and expenses
2018 2017
$'000 $'000
Transfer receipts
Taxes, fees and fines 627,656 604,472 Stamp duty 835,064 826,277 Motor vehicle weight tax and fines 2,146,894 2,079,195 Other 58,915 55,034 Administered income 3,668,529 3,564,978 Administered income less expenses 3,668,529 3,564,978 Recognition and Measurement RMS administers, but does not control, the collection of various fees, fines and levies on behalf of the Crown Entity. Monies collected are not recognised as RMS’ revenue but are separately disclosed in the Administered Income and Expenses note. RMS is accountable for the transactions relating to these administered activities but does not have the discretion, for example, to deploy the resources for the achievement of its own objectives. Expenses incurred in collecting monies on behalf of the Crown Entity are recognised as RMS’ expenses. The accrual basis of accounting and all applicable accounting standards have been adopted. Roads and Maritime Services received Cabinet approval to establish a refund scheme and in-principle approval of approximately $42 million to enable Roads and Maritime Services to provide three years of refunds to affected customers where the legislated cap was not applied to their primary producer heavy vehicle registration charge. As the refund relates to the registration fee that RMS administers on behalf of the Crown, the impact is a decrease in the Administered Income in this note. An associated administered liability (current provision) has been reflected in the Administered Liability disclosure in Note 28 below. 28. Administered assets and liabilities
2018 2017
$'000 $'000
Remitting account, cash in transit and cash on hand 37,979 33,683 Administered assets 37,979 33,683 Holding accounts (current liabilities-other) 37,979 33,683 Provision (current) Other*
41,678 240,666
- 232,377
Administered liabilities 320,323 266,060 * The amount of multiple licence fees issued in the current year is approximately $147.8 million (2017: $144.2 million). The maximum period of licence is 10 years. First year licences are not deemed to be a liability. The outstanding liability above represents the remaining 9 years. Recognition and Measurement RMS administers, but does not control, the collection of various fees, fines and levies on behalf of the Crown Entity. Transactions and balances relating to the administered activities are not recognised as RMS’ assets and liabilities, but are disclosed as “Administered Assets and Liabilities”. The holding accounts and remitting account balances above represent fees collected by motor registries that have not been remitted to the third party they are being administered for (generally NSW Treasury). Refer to Note 27 for further details of the current provision recognised in 2017-18.

Roads and Maritime Services Notes to the financial statements for the year ended 30 June 2018
77
29. Native title The Commonwealth’s legislation (Native Title Act) and the New South Wales statute (Native Title (New South Wales) Act) have financial implications for New South Wales Government agencies generally. RMS has undertaken an assessment of the impact of this legislation on its financial position as at 30 June 2018. This assessment indicates there were no Native Title Claims which had a financial impact during the financial year ending 30 June 2018 (2017: none). 30. Financial instruments RMS’ principal financial instruments are outlined below. These financial instruments arise directly from RMS’ operations or are required to finance RMS’ operations. RMS does not enter into or trade financial instruments, including derivative financial instruments, for speculative purposes. RMS’ main risks arising from financial instruments are outlined below, together with RMS’ objectives, policies and processes for measuring and managing risk. Further quantitative and qualitative disclosures are included throughout this financial report. The Chief Executive has overall responsibility for the establishment and oversight of risk management and reviews and agrees policies for managing each of these risks. Risk management policies are established to identify and analyse the risks faced by RMS, to set risk limits and controls and to monitor risks. Compliance with policies is reviewed by the entity on a continuous basis. (a) Financial instrument categories
Carrying amount
Carrying amount
2018 2017
Note Category $'000 $'000
Financial assets
Class:
Cash and cash equivalents 8 N/A 886,839 748,652 Receivables1 9 Loans and receivables (at amortised cost) 346,189 416,679
Financial assets at fair value 10 At fair value through profit or loss designated upon initial recognition 111,565 104,857
Other financial assets 11 Loans and receivables (at amortised cost) 369,879 390,532 1,714,472 1,660,720
Financial liabilities
Class:
Payables2 17,20 Financial liabilities measured at amortised cost 1,528,971 1,430,757 Borrowings 18 Financial liabilities measured at amortised cost 305,133 358,813 1,834,104 1,789,570 1. Excludes statutory receivables and prepayments (i.e. not w ithin scope of AASB 7). 2. Excludes statutory payables and unearned revenue (i.e. not w ithin scope of AASB 7). (b) Derecognition of financial assets and financial liabilities A financial asset is derecognised in the following circumstances when the contractual rights to the cash flows from the financial assets expire; or if RMS transfers the financial asset:
• Where substantially all the risks and rewards have been transferred. • Where RMS has not transferred substantially all the risks and rewards, if the entity has not retained control.

Roads and Maritime Services Notes to the financial statements for the year ended 30 June 2018
78
Where RMS has neither transferred nor retained substantially all the risks and rewards or transferred control, the asset is recognised to the extent of RMS’ continuing involvement in the asset. A financial liability is derecognised when the obligation specified in the contract is discharged, cancelled or expires. When a lender replaces an existing financial liability with one on significantly different or modified terms, RMS derecognises the original liability and recognises the new liability. It then recognises the difference in their carrying amounts in the net result. (c) Market risk
Market risk is the risk that the fair value or future cash flows of a financial instrument will fluctuate because of changes in market prices. RMS’ exposures to market risk are primarily through interest rate risk on borrowings and other price risks associated with the movement in the unit price of the Hour-Glass Investment facilities. RMS has no exposure to foreign currency risk and does not enter into commodity contracts. The effect on profit and equity due to a reasonably possible change in risk variable is outlined in the table below, for interest rate risk and other price risk. A reasonably possible change in risk variable has been determined after taking into account the economic environment in which RMS operates and the time frame for the assessment (i.e. until the end of the next annual reporting period). The sensitivity analysis is based on risk exposures in existence at the Statement of Financial Position date. The analysis is performed on the same basis as for 2017 and assumes that all other variables remain constant.
(i) Interest rate risk Exposure to interest rate risk arises primarily through RMS’ interest bearing liabilities. This risk is minimised by undertaking mainly fixed rate borrowings. RMS do not account for any fixed rate financial instruments at fair value through profit and loss or as available for sale. Therefore, for these financial instruments, a change in interest rates would not affect profit or loss or equity. A reasonably possible change of +/– one per cent is used, consistent with current trends in interest rates. The basis will be reviewed annually and amended where there is a structural change in the level of interest rate volatility. The impact on RMS’ surplus/deficit and equity is set out in the table below assuming a 1 per cent change in variable interest rates.
-1% 1%
Carrying amount Surplus/Deficit Equity Surplus/Deficit Equity
2018 2018 2018 2018 2018
$'000 $'000 $'000 $'000 $'000
Financial assets Cash and cash equivalents 369,284 (3,693) (3,693) 3,693 3,693 Financial assets at fair value 111,565 (1,116) (1,116) 1,116 1,116 Other financial assets 369,879 (3,699) (3,699) 3,699 3,699
850,728 (8,508) (8,508) 8,508 8,508
-1% 1%
Carrying amount Surplus/Deficit Equity Surplus/Deficit Equity
2017 2017 2017 2017 2017
$'000 $'000 $'000 $'000 $'000
Financial assets Cash and cash equivalents 333,878 (3,339) (3,339) 3,339 3,339 Financial assets at fair value 104,857 (1,049) (1,049) 1,049 1,049 Other financial assets 390,532 (3,905) (3,905) 3,905 3,905
829,267 (8,293) (8,293) 8,293 8,293

Roads and Maritime Services Notes to the financial statements for the year ended 30 June 2018
79
30. Financial instruments (continued)
(ii) Other price risk – TCorp Hour-Glass facilities Exposure to ‘Other Price Risk’ primarily arises through the investment in the TCorp Hour-Glass Investment facilities, which are held for strategic rather than trading purposes. RMS has no direct equity investments and holds units in the following Hour-Glass Investment Trusts: Facility Investment sectors Investment 2018 2017
horizon $ '000 $ '000
Cash facility Cash, money market instruments up to 1.5 years - -
Strategic Cash facility
Cash, money market instruments, interest rate securities, bank floating rate notes
1.5 years to 3 years - -
Medium term growth facility
Cash, money market instruments, Australian and international bonds, listed property, and Australian shares
3 years to 7 years 76,563 72,937
Long term growth facility
Cash, money market instruments, Australian and international bonds, listed property, and Australian shares
7 years and over 35,002 31,920
The unit price of each facility is equal to the total fair value of the net assets held by the facility divided by the total number of units on issue for that facility. Unit prices are calculated and published daily. NSW TCorp is the trustee for each of the above facilities and is required to act in the best interest of the unit holders and to administer the trusts in accordance with the trust deeds. As trustee, TCorp has appointed external managers to manage the performance and risks of each facility in accordance with a mandate agreed by the parties. TCorp has also leveraged off internal expertise to manage certain fixed income assets for the Hour-Glass facilities. A significant portion of the administration of the facilities is outsourced to an external custodian. Investment in the Hour-Glass facilities limits RMS’ exposure to risk, as it allows diversification across a pool of funds with different investment horizons and a mix of investments. NSW TCorp provides sensitivity analysis information for each of the Investment facilities, using historically based volatility information collected over a ten year period, quoted at two standard deviations (i.e. 95% probability). The TCorp Hour-Glass Investment facilities are designated at fair value through profit or loss and therefore any change in unit price impacts directly on profit (rather than equity). A reasonably possible change is based on the percentage change in unit price (as advised by TCorp) multiplied by the redemption value as at 30 June each year for each facility (balance from Hour-Glass statement).
Facility
Change in unit 2018 2017
price $ '000 $ '000
Cash facility +/- 1% - - Strategic Cash facility +/- 1% - - Medium term growth facility +/- 6% 4,594 4,376 Long term growth facility +/- 15% 5,250 4,788

Roads and Maritime Services Notes to the financial statements for the year ended 30 June 2018
80
30. Financial instruments (continued)
(d) Credit risk Credit risk arises when there is the possibility of RMS’ debtors defaulting on their contractual obligations, resulting in a financial loss to RMS. The maximum exposure to credit risk is generally represented by the carrying amount of the financial assets (net of any allowance for impairment). Credit risk arises from the financial assets of RMS, including cash, receivables and authority deposits. RMS does not hold any collateral and has not granted any financial guarantees. Credit risk associated with RMS financial assets, other than receivables, is managed through the selection of counterparties and establishment of minimum credit rating standards. RMS deposits held with NSW TCorp are guaranteed by the State.
Banks Government Other Total
$ '000 $ '000 $ '000 $ '000
2018 Cash and cash equivalents 886,598 - 241 886,839 Receivables - 126,481 219,708 346,189 Other financial assets - - 369,879 369,879 Financial assets at fair value - 111,565 - 111,565 Total financial assets 886,598 238,046 589,828 1,714,472
2017 Cash and cash equivalents 748,056 - 596 748,652 Receivables - 88,889 327,790 416,679 Financial assets at fair value - 104,857 - 104,857 Other financial assets - - 390,532 390,532 Total financial assets 748,056 193,746 718,918 1,660,720
(i) Cash and cash equivalents Cash comprises cash on hand and bank balances within the NSW Treasury Banking System. Interest is earned on daily bank balances at the monthly average NSW TCorp 11am unofficial cash rate, adjusted for a management fee to NSW Treasury.
(ii) Receivables – trade debtors All trade debtors are recognised as amounts receivable at balance date. Collectability of trade debtors is reviewed on an ongoing basis. Procedures as established in the Treasurer’s Directions are followed to recover outstanding amounts, including letters of demand. Debts which are known to be uncollectible are written off. An allowance for impairment is raised when there is objective evidence that the entity will not be able to collect all amounts due. This evidence includes past experience, and current and expected changes in economic conditions and debtor credit ratings. No interest is earned on trade debtors. Sales are generally made on 30 day terms. RMS is not materially exposed to concentrations of credit risk to a single trade debtor or group of debtors. Based on past experience, debtors that are not past due (2018: $33.2 million; 2017: $30.5 million) and past due (2018: $17.3 million; 2017: $13.5 million) are not considered impaired and together these represent 83.5 per cent (2017: 81.5 per cent) of the total trade debtors. There are no debtors which are currently not past due or impaired whose terms have been renegotiated. The only financial assets that are past due or impaired are “sales of goods and services”, “other” and “property debtors” in the “receivables” category of the Statement of Financial Position (refer to Note 9).

Roads and Maritime Services Notes to the financial statements for the year ended 30 June 2018
81
30. Financial instruments (continued)
Past due but not
impaired*
Considered impaired* Total*
$ '000 $ '000 $ '000
2018 < 3 months overdue 13,170 707 13,877
3 months - 6 months overdue 836 599 1,435
> 6 months overdue 3,249 8,638 11,887 2017 < 3 months overdue 9,814 485 10,299
3 months - 6 months overdue 1,737 525 2,262
> 6 months overdue 1,921 9,000 10,921
*Each column in the table reports “gross receivables”. *The ageing analysis excludes statutory receivables, as these are not w ithin the scope of AASB 7 Financial Instruments: Disclosures and excludes receivables that are not past due and not impaired. Therefore, the “total” w ill not reconcile to the receivables total recognised in the Statement of Financial Position.
(iii) Other financial assets The repayment of the Sydney Harbour Tunnel loan ranks behind all creditors to be paid. Redemption of the M2 and Eastern Distributor promissory notes is dependent upon counterparties generating sufficient cash flows to enable the face value to be repaid.
(iv) RMS Deposits RMS has placed funds on deposit with highly rated financial institutions. These deposits are similar to money market or bank deposits and can be placed “at call” or for a fixed term. For fixed term deposits, the interest rate payable by TCorp is negotiated initially and is fixed for the term of the deposit, while the interest rate payable on at call deposits can vary. The deposits at balance date were earning an average interest rate of 2.58 per cent (2017: 2.97 per cent), while over the year the weighted average interest rate was 2.54 per cent (2017: 3.07 per cent) on a weighted average balance during the year of $488.1 million (2017: $406.8 million). None of these assets are past due or impaired.
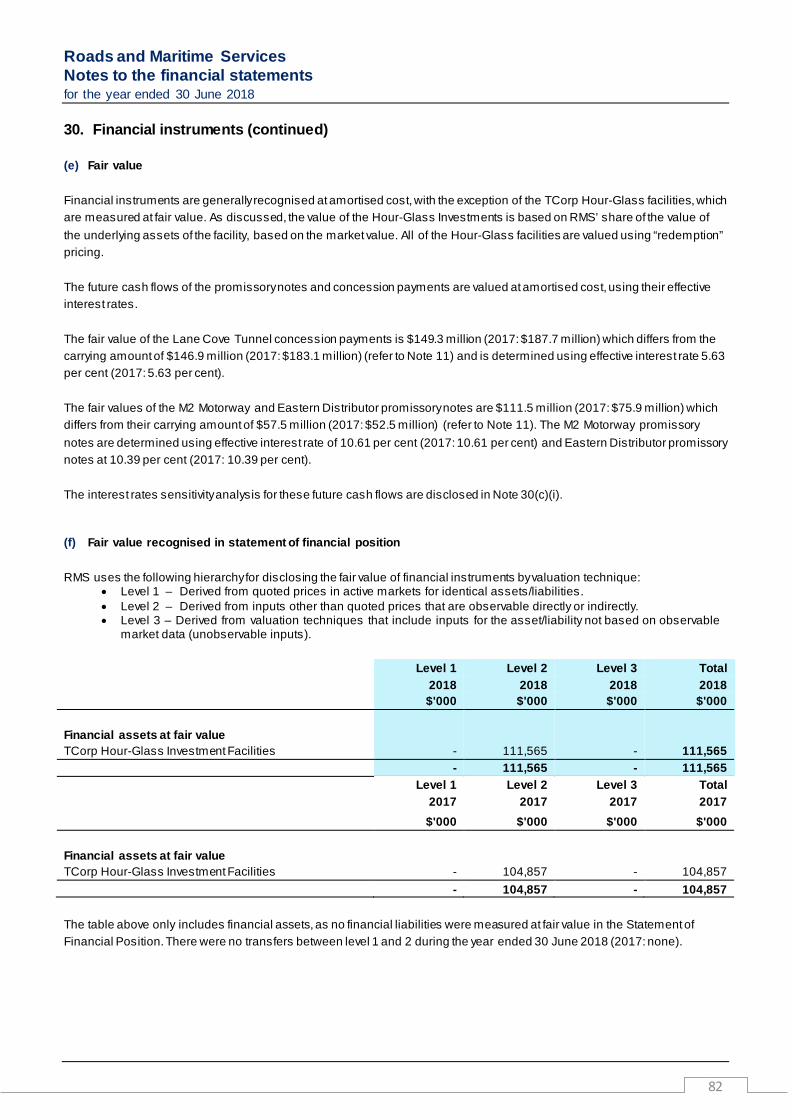
Roads and Maritime Services Notes to the financial statements for the year ended 30 June 2018
82
30. Financial instruments (continued) (e) Fair value Financial instruments are generally recognised at amortised cost, with the exception of the TCorp Hour-Glass facilities, which are measured at fair value. As discussed, the value of the Hour-Glass Investments is based on RMS’ share of the value of the underlying assets of the facility, based on the market value. All of the Hour-Glass facilities are valued using “redemption” pricing. The future cash flows of the promissory notes and concession payments are valued at amortised cost, using their effective interest rates. The fair value of the Lane Cove Tunnel concession payments is $149.3 million (2017: $187.7 million) which differs from the carrying amount of $146.9 million (2017: $183.1 million) (refer to Note 11) and is determined using effective interest rate 5.63 per cent (2017: 5.63 per cent). The fair values of the M2 Motorway and Eastern Distributor promissory notes are $111.5 million (2017: $75.9 million) which differs from their carrying amount of $57.5 million (2017: $52.5 million) (refer to Note 11). The M2 Motorway promissory notes are determined using effective interest rate of 10.61 per cent (2017: 10.61 per cent) and Eastern Distributor promissory notes at 10.39 per cent (2017: 10.39 per cent). The interest rates sensitivity analysis for these future cash flows are disclosed in Note 30(c)(i).
(f) Fair value recognised in statement of financial position
RMS uses the following hierarchy for disclosing the fair value of financial instruments by valuation technique: • Level 1 – Derived from quoted prices in active markets for identical assets/liabilities. • Level 2 – Derived from inputs other than quoted prices that are observable directly or indirectly. • Level 3 – Derived from valuation techniques that include inputs for the asset/liability not based on observable
market data (unobservable inputs).
Level 1 Level 2 Level 3 Total
2018 2018 2018 2018
$'000 $'000 $'000 $'000
Financial assets at fair value TCorp Hour-Glass Investment Facilities - 111,565 - 111,565
- 111,565 - 111,565
Level 1 Level 2 Level 3 Total
2017 2017 2017 2017
$'000 $'000 $'000 $'000
Financial assets at fair value TCorp Hour-Glass Investment Facilities - 104,857 - 104,857
- 104,857 - 104,857 The table above only includes financial assets, as no financial liabilities were measured at fair value in the Statement of Financial Position. There were no transfers between level 1 and 2 during the year ended 30 June 2018 (2017: none).

Roads and Maritime Services Notes to the financial statements for the year ended 30 June 2018
83
30. Financial instruments (continued) (g) Liquidity risk RMS manage liquidity risk by maintaining adequate reserves, banking facilities and reserve borrowing facilities by continuously monitoring forecast and actual cash flows. Liquidity risk is the risk that RMS will be unable to meet its payment obligations when they fall due. RMS continuously manages risk through monitoring future cash flows and maturities planning to ensure adequate holding of high quality liquid assets. The objective is to maintain a balance between continuity of funding and flexibility through the use of overdrafts, loans and other advances. Until 30 June 2018, RMS had a Come and Go Facility with TCorp valued at $110 million for cash management purposes. This year the facility was not used to fund shortfalls, incurring a total interest charge of zero. The facility has not been renewed going forward. Instead, Treasury’s cash management reforms allow RMS to access an emergency cash injection to fulfil funding requirements under any extreme situations. Financing arrangements
2018 2017
$ '000 $ '000
Unrestricted access was available at the Statement of Financial Position date to the come and go facility - -
Total facility 110,000 110,000 Used at Statement of Financial Position date - - Unused at Statement of Financial Position date 110,000 110,000 During the current and prior years, there were no defaults on any loans payable. No assets have been pledged as collateral. RMS’ exposure to liquidity risk is deemed insignificant based on prior periods’ data and current assessment of risk. The liabilities are recognised for amounts due to be paid in the future for goods or services received, whether or not invoiced. Amounts owing to suppliers (which are unsecured) are settled in accordance with TC 11/12 “Payment of Accounts”. For small business suppliers, where terms are not specified, payment is made not later than 30 days from the date of receipt of a correctly rendered invoice. For other suppliers, if trade terms are not specified, payment is made no later than the end of the month following the month in which an invoice or a statement is received. For small business suppliers, where payment is not made within the specified time period, simple interest must be paid automatically unless an existing contract specifies otherwise. The average rate of interest applied during the year was 9.7% (2017: 9.8%).

Roads and Maritime Services Notes to the financial statements for the year ended 30 June 2018
84
30. Financial instruments (continued) (g) Liquidity risk (cont’d) The table below summarises the maturity profile of RMS’ financial liabilities, together with the interest rate exposure. Maturity analysis and interest rate exposure of financial liabilities Interest rate exposure Maturity dates
Weighted Average
Effective Int. Rate (%)
Nominal amount*
Fixed Interest
Rate Variable
Interest Rate Non-interest
bearing < 1 year 1 - 5 years > 5 years
$'000 $'000 $'000 $'000 $'000 $'000 $'000
2018 Payables
Trade creditors - 108,790 - - 108,790 108,790 - - Accrued expenses - 822,764 - - 822,764 822,764 - - Other payables - 337,684 - - 337,684 333,873 3,811 - Personnel services - 77,298 - - 77,298 71,949 5,349 - Sydney Harbour Tunnel tax liability - 21,748 - - 21,748 4,526 16,557 665 Holding accounts - 162,216 - - 162,216 162,216 - -
Borrowings
Finance leases 7.70 359,407 359,407 - - 81,794 277,613 -
2017 Payables
Trade creditors - 169,350 - - 169,350 169,350 - - Accrued expenses - 803,318 - - 803,318 803,318 - - Other payables - 211,318 - - 211,318 203,695 7,623 - Personnel services - 69,425 - - 69,425 61,956 7,469 - Sydney Harbour Tunnel tax liability - 23,563 - - 23,563 4,475 18,422 666 Holding accounts - 155,711 - - 155,711 155,711 - -
Borrowings
Finance leases 7.70 438,539 438,539 - - 79,132 344,046 15,361 *The amounts disclosed are the contractual undiscounted cash flows of each class of financial liabilities and therefore will not reconcile to the Statement of Position.

Roads and Maritime Services Notes to the financial statements for the year ended 30 June 2018
85
31. Related Party Disclosures (a) Key Management Personnel Compensation During the year, RMS incurred $4.4 million (2017: $3.9 million) in respect of the key management personnel services that are provided by Transport Service NSW. The amount incurred excludes long service leave and defined benefit superannuation scheme benefits assumed by the Crown Entity in accordance with NSWTC 16-12 Related party disclosures. (b) Key management personnel transactions, outstanding balances or commitments with the reporting entity and
its parent during the financial year Key management personnel did not have material transactions, outstanding balances or commitments with RMS or its parent during the financial year. (c) Transactions with Government Related Entities during the financial year During the 2017-18 financial year, RMS entered into the following transactions with other NSW government agencies. Senior Management considers these within the normal course of business and, in addition to the details on these transactions provided in previous notes, makes the following qualitative disclosure:
• Transport for NSW (TfNSW - RMS’ parent entity) - Grants revenue and recoupment/repayment of costs incurred by RMS/TfNSW on behalf of TfNSW/RMS.
• Transport Shared Services - charges for personnel services, finance, human resources, and information technology services, as well as personnel services revenue for seconded staff to other NSW government agencies.
• Sydney Motorway Corporation (SMC) - WestConnex development cost delivered and recorded as a Prepayment against the PSPI.
• Property NSW and Place Management NSW - Property rental payment. • Port Authority of NSW - Channel fees received. • Insurance for NSW - Insurance payment to and hindsight adjustment received from the Treasury Managed Fund
(TMF). • NSW Treasury Corporation - Investment in T-Corp Hourglass facilities and investment revenue earned from these
facilities. • Crown Finance Entity - Interest revenue earned from the Treasury Banking System. • Service NSW – Front-line service delivery fees. • Various agencies (Including Department of Planning and Environment, Office of Environment and Heritage and
Property NSW) – Transfers of land to/from RMS • Department of Finance, Services and Innovation – Outward transfer of Tow Trucks administration function including
cash balance as well as various licensing fees received. • Various agencies (including Sydney Trains, Department of Planning and Environment and the Department of
Justice) - Grants and contributions received. • Various agencies (including Sydney Water, Infrastructure NSW and UrbanGrowth NSW Development Corporation) -
Professional services and external works provided/received.
32. Events after the reporting period No events have occurred after the reporting date that would have a material impact on the financial statements. End of Audited Financial Statements


Roads and Maritime ServicesLocked Bag 928 North Sydney NSW 2059 rms.nsw.gov.au © Roads and Maritime Services Users are welcome to copy, reproduce and distribute the information contained in this report for non commercial purposes only, provided acknowledgement is given to Roads and Maritime Services as the source.
RMS 18.1058
ISSN: 2201-1250