Embed Size (px)
Citation preview
Roads and Traffic Authority of NSW
Oxley Highway to KempseyUpgrading the Pacific Highway
Environmental Assessment
MAIN VOLUME
September 2010
GHD Pty LtdABN 39 008 488 373
Level 3, GHD Tower24 Honeysuckle Drive
NEWCASTLE NSW 2300
Phone: +61 2 4979 9999Fax: +61 2 4979 9988
Email: [email protected]
ISBN: 978-1-921766-49-7
CHAPTER 12 HYDROLOGY
12. Hydrology
This chapter describes the existing flood behaviour and geomorphic condition of watercourses in
the Proposal area. Potential impacts from the construction and operation of the Proposal are assessed and measures to mitigate those potential impacts are proposed.
The Director-General’s environmental assessment requirements identify surface and groundwater
impacts to be a key issue. Table 12-1 indicates where the aspects of the Director-General’s environmental assessment requirements that relate to surface and groundwater are addressed, either in this chapter or in other chapters (in italics).
Table 12-1 Hydrology
Environmental assessment requirements Where addressed
Surface and Ground Water – including but not limited to:
Water quality taking into account impacts from both accidents and runoff and considering relevant environmental water quality criteria specified in the Australian and New Zealand Guidelines for Fresh and Marine Water Quality 2000.
Chapter 13 Water quality
Groundwater including cumulative impacts on regional hydrology. The assessment must consider: extent of drawdown; impacts to groundwater quality; discharge requirements; and implications for groundwater-dependent surface flows (including springs and drinking water catchments), groundwater-dependent ecological communities and groundwater users.
Chapter 14 Groundwater
Chapter 15 Flora and fauna
Identifying changes to existing flood regimes, in accordance with the Floodplain Development Manual (former Department of Natural Resources, 2005), including impacts to existing receivers and infrastructure and the future development potential of affected land.
Section 12.3
Demonstrating consideration of the effects of sea level rise, changes to rainfall frequency and/or intensity as a result of climate change on the project.
Section 12.3
Section 20.8
Waterways to be modified as a result of the project, including ecological, hydrological and geomorphic impacts (as relevant) and measures to rehabilitate the waterways to pre-construction conditions or better.
Section 12.3 and 012.4
12.1 Assessment approach
12.1.1 Relevant guidelines
The assessment of potential impacts on hydrology and hydraulics in the Proposal area has taken
into account the following documents:
RTA Water Policy (RTA 2000).
RTA Code of Practice for Water Management (RTA 1999b).
RTA QA Specification G38 Soil and Water Management (Soil and Water Management Plan) (RTA 2004b).
NSW ROADS AND TRAFFIC AUTHORITY 219
OXLEY HIGHWAY TO KEMPSEY PACIFIC HIGHWAY UPGRADE
Floodplain Development Manual (former Department of Natural Resources 2005).
Upgrading the Pacific Highway – Upgrading Program beyond 2006: Design Guidelines (RTA,
2006).
12.1.2 Design objectives
Water management
The key objectives of the Proposal relating to water management are to:
Preserve existing elements such as natural channels, wetlands and riparian vegetation.
Manage both quality and quantity of stormwater as close to its source as possible, including installing devices that treat stormwater and retain the runoff so that changes to the system are kept to the minimum amount practical.
Integrate with the construction process so that the total investment in drainage infrastructure is minimised and access is available to all devices which need ongoing maintenance during both
the construction phase and the maintenance phase.
Minimise erosion and sedimentation of downstream watercourses.
Minimise any increase in upstream flood levels by managing the constriction of flow paths.
Flood immunity
The flood immunity objectives specific to the Proposal are to:
A 1 in 20 year flood may occur, on average, once in a 20 year period, or roughly a 5 per cent chance in any year.
Flooding frequency:
A 1 in 100 year flood event means a flood of that size may occur, on average, once in 100 years or roughly a 1 per cent chance in any year.
Achieve flood immunity on all carriageways of the upgraded highway
and service roads for at least a 1 in 20 year flood event.
If possible, achieve flood immunity on at least one carriageway of the
upgraded highway for a 1 in 100 year flood event.
Achieve flood immunity on access roads for a 1 in 10 year flood event.
The concept design for the Proposal allows for either both carriageways, or an alternative route such as the existing Pacific Highway, to remain
operational during the 1 in 100 year flood events for the length of the Proposal.
12.1.3 Software packages used
RMA-2
RMA-2 software is a hydraulic model which computes water surface elevations and velocity for flow
over a specified area. RMA-2 modelling is most appropriate for broad areas of flow, such as large floodplains and requires three-dimensional digital terrain information to model a floodplain. The model predicts the direction and speed of water across a floodplain.
XP-RAFTS
XP-RAFTS is a hydrologic model that predicts the amount of rainfall runoff from various storm
events for specified catchments. The program considers the broad characteristics of the contributing catchments such as slope, flow lengths and the land use of the catchment.
220 ENVIRONMENTAL ASSESSMENT
CHAPTER 12 HYDROLOGY
HEC-RAS
HEC-RAS software (produced by the US Army Corps of Engineers) is a hydraulic model that predicts the flow of water through channels and structures. The model estimates flood levels for a
given channel cross section (one dimensional flow). The software has the capability of considering culverts, bridges and other structures which could affect flow.
DRAINS
DRAINS software has the capability to model sub-catchments, pits, pipes and overflow routes. A design rainfall event is selected for analysis and the program subsequently estimates runoff from
the modelled subcatchments. The software enables the capacity of existing culverts to be assessed for various rainfall events and new culverts to appropriately sized for specific rainfall events. DRAINS is both a hydrologic and hydraulic model.
12.1.4 Methodology
The methodology employed in the flooding assessment of the Proposal was to model the existing case to develop a baseline. The existing case consists of the existing highway, land development, and landform. The flood models developed were then amended to include the Proposal and were
rerun to measure the change in flooding behaviour directly caused by the Proposal. The change in flooding behaviour included flood heights, floodwater speeds and duration of flooding inundation. Where changes were predicted, management and mitigation measures were identified and
recommendations made.
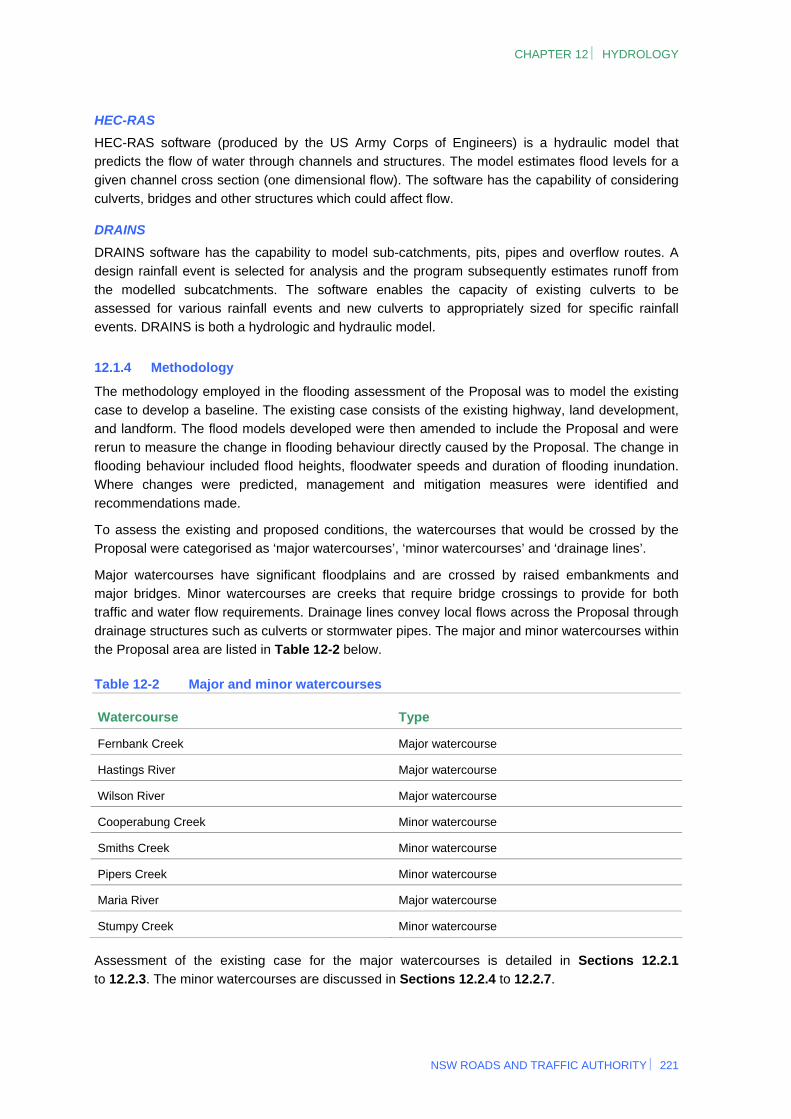
To assess the existing and proposed conditions, the watercourses that would be crossed by the Proposal were categorised as ‘major watercourses’, ‘minor watercourses’ and ‘drainage lines’.
Major watercourses have significant floodplains and are crossed by raised embankments and major bridges. Minor watercourses are creeks that require bridge crossings to provide for both traffic and water flow requirements. Drainage lines convey local flows across the Proposal through
drainage structures such as culverts or stormwater pipes. The major and minor watercourses within the Proposal area are listed in Table 12-2 below.
Table 12-2 Major and minor watercourses
Watercourse Type
Fernbank Creek Major watercourse
Hastings River Major watercourse
Wilson River Major watercourse
Cooperabung Creek Minor watercourse
Smiths Creek Minor watercourse
Pipers Creek Minor watercourse
Maria River Major watercourse
Stumpy Creek Minor watercourse
Assessment of the existing case for the major watercourses is detailed in Sections 12.2.1 to 12.2.3. The minor watercourses are discussed in Sections 12.2.4 to 12.2.7.
NSW ROADS AND TRAFFIC AUTHORITY 221
OXLEY HIGHWAY TO KEMPSEY PACIFIC HIGHWAY UPGRADE
An analysis of existing watercourse crossings was undertaken to determine peak flood levels and flow velocities. This information was used to make an assessment of the existing structures to determine a baseline for assessment. Information relating to geometry for existing bridges at
Hastings, Wilson and Maria rivers, and Fernbank, Cooperabung, Smiths and Pipers creeks was derived from ‘as built’ design drawings held by the RTA.
Hydrological and hydraulic modelling was then undertaken on the proposed bridge crossings for major watercourses and
minor watercourses and for culvert drainage structures in relation to drainage lines, to achieve sufficient hydraulic capacity, and therefore achieve compliance with design
guidelines. Assessment was then undertaken on the bridges, flood relief structures and drainage structures to determine the impact on watercourses throughout the Proposal.
Hydrology and hydraulics:
Hydrology is the study of rainfall and runoff, used to model and predict flood flows.
Hydraulics is the study of a watercourse and its reaction to a flood flows, modelling and predicting flood speeds and flood heights.
Major watercourses
The Hastings River Flood Study (Patterson Britton & Partners 2006) investigated the existing flooding behaviour of the Hastings, Wilson and Maria rivers. To ensure consistency with the results
of this study, the same model was used to conduct analyses specific to the Proposal.
Hydrology of the major watercourses was determined through the hydrologic model XP-RAFTS. The analysis provided an estimation of the peak flow rates passing through the Hastings and
Wilson river floodplain crossings for a range of design storm events listed below:
1 in 5 year flood.
1 in 20 year flood.
1 in 50 year flood.
1 in 100 year flood.
1 in 2000 year flood.
Probable maximum flood (extreme flood event). Note that in lieu of a detailed estimate for the
probable maximum flood, an extreme event was calculated as three times the flow of the 1 in 100 year flood event.
Hydraulics of the major watercourses was determined using RMA-2 modelling software. The
hydraulic assessment estimated flood levels and floodwater velocities across the floodplains.
The model developed for the Hastings River Flood Study (Patterson Britton 2006) was amended to include topographic and hydrographic survey information collected for the Proposal. An
amalgamation of survey information from a variety of sources was used as a base to model the existing conditions, which was then amended to incorporate the Proposal into the model for the proposed conditions.
The effect of the proposed embankment and drainage structures on the existing flood levels and velocities was determined. This allowed for an assessment of the likely impacts of the Proposal on flood levels for the Hastings and Wilson river floodplains.
222 ENVIRONMENTAL ASSESSMENT
CHAPTER 12 HYDROLOGY
Minor watercourses
A hydrological analysis of watercourse crossings for the existing Pacific Highway was undertaken to determine the design flow rates for the minor watercourses at the location of the existing
watercourse crossings. XP-RAFTS hydrological models were used for modelling all minor watercourses (except Stumpy Creek) and predicting conditions for the 1 in 5, 20 and 100 year flood events. Stumpy Creek was added to the scope of works covered by this assessment at a later date
than the other watercourses and therefore information at the same level of detail was not available for the Stumpy Creek catchment. Hydrological analysis for Stumpy Creek was undertaken using the probabilistic Rational Method for use in eastern NSW (Australian Rainfall and Runoff 1987),
which is a widely used process for estimating peak flows in small to medium catchments.
Peak design flows for each design storm event were applied to the conceptual bridge geometry using a HEC-RAS hydraulic model. The peak flow heights and velocities were then determined for
each minor watercourse structure including an assessment of the flood immunity of each structure. Service and access roads have been included in the hydraulic modelling of the creek bridge crossings.
The detailed design of minor watercourse crossing structures would be refined during detailed design to maximise hydraulic performance.
Culverts
Culverts which would convey local flows across the Proposal were assessed for their hydraulic performance.
The hydraulic performance of culverts was determined in DRAINS for the 1 in 5, 20 and 100 year flood events. The assessment of existing and proposed culvert performances enabled identification of culverts of insufficient capacity. Where under capacity culverts have been identified new culvert
sizes were nominated that would be suitable for the 1 in 100 year flood event and to meet the RTA design standards.
Minor design changes to the size and grade of the culverts were made to satisfy the RTA’s design
velocity criteria. Where these design changes did not satisfy velocity criteria, a stepped drop structure at the upstream end of culverts or a plunge pool at the downstream end (dependent on site conditions) was incorporated into the concept design.
Culverts with dual function as fauna crossings were modelled with increased surface roughness to reflect the likely impact on capacity of the culverts.
Pavement drainage
The performance of the pavement drainage system for the concept design was evaluated using the Rational Method to assess the capacity of the provided longitudinal drainage for the Proposal.
Pavement drainage concept design also incorporated the requirement to reduce the risk of aquaplaning, which occurs when a vehicle’s wheels lose traction due to a thick layer of water building up between the road surface and vehicle tyres.
Climate change effects
Additional hydraulic modelling was undertaken on the major watercourses using RMA-2 software to
assess the impacts of climate change on the flooding impacts of the Proposal. A sea level rise policy for NSW was released in 2009 (DECCW 2009). This policy states that the best projections of sea level rise along the NSW coast predict that mean sea levels are expected to rise relative to
1990 levels by 40 centimetres by 2050. By 2100 mean sea levels are expected to rise by 90 centimetres relative to 1990 levels.
NSW ROADS AND TRAFFIC AUTHORITY 223
OXLEY HIGHWAY TO KEMPSEY PACIFIC HIGHWAY UPGRADE
Additional modelling was undertaken on the major watercourses to determine the following:
The potential impact of climate change on peak flood levels and flood extents in the vicinity of the existing highway for existing topographic conditions.
The potential impact that the Proposal could have on flood characteristics (peak flood levels and extents) under the selected climate change scenarios.
The potential impact that climate change scenarios could have on the Proposal.
The assessment was based on the application of procedures outlined in Floodplain Risk Management Guideline – Practical Considerations of Climate Change (Department of Environment and Climate Change 2007c). The scenarios that were modelled were selected in consultation with
DECCW and are provided in Table 12-3.
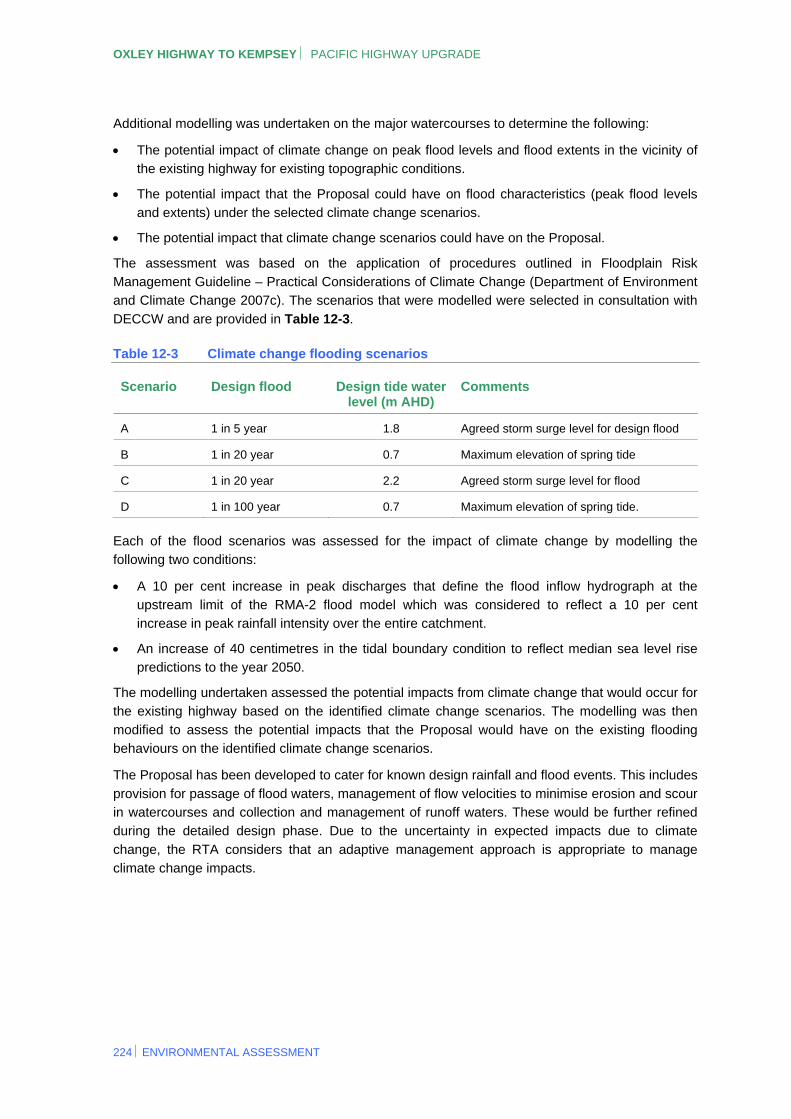
Table 12-3 Climate change flooding scenarios
Scenario Design flood Design tide water level (m AHD)
Comments
A 1 in 5 year 1.8 Agreed storm surge level for design flood
B 1 in 20 year 0.7 Maximum elevation of spring tide
C 1 in 20 year 2.2 Agreed storm surge level for flood
D 1 in 100 year 0.7 Maximum elevation of spring tide.
Each of the flood scenarios was assessed for the impact of climate change by modelling the following two conditions:
A 10 per cent increase in peak discharges that define the flood inflow hydrograph at the upstream limit of the RMA-2 flood model which was considered to reflect a 10 per cent increase in peak rainfall intensity over the entire catchment.
An increase of 40 centimetres in the tidal boundary condition to reflect median sea level rise predictions to the year 2050.
The modelling undertaken assessed the potential impacts from climate change that would occur for the existing highway based on the identified climate change scenarios. The modelling was then
modified to assess the potential impacts that the Proposal would have on the existing flooding behaviours on the identified climate change scenarios.
The Proposal has been developed to cater for known design rainfall and flood events. This includes
provision for passage of flood waters, management of flow velocities to minimise erosion and scour in watercourses and collection and management of runoff waters. These would be further refined during the detailed design phase. Due to the uncertainty in expected impacts due to climate
change, the RTA considers that an adaptive management approach is appropriate to manage climate change impacts.
224 ENVIRONMENTAL ASSESSMENT
CHAPTER 12 HYDROLOGY
12.2 Existing hydrological conditions
12.2.1 Hastings River floodplain
Site description
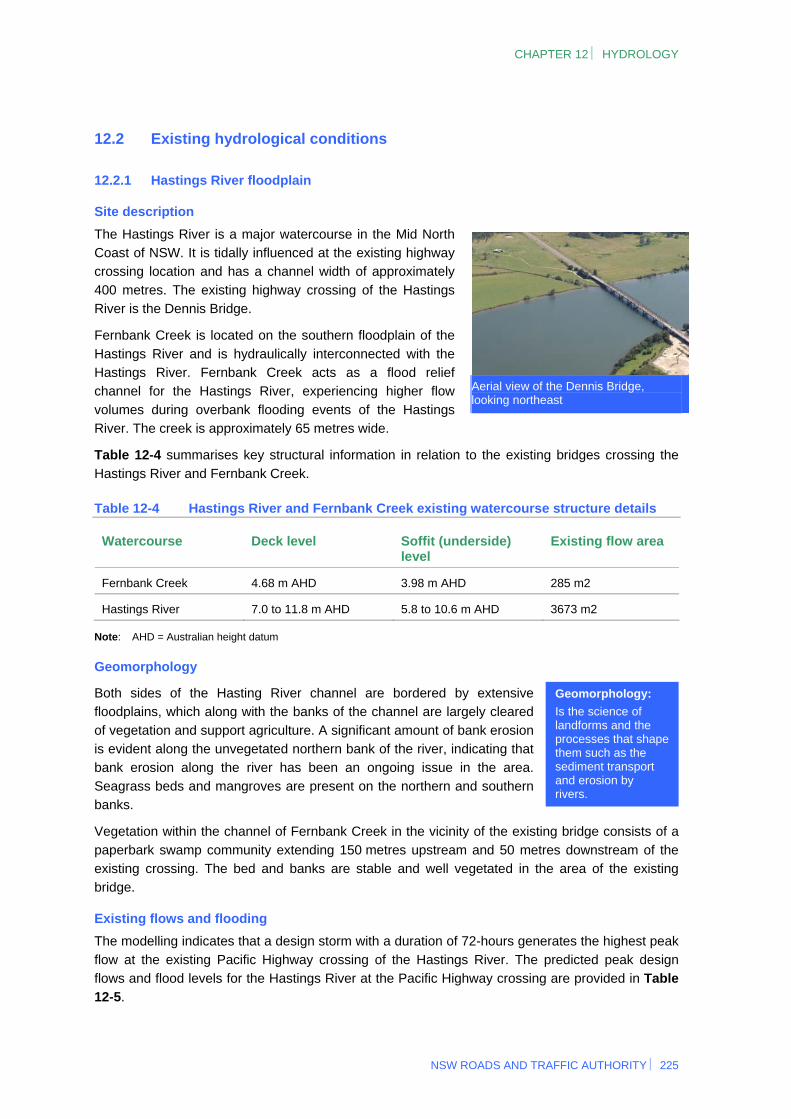
The Hastings River is a major watercourse in the Mid North Coast of NSW. It is tidally influenced at the existing highway crossing location and has a channel width of approximately
400 metres. The existing highway crossing of the Hastings River is the Dennis Bridge.
Aerial view of the Dennis Bridge, looking northeast
Fernbank Creek is located on the southern floodplain of the
Hastings River and is hydraulically interconnected with the Hastings River. Fernbank Creek acts as a flood relief channel for the Hastings River, experiencing higher flow
volumes during overbank flooding events of the Hastings River. The creek is approximately 65 metres wide.
Table 12-4 summarises key structural information in relation to the existing bridges crossing the
Hastings River and Fernbank Creek.
Table 12-4 Hastings River and Fernbank Creek existing watercourse structure details
Watercourse Deck level Soffit (underside) level
Existing flow area
Fernbank Creek 4.68 m AHD 3.98 m AHD 285 m2
Hastings River 7.0 to 11.8 m AHD 5.8 to 10.6 m AHD 3673 m2
Note: AHD = Australian height datum
Geomorphology
Both sides of the Hasting River channel are bordered by extensive floodplains, which along with the banks of the channel are largely cleared
of vegetation and support agriculture. A significant amount of bank erosion is evident along the unvegetated northern bank of the river, indicating that bank erosion along the river has been an ongoing issue in the area.
Seagrass beds and mangroves are present on the northern and southern banks.
Geomorphology:
Is the science of landforms and the processes that shape them such as the sediment transport and erosion by rivers.
Vegetation within the channel of Fernbank Creek in the vicinity of the existing bridge consists of a
paperbark swamp community extending 150 metres upstream and 50 metres downstream of the existing crossing. The bed and banks are stable and well vegetated in the area of the existing bridge.
Existing flows and flooding
The modelling indicates that a design storm with a duration of 72-hours generates the highest peak
flow at the existing Pacific Highway crossing of the Hastings River. The predicted peak design flows and flood levels for the Hastings River at the Pacific Highway crossing are provided in Table 12-5.
NSW ROADS AND TRAFFIC AUTHORITY 225
OXLEY HIGHWAY TO KEMPSEY PACIFIC HIGHWAY UPGRADE
Table 12-5 Predicted existing peak discharge and flood levels for the Hastings River
Flood event Predicted design peak discharge (m3/s)
Predicted design peak flood level (m AHD)
1 in 5 year 2910 2.37
1 in 100 year 7190 3.81
1 in 200 year 8560 4.18
1 in 2,000 year 13,500 5.50
Extreme flood event 21,570 6.97
Note: m3/s = cubic metres per second m AHD = metres above the Australian height datum.
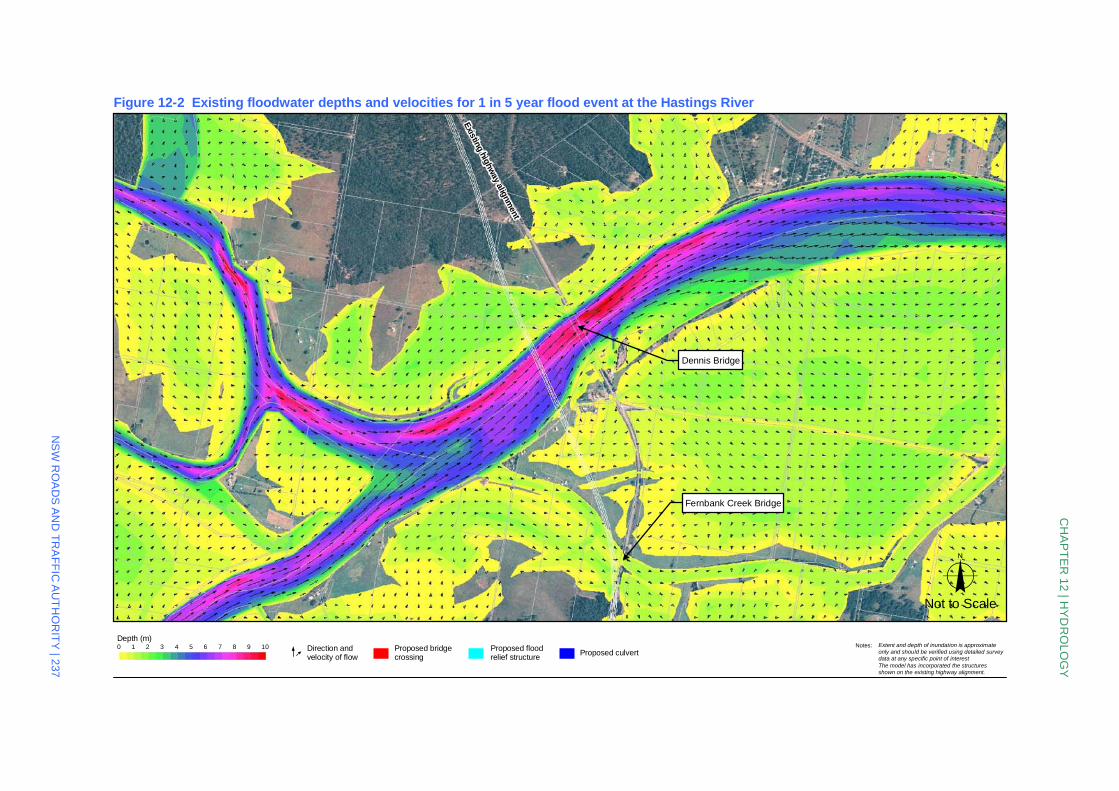
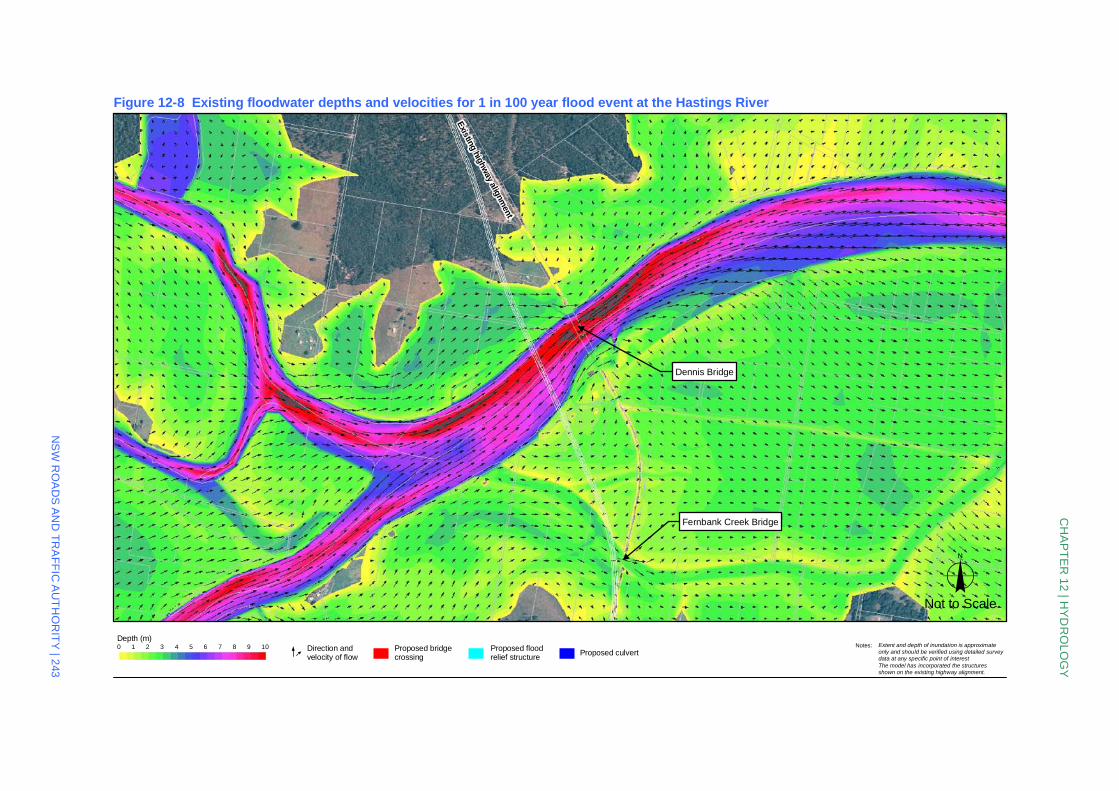
Peak velocities for the 1 in 100 year storm event through the Hastings River are generally 1.5 metres per second in the centre of the river and up to approximately 2.5 metres per second through the constriction formed by the existing Dennis Bridge. Flow velocities across the northern
and southern floodplains are generally less than 0.7 metres per second. The Fernbank Creek Bridge openings and other culverts are predicted to have higher flow velocities up to 1.7 metres per second.
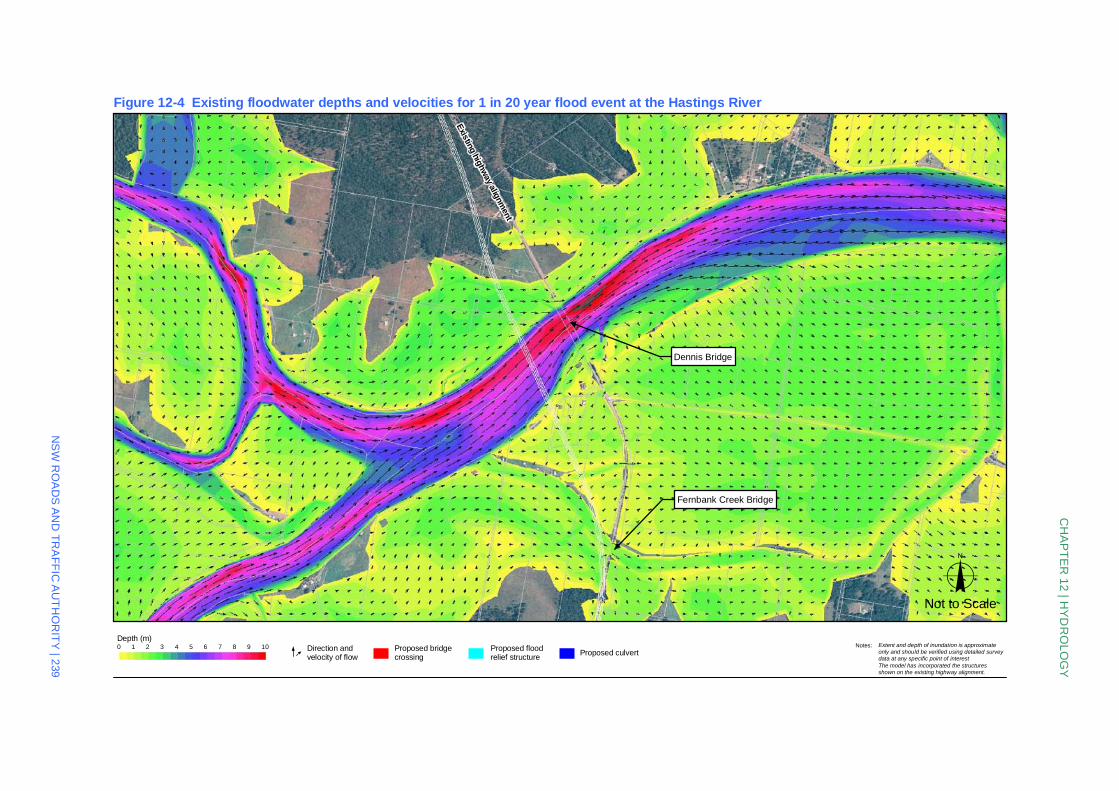
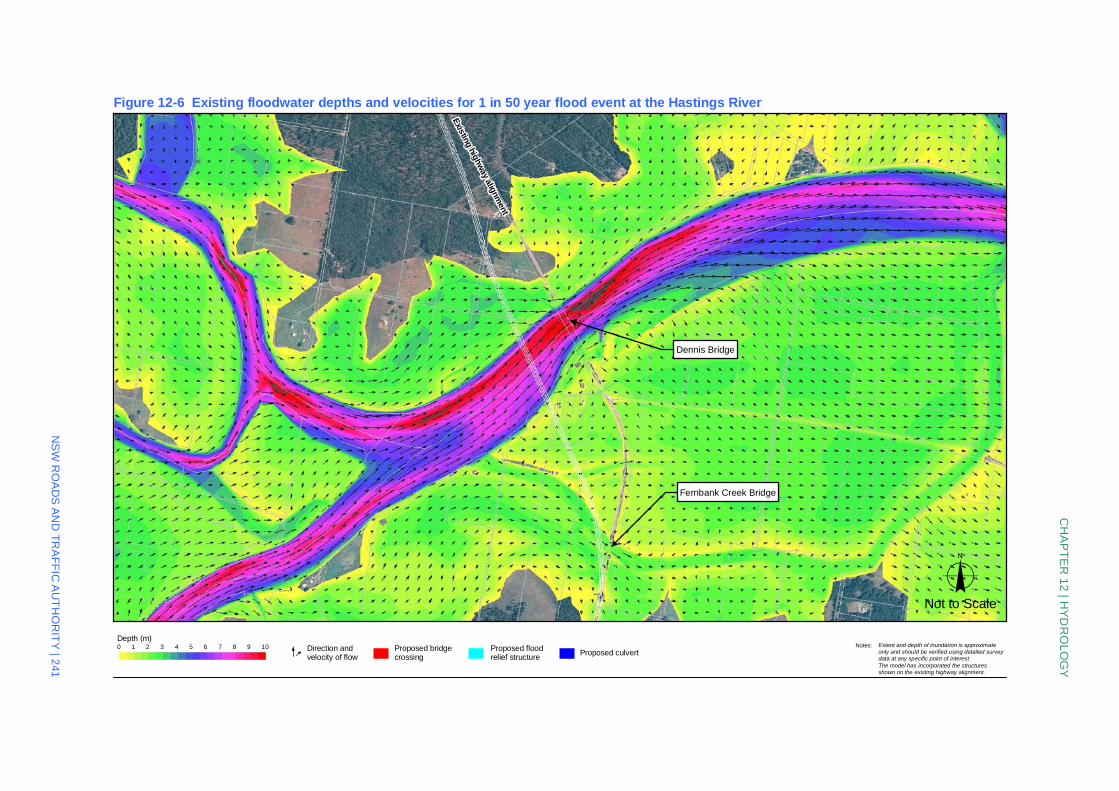
Existing floodwater depths and velocities for the Hastings River for the 1 in 5, 1 in 20, 1 in 50, 1 in 100 and extreme flood events are indicated in Figure 12-2, Figure 12-4, Figure 12-6, Figure 12-8 and Figure 12-11 respectively, in Section 12.3.2. These figures demonstrate that the existing
Pacific Highway, as it crosses the Hastings River floodplain, provides an impediment to flow during flood conditions.
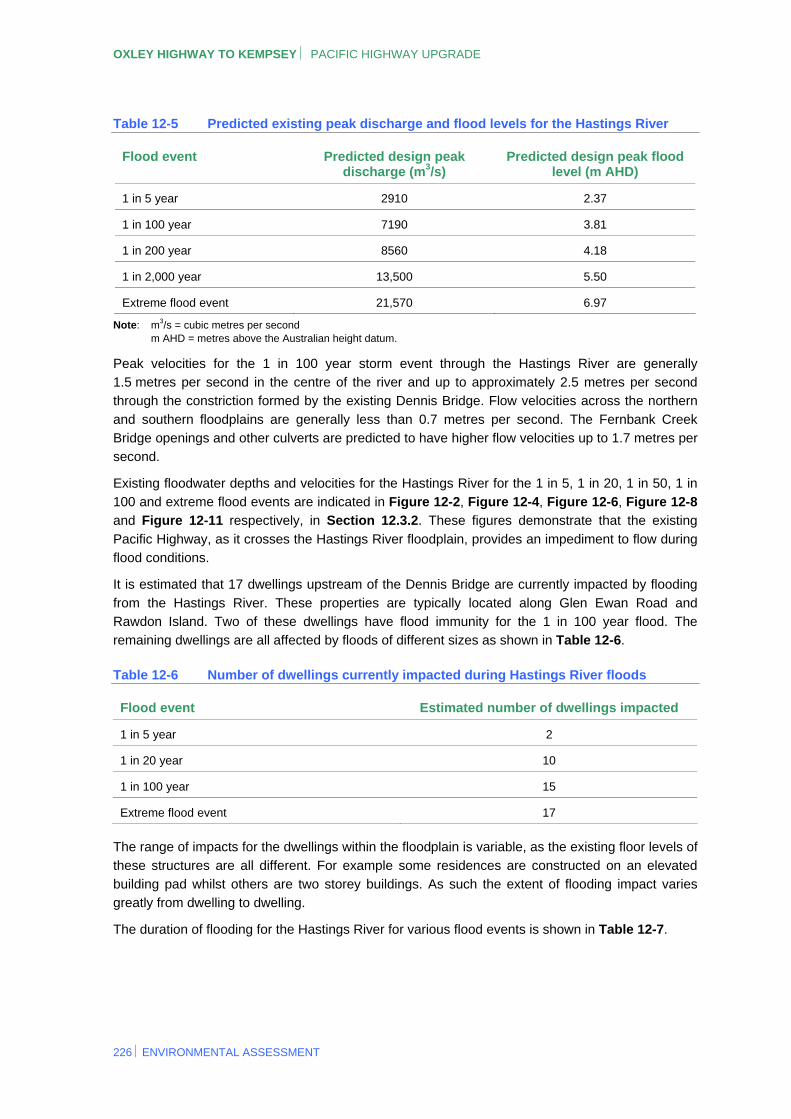
It is estimated that 17 dwellings upstream of the Dennis Bridge are currently impacted by flooding
from the Hastings River. These properties are typically located along Glen Ewan Road and Rawdon Island. Two of these dwellings have flood immunity for the 1 in 100 year flood. The remaining dwellings are all affected by floods of different sizes as shown in Table 12-6.
Table 12-6 Number of dwellings currently impacted during Hastings River floods
Flood event Estimated number of dwellings impacted
1 in 5 year 2
1 in 20 year 10
1 in 100 year 15
Extreme flood event 17
The range of impacts for the dwellings within the floodplain is variable, as the existing floor levels of
these structures are all different. For example some residences are constructed on an elevated building pad whilst others are two storey buildings. As such the extent of flooding impact varies greatly from dwelling to dwelling.
The duration of flooding for the Hastings River for various flood events is shown in Table 12-7.
226 ENVIRONMENTAL ASSESSMENT
CHAPTER 12 HYDROLOGY
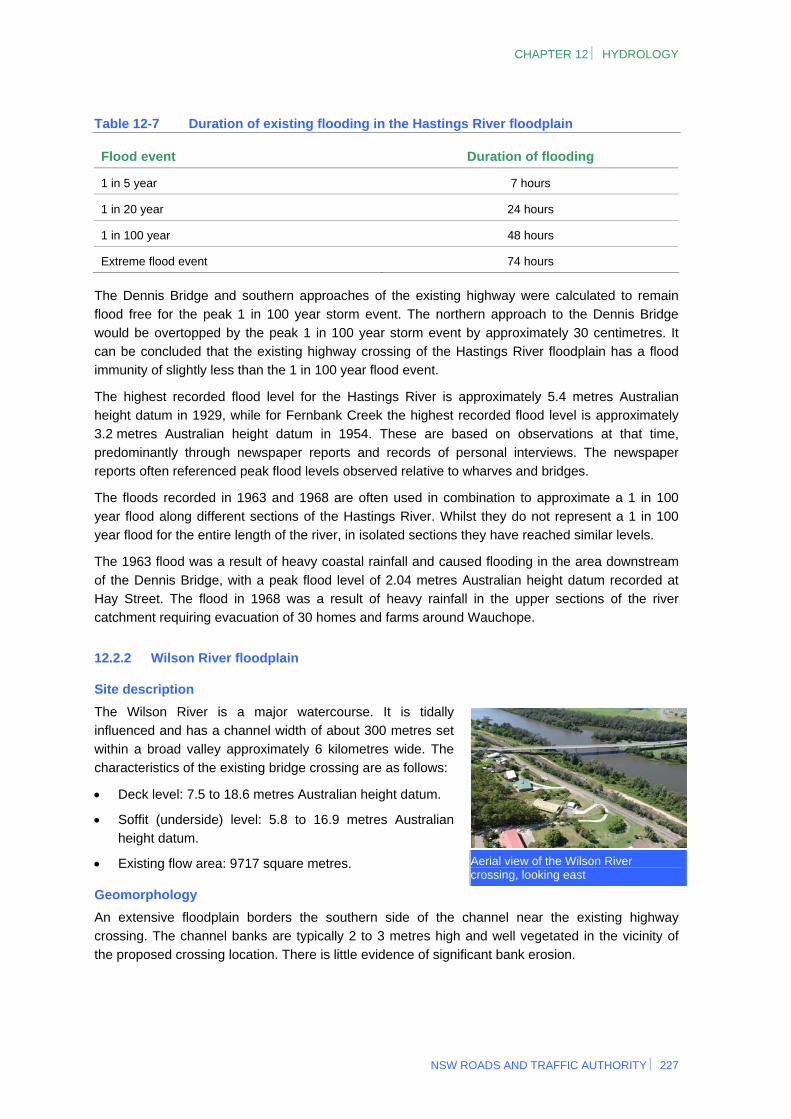
Table 12-7 Duration of existing flooding in the Hastings River floodplain
Flood event Duration of flooding
1 in 5 year 7 hours
1 in 20 year 24 hours
1 in 100 year 48 hours
Extreme flood event 74 hours
The Dennis Bridge and southern approaches of the existing highway were calculated to remain flood free for the peak 1 in 100 year storm event. The northern approach to the Dennis Bridge
would be overtopped by the peak 1 in 100 year storm event by approximately 30 centimetres. It can be concluded that the existing highway crossing of the Hastings River floodplain has a flood immunity of slightly less than the 1 in 100 year flood event.
The highest recorded flood level for the Hastings River is approximately 5.4 metres Australian height datum in 1929, while for Fernbank Creek the highest recorded flood level is approximately 3.2 metres Australian height datum in 1954. These are based on observations at that time,
predominantly through newspaper reports and records of personal interviews. The newspaper reports often referenced peak flood levels observed relative to wharves and bridges.
The floods recorded in 1963 and 1968 are often used in combination to approximate a 1 in 100
year flood along different sections of the Hastings River. Whilst they do not represent a 1 in 100 year flood for the entire length of the river, in isolated sections they have reached similar levels.
The 1963 flood was a result of heavy coastal rainfall and caused flooding in the area downstream
of the Dennis Bridge, with a peak flood level of 2.04 metres Australian height datum recorded at Hay Street. The flood in 1968 was a result of heavy rainfall in the upper sections of the river catchment requiring evacuation of 30 homes and farms around Wauchope.
12.2.2 Wilson River floodplain
Site description
Aerial view of the Wilson River crossing, looking east
The Wilson River is a major watercourse. It is tidally influenced and has a channel width of about 300 metres set within a broad valley approximately 6 kilometres wide. The
characteristics of the existing bridge crossing are as follows:
Deck level: 7.5 to 18.6 metres Australian height datum.
Soffit (underside) level: 5.8 to 16.9 metres Australian height datum.
Existing flow area: 9717 square metres.
Geomorphology
An extensive floodplain borders the southern side of the channel near the existing highway crossing. The channel banks are typically 2 to 3 metres high and well vegetated in the vicinity of the proposed crossing location. There is little evidence of significant bank erosion.
NSW ROADS AND TRAFFIC AUTHORITY 227
OXLEY HIGHWAY TO KEMPSEY PACIFIC HIGHWAY UPGRADE
Dalhunty Island is a large elongated island, and located within the channel of the Wilson River where the Proposal crosses the river. Mangroves are present on the northern and southern banks of both the Wilson River and Dalhunty Island while State listed wetlands are present on Dalhunty
Island and the northern bank of the river.
Existing flows and flooding
The Wilson and Maria rivers merge to form a common floodplain approximately 3.5 kilometres
downstream of the existing highway embankment. The results of modelling indicate that the existing highway impedes flow across the southern floodplain of the Wilson River. The Wilson River bridge and three smaller culvert openings along the southern embankment regulate flow to this
common floodplain from the Wilson River.
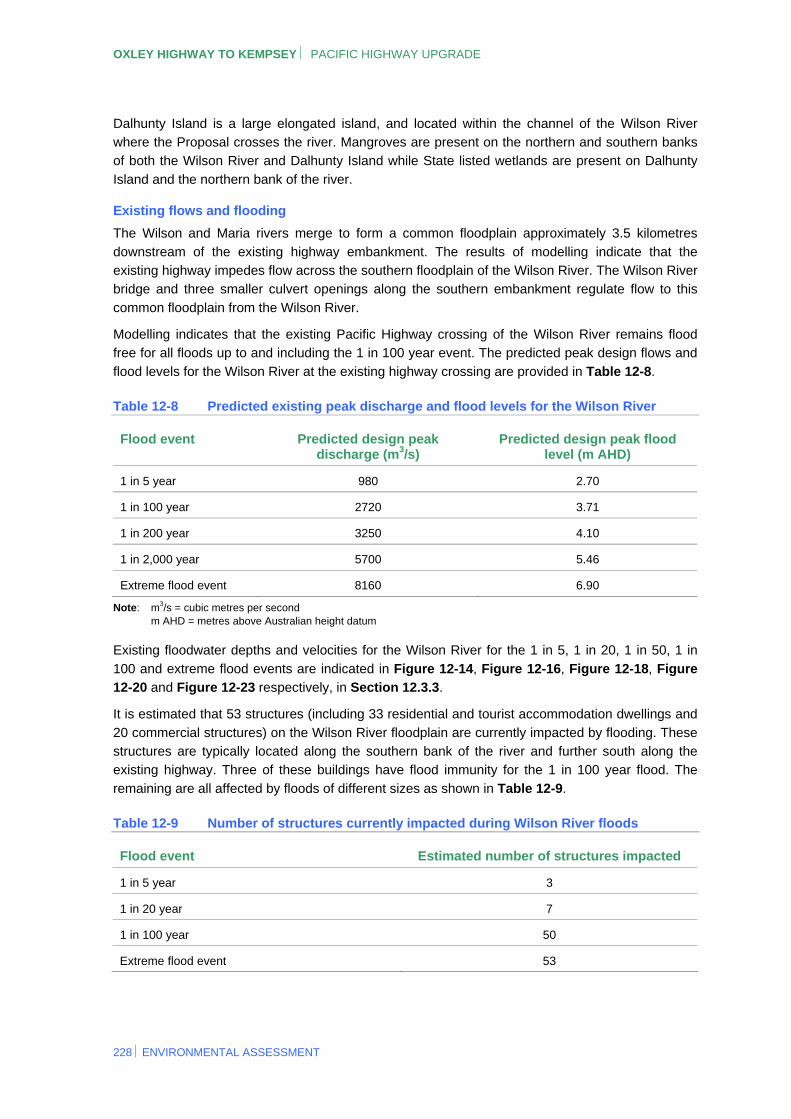
Modelling indicates that the existing Pacific Highway crossing of the Wilson River remains flood free for all floods up to and including the 1 in 100 year event. The predicted peak design flows and
flood levels for the Wilson River at the existing highway crossing are provided in Table 12-8.
Table 12-8 Predicted existing peak discharge and flood levels for the Wilson River
Flood event Predicted design peak discharge (m3/s)
Predicted design peak flood level (m AHD)
1 in 5 year 980 2.70
1 in 100 year 2720 3.71
1 in 200 year 3250 4.10
1 in 2,000 year 5700 5.46
Extreme flood event 8160 6.90
Note: m3/s = cubic metres per second m AHD = metres above Australian height datum
Existing floodwater depths and velocities for the Wilson River for the 1 in 5, 1 in 20, 1 in 50, 1 in
100 and extreme flood events are indicated in Figure 12-14, Figure 12-16, Figure 12-18, Figure 12-20 and Figure 12-23 respectively, in Section 12.3.3.
It is estimated that 53 structures (including 33 residential and tourist accommodation dwellings and
20 commercial structures) on the Wilson River floodplain are currently impacted by flooding. These structures are typically located along the southern bank of the river and further south along the existing highway. Three of these buildings have flood immunity for the 1 in 100 year flood. The
remaining are all affected by floods of different sizes as shown in Table 12-9.
Table 12-9 Number of structures currently impacted during Wilson River floods
Flood event Estimated number of structures impacted
1 in 5 year 3
1 in 20 year 7
1 in 100 year 50
Extreme flood event 53
228 ENVIRONMENTAL ASSESSMENT
CHAPTER 12 HYDROLOGY
The range of impacts for the dwellings and buildings within the floodplain is variable, as the existing floor levels of these structures are all different. For example some buildings are constructed on an elevated building pad whilst others are two storey buildings. As such the extent of flooding impact
varies greatly from property to property.
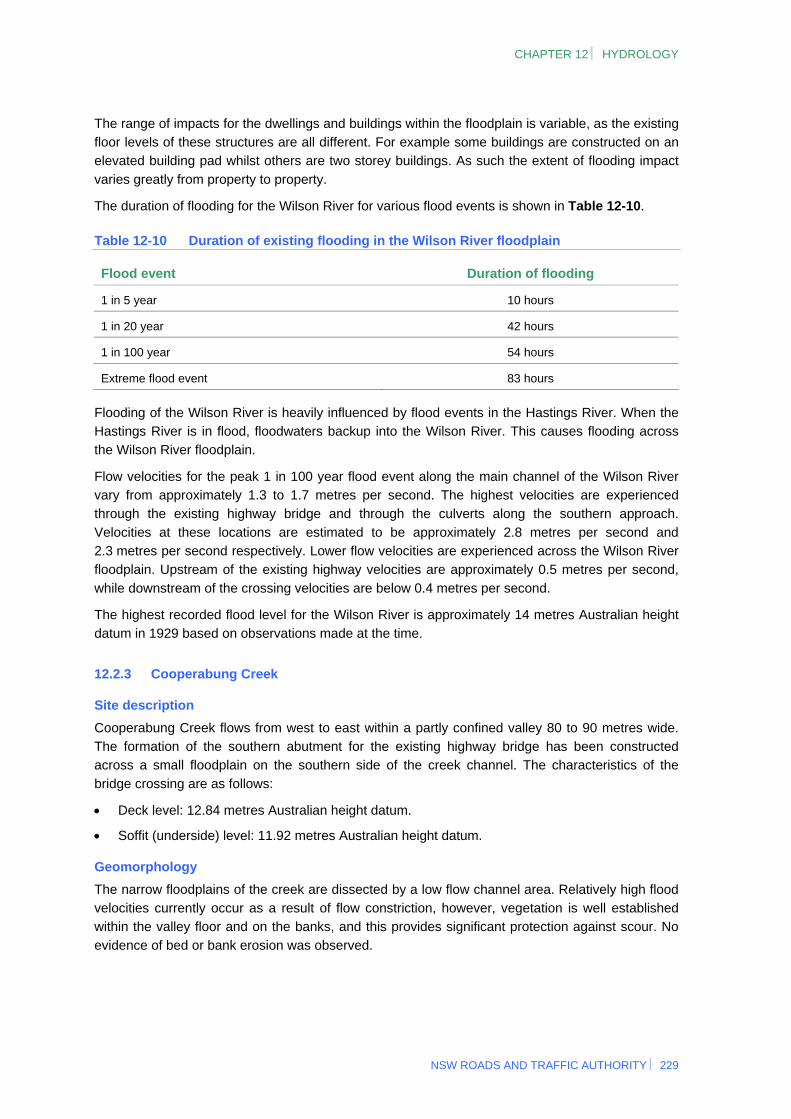
The duration of flooding for the Wilson River for various flood events is shown in Table 12-10.
Table 12-10 Duration of existing flooding in the Wilson River floodplain
Flood event Duration of flooding
1 in 5 year 10 hours
1 in 20 year 42 hours
1 in 100 year 54 hours
Extreme flood event 83 hours
Flooding of the Wilson River is heavily influenced by flood events in the Hastings River. When the Hastings River is in flood, floodwaters backup into the Wilson River. This causes flooding across the Wilson River floodplain.
Flow velocities for the peak 1 in 100 year flood event along the main channel of the Wilson River vary from approximately 1.3 to 1.7 metres per second. The highest velocities are experienced through the existing highway bridge and through the culverts along the southern approach.
Velocities at these locations are estimated to be approximately 2.8 metres per second and 2.3 metres per second respectively. Lower flow velocities are experienced across the Wilson River floodplain. Upstream of the existing highway velocities are approximately 0.5 metres per second,
while downstream of the crossing velocities are below 0.4 metres per second.
The highest recorded flood level for the Wilson River is approximately 14 metres Australian height datum in 1929 based on observations made at the time.
12.2.3 Cooperabung Creek
Site description
Cooperabung Creek flows from west to east within a partly confined valley 80 to 90 metres wide. The formation of the southern abutment for the existing highway bridge has been constructed across a small floodplain on the southern side of the creek channel. The characteristics of the
bridge crossing are as follows:
Deck level: 12.84 metres Australian height datum.
Soffit (underside) level: 11.92 metres Australian height datum.
Geomorphology
The narrow floodplains of the creek are dissected by a low flow channel area. Relatively high flood velocities currently occur as a result of flow constriction, however, vegetation is well established within the valley floor and on the banks, and this provides significant protection against scour. No
evidence of bed or bank erosion was observed.
NSW ROADS AND TRAFFIC AUTHORITY 229
OXLEY HIGHWAY TO KEMPSEY PACIFIC HIGHWAY UPGRADE
Existing flows and flooding
Baseline hydraulic modelling of the bridge at Cooperabung Creek demonstrates that the bridge at this location has flood immunity for the 1 in 100 year event. Details for comparison with the
Proposal are shown in Table 12-22 in Section 12.3.
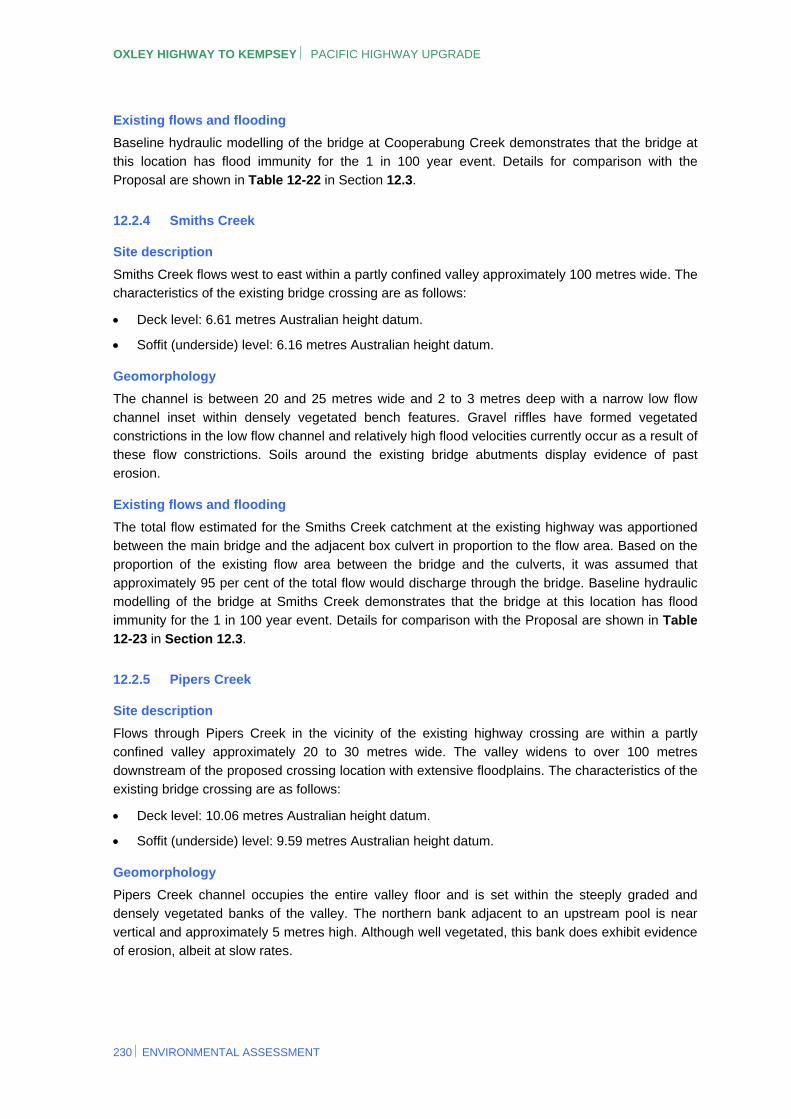
12.2.4 Smiths Creek
Site description
Smiths Creek flows west to east within a partly confined valley approximately 100 metres wide. The characteristics of the existing bridge crossing are as follows:
Deck level: 6.61 metres Australian height datum.
Soffit (underside) level: 6.16 metres Australian height datum.
Geomorphology
The channel is between 20 and 25 metres wide and 2 to 3 metres deep with a narrow low flow
channel inset within densely vegetated bench features. Gravel riffles have formed vegetated constrictions in the low flow channel and relatively high flood velocities currently occur as a result of these flow constrictions. Soils around the existing bridge abutments display evidence of past
erosion.
Existing flows and flooding
The total flow estimated for the Smiths Creek catchment at the existing highway was apportioned between the main bridge and the adjacent box culvert in proportion to the flow area. Based on the proportion of the existing flow area between the bridge and the culverts, it was assumed that
approximately 95 per cent of the total flow would discharge through the bridge. Baseline hydraulic modelling of the bridge at Smiths Creek demonstrates that the bridge at this location has flood immunity for the 1 in 100 year event. Details for comparison with the Proposal are shown in Table
12-23 in Section 12.3.
12.2.5 Pipers Creek
Site description
Flows through Pipers Creek in the vicinity of the existing highway crossing are within a partly confined valley approximately 20 to 30 metres wide. The valley widens to over 100 metres
downstream of the proposed crossing location with extensive floodplains. The characteristics of the existing bridge crossing are as follows:
Deck level: 10.06 metres Australian height datum.
Soffit (underside) level: 9.59 metres Australian height datum.
Geomorphology
Pipers Creek channel occupies the entire valley floor and is set within the steeply graded and densely vegetated banks of the valley. The northern bank adjacent to an upstream pool is near
vertical and approximately 5 metres high. Although well vegetated, this bank does exhibit evidence of erosion, albeit at slow rates.
230 ENVIRONMENTAL ASSESSMENT
CHAPTER 12 HYDROLOGY
Existing flows and flooding
Baseline hydraulic modelling of the bridge at Pipers Creek demonstrates that the bridge at this location has flood immunity for the 1 in 100 year event. Details for comparison with the Proposal
are shown in Table 12-24 in Section 12.3.
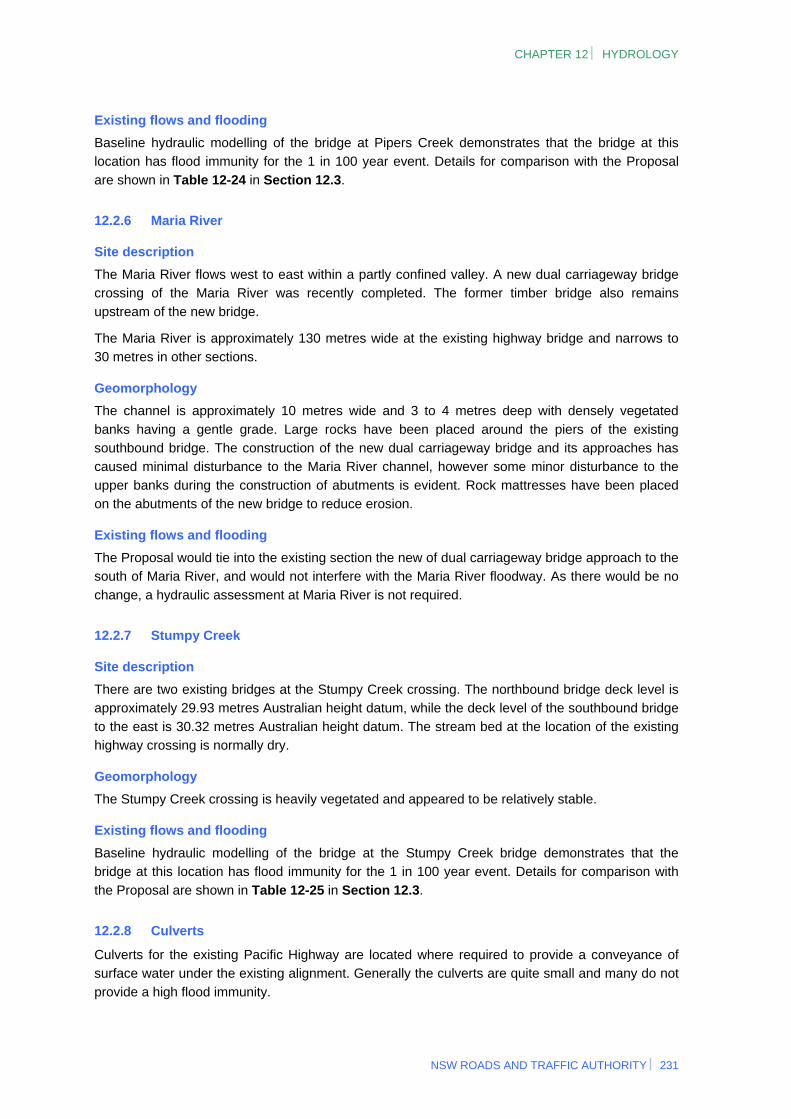
12.2.6 Maria River
Site description
The Maria River flows west to east within a partly confined valley. A new dual carriageway bridge crossing of the Maria River was recently completed. The former timber bridge also remains
upstream of the new bridge.
The Maria River is approximately 130 metres wide at the existing highway bridge and narrows to 30 metres in other sections.
Geomorphology
The channel is approximately 10 metres wide and 3 to 4 metres deep with densely vegetated
banks having a gentle grade. Large rocks have been placed around the piers of the existing southbound bridge. The construction of the new dual carriageway bridge and its approaches has caused minimal disturbance to the Maria River channel, however some minor disturbance to the
upper banks during the construction of abutments is evident. Rock mattresses have been placed on the abutments of the new bridge to reduce erosion.
Existing flows and flooding
The Proposal would tie into the existing section the new of dual carriageway bridge approach to the south of Maria River, and would not interfere with the Maria River floodway. As there would be no
change, a hydraulic assessment at Maria River is not required.
12.2.7 Stumpy Creek
Site description
There are two existing bridges at the Stumpy Creek crossing. The northbound bridge deck level is approximately 29.93 metres Australian height datum, while the deck level of the southbound bridge
to the east is 30.32 metres Australian height datum. The stream bed at the location of the existing highway crossing is normally dry.
Geomorphology
The Stumpy Creek crossing is heavily vegetated and appeared to be relatively stable.
Existing flows and flooding
Baseline hydraulic modelling of the bridge at the Stumpy Creek bridge demonstrates that the bridge at this location has flood immunity for the 1 in 100 year event. Details for comparison with
the Proposal are shown in Table 12-25 in Section 12.3.
12.2.8 Culverts
Culverts for the existing Pacific Highway are located where required to provide a conveyance of surface water under the existing alignment. Generally the culverts are quite small and many do not
provide a high flood immunity.
NSW ROADS AND TRAFFIC AUTHORITY 231
OXLEY HIGHWAY TO KEMPSEY PACIFIC HIGHWAY UPGRADE
232 ENVIRONMENTAL ASSESSMENT
12.2.9 Drainage
Minimal longitudinal drainage exists for the existing highway.
12.3 Predicted hydrological impacts of the Proposal
The same hydrologic and hydraulic models were used to simulate construction of the Proposal to assess the impacts on flooding. A comparison was then made to determine the differences
between the existing situation and that after construction of the Proposal.
Overall the impact of the Proposal on flooding is not considered significant as mitigation measures were incorporated into the design. Where predicted impacts were identified, such as minor
increased flood levels or velocities for example, measures to manage these impacts have been identified and these are discussed in Section 12.4.
The design of the Proposal incorporates a number of flood relief structures to minimise the impacts
of flooding. The type of flood relief structures includes pipe culverts, box culverts, small bridge structures or a combination of these. The final size, location and type of structure would be refined during the detailed design phase.
The following sections discuss the predicted hydrological impacts of the Proposal taking into consideration the proposed flood relief structures in terms of overall impacts on flooding, impacts on individual watercourses, and impacts in relation to specific Proposal elements.
12.3.1 Overall impacts on flooding
The Proposal’s design has been undertaken to minimise flooding impacts on properties and infrastructure. This would be achieved through the provision of a hydraulic design that minimises the change in flow behaviour by not creating additional significant water ponding areas, not
significantly changing floodplain flow patterns and durations, not significantly changing flood levels and not discharging water directly to environmentally sensitive areas such as critical watercourses and endangered ecological communities.
The impact of the Proposal on flood behaviour on the major watercourses, across the Hastings River and Wilson river floodplains, was assessed in the Preliminary Hydrology and Hydraulics Report (Worley Parsons 2010). The change in flood impact was determined through the use of a
two-dimensional flooding model. The assessment indicates that for all flood events assessed, no additional dwellings would experience flooding as a result of the Proposal. Minor changes in flood levels and velocities are predicted, and these are discussed further in Sections 12.3.2 to 12.3.4.
The impact of the Proposal on the minor watercourses was also assessed. The assessment indicates that there are impacts on flood levels for the minor watercourses, and these are discussed below in Sections 12.3.5 to 12.3.8.
The impacts at culverts are assessed in Section 12.3.9. The assessment indicates that the concept design complies with the relevant design criteria.
Duration of flooding inundation
Flooding across the Hastings and Wilson river floodplains results in the floodplains being inundated for days at a time. For the existing situation, the 1 in 100 year flood event will flood the Hastings
River floodplain for approximately 48 hours. The Wilson River floodplain is predicted to remain inundated for approximately 54 hours.
CHAPTER 12 HYDROLOGY
NSW ROADS AND TRAFFIC AUTHORITY 233
The overall duration of flooding across the major floodplains is predicted to increase slightly. This increase is not considered significant as the overall flood behaviour remains broadly the same. For the Hastings River floodplain inundation could increase by up to one hour for all events up to and
including the 1 in 100 year flood. For the Wilson River floodplain, the predicted increase in flooding duration is less than one hour for the 1 in 5 and 1 in 20 year floods. For the 1 in 100 year flood there is approximately a two hour increase in the duration of flooding.
Further details and are included in Sections 12.3.2 to 12.3.4 for the major watercourses and in Sections 12.3.5 to 12.3.8 the minor watercourses are addressed.
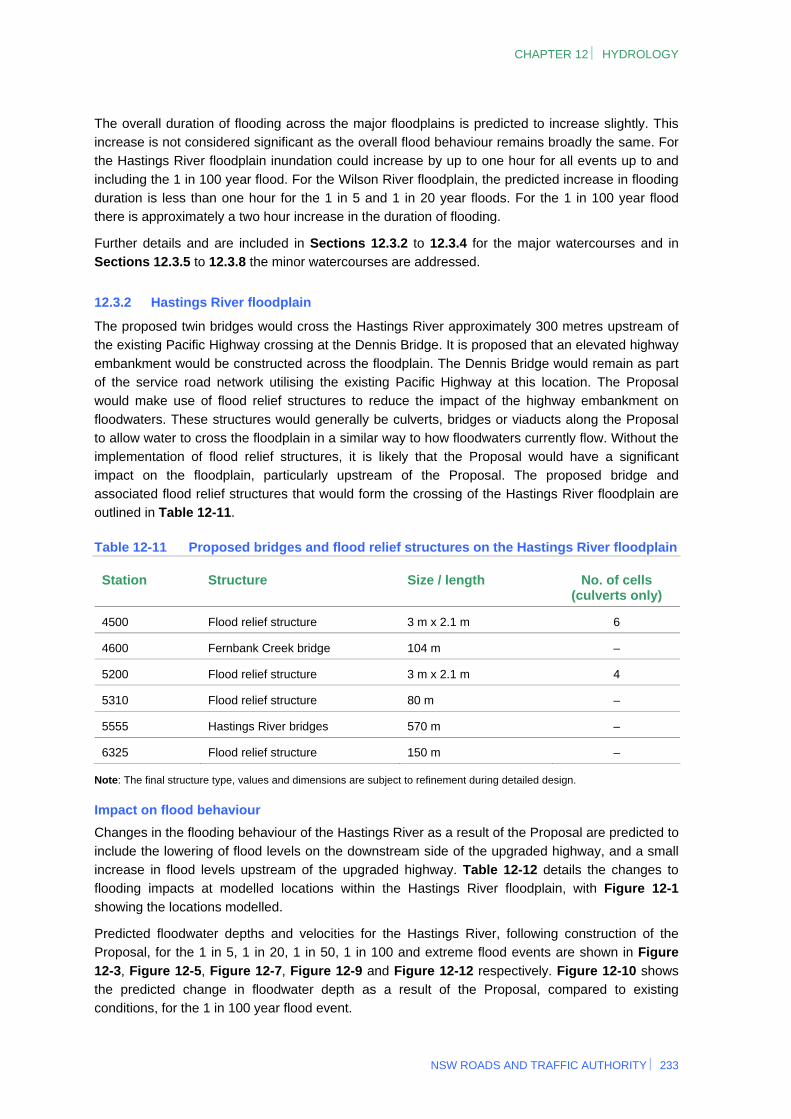
12.3.2 Hastings River floodplain
The proposed twin bridges would cross the Hastings River approximately 300 metres upstream of the existing Pacific Highway crossing at the Dennis Bridge. It is proposed that an elevated highway
embankment would be constructed across the floodplain. The Dennis Bridge would remain as part of the service road network utilising the existing Pacific Highway at this location. The Proposal would make use of flood relief structures to reduce the impact of the highway embankment on
floodwaters. These structures would generally be culverts, bridges or viaducts along the Proposal to allow water to cross the floodplain in a similar way to how floodwaters currently flow. Without the implementation of flood relief structures, it is likely that the Proposal would have a significant
impact on the floodplain, particularly upstream of the Proposal. The proposed bridge and associated flood relief structures that would form the crossing of the Hastings River floodplain are outlined in Table 12-11.
Table 12-11 Proposed bridges and flood relief structures on the Hastings River floodplain
Station Structure Size / length No. of cells (culverts only)
4500 Flood relief structure 3 m x 2.1 m 6
4600 Fernbank Creek bridge 104 m –
5200 Flood relief structure 3 m x 2.1 m 4
5310 Flood relief structure 80 m –
5555 Hastings River bridges 570 m –
6325 Flood relief structure 150 m –
Note: The final structure type, values and dimensions are subject to refinement during detailed design.
Impact on flood behaviour
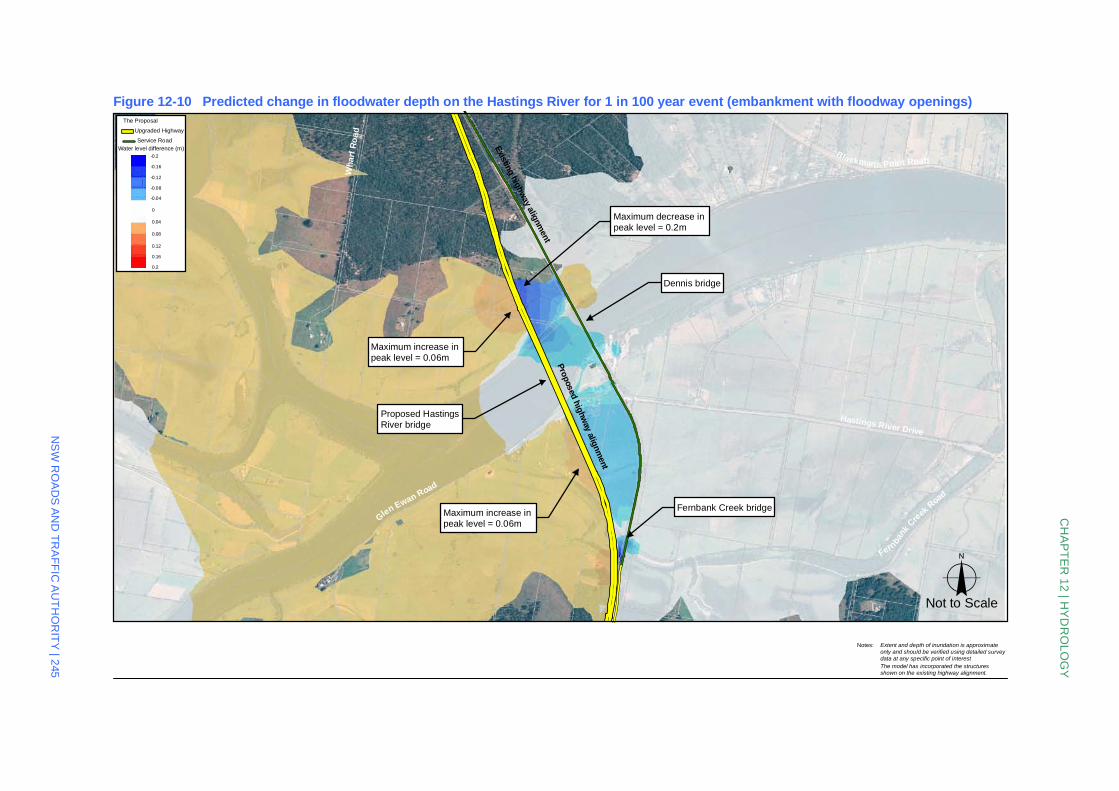
Changes in the flooding behaviour of the Hastings River as a result of the Proposal are predicted to
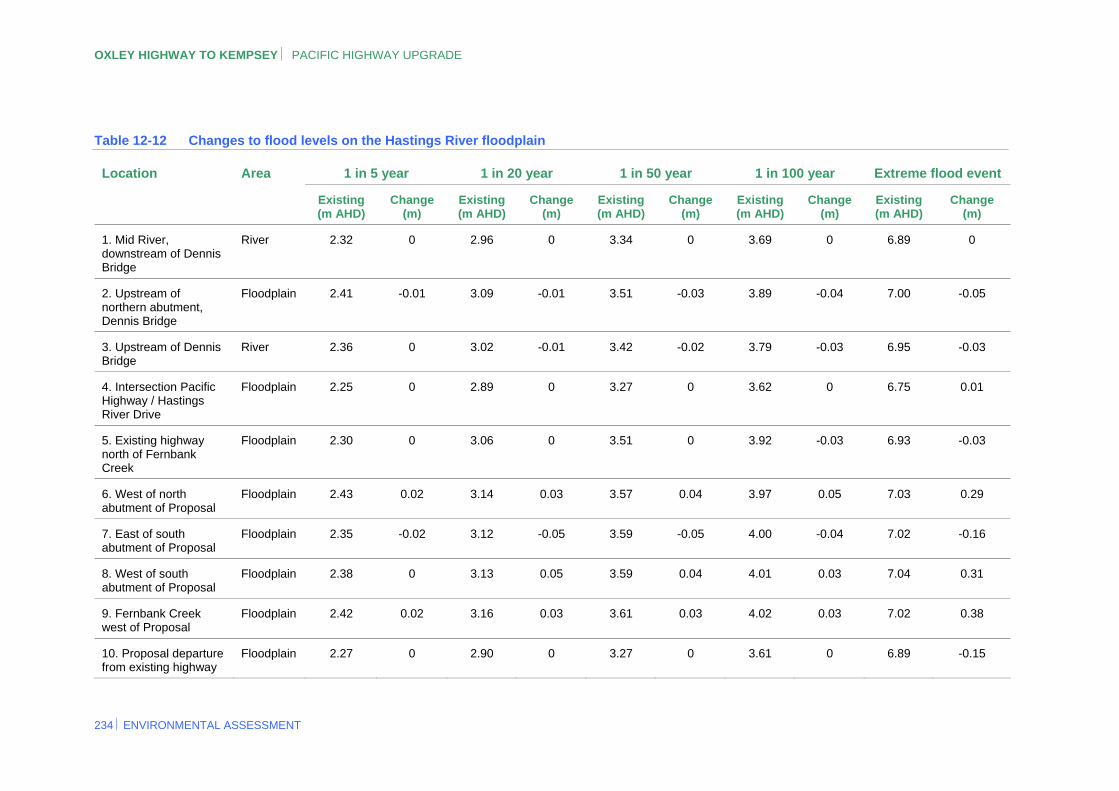
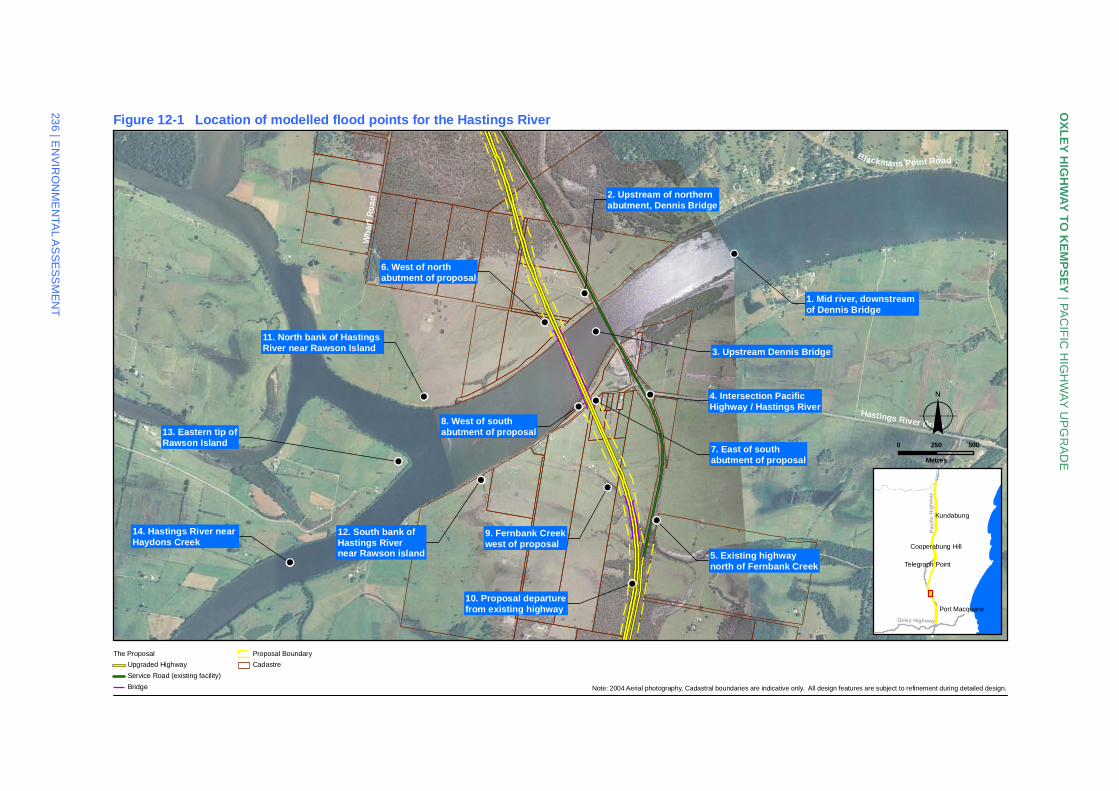
include the lowering of flood levels on the downstream side of the upgraded highway, and a small increase in flood levels upstream of the upgraded highway. Table 12-12 details the changes to flooding impacts at modelled locations within the Hastings River floodplain, with Figure 12-1
showing the locations modelled.
Predicted floodwater depths and velocities for the Hastings River, following construction of the Proposal, for the 1 in 5, 1 in 20, 1 in 50, 1 in 100 and extreme flood events are shown in Figure
12-3, Figure 12-5, Figure 12-7, Figure 12-9 and Figure 12-12 respectively. Figure 12-10 shows the predicted change in floodwater depth as a result of the Proposal, compared to existing conditions, for the 1 in 100 year flood event.
OXLEY HIGHWAY TO KEMPSEY PACIFIC HIGHWAY UPGRADE
Table 12-12 Changes to flood levels on the Hastings River floodplain
1 in 5 year 1 in 20 year 1 in 50 year 1 in 100 year Extreme flood event Location Area
Existing (m AHD)
Change (m)
Existing (m AHD)
Change (m)
Existing (m AHD)
Change (m)
Existing (m AHD)
Change (m)
Existing (m AHD)
Change (m)
1. Mid River, downstream of Dennis Bridge
River 2.32 0 2.96 0 3.34 0 3.69 0 6.89 0
2. Upstream of northern abutment, Dennis Bridge
Floodplain 2.41 -0.01 3.09 -0.01 3.51 -0.03 3.89 -0.04 7.00 -0.05
3. Upstream of Dennis Bridge
River 2.36 0 3.02 -0.01 3.42 -0.02 3.79 -0.03 6.95 -0.03
4. Intersection Pacific Highway / Hastings River Drive
Floodplain 2.25 0 2.89 0 3.27 0 3.62 0 6.75 0.01
5. Existing highway north of Fernbank Creek
Floodplain 2.30 0 3.06 0 3.51 0 3.92 -0.03 6.93 -0.03
6. West of north abutment of Proposal
Floodplain 2.43 0.02 3.14 0.03 3.57 0.04 3.97 0.05 7.03 0.29
7. East of south abutment of Proposal
Floodplain 2.35 -0.02 3.12 -0.05 3.59 -0.05 4.00 -0.04 7.02 -0.16
8. West of south abutment of Proposal
Floodplain 2.38 0 3.13 0.05 3.59 0.04 4.01 0.03 7.04 0.31
9. Fernbank Creek west of Proposal
Floodplain 2.42 0.02 3.16 0.03 3.61 0.03 4.02 0.03 7.02 0.38
10. Proposal departure from existing highway
Floodplain 2.27 0 2.90 0 3.27 0 3.61 0 6.89 -0.15
234 ENVIRONMENTAL ASSESSMENT
CHAPTER 12 HYDROLOGY
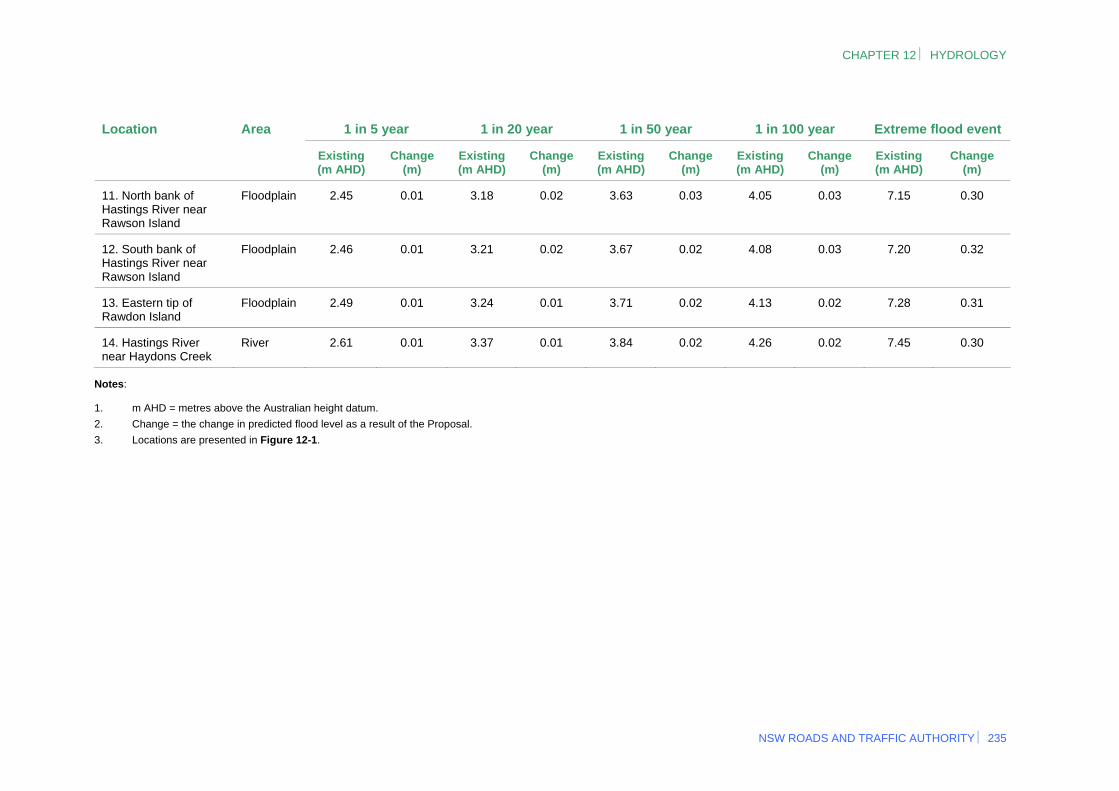
NSW ROADS AND TRAFFIC AUTHORITY 235
1 in 5 year 1 in 20 year 1 in 50 year 1 in 100 year Extreme flood event Location Area
Existing (m AHD)
Change (m)
Existing (m AHD)
Change (m)
Existing (m AHD)
Change (m)
Existing (m AHD)
Change (m)
Existing (m AHD)
Change (m)
11. North bank of Hastings River near Rawson Island
Floodplain 2.45 0.01 3.18 0.02 3.63 0.03 4.05 0.03 7.15 0.30
12. South bank of Hastings River near Rawson Island
Floodplain 2.46 0.01 3.21 0.02 3.67 0.02 4.08 0.03 7.20 0.32
13. Eastern tip of Rawdon Island
Floodplain 2.49 0.01 3.24 0.01 3.71 0.02 4.13 0.02 7.28 0.31
14. Hastings River near Haydons Creek
River 2.61 0.01 3.37 0.01 3.84 0.02 4.26 0.02 7.45 0.30
Notes:
1. m AHD = metres above the Australian height datum.
2. Change = the change in predicted flood level as a result of the Proposal.
3. Locations are presented in Figure 12-1.
!
!
!
!
!
!
!
!
!
!
!
!
!
!
!
!
!
!
!
!
!
!
!
!
!
!
!
!
!
!
!
!
!!
!
!
!
!
!
!
!
!
!
!
!
!
!
!
!
!
!
!
!
!
!
!
!
!
1. Mid river, downstreamof Dennis Bridge
!
2. Upstream of northernabutment, Dennis Bridge
!
3. Upstream Dennis Bridge
!4. Intersection PacificHighway / Hastings River
!
5. Existing highwaynorth of Fernbank Creek
!
6. West of northabutment of proposal
!
7. East of southabutment of proposal
!
8. West of southabutment of proposal
!
9. Fernbank Creekwest of proposal
!
10. Proposal departurefrom existing highway
!
11. North bank of HastingsRiver near Rawson Island
!
13. Eastern tip ofRawson Island
!
14. Hastings River nearHaydons Creek
!
12. South bank ofHastings Rivernear Rawson island
Hastings River Drive
Wh
arf
Ro
ad
Fernbank Cre
ekRoad
Blackmans Point Road
Figure 12-1 Location of modelled flood points for the Hastings River
o
OX
LE
Y H
IGH
WA
Y T
O K
EM
PS
EY
| PA
CIF
IC H
IGH
WA
Y U
PG
RA
DE
236
| EN
VIR
ON
ME
NTA
L A
SS
ES
SM
EN
T
0 500250
Metres
Pac
ific
Hig
hw
ay
Oxley Highway
Kundabung
Port Macquarie
Telegraph Point
Cooperabung Hill
The Proposal
Upgraded Highway
Service Road (existing facility)
Bridge
!
! Proposal Boundary
Cadastre
Note: 2004 Aerial photography, Cadastral boundaries are indicative only. All design features are subject to refinement during detailed design.
Depth (m)0 1 2 3 4 5 6 7 8 9 10
Figure 12-2 Existing floodwater depths and velocities for 1 in 5 year flood event at the Hastings River
Dennis Bridge
Fernbank Creek Bridge
Existing highway alignm
ent
CH
AP
TE
R 1
2 | H
YD
RO
LO
GY
NS
W R
OA
DS
AN
D T
RA
FF
IC A
UT
HO
RIT
Y | 2
37
Notes: Extent and depth of inundation is approximateonly and should be verified using detailed surveydata at any specific point of interestThe model has incorporated the structuresshown on the existing highway alignment.
oProposed culvert
Proposed floodrelief structure
Proposed bridgecrossing
Direction andvelocity of flow
Not to Scale
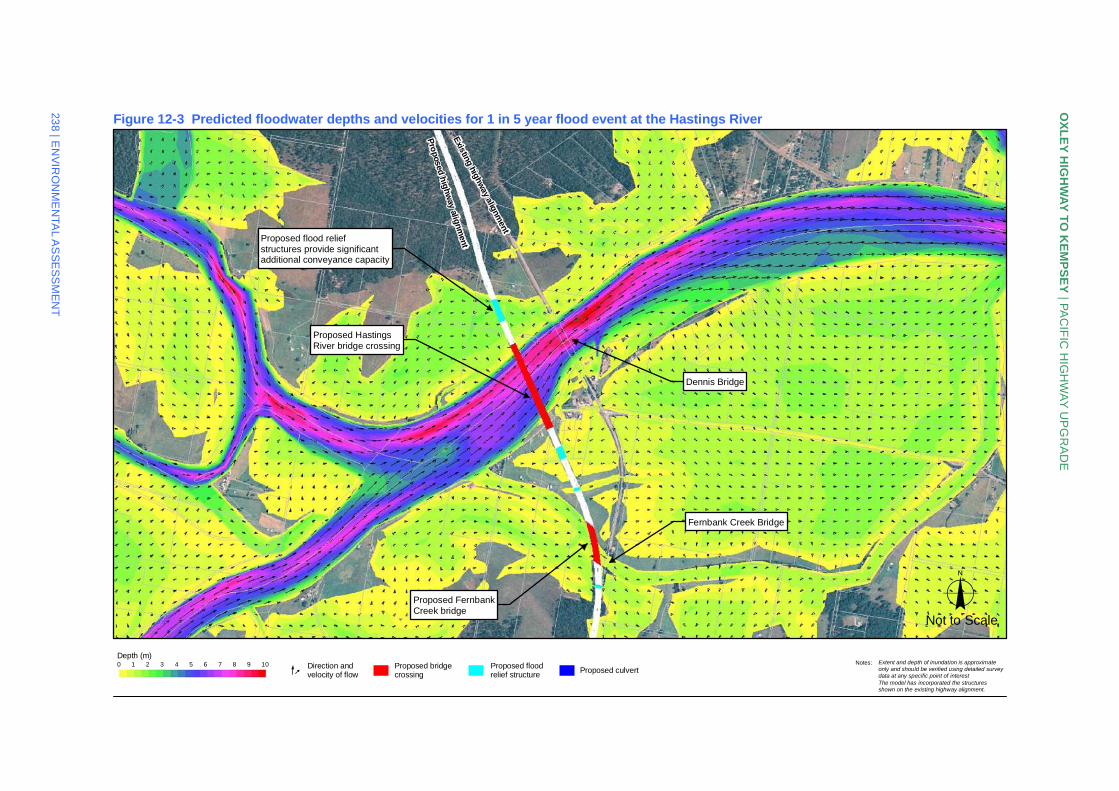
Figure 12-3 Predicted floodwater depths and velocities for 1 in 5 year flood event at the Hastings River
Dennis Bridge
Proposed HastingsRiver bridge crossing
Fernbank Creek Bridge
Pro
posed hig
hway alignm
entExisting highw
ay alignment
Proposed flood reliefstructures provide significantadditional conveyance capacity
Proposed FernbankCreek bridge
OX
LE
Y H
IGH
WA
Y T
O K
EM
PS
EY
| PA
CIF
IC H
IGH
WA
Y U
PG
RA
DE
238
| EN
VIR
ON
ME
NTA
L A
SS
ES
SM
EN
T
Notes: Extent and depth of inundation is approximateonly and should be verified using detailed surveydata at any specific point of interestThe model has incorporated the structuresshown on the existing highway alignment.
oNot to Scale
Depth (m)0 1 2 3 4 5 6 7 8 9 10
Proposed culvertProposed floodrelief structure
Proposed bridgecrossing
Direction andvelocity of flow
Depth (m)0 1 2 3 4 5 6 7 8 9 10
Figure 12-4 Existing floodwater depths and velocities for 1 in 20 year flood event at the Hastings River
Dennis Bridge
Fernbank Creek Bridge
Existing highway alignm
ent
CH
AP
TE
R 1
2 | H
YD
RO
LO
GY
NS
W R
OA
DS
AN
D T
RA
FF
IC A
UT
HO
RIT
Y | 2
39
Notes: Extent and depth of inundation is approximateonly and should be verified using detailed surveydata at any specific point of interestThe model has incorporated the structuresshown on the existing highway alignment.
oProposed culvert
Proposed floodrelief structure
Proposed bridgecrossing
Direction andvelocity of flow
Not to Scale
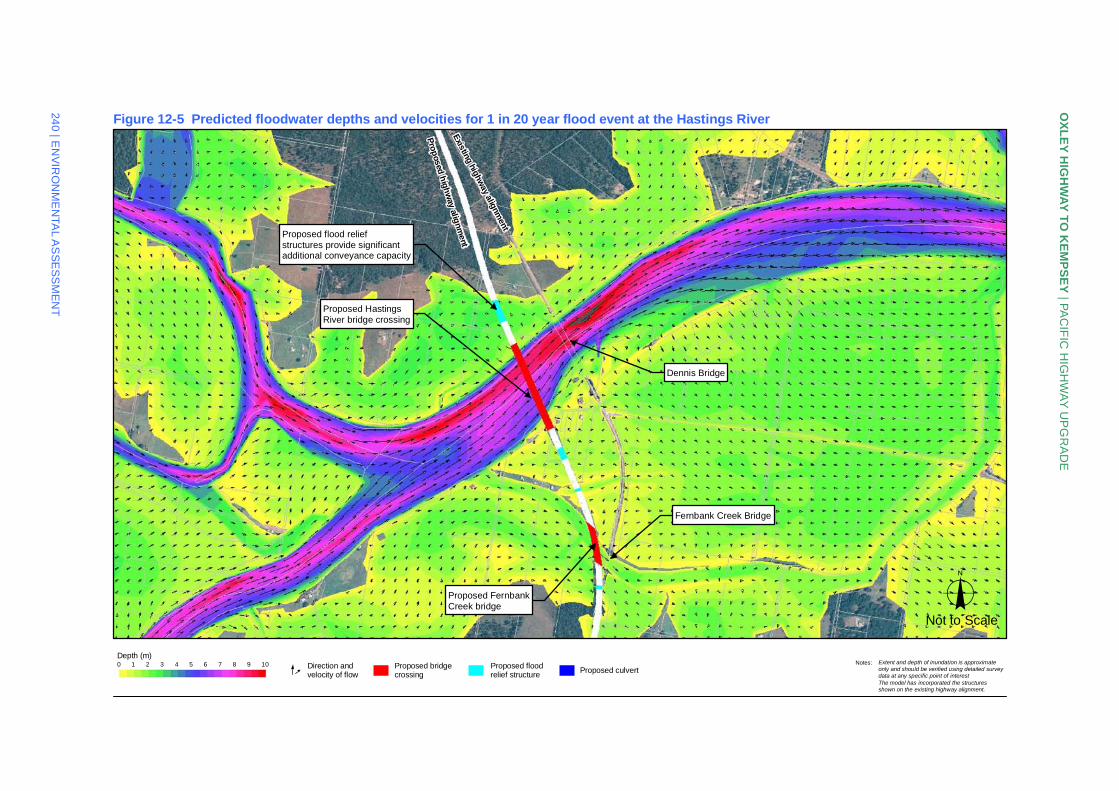
Figure 12-5 Predicted floodwater depths and velocities for 1 in 20 year flood event at the Hastings River
Dennis Bridge
Proposed HastingsRiver bridge crossing
Fernbank Creek Bridge
Prop
osed h
ighw
ay alignm
entExisting highw
ay alignment
Proposed flood reliefstructures provide significantadditional conveyance capacity
Proposed FernbankCreek bridge
OX
LE
Y H
IGH
WA
Y T
O K
EM
PS
EY
| PA
CIF
IC H
IGH
WA
Y U
PG
RA
DE
240
| EN
VIR
ON
ME
NTA
L A
SS
ES
SM
EN
T
Notes: Extent and depth of inundation is approximateonly and should be verified using detailed surveydata at any specific point of interestThe model has incorporated the structuresshown on the existing highway alignment.
oNot to Scale
Depth (m)0 1 2 3 4 5 6 7 8 9 10
Proposed culvertProposed floodrelief structure
Proposed bridgecrossing
Direction andvelocity of flow
Depth (m)0 1 2 3 4 5 6 7 8 9 10
Figure 12-6 Existing floodwater depths and velocities for 1 in 50 year flood event at the Hastings River
Dennis Bridge
Fernbank Creek Bridge
Existing highway alignm
ent
CH
AP
TE
R 1
2 | H
YD
RO
LO
GY
NS
W R
OA
DS
AN
D T
RA
FF
IC A
UT
HO
RIT
Y | 2
41
Notes: Extent and depth of inundation is approximateonly and should be verified using detailed surveydata at any specific point of interestThe model has incorporated the structuresshown on the existing highway alignment.
oProposed culvert
Proposed floodrelief structure
Proposed bridgecrossing
Direction andvelocity of flow
Not to Scale

Figure 12-7 Predicted floodwater depths and velocities for 1 in 50 year flood event at the Hastings River
Dennis Bridge
Proposed HastingsRiver bridge crossing
Fernbank Creek Bridge
Prop
osed h
ighw
ay alignm
entExisting highw
ay alignmentProposed flood relief
structures provide significantadditional conveyance capacity
Proposed FernbankCreek bridge
OX
LE
Y H
IGH
WA
Y T
O K
EM
PS
EY
| PA
CIF
IC H
IGH
WA
Y U
PG
RA
DE
242
| EN
VIR
ON
ME
NTA
L A
SS
ES
SM
EN
T
Notes: Extent and depth of inundation is approximateonly and should be verified using detailed surveydata at any specific point of interestThe model has incorporated the structuresshown on the existing highway alignment.
oNot to Scale
Depth (m)0 1 2 3 4 5 6 7 8 9 10
Proposed culvertProposed floodrelief structure
Proposed bridgecrossing
Direction andvelocity of flow
Depth (m)0 1 2 3 4 5 6 7 8 9 10
Figure 12-8 Existing floodwater depths and velocities for 1 in 100 year flood event at the Hastings River
Dennis Bridge
Fernbank Creek Bridge
Existing highway alignm
ent
CH
AP
TE
R 1
2 | H
YD
RO
LO
GY
NS
W R
OA
DS
AN
D T
RA
FF
IC A
UT
HO
RIT
Y | 2
43
Notes: Extent and depth of inundation is approximateonly and should be verified using detailed surveydata at any specific point of interestThe model has incorporated the structuresshown on the existing highway alignment.
oProposed culvert
Proposed floodrelief structure
Proposed bridgecrossing
Direction andvelocity of flow
Not to Scale
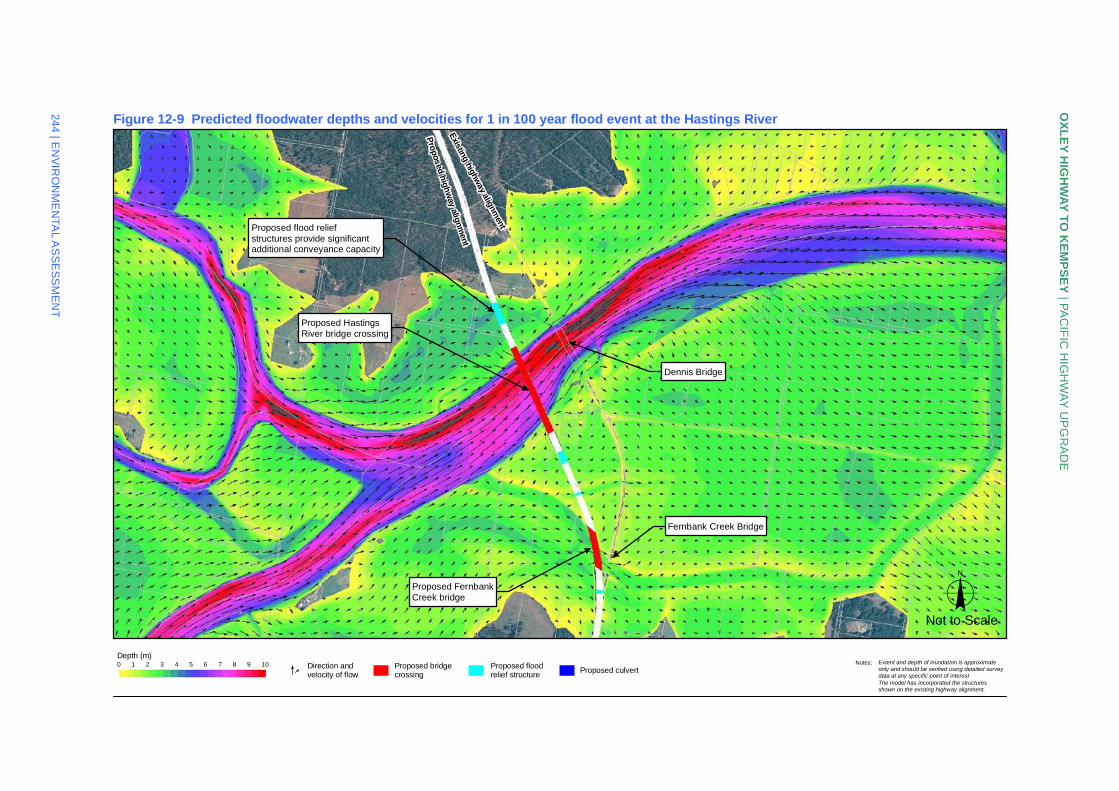
Figure 12-9 Predicted floodwater depths and velocities for 1 in 100 year flood event at the Hastings River
Dennis Bridge
Proposed HastingsRiver bridge crossing
Fernbank Creek Bridge
Proposed high
way alignm
ent
Existing highway alignm
entProposed flood reliefstructures provide significantadditional conveyance capacity
Proposed FernbankCreek bridge
OX
LE
Y H
IGH
WA
Y T
O K
EM
PS
EY
| PA
CIF
IC H
IGH
WA
Y U
PG
RA
DE
244
| EN
VIR
ON
ME
NTA
L A
SS
ES
SM
EN
T
Notes: Extent and depth of inundation is approximateonly and should be verified using detailed surveydata at any specific point of interestThe model has incorporated the structuresshown on the existing highway alignment.
oNot to Scale
Depth (m)0 1 2 3 4 5 6 7 8 9 10
Proposed culvertProposed floodrelief structure
Proposed bridgecrossing
Direction andvelocity of flow
Notes: Extent and depth of inundation is approximateonly and should be verified using detailed surveydata at any specific point of interestThe model has incorporated the structuresshown on the existing highway alignment.
Dennis bridge
Proposed highw
ay alignment
Existing highway alignm
ent
Fernbank Creek bridge
Proposed HastingsRiver bridge
Maximum increase inpeak level = 0.06m
Maximum increase inpeak level = 0.06m
Maximum decrease inpeak level = 0.2m
Glen Ewan Road
Hastings River Drive
Wh
arf
Ro
ad
Blackmans Point Road
Fern
bank
Creek
Road
Figure 12-10 Predicted change in floodwater depth on the Hastings River for 1 in 100 year event (embankment with floodway openings)
oNot to Scale
CH
AP
TE
R 1
2 | H
YD
RO
LO
GY
NS
W R
OA
DS
AN
D T
RA
FF
IC A
UT
HO
RIT
Y | 2
45
Water level difference (m)
0
-0.04
-0.08
-0.12
-0.16
-0.2
0.16
0.2
0.12
0.08
0.04
The Proposal
Upgraded Highway
Service Road
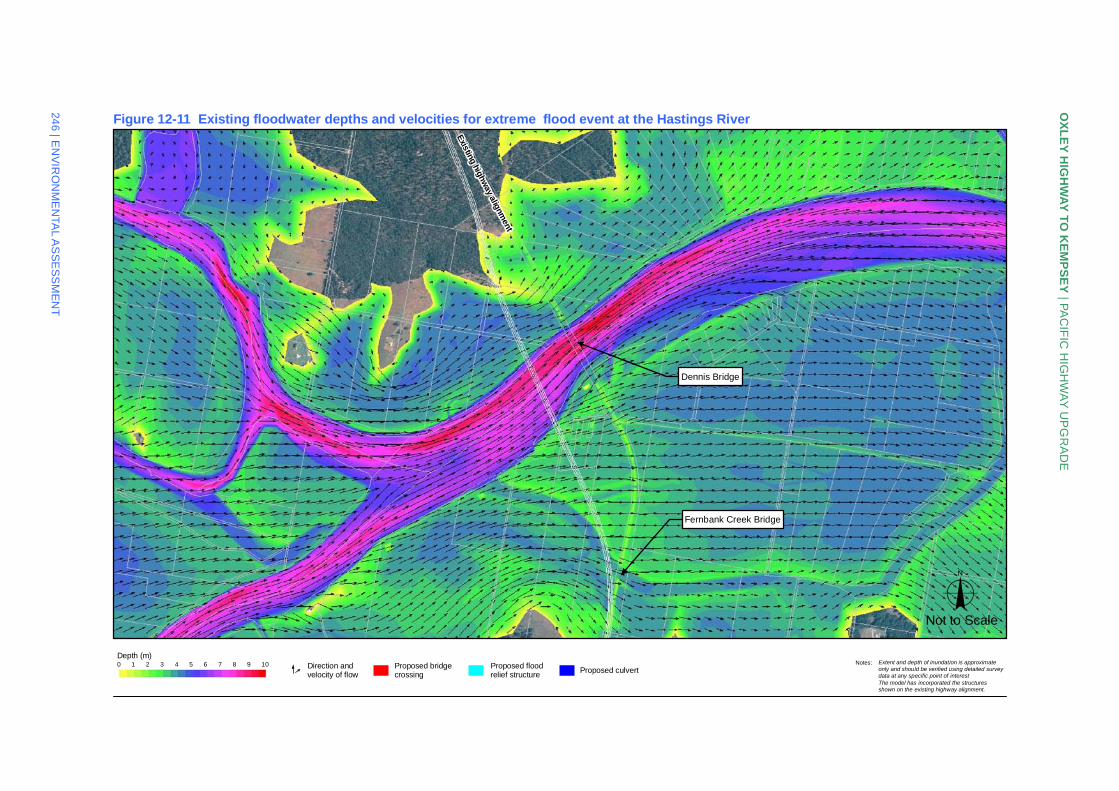
Figure 12-11 Existing floodwater depths and velocities for extreme flood event at the Hastings River
Dennis Bridge
Fernbank Creek Bridge
Existing highway alignm
ent
OX
LE
Y H
IGH
WA
Y T
O K
EM
PS
EY
| PA
CIF
IC H
IGH
WA
Y U
PG
RA
DE
246
| EN
VIR
ON
ME
NTA
L A
SS
ES
SM
EN
T
Notes: Extent and depth of inundation is approximateonly and should be verified using detailed surveydata at any specific point of interestThe model has incorporated the structuresshown on the existing highway alignment.
oNot to Scale
Depth (m)0 1 2 3 4 5 6 7 8 9 10
Proposed culvertProposed floodrelief structure
Proposed bridgecrossing
Direction andvelocity of flow
Depth (m)0 1 2 3 4 5 6 7 8 9 10
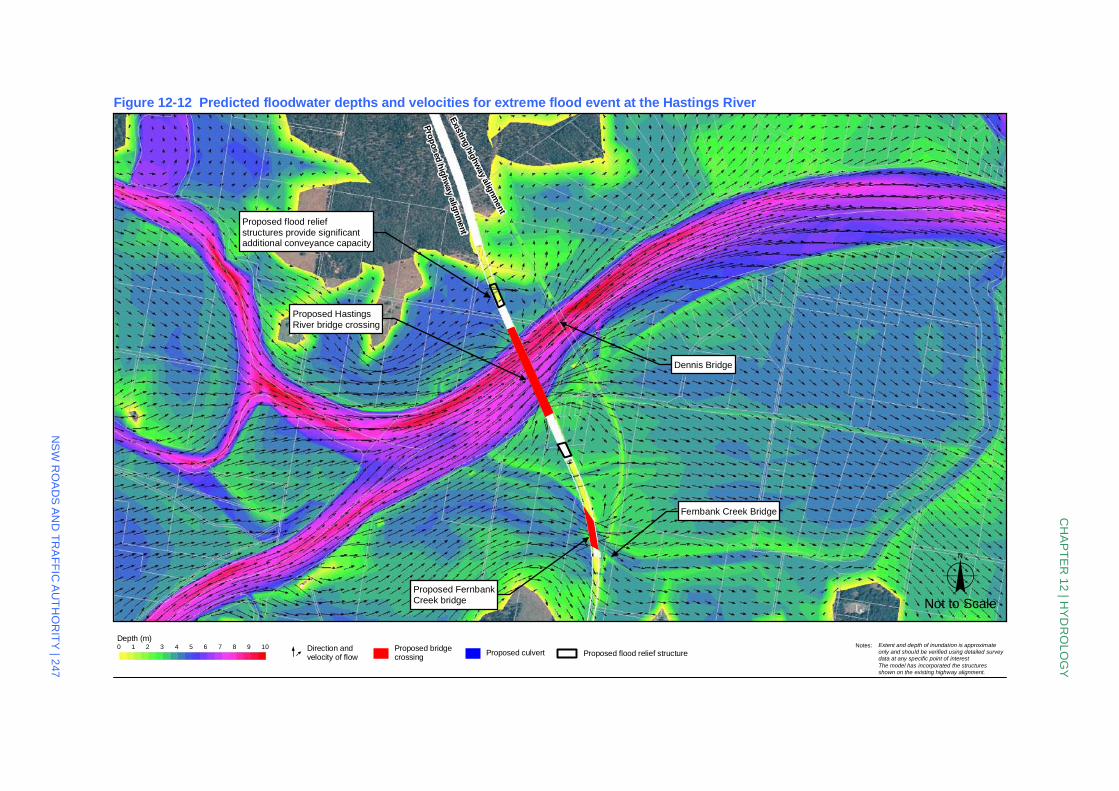
Figure 12-12 Predicted floodwater depths and velocities for extreme flood event at the Hastings River
Dennis Bridge
Proposed HastingsRiver bridge crossing
Fernbank Creek Bridge
Prop
osed h
ighw
ay alignm
entExisting highw
ay alignment
Proposed flood reliefstructures provide significantadditional conveyance capacity
Proposed FernbankCreek bridge
CH
AP
TE
R 1
2 | H
YD
RO
LO
GY
NS
W R
OA
DS
AN
D T
RA
FF
IC A
UT
HO
RIT
Y | 2
47
Notes: Extent and depth of inundation is approximateonly and should be verified using detailed surveydata at any specific point of interestThe model has incorporated the structuresshown on the existing highway alignment.
oProposed culvert
Proposed bridgecrossing
Direction andvelocity of flow
Not to Scale
Proposed flood relief structure
OXLEY HIGHWAY TO KEMPSEY PACIFIC HIGHWAY UPGRADE
As can be seen in Table 12-2 and Figure 12-2 to Figure 12-12, there is a small increase in flood levels anticipated upstream of the Proposal for flood events of various sizes. For more frequent floods such as the 1 in 5 year floods, small increases (up to 2 centimetres) are expected
immediately upstream of the Proposal. This reduces to a change of up to 1 centimetre further upstream near Rawdon Island.
For a rarer flood such as the 1 in 100 year flood, changes to flood levels have been predicted of up
to 2 centimetres immediately upstream of the Proposal on the northern bank of the Hastings River. Further upstream, and without the immediate proximity effects of the road embankment, the change in flood level is predicted to be up to 3 centimetres such as near Rawdon Island.
The impact of the Proposal quickly converges back to the existing situation as increases in flood level are generally contained within 200 metres of the Proposal.
Downstream of the Proposal, flood levels are predicted to reduce by a similar margin of around 3 to
4 centimetres.
Dwellings and structures
No additional dwellings would experience flooding as a result of the Proposal during the 1 in 100
year flood events.
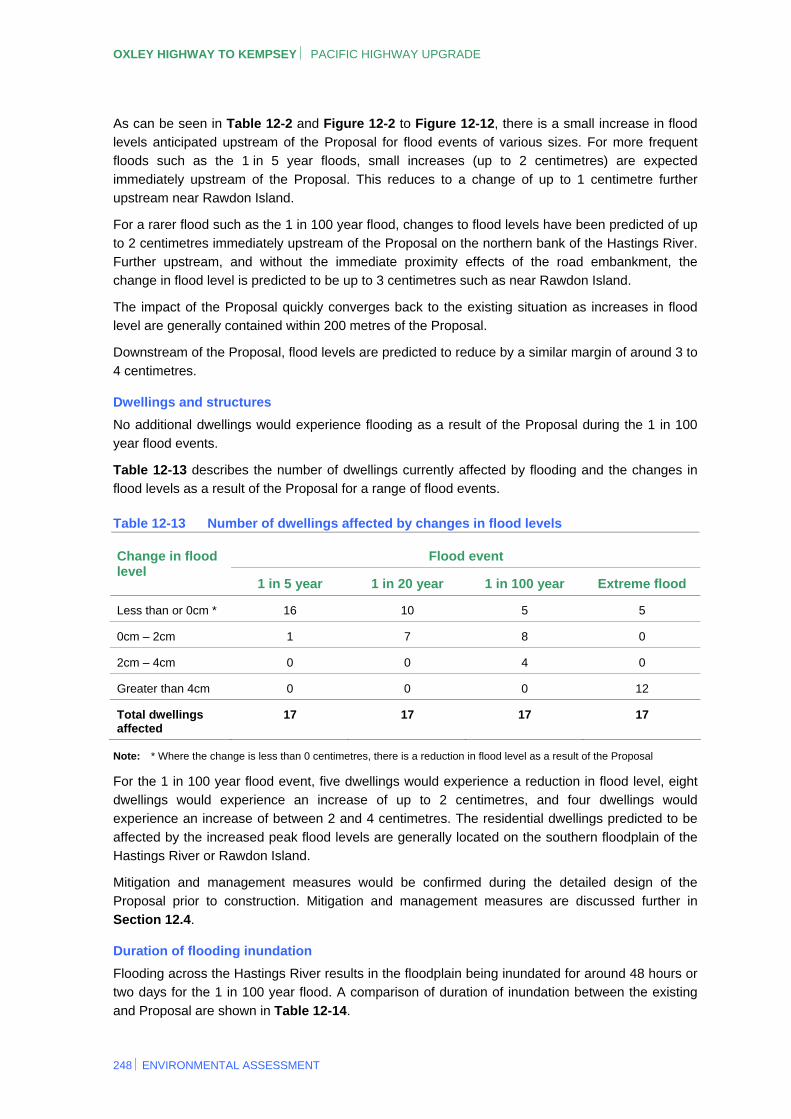
Table 12-13 describes the number of dwellings currently affected by flooding and the changes in flood levels as a result of the Proposal for a range of flood events.
Table 12-13 Number of dwellings affected by changes in flood levels
Flood event Change in flood level
1 in 5 year 1 in 20 year 1 in 100 year Extreme flood
Less than or 0cm * 16 10 5 5
0cm – 2cm 1 7 8 0
2cm – 4cm 0 0 4 0
Greater than 4cm 0 0 0 12
Total dwellings affected
17 17 17 17
Note: * Where the change is less than 0 centimetres, there is a reduction in flood level as a result of the Proposal
For the 1 in 100 year flood event, five dwellings would experience a reduction in flood level, eight dwellings would experience an increase of up to 2 centimetres, and four dwellings would experience an increase of between 2 and 4 centimetres. The residential dwellings predicted to be
affected by the increased peak flood levels are generally located on the southern floodplain of the Hastings River or Rawdon Island.
Mitigation and management measures would be confirmed during the detailed design of the
Proposal prior to construction. Mitigation and management measures are discussed further in Section 12.4.
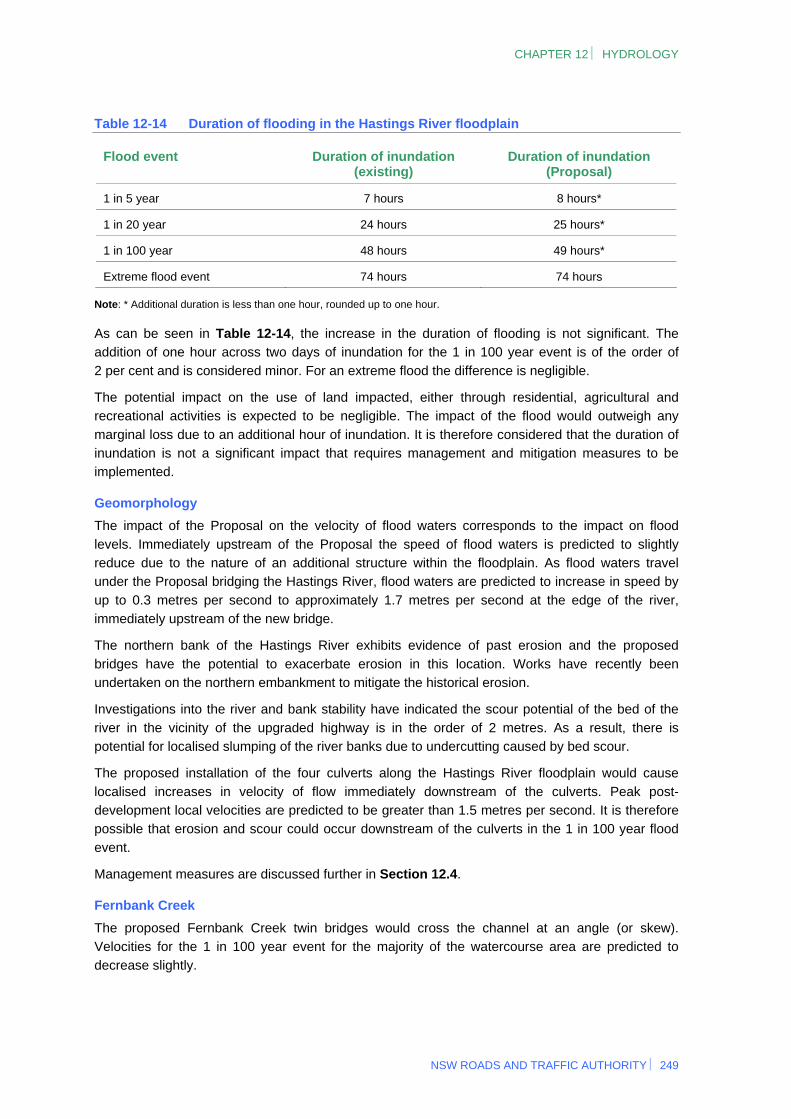
Duration of flooding inundation
Flooding across the Hastings River results in the floodplain being inundated for around 48 hours or two days for the 1 in 100 year flood. A comparison of duration of inundation between the existing
and Proposal are shown in Table 12-14.
248 ENVIRONMENTAL ASSESSMENT
CHAPTER 12 HYDROLOGY
Table 12-14 Duration of flooding in the Hastings River floodplain
Flood event Duration of inundation (existing)
Duration of inundation (Proposal)
1 in 5 year 7 hours 8 hours*
1 in 20 year 24 hours 25 hours*
1 in 100 year 48 hours 49 hours*
Extreme flood event 74 hours 74 hours
Note: * Additional duration is less than one hour, rounded up to one hour.
As can be seen in Table 12-14, the increase in the duration of flooding is not significant. The addition of one hour across two days of inundation for the 1 in 100 year event is of the order of
2 per cent and is considered minor. For an extreme flood the difference is negligible.
The potential impact on the use of land impacted, either through residential, agricultural and recreational activities is expected to be negligible. The impact of the flood would outweigh any
marginal loss due to an additional hour of inundation. It is therefore considered that the duration of inundation is not a significant impact that requires management and mitigation measures to be implemented.
Geomorphology
The impact of the Proposal on the velocity of flood waters corresponds to the impact on flood
levels. Immediately upstream of the Proposal the speed of flood waters is predicted to slightly reduce due to the nature of an additional structure within the floodplain. As flood waters travel under the Proposal bridging the Hastings River, flood waters are predicted to increase in speed by
up to 0.3 metres per second to approximately 1.7 metres per second at the edge of the river, immediately upstream of the new bridge.
The northern bank of the Hastings River exhibits evidence of past erosion and the proposed
bridges have the potential to exacerbate erosion in this location. Works have recently been undertaken on the northern embankment to mitigate the historical erosion.
Investigations into the river and bank stability have indicated the scour potential of the bed of the
river in the vicinity of the upgraded highway is in the order of 2 metres. As a result, there is potential for localised slumping of the river banks due to undercutting caused by bed scour.
The proposed installation of the four culverts along the Hastings River floodplain would cause
localised increases in velocity of flow immediately downstream of the culverts. Peak post-development local velocities are predicted to be greater than 1.5 metres per second. It is therefore possible that erosion and scour could occur downstream of the culverts in the 1 in 100 year flood
event.
Management measures are discussed further in Section 12.4.
Fernbank Creek
The proposed Fernbank Creek twin bridges would cross the channel at an angle (or skew). Velocities for the 1 in 100 year event for the majority of the watercourse area are predicted to
decrease slightly.
NSW ROADS AND TRAFFIC AUTHORITY 249
OXLEY HIGHWAY TO KEMPSEY PACIFIC HIGHWAY UPGRADE
Immediately adjacent to Fernbank Creek there is a predicted increase in velocity of 1.4 metres per second. Overall flows would be dissipated over a greater area and the risk of erosion would be reduced generally. The risk of significant channel erosion is low, however flow velocities around
bridge abutments could increase the potential for scour and erosion of the steep northern bank.
Construction of the proposed bridges would require the removal of vegetation from the stream. This would reduce both flow roughness and the protection that vegetation provides to the channel soils.
Hence, there would be a risk of increased erosion prior to rehabilitation.
Impacts of climate change on flood levels on the Hastings River
Modelling of the impact of climate change on the existing Pacific Highway crossing of the Hastings
River floodplain predicts there would be an increase in flood levels throughout the floodplain. Modelling of the climate change scenarios outlined in Section 12.3 indicated that climate change has the potential to increase the existing peak flood levels during smaller events, such as Scenario
A (1 in 5 year event), by a greater amount than during larger events, such as Scenario D (1 in 100 year event).
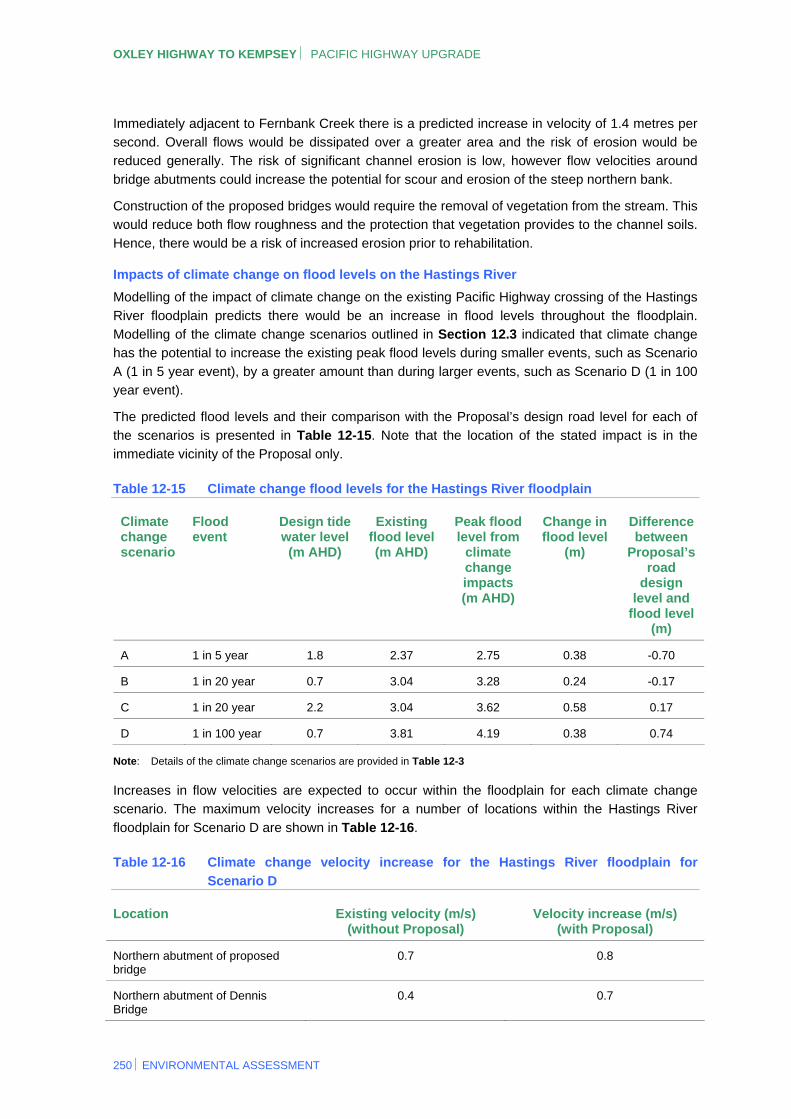
The predicted flood levels and their comparison with the Proposal’s design road level for each of
the scenarios is presented in Table 12-15. Note that the location of the stated impact is in the immediate vicinity of the Proposal only.
Table 12-15 Climate change flood levels for the Hastings River floodplain
Climate change scenario
Flood event
Design tide water level(m AHD)
Existing flood level(m AHD)
Peak flood level from
climate change impacts (m AHD)
Change in flood level
(m)
Difference between
Proposal’s road
design level and
flood level (m)
A 1 in 5 year 1.8 2.37 2.75 0.38 -0.70
B 1 in 20 year 0.7 3.04 3.28 0.24 -0.17
C 1 in 20 year 2.2 3.04 3.62 0.58 0.17
D 1 in 100 year 0.7 3.81 4.19 0.38 0.74
Note: Details of the climate change scenarios are provided in Table 12-3
Increases in flow velocities are expected to occur within the floodplain for each climate change scenario. The maximum velocity increases for a number of locations within the Hastings River
floodplain for Scenario D are shown in Table 12-16.
Table 12-16 Climate change velocity increase for the Hastings River floodplain for
Scenario D
Location Existing velocity (m/s) (without Proposal)
Velocity increase (m/s) (with Proposal)
Northern abutment of proposed bridge
0.7 0.8
Northern abutment of Dennis Bridge
0.4 0.7
250 ENVIRONMENTAL ASSESSMENT
CHAPTER 12 HYDROLOGY
Location Existing velocity (m/s) (without Proposal)
Velocity increase (m/s) (with Proposal)
Fernbank Creek 0.6 0.7
Proposed floodplain culvert south of Fernbank Creek
0.4 1.7
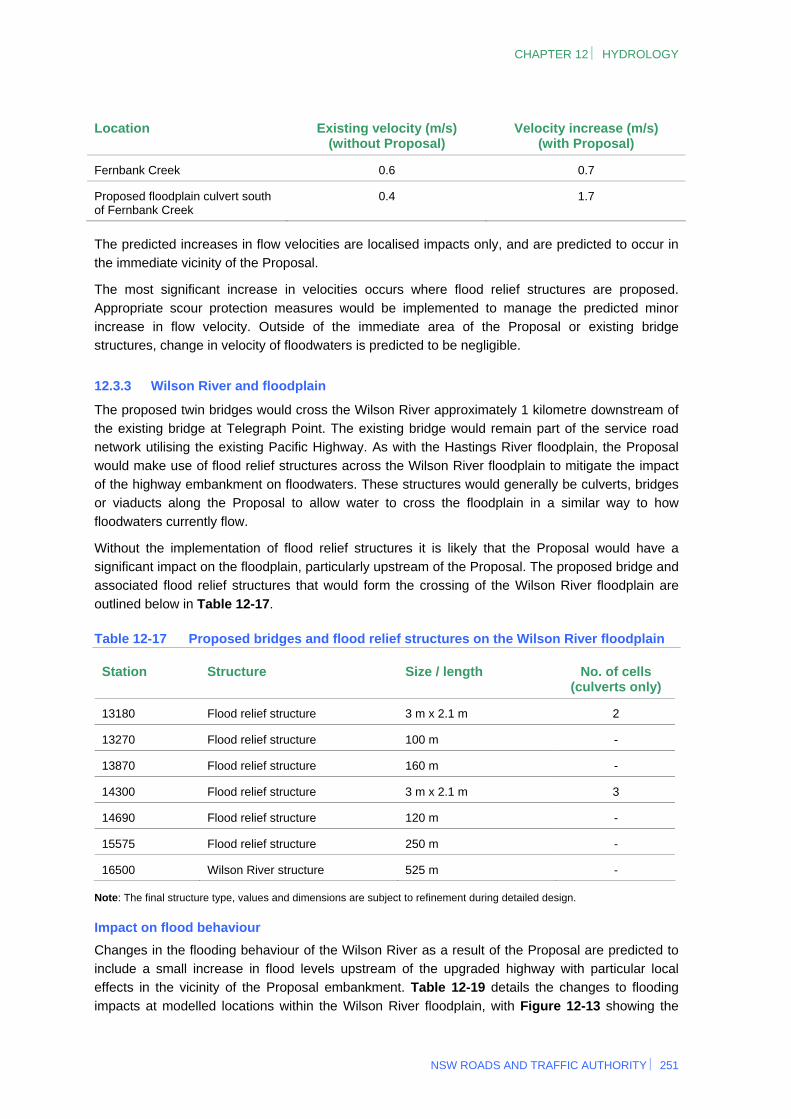
The predicted increases in flow velocities are localised impacts only, and are predicted to occur in the immediate vicinity of the Proposal.
The most significant increase in velocities occurs where flood relief structures are proposed.
Appropriate scour protection measures would be implemented to manage the predicted minor increase in flow velocity. Outside of the immediate area of the Proposal or existing bridge structures, change in velocity of floodwaters is predicted to be negligible.
12.3.3 Wilson River and floodplain
The proposed twin bridges would cross the Wilson River approximately 1 kilometre downstream of the existing bridge at Telegraph Point. The existing bridge would remain part of the service road network utilising the existing Pacific Highway. As with the Hastings River floodplain, the Proposal
would make use of flood relief structures across the Wilson River floodplain to mitigate the impact of the highway embankment on floodwaters. These structures would generally be culverts, bridges or viaducts along the Proposal to allow water to cross the floodplain in a similar way to how
floodwaters currently flow.
Without the implementation of flood relief structures it is likely that the Proposal would have a significant impact on the floodplain, particularly upstream of the Proposal. The proposed bridge and
associated flood relief structures that would form the crossing of the Wilson River floodplain are outlined below in Table 12-17.
Table 12-17 Proposed bridges and flood relief structures on the Wilson River floodplain
Station Structure Size / length No. of cells (culverts only)
13180 Flood relief structure 3 m x 2.1 m 2
13270 Flood relief structure 100 m -
13870 Flood relief structure 160 m -
14300 Flood relief structure 3 m x 2.1 m 3
14690 Flood relief structure 120 m -
15575 Flood relief structure 250 m -
16500 Wilson River structure 525 m -
Note: The final structure type, values and dimensions are subject to refinement during detailed design.
Impact on flood behaviour
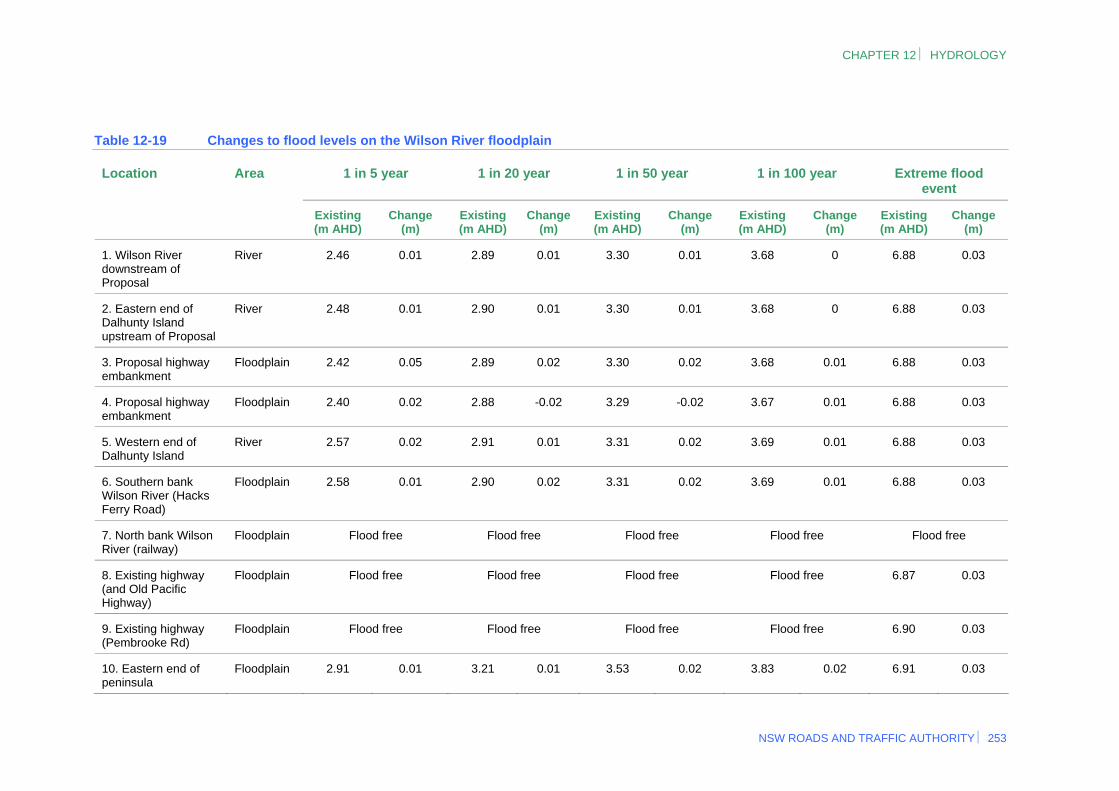
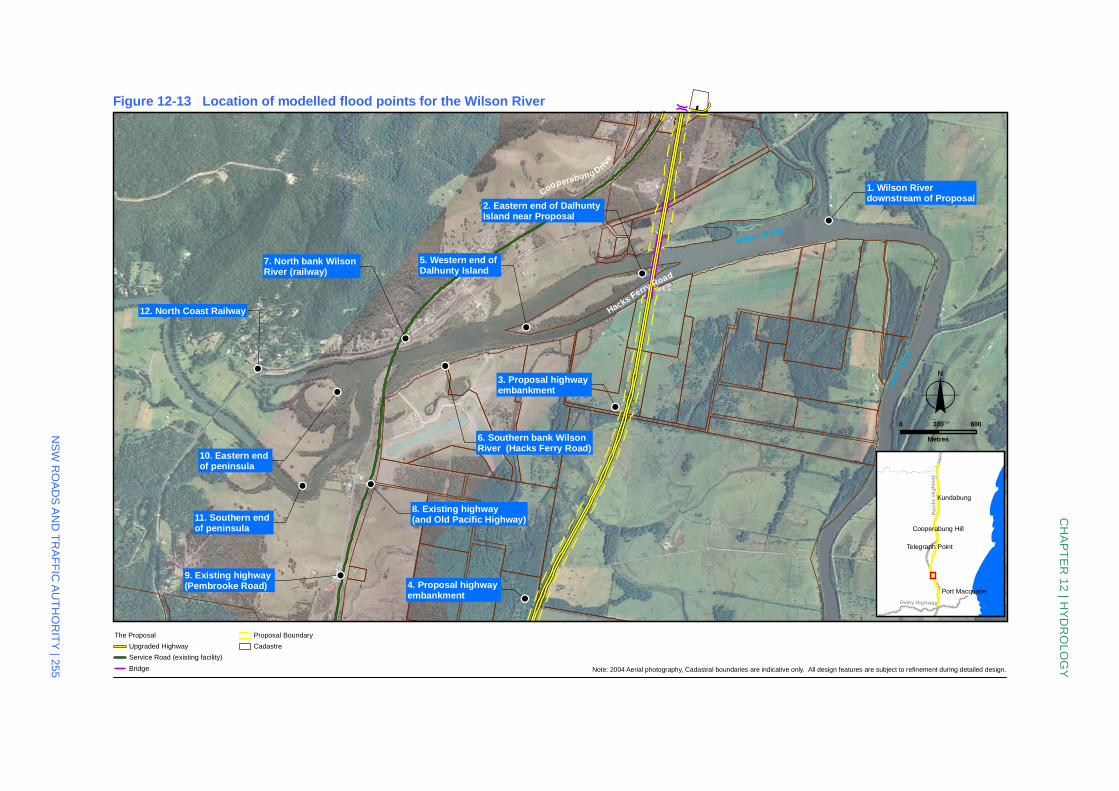
Changes in the flooding behaviour of the Wilson River as a result of the Proposal are predicted to include a small increase in flood levels upstream of the upgraded highway with particular local effects in the vicinity of the Proposal embankment. Table 12-19 details the changes to flooding
impacts at modelled locations within the Wilson River floodplain, with Figure 12-13 showing the
NSW ROADS AND TRAFFIC AUTHORITY 251
OXLEY HIGHWAY TO KEMPSEY PACIFIC HIGHWAY UPGRADE
252 ENVIRONMENTAL ASSESSMENT
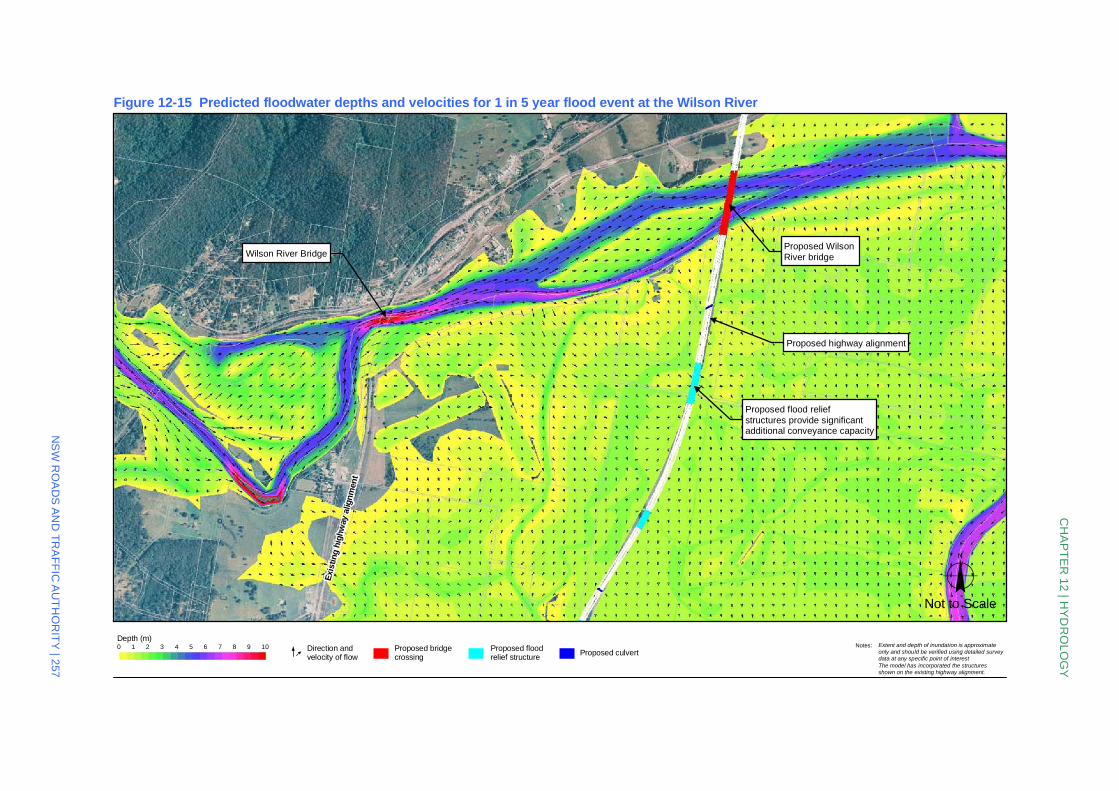
locations modelled. Predicted floodwater depths and velocities for the Wilson River following construction of the Proposal for the 1 in 5, 1 in 20, 1 in 50, 1 in 100 and extreme flood events are shown in Figure 12-15, Figure 12-17, Figure 12-19, Figure 12-21 and Figure 12-24 respectively.
Figure 12-22 shows the predicted change in floodwater depth as a result of the Proposal, compared to existing conditions, for the 1 in 100 year flood event.
It is noted that the change in flood levels for the Wilson River floodplain is less than that of the
Hastings River floodplain. This is primarily due to the different planning level of the Proposal at the two locations. Across the Wilson River floodplain the Proposal would be constructed to provide flood immunity for the roadway for the 1 in 20 year flood level. Across the Hastings River floodplain
the Proposal would be constructed to provide flood immunity for the roadway for the 1 in 100 year flood level. This approach has been adopted because the existing Pacific Highway at Telegraph Point is well above the 1 in 100 year flood level and therefore provides a safe crossing point for this
storm event. A higher road embankment for the Proposal is therefore not required for the Wilson River floodplain.
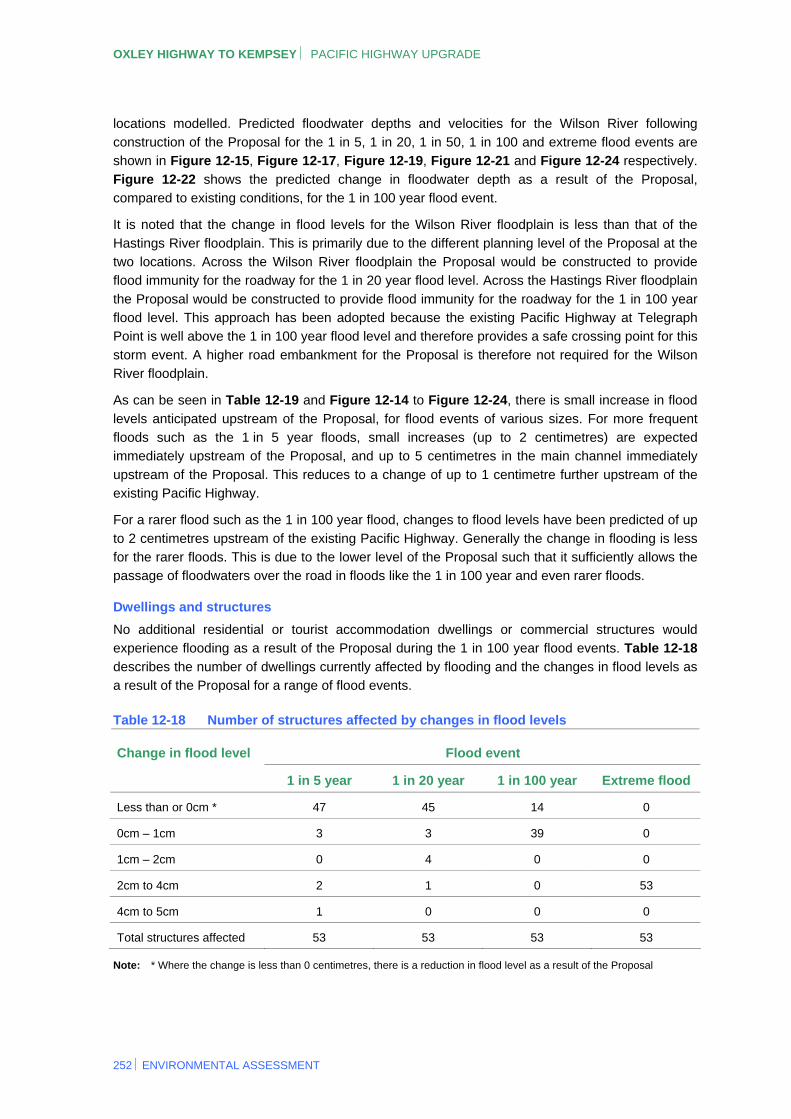
As can be seen in Table 12-19 and Figure 12-14 to Figure 12-24, there is small increase in flood
levels anticipated upstream of the Proposal, for flood events of various sizes. For more frequent floods such as the 1 in 5 year floods, small increases (up to 2 centimetres) are expected immediately upstream of the Proposal, and up to 5 centimetres in the main channel immediately
upstream of the Proposal. This reduces to a change of up to 1 centimetre further upstream of the existing Pacific Highway.
For a rarer flood such as the 1 in 100 year flood, changes to flood levels have been predicted of up
to 2 centimetres upstream of the existing Pacific Highway. Generally the change in flooding is less for the rarer floods. This is due to the lower level of the Proposal such that it sufficiently allows the passage of floodwaters over the road in floods like the 1 in 100 year and even rarer floods.
Dwellings and structures
No additional residential or tourist accommodation dwellings or commercial structures would experience flooding as a result of the Proposal during the 1 in 100 year flood events. Table 12-18
describes the number of dwellings currently affected by flooding and the changes in flood levels as a result of the Proposal for a range of flood events.
Table 12-18 Number of structures affected by changes in flood levels
Flood event Change in flood level
1 in 5 year 1 in 20 year 1 in 100 year Extreme flood
Less than or 0cm * 47 45 14 0
0cm – 1cm 3 3 39 0
1cm – 2cm 0 4 0 0
2cm to 4cm 2 1 0 53
4cm to 5cm 1 0 0 0
Total structures affected 53 53 53 53
Note: * Where the change is less than 0 centimetres, there is a reduction in flood level as a result of the Proposal
CHAPTER 12 HYDROLOGY
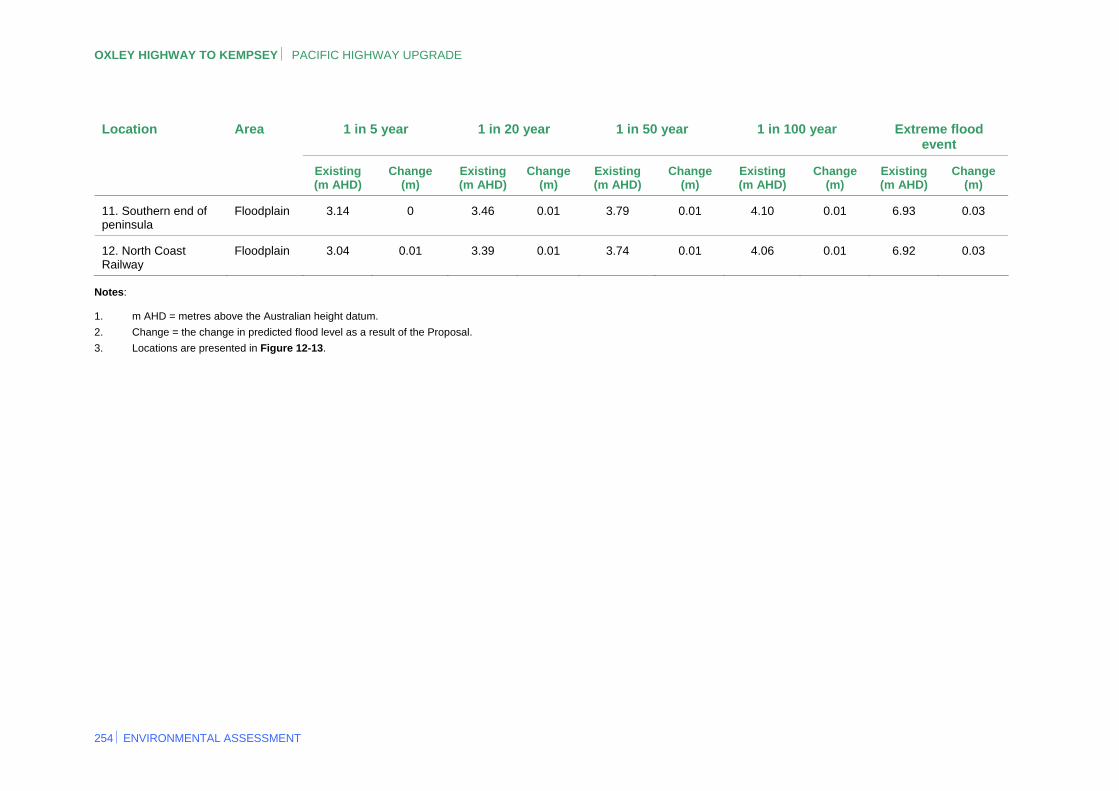
Table 12-19 Changes to flood levels on the Wilson River floodplain
1 in 5 year 1 in 20 year 1 in 50 year 1 in 100 year Extreme flood event
Location Area
Existing (m AHD)
Change (m)
Existing (m AHD)
Change (m)
Existing (m AHD)
Change (m)
Existing (m AHD)
Change (m)
Existing (m AHD)
Change (m)
1. Wilson River downstream of Proposal
River 2.46 0.01 2.89 0.01 3.30 0.01 3.68 0 6.88 0.03
2. Eastern end of Dalhunty Island upstream of Proposal
River 2.48 0.01 2.90 0.01 3.30 0.01 3.68 0 6.88 0.03
3. Proposal highway embankment
Floodplain 2.42 0.05 2.89 0.02 3.30 0.02 3.68 0.01 6.88 0.03
4. Proposal highway embankment
Floodplain 2.40 0.02 2.88 -0.02 3.29 -0.02 3.67 0.01 6.88 0.03
5. Western end of Dalhunty Island
River 2.57 0.02 2.91 0.01 3.31 0.02 3.69 0.01 6.88 0.03
6. Southern bank Wilson River (Hacks Ferry Road)
Floodplain 2.58 0.01 2.90 0.02 3.31 0.02 3.69 0.01 6.88 0.03
7. North bank Wilson River (railway)
Floodplain Flood free Flood free Flood free Flood free Flood free
8. Existing highway (and Old Pacific Highway)
Floodplain Flood free Flood free Flood free Flood free 6.87 0.03
9. Existing highway (Pembrooke Rd)
Floodplain Flood free Flood free Flood free Flood free 6.90 0.03
10. Eastern end of peninsula
Floodplain 2.91 0.01 3.21 0.01 3.53 0.02 3.83 0.02 6.91 0.03
NSW ROADS AND TRAFFIC AUTHORITY 253
OXLEY HIGHWAY TO KEMPSEY PACIFIC HIGHWAY UPGRADE
254 ENVIRONMENTAL ASSESSMENT
1 in 5 year 1 in 20 year 1 in 50 year 1 in 100 year Extreme flood event
Location Area
Existing (m AHD)
Change (m)
Existing (m AHD)
Change (m)
Existing (m AHD)
Change (m)
Existing (m AHD)
Change (m)
Existing (m AHD)
Change (m)
11. Southern end of peninsula
Floodplain 3.14 0 3.46 0.01 3.79 0.01 4.10 0.01 6.93 0.03
12. North Coast Railway
Floodplain 3.04 0.01 3.39 0.01 3.74 0.01 4.06 0.01 6.92 0.03
Notes:
1. m AHD = metres above the Australian height datum.
2. Change = the change in predicted flood level as a result of the Proposal.
3. Locations are presented in Figure 12-13.
!
!
!
!
!
!!
!
!
!
!
!
!
!
!
!
!
!
!
!
!
!
!
!
!
!
!
!
!!
!
!
!
!
!
!
!
!
!
!
!
!
!
!
!
!
!
!
!
!
!
!
!
!
!
!
!
!
!
1. Wilson Riverdownstream of Proposal
!
2. Eastern end of DalhuntyIsland near Proposal
!
3. Proposal highwayembankment
!
4. Proposal highwayembankment
!
5. Western end ofDalhunty Island
!6. Southern bank WilsonRiver (Hacks Ferry Road)
!
7. North bank WilsonRiver (railway)
!
8. Existing highway(and Old Pacific Highway)
!9. Existing highway(Pembrooke Road)
!
11. Southern endof peninsula
!
10. Eastern endof peninsula
!
12. North Coast Railway Hacks Ferry Road
Cooperabung Drive
Wilson River
Mar
ia R
iver
Figure 12-13 Location of modelled flood points for the Wilson River
o
CH
AP
TE
R 1
2 | H
YD
RO
LO
GY
NS
W R
OA
DS
AN
D T
RA
FF
IC A
UT
HO
RIT
Y | 255
0 600300
Metres
Pa
cifi
c H
igh
way
Oxley Highway
Kundabung
Port Macquarie
Telegraph Point
Cooperabung Hill
The Proposal
Upgraded Highway
Service Road (existing facility)
Bridge
!
! Proposal Boundary
Cadastre
Note: 2004 Aerial photography, Cadastral boundaries are indicative only. All design features are subject to refinement during detailed design.
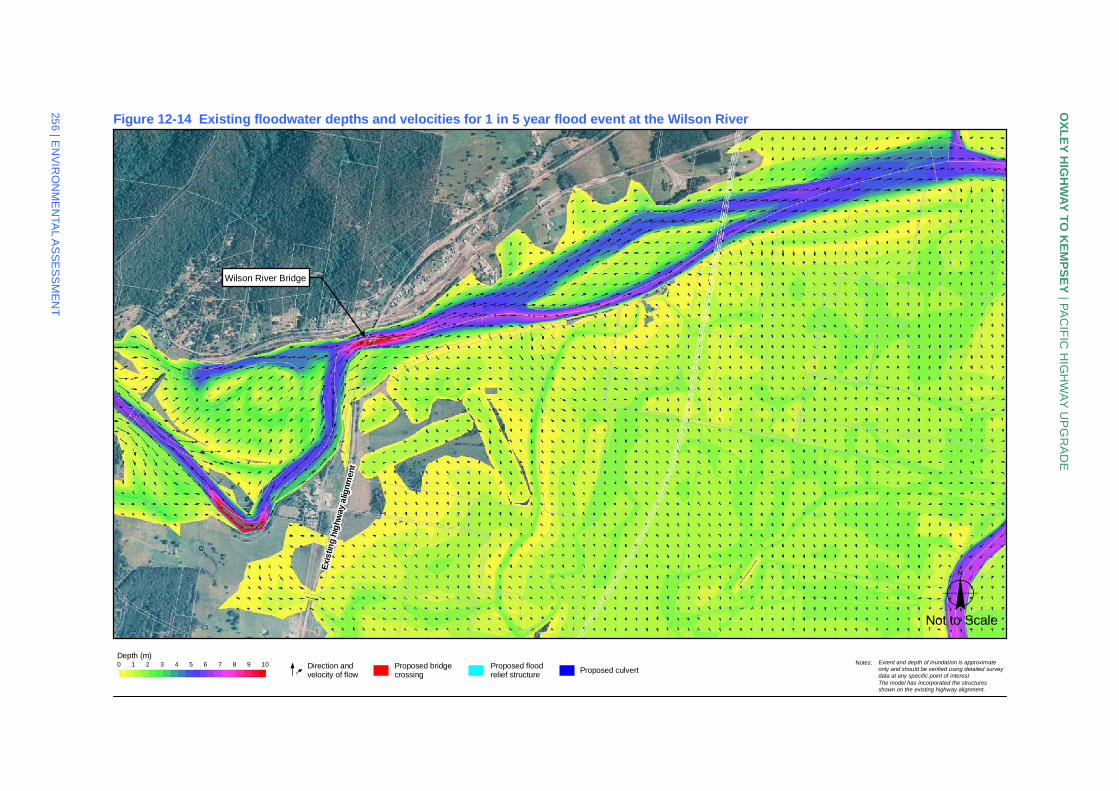
Figure 12-14 Existing floodwater depths and velocities for 1 in 5 year flood event at the Wilson River
Wilson River Bridge
Exi
stin
g hi
ghw
ay a
lignm
ent
OX
LE
Y H
IGH
WA
Y T
O K
EM
PS
EY
| PA
CIF
IC H
IGH
WA
Y U
PG
RA
DE
256
| EN
VIR
ON
ME
NTA
L A
SS
ES
SM
EN
T
Notes: Extent and depth of inundation is approximateonly and should be verified using detailed surveydata at any specific point of interestThe model has incorporated the structuresshown on the existing highway alignment.
oNot to Scale
Depth (m)0 1 2 3 4 5 6 7 8 9 10
Proposed culvertProposed floodrelief structure
Proposed bridgecrossing
Direction andvelocity of flow
Depth (m)0 1 2 3 4 5 6 7 8 9 10
Figure 12-15 Predicted floodwater depths and velocities for 1 in 5 year flood event at the Wilson River
Wilson River Bridge
Exi
stin
g h
igh
way
alig
nm
ent
Proposed WilsonRiver bridge
Proposed flood reliefstructures provide significantadditional conveyance capacity
Proposed highway alignment
CH
AP
TE
R 1
2 | H
YD
RO
LO
GY
NS
W R
OA
DS
AN
D T
RA
FF
IC A
UT
HO
RIT
Y | 2
57
Notes: Extent and depth of inundation is approximateonly and should be verified using detailed surveydata at any specific point of interestThe model has incorporated the structuresshown on the existing highway alignment.
oProposed culvert
Proposed floodrelief structure
Proposed bridgecrossing
Direction andvelocity of flow
Not to Scale
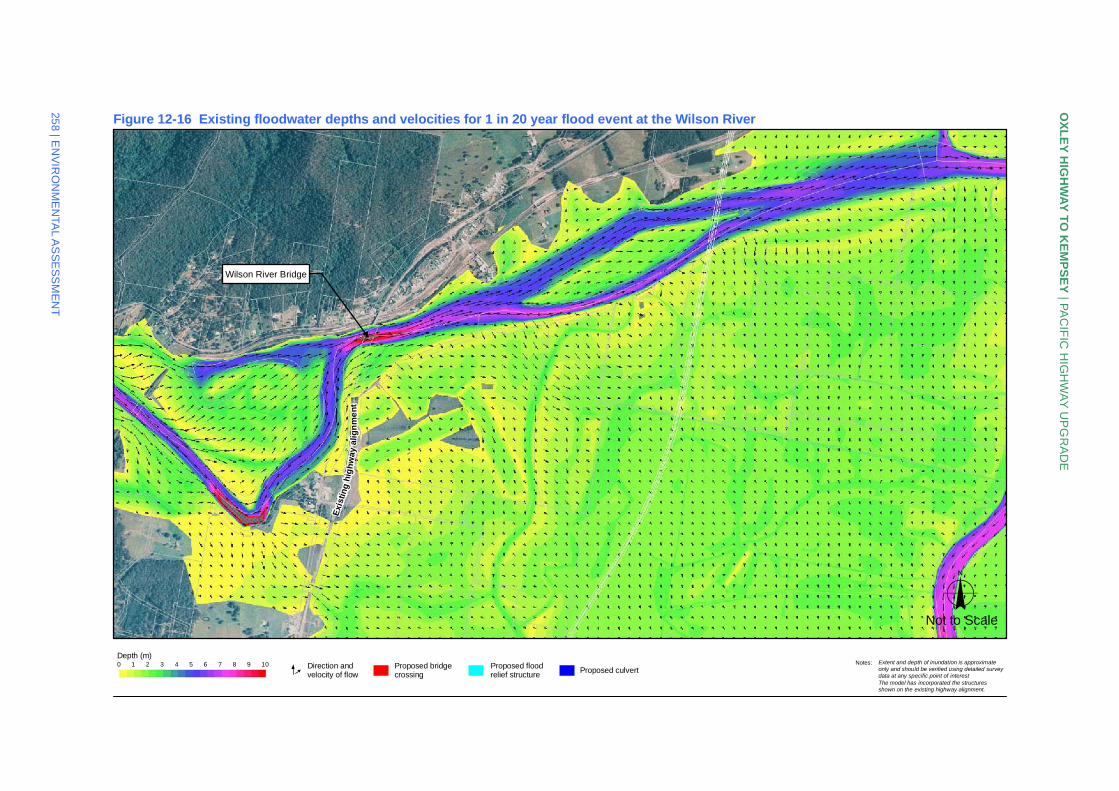
Figure 12-16 Existing floodwater depths and velocities for 1 in 20 year flood event at the Wilson River
Wilson River Bridge
Exi
stin
g h
igh
way
ali
gn
me
nt
OX
LE
Y H
IGH
WA
Y T
O K
EM
PS
EY
| PA
CIF
IC H
IGH
WA
Y U
PG
RA
DE
258
| EN
VIR
ON
ME
NTA
L A
SS
ES
SM
EN
T
Notes: Extent and depth of inundation is approximateonly and should be verified using detailed surveydata at any specific point of interestThe model has incorporated the structuresshown on the existing highway alignment.
oNot to Scale
Depth (m)0 1 2 3 4 5 6 7 8 9 10
Proposed culvertProposed floodrelief structure
Proposed bridgecrossing
Direction andvelocity of flow
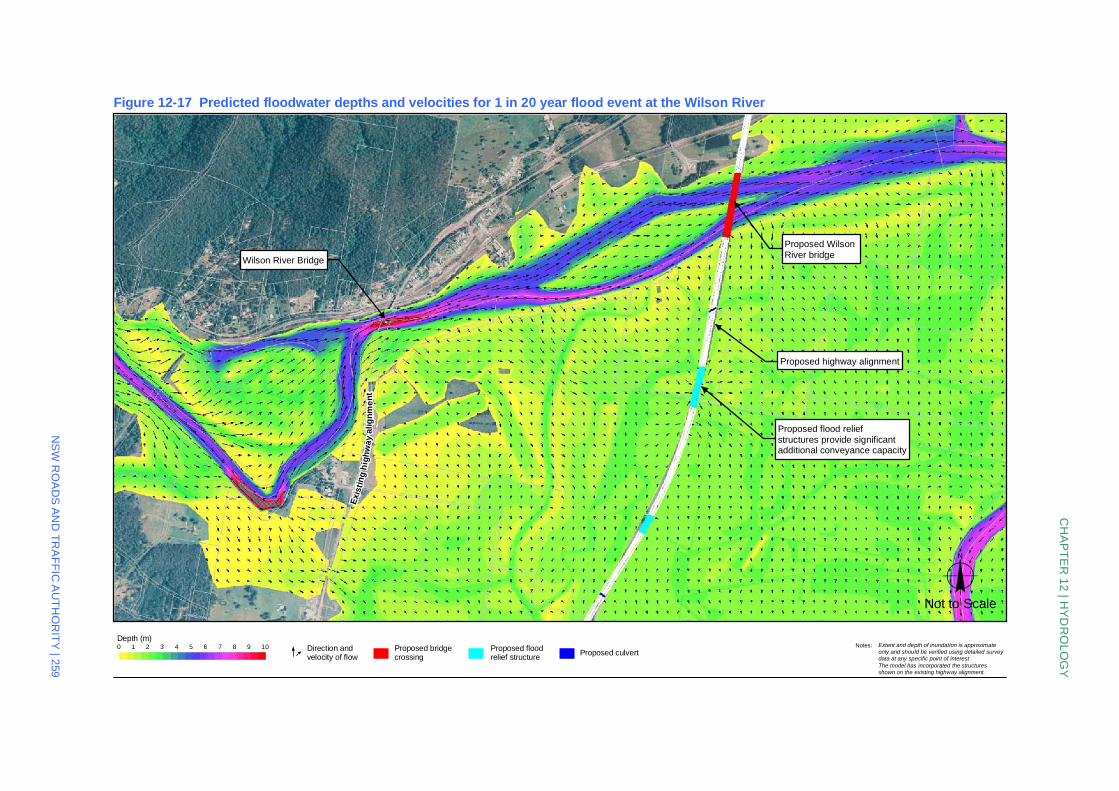
Depth (m)0 1 2 3 4 5 6 7 8 9 10
Figure 12-17 Predicted floodwater depths and velocities for 1 in 20 year flood event at the Wilson River
Wilson River Bridge
Proposed WilsonRiver bridge
Proposed flood reliefstructures provide significantadditional conveyance capacity
Exi
stin
gh
i gh
wa
y al
ign
me
nt
Proposed highway alignment
CH
AP
TE
R 1
2 | H
YD
RO
LO
GY
NS
W R
OA
DS
AN
D T
RA
FF
IC A
UT
HO
RIT
Y | 2
59
Notes: Extent and depth of inundation is approximateonly and should be verified using detailed surveydata at any specific point of interestThe model has incorporated the structuresshown on the existing highway alignment.
oProposed culvert
Proposed floodrelief structure
Proposed bridgecrossing
Direction andvelocity of flow
Not to Scale
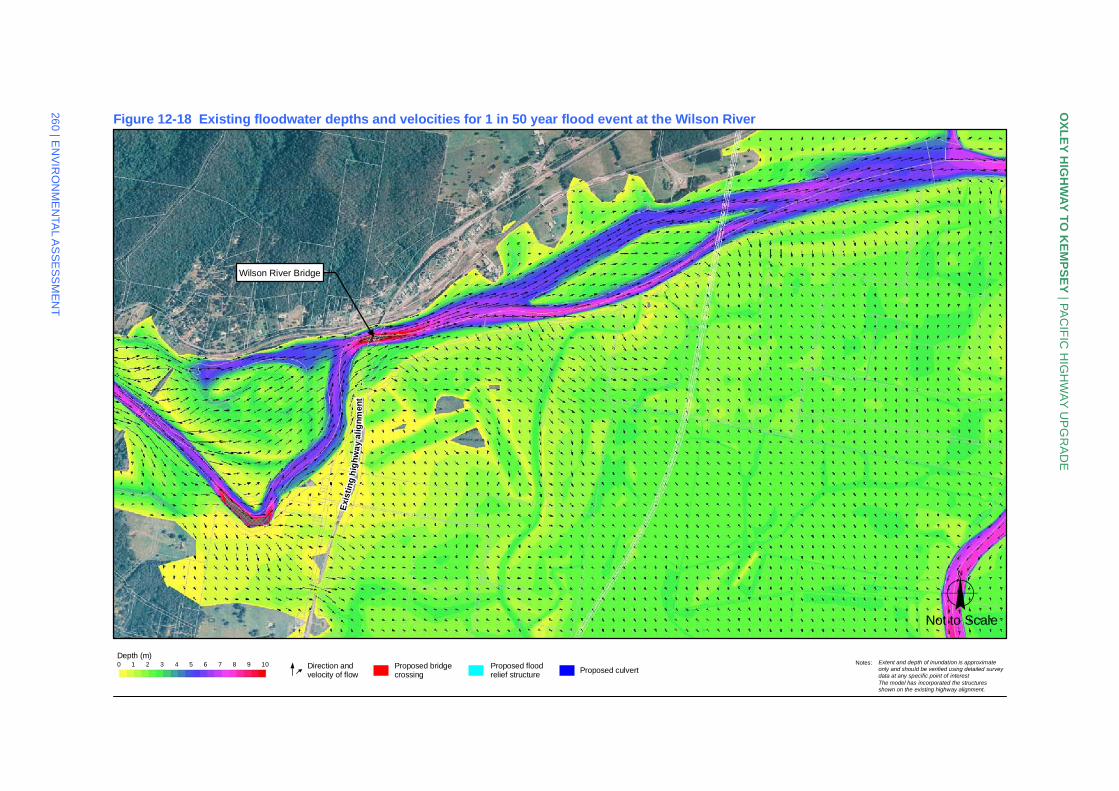
Figure 12-18 Existing floodwater depths and velocities for 1 in 50 year flood event at the Wilson River
Wilson River Bridge
Exi
stin
gh
igh
wa
y al
ign
men
t
OX
LE
Y H
IGH
WA
Y T
O K
EM
PS
EY
| PA
CIF
IC H
IGH
WA
Y U
PG
RA
DE
260
| EN
VIR
ON
ME
NTA
L A
SS
ES
SM
EN
T
Notes: Extent and depth of inundation is approximateonly and should be verified using detailed surveydata at any specific point of interestThe model has incorporated the structuresshown on the existing highway alignment.
oNot to Scale
Depth (m)0 1 2 3 4 5 6 7 8 9 10
Proposed culvertProposed floodrelief structure
Proposed bridgecrossing
Direction andvelocity of flow
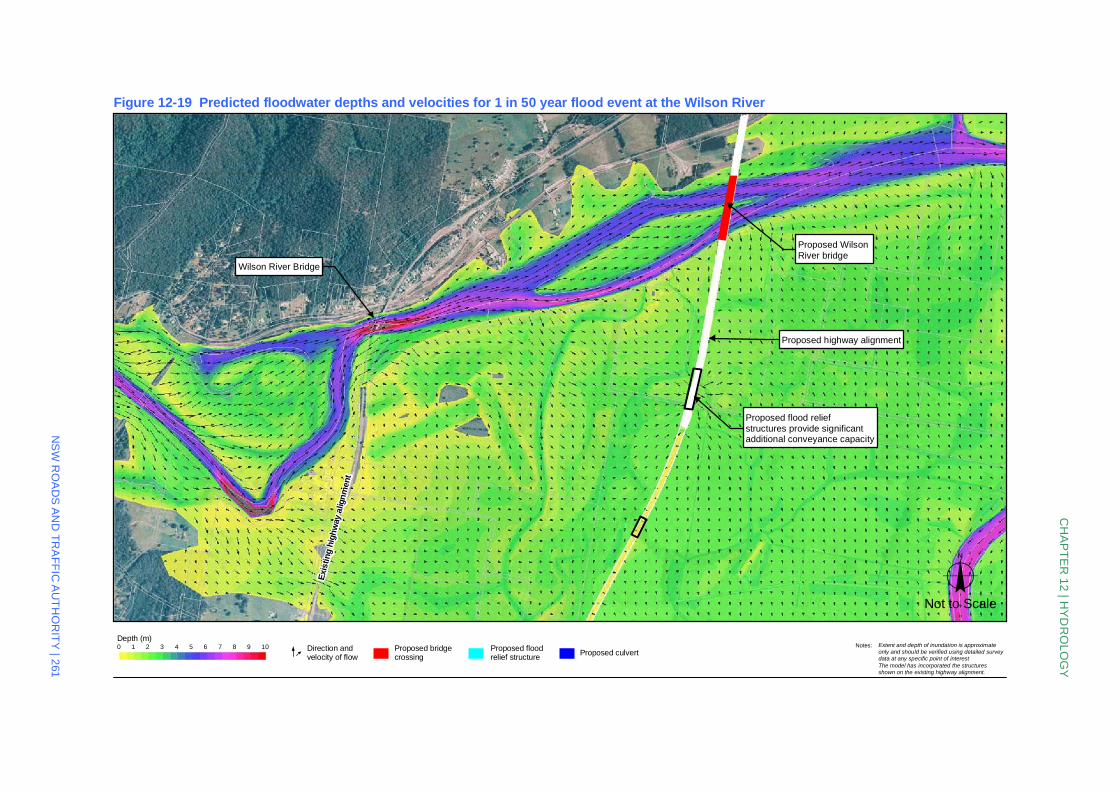
Depth (m)0 1 2 3 4 5 6 7 8 9 10
Figure 12-19 Predicted floodwater depths and velocities for 1 in 50 year flood event at the Wilson River
Wilson River Bridge
Exi
stin
g hi
ghw
ay a
lign
men
t
Proposed flood reliefstructures provide significantadditional conveyance capacity
Proposed highway alignment
Proposed WilsonRiver bridge
CH
AP
TE
R 1
2 | H
YD
RO
LO
GY
NS
W R
OA
DS
AN
D T
RA
FF
IC A
UT
HO
RIT
Y | 2
61
Notes: Extent and depth of inundation is approximateonly and should be verified using detailed surveydata at any specific point of interestThe model has incorporated the structuresshown on the existing highway alignment.
oProposed culvert
Proposed floodrelief structure
Proposed bridgecrossing
Direction andvelocity of flow
Not to Scale
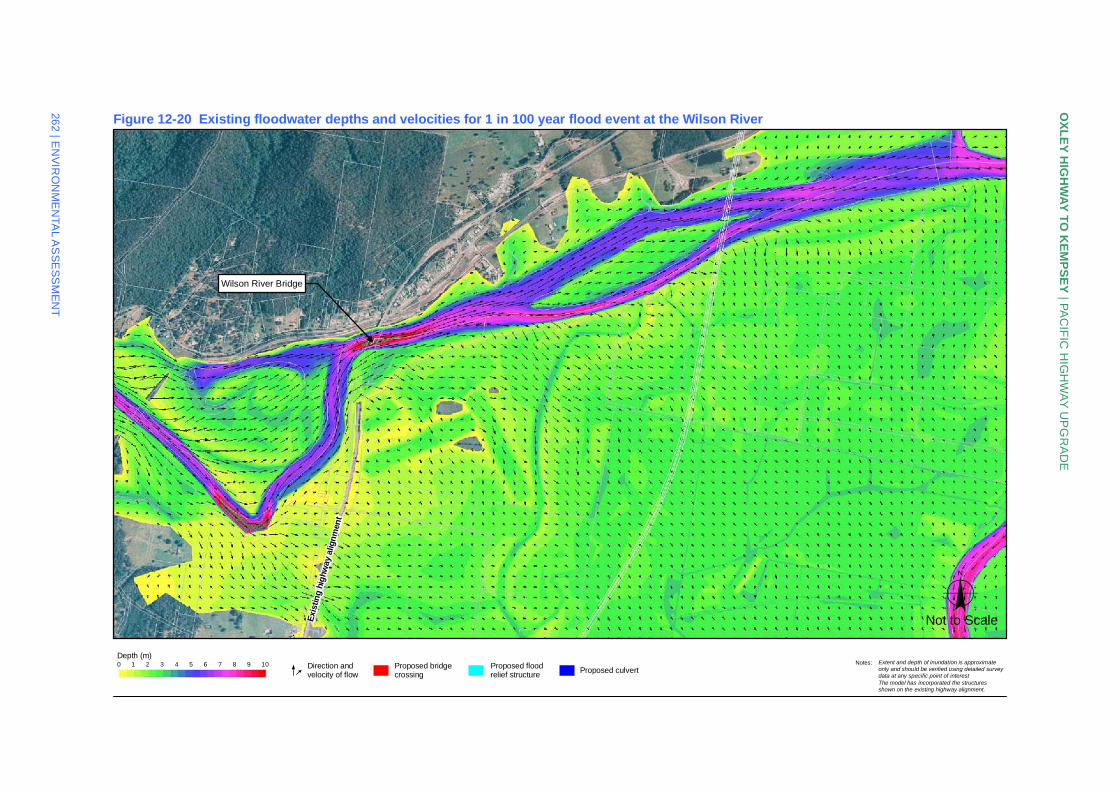
Figure 12-20 Existing floodwater depths and velocities for 1 in 100 year flood event at the Wilson River
Wilson River Bridge
Exi
stin
g h
ighw
ay a
lign
men
t
OX
LE
Y H
IGH
WA
Y T
O K
EM
PS
EY
| PA
CIF
IC H
IGH
WA
Y U
PG
RA
DE
262
| EN
VIR
ON
ME
NTA
L A
SS
ES
SM
EN
T
Notes: Extent and depth of inundation is approximateonly and should be verified using detailed surveydata at any specific point of interestThe model has incorporated the structuresshown on the existing highway alignment.
oNot to Scale
Depth (m)0 1 2 3 4 5 6 7 8 9 10
Proposed culvertProposed floodrelief structure
Proposed bridgecrossing
Direction andvelocity of flow
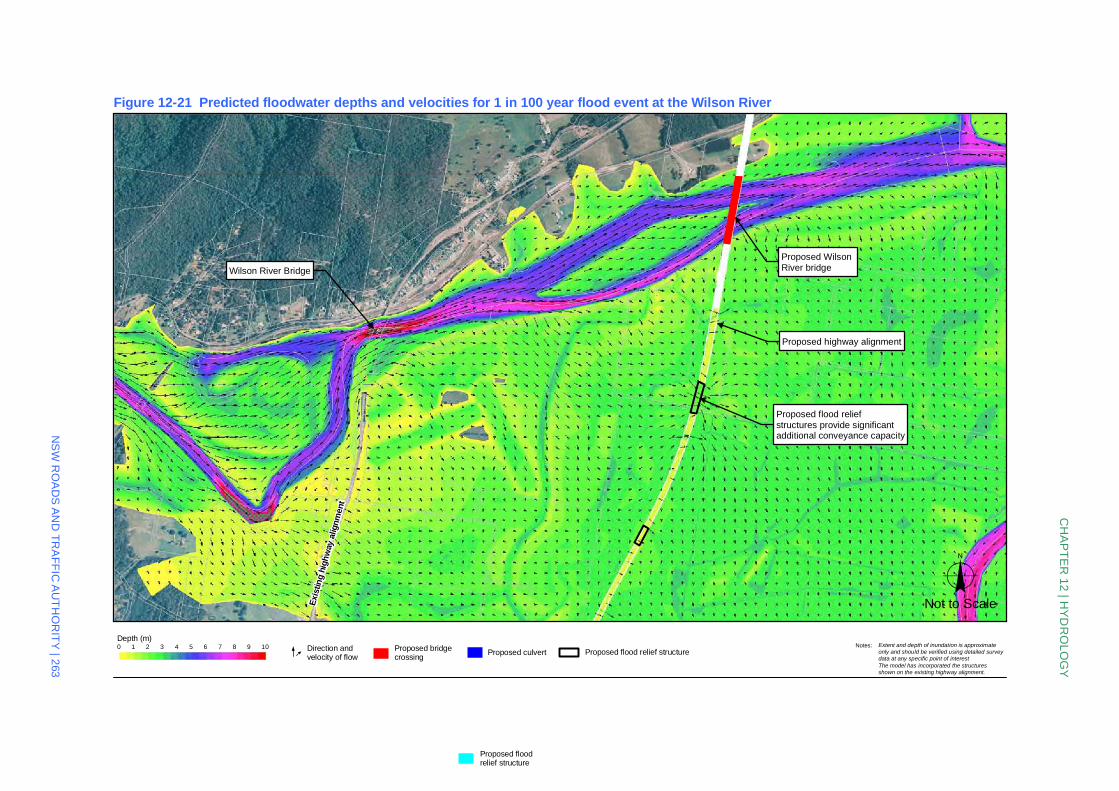
Depth (m)0 1 2 3 4 5 6 7 8 9 10
Figure 12-21 Predicted floodwater depths and velocities for 1 in 100 year flood event at the Wilson River
Wilson River Bridge
Exi
stin
g h
igh
way
alig
nm
ent
Proposed WilsonRiver bridge
Proposed flood reliefstructures provide significantadditional conveyance capacity
Proposed highway alignment
CH
AP
TE
R 1
2 | H
YD
RO
LO
GY
NS
W R
OA
DS
AN
D T
RA
FF
IC A
UT
HO
RIT
Y | 2
63
Notes: Extent and depth of inundation is approximateonly and should be verified using detailed surveydata at any specific point of interestThe model has incorporated the structuresshown on the existing highway alignment.
oProposed culvertProposed bridge
crossingDirection andvelocity of flow
Not to Scale
Proposed floodrelief structure
Proposed flood relief structure
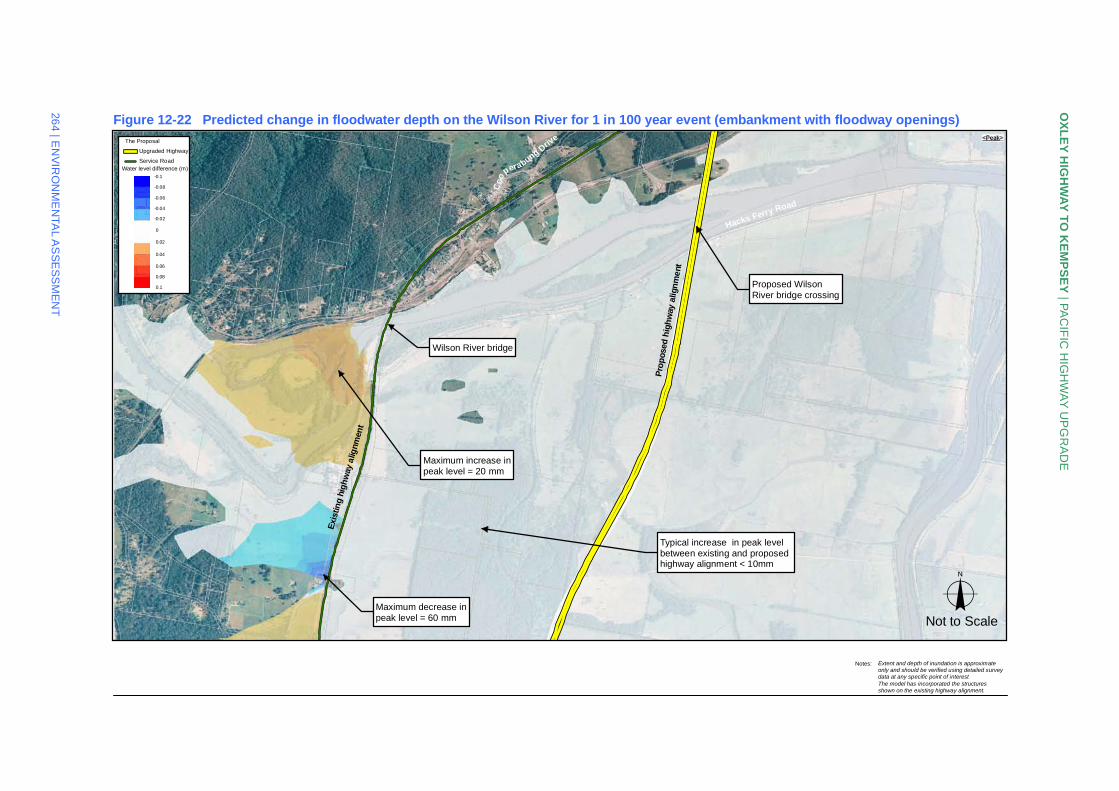
Notes: Extent and depth of inundation is approximateonly and should be verified using detailed surveydata at any specific point of interestThe model has incorporated the structuresshown on the existing highway alignment.
Figure 12-22 Predicted change in floodwater depth on the Wilson River for 1 in 100 year event (embankment with floodway openings)
Wilson River bridge
Maximum increase inpeak level = 20 mm
Maximum decrease inpeak level = 60 mm
Proposed WilsonRiver bridge crossing
Pro
pos
ed h
igh
way
alig
nm
ent
Exi
stin
g h
igh
way
alig
nmen
t
Typical increase in peak levelbetween existing and proposedhighway alignment < 10mm
Hacks Ferry Road
Co
o
perabung Drive
OX
LE
Y H
IGH
WA
Y T
O K
EM
PS
EY
| PA
CIF
IC H
IGH
WA
Y U
PG
RA
DE
264
| EN
VIR
ON
ME
NTA
L A
SS
ES
SM
EN
T
oNot to Scale
Water level difference (m)
0
-0.02
-0.04
-0.06
-0.08
-0.1
0.08
0.1
0.06
0.04
0.02
The Proposal
Upgraded Highway
Service Road
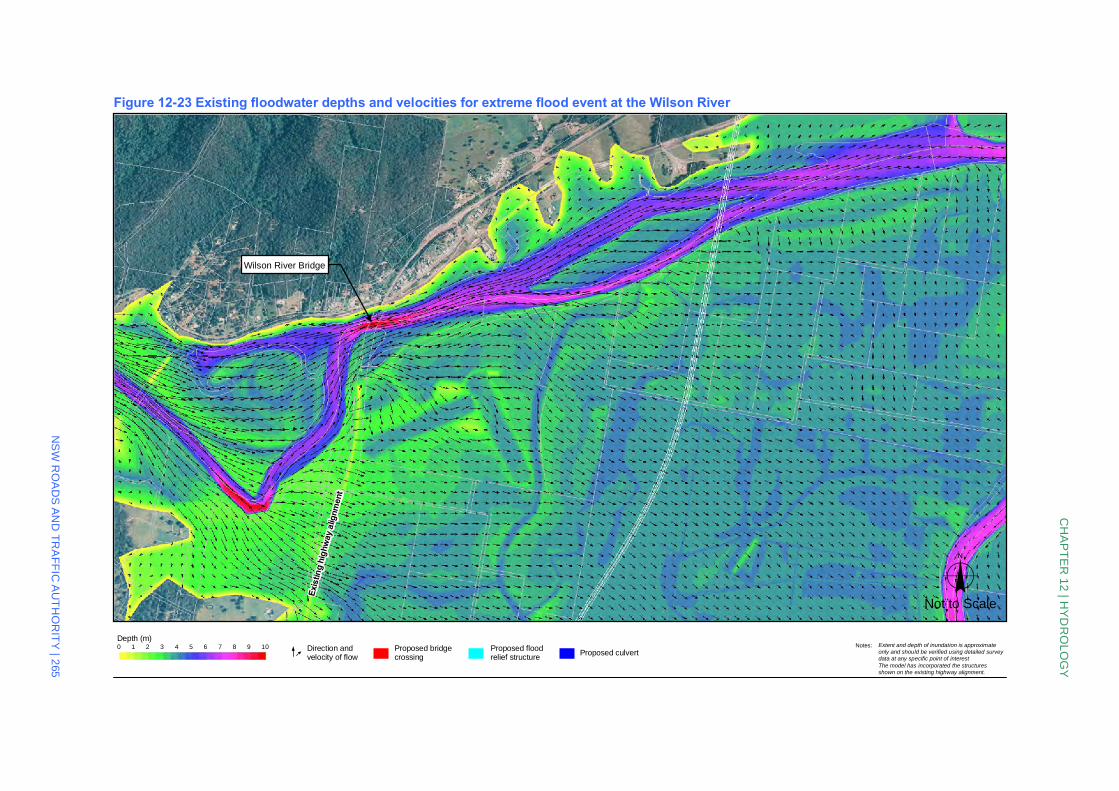
Depth (m)0 1 2 3 4 5 6 7 8 9 10
Figure 12-23 Existing floodwater depths and velocities for extreme flood event at the Wilson River
Wilson River Bridge
Exis
ting
high
way
alig
nmen
t
CH
AP
TE
R 1
2 | H
YD
RO
LO
GY
NS
W R
OA
DS
AN
D T
RA
FF
IC A
UT
HO
RIT
Y | 2
65
Notes: Extent and depth of inundation is approximateonly and should be verified using detailed surveydata at any specific point of interestThe model has incorporated the structuresshown on the existing highway alignment.
oProposed culvert
Proposed floodrelief structure
Proposed bridgecrossing
Direction andvelocity of flow
Not to Scale
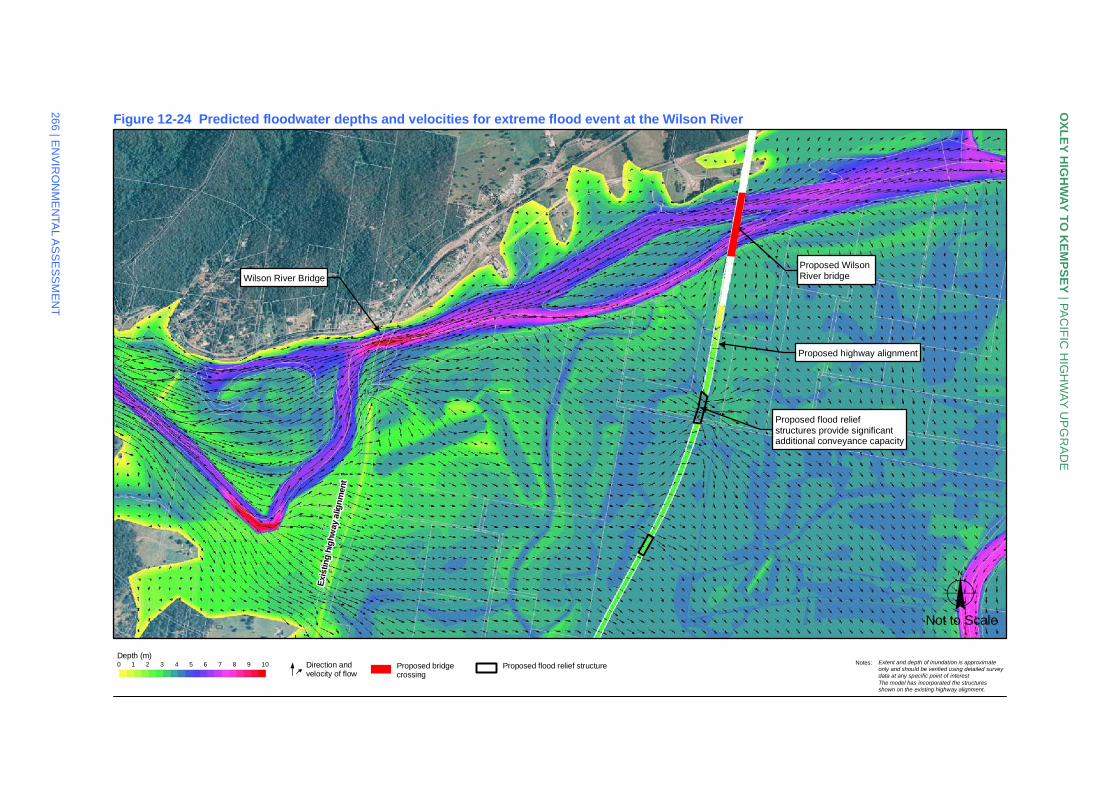
Figure 12-24 Predicted floodwater depths and velocities for extreme flood event at the Wilson River
Wilson River Bridge
Exi
stin
g h
ighw
ay a
lign
men
t
Proposed WilsonRiver bridge
Proposed flood reliefstructures provide significantadditional conveyance capacity
Proposed highway alignment
OX
LE
Y H
IGH
WA
Y T
O K
EM
PS
EY
| PA
CIF
IC H
IGH
WA
Y U
PG
RA
DE
266
| EN
VIR
ON
ME
NTA
L A
SS
ES
SM
EN
T
Notes: Extent and depth of inundation is approximateonly and should be verified using detailed surveydata at any specific point of interestThe model has incorporated the structuresshown on the existing highway alignment.
oNot to Scale
Depth (m)0 1 2 3 4 5 6 7 8 9 10 Direction and
velocity of flowProposed bridgecrossing
Proposed flood relief structure
CHAPTER 12 HYDROLOGY
For the 1 in 100 year flood, 14 structures would have a reduced flood level. Residential, accommodation or commercial structures along the southern bank of the Wilson River, along the existing highway and around the water ski facility are predicted to have increases in flood levels of
up to 1 centimetre.
For the 1 in 5 year flood, there are six structures that are predicted to experience a higher flood level of between 1 and 5 centimetres.
Mitigation and management measures would be confirmed during the detailed design of the Proposal prior to construction. Mitigation and management measures are discussed further in Section 12.4.
Geomorphology
The impact of the Proposal on the velocity of flood waters corresponds to the impact on flood levels. Immediately upstream of the Proposal, particularly at flood relief structures, the speed of
flood waters is predicted to slightly increase by around 0.3 metres per second. Given the low velocities for existing conditions of the order of 0.4 metres per second for the 1 in 100 year flood, the velocities resulting from the Proposal are still low and do not represent a significant risk of
increasing erosion. At the crossing of the Wilson River the speed of floodwaters is expected to increase by less than 0.1 metres per second. At the abutments for the bridge structures there could be local increases in velocity, however potential erosion issues at this location can be managed.
Further details for mitigation and management are discussed in Section 12.4.
The increase in velocities in the channel could result in localised scouring of the river bed. There is also a possibility of future sediment accretion or erosion around Dalhunty Island as a result of the
Proposal. Increases in channel velocity are also predicted downstream of the culvert crossings located along the Wilson River floodplain. These increases in velocity have the potential to cause localised erosion and scour.
The Proposal is more likely to be overtopped across the Wilson River floodplain as it would be constructed at the 1 in 20 year flood level. The hydraulic model predicts there would be a difference in water levels upstream and downstream of the Proposal for both the 1 in 50 year and 1 in 100
year floods. The maximum differential is predicted to be 0.5 metres, which is sufficient to generate a localised velocity across the road embankment of 3 metres per second. It is unlikely this would cause erosion of the road pavement, however it is likely this would cause erosion of the
downstream batter of the road embankment. Erosion protection management measures such as stone pitching would be required for the Proposal across the Wilson River floodplain, subject to detailed design.
Impact of climate change on flood levels on the Wilson River
Modelling of the impact of climate change on the existing Pacific Highway crossing of the Wilson
River floodplain predicted that there would be an increase in flood levels throughout the floodplain.
Modelling of the impact of the Proposal on flood levels under the climate change scenarios outlined in Section 12.1.3 showed that it is likely that the Proposal would result in a further increase in flood
levels compared to the existing highway under the same scenarios.
The predicted flood levels and their comparison with the Proposal’s design road level for each of the scenarios is presented in Table 12-20. Note that the location of the stated impact is in the
immediate vicinity of the Proposal only.
NSW ROADS AND TRAFFIC AUTHORITY 267
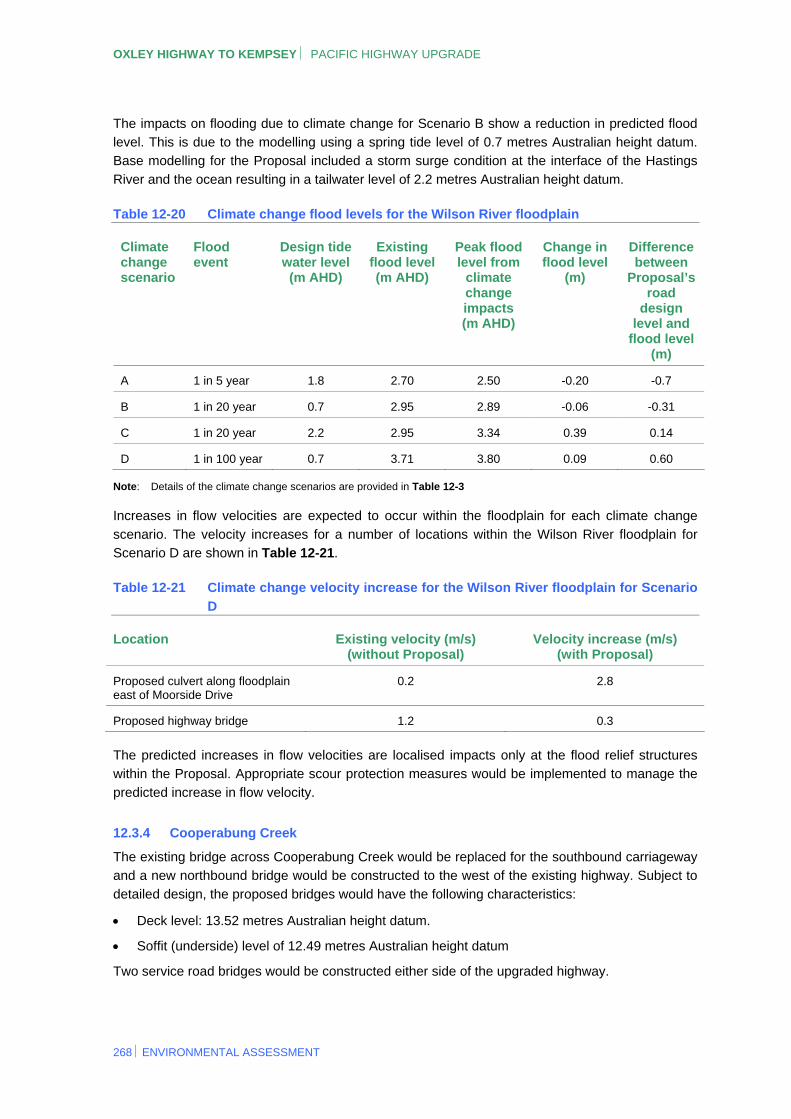
OXLEY HIGHWAY TO KEMPSEY PACIFIC HIGHWAY UPGRADE
The impacts on flooding due to climate change for Scenario B show a reduction in predicted flood level. This is due to the modelling using a spring tide level of 0.7 metres Australian height datum. Base modelling for the Proposal included a storm surge condition at the interface of the Hastings
River and the ocean resulting in a tailwater level of 2.2 metres Australian height datum.
Table 12-20 Climate change flood levels for the Wilson River floodplain
Climate change scenario
Flood event
Design tide water level (m AHD)
Existing flood level(m AHD)
Peak flood level from
climate change impacts (m AHD)
Change in flood level
(m)
Difference between
Proposal’s road
design level and
flood level (m)
A 1 in 5 year 1.8 2.70 2.50 -0.20 -0.7
B 1 in 20 year 0.7 2.95 2.89 -0.06 -0.31
C 1 in 20 year 2.2 2.95 3.34 0.39 0.14
D 1 in 100 year 0.7 3.71 3.80 0.09 0.60
Note: Details of the climate change scenarios are provided in Table 12-3
Increases in flow velocities are expected to occur within the floodplain for each climate change
scenario. The velocity increases for a number of locations within the Wilson River floodplain for Scenario D are shown in Table 12-21.
Table 12-21 Climate change velocity increase for the Wilson River floodplain for Scenario
D
Location Existing velocity (m/s) (without Proposal)
Velocity increase (m/s) (with Proposal)
Proposed culvert along floodplain east of Moorside Drive
0.2 2.8
Proposed highway bridge 1.2 0.3
The predicted increases in flow velocities are localised impacts only at the flood relief structures within the Proposal. Appropriate scour protection measures would be implemented to manage the
predicted increase in flow velocity.
12.3.4 Cooperabung Creek
The existing bridge across Cooperabung Creek would be replaced for the southbound carriageway and a new northbound bridge would be constructed to the west of the existing highway. Subject to
detailed design, the proposed bridges would have the following characteristics:
Deck level: 13.52 metres Australian height datum.
Soffit (underside) level of 12.49 metres Australian height datum
Two service road bridges would be constructed either side of the upgraded highway.
268 ENVIRONMENTAL ASSESSMENT
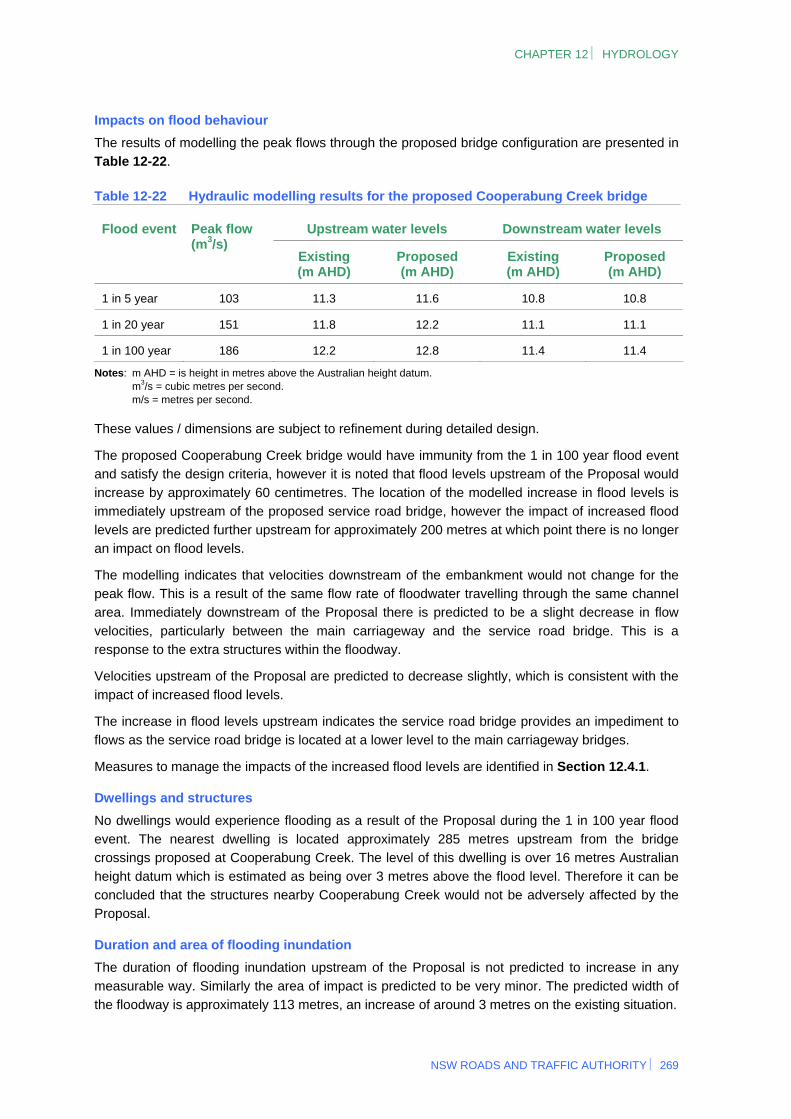
CHAPTER 12 HYDROLOGY
Impacts on flood behaviour
The results of modelling the peak flows through the proposed bridge configuration are presented in Table 12-22.
Table 12-22 Hydraulic modelling results for the proposed Cooperabung Creek bridge
Upstream water levels Downstream water levels Flood event Peak flow (m3/s)
Existing (m AHD)
Proposed (m AHD)
Existing (m AHD)
Proposed (m AHD)
1 in 5 year 103 11.3 11.6 10.8 10.8
1 in 20 year 151 11.8 12.2 11.1 11.1
1 in 100 year 186 12.2 12.8 11.4 11.4
Notes: m AHD = is height in metres above the Australian height datum. m3/s = cubic metres per second. m/s = metres per second.
These values / dimensions are subject to refinement during detailed design.
The proposed Cooperabung Creek bridge would have immunity from the 1 in 100 year flood event and satisfy the design criteria, however it is noted that flood levels upstream of the Proposal would increase by approximately 60 centimetres. The location of the modelled increase in flood levels is
immediately upstream of the proposed service road bridge, however the impact of increased flood levels are predicted further upstream for approximately 200 metres at which point there is no longer an impact on flood levels.
The modelling indicates that velocities downstream of the embankment would not change for the peak flow. This is a result of the same flow rate of floodwater travelling through the same channel area. Immediately downstream of the Proposal there is predicted to be a slight decrease in flow
velocities, particularly between the main carriageway and the service road bridge. This is a response to the extra structures within the floodway.
Velocities upstream of the Proposal are predicted to decrease slightly, which is consistent with the
impact of increased flood levels.
The increase in flood levels upstream indicates the service road bridge provides an impediment to flows as the service road bridge is located at a lower level to the main carriageway bridges.
Measures to manage the impacts of the increased flood levels are identified in Section 12.4.1.
Dwellings and structures
No dwellings would experience flooding as a result of the Proposal during the 1 in 100 year flood event. The nearest dwelling is located approximately 285 metres upstream from the bridge crossings proposed at Cooperabung Creek. The level of this dwelling is over 16 metres Australian
height datum which is estimated as being over 3 metres above the flood level. Therefore it can be concluded that the structures nearby Cooperabung Creek would not be adversely affected by the Proposal.
Duration and area of flooding inundation
The duration of flooding inundation upstream of the Proposal is not predicted to increase in any
measurable way. Similarly the area of impact is predicted to be very minor. The predicted width of the floodway is approximately 113 metres, an increase of around 3 metres on the existing situation.
NSW ROADS AND TRAFFIC AUTHORITY 269
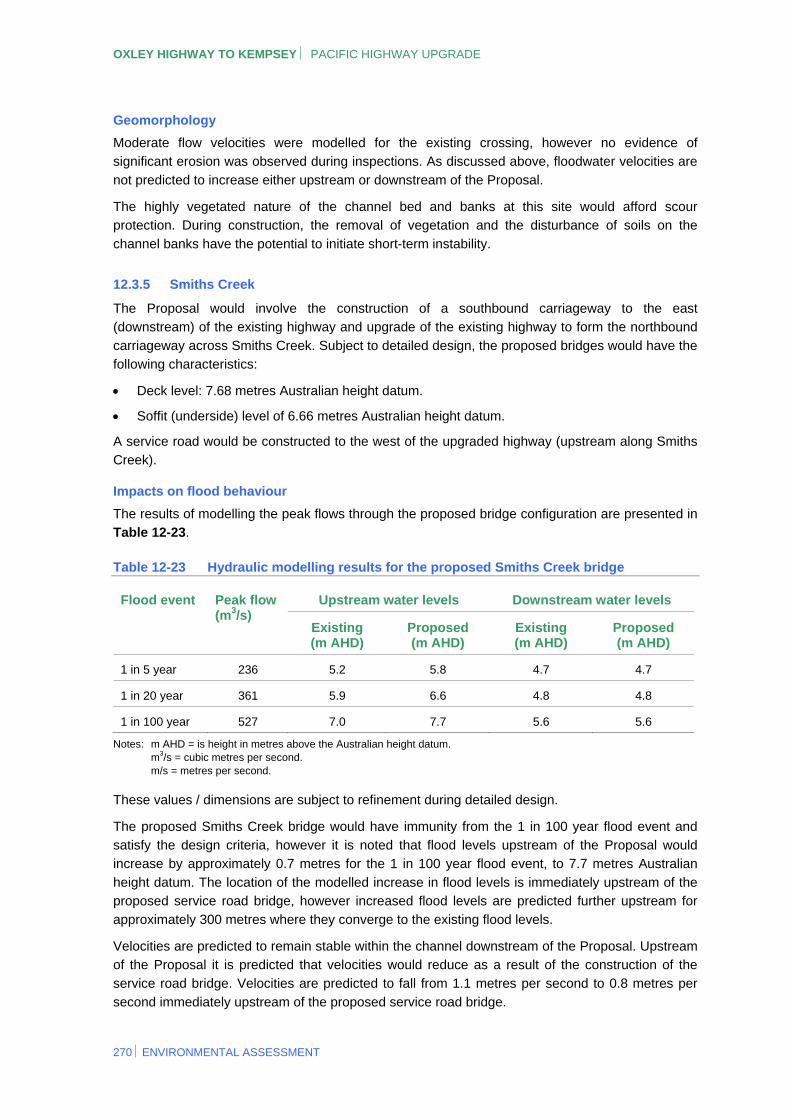
OXLEY HIGHWAY TO KEMPSEY PACIFIC HIGHWAY UPGRADE
Geomorphology
Moderate flow velocities were modelled for the existing crossing, however no evidence of significant erosion was observed during inspections. As discussed above, floodwater velocities are
not predicted to increase either upstream or downstream of the Proposal.
The highly vegetated nature of the channel bed and banks at this site would afford scour protection. During construction, the removal of vegetation and the disturbance of soils on the
channel banks have the potential to initiate short-term instability.
12.3.5 Smiths Creek
The Proposal would involve the construction of a southbound carriageway to the east (downstream) of the existing highway and upgrade of the existing highway to form the northbound
carriageway across Smiths Creek. Subject to detailed design, the proposed bridges would have the following characteristics:
Deck level: 7.68 metres Australian height datum.
Soffit (underside) level of 6.66 metres Australian height datum.
A service road would be constructed to the west of the upgraded highway (upstream along Smiths Creek).
Impacts on flood behaviour
The results of modelling the peak flows through the proposed bridge configuration are presented in Table 12-23.
Table 12-23 Hydraulic modelling results for the proposed Smiths Creek bridge
Upstream water levels Downstream water levels Flood event Peak flow (m3/s)
Existing (m AHD)
Proposed (m AHD)
Existing (m AHD)
Proposed (m AHD)
1 in 5 year 236 5.2 5.8 4.7 4.7
1 in 20 year 361 5.9 6.6 4.8 4.8
1 in 100 year 527 7.0 7.7 5.6 5.6
Notes: m AHD = is height in metres above the Australian height datum. m3/s = cubic metres per second. m/s = metres per second.
These values / dimensions are subject to refinement during detailed design.
The proposed Smiths Creek bridge would have immunity from the 1 in 100 year flood event and satisfy the design criteria, however it is noted that flood levels upstream of the Proposal would increase by approximately 0.7 metres for the 1 in 100 year flood event, to 7.7 metres Australian
height datum. The location of the modelled increase in flood levels is immediately upstream of the proposed service road bridge, however increased flood levels are predicted further upstream for approximately 300 metres where they converge to the existing flood levels.
Velocities are predicted to remain stable within the channel downstream of the Proposal. Upstream of the Proposal it is predicted that velocities would reduce as a result of the construction of the service road bridge. Velocities are predicted to fall from 1.1 metres per second to 0.8 metres per
second immediately upstream of the proposed service road bridge.
270 ENVIRONMENTAL ASSESSMENT
CHAPTER 12 HYDROLOGY
Modelling the Proposal without the service roads indicates a very minor change in flood behaviour. The increase in flood level and reduction in velocities upstream indicates the service road bridge provides an impediment to flows. The bridge is located at a lower level to the main carriageway
bridges. For example the flood level would increase by up to 1 centimetre for the main carriageways compared to 1 metre with inclusion of the service road bridge.
Dwellings and structures
No dwellings would experience flooding as a result of the Proposal during the 1 in 100 year flood events. The nearest dwelling is over 500 metres from the Smiths Creek bridges and ground levels at this location are over 15 metres Australian height datum, some 7 metres above the flood level.
Therefore it can be concluded that the Proposal would not impact on dwellings in the vicinity of Smiths Creek.
Duration and area of flooding inundation
The area of inundation is anticipated to increase by around 7 metres in width from 184 metres to 191 metres. The land impacted is generally cleared pasture or regrowth, and therefore the change
in affected land is not considered significant.
The duration of flooding is not predicted to change significantly. The velocity and discharge flow rate downstream of the Proposal remains constant, therefore suggesting the time of inundation
upstream also remains relatively constant.
Therefore it can be concluded that the service road bridge provides an impact to flood behaviour with respect to depths, inundation and velocity. Management of the impacts of the increased flood
levels are identified in Section 12.4.1.
Geomorphology
The banks of the channel display a high level of stability. However there is some evidence of past and ongoing bed scour immediately downstream of the existing crossing. The construction of the southbound carriageway has the potential to extend scour downstream. However, this would be
localised to the area immediately downstream of the proposed southbound bridge. During construction, the removal of vegetation and soil disturbance has the potential to initiate short-term instability.
12.3.6 Pipers Creek
The existing bridge would be replaced for the northbound carriageway and a new bridge would be constructed for the southbound carriageway to the east of the existing highway. Subject to detailed design, the proposed bridges would have the following characteristics:
Deck level of 10.95 metres Australian height datum.
Soffit (underside) level of 9.94 metres Australian height datum.
Service roads would be constructed on the western and eastern sides of the upgraded highway.
Impacts on flood behaviour
The results of modelling the peak flows through the proposed bridge configuration are presented in Table 12-24.
NSW ROADS AND TRAFFIC AUTHORITY 271
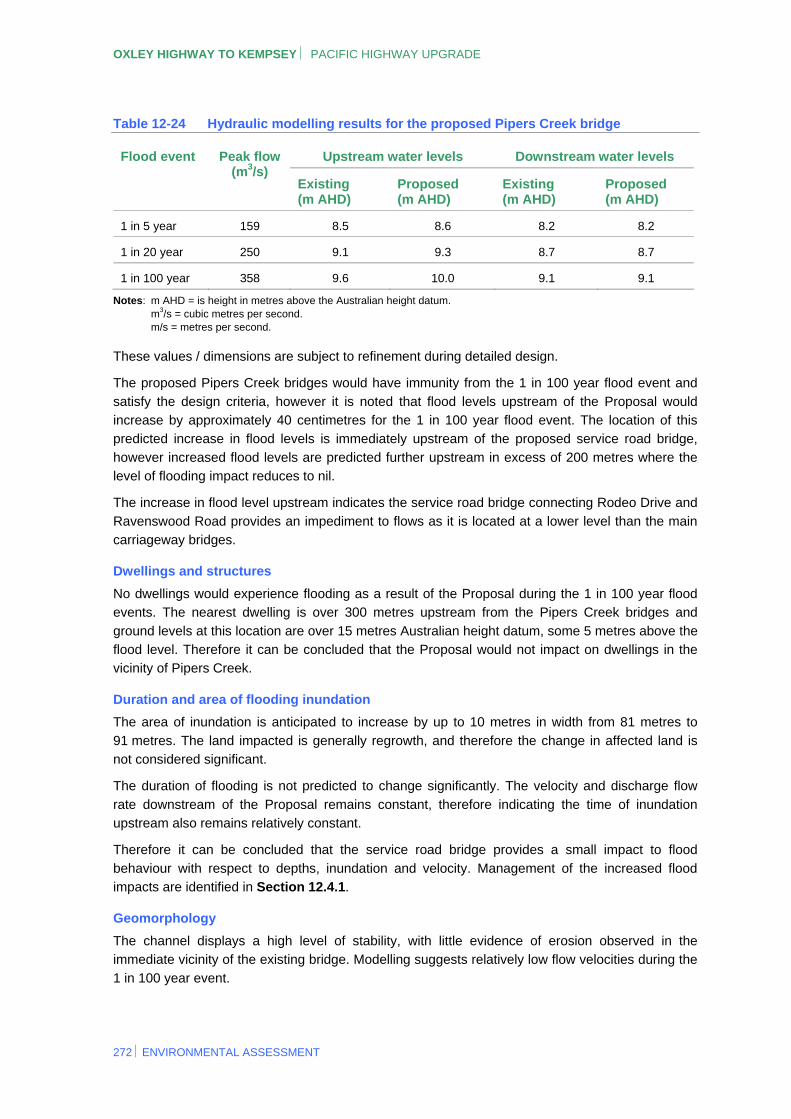
OXLEY HIGHWAY TO KEMPSEY PACIFIC HIGHWAY UPGRADE
Table 12-24 Hydraulic modelling results for the proposed Pipers Creek bridge
Upstream water levels Downstream water levels Flood event Peak flow (m3/s)
Existing (m AHD)
Proposed (m AHD)
Existing (m AHD)
Proposed (m AHD)
1 in 5 year 159 8.5 8.6 8.2 8.2
1 in 20 year 250 9.1 9.3 8.7 8.7
1 in 100 year 358 9.6 10.0 9.1 9.1
Notes: m AHD = is height in metres above the Australian height datum. m3/s = cubic metres per second. m/s = metres per second.
These values / dimensions are subject to refinement during detailed design.
The proposed Pipers Creek bridges would have immunity from the 1 in 100 year flood event and
satisfy the design criteria, however it is noted that flood levels upstream of the Proposal would increase by approximately 40 centimetres for the 1 in 100 year flood event. The location of this predicted increase in flood levels is immediately upstream of the proposed service road bridge,
however increased flood levels are predicted further upstream in excess of 200 metres where the level of flooding impact reduces to nil.
The increase in flood level upstream indicates the service road bridge connecting Rodeo Drive and
Ravenswood Road provides an impediment to flows as it is located at a lower level than the main carriageway bridges.
Dwellings and structures
No dwellings would experience flooding as a result of the Proposal during the 1 in 100 year flood events. The nearest dwelling is over 300 metres upstream from the Pipers Creek bridges and
ground levels at this location are over 15 metres Australian height datum, some 5 metres above the flood level. Therefore it can be concluded that the Proposal would not impact on dwellings in the vicinity of Pipers Creek.
Duration and area of flooding inundation
The area of inundation is anticipated to increase by up to 10 metres in width from 81 metres to
91 metres. The land impacted is generally regrowth, and therefore the change in affected land is not considered significant.
The duration of flooding is not predicted to change significantly. The velocity and discharge flow
rate downstream of the Proposal remains constant, therefore indicating the time of inundation upstream also remains relatively constant.
Therefore it can be concluded that the service road bridge provides a small impact to flood
behaviour with respect to depths, inundation and velocity. Management of the increased flood impacts are identified in Section 12.4.1.
Geomorphology
The channel displays a high level of stability, with little evidence of erosion observed in the immediate vicinity of the existing bridge. Modelling suggests relatively low flow velocities during the
1 in 100 year event.
272 ENVIRONMENTAL ASSESSMENT
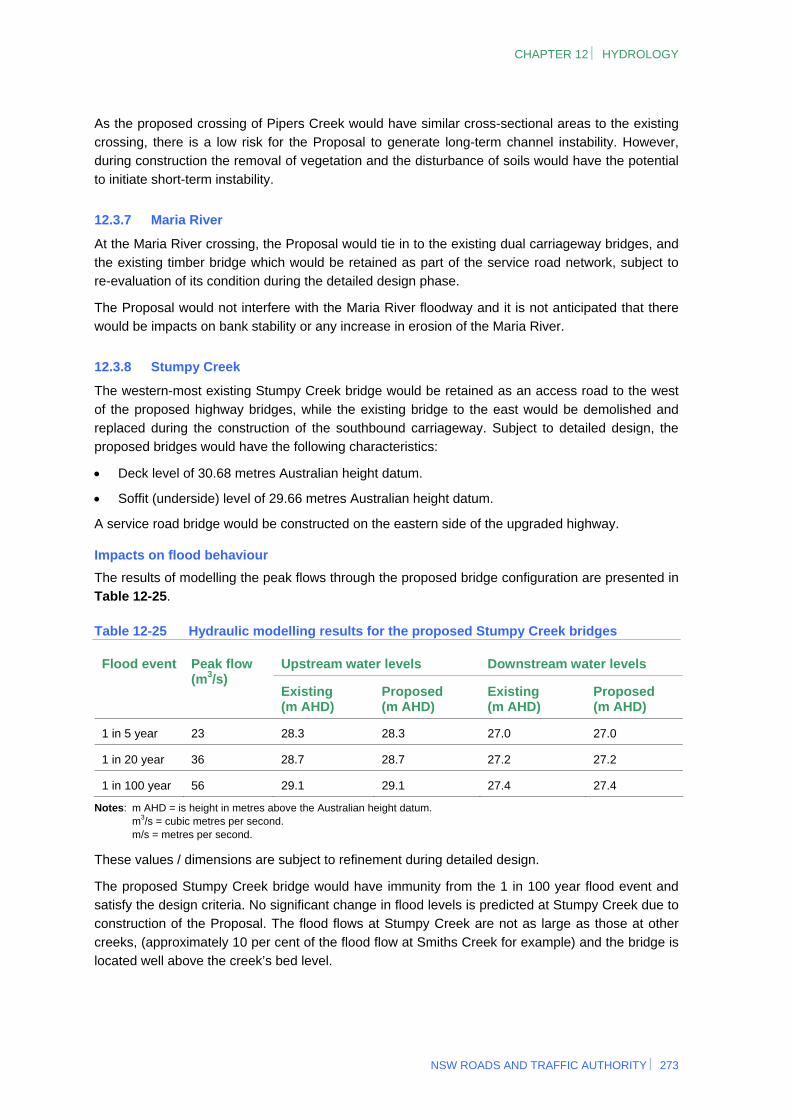
CHAPTER 12 HYDROLOGY
As the proposed crossing of Pipers Creek would have similar cross-sectional areas to the existing crossing, there is a low risk for the Proposal to generate long-term channel instability. However, during construction the removal of vegetation and the disturbance of soils would have the potential
to initiate short-term instability.
12.3.7 Maria River
At the Maria River crossing, the Proposal would tie in to the existing dual carriageway bridges, and the existing timber bridge which would be retained as part of the service road network, subject to re-evaluation of its condition during the detailed design phase.
The Proposal would not interfere with the Maria River floodway and it is not anticipated that there would be impacts on bank stability or any increase in erosion of the Maria River.
12.3.8 Stumpy Creek
The western-most existing Stumpy Creek bridge would be retained as an access road to the west
of the proposed highway bridges, while the existing bridge to the east would be demolished and replaced during the construction of the southbound carriageway. Subject to detailed design, the proposed bridges would have the following characteristics:
Deck level of 30.68 metres Australian height datum.
Soffit (underside) level of 29.66 metres Australian height datum.
A service road bridge would be constructed on the eastern side of the upgraded highway.
Impacts on flood behaviour
The results of modelling the peak flows through the proposed bridge configuration are presented in Table 12-25.
Table 12-25 Hydraulic modelling results for the proposed Stumpy Creek bridges
Upstream water levels Downstream water levels Flood event Peak flow (m3/s)
Existing (m AHD)
Proposed (m AHD)
Existing (m AHD)
Proposed (m AHD)
1 in 5 year 23 28.3 28.3 27.0 27.0
1 in 20 year 36 28.7 28.7 27.2 27.2
1 in 100 year 56 29.1 29.1 27.4 27.4
Notes: m AHD = is height in metres above the Australian height datum. m3/s = cubic metres per second. m/s = metres per second.
These values / dimensions are subject to refinement during detailed design.
The proposed Stumpy Creek bridge would have immunity from the 1 in 100 year flood event and satisfy the design criteria. No significant change in flood levels is predicted at Stumpy Creek due to construction of the Proposal. The flood flows at Stumpy Creek are not as large as those at other
creeks, (approximately 10 per cent of the flood flow at Smiths Creek for example) and the bridge is located well above the creek’s bed level.
NSW ROADS AND TRAFFIC AUTHORITY 273
OXLEY HIGHWAY TO KEMPSEY PACIFIC HIGHWAY UPGRADE
The span of the bridge and clearance from the bridge soffit to the creek bed are dictated by topography and the road design geometry, rather than hydraulic requirements. The resulting waterway area at this location is significantly in excess of the requirements of the flood flows.
Therefore there is sufficient capacity through the bridge structures proposed at Stumpy Creek for the floods up to and including the 1 in 100 year flood events.
No particular flood mitigation and management measures are required at Stumpy Creek as a result
of the Proposal.
Dwellings and structures
No dwellings would experience flooding as a result of the Proposal during the 1 in 100 year flood
events as there is no change in flood behaviour at this location. The nearest dwelling is around 230 metres upstream from the Stumpy Creek bridges and ground levels at this location are over 38 metres Australian height datum, 10 metres above the flood level. Therefore it can be concluded
that the Proposal would not impact on dwellings in the vicinity of Stumpy Creek.
Duration and area of flooding inundation
The area of inundation is not anticipated to change as there is no change predicted in flood behaviour. Similarly with the duration of flooding, no change is predicted.
Therefore it can be concluded that the Proposal does not generate impacts on hydrology and
hydraulics in the vicinity of Stumpy Creek.
Geomorphology
The channel displays a high level of stability, with little evidence of erosion observed in the immediate vicinity of the existing bridge. Modelling suggests relatively low flow velocities during the 1 in 100 year event. Since the proposed crossing of Stumpy Creek would have similar cross-
sectional areas to the existing crossing, there is a low risk for the Proposal to generate long-term channel instability. However, during construction the removal of vegetation and the disturbance of soils would have the potential to initiate short-term instability.
12.3.9 Culverts
Existing streambeds generally withstand much higher velocities than a channel that has been newly constructed. This is a result of erosion taking place in the natural channel for many years. The material that forms the channel lining tends to be coarse, stable and well compacted. Water
velocities at culvert outlets that discharge into a natural stream, tend to be higher than the natural velocities as culverts are generally hydraulically more efficient.
High velocity flows from culverts can result in scour if there is no mechanism to dissipate excess
energy at the outlet. These scour holes could undermine the culvert headwall, endanger the structure or road embankment, and affect downstream water quality. Modifications to drainage patterns could also result in damage to drainage structures constructed on farms.
Hydraulic modelling was undertaken to calculate whether the Proposal’s culvert configurations would meet the RTA’s velocity criteria to reduce the impacts of the Proposal. The concept design of the flood relief structures and culverts has achieved this in all circumstances. The design of
drainage structures would be further refined and finalised during the detailed design stage.
274 ENVIRONMENTAL ASSESSMENT
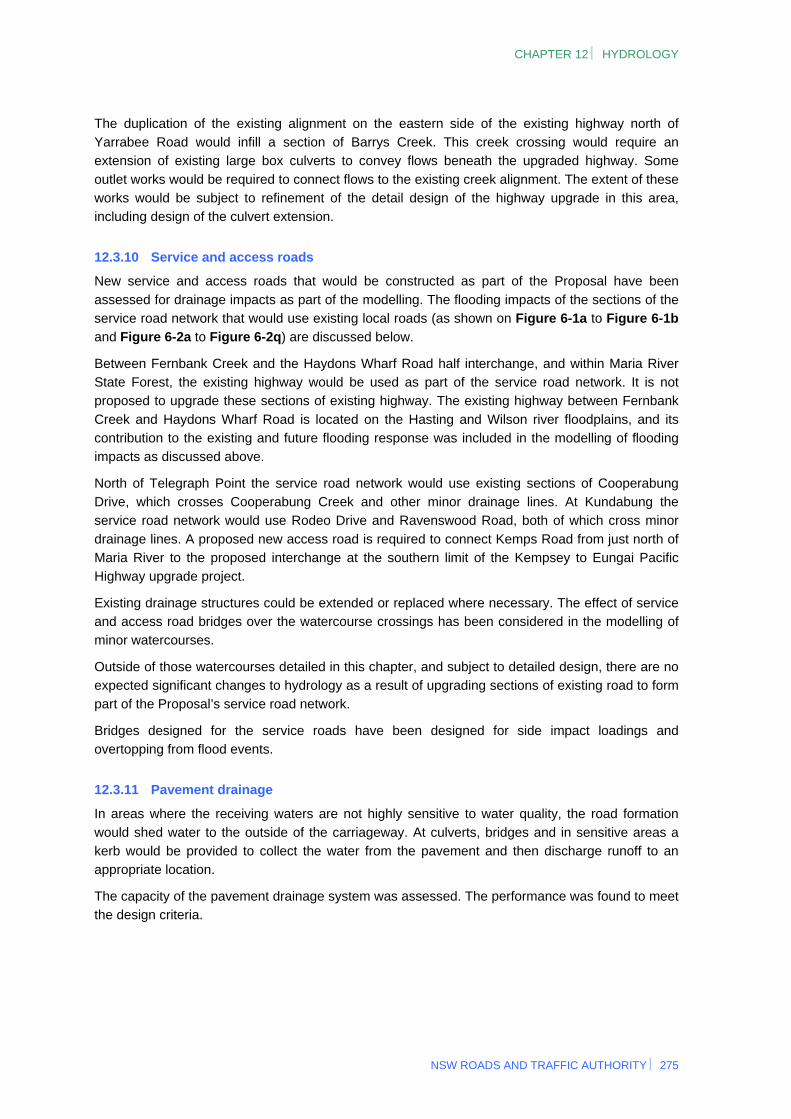
CHAPTER 12 HYDROLOGY
The duplication of the existing alignment on the eastern side of the existing highway north of Yarrabee Road would infill a section of Barrys Creek. This creek crossing would require an extension of existing large box culverts to convey flows beneath the upgraded highway. Some
outlet works would be required to connect flows to the existing creek alignment. The extent of these works would be subject to refinement of the detail design of the highway upgrade in this area, including design of the culvert extension.
12.3.10 Service and access roads
New service and access roads that would be constructed as part of the Proposal have been
assessed for drainage impacts as part of the modelling. The flooding impacts of the sections of the service road network that would use existing local roads (as shown on Figure 6-1a to Figure 6-1b and Figure 6-2a to Figure 6-2q) are discussed below.
Between Fernbank Creek and the Haydons Wharf Road half interchange, and within Maria River State Forest, the existing highway would be used as part of the service road network. It is not proposed to upgrade these sections of existing highway. The existing highway between Fernbank
Creek and Haydons Wharf Road is located on the Hasting and Wilson river floodplains, and its contribution to the existing and future flooding response was included in the modelling of flooding impacts as discussed above.
North of Telegraph Point the service road network would use existing sections of Cooperabung Drive, which crosses Cooperabung Creek and other minor drainage lines. At Kundabung the service road network would use Rodeo Drive and Ravenswood Road, both of which cross minor
drainage lines. A proposed new access road is required to connect Kemps Road from just north of Maria River to the proposed interchange at the southern limit of the Kempsey to Eungai Pacific Highway upgrade project.
Existing drainage structures could be extended or replaced where necessary. The effect of service and access road bridges over the watercourse crossings has been considered in the modelling of minor watercourses.
Outside of those watercourses detailed in this chapter, and subject to detailed design, there are no expected significant changes to hydrology as a result of upgrading sections of existing road to form part of the Proposal’s service road network.
Bridges designed for the service roads have been designed for side impact loadings and overtopping from flood events.
12.3.11 Pavement drainage
In areas where the receiving waters are not highly sensitive to water quality, the road formation
would shed water to the outside of the carriageway. At culverts, bridges and in sensitive areas a kerb would be provided to collect the water from the pavement and then discharge runoff to an appropriate location.
The capacity of the pavement drainage system was assessed. The performance was found to meet the design criteria.
NSW ROADS AND TRAFFIC AUTHORITY 275
OXLEY HIGHWAY TO KEMPSEY PACIFIC HIGHWAY UPGRADE
12.3.12 Other operational impacts
Other potential impacts during operation of the Proposal include the following:
Increase in impervious surfaces leading to greater runoff to drainage paths.
Increase the potential for erosion of stream banks and flooding due to the alteration of natural drainage paths, creeks and streams.
Increase the potential for erosion due to the direct disturbance of soils and the removal of vegetation.
12.3.13 Staging implications
In preparing this Environmental Assessment, the potential hydrology and hydraulic impacts of the
possible staging option described in Section 7.3.2 in comparison to the construction of the entire Proposal to a full motorway standard have been considered as outlined below.
In this regard, the bridges and flood relief structures that would be provided as part of this staging
option in Sections C and D would be the same as those proposed for the motorway standard upgrade. There would be no change in the flooding impacts or risk to residential properties upstream of the Proposal for this staging option, compared to the ultimate motorway standard
upgrade.
Should the Proposal be delivered in stages, the staging report described in Section 7.3.3 would detail the hydrology and hydraulic impacts of the selected staging option. If any additional or
altered impacts are identified, the staging report would further assess these impacts and identify appropriate management measures.
12.4 Management of impacts
12.4.1 Flooding and watercourse crossings
The Proposal has the potential to affect flood behaviour through the introduction of infrastructure such as new bridges, embankments and drainage structures. To minimise and mitigate the Proposal’s potential impacts on flooding and the impacts of proposed watercourse crossings, the
concept design incorporates measures to mitigate flooding and impacts consistent with the flood management objectives outlined in Section 12.1.2. The design of drainage structures also allows for the natural flow of floodwaters and existing overland flow paths to be maintained after the
construction of the Proposal.
Major watercourses and floodplains
Modelling of the major watercourses, the results of which were described in Section 12.3, considered three different scenarios so that the impacts on the watercourses are minimised. The concept designs for the crossings of major watercourses include bridges and flood relief structures
(such as culverts) along the floodplains. These structures minimise the impact of the Proposal on floodwaters.
For the major floodplains, rock bank stabilisation works would be undertaken upstream and
downstream of the proposed crossings. Subject to refinement during detailed design, at the Hastings River the stabilisation works would extend 50 metres upstream of the proposed crossing and 100 metres downstream of the crossing, except on the northern bank where rock armouring
would extend between the proposed and existing alignment. For the Wilson River, stabilisation works would extend 50 metres upstream and downstream of the proposed crossing.
276 ENVIRONMENTAL ASSESSMENT
CHAPTER 12 HYDROLOGY
For culvert locations along the Hastings and Wilson river floodplains, geotextile mattresses would be installed along the bed and banks downstream of each culvert crossing. This would mitigate the impacts of floodwaters flowing through culverts, and also the additional impacts on flood flows by
climate change.
The Proposal has been developed to cater for known design rainfall and flood events. This includes provision for passage of flood waters, management of flow velocities to minimise erosion and scour
in watercourses and collection and management of runoff waters. These would be further refined during the detailed design phase.
Minor watercourses
The assessment of bridge crossings of minor watercourses considered the effect of service and access road bridges on hydraulic conveyance and it was shown that all proposed bridges have been designed to adequately convey the 1 in 100 year peak flows. In some circumstances flood
levels are predicted to increase as a result of the Proposal, particularly with construction of the service road bridges. Even though the impacts of the increase in flood levels are not predicted to be significant, further options and mitigation measures would be investigated at the detailed design
stage. These options would include raising service road bridge structures to a higher level, widening bridge openings, additional culverts etc. However it is noted that the impacts of the service road bridges are not considered significant. Furthermore where a bridge structure
adversely impacts flood flows, individual mitigation options for buildings are available. These options can include elevating houses, and elevating electrical outlets and high values items such as pumps on rural properties.
Any bridge crossing or culvert where high velocities have been identified and cannot be minimised by changes to the design, would also have scour protection as detailed in Section 12.4.2.
Bridge construction techniques, such as minimising the clearance footprint on embankments, and
maintaining clear passage of the stream channels, would assist in mitigating the impact of construction on the various creeks within the Proposal area. Bridge designs would limit the location of structures such as piers and piles within the channel bed of the watercourses. Piers would be
designed and orientated to avoid the generation of turbulence and subsequent bed and bank erosion.
At Pipers Creek, rock armouring would be undertaken to protect steepened batters along the
northern bank abutment. The southern bank would comprise a vertical concrete abutment wall and wingwalls.
Refinement of the drainage structure design would be undertaken at the detailed design stage to
maximise their hydraulic and environmental performance.
Dwellings and structures
Dwellings and structures in the floodplains for the Hastings and Wilson rivers are predicted to be impacted by increased flood levels. The impact is not predicted to be significant, however mitigation and management options would be investigated at the detailed design stage for the
Proposal. Possible mitigation and management measures for buildings and dwellings can include raising houses or adjusting electrical outlets and raising high value items such as pumps on rural properties. Raising dwellings would generally only be implemented for significantly impacted
dwellings, however no dwellings have been identified as being significantly impacted by the Proposal.
NSW ROADS AND TRAFFIC AUTHORITY 277
OXLEY HIGHWAY TO KEMPSEY PACIFIC HIGHWAY UPGRADE
Culverts
Culverts have been located to minimise impacts on the flow of stormwater runoff, sized to adequately convey the 1 in 100 year runoff event, and designed to meet the RTA’s design velocity
criteria. Where high velocities are predicted to be experienced, scour protection has been specified for the applicable drainage structures (see Section 12.4.2). However, it should be noted that the hydrology and hydraulics of culverts would be refined during detailed design.
12.4.2 Climate change
Development of the Proposal has been planned with an awareness of the potential for climate change impacts on the Proposal and the range of the potential impacts. For the Proposal, the RTA considers that an adaptive approach provides the most appropriate methodology for the
management of the impact of future climate change on flood behaviour and the performance of the highway drainage structures. This approach would involve:
Designing and constructing the Proposal to, if possible, achieve the Proposal objective of
providing flood immunity on at least one carriageway for a 1 in 100 year flood event. It is noted that the concept design for the Proposal currently allows for either both carriageways, or an alternative route such as the existing Pacific Highway, to remain operational during the 1 in 100
year flood events for the length of the Proposal.
Monitoring the performance of the installed drainage structures.
Periodic reviews of published rainfall and ocean level data and advices / guidelines issued by appropriate organisations.
Determining, based on the above data, the actual and/or predicted performance of the highway drainage structures and compare this performance against the Proposal objective of providing
flood immunity for a 1 in 100 year flood event.
Identify any location(s) where the performance of the highway drainage structures does not
satisfy the Proposal objective and identify and assess measures to manage these areas. Potential management measures could include:
o Augmentation of the drainage structures and/or undertaking other works to provide flood immunity for a 1 in 100 year flood event.
o Accept a reduced level of flood immunity at these locations and implement appropriate measures to any impacts of the reduced flood immunity.
o A combination of the above.
Implement the adopted management measures.
12.4.3 Scour protection
Appropriate scour protection would be provided on both the upstream and downstream ends of structures where increased velocities have the potential to cause scour. Design of scour protection measures would be undertaken during the detailed design phase based on peak inlet and outlet
velocities, and applicable fish and fauna friendly requirements. Rock armouring is proposed for the protection of steepened batters at bridge abutments.
278 ENVIRONMENTAL ASSESSMENT
CHAPTER 12 HYDROLOGY
NSW ROADS AND TRAFFIC AUTHORITY 279
For culverts, the selection of appropriate scour protection would depend on the characteristics of the culvert flows. Typically, a headwall and apron would be sufficient to protect against scour when the outlet velocities are low. Rock protection would be required at the outlet of each culvert. For
culverts with 1 in 100 year exit velocities of less than 4 metres per second, rock protection would be implemented. For culverts with exit velocities in excess of 4 metres per second, constructed rock plunge pools would be provided. These would be designed in accordance with the RTA Road
Design Guide (RTA 1988) using rock diameters appropriate for each specific location.
Other forms of protection that could be required at specific culverts in addition to the above treatments, such as channel armouring, riprap, gabion structures, and channel realignments.
These would be identified during detailed design.
12.4.4 Other construction management measures
Other measures to mitigate potential impacts on geomorphology during detailed design and construction include:
Bridge design and construction would minimise the disturbance of vegetation and soils within
the bed and banks of the watercourse channels.
Minimisation of vehicular access and movement on the bed and banks of the creeks to
minimise disturbance and the potential for scour during a large flood flow event.
Revegetation of banks upstream and downstream of the new bridges (within the road
reservation) with local native species as soon as practical. Particular attention would be paid to stabilising the toe of the bank by providing a high density planting of both ground cover species and deeper-rooted species.
Revegetation of the in-channel surface, focusing on areas disturbed during the construction process.
Construction activities within watercourses would be avoided during periods of higher than normal creek flows.
Watercourse bed and banks would be monitored during construction for indications of instability. Particular attention to monitoring channel erosion would be undertaken during and
following higher than normal flow conditions. Any evidence in the increased intensity or extent of erosion would be addressed with appropriate temporary and/or permanent protection measures.
Subject to detailed design and further modelling if required, bridge piers of existing bridge structures which are no longer required would be removed.

THIS PAGE IS INTENTIONALLY BLANK