Embed Size (px)
Citation preview
T R A N S P O R T A T I O N R E S E A R C H
Number E-C215 November 2016
Roadside Safety Design and Devices
International Workshop
March 26, 2015Melbourne, Australia
TRANSPORTATION RESEARCH BOARD 2016 EXECUTIVE COMMITTEE OFFICERS Chair: James M. Crites, Executive Vice President of Operations, Dallas–Fort Worth
International Airport, Texas Vice Chair: Paul Trombino III, Director, Iowa Department of Transportation, Ames Division Chair for NRC Oversight: Susan Hanson, Distinguished University Professor
Emerita, School of Geography, Clark University, Worcester, Massachusetts Executive Director: Neil J. Pedersen, Transportation Research Board TRANSPORTATION RESEARCH BOARD 2016–2017 TECHNICAL ACTIVITIES COUNCIL Chair: Daniel S. Turner, Emeritus Professor of Civil Engineering, University of Alabama,
Tuscaloosa Technical Activities Director: Ann M. Brach, Transportation Research Board Peter M. Briglia, Jr., Consultant, Seattle, Washington, Operations and Preservation Group
Chair Mary Ellen Eagan, President and CEO, Harris Miller Miller and Hanson, Inc., Burlington,
Massachusetts, Aviation Group Chair Anne Goodchild, Associate Professor, University of Washington, Seattle, Freight Systems
Group Chair David Harkey, Director, Highway Safety Research Center, University of North Carolina,
Chapel Hill, Safety and Systems Users Group Chair Dennis Hinebaugh, Director, National Bus Rapid Transit Institute, University of South
Florida Center for Urban Transportation Research, Tampa, Public Transportation Group Chair
Bevan Kirley, Research Associate, Highway Safety Research Center, University of North Carolina, Chapel Hill, Young Members Council Chair
D. Stephen Lane, Associate Principal Research Scientist, Virginia Center for Transportation Innovation and Research, Design and Construction Group Chair
Hyun-A C. Park, President, Spy Pond Partners, LLC, Arlington, Massachusetts, Policy and Organization Group Chair
Harold R. (Skip) Paul, Director, Louisiana Transportation Research Center, Louisiana Department of Transportation and Development, Baton Rouge, State DOT Representative
Ram M. Pendyala, Frederick R. Dickerson Chair and Professor of Transportation, Georgia Institute of Technology, Planning and Environment Group Chair
Stephen M. Popkin, Director, Safety Management and Human Factors, Office of the Assistant Secretary of Transportation for Research and Technology, Volpe National Transportation Systems Center, Cambridge, Massachusetts, Rail Group Chair
Robert Shea, Senior Deputy Chief Counsel, Pennsylvania Department of Transportation, Legal Resources Group Chair
Eric Shen, Director, Southern California Gateway Office, Maritime Administration, Long Beach, California, Marine Group Chair
TRANSPORTATION RESEARCH CIRCULAR E-C215
Roadside Safety Design and Devices
International Workshop
March 26, 2015 Melbourne, Australia
Prepared by Standing Committee on Roadside Safety Design
Editors Rod Troutbeck, Troutbeck & Associates
Andrew Burbridge, Queensland University of Technology
November 2016
Transportation Research Board 500 Fifth Street, NW
Washington, D.C. 20001 www.TRB.org
Lea Camarda, Production Editor; Jennifer Correro, Proofreading and Layout
TRANSPORTATION RESEARCH CIRCULAR E-C215 ISSN 0097-8515 The Transportation Research Board is one of seven programs of the National Academies of Sciences, Engineering, and Medicine. The mission of the Transportation Research Board is to provide leadership in transportation innovation and progress through research and information exchange, conducted within a setting that is objective, interdisciplinary, and multimodal. The Transportation Research Board is distributing this E-Circular to make the information contained herein available for use by individual practitioners in state and local transportation agencies, researchers in academic institutions, and other members of the transportation research community. The information in this circular was taken directly from the submission of the authors. This document is not a report of the National Academies of Sciences, Engineering, and Medicine.
Design and Construction Group Thomas J. Kazmierowski, Chair
Design Section
Brian L. Ray, Chair
Standing Committee on Roadside Safety Design Richard Albin, Chair
Dean C. Alberson Douglas J. Gabauer Malcolm Ray Marco Anghileri Hampton Gabler Maria Ruppe Richard Butler Raphael H. Grzebieta Francesca Russo
Brian E. Chandler Ali Hangul Jeffery Sankey Joseph Cheung Donna Hardy Marc-Andre Seguin
Chiara Silvestri Dobrovolny Chad Heimbecker Dean Sicking John C. Durkos Don Ivey Barry Stephens Gerrit A. Dyke Kristofer Kusano Stephen Summers Michael Elle Francesca La Torre Rod Troutbeck Erik Emerson Rodney Lacy Ida Van Schalkwyk
Ronald K. Faller Dhafer Marzougui Gavin Williams John Mauthner
TRB Staff Stephen Maher, Associate Division Director–Design Engineer
Transportation Research Board 500 Fifth Street, NW
Washington, D.C. www.TRB.org
iii
Preface
his e-circular is a record of a meeting hosted by the International Research Subcommittee of the TRB Roadside Safety Design Committee in Melbourne, Australia, on March 26, 2015.
This meeting follows others in Milan, Italy, in 2012 and Brussels, Belgium, in 2013 and 2014. The workshop was arranged by Mike Dreznes and Rod Troutbeck, cochairs of the
subcommittee and organized by the staff at Roads Australia. Ninety-four delegates from many countries attended this meeting, and these delegates are listed in the Appendix.
This e-circular is a compilation of the papers presented at the workshop and is similar to an earlier electronic Transportation Research Circular E-C172: Roadside Safety Design and Devices: International Workshop (http://www.trb.org/Publications/Blurbs/168537.aspx).
The papers in this e-circular give a sense of what was discussed and should be useful for researchers and practitioners alike. Four papers were prepared by the editors, Rod Troutbeck and Andrew Burbridge, based on their presentation slides. Rod Troutbeck and Andrew Burbridge provided editorial guidance on all papers in the preparation of this circular.
The meeting was a great success, and the attendees affirmed interest in conducting a similar meeting annually outside of North America, particularly in Australia.
Thanks go to the TRB Roadside Safety Design Committee members—in particular to committee chair Roger Bligh; to Roads Australia, in particular, to Mandi Dorhout Mees; to Monash University, in particular to Madeleine McManus for providing the meeting room; to all of the presenters; and, finally, to TRB Staff Representative Stephen Maher.
—Rod Troutbeck Mike Dreznes
Cochairs International Research Subcommittee,
TRB Roadside Safety Design Committee
T
PUBLISHER’S NOTE The views expressed in the papers contained in this publication are those of the authors and do not necessarily reflect the views of the Transportation Research Board or the National Academies of Science, Engineering, and Medicine. The papers have not been subjected to the formal TRB peer review process.

v
Contents SESSION 1: ASSESSMENT PRACTICES Roadside Barrier Installation and Maintenance Issues: The Need for
Improved Quality Control ......................................................................................................1 Daniel Cassar
Sector Schemes: What Are They and How Should They Be Used in Australia? ...................10 Paul Hansen
Measuring Cable Tensions in Wire Rope Barriers During In-Service Conditions ...............17 Noel O’Callaghan
SESSION 2: WORK ZONE SAFETY The Importance of Proven and Tested Positive Protection in Work Zones ...........................23
Steve Johnson Recent Developments in Portable Longitudinal Barriers for Work Zones ............................25
Ben Duncker SESSION 3: SAFE SYSTEM AND ROADSIDES Safe System Roadsides: Putting Clear Zones in Their Place ...................................................28
Wayne Moon, Paul Milailidis, and Tony Chau Measuring the Residual Risk Associated with Road Safety Barriers .....................................38
Andrew Burbridge Application of Safe System (Safe Roads) to Existing Highways
in Developing Countries ........................................................................................................50 Peter C. Harris
Implementation and Evaluation of an Innovative Wide Centerline to Reduce Cross-Over-the-Centerline Crashes in Queensland .........................................63 Simon Harrison, Sam Atabak, and Hanford Cheung
Recent Efforts to Enhance Road Safety in Nepal .....................................................................70 Tulasi Sitaula
SESSION 4: ROADSIDE SAFETY HARDWARE DEVELOPMENT AND TESTING Can Australian Authorities Use a Common Guardrail Design? .............................................72
Bruce Snook Developing a Safer Impact-Absorbing Street Lighting Pole for
Urban Environments and Review of Test Requirements and Pass–Fail Criteria ...........85 Noel O’Callaghan, Adam Pyrzakowski and Grad Zivkovic
EN 1317 Versus NCHRP 350: Nongating Test Level 3 Crash Cushion Versus Redirective 110-km/h Crash Cushion .....................................................................96 Luigi Grassia
and Mauro Corsanici
Safe Bridge Barriers Tested and Simulated to EN 1317 and MASH with Low Forces Transmitted: Australian Example Compared with European Union Example ............104 Joseph Marra, Dario Guarino, Ryan Findlayson, Dane Hansen, and Paul Hansen
Public Benefit of Road Safety Barrier Innovation ..................................................................116 Hayden Wallace
Analysis of In-Service Safety Performance of Wire Rope Safety Barriers ..........................122 Chris Jurewicz
SESSION 5: MOTORCYCLE SAFETY Simulation of Motorcyclist Impacts with Rub-Rail Roadside Barrier Modifications .........125
Mike Bambach and Raphael Grzebieta Identification of Motorcycle Crashes and Possible Roadside
Protection on Rural Low-Volume Roads in Indonesia .....................................................130 Tri Tjahjono
Making Roads Motorcycle Friendly: A New Zealand Perspective .......................................143 Julian Chisnall and Frances Broatch
Appendix: List of Attendees ......................................................................................................149
1
SESSION 1: ASSESSMENT PRACTICES
Roadside Barrier Installation and Maintenance Issues The Need for Improved Quality Control
DANIEL CASSAR
Roads Corporation of Victoria, Australia
re we receiving the full benefit of our investment in road safety? This paper aims to raise awareness of the need to improve installation and maintenance practices and quality control
associated with both permanent and temporary road safety hardware. In 2011,the Roads Corporation of Victoria (VicRoads) was approached by a number of
barrier installation companies and product suppliers with serious concerns for practices the industry were engaging in that are likely to compromise the performance of safety hardware. At the time VicRoads was and still is deeply committed to the Decade of Action to reduce the average of 250 lives lost each year on roads in the state of Victoria (population 5.79 million). A joint Traffic Accident Commission and VicRoads commitment has seen and continues to see significant quantities of both wire rope safety barrier (WRSB) and guard fence (predominantly W-beam) installed over the last decade. But the legacy now left behind from inappropriate installation and maintenance practices is likely to reduce the benefit of that investment the community is making. Is it just a matter of time until the hardware that is meant to save lives is responsible for taking lives?
We initially investigated these concerns raised by industry in 2012. Over a 12-month period, we randomly inspected a number of routes that received large quantities of permanent barriers (mainly guard fence and WRSB) because of the presence of roadside hazards. By the end of the 12 months we had seen considerable evidence to realize the concerns raised were valid and worth taking action on, not only of permanent barrier systems but also of temporary worksite barriers used during construction. Typically hardware was not installed in accordance with both VicRoads’ specification requirements and the licensed product suppliers’ requirements.
The investment made by all stakeholders to develop, improve, and to receive acceptance by the respective road authority is significant, and for very good reason. From the inception of a new idea for a hardware device that may save a life, to the effort and financial investment made by companies and organizations that undertake years of research and testing to develop a product, the investment is substantial. Investments include those made by road authorities and agencies such as FHWA to ensure the products meet standards, are fit for purpose, are assessed and deemed compliant against crash testing standards, and meet the road authority’s operational needs. The primary objective is to ensure the community will receive the highest benefit from the safety hardware device. Once a product is approved for use by the road authority or deemed eligible for state funding contribution, the licensed suppliers invest heavily to ensure their products can be installed in accordance with how they were crash tested and approved. Companies develop comprehensive manuals for installation and maintenance practices and some have even prepared professional instructional videos or short courses on how to install and maintain their systems.
Despite such an investment of effort to ensure the safety hardware will perform as it was crash tested, there is little or no process or governance around who can install these devices and
A
2 Transportation Research Circular E-C215: Roadside Safety Design and Devices
limited understanding by the industry on how to specifically design using the systems. This is the critical missing link in this entire process to realizing the full potential of our investment in road safety and saving lives, and there is considerable evidence to support this lack of governance or process.
Following the investigation in 2012 that confirmed the industry and supplier concerns, VicRoads introduced a short-term governance measure to immediately address the issue going forward. As part of its contracts, VicRoads introduced and still currently requires any installation of guard fence terminals and WRSB systems to be certified by the Australian licensed product supplier prior to the issue of Practical Completion on the contract, as follows:
708.09 COMPLIANCE AUDITING OF BARRIER SYSTEM INSTALLATION HP Further to Clause 708.07 Installation, and prior to the issue of the Certificate of Practical
Completion, the Contractor shall arrange for a safety barrier compliance audit on all proprietary guard fence end treatments constructed under the Contract. The audit shall be undertaken and a report prepared by the Australian Licensed Supplier of the safety barrier system. A Compliance Audit Report (CAR), signed by the Contractor’s Representative and the Licensed Supplier, shall be provided certifying that the products have been installed in accordance with the manufacturer’s Installation Manual and this specification. A CAR shall be provided for each end treatment installed.
In addition, the Contractor shall complete and submit to the Superintendent a signed copy of the manufacturer’s Installation Checklist / Inspection and Test Plan as per the manufacturer’s Product and Installation Manual.
This has delivered some success and improvement with a number of contractors
responding well to the issue and changing practices, with some contractors achieving near perfect results following compliance auditing of their contract. However, many compliance audits are still highlighting the problem that remains. One recently audited contract of approximately 60 NCHRP 350 terminals found that only five were compliant with manufacturer’s requirements. The ramifications of the terminals not in compliance include costly rework for the contractor, delays, and an overall compromise of safety for road users.
The nonconformances identified are not minor; they are defects that will adversely affect the performance of the terminal or system based on engineering analysis and manufacturers’ recommendations. VicRoads is currently investigating strategies to address existing installations that are outside the contract defects period and that involve longer-term solutions to addressing the problem. Such longer-term solutions are the topics of further abstracts at this conference.
VicRoads also presented issues of non-compliance to the Austroads Safety Barrier Assessment Panel (ASBAP) for consideration, as it is likely the problem would be common across all member authorities. A later industry forum hosted by ASBAP identified that the majority of the barrier installation and supply industry shared concerns for non-compliance issues, and wanted a level playing field when competing against “cowboy practices” irrespective of the member network on which they operated. Other road authorities are currently investigating how widespread this problem is within their specific network. Irrespective of how widespread the problem is, the installation of safety devices and systems should not be undertaken by unqualified personnel given peoples’ lives are at stake.
Specifically, the following issues and nonconformances as they affect permanent and temporary worksite barriers have been identified:
Cassar 3
• Design issues: - Inappropriate barrier and terminal selection, - Insufficient termination–transition between barrier systems, - Inappropriate barrier length of need, - Inappropriate consideration of run out area requirements, and - Not undertaking risk assessments when a conforming design is not possible.
• Installation–maintenance issues: - Incorrect barrier heights well outside specified tolerance, - Footings and anchors not in accordance with manufacturers minimum
requirements (particularly WRSB concrete anchors and post footings), - Omission and incorrect use of hardware and componentry, - WRSB rope tension well below manufacturers requirements, - Inappropriate offsets to batter hinge points, - Inconsistent post spacing or post spacing not in accordance with design
requirements, - Modifications to systems (to make it work or fit, e.g., cutting significant amounts
of guard fence posts when rock is encountered), - Incorrect deployment, and - Using unapproved products.
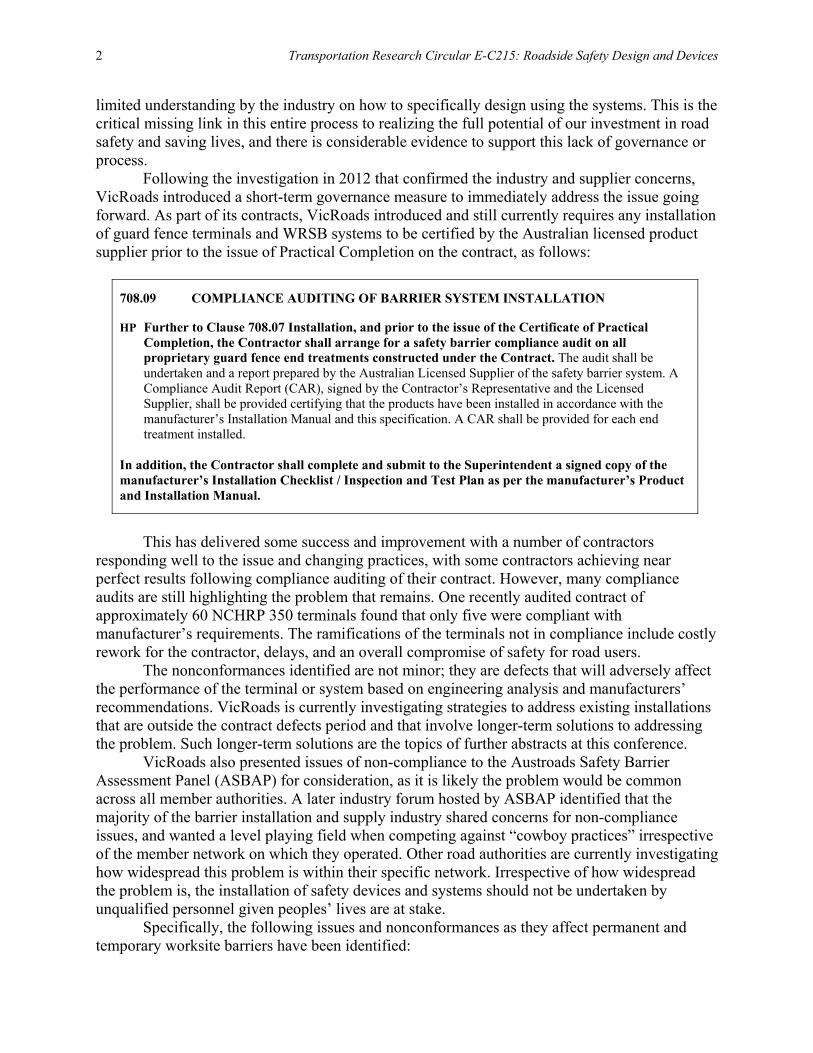
PERMANENT BARRIERS Years ago semirigid public domain guard fence and break away cable terminals dominated as the barrier system of choice because that was all that was available. The design standards were simple and remained unchanged for a long period of time. However, as road authorities have moved away from investing in research and development to make continual improvements to systems or developing new improved systems, companies have taken the opportunity to innovate and develop new proprietary products. But one has to ask whether the outcome is ideal given the problem that exists. While no one can argue that improving road safety through the development and improvement of new products is beneficial, one also has to ask whether the market has become inundated with different and more-complex systems, that the installation industry’s ability to keep up is difficult. The most common feedback received from contract administrators, designers, installers, and maintainers of the systems is that there are too many systems available and that some systems are so complex to design, or assemble and maintain, that the preference is to go to the simplest proprietary system that still yields the best outcome for road users. But then, even some installers are having difficulty with the simplest systems as well, as is evident in Figure 1 and Figure 2. This may be the inherent problem we realize in having too many systems to choose from, which may be a contributing factor towards the problem. The examples in Figures 1 and 2 represent a small sample of the current problem at large. VicRoads has documented thousands of these examples, which are common and in most cases would significantly reduce the effectiveness of the barrier or terminal. The example in Figure 1d was in place for over 6 months while work was undertaken on one of Victoria’s major freeways.
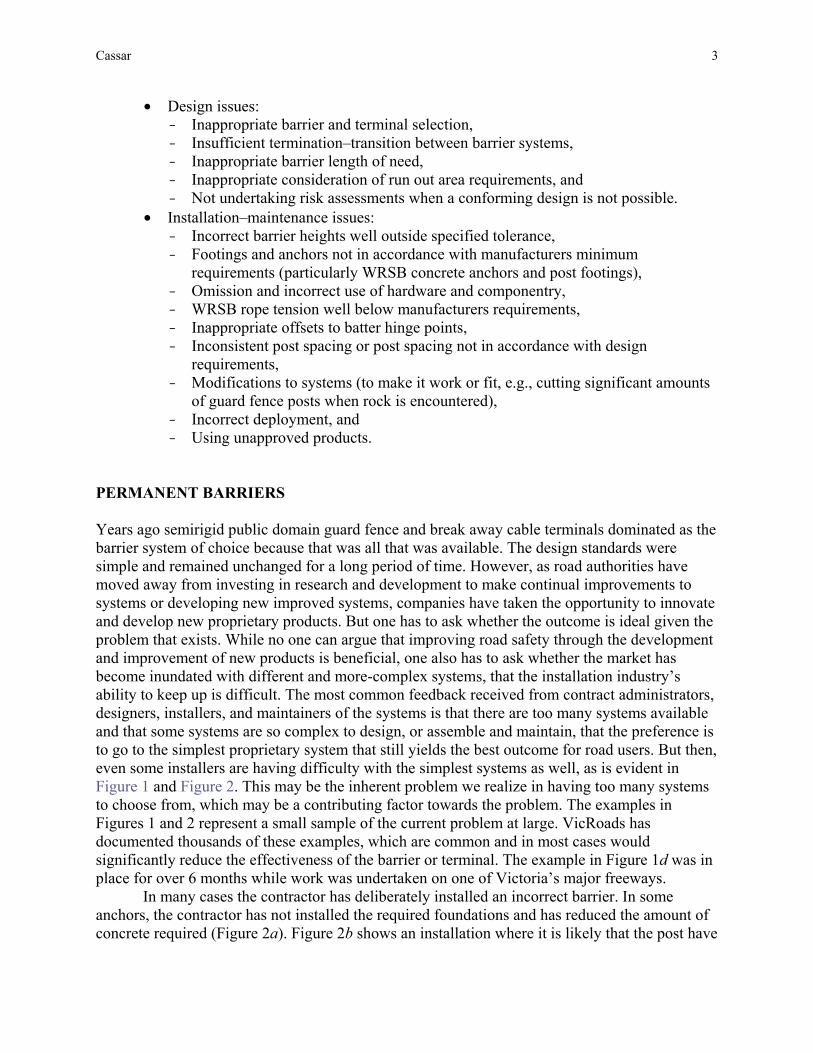
In many cases the contractor has deliberately installed an incorrect barrier. In some anchors, the contractor has not installed the required foundations and has reduced the amount of concrete required (Figure 2a). Figure 2b shows an installation where it is likely that the post have
4 Transportation Research Circular E-C215: Roadside Safety Design and Devices
(a) (b)
(c) (d)
FIGURE 1 Examples of poor installations: (a) the first rail protruding outward from the extruder head chute. The head will not appropriately extrude the rail as intended which
could cause spearing of the vehicle. (b) The slider bracket installed backwards on a terminal. The likely outcome is severe jamming of the terminal at the time of impact.
(c) Two different wire rope barriers have been intermixed. (d) A wire rope barrier has been temporarily restrained with a guard fence post.
hit rock and the post embedment was not sufficient. The solution was to cut off the posts. At times, a barrier is installed outside the standards as in Figure 2d. Here, The system may or may not work as intended as the posts may not have the lateral restraint. These installations will not operate as intended or as demonstrated in the crash tests. TEMPORARY WORKSITE BARRIERS No different to permanent barriers, temporary worksite barriers are considered for use based on crash testing performance, capacity, and operating characteristics. The effectiveness of each product to operate safely relies on users to understand and design worksites considering specific barrier characteristics and installation requirements. An important aspect is the consideration of those working behind such barriers, which are mostly exposed.
Cassar 5
(a) (b)
(c) (d) FIGURE 2 Additional examples of poor installations: (a) An inappropriate foundation size for
anchors. (b) The driven posts encountered rock below the surface and were cut off. (c) Guard fence installed behind a pole and with deadly fish tail terminals on each end.
(d) Inappropriately designed and installed WRSB far too close to the batter hinge point.
There is growing concern that many contractors, including those directly engaged by the road authority and those undertaking work adjacent to the road itself, are using temporary barrier products in ways that significantly compromise both worker safety and vehicle occupant safety. This is mostly prevalent in inner urban areas where sites are often restricted for space. What is further concerning is that some contractors are using products that have not been accepted for use in either Victoria or Australia, or were withdrawn from acceptance because of previous concerns.
Plastic water-filled devices, including both longitudinal barriers and terminals, are the most incorrectly used temporary barrier system based on our investigations. Systems are often not filled with water, not connected, have insufficient length to offer adequate protection, have unapproved modifications, have inadequate no-go zones behind them to allow for deflection, have no run-out area behind terminals, and others. Such practices demonstrate a lack of understanding by the industry about the performance characteristics of the systems. There is limited training available for the industry in this area. This is likely a combination of the following issues.
6 Transportation Research Circular E-C215: Roadside Safety Design and Devices
• Lack of industry understanding about the correct use of temporary systems. This includes contractors who use the systems and consultants who prepare traffic management plans prescribing their use.
• Restricted work zones preventing conforming installations being used. • Missing link between hire companies—or contractors—and lack of installation
information provided by the hire companies and the contacting staff who deploy the systems. • Variability in experience with roadside barriers for road safety auditors auditing traffic
management plans. • Lack of surveillance, experience, and necessary contract administration to understand
and control the issue.
The suppliers of temporary worksite barrier systems continue to raise shared concerns with road authorities about this issue with safety and reputation being their primary driver. VicRoads has recently reaffirmed its commitment to improved Worksite Safety and will be stepping its efforts up in this area.
The photos in Figure 3 and Figure 4 are a small representative sample of the magnitude of this issue over the last couple of years and months.
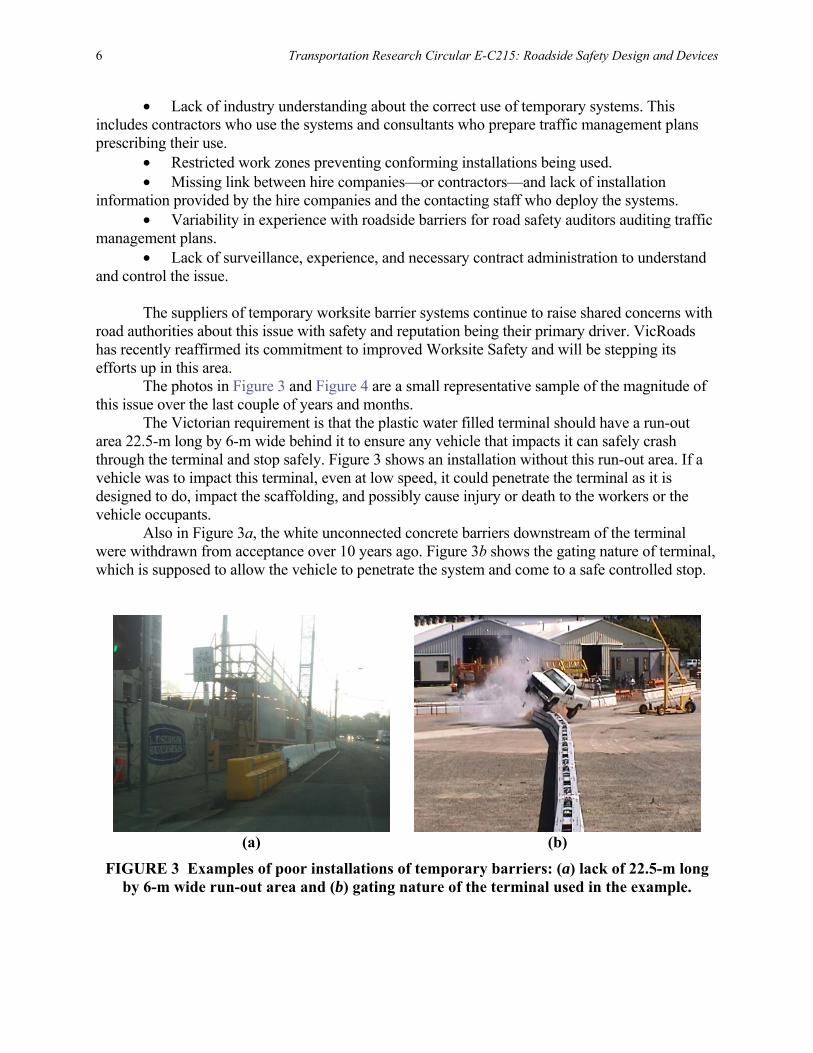
The Victorian requirement is that the plastic water filled terminal should have a run-out area 22.5-m long by 6-m wide behind it to ensure any vehicle that impacts it can safely crash through the terminal and stop safely. Figure 3 shows an installation without this run-out area. If a vehicle was to impact this terminal, even at low speed, it could penetrate the terminal as it is designed to do, impact the scaffolding, and possibly cause injury or death to the workers or the vehicle occupants.
Also in Figure 3a, the white unconnected concrete barriers downstream of the terminal were withdrawn from acceptance over 10 years ago. Figure 3b shows the gating nature of terminal, which is supposed to allow the vehicle to penetrate the system and come to a safe controlled stop.
(a) (b)
FIGURE 3 Examples of poor installations of temporary barriers: (a) lack of 22.5-m long by 6-m wide run-out area and (b) gating nature of the terminal used in the example.
Cassar 7
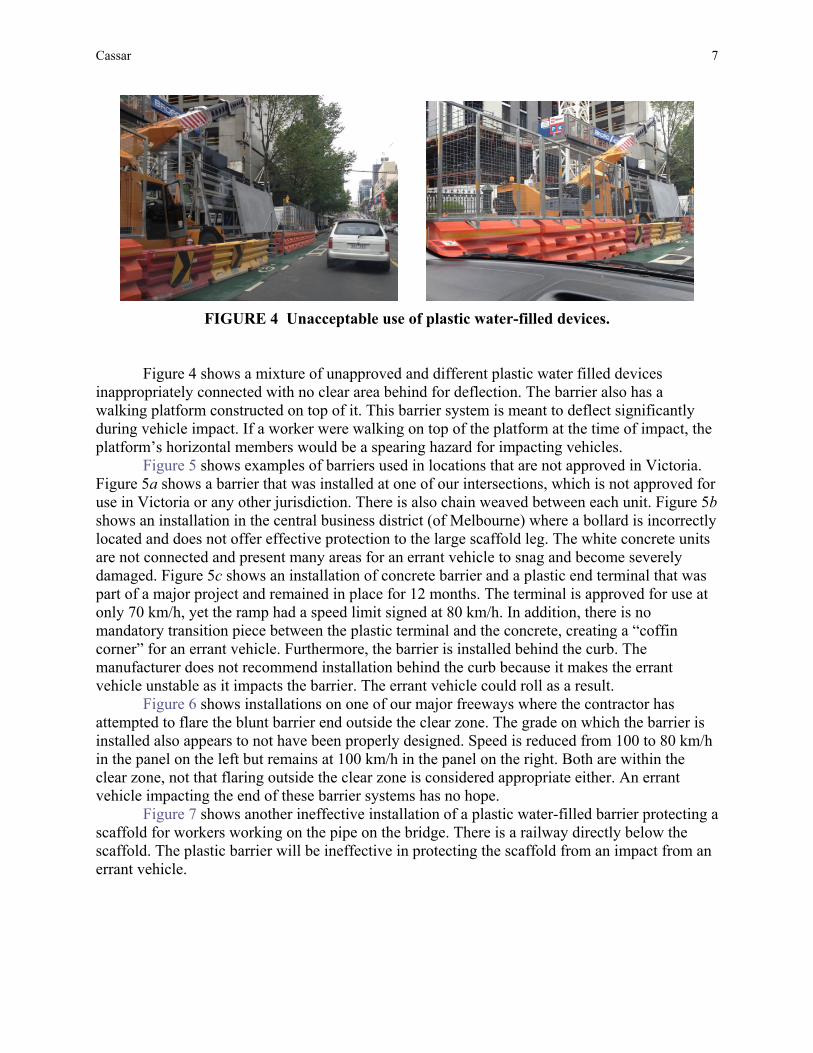
FIGURE 4 Unacceptable use of plastic water-filled devices.
Figure 4 shows a mixture of unapproved and different plastic water filled devices
inappropriately connected with no clear area behind for deflection. The barrier also has a walking platform constructed on top of it. This barrier system is meant to deflect significantly during vehicle impact. If a worker were walking on top of the platform at the time of impact, the platform’s horizontal members would be a spearing hazard for impacting vehicles.
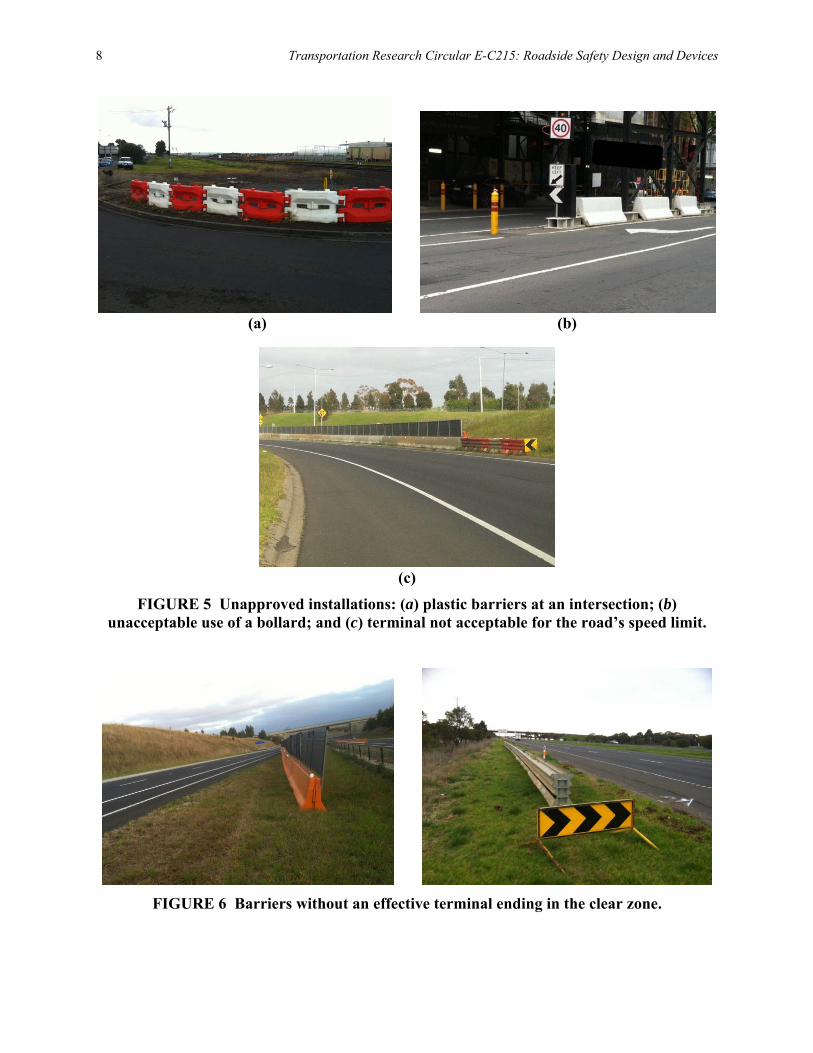
Figure 5 shows examples of barriers used in locations that are not approved in Victoria. Figure 5a shows a barrier that was installed at one of our intersections, which is not approved for use in Victoria or any other jurisdiction. There is also chain weaved between each unit. Figure 5b shows an installation in the central business district (of Melbourne) where a bollard is incorrectly located and does not offer effective protection to the large scaffold leg. The white concrete units are not connected and present many areas for an errant vehicle to snag and become severely damaged. Figure 5c shows an installation of concrete barrier and a plastic end terminal that was part of a major project and remained in place for 12 months. The terminal is approved for use at only 70 km/h, yet the ramp had a speed limit signed at 80 km/h. In addition, there is no mandatory transition piece between the plastic terminal and the concrete, creating a “coffin corner” for an errant vehicle. Furthermore, the barrier is installed behind the curb. The manufacturer does not recommend installation behind the curb because it makes the errant vehicle unstable as it impacts the barrier. The errant vehicle could roll as a result.
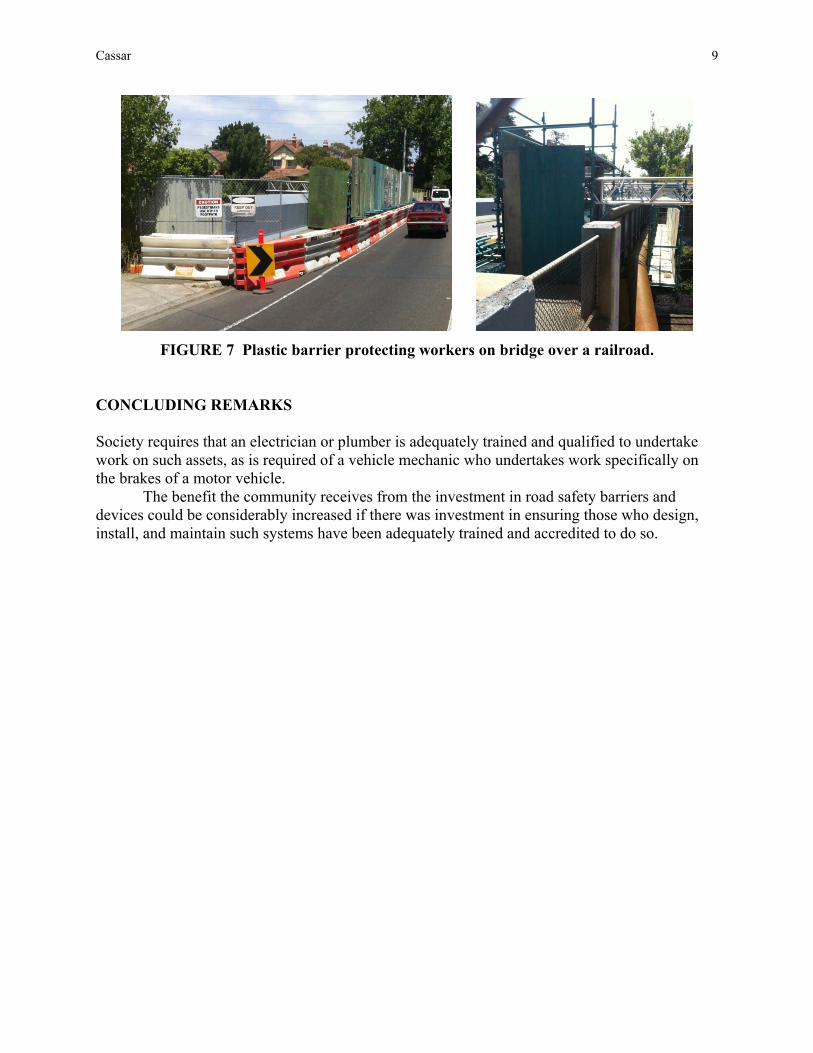
Figure 6 shows installations on one of our major freeways where the contractor has attempted to flare the blunt barrier end outside the clear zone. The grade on which the barrier is installed also appears to not have been properly designed. Speed is reduced from 100 to 80 km/h in the panel on the left but remains at 100 km/h in the panel on the right. Both are within the clear zone, not that flaring outside the clear zone is considered appropriate either. An errant vehicle impacting the end of these barrier systems has no hope.
Figure 7 shows another ineffective installation of a plastic water-filled barrier protecting a scaffold for workers working on the pipe on the bridge. There is a railway directly below the scaffold. The plastic barrier will be ineffective in protecting the scaffold from an impact from an errant vehicle.
8 Transportation Research Circular E-C215: Roadside Safety Design and Devices
(a) (b)
(c)
FIGURE 5 Unapproved installations: (a) plastic barriers at an intersection; (b) unacceptable use of a bollard; and (c) terminal not acceptable for the road’s speed limit.
FIGURE 6 Barriers without an effective terminal ending in the clear zone.
Cassar 9
FIGURE 7 Plastic barrier protecting workers on bridge over a railroad.
CONCLUDING REMARKS Society requires that an electrician or plumber is adequately trained and qualified to undertake work on such assets, as is required of a vehicle mechanic who undertakes work specifically on the brakes of a motor vehicle.
The benefit the community receives from the investment in road safety barriers and devices could be considerably increased if there was investment in ensuring those who design, install, and maintain such systems have been adequately trained and accredited to do so.
10
SESSION 1: ASSESSMENT PRACTICES
Sector Schemes What Are They and How Should They Be Used in Australia?
PAUL HANSEN
Working Party for National Training and Accreditation in the Safety Barrier Industry, Australia
n response to a nationally identified need to improve both the standard of safety barrier installation and maintenance works, in addressing community road safety, Roads and
Maritime Services (RMS) sponsored an industry forum in Parramatta convened by the Austroads Safety Barrier Assessment Panel (ASBAP) on August 21, 2013. The forum was well attended by 66 stakeholders concerned with manufacturing, supply, hiring and rental, installing, and maintaining safety barriers in Australia and New Zealand. There was overwhelming support at the forum for improvement to the industry.
Preference was expressed by the industry represented at the forum for a national system that not only ensured conformance across states but created uniform standards and “level playing field” for both construction and maintenance across Australia and New Zealand. The industry and road authorities felt the creation and adoption of a national training and accreditation scheme, not only for the installers, but for designers, engineers, surveillance personnel, and the associated and integral skills involved in deploying the correct safety hardware at the right location, constructed in accordance with standards, was paramount. Road safety of the community lies at the heart of this nationally identified need.
The issues identified at the Safety Barrier Industry Forum include the following: • An industry with no education training framework established at national level. • An industry with low levels of entry and no defined professional development path at
national level. • An industry with low personal immediate risk profile but the potential for serious
public risk due to poor workmanship or poor engineering control (design, supervision, auditing). • An industry where standards of work supervision and product auditing were variable
and at times either not recorded or not performed. • An industry where repair standards are rarely monitored and where maintenance
regimes are rarely organized or are rarely recorded. • An industry where few meaningful or consistent penalties for poor workmanship
(other than rework that involves wasted time and expense). • An industry with some parochial rules to limit competition to local companies and
deter competition from Interstate.
In response to this need to nationalize and standardize the safety barrier installation industry, a Working Party (WP) was formed by ASBAP from volunteers at the forum representing the industry and road authorities. This was a 14-person WP with representatives from all Australian states (apart from Tasmania) and, initially, two representatives from New Zealand.
I
Hansen 11
The WP findings are: 1. Training courses currently available in Australia and New Zealand were product-
specific courses and not delivered within an education framework for continuous personal development delivered within any national industry accreditation system.
2. The only national accreditation administrative system found in the English speaking and culturally similar civil engineering space is U.K. National Highways Sector Schemes (NHSS).
3. The particular NHSS 2B for Vehicle Restraint Systems (VRS) has been successfully organized and run by the U.K. not-for-profit company Lantra Awards for almost 30 years.
4. There are three nationally registered training organizations within the civil work space in Australia, namely, CivilTrain—the training arm of the Civil Contractors Federation; Coates Hire—for product training on rental equipment and HRIA—the Hire & Rental Industry Association.
5. The limited number of safety barrier training courses currently available were product-specific courses and not delivered within an education framework for continuous personal development nor delivered within any national industry accreditation system.
6. For a national scheme to be successful, the governments, through the road authorities, have to mandate that all installers and supervisors be trained in a process similar to NHSS 2B requirements, and that the accreditation be easily recognized at a work site.
7. A common national commencement date would be beneficial. 8. A fragmented state-by-state approach was not ideal and will not deliver a national
scheme in the short term.
Thus by November 2013 the WP had concluded: • To save reinventing the wheel, Australia may benefit from adopting a national
scheme for safety industry barrier training and accreditation. • The U.K. has the only culturally similar national scheme in an English language
framework. • 30 years ago the U.K. faced similar issues that exist in Australia now. • The British solution for industry training and accreditation is effective and is
responsive to changes in product, standards, laws and regulations. That this solution was known as NHSS 2B VRS.
• That the WP may benefit from assistance of the scheme administrator, Lantra Awards.
The WP made contact with staff at Lantra to establish the best method to move forward. Officials from the U.K. Highway Agency and a contractor working in the U.K. and Ireland, both verified Lantra’s credentials, in writing. SECTOR SCHEMES NHSS were created in 1980s to harmonize differing U.K. county technical standards into a single national standard for training and accreditation in alignment with quality assurance and quality
12 Transportation Research Circular E-C215: Roadside Safety Design and Devices
management scheme (QMS) standards. Sector schemes are bespoke QMS for organizations working on the U.K. road network designed to ensure a properly trained and competent workforce in the U.K.’s highways industry.
The sector schemes are based on the ISO 9001:2008 standards, but do not duplicate them, rather interpreting them specifically for highways maintenance activities to
• Provide an industry benchmark; • Ensure that all processes are planned; • Provide a basis for continuous improvement; • Focus on quality of training provision as an objective; • Reduce costs for client and suppliers; • Ensure a properly trained and competent workforce; and • Ensure that training providers are audited appropriately.
Each sector scheme is managed by a technical advisory committee that agrees on the
minimum levels of training and competency of operatives to meet the agreed standards for workmanship, services, products, and testing. The technical advisory committee has representation from
• Highway authorities, • Relevant trade associations, • Certification body (administrator), and • Industry.
Each sector scheme has a secretariat body (an administrator) to make sure that it achieves
this objective. In the U.K. there are 31 NHSSs with 14 administrative bodies supporting these schemes.
Key elements for the success of sector schemes has been • The technical experts from the industry agree a training standard and training
resource specifications. • The administrator independently assesses that training providers, their training
courses, their sites and their staff are of sufficient quality to deliver the training. • The administrator provides quality assurance on the delivery of training and also
issues certificates and cards as proof those individuals have reached a certain standard. • The industry agrees that only certified individuals can carry out the required work
and accepts an investigation system that is created by the administrator. • The accredited individuals need to maintain a level of skills and therefore have to
demonstrate continual professional development to retain their certification status—usually achieved through refresher training.
• The administrator works with all parties such that there is continual improvement and development of the training and workmanship standard.
Hansen 13
LANTRA AND NHSS 2B VEHICLE RESTRAINT SYSTEMS Sector scheme 2B VRS is the relevant sector scheme with regards to safety barrier industry accreditation. The scheme applies to all aspects of vehicle restraint systems (road safety barrier systems) made from a kit of parts manufactured off site, for example, the design, the installation, the audit, the maintenance, and the repair of a safety barrier.
The current administrator body for the 2B sector scheme is Lantra Awards (Lantra). Lantra also looks after seven other sector schemes, including the NHSS 5B Installation of Parapets for Road Restraint Systems.
Lantra is a not-for-profit organization that evolved from the National Fencing Training Association (NFTA). In the 1990s, the U.K. government required training centers to amalgamate, resulting in the NFTA combining with several land-based training organizations to form Lantra. Then in 1995 when NHSS 2B was created to separate highway safety fencing from the general fencing industry, Lantra continued the administrative role.
The administrator of sector scheme is expected to act in accordance with the memorandum of understanding (MOU) set out for the VRS technical committee. This MOU states in part that the purpose of the committee is to
• Provide and establish bespoke QMSs for industry, and to provide where appropriate
or requested industry experts for consultation. • Maintain and improve the NHSS 2B VRS in line with current best practices. • Liaise with other relevant NHSS committees. • Undertake regular reviews at intervals not exceeding 13 months of the operations of
the VRS industry in line with best practice and to benchmark the standards. • Provide regular updates to the NHSS Liaison Committee on the status of the Sector
Scheme 2B. • Liaise as necessary with relevant stakeholders.
BENEFITS OF THE SECTOR SCHEME MODEL FOR THE AUSTRALIA–NEW ZEALAND SAFETY BARRIER INDUSTRY It is anticipated that the safety barrier industry will benefit from a sector scheme basis. It is expected that the use of the scheme would
• Create national uniformity for the safety barrier industry; • Guarantee minimum standard of all practitioners in the industry; • Eliminate liability claims when the scheme is adhered to by practitioners; • Result in fewer deaths and serious injuries not only at the work site but for all road
users; • Result in fewer man hours lost reworking product or resolving conflicts (in design or
specification or construction details); and • Create career path lines defined and fostered by a clear continual professional
development program within a national educational framework.
14 Transportation Research Circular E-C215: Roadside Safety Design and Devices
KEY FACTORS IN RECOMMENDING AN AUSTRALIAN SCHEME ADMINISTRATOR The WP considered the following key factors supporting a Lantra-like scheme administrator:
• The scheme administrator should be experienced in the safety barrier industry. • The scheme administrator should be experienced in developing course work for
different environments and countries. • The scheme administrator should have the committees operational, the trainer training
completed, and be delivering the initial basic courses within short period of being established. • The scheme administrator should have experience in maintaining records of
candidates, trainers, training centers, specifications, standards, and a myriad of other data required for verification to the various quality standards.
• The scheme administrator should be audited at least annually against ISO 9001:2008. EXAMPLES OF ROLE CLASSIFICATION IN THE UNITED KINGDOM Each of the training courses below have their own series of training modules for each type of safety barrier:
• Laborer (role: to assist installers). • Installer (role: to work under the direction of the site supervisor). • Lead Installer (role: to sign off paperwork after agreeing a system is installed to
specification). • Supervisor (role: to ensure the installing teams are working safely and appropriately,
also to be the company representative on site). • Engineers–designers (role: to ensure that the compatibility of the safety barrier
system and the design can be reached without detriment to the integrity of the system). • Inspectors–auditors (role: to be able to correctly identify safety barrier systems and
required repair options, and place an accurate report back to the management team ready for the installing team to repair safely and efficiently).
• Instructors (training role: to be able to communicate the approved courses to the candidates in a manner which can be understood).
• Assessors (training role: to be able to understand the importance of correct and unbiased assessment decisions, and to understand and report against performance criteria in the national standards).
• Internal verifiers (role: to be able to understand the importance of correct and unbiased assessment decisions, and to understand and report against performance criteria in the national occupational standards, arrange standardization meetings for all assessors).
• External verifiers (role: to be able to understand the importance of correct and unbiased assessment decisions, understand and report against performance criteria in the national occupational standards, and to inspect and report on training and persons involved in the assessment decisions to the awarding body to which they are attached.
Hansen 15
HOW TRAINING AND ASSESSMENT IS FUNDED The working group recommends that the assessment be funded by
• Charging the training providers a fee to cover costs for training materials, auditing, and administration;
• Having candidates pay for their own cards and certificates which covers costs for database administration and card costs; and
• Having the committee consist of volunteers from and with a passion for the industry, incurring a cost in time rather than dollars.
A technical advisor is also needed to best execute a strategy of how to adopt and adapt in Australia and New Zealand. The technical advisor should have the following skills–knowledge:
• Understand both sector schemes and the safety barrier industry; • Be backed by an established U.K. awarding body that will help and guide the main
committee in Australia to ensure the training and assessment is fit for its designed purpose; • Can set the foundations to steer the committee’s growth to a place where the U.K.
sector scheme development is; • Can lead successfully from the beginning; and • Has knowledge of the local industry and governments to understand what is required
to adapt the U.K. experience to a successful scheme in Australia and New Zealand. PROGRESS OF THE ASBAP RECOMMENDATIONS A timeline of events and achievements is:
• August 2013, the RMS-ASBAP forum at Parramatta. • August 2013, the WP for National Training and Accreditation of Safety Barrier
Installers formed. • May 15, 2014, ASBAP-WP recommendations sent to Austroads Board. • June 26, 2014, ASBAP-WP recommendations considered by Austroads Board. The
report referred to the Chief Engineers Group (CEG) for review by December 2014. • December 2, 2014, WP writes to the Chief Engineer and the Chief Executive in each
state and New Zealand. • March 25, 2015, CEG recommendations to be considered by Austroads Board.
TIMETABLE TO INTRODUCE SECTOR SCHEME INTO AUSTRALIA A timeline of events to introduce a sector scheme in Australia is
1. Precontract requirements: namely, mandate must be in place either at the national level or at state level, and the terms of contract have to be agreed on.
16 Transportation Research Circular E-C215: Roadside Safety Design and Devices
2. Setting up period (from signing the contracts to start of courses) should be 6 to 12 months.
3. The transition period will probably be 2 years to allow everyone time to be trained in the basic course.
4. An initial contract period is a minimum of 8 years. This is the foundation period which will enable the scheme to be established, and allow for time to assess candidates with basic training over one 5-year period. Apart from the basic training course, it is expected that some advanced courses will be introduced and some product specific courses will be offered to enable the industry to develop talent and meet the expected demand for continuous personal development. ACKNOWLEDGMENTS
• Members of the WP: Rick Driscoll, Australian Road Barriers; Ian McLean, A1 Highways; John Annison, Coates Hire; Sue Walker, CSP Pacific; Kim Edmundson, Erections Western Australia; Graham Brown, Euro Civil; John Dignam, Ingal Civil Products; Casey Lee, Hill & Smith; Mike Mason, Mike Mason Fencing; Hamish Webb, Saferoads; Justin McCann, Safety Barrier Solutions; Daniel Cassar, Vicroads; plus the significant and on-going assistance of Peter Pavey, Ingal; and Ryan Findlayson, LB Australia, since inception.
• Lantra Awards Directors and Staff: Jennifer Walpole, Stephanie Craig-Smith, and Robert Tabor.
• Highways Agency NHSS representative Lance Williams.
17
SESSION 1: ASSESSMENT PRACTICES
Measuring Cable Tensions in Wire Rope Barriers During In-Service Conditions
NOEL O’CALLAGHAN
Department of Planning, Transport and Infrastructure, South Australia
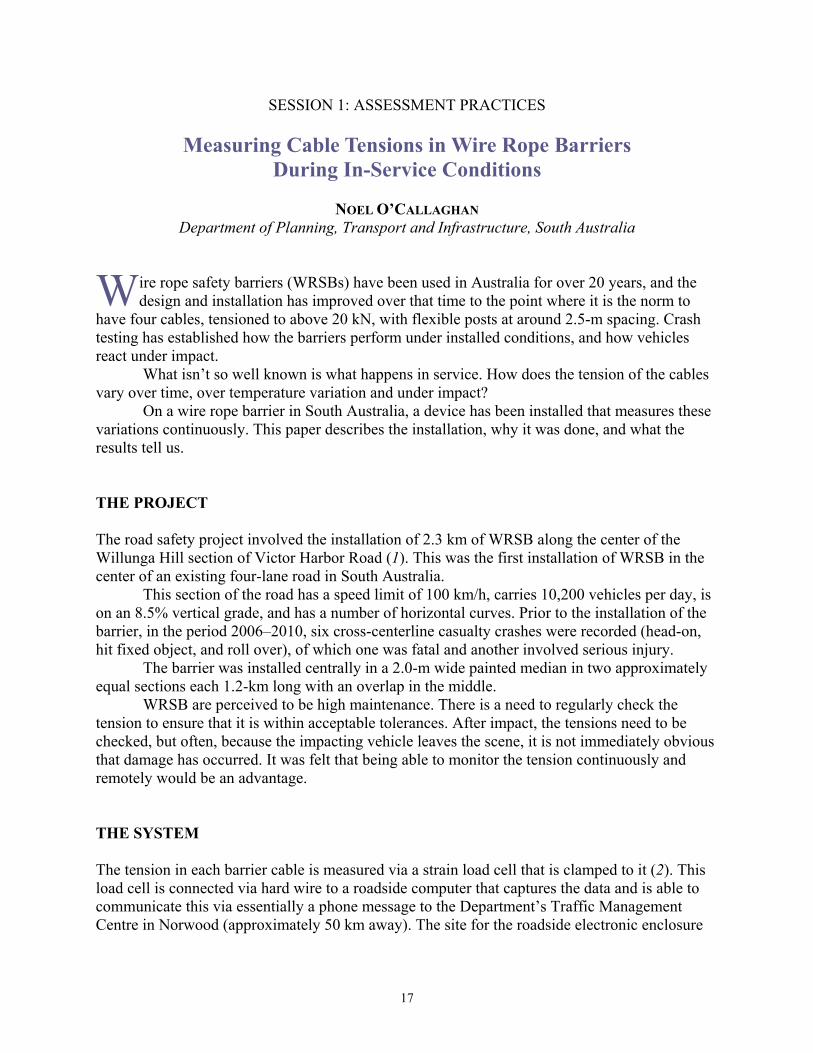
ire rope safety barriers (WRSBs) have been used in Australia for over 20 years, and the design and installation has improved over that time to the point where it is the norm to
have four cables, tensioned to above 20 kN, with flexible posts at around 2.5-m spacing. Crash testing has established how the barriers perform under installed conditions, and how vehicles react under impact.
What isn’t so well known is what happens in service. How does the tension of the cables vary over time, over temperature variation and under impact?
On a wire rope barrier in South Australia, a device has been installed that measures these variations continuously. This paper describes the installation, why it was done, and what the results tell us. THE PROJECT The road safety project involved the installation of 2.3 km of WRSB along the center of the Willunga Hill section of Victor Harbor Road (1). This was the first installation of WRSB in the center of an existing four-lane road in South Australia.
This section of the road has a speed limit of 100 km/h, carries 10,200 vehicles per day, is on an 8.5% vertical grade, and has a number of horizontal curves. Prior to the installation of the barrier, in the period 2006–2010, six cross-centerline casualty crashes were recorded (head-on, hit fixed object, and roll over), of which one was fatal and another involved serious injury.
The barrier was installed centrally in a 2.0-m wide painted median in two approximately equal sections each 1.2-km long with an overlap in the middle.
WRSB are perceived to be high maintenance. There is a need to regularly check the tension to ensure that it is within acceptable tolerances. After impact, the tensions need to be checked, but often, because the impacting vehicle leaves the scene, it is not immediately obvious that damage has occurred. It was felt that being able to monitor the tension continuously and remotely would be an advantage. THE SYSTEM The tension in each barrier cable is measured via a strain load cell that is clamped to it (2). This load cell is connected via hard wire to a roadside computer that captures the data and is able to communicate this via essentially a phone message to the Department’s Traffic Management Centre in Norwood (approximately 50 km away). The site for the roadside electronic enclosure
W
18 Transportation Research Circular E-C215: Roadside Safety Design and Devices
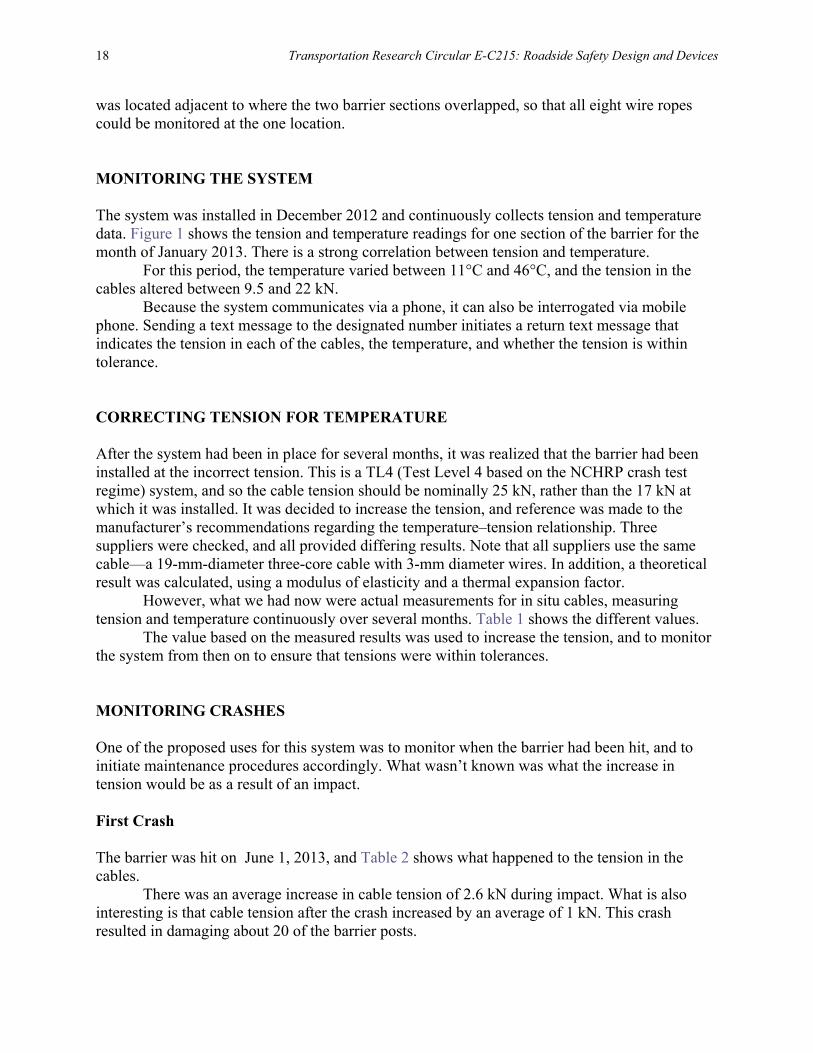
was located adjacent to where the two barrier sections overlapped, so that all eight wire ropes could be monitored at the one location. MONITORING THE SYSTEM The system was installed in December 2012 and continuously collects tension and temperature data. Figure 1 shows the tension and temperature readings for one section of the barrier for the month of January 2013. There is a strong correlation between tension and temperature.
For this period, the temperature varied between 11°C and 46°C, and the tension in the cables altered between 9.5 and 22 kN.
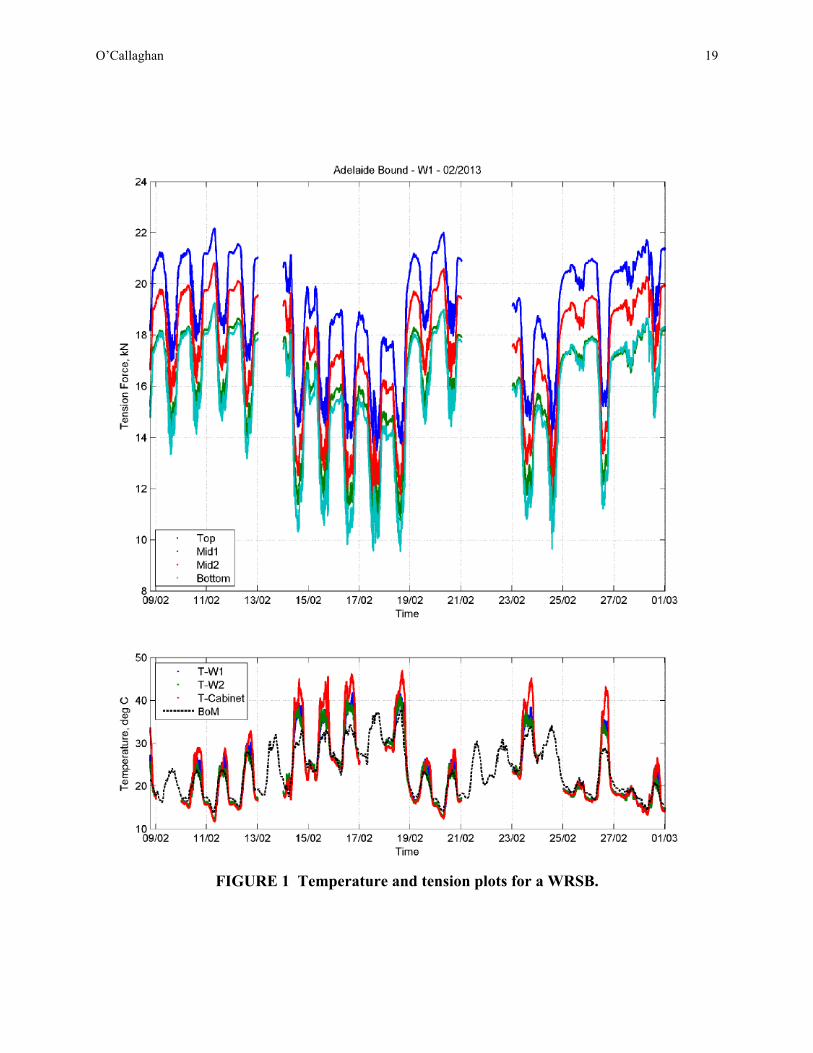
Because the system communicates via a phone, it can also be interrogated via mobile phone. Sending a text message to the designated number initiates a return text message that indicates the tension in each of the cables, the temperature, and whether the tension is within tolerance. CORRECTING TENSION FOR TEMPERATURE After the system had been in place for several months, it was realized that the barrier had been installed at the incorrect tension. This is a TL4 (Test Level 4 based on the NCHRP crash test regime) system, and so the cable tension should be nominally 25 kN, rather than the 17 kN at which it was installed. It was decided to increase the tension, and reference was made to the manufacturer’s recommendations regarding the temperature–tension relationship. Three suppliers were checked, and all provided differing results. Note that all suppliers use the same cable—a 19-mm-diameter three-core cable with 3-mm diameter wires. In addition, a theoretical result was calculated, using a modulus of elasticity and a thermal expansion factor.
However, what we had now were actual measurements for in situ cables, measuring tension and temperature continuously over several months. Table 1 shows the different values.
The value based on the measured results was used to increase the tension, and to monitor the system from then on to ensure that tensions were within tolerances. MONITORING CRASHES One of the proposed uses for this system was to monitor when the barrier had been hit, and to initiate maintenance procedures accordingly. What wasn’t known was what the increase in tension would be as a result of an impact. First Crash The barrier was hit on June 1, 2013, and Table 2 shows what happened to the tension in the cables.
There was an average increase in cable tension of 2.6 kN during impact. What is also interesting is that cable tension after the crash increased by an average of 1 kN. This crash resulted in damaging about 20 of the barrier posts.
O’Callaghan 19
FIGURE 1 Temperature and tension plots for a WRSB.
20 Transportation Research Circular E-C215: Roadside Safety Design and Devices
TABLE 1 Recommended and Measured Tension Changes for Different Temperatures Source Tension Change (kN) per 1°C Temperature Change Brifen 0.55 Flexfence 0.29 Armorwire 0.31 Calculated 0.35 Measured 0.23
TABLE 2 Tension Changes During Impact: First Crash
Cable Rope Tension kN
Before During After Pulse Top 23.4 25.9 24.0 2.5 2nd 19.1 22.0 20.5 2.9 3rd 21.6 23.5 21.9 1.9 Bottom 20.1 23.1 21.8 3.0
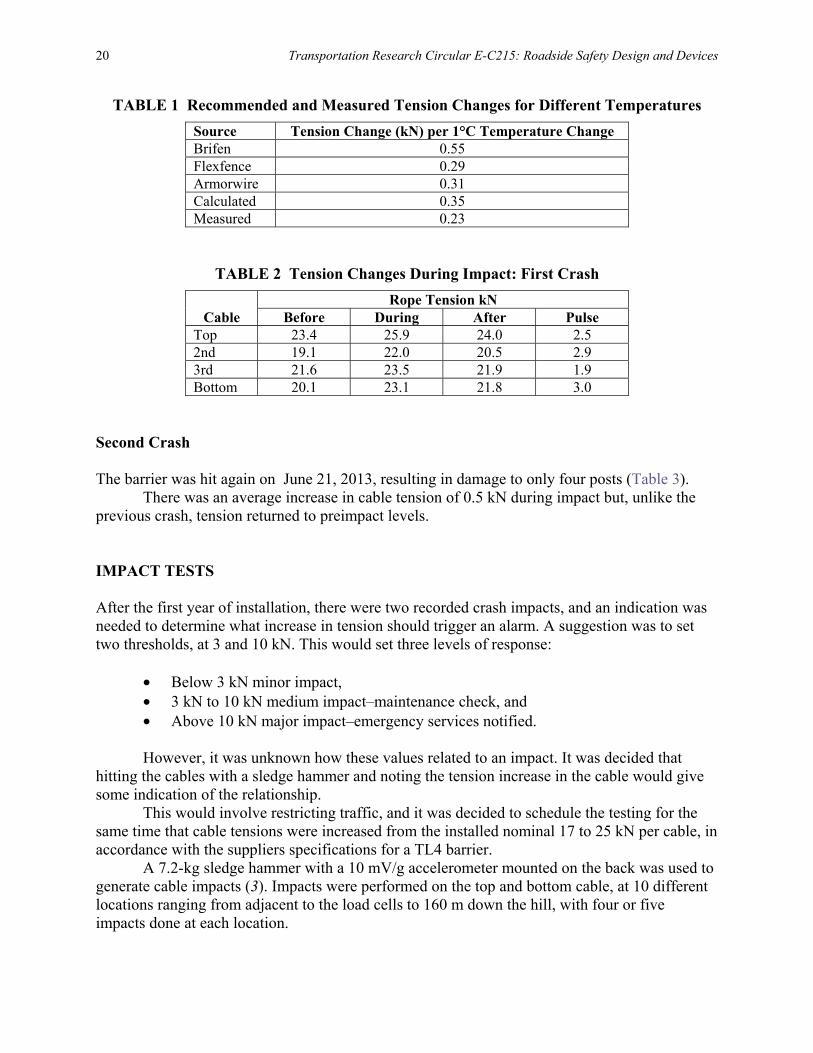
Second Crash The barrier was hit again on June 21, 2013, resulting in damage to only four posts (Table 3).
There was an average increase in cable tension of 0.5 kN during impact but, unlike the previous crash, tension returned to preimpact levels. IMPACT TESTS After the first year of installation, there were two recorded crash impacts, and an indication was needed to determine what increase in tension should trigger an alarm. A suggestion was to set two thresholds, at 3 and 10 kN. This would set three levels of response:
• Below 3 kN minor impact, • 3 kN to 10 kN medium impact–maintenance check, and • Above 10 kN major impact–emergency services notified. However, it was unknown how these values related to an impact. It was decided that
hitting the cables with a sledge hammer and noting the tension increase in the cable would give some indication of the relationship.
This would involve restricting traffic, and it was decided to schedule the testing for the same time that cable tensions were increased from the installed nominal 17 to 25 kN per cable, in accordance with the suppliers specifications for a TL4 barrier.
A 7.2-kg sledge hammer with a 10 mV/g accelerometer mounted on the back was used to generate cable impacts (3). Impacts were performed on the top and bottom cable, at 10 different locations ranging from adjacent to the load cells to 160 m down the hill, with four or five impacts done at each location.
O’Callaghan 21
TABLE 3 Tension Changes During Impact: Second Crash Rope Tension kN
Cable Before During After Pulse Top 22.8 23.4 22.8 0.6 2nd 20.5 21.0 20.5 0.5 3rd 21.3 21.8 21.3 0.5 Bottom 18.1 18.4 18.1 0.3
TABLE 4 Tension Increases from an Impact with a Sledge Hammer Distance from Cell
(m) Hammer Impact
(kN) Cable Tension Increase
(kN) Tension increase per
Impact force (kN) 0 3.8 2.00 0.57
20 3.5 0.89 0.24 40 4.5 1.50 0.33 60 4.5 1.70 0.36 80 5.4 1.20 0.23 80 5.0 0.71 0.14
100 5.5 0.64 0.12 120 4.8 0.43 0.09 140 5.6 0.43 0.08 160 5.3 0.36 0.6
The magnitude of the impacts was in the range of 3 to 5 kN, and the response in the range of 0.2 to 2 kN per cable. The significant observation was that the response in the cable tension dropped markedly as distance from the load cells increased. Table 4 shows the response to hits on the top cable.
It is estimated from this trend that, at a distance of about 300 m from the load cells, the tension response in the cables would be negligible.
This effect was emphasized when, after the impact tests were performed, retensioning of the cable was performed, with the tensions monitored at the load cell site.
Tensioning was commenced at the lower end of the barrier installation. The length is about 1.2 km, with tensioning panels every 300 m. When tension was increased at the first and second panels, from 17 to 25 kN, no increase in tension was recorded by the tension monitoring load cells. It was only when the cables were tightened at the top panel that the tension could be detected by the load cells.
The conclusion is that the use of the load cells to indicate when the barrier has been impacted is limited.
No impact has been recorded by the cells in the past year. There was one impact in October 2014 at the far end of one of the barriers, and the increase in tension was not enough to trigger the alarm.
22 Transportation Research Circular E-C215: Roadside Safety Design and Devices
CONCLUSIONS It is concluded that
• Monitoring the tension and temperature has enabled a more realistic tension to be set at the time of installation.
• Remote monitoring has the potential to limit the amount of on-road tension checking. • Remote monitoring has limited use as a crash indicator.
REFERENCES 1. Anderson, C. Median Wire Rope Safety Barrier—Willunga Hill. Department of Planning, Transport
and Infrastructure Internal Report, 2013. 2. Dua, A. Wire Rope Barrier Monitoring System (Load Cell Communication): An Overview.
Department of Planning, Transport and Infrastructure Internal Report, 2013. 3. Cowley, A. WRSB Impact Tests. Vipac Report 2014.
23
SESSION 2: WORK ZONE SAFETY
The Importance of Proven and Tested Positive Protection in Work Zones
STEVE JOHNSON
Lindsay Transportation Solutions, Singapore
he use of positive work zone protection is an issue of balancing the cost versus the level of safety offered. At times positive protection in work zones is not provided because the project
is of short duration. Road authorities need to understand the characteristics of different barrier options in order to select the appropriate barrier type.
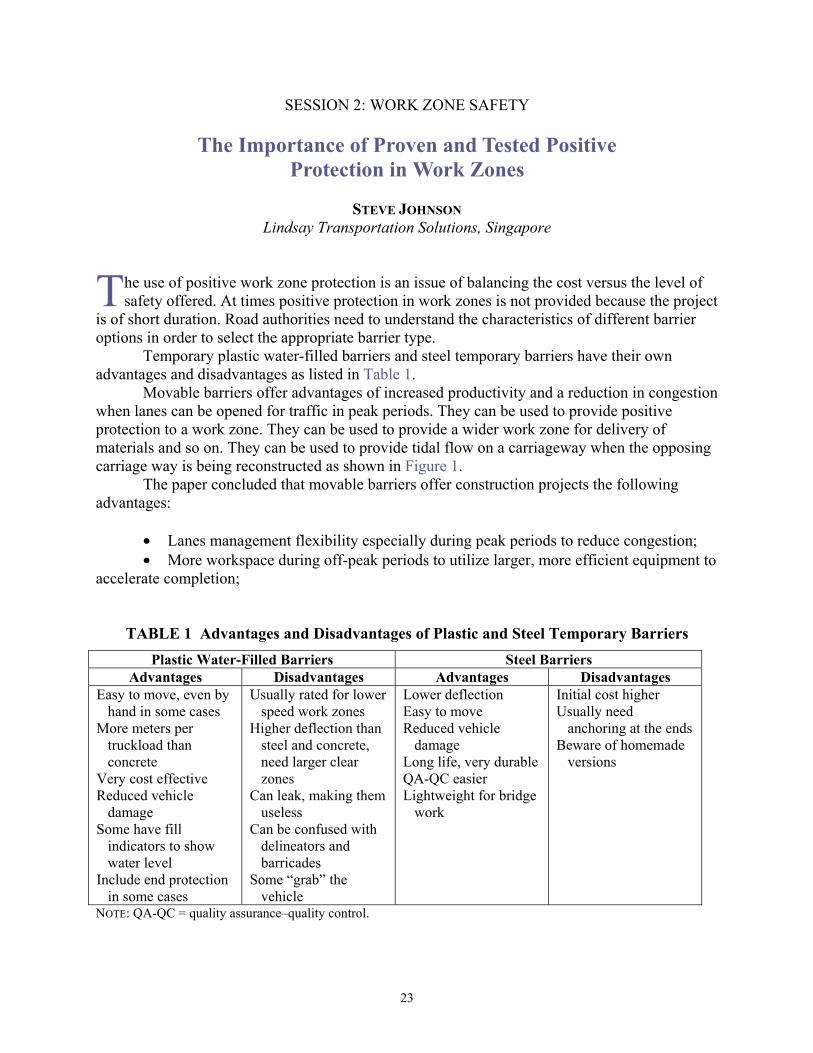
Temporary plastic water-filled barriers and steel temporary barriers have their own advantages and disadvantages as listed in Table 1.
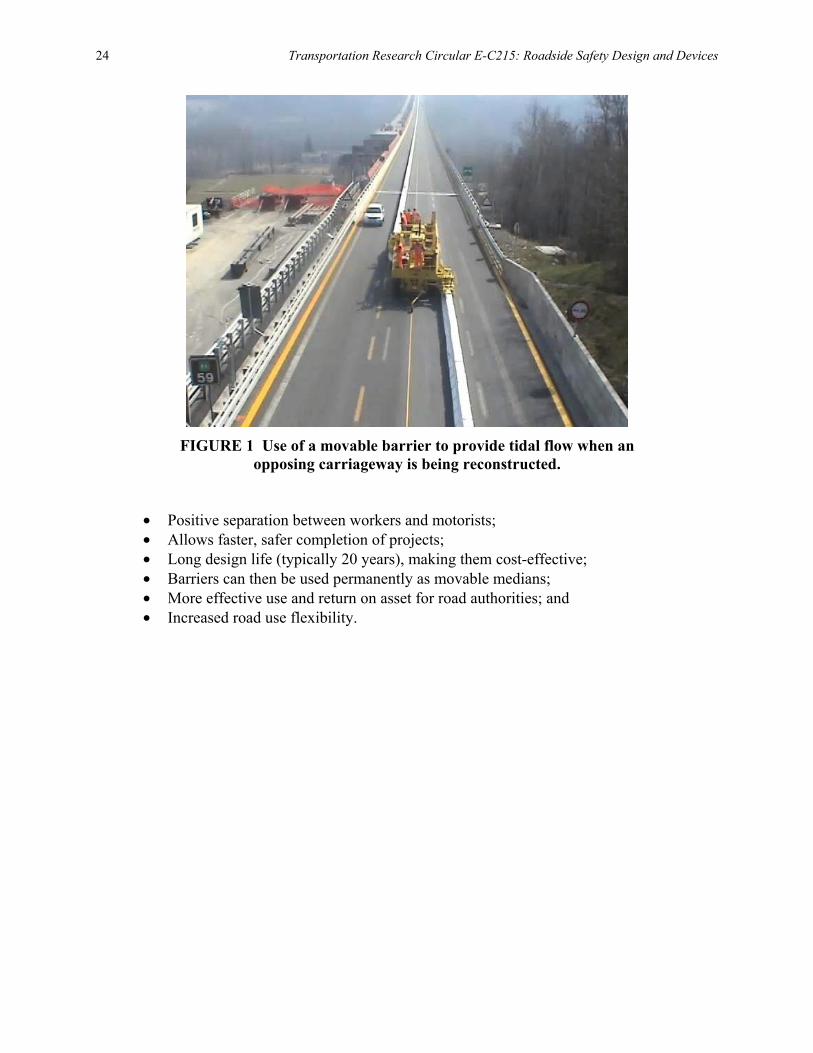
Movable barriers offer advantages of increased productivity and a reduction in congestion when lanes can be opened for traffic in peak periods. They can be used to provide positive protection to a work zone. They can be used to provide a wider work zone for delivery of materials and so on. They can be used to provide tidal flow on a carriageway when the opposing carriage way is being reconstructed as shown in Figure 1.
The paper concluded that movable barriers offer construction projects the following advantages:
• Lanes management flexibility especially during peak periods to reduce congestion; • More workspace during off-peak periods to utilize larger, more efficient equipment to
accelerate completion;
TABLE 1 Advantages and Disadvantages of Plastic and Steel Temporary Barriers Plastic Water-Filled Barriers Steel Barriers
Advantages Disadvantages Advantages Disadvantages Easy to move, even by
hand in some cases More meters per
truckload than concrete
Very cost effective Reduced vehicle
damage Some have fill
indicators to show water level
Include end protection in some cases
Usually rated for lower speed work zones
Higher deflection than steel and concrete, need larger clear zones
Can leak, making them useless
Can be confused with delineators and barricades
Some “grab” the vehicle
Lower deflection Easy to move Reduced vehicle
damage Long life, very durable QA-QC easier Lightweight for bridge
work
Initial cost higher Usually need
anchoring at the ends Beware of homemade
versions
NOTE: QA-QC = quality assurance–quality control.
T
24 Transportation Research Circular E-C215: Roadside Safety Design and Devices
FIGURE 1 Use of a movable barrier to provide tidal flow when an
opposing carriageway is being reconstructed. • Positive separation between workers and motorists; • Allows faster, safer completion of projects; • Long design life (typically 20 years), making them cost-effective; • Barriers can then be used permanently as movable medians; • More effective use and return on asset for road authorities; and • Increased road use flexibility.
25
SESSION 2: WORK ZONE SAFETY
Recent Developments in Portable Longitudinal Barriers for Work Zones
BEN DUNCKER
Highway Care Ltd, United Kingdom
ver the last half-decade Australia and New Zealand have undergone significant changes in the understanding, use and availability of tested work zone barriers. Existing work zone
barrier systems, which have been the mainstay of the market such as plastic water-filled devices and nonproprietary concrete barriers, have begun to be replaced by proprietary systems.
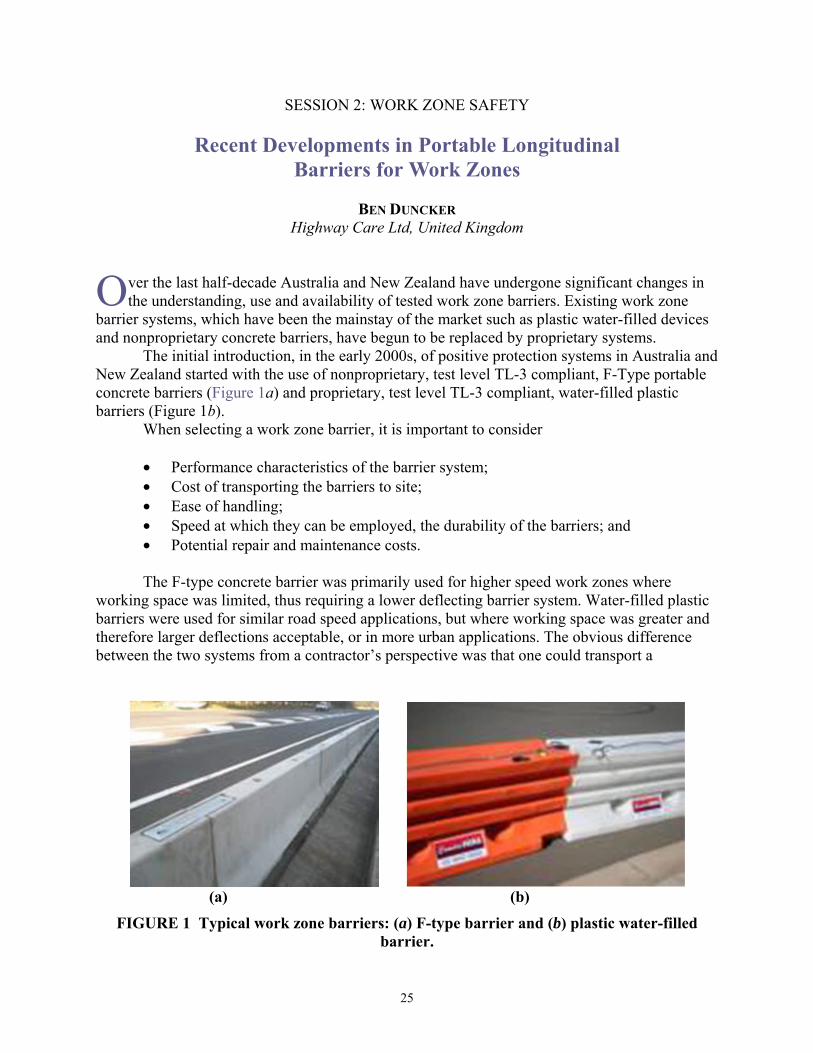
The initial introduction, in the early 2000s, of positive protection systems in Australia and New Zealand started with the use of nonproprietary, test level TL-3 compliant, F-Type portable concrete barriers (Figure 1a) and proprietary, test level TL-3 compliant, water-filled plastic barriers (Figure 1b).
When selecting a work zone barrier, it is important to consider
• Performance characteristics of the barrier system; • Cost of transporting the barriers to site; • Ease of handling; • Speed at which they can be employed, the durability of the barriers; and • Potential repair and maintenance costs.
The F-type concrete barrier was primarily used for higher speed work zones where
working space was limited, thus requiring a lower deflecting barrier system. Water-filled plastic barriers were used for similar road speed applications, but where working space was greater and therefore larger deflections acceptable, or in more urban applications. The obvious difference between the two systems from a contractor’s perspective was that one could transport a
(a) (b)
FIGURE 1 Typical work zone barriers: (a) F-type barrier and (b) plastic water-filled barrier.
O
26 Transportation Research Circular E-C215: Roadside Safety Design and Devices
significantly higher volume of plastic barriers on a truck when compared to concrete barriers, in most cases up to four or five times more, e.g., 200 linear meters of plastic barrier compared to 20 to 30 linear meters of concrete barrier.
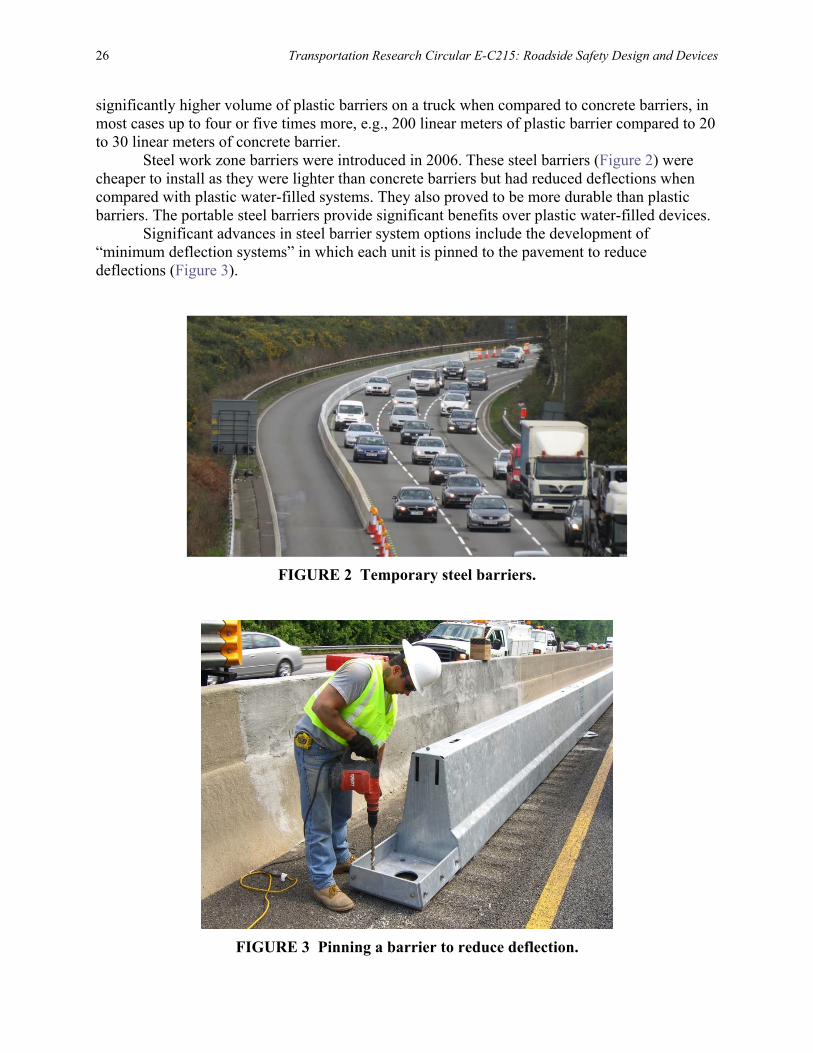
Steel work zone barriers were introduced in 2006. These steel barriers (Figure 2) were cheaper to install as they were lighter than concrete barriers but had reduced deflections when compared with plastic water-filled systems. They also proved to be more durable than plastic barriers. The portable steel barriers provide significant benefits over plastic water-filled devices.
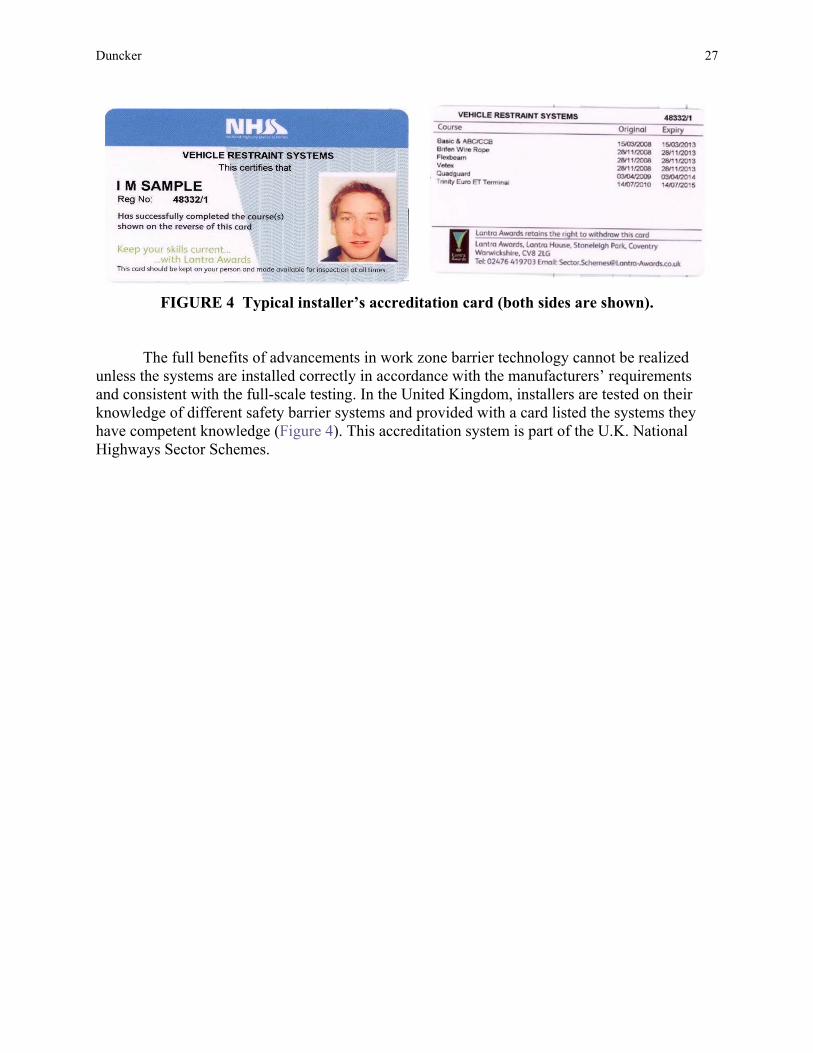
Significant advances in steel barrier system options include the development of “minimum deflection systems” in which each unit is pinned to the pavement to reduce deflections (Figure 3).
FIGURE 2 Temporary steel barriers.
FIGURE 3 Pinning a barrier to reduce deflection.
Duncker 27
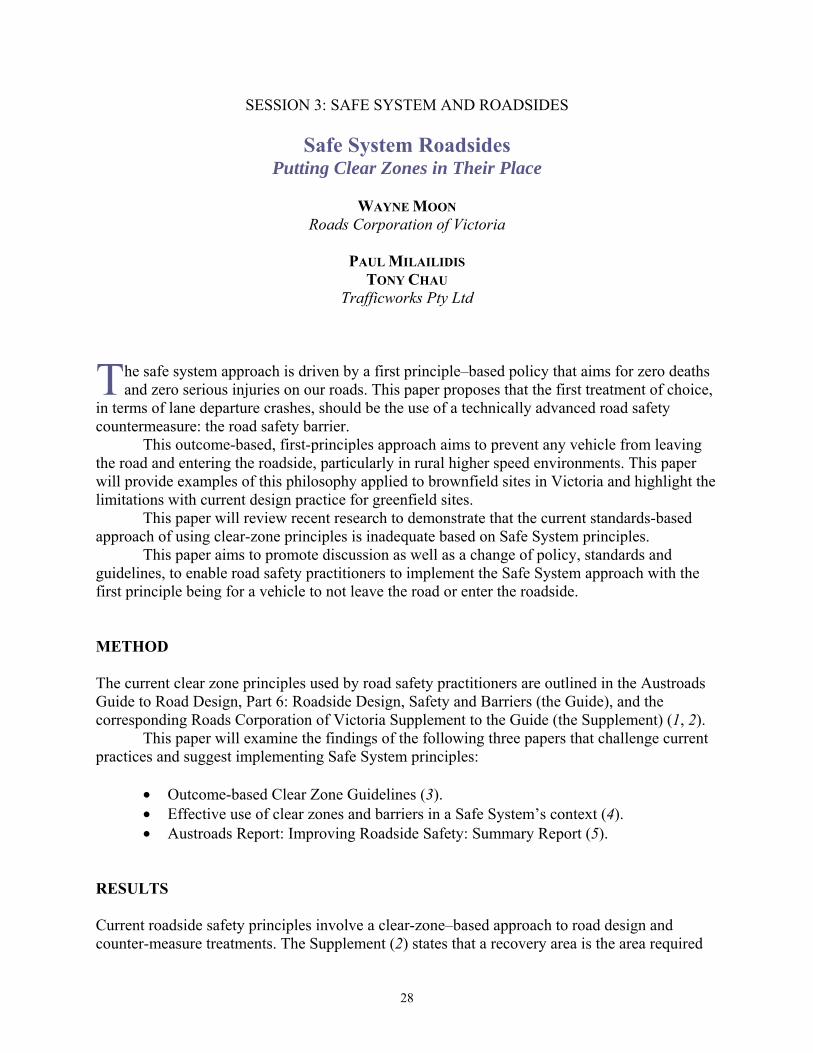
FIGURE 4 Typical installer’s accreditation card (both sides are shown).
The full benefits of advancements in work zone barrier technology cannot be realized unless the systems are installed correctly in accordance with the manufacturers’ requirements and consistent with the full-scale testing. In the United Kingdom, installers are tested on their knowledge of different safety barrier systems and provided with a card listed the systems they have competent knowledge (Figure 4). This accreditation system is part of the U.K. National Highways Sector Schemes.
28
SESSION 3: SAFE SYSTEM AND ROADSIDES
Safe System Roadsides Putting Clear Zones in Their Place
WAYNE MOON
Roads Corporation of Victoria
PAUL MILAILIDIS TONY CHAU
Trafficworks Pty Ltd
he safe system approach is driven by a first principle–based policy that aims for zero deaths and zero serious injuries on our roads. This paper proposes that the first treatment of choice,
in terms of lane departure crashes, should be the use of a technically advanced road safety countermeasure: the road safety barrier.
This outcome-based, first-principles approach aims to prevent any vehicle from leaving the road and entering the roadside, particularly in rural higher speed environments. This paper will provide examples of this philosophy applied to brownfield sites in Victoria and highlight the limitations with current design practice for greenfield sites.
This paper will review recent research to demonstrate that the current standards-based approach of using clear-zone principles is inadequate based on Safe System principles.
This paper aims to promote discussion as well as a change of policy, standards and guidelines, to enable road safety practitioners to implement the Safe System approach with the first principle being for a vehicle to not leave the road or enter the roadside. METHOD The current clear zone principles used by road safety practitioners are outlined in the Austroads Guide to Road Design, Part 6: Roadside Design, Safety and Barriers (the Guide), and the corresponding Roads Corporation of Victoria Supplement to the Guide (the Supplement) (1, 2).
This paper will examine the findings of the following three papers that challenge current practices and suggest implementing Safe System principles:
• Outcome-based Clear Zone Guidelines (3). • Effective use of clear zones and barriers in a Safe System’s context (4). • Austroads Report: Improving Roadside Safety: Summary Report (5).
RESULTS Current roadside safety principles involve a clear-zone–based approach to road design and counter-measure treatments. The Supplement (2) states that a recovery area is the area required
T
Moon, Milailidis, and Chau 29
for errant vehicles leaving the carriageway to regain control or stop safely. To achieve a reasonable degree of safety, the Guide recommends that road designers use an area smaller than the recovery area—a clear zone.
The clear zone, according to the Guide, is a compromise between the recovery area required by an errant vehicle, the cost of providing this area, and the probability of an errant vehicle encountering a hazard in this area. The clear zone should be kept free of nonfrangible hazards where economically and environmentally possible. The Guide does recommend that if a major hazard (one that is likely to cause serious injury or death) is present just beyond the clear zone, treatment of this hazard must be considered even though it is outside the defined clear zone.
In the Guide, clear zone widths range between 3.0 to 14.0 m from the edge of the traffic lane. The Guide does note, however, that where a specific investigation indicates a high probability of continuing crashes, then the clear zone widths may be greater than those listed.
The Supplement states that about 80% to 85% of vehicles traveling at 100 km/h can regain control or recover in a width of about 9 m when measured from the edge of the traffic lane. The Supplement also states, however, that the clear zone required to enable the recovery of 100% of vehicles is substantially wider and generally impractical to achieve. This is impractical as a greater clear zone requires a wider area beside the road which in turn, substantially increases the cost of providing a road, even for a modest percentile increase. As such, the incremental risk reduction afforded by increasing the width of the area does not generally warrant the expense.
Nevertheless, the first principle in current road safety practice, when following the Guide, is to manage roadside hazards primarily by hazard removal in the context of clear zone widths. In contrast, the above-mentioned papers conclude that current clear zones need to be significantly wider to meet Safe System principles, as regaining control once off the road is unlikely.
A review of the latest research into clear zones undertaken by Monash University of Accident Research (MUARC), Centre of Automotive Safety Research (CASR) and Australian Road Research Board (ARRB) is outlined below. MONASH UNIVERSITY OF ACCIDENT RESEARCH The research into clear zone guidelines titled Outcome-Based Clear-Zone Guidelines (3) states that Victoria’s largest category of road trauma continues to involve errant vehicles leaving the roadway, resulting in death or serious injury, with over 50% of deaths on rural roadways occurring as a result of vehicles running off the road.
MUARC’s research involved a theoretical assessment of vehicles leaving the roadway at varying departure angles, for varying speeds, to determine the lateral displacement and the resultant impact speeds. This was undertaken as a means of establishing an outcome-based approach to determining appropriate clear-zone guidelines on a case-by-case basis in Victoria.
The research showed that for 9-m clear-zones, with a driver reaction time of 2.5 s (based on rural roads where longer distances, drowsiness, and fatigue are factors or more appropriately, for guidelines to consider the best case scenario), leaving the roadway at a speed of 100 km/h and regardless of the departure angle, all crashes would likely result in death to the occupants of an errant vehicle.
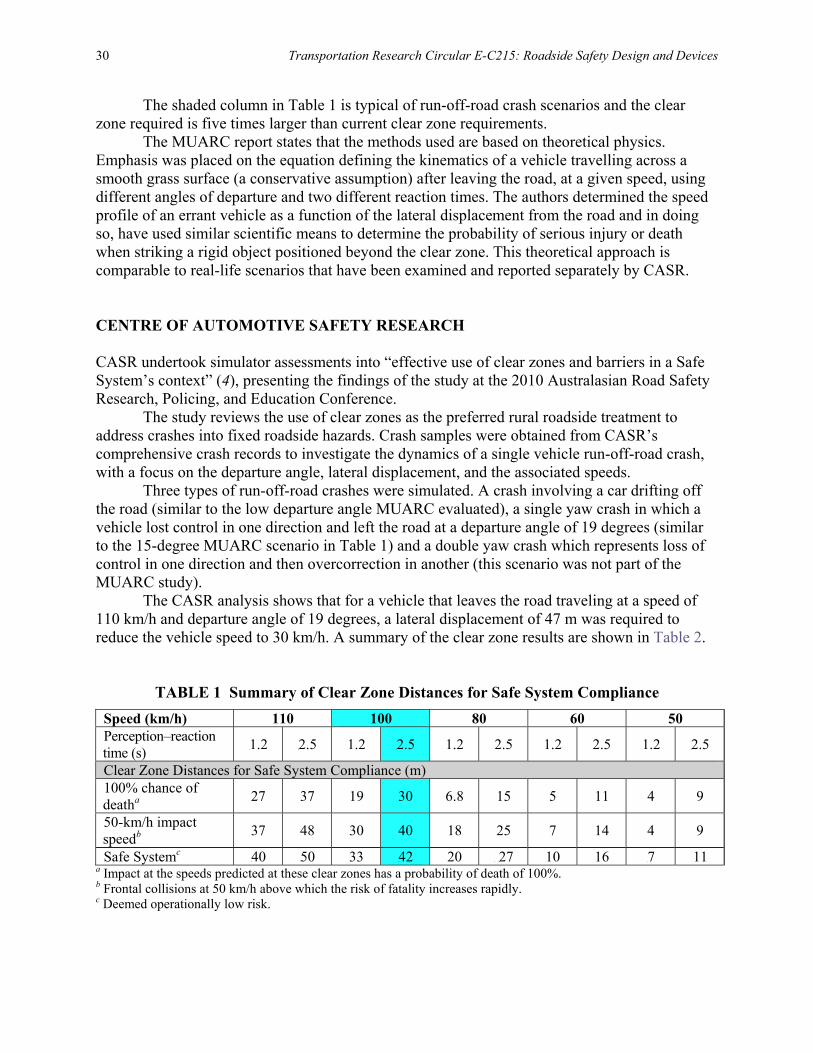
MUARC evaluated a range of departure angles, which included 5, 10, 15, 25, and 45 degrees using reaction times of 1.2 and 2.5 s for various speed limits. In summary, this data can best be reflected in Table 1 for the 15-degree angle of departure scenario:
30 Transportation Research Circular E-C215: Roadside Safety Design and Devices
The shaded column in Table 1 is typical of run-off-road crash scenarios and the clear zone required is five times larger than current clear zone requirements.
The MUARC report states that the methods used are based on theoretical physics. Emphasis was placed on the equation defining the kinematics of a vehicle travelling across a smooth grass surface (a conservative assumption) after leaving the road, at a given speed, using different angles of departure and two different reaction times. The authors determined the speed profile of an errant vehicle as a function of the lateral displacement from the road and in doing so, have used similar scientific means to determine the probability of serious injury or death when striking a rigid object positioned beyond the clear zone. This theoretical approach is comparable to real-life scenarios that have been examined and reported separately by CASR. CENTRE OF AUTOMOTIVE SAFETY RESEARCH CASR undertook simulator assessments into “effective use of clear zones and barriers in a Safe System’s context” (4), presenting the findings of the study at the 2010 Australasian Road Safety Research, Policing, and Education Conference.
The study reviews the use of clear zones as the preferred rural roadside treatment to address crashes into fixed roadside hazards. Crash samples were obtained from CASR’s comprehensive crash records to investigate the dynamics of a single vehicle run-off-road crash, with a focus on the departure angle, lateral displacement, and the associated speeds.
Three types of run-off-road crashes were simulated. A crash involving a car drifting off the road (similar to the low departure angle MUARC evaluated), a single yaw crash in which a vehicle lost control in one direction and left the road at a departure angle of 19 degrees (similar to the 15-degree MUARC scenario in Table 1) and a double yaw crash which represents loss of control in one direction and then overcorrection in another (this scenario was not part of the MUARC study).
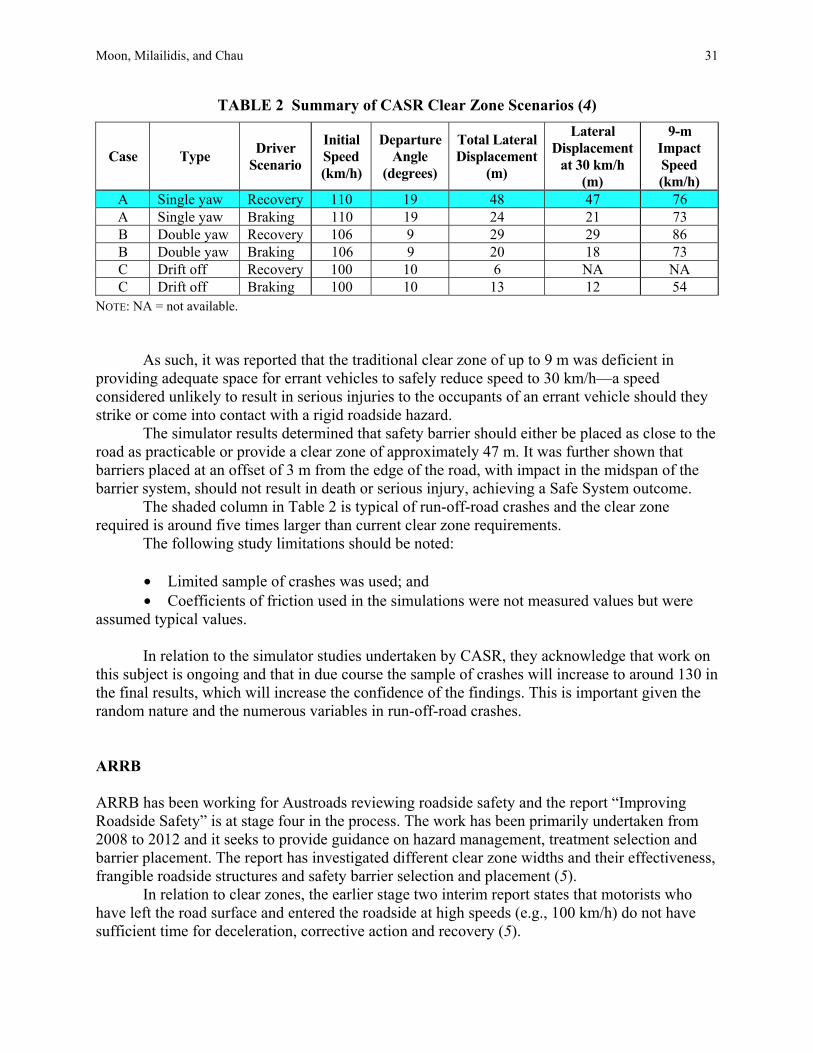
The CASR analysis shows that for a vehicle that leaves the road traveling at a speed of 110 km/h and departure angle of 19 degrees, a lateral displacement of 47 m was required to reduce the vehicle speed to 30 km/h. A summary of the clear zone results are shown in Table 2.
TABLE 1 Summary of Clear Zone Distances for Safe System Compliance Speed (km/h) 110 100 80 60 50 Perception–reaction time (s) 1.2 2.5 1.2 2.5 1.2 2.5 1.2 2.5 1.2 2.5
Clear Zone Distances for Safe System Compliance (m) 100% chance of deatha 27 37 19 30 6.8 15 5 11 4 9
50-km/h impact speedb 37 48 30 40 18 25 7 14 4 9
Safe Systemc 40 50 33 42 20 27 10 16 7 11 a Impact at the speeds predicted at these clear zones has a probability of death of 100%. b Frontal collisions at 50 km/h above which the risk of fatality increases rapidly. c Deemed operationally low risk.
Moon, Milailidis, and Chau 31
TABLE 2 Summary of CASR Clear Zone Scenarios (4)
Case Type Driver Scenario
Initial Speed (km/h)
Departure Angle
(degrees)
Total Lateral Displacement
(m)
Lateral Displacement
at 30 km/h (m)
9-m Impact Speed (km/h)
A Single yaw Recovery 110 19 48 47 76 A Single yaw Braking 110 19 24 21 73 B Double yaw Recovery 106 9 29 29 86 B Double yaw Braking 106 9 20 18 73 C Drift off Recovery 100 10 6 NA NA C Drift off Braking 100 10 13 12 54
NOTE: NA = not available.
As such, it was reported that the traditional clear zone of up to 9 m was deficient in providing adequate space for errant vehicles to safely reduce speed to 30 km/h—a speed considered unlikely to result in serious injuries to the occupants of an errant vehicle should they strike or come into contact with a rigid roadside hazard.
The simulator results determined that safety barrier should either be placed as close to the road as practicable or provide a clear zone of approximately 47 m. It was further shown that barriers placed at an offset of 3 m from the edge of the road, with impact in the midspan of the barrier system, should not result in death or serious injury, achieving a Safe System outcome.
The shaded column in Table 2 is typical of run-off-road crashes and the clear zone required is around five times larger than current clear zone requirements.
The following study limitations should be noted:
• Limited sample of crashes was used; and • Coefficients of friction used in the simulations were not measured values but were
assumed typical values. In relation to the simulator studies undertaken by CASR, they acknowledge that work on
this subject is ongoing and that in due course the sample of crashes will increase to around 130 in the final results, which will increase the confidence of the findings. This is important given the random nature and the numerous variables in run-off-road crashes. ARRB ARRB has been working for Austroads reviewing roadside safety and the report “Improving Roadside Safety” is at stage four in the process. The work has been primarily undertaken from 2008 to 2012 and it seeks to provide guidance on hazard management, treatment selection and barrier placement. The report has investigated different clear zone widths and their effectiveness, frangible roadside structures and safety barrier selection and placement (5).
In relation to clear zones, the earlier stage two interim report states that motorists who have left the road surface and entered the roadside at high speeds (e.g., 100 km/h) do not have sufficient time for deceleration, corrective action and recovery (5).
32 Transportation Research Circular E-C215: Roadside Safety Design and Devices
The ARRB study concludes that the average braking distance under skidding required to reach an impact speed of 40 km/h is 119 m for a roadside surface of loose gravel, and 201 m for wet grass, using a reaction time of 2.0 s and an initial departure speed of 100 km/h. The report subsequently advises that a clear zone of 53 m (lateral departure) would be required for vehicles leaving the road to achieve deceleration to a survivable speed (at a departure angle of 15 degrees at 100 km/h with a roadside surface of wet grass). The report also compares this to similar findings reported in the CASR study (4).
In terms of departure angles, the ARRB report shows that the majority (74%) of run-off-road casualty crashes in Victoria occurred at departure angles exceeding 15 degrees and they refer to both the CASR report and Mak, Sicking, Albuquerque, and Coon (6) which together similarly conclude that the mean average departure angle is in the order of 17 to 18 degrees. This means that the crashes typically occur into the roadside rather than along it.
In contrast, the minority of run-off-road crashes appear to be drift-off events where the motorist leaves the road at shallow angles and as such, has a higher chance of full recovery within the first 4-5 m if their vehicle remained under control and if a recovery was attempted. This scenario appears to be associated with straighter aligned road geometry.
It is acknowledged that the ARRB study covers broader aspects for improving roadside safety but its focus on run-off-road crashes and clear zones is particularly noteworthy, and in summary, is consistent with the work of MUARC and CASR. DISCUSSION OF RESULTS Contemporary Clear Zone Research Summarizing the studies, the parameters of speed (100 to 110 km/h), departure angle (approximately 15 degrees) and reaction time (2.0 s) are typical of run-off-road crashes on rural roads.
It is arguable that the 50 km/h impact speed used by MUARC should be lower and perhaps the 30-km/h speed allowed by CASR is more appropriate (for side impacts). At 50 km/h, the occupants of an errant vehicle may sustain serious injury whereas at 30 km/h, the occupants are unlikely to. This recognizes that human error is unavoidable and there is a natural limit to the amount of force that the human body can endure. Nonetheless, regardless of either impact speed, the studies show that to significantly mitigate the risk of injury and achieve Safe System principles, significantly wider clear zones would be required.
Specifically, the study by MUARC found that for a vehicle leaving the road traveling at 100 km/h, at a departure angle of 15 degrees, a 42-m clear zone is required to reduce the likelihood of death to below 10%. Similarly, CASR simulations show that traveling at 110 km/h, at a departure angle of 19 degrees, a 47-m clear zone is required to be Safe System-compliant. Likewise, ARRB reported that a clear zone of 54 m would be required for a vehicle leaving the road at 100 km/h at a departure angle of 15 degrees.
The findings by MUARC, CASR, and ARRB are all notably similar. They show that the current clear zone standards are not Safe System compliant and that the chance of survival at the associated impact speeds is minimal.

Moon, Milailidis, and Chau 33
To work towards a Safe System, a process of evaluating risk and exposure should be adopted to prioritize safety barrier treatments which, if not achieved in the short to medium term, would lead the way towards the ideal aim of barriers fully shielding the roadside.
The clear zone principles will never achieve this safety outcome as roadsides are typically not wide enough to accommodate a drivable hazard free zone of approximately 45 m.
Other constraints include the high social and environmental value of road reserves which is a significant issue that is difficult to resolve, due to the environmental constraints under state and federal legislation that protects remnant native vegetation.
The ARRB report (5) notes that in the short to medium term, safety barriers may provide a cost effective treatment for high-risk locations and that, in the long term, active vehicle safety features as well as Safe System road and roadside design are options for severe risks on higher traffic volume roads. On lesser traffic volume roads, it may be difficult to justify the high level of infrastructure required to meet Safe System requirements.
Nevertheless, clearer direction regarding the widths required to meet Safe System roadside requirements would likely lead to improved road design and counter measure treatments by road safety practitioners. For example, it is evident that compliance with current clear zones results in hazards that are either constructed marginally outside the clear zone or existing hazards that remain marginally outside the clear zone.
In terms of the high cost of infrastructure to treat roadsides with safety barriers, which is the ideal outcome, the cost benefits should be further scrutinized and industry should be encouraged to consider lower-cost safety barrier systems. As a minimum, the safety barrier is likely the only effective treatment to meet Safe System requirements in terms of run-off-road crashes. Ideally, the aim should be to install it as the first treatment of choice when funding permits.
Further investigation is required and a cost-benefit analysis undertaken in order to compare the cost of installing safety barrier versus the provision of a clear zone in excess of 40 m. Principle Based Policy and Guidelines In relation to a principles-based approach, and on the conclusion that the current clear zones are inadequate based on the research by MUARC, CASR, and ARRB, road authorities should evolve accordingly to reflect outcomes that align with the Safe System vision. Figure 1 demonstrates an example of a principles-based approach at policy level.
Figure 1 sets out a process that starts with Safe System Principles, outlines actions required to achieve these principles with due consideration to the human tolerance levels in a crash situation, and proposes countermeasures for Safe System design with the aim of ensuring that no vehicle leaves the road and enters the roadside. Safe System Roads Infrastructure Program, Victoria In Victoria, the Transport Accident Commission’s Safe System Roads Infrastructure Program (SSRIP) comprises a run-off-road program which evaluates, develops, and delivers projects with a variety of countermeasures based on risk and exposure related to run-off-road crashes.
For the run-off-road component, the primary treatment is safety barriers with the preference for flexible systems such as wire rope. However, hazard removal (based on clear zone
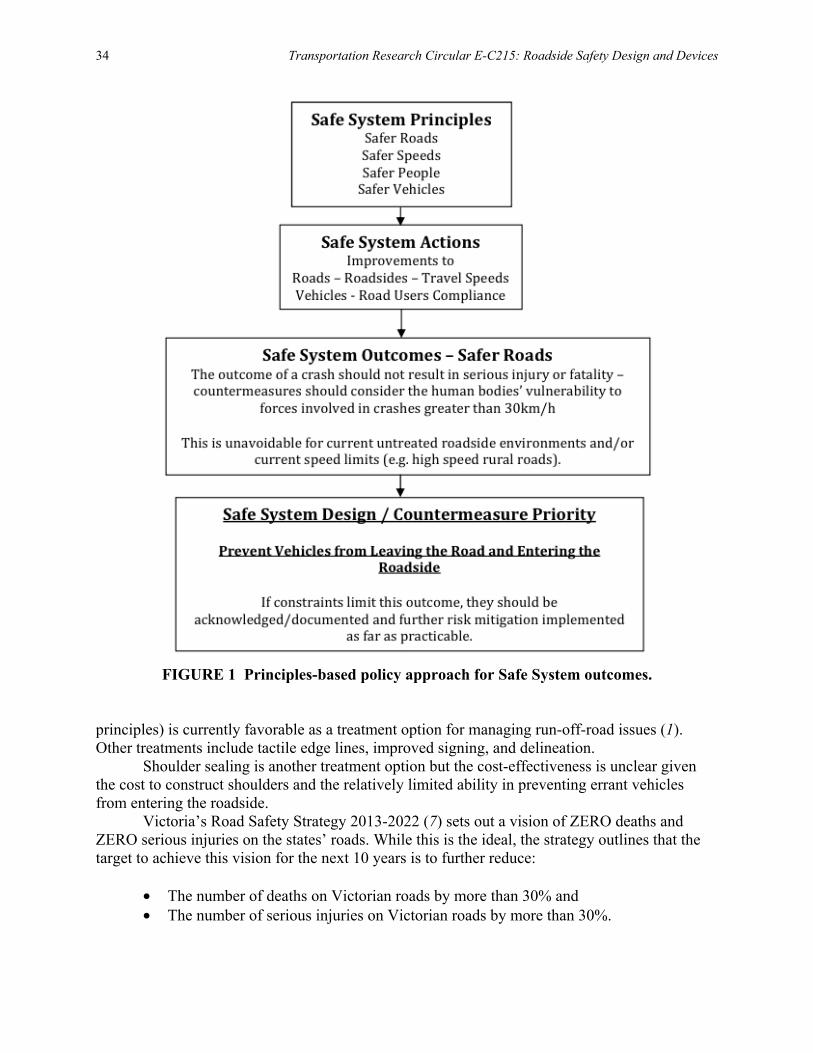
34 Transportation Research Circular E-C215: Roadside Safety Design and Devices
FIGURE 1 Principles-based policy approach for Safe System outcomes.
principles) is currently favorable as a treatment option for managing run-off-road issues (1). Other treatments include tactile edge lines, improved signing, and delineation.
Shoulder sealing is another treatment option but the cost-effectiveness is unclear given the cost to construct shoulders and the relatively limited ability in preventing errant vehicles from entering the roadside.
Victoria’s Road Safety Strategy 2013-2022 (7) sets out a vision of ZERO deaths and ZERO serious injuries on the states’ roads. While this is the ideal, the strategy outlines that the target to achieve this vision for the next 10 years is to further reduce:
• The number of deaths on Victorian roads by more than 30% and • The number of serious injuries on Victorian roads by more than 30%.
Moon, Milailidis, and Chau 35
Improving roadsides to reduce the likelihood of a run-off-road crash resulting in serious injury or death can occur by implementing a Safe System approach. This challenges the current clear zone principles and should consider the solution of safety barrier installation to shield all roadside hazards. Brownfield Treatments: Safe System Outcome-Based Approach An example of a Safe System outcome-based approach can be seen in a recently completed project for a 14-km section of the South Gippsland Highway in Victoria. This project adopted an outcome-based approach of no fatal or serious run-off-road injuries within its treatment length with the objective that no vehicle should leave the road and enter the roadside.
The existing clear zone for this road is 7.3 m. However, a review of run-off-road crashes in this relatively high-standard road showed that approximately 50% of crashes involving vehicles leaving the road, crashing beyond the clear zone, and resulting in serious injury. In order to reduce an errant vehicle to a safe speed and align with Safe System principles, based on the MUARC study, roadside clearing, terrain modification and maintenance would have been required for over 42 m. This was impractical to achieve, as such, clear zone standards were not considered and instead, safety barrier was proposed to shield the majority of the roadside environment.
Safety barrier was installed for approximately 90% of the treatment length. The remaining sections were either side road intersections or private access points. The safety barrier installed comprised 86% of wire rope safety barrier and 14% percent of w-beam guardrail barrier.
Hazard removal was only implemented where safety barrier could not shield the roadside (e.g., in the openings at intersections and access points) and to facilitate barrier deflection.
This pilot project is a model for the Safe System and was driven by an outcome-based approach of no fatal or serious injuries with the objective that no vehicle should leave the road and enter the roadside in this higher speed rural environment. Greenfield Treatments: Current Practice Versus Safe System One of the most substantive constraints in achieving Safe System outcomes in greenfield projects are the current design practices, which do not align with Safe System principles. Roadside hazards are still built in to new roadside infrastructure as the current practices and standards are based on clear zone principles.
Brodie, Bergh, and Corben (8) confirm that to meet the Safe System vision in the future, it is vital to adopt Safe System practices from the outset, when new road projects are being planned, designed, constructed, and operated. This will necessitate challenging traditional standards at every step. This equally translates to brownfield sites, which in almost all cases use traditional design standards when considering countermeasure treatments.
Brodie, Bergh, and Corben (8) propose that by utilizing safety barrier to achieve a reduced cross section for new road infrastructure, Safe System principles are achieved. This is potentially lower cost and will provide improved safety outcomes. By challenging conventional standards for median, traffic lane, and shoulder widths, as well as the standards for the use of flexible mid-barriers, and flexible side barriers instead of clear zones, the total width of the road reserve can be reduced from around 36 m to 21 to 22 m, representing a 40% reduction. This
36 Transportation Research Circular E-C215: Roadside Safety Design and Devices
lowers the capital and maintenance costs for infrastructure in general, including most notably, the costs of grade-separated structures along the route, as well as superior safety performance (likely much better than today’s standards deliver). System Failure Wundersitz and Baldock (9) report that a significant proportion of run-off-road crashes that result in fatal or serious injury are due to normal road user error and this is a system failure. The Safe System approach, including the development of forgiving road, roadside infrastructure, and other initiatives including appropriate speed limits, have the potential to reduce road trauma and these types of system failures. Safe System With the relatively recent introduction of the Safe System into the road safety industry, it is acknowledged that during every step of the road design and road safety process, current standards will need to be challenged and changed (7).
Subsequently, this paper has focused primarily on a review of three studies in relation to clear zone performance to determine how effective the traditional road design standard is in achieving Safe System outcomes. The results show that traditional clear zone standards are deficient in providing adequate space for errant vehicles to safely reduce speed to 30 km/h (a speed considered unlikely to result in serious injuries to the occupants of an errant vehicle). While an in-depth analysis of all these studies is beyond the scope of this paper, a comparative analysis needs to be undertaken in order to provide a solution to this problem.
The concept and value of clear zones should be reviewed when managing and treating run- off-road crashes, particularly in light of the Safe System objectives. In doing so, clearer direction regarding the widths required to meet Safe System clear zone requirements would lead to modified and improved thinking by designers and road safety practitioners. This will involve questioning whether objectives are based on economics or road safety outcomes. Ideally, the aspect of balance between these objectives should be removed and the standards set appropriately in line with Safe System principles to then allow the available resources to achieve as much as possible. Specifically, road safety barrier should be considered as an effective treatment to meet Safe System requirements. CONCLUSION In conclusion, current clear zone standards should be reviewed in terms of achieving Safe System objectives. A directional change in standards is required to make meaningful improvements to the biggest issue causing road trauma in rural Australia—run-off-road crashes.
This change should adopt a principles-based approach to achieve Safe System outcomes. The answer is not clear zone/hazard management but rather a shift to a principles-based approach with the aim of preventing any vehicle from entering the roadside. This ideal should be supported by renewed standards and guidelines.
The three studies above indicate that safety barriers are a preferred solution compared to clear zone guidelines to provide a Safe System solution. This implies that any hazard at any
Moon, Milailidis, and Chau 37
distance within a road reserve is not acceptable and hence, safety barrier design that prevents vehicles from entering the roadside is the ultimate standard. REFERENCES 1. Austroads. Guide to Road Design, Part 6: Roadside Design, Safety and Barriers. Sydney, Australia
2010. 2. Roads Corporation of Victoria. Supplement to the Austroads Guide to Road Design, Part 6: Roadside
Design, Safety and Barriers. Victoria, Australia, 2011. 3. Candappa, N., B. Corben, and D. Logan. Outcome-Based Clear Zone Guidelines: Final Report.
Monash University Accident Research Centre, 2008. 4. Doecke, S., and J. Woolley. Effective Use of Clear Zones and Barriers in a Safe System’s Context.
Presented at Australasian Road Safety Research, Policing, and Education Conference, Centre for Automotive Safety Research, The University of Adelaide, 2010.
5. Jurewicz, C., L. Steinmetz, C. Phillips, P. Cairney, G. Veith, and J. McLean. Improving Roadside Safety: Summary Report. Report AP-R437.14, Austroads, Sydney, Australia.
6. Mak, K. K., D. L. Sicking, F. D. B. Albuquerque, and B. A. Coon. NCHRP Report 665: Identification of Vehicular Impact Conditions Associated with Serious Run-off-Road Crashes, Transportation Research Board, 2010.
7. State Government of Victoria. Victoria’s Road Safety Action Plan 2013–2022. 2013. 8. Brodie, C., T. Bergh, and B. Corben. Regarding Road Safety. E-mail to W. Moon, July 16, 2013. 9. Wundersitz, L. N., and M. R. J. Baldock. The Relative Contribution of System Failures and Extreme
Behaviour in South Australian Crashes. Centre for Automotive Safety Research, The University of Adelaide, 2011.
38
SESSION 3: SAFE SYSTEM AND ROADSIDES
Measuring the Residual Risk Associated with Road Safety Barriers
ANDREW BURBRIDGE Department of Transport and Main Roads, Queensland Government
Centre for Accident Research and Road Safety, Queensland University of Technology
isk management principles require that post-treatment residual risk is tolerable. To be deemed tolerable, the level of residual risk should be understood and as far as possible
quantified. Risk may be calculated in human terms (e.g., in terms of fatal and serious injury) or it may be calculated in economic terms. Roadside hazards present risk. Road safety barriers are themselves roadside hazards. The Severity Index approach has a history of being used for the prediction of the economic consequences of an interaction between an errant vehicle and the roadside. This paper shows that the Severity Index may in principle be used to facilitate calculation of risk in terms of both human and economic metrics, but that further work is required to calibrate these Indices. INTRODUCTION Road authorities deploy road safety barriers primarily to prevent errant vehicles from impacting with roadside objects that could cause an adverse outcome either to the vehicle occupants or to third parties. However the foreword to Australian–New Zealand Standard (AS/NZS) 3845:1999 Road Safety Barrier Systems states
…it should be recognized that these devices are themselves a hazard; they have the potential to cause serious injuries. The intention of this Standard is that these devices are only installed at locations where the risk with the device installed is significantly less than the risk without the device (1).
Hence a road safety barrier is intended to reduce but is not expected to eliminate risk: there is an acknowledgement that some degree of residual risk exists even when a road safety barrier has been deployed.
Residual risk is defined in AS/NZS ISO 31000:2009 as the risk that remains after risk treatment (2). Risk treatment in accordance with AS/NZS ISO 31000:2009 requires that the level of residual risk level is tolerable. If the level of residual risk is not tolerable then the standard requires that a new risk treatment be generated. This paper discusses how the residual risk associated with road safety barriers might be measured in order that it can be assessed for tolerability.
R
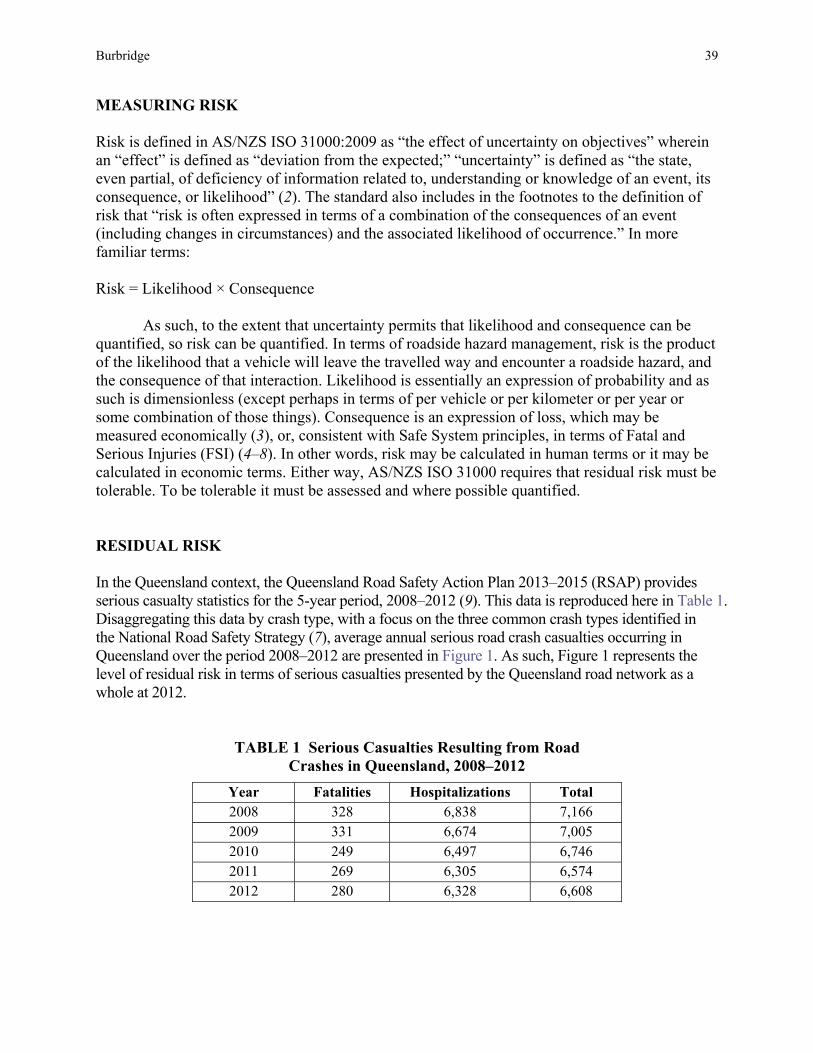
Burbridge 39
MEASURING RISK Risk is defined in AS/NZS ISO 31000:2009 as “the effect of uncertainty on objectives” wherein an “effect” is defined as “deviation from the expected;” “uncertainty” is defined as “the state, even partial, of deficiency of information related to, understanding or knowledge of an event, its consequence, or likelihood” (2). The standard also includes in the footnotes to the definition of risk that “risk is often expressed in terms of a combination of the consequences of an event (including changes in circumstances) and the associated likelihood of occurrence.” In more familiar terms: Risk = Likelihood × Consequence
As such, to the extent that uncertainty permits that likelihood and consequence can be quantified, so risk can be quantified. In terms of roadside hazard management, risk is the product of the likelihood that a vehicle will leave the travelled way and encounter a roadside hazard, and the consequence of that interaction. Likelihood is essentially an expression of probability and as such is dimensionless (except perhaps in terms of per vehicle or per kilometer or per year or some combination of those things). Consequence is an expression of loss, which may be measured economically (3), or, consistent with Safe System principles, in terms of Fatal and Serious Injuries (FSI) (4–8). In other words, risk may be calculated in human terms or it may be calculated in economic terms. Either way, AS/NZS ISO 31000 requires that residual risk must be tolerable. To be tolerable it must be assessed and where possible quantified. RESIDUAL RISK In the Queensland context, the Queensland Road Safety Action Plan 2013–2015 (RSAP) provides serious casualty statistics for the 5-year period, 2008–2012 (9). This data is reproduced here in Table 1. Disaggregating this data by crash type, with a focus on the three common crash types identified in the National Road Safety Strategy (7), average annual serious road crash casualties occurring in Queensland over the period 2008–2012 are presented in Figure 1. As such, Figure 1 represents the level of residual risk in terms of serious casualties presented by the Queensland road network as a whole at 2012.
TABLE 1 Serious Casualties Resulting from Road Crashes in Queensland, 2008–2012
Year Fatalities Hospitalizations Total 2008 328 6,838 7,166 2009 331 6,674 7,005 2010 249 6,497 6,746 2011 269 6,305 6,574 2012 280 6,328 6,608
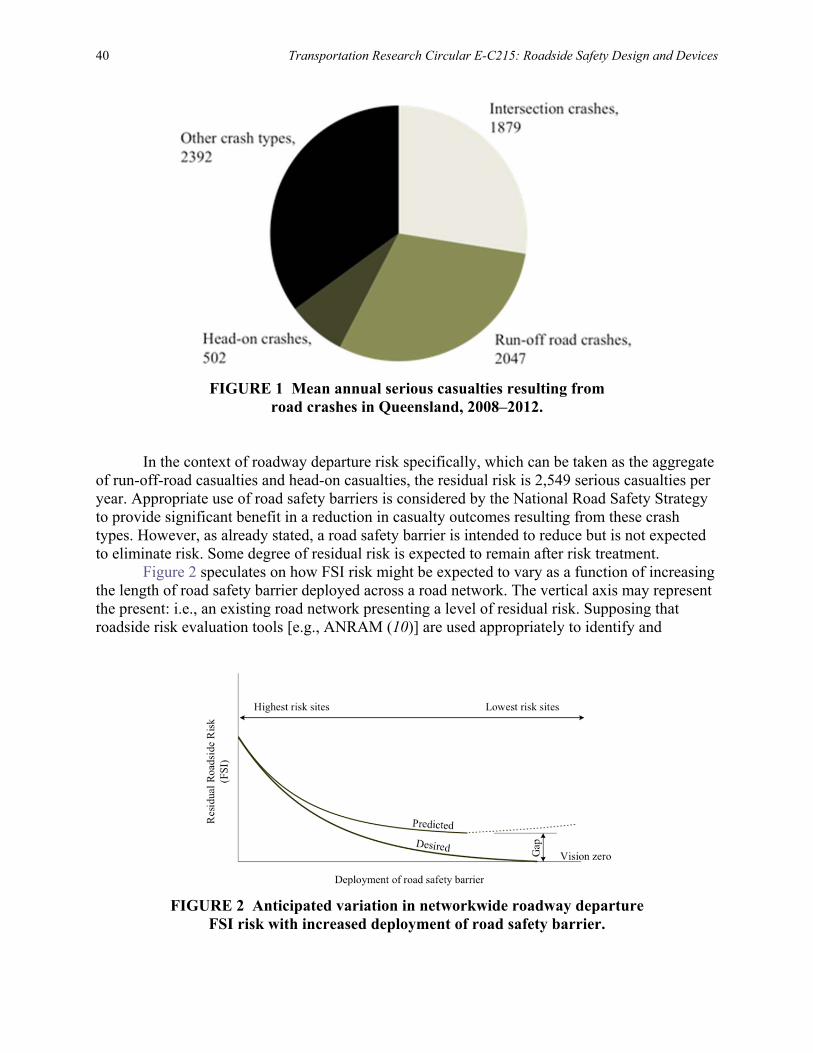
40 Transportation Research Circular E-C215: Roadside Safety Design and Devices
FIGURE 1 Mean annual serious casualties resulting from
road crashes in Queensland, 2008–2012.
In the context of roadway departure risk specifically, which can be taken as the aggregate of run-off-road casualties and head-on casualties, the residual risk is 2,549 serious casualties per year. Appropriate use of road safety barriers is considered by the National Road Safety Strategy to provide significant benefit in a reduction in casualty outcomes resulting from these crash types. However, as already stated, a road safety barrier is intended to reduce but is not expected to eliminate risk. Some degree of residual risk is expected to remain after risk treatment.
Figure 2 speculates on how FSI risk might be expected to vary as a function of increasing the length of road safety barrier deployed across a road network. The vertical axis may represent the present: i.e., an existing road network presenting a level of residual risk. Supposing that roadside risk evaluation tools [e.g., ANRAM (10)] are used appropriately to identify and
FIGURE 2 Anticipated variation in networkwide roadway departure
FSI risk with increased deployment of road safety barrier.
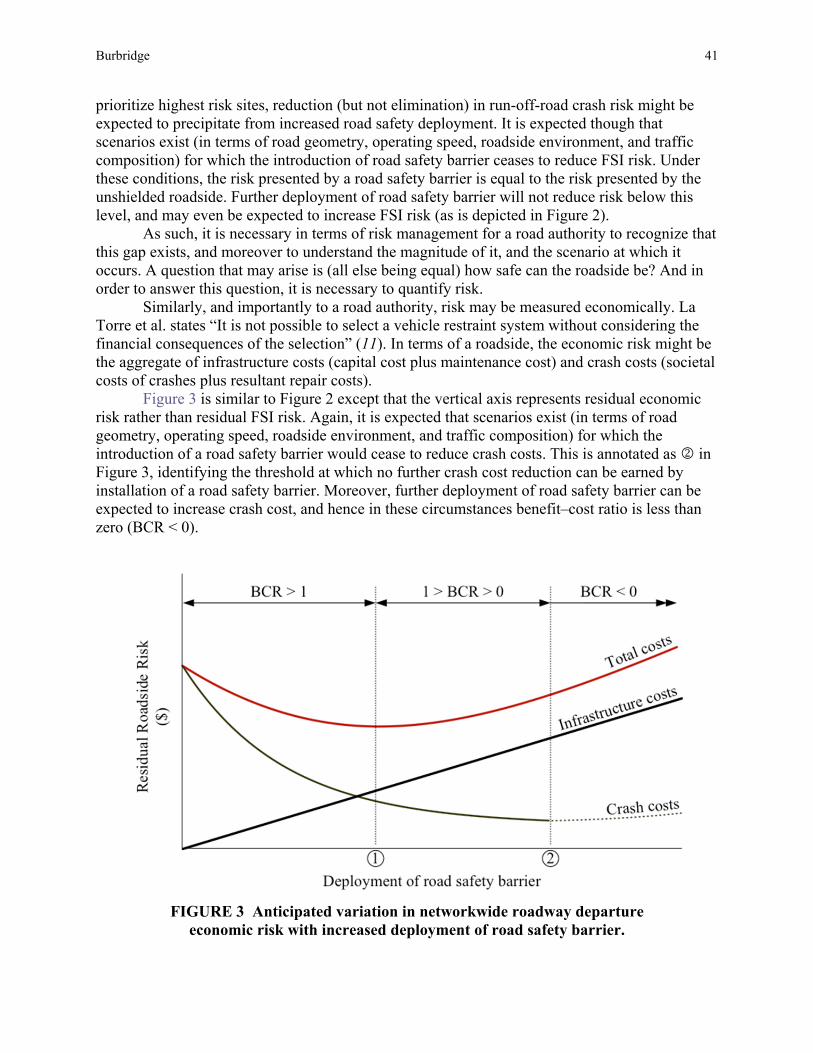
Burbridge 41
prioritize highest risk sites, reduction (but not elimination) in run-off-road crash risk might be expected to precipitate from increased road safety deployment. It is expected though that scenarios exist (in terms of road geometry, operating speed, roadside environment, and traffic composition) for which the introduction of road safety barrier ceases to reduce FSI risk. Under these conditions, the risk presented by a road safety barrier is equal to the risk presented by the unshielded roadside. Further deployment of road safety barrier will not reduce risk below this level, and may even be expected to increase FSI risk (as is depicted in Figure 2).
As such, it is necessary in terms of risk management for a road authority to recognize that this gap exists, and moreover to understand the magnitude of it, and the scenario at which it occurs. A question that may arise is (all else being equal) how safe can the roadside be? And in order to answer this question, it is necessary to quantify risk.
Similarly, and importantly to a road authority, risk may be measured economically. La Torre et al. states “It is not possible to select a vehicle restraint system without considering the financial consequences of the selection” (11). In terms of a roadside, the economic risk might be the aggregate of infrastructure costs (capital cost plus maintenance cost) and crash costs (societal costs of crashes plus resultant repair costs).
Figure 3 is similar to Figure 2 except that the vertical axis represents residual economic risk rather than residual FSI risk. Again, it is expected that scenarios exist (in terms of road geometry, operating speed, roadside environment, and traffic composition) for which the introduction of a road safety barrier would cease to reduce crash costs. This is annotated as in Figure 3, identifying the threshold at which no further crash cost reduction can be earned by installation of a road safety barrier. Moreover, further deployment of road safety barrier can be expected to increase crash cost, and hence in these circumstances benefit–cost ratio is less than zero (BCR < 0).
FIGURE 3 Anticipated variation in networkwide roadway departure
economic risk with increased deployment of road safety barrier.
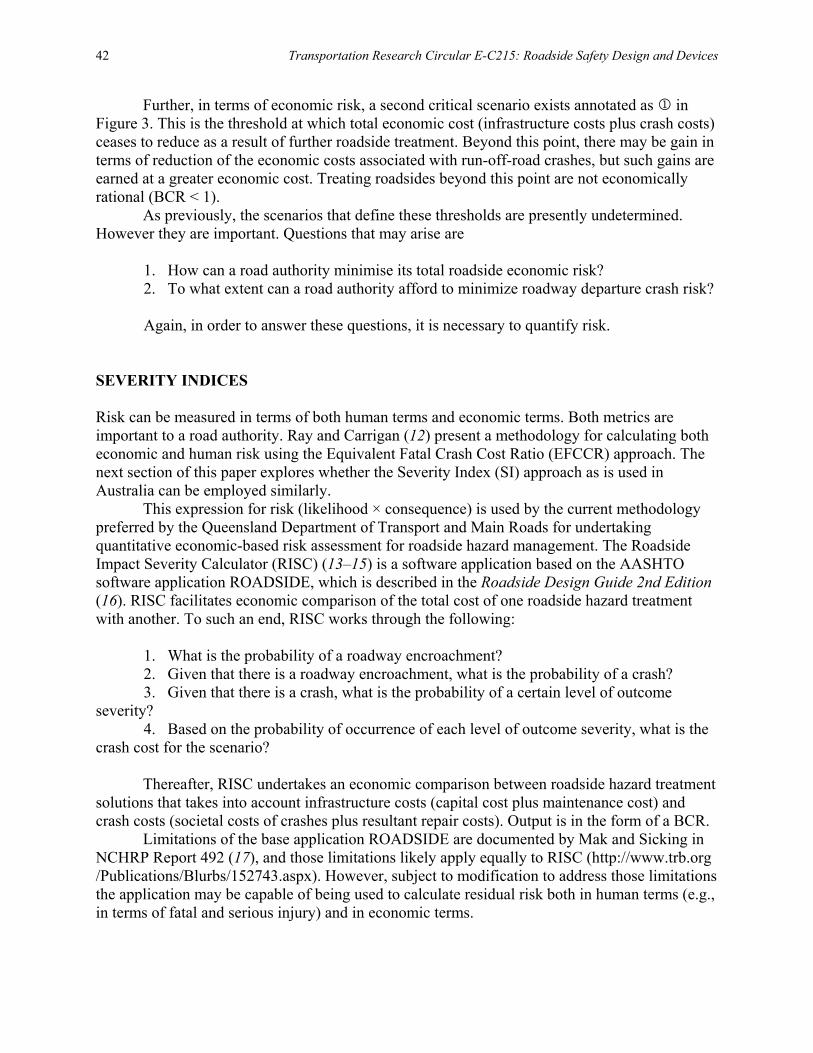
42 Transportation Research Circular E-C215: Roadside Safety Design and Devices
Further, in terms of economic risk, a second critical scenario exists annotated as in Figure 3. This is the threshold at which total economic cost (infrastructure costs plus crash costs) ceases to reduce as a result of further roadside treatment. Beyond this point, there may be gain in terms of reduction of the economic costs associated with run-off-road crashes, but such gains are earned at a greater economic cost. Treating roadsides beyond this point are not economically rational (BCR < 1).
As previously, the scenarios that define these thresholds are presently undetermined. However they are important. Questions that may arise are
1. How can a road authority minimise its total roadside economic risk? 2. To what extent can a road authority afford to minimize roadway departure crash risk? Again, in order to answer these questions, it is necessary to quantify risk.
SEVERITY INDICES Risk can be measured in terms of both human terms and economic terms. Both metrics are important to a road authority. Ray and Carrigan (12) present a methodology for calculating both economic and human risk using the Equivalent Fatal Crash Cost Ratio (EFCCR) approach. The next section of this paper explores whether the Severity Index (SI) approach as is used in Australia can be employed similarly.
This expression for risk (likelihood × consequence) is used by the current methodology preferred by the Queensland Department of Transport and Main Roads for undertaking quantitative economic-based risk assessment for roadside hazard management. The Roadside Impact Severity Calculator (RISC) (13–15) is a software application based on the AASHTO software application ROADSIDE, which is described in the Roadside Design Guide 2nd Edition (16). RISC facilitates economic comparison of the total cost of one roadside hazard treatment with another. To such an end, RISC works through the following:
1. What is the probability of a roadway encroachment? 2. Given that there is a roadway encroachment, what is the probability of a crash? 3. Given that there is a crash, what is the probability of a certain level of outcome
severity? 4. Based on the probability of occurrence of each level of outcome severity, what is the
crash cost for the scenario? Thereafter, RISC undertakes an economic comparison between roadside hazard treatment
solutions that takes into account infrastructure costs (capital cost plus maintenance cost) and crash costs (societal costs of crashes plus resultant repair costs). Output is in the form of a BCR.
Limitations of the base application ROADSIDE are documented by Mak and Sicking in NCHRP Report 492 (17), and those limitations likely apply equally to RISC (http://www.trb.org /Publications/Blurbs/152743.aspx). However, subject to modification to address those limitations the application may be capable of being used to calculate residual risk both in human terms (e.g., in terms of fatal and serious injury) and in economic terms.
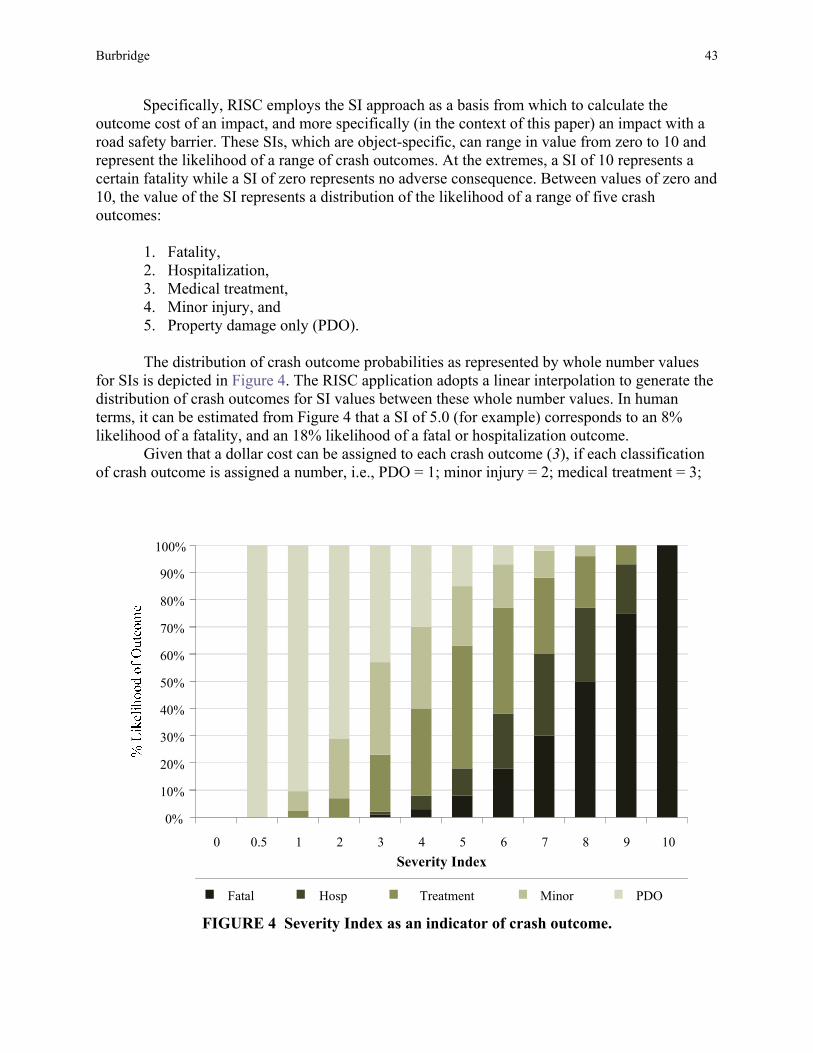
Burbridge 43
Specifically, RISC employs the SI approach as a basis from which to calculate the outcome cost of an impact, and more specifically (in the context of this paper) an impact with a road safety barrier. These SIs, which are object-specific, can range in value from zero to 10 and represent the likelihood of a range of crash outcomes. At the extremes, a SI of 10 represents a certain fatality while a SI of zero represents no adverse consequence. Between values of zero and 10, the value of the SI represents a distribution of the likelihood of a range of five crash outcomes:
1. Fatality, 2. Hospitalization, 3. Medical treatment, 4. Minor injury, and 5. Property damage only (PDO). The distribution of crash outcome probabilities as represented by whole number values
for SIs is depicted in Figure 4. The RISC application adopts a linear interpolation to generate the distribution of crash outcomes for SI values between these whole number values. In human terms, it can be estimated from Figure 4 that a SI of 5.0 (for example) corresponds to an 8% likelihood of a fatality, and an 18% likelihood of a fatal or hospitalization outcome.
Given that a dollar cost can be assigned to each crash outcome (3), if each classification of crash outcome is assigned a number, i.e., PDO = 1; minor injury = 2; medical treatment = 3;
FIGURE 4 Severity Index as an indicator of crash outcome.
0%
10%
20%
30%
40%
50%
60%
70%
80%
90%
100%
0 0.5 1 2 3 4 5 6 7 8 9 10Severity Index
Fatal Hosp Treatment Minor PDO
44 Transportation Research Circular E-C215: Roadside Safety Design and Devices
hospitalization = 4; and fatality = 5, then the crash cost associated with a given SI is calculated by the expression in Equation 1: Cost = ∑ × Cost (1) where
CostSI = crash cost corresponding to a given SI; j = classification of crash outcome;
P{CO jSI} = probability of occurrence of each crash outcome for a given SI; CostCO j = crash cost corresponding to each classification of crash outcome.
Thus, if the SI for any impact event can be predicted, then both an economic consequence
and a human consequence can be predicted. This is important in the management of risk. However, there is a body of evidence (introduced below) suggesting that the present values of SIs are not calibrated correctly. Discussion of Severity Indices Values for Sis for different objects, including road safety barriers, are listed (as suggested SIs) in Appendix E of the Guide to Road Design Part 6 (15). The original source is the AASHTO Roadside Design Guide 2nd Edition (16). Values for SI vary only as a function of speed and make no account of the range of impact variables that might affect crash outcome, for example, the angle of impact, or the age, shape or make and model of the impacting vehicle, or the likelihood of secondary outcomes [as are explicitly included in the RSAP application (18, 19)]. In essence, the values of SI are supposed to represent an average outcome. SIs for roadside safety barriers (not accounting for likelihood of penetrations) are provided here in Table 2.
Notably, these values do not discern between flexible, semi-rigid, and rigid barriers. This is despite literature that supports an argument that wire rope is a more forgiving road safety barrier solution (8, 20–22). As such, wire rope barriers should be represented with lower Sis than those representing steel beam barriers [although there is dissenting research suggesting that the rate of injuries due to collisions with wire rope may be higher than with other road safety barriers such as w-beam and concrete (23)].
Mak and Sicking are critical of the values for SI provided in the Roadside Design Guide (2nd Edition) stating “although most of these severities appear to be reasonable, they were based largely on engineering judgment, with only modest objective basis. As a result, a high degree of uncertainty still exists regarding the appropriate severity indices used in the model” (17). The authors also opine that many of the SIs appear too high. Ray et al (18) further elaborate that the SI approach to determining crash severity has been “widely used but never validated or compared to real-world crash data.”
TABLE 2 SIs by Design Speed Design speed (km/h) 50 60 70 80 90 100 110 120 Basic SI for all accepted barriers 1.9 2.0 2.2 2.3 2.5 3.7 3.0 3.3
Burbridge 45
In response to the criticism, some efforts have been expended to recalculate SI values. Sicking et al (24) review the default value of the SI for guardrails, finding it necessary to adjust it downwards to account for unreported crashes and in-service guardrail crash outcome costs. Schrum et al (25) determine that the values of SIs adopted for embankments are invalid, and develop a series of functions to recalculate the SIs for roadside embankment slopes. Consequent to a New South Wales study of the nature and cost of casualty crashes with a range of fixed objects, Bambach et al (26) recommend that established procedures for evaluating collisions with fixed objects in economic terms should continue to be used but that updated costs should replace those derived using the “traditional SI method.” Ray and Carrigan (19) present an argument for using instead EFCCR, derived from analyses of crash databases, as a “a single, dimensionless measure of crash severity with a particular roadside feature at a baseline speed of 65 mi/hr” as is adopted in Version 3 of RSAP (18). The EFCCR approach may be considered superior to the SI approach because it includes a factor for the likelihood of penetration (including rollover or vault) of the barrier (%PRV), and a factor for the likelihood that the impacting vehicle will rollover on the trafficked side of the barrier postimpact (%RSS). Default values for EFCCR65, %PRV and %RSS for a selection of road safety barriers modeled in RSAP is presented in Table 3. VEHICLE FLEET Of note, values of EFCCR are pertinent only for passenger vehicle crashes, and multipliers must be applied in RSAP to calculate the crash costs associated with two other classes of vehicle (trucks and motorcycles). The SI approach currently makes no similar provision. Karpinksi has determined that SI values are “valid for cars only and if the vehicle is upright” (27). Of course, not all vehicles are cars.
Data published by Bambach et al. (26), for example, suggests that the mean injury cost of casualty crash is 3.4 times more costly for a motorcyclist than the driver of a light passenger vehicle in an impact with w-beam, and 2.1 times more costly if the impact is with concrete barrier. This compares with a study by Daniello and Gabler who determine that motorcyclist fatality risk by most harmful object struck is about 1.75 times higher for guardrail than for concrete barrier (28), but “no significant difference in the odds of severe injury in cable barrier collisions as compared to the odds of severe injury in w-beam guardrail collisions” (29). Conversely, other research is unable to identify any statistically significant effect of barrier type on motorcyclist risk (21, 30).
TABLE 3 Selection of Default Object Severity Values Used in RSAP (18) Object–Event EFCCR65 %PRV %RSS Rigid concrete barrier (F-shape) (42-in. high) (TL-5) 0.0035 0.10 1.50 W-beam guardrail (TL-3) 0.0047 2.00 0.10 High-tension cable median barrier (TL-3) 0.0018 4.00 0.50 Rollover 0.0220 — —
46 Transportation Research Circular E-C215: Roadside Safety Design and Devices
Moreover, cars themselves exist in many shapes and sizes. Ydenius et al. consider that knowledge of the ways in which different vehicles interact with different barriers is important (31). Wu and Thomson state that “vehicles with similar mass can behave quite differently during a crash event” and that vehicle compatibility with the barrier system is important (32). This is consistent with Tingvall et al. quoted by Rechnitzer and Grzebieta (33), “The interface between the car and the infrastructure is poorly defined. Very little attention is paid to how a modern car is designed, and even less to how the restraint system works and is triggered. There seems to be a lack of communication between car and infrastructure designers.”
Stolle and Sicking report that “…vehicles most commonly associated with penetrations (of wire rope road safety barriers) were typically either sharply-contoured or high bumper height, high CG location vehicles such as large SUVs” (34). The authors proceed to note that vehicle make, model, and type are important factors in wire rope barrier performance. Meanwhile, Gabauer and Gabler find that rollover risk in impacts with concrete barriers and steel barriers is eight times higher for SUVs than for cars (35). Barriers aside, Fréchède et al. cite research by others that establishes “an increased propensity of specific car classes such as SUVs or 4WD vehicles to roll,” while “4WD vehicles, regardless of size, provided poor rollover crash protection to their occupants” (36).
And pertinently, for example, research indicates that the light vehicle fleet is polarising: sales of large and mid-sized sedans are observed to be in decline, while small vehicles and SUVs are increasing their market share (37–39).
The point is that different road safety barriers may be expected to perform differently as a function of the impacting vehicle and the configuration of the impact, and moreover that variations in the vehicle fleet may be responsible for variations in occupant injury outcome. As such, site-specific knowledge of the vehicle fleet to which a road safety barrier is exposed is as important as knowledge of the barrier infrastructure. CONCLUSIONS AS/NZS ISO 31000:2009 requires that residual risk must be tolerable. To be deemed tolerable it must be assessed and where possible quantified. Risk may be calculated in human terms (e.g., in terms of fatal and serious injury) or it may be calculated in economic terms. Importantly, road authorities have an interest in both measures.
SIs have been used historically as a vector for transforming the expected distribution of a range of crash outcomes to an economic cost for the purposes of economic analysis. Given their basis, SIs could also be useful predictors of the likelihood of each level of crash outcome. As such the SI approach has the potential to be used to estimate residual crash risk in terms of both human and economic measures.
However, a comprehensive review of the values for SI is necessary. In the first instance, there is sufficient published literature in existence to show that the currently accepted values require review. Second, SIs are a function of two components of the system (vehicle and impacted object) rather than simply the object itself, and that the values for SIs should be cognisant of both components, and moreover the configuration of the impact.
In the case of road safety barriers specifically, the SI approach may be useful to calculate the residual risk after deployment, providing that composition of the site-specific vehicle fleet is known and the probability distribution of various crash outcomes can be predicted. Knowledge
Burbridge 47
of the vehicle fleet to which a road safety barrier is exposed is as important as knowledge of the barrier infrastructure. DISCLAIMER Any opinions expressed are those of the author. The State of Queensland makes no statements, representations or warranties regarding the accuracy or usefulness of the information for any use whatsoever. Any party using the information for any purpose does so at their own risk, and releases and indemnifies the State of Queensland against all responsibility and liability (including negligence, negligent misstatement and pure economic loss) for all expenses, losses, damages and costs incurred as a consequence of such use. REFERENCES 1. AS/NZS 3845:1999 Road Safety Barrier Systems. Standards Australia, Sydney, New South Wales,
Australia, and Standards New Zealand, Wellington, New Zealand, p. 128, 1999. 2. AS/NZS ISO 31000:2009: Risk Management—Principles and Guidelines. Standards Australia,
Sydney, New South Wales, Australia, and Standards New Zealand, Wellington, New Zealand, 2009, 3. Austroads. Social Costs of Road Crashes in Australia: The Case for Willingness-to-Pay Values for
Road Safety. Sydney, New South Wales, Australia, 2015. 4. Organisation for Economic Cooperation and Development/International Transport Forum. Towards
Zero, Washington, D.C., 2008, p. 241. 5. Howard, E. Implementing a ‘Safe System’ Approach to Road Safety in Victoria. Road Safety
Research, Policing, and Education Conference, Perth, Western Australia, Australia, 2004. 6. Tingvall, C., and N. Haworth. Vision Zero: An Ethical Approach to Safety and Mobility. Road Safety
and Traffic Enforcement, 6th Institute of Transportation Engineers International Conference, Melbourne, Victoria, Australia, 1999.
7. Australian Transport Council. National Road Safety Strategy 2011–2020. Canberra, Australian Capital Territory, 2011, p. 110.
8. Jurewicz, C., L. Steinmetz, C. Phillips, P. Cairney, G. Veith, and J. McLean. Improving Roadside Safety: Summary Report. Austroads, Sydney, New South Wales, Australia, 2014, p. 100.
9. Queensland Department of Transport and Main Roads. Queensland Road Safety Action Plan 2013–2015. Brisbane, Queensland, Australia, 2013.
10. Jurewicz, C., L. Steinmetz, and B. Turner. Australian National Risk Assessment Model, Austroads, Sydney, New South Wales, Australia, 2014, p. 76.
11. La Torre, F., C. Erginbas, R. Thomson, G. Amato, B. Pengal, P. Saleh, C. Britton, and K. Redant. Development of a Guideline for the Selection of Vehicle Restraint Systems—Identification of the Key Selection Parameters. Transport Research Arena, Paris, France, 2014.
12. Ray, M. H., and C. E. Carrigan. Using Risk Analysis to Minimize Adverse Consequences in Non-Standard Designs. Presented at 94th Annual Meeting of the Transportation Research Board, Washington, D.C., 2015.
13. Queensland Department of Main Roads. Roadside Impact Severity Calculator. Brisbane, Queensland, Australia, 1999.
14. Queensland Department of Transport and Main Roads. Road Planning and Design Manual. Brisbane, Queensland, Australia, 2005.
15. Austroads. Guide to Road Design, Part 6: Roadside Design, Safety, and Barriers. Austroads, Sydney, New South Wales, Australia, 2009.
48 Transportation Research Circular E-C215: Roadside Safety Design and Devices
16. Roadside Design Guide, 2nd Edition. American Association of State Highway and Transportation Officials, Washington, D.C., 1996.
17. Mak, K. K., and D. L. Sicking. NCHRP Report 492: Roadside Safety Analysis Program—Engineer’s Manual. 2003.
18. Ray, M. H., C. E. Carrigan, C. A. Plaxico, S.-P. Miaou, and T. O. Johnson. NCHRP 22-27 Roadside Safety Analysis Program Update. RoadSafe LLC, Maine, 2012.
19. Ray, M. H., and C. E. Carrigan. Methodology for Systematically Comparing Longitudinal Barrier Performance. Presented at 93rd Annual Meeting of the Transportation Research Board, Washington, D.C., 2014.
20. Candappa, N., A. D’Elia, S. Newstead, and B. Corben. The Effectiveness of Wire Rope Barriers in Victoria. Journal of the Australasian College of Road Safety, Vol. 23, No. 3, 2012, pp. 27–37.
21. Zou, Y., A. P. Tarko, E. Chen, and M. A. Romero. Effectiveness of Cable Barriers, Guardrails, and Concrete Barrier Walls in Reducing the Risk of Injury. Accident Analysis and Prevention, Vol. 72, No. 0, 2014, pp. 55–65.
22. Ydenius, A. Influence of Crash Pulse Characteristics on Injury Risk in Frontal Impacts Based on Real-Life Crashes. Traffic Injury Prevention, Vol. 11, No. 5, 2010, pp. 526–534.
23. Karim, H., R. Magnusson, and M. Wiklund. Assessment of Injury Rates Associated with Road Barrier Collision. Procedia–Social and Behavioral Sciences, Vol. 48, No. 0, 2012, pp. 52–63.
24. Sicking, D. L., K. A. Lechtenberg, and S. Peterson. NCHRP Report 638: Guidelines for Guardrail Implementation. 2009, p. 978.
25. Schrum, K. D., F. D. B. De Albuquerque, D. L. Sicking, R. K. Falle, and J. D. Reid. Correlation Between Crash Severity and Embankment Geometry. Journal of Transportation Safety and Security, Vol. 6, No. 4, 2014, pp. 321–334.
26. Bambach, M. R., R. J. Mitchell, and G. A. Mattos. Mean Injury Costs of Run-Off-Road Collisions with Fixed Objects: Passenger Vehicles and Motorcycles. Journal of Transportation Safety and Security, Vol. 7, No. 3, 2015, pp. 228–242.
27. Karpinski, J. Main Roads Roadside Hazard Rating. Presented at 25th ARRB Conference, Perth, Western Australia, 2012.
28. Daniello, A., and H. C. Gabler. Fatality Risk in Motorcycle Collisions with Roadside Objects in the United States. Accident Analysis and Prevention, Vol. 43, No. 3, 2011, pp. 1167–1170.
29. Daniello, A., and H. C. Gabler. Effect of Barrier Type on Injury Severity in Motorcycle-to-Barrier Collisions in North Carolina, Texas, and New Jersey. Transportation Research Record: Journal of the Transportation Research Board, No. 2262, 2011, pp. 144–151.
30. Grzebieta, R., M. Bambach, and A. McIntosh. Motorcyclist Impacts into Roadside Barriers. Transportation Research Record: Journal of the Transportation Research Board, No. 2377, 2013, pp. 84–91.
31. Ydenius, A., A. Kullgren, and C. Tingvall. Development of a Crashworthy System: Interaction Between Car Structural Integrity, Restraint Systems, and Guardrails. Presented at 17th International Technical Conference on the Enhanced Safety of Vehicles, 2001.
32. Wu, W., and R. Thomson. Compatibility Between Passenger Vehicles and Road Barriers During Oblique Collisions. International Journal of Crashworthiness, Vol. 9, No. 3, 2004, pp. 245–253.
33. Rechnitzer, G., and R. Grzebieta. Crashworthy Systems—A Paradigm Shift in Road Safety Design. Transport Engineering in Australia, Vol. 5, No. 2, 1999.
34. Stolle, C. S., and D. L. Sicking. Impact Conditions Associated with Cable Median Barrier Failures. Presented at 92nd Annual Meeting of the Transportation Research Board, Washington, D.C., 2013.
35. Gabauer, D. J., and H. C. Gabler. Differential Rollover Risk in Vehicle-to-Traffic Barrier Collisions. Association for the Advancement of Automotive Medicine, 2009.
36. Fréchède, B., A. McIntosh, R. Grzebieta, and M. R. Bambach. Characteristics of Single Vehicle Rollover Fatalities in Three Australian States (2000–2007). Accident Analysis and Prevention, Vol. 43, No. 3, 2011, pp. 804–812.

Burbridge 49
37. Oxley, P., S. Newstead, and M. Cameron. Estimation of the Safety Benefits of a Vehicle Replacement Program in Victoria. Presented at Road Safety Research, Policing and Education Conference, Sydney, New South Wales, Australia, 2003.
38. Anderson, R., T. P. Hutchinson, and G. Ponte. The Impact of Changes in the Australian Light Vehicle Fleet on Crashworthiness and Crash Outcomes. Austroads, Sydney, Australia, 2013, p. 81.
39. Newstead, S., A. Delaney, L. Watson, and M. Cameron. A Model for Considering the Total Safety of the Light Passenger Vehicle Fleet. Monash University Accident Research Centre, Melbourne, Victoria, Australia. 2004.
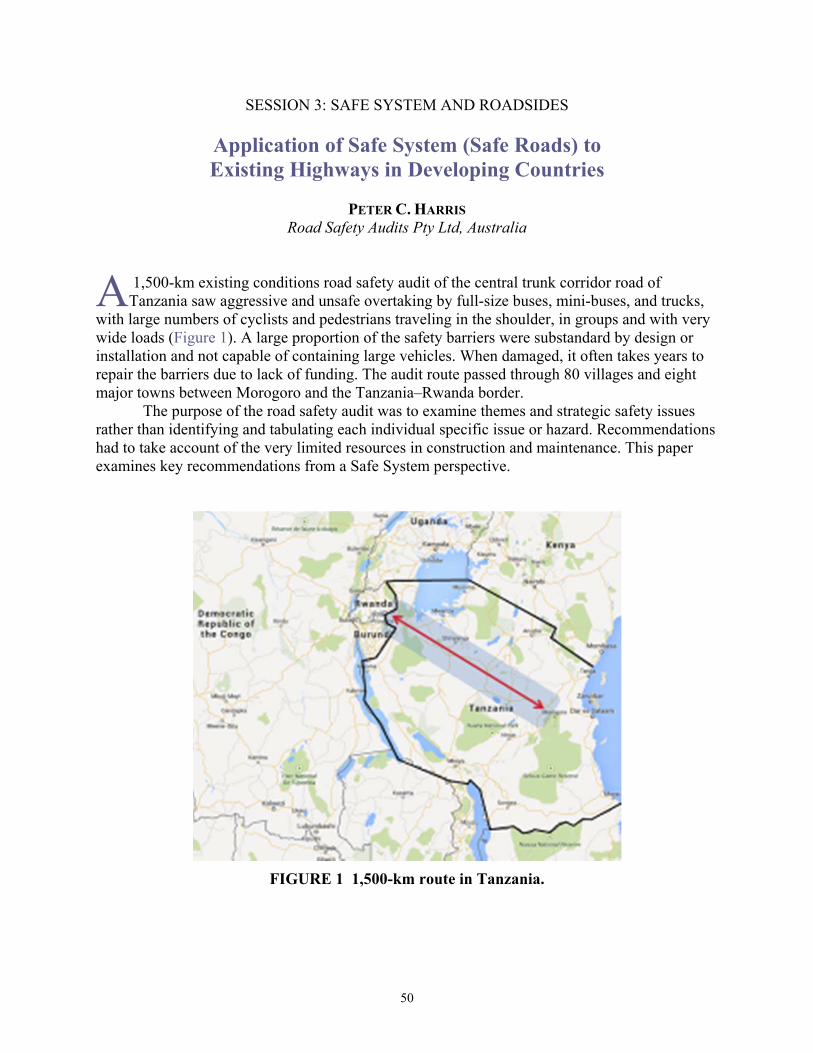
50
SESSION 3: SAFE SYSTEM AND ROADSIDES
Application of Safe System (Safe Roads) to Existing Highways in Developing Countries
PETER C. HARRIS
Road Safety Audits Pty Ltd, Australia
1,500-km existing conditions road safety audit of the central trunk corridor road of Tanzania saw aggressive and unsafe overtaking by full-size buses, mini-buses, and trucks,
with large numbers of cyclists and pedestrians traveling in the shoulder, in groups and with very wide loads (Figure 1). A large proportion of the safety barriers were substandard by design or installation and not capable of containing large vehicles. When damaged, it often takes years to repair the barriers due to lack of funding. The audit route passed through 80 villages and eight major towns between Morogoro and the Tanzania–Rwanda border.
The purpose of the road safety audit was to examine themes and strategic safety issues rather than identifying and tabulating each individual specific issue or hazard. Recommendations had to take account of the very limited resources in construction and maintenance. This paper examines key recommendations from a Safe System perspective.
FIGURE 1 1,500-km route in Tanzania.
A
Harris 51
SAFE SYSTEM In summary, the Safe System approach to traffic and transportation includes the following components:
• Aims to eliminate death and seriously injuries to road users of all types by applying kinetic energy thresholds to likely crashes. It does this with the understanding that we have already addressed the easiest issues with greatest benefit-cost with roads and vehicle, yet there are still a high number of fatal and serious accidents on our roads that need addressing.
• Acknowledges that drivers will make mistakes and that driver error will continue to be a significant factor in crashes.
• Asks road designers and managers to focus on four key areas: roads, speed, vehicles, and people.
Safe System recommendations are often categorized into primary and other categories such as:
1. Primary treatments. These have the potential to deliver near zero death and serious
injury (e.g., a well-designed roundabout). 2. Supporting treatments. These reduce likelihood or severity only, but are expected to
improve safety and be practical and physically able to be installed and maintained. Example: Audio–tactile edge lines reduce run-off-road crashes but doesn’t eliminate them or reduce their severity to kinetic energy thresholds that eliminate death or serious injury.
3. Non–Safe System treatments. Example: The installation of traffic signals at a high-speed intersection. These will reduce the likelihood of crashes occurring, but when they do occur, the impact forces and angles will be severe (1, 2). AUDIT EXECUTION An audit team of three people drove the highway over 7 days and nights, stopping where necessary to take measurements, notes, photos, and hold group discussions. Stops were also made at key regional centers to attempt to obtain crash data from police. The team consisted of a Tanzanian road and traffic consultant acting as team leader (Peter Harris, author of this paper), as lead road safety auditor, and a participant from Tanzania Ministry of Works.
Key themes were discussed during the audit many examples recorded to assist with reporting. The key themes were: lane width; shoulder width; overtaking areas; lay-by areas; signs and line marking; hazards; guard rail; bridge barriers (parapets); speed limits, speed humps, pedestrian crossing; traffic police; railway crossings; pedestrian issues; potential and known blackspots or blacklengths. OBSERVED ROAD CONDITIONS The trunk road audited has two lanes. Some sections had line marking. Spot-checked lane widths were typically 3.25 m, with 1.0 to 1.5 m shoulders (Figure 2). Lane widening at curves was not
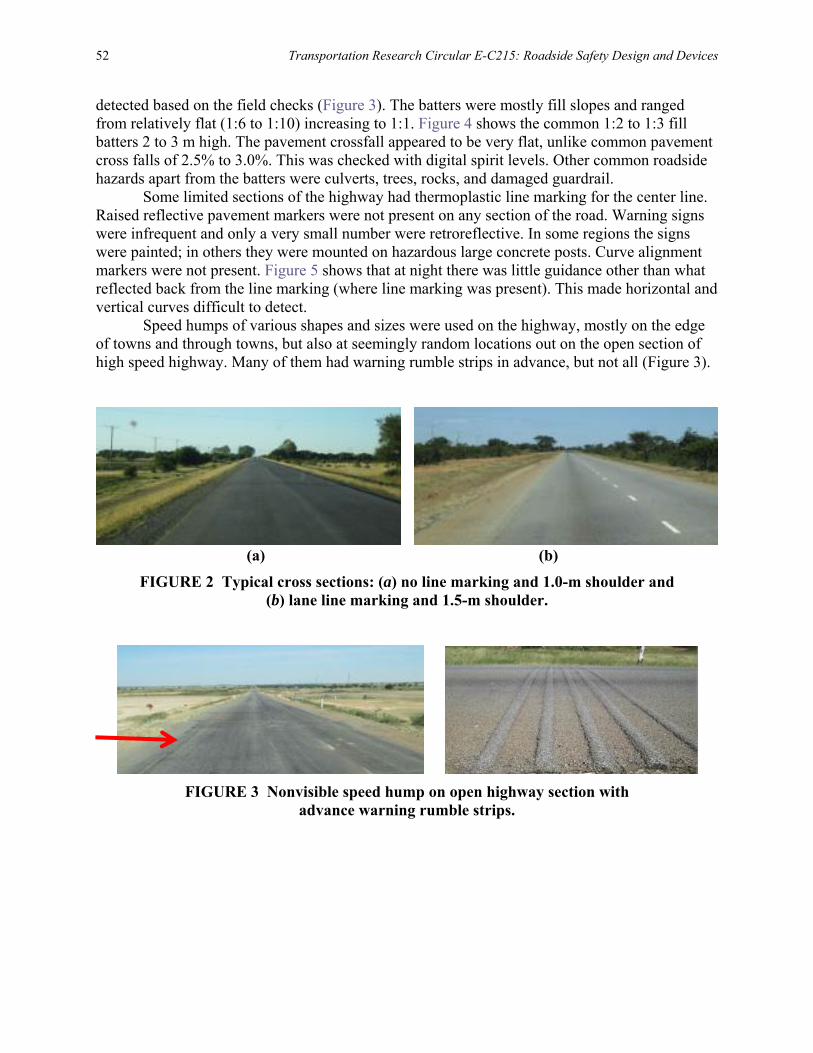
52 Transportation Research Circular E-C215: Roadside Safety Design and Devices
detected based on the field checks (Figure 3). The batters were mostly fill slopes and ranged from relatively flat (1:6 to 1:10) increasing to 1:1. Figure 4 shows the common 1:2 to 1:3 fill batters 2 to 3 m high. The pavement crossfall appeared to be very flat, unlike common pavement cross falls of 2.5% to 3.0%. This was checked with digital spirit levels. Other common roadside hazards apart from the batters were culverts, trees, rocks, and damaged guardrail.
Some limited sections of the highway had thermoplastic line marking for the center line. Raised reflective pavement markers were not present on any section of the road. Warning signs were infrequent and only a very small number were retroreflective. In some regions the signs were painted; in others they were mounted on hazardous large concrete posts. Curve alignment markers were not present. Figure 5 shows that at night there was little guidance other than what reflected back from the line marking (where line marking was present). This made horizontal and vertical curves difficult to detect.
Speed humps of various shapes and sizes were used on the highway, mostly on the edge of towns and through towns, but also at seemingly random locations out on the open section of high speed highway. Many of them had warning rumble strips in advance, but not all (Figure 3).
(a) (b)
FIGURE 2 Typical cross sections: (a) no line marking and 1.0-m shoulder and (b) lane line marking and 1.5-m shoulder.
FIGURE 3 Nonvisible speed hump on open highway section with
advance warning rumble strips.
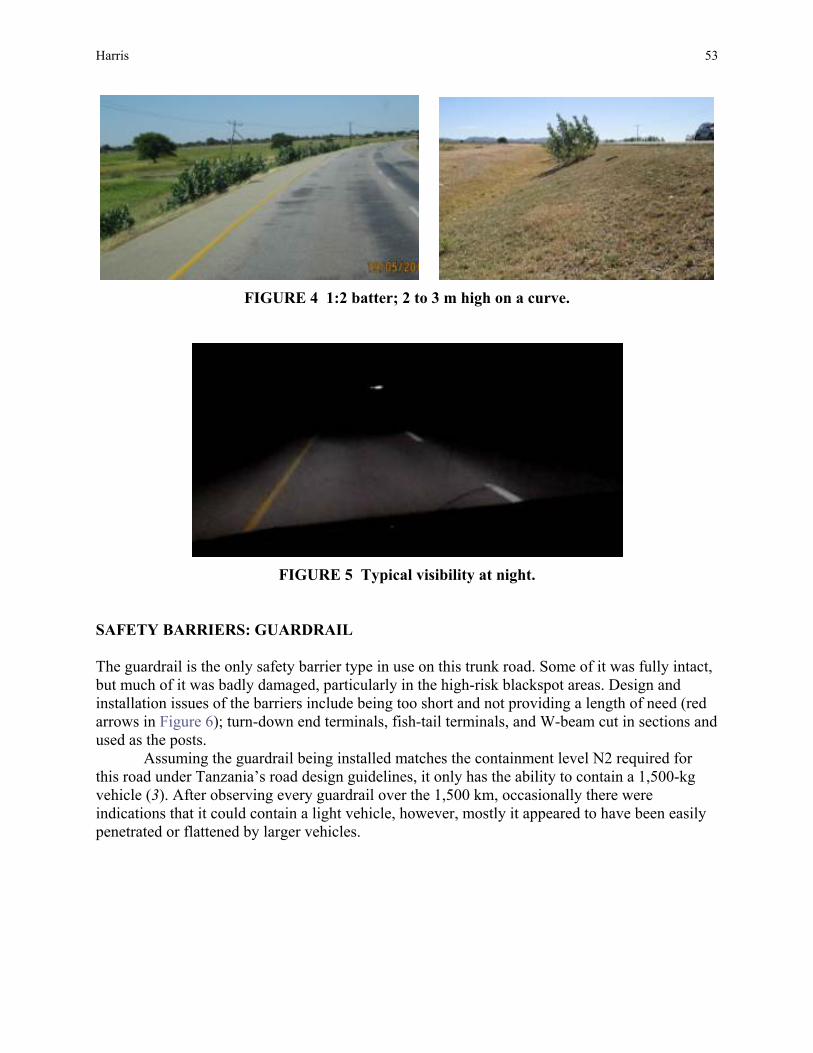
Harris 53
FIGURE 4 1:2 batter; 2 to 3 m high on a curve.
FIGURE 5 Typical visibility at night.
SAFETY BARRIERS: GUARDRAIL The guardrail is the only safety barrier type in use on this trunk road. Some of it was fully intact, but much of it was badly damaged, particularly in the high-risk blackspot areas. Design and installation issues of the barriers include being too short and not providing a length of need (red arrows in Figure 6); turn-down end terminals, fish-tail terminals, and W-beam cut in sections and used as the posts.
Assuming the guardrail being installed matches the containment level N2 required for this road under Tanzania’s road design guidelines, it only has the ability to contain a 1,500-kg vehicle (3). After observing every guardrail over the 1,500 km, occasionally there were indications that it could contain a light vehicle, however, mostly it appeared to have been easily penetrated or flattened by larger vehicles.
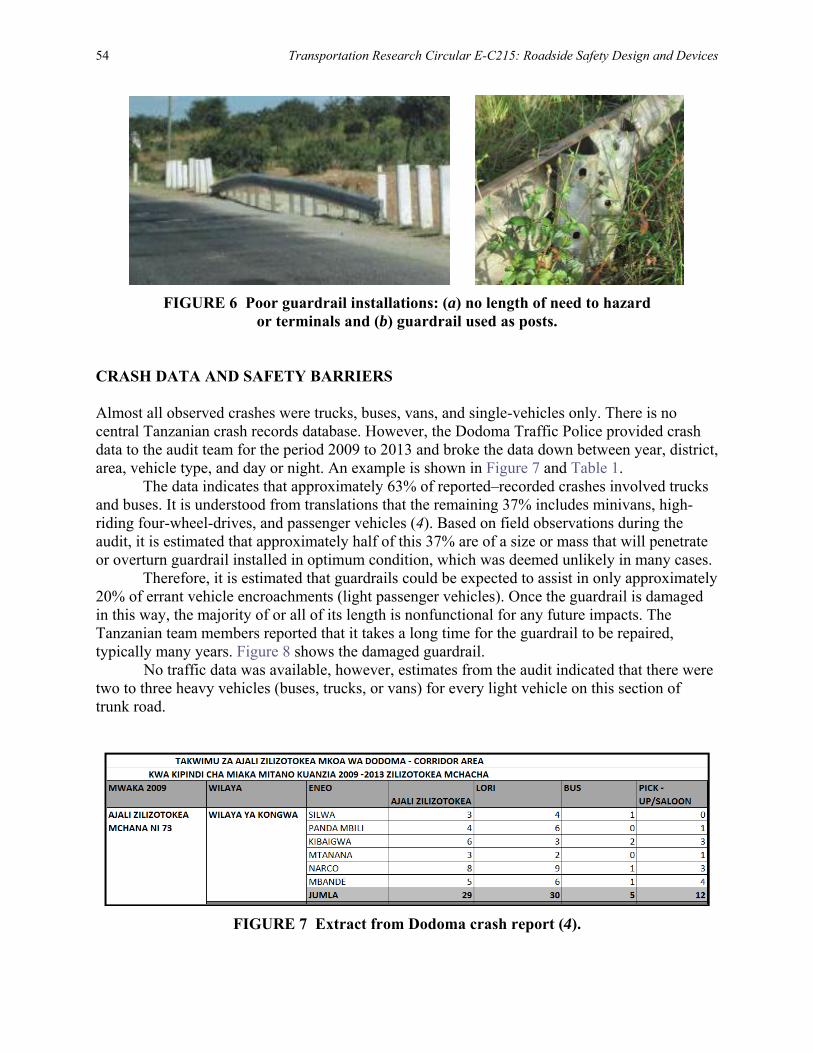
54 Transportation Research Circular E-C215: Roadside Safety Design and Devices
FIGURE 6 Poor guardrail installations: (a) no length of need to hazard
or terminals and (b) guardrail used as posts. CRASH DATA AND SAFETY BARRIERS Almost all observed crashes were trucks, buses, vans, and single-vehicles only. There is no central Tanzanian crash records database. However, the Dodoma Traffic Police provided crash data to the audit team for the period 2009 to 2013 and broke the data down between year, district, area, vehicle type, and day or night. An example is shown in Figure 7 and Table 1.
The data indicates that approximately 63% of reported–recorded crashes involved trucks and buses. It is understood from translations that the remaining 37% includes minivans, high-riding four-wheel-drives, and passenger vehicles (4). Based on field observations during the audit, it is estimated that approximately half of this 37% are of a size or mass that will penetrate or overturn guardrail installed in optimum condition, which was deemed unlikely in many cases.
Therefore, it is estimated that guardrails could be expected to assist in only approximately 20% of errant vehicle encroachments (light passenger vehicles). Once the guardrail is damaged in this way, the majority of or all of its length is nonfunctional for any future impacts. The Tanzanian team members reported that it takes a long time for the guardrail to be repaired, typically many years. Figure 8 shows the damaged guardrail.
No traffic data was available, however, estimates from the audit indicated that there were two to three heavy vehicles (buses, trucks, or vans) for every light vehicle on this section of trunk road.
FIGURE 7 Extract from Dodoma crash report (4).
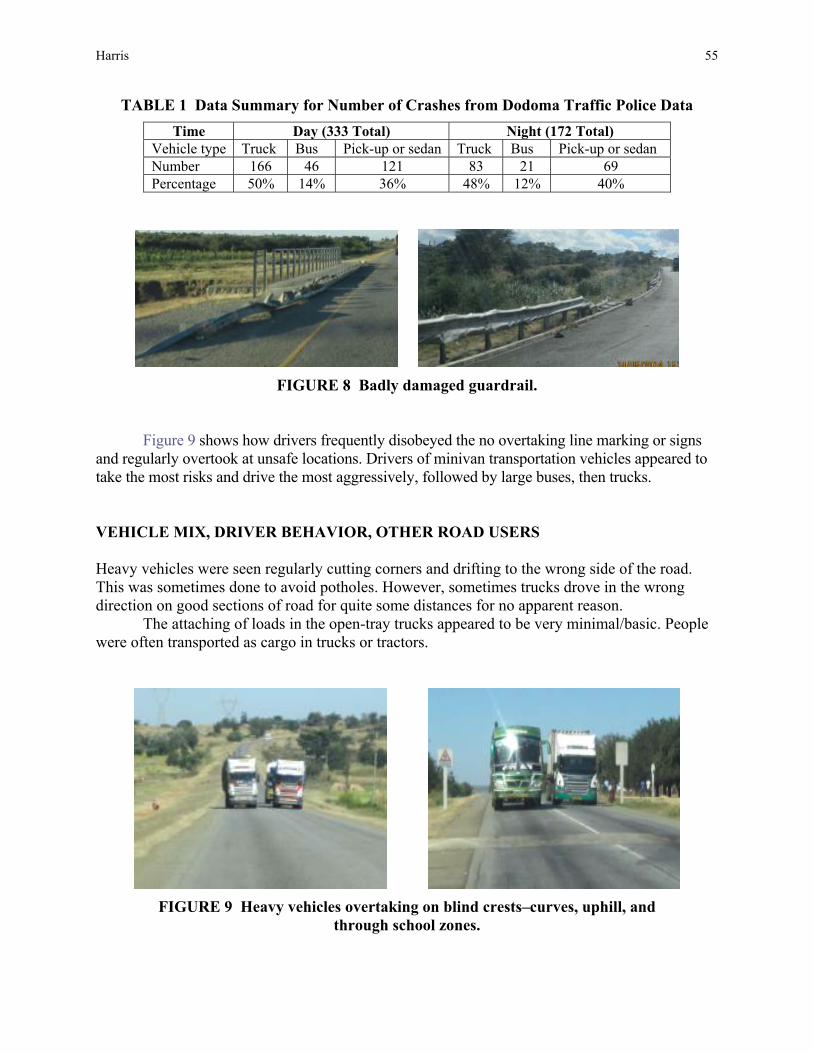
Harris 55
TABLE 1 Data Summary for Number of Crashes from Dodoma Traffic Police Data Time Day (333 Total) Night (172 Total)
Vehicle type Truck Bus Pick-up or sedan Truck Bus Pick-up or sedan Number 166 46 121 83 21 69 Percentage 50% 14% 36% 48% 12% 40%
FIGURE 8 Badly damaged guardrail.
Figure 9 shows how drivers frequently disobeyed the no overtaking line marking or signs
and regularly overtook at unsafe locations. Drivers of minivan transportation vehicles appeared to take the most risks and drive the most aggressively, followed by large buses, then trucks. VEHICLE MIX, DRIVER BEHAVIOR, OTHER ROAD USERS Heavy vehicles were seen regularly cutting corners and drifting to the wrong side of the road. This was sometimes done to avoid potholes. However, sometimes trucks drove in the wrong direction on good sections of road for quite some distances for no apparent reason.
The attaching of loads in the open-tray trucks appeared to be very minimal/basic. People were often transported as cargo in trucks or tractors.
FIGURE 9 Heavy vehicles overtaking on blind crests–curves, uphill, and
through school zones.
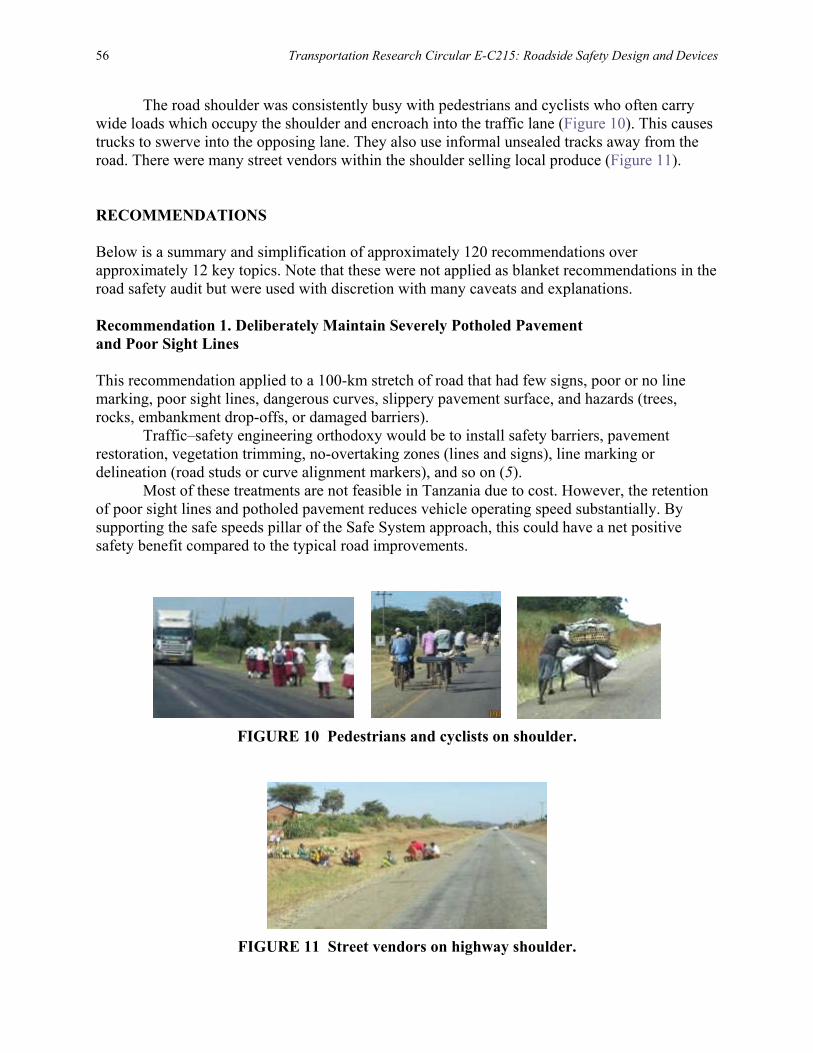
56 Transportation Research Circular E-C215: Roadside Safety Design and Devices
The road shoulder was consistently busy with pedestrians and cyclists who often carry wide loads which occupy the shoulder and encroach into the traffic lane (Figure 10). This causes trucks to swerve into the opposing lane. They also use informal unsealed tracks away from the road. There were many street vendors within the shoulder selling local produce (Figure 11). RECOMMENDATIONS Below is a summary and simplification of approximately 120 recommendations over approximately 12 key topics. Note that these were not applied as blanket recommendations in the road safety audit but were used with discretion with many caveats and explanations. Recommendation 1. Deliberately Maintain Severely Potholed Pavement and Poor Sight Lines This recommendation applied to a 100-km stretch of road that had few signs, poor or no line marking, poor sight lines, dangerous curves, slippery pavement surface, and hazards (trees, rocks, embankment drop-offs, or damaged barriers).
Traffic–safety engineering orthodoxy would be to install safety barriers, pavement restoration, vegetation trimming, no-overtaking zones (lines and signs), line marking or delineation (road studs or curve alignment markers), and so on (5).
Most of these treatments are not feasible in Tanzania due to cost. However, the retention of poor sight lines and potholed pavement reduces vehicle operating speed substantially. By supporting the safe speeds pillar of the Safe System approach, this could have a net positive safety benefit compared to the typical road improvements.
FIGURE 10 Pedestrians and cyclists on shoulder.
FIGURE 11 Street vendors on highway shoulder.
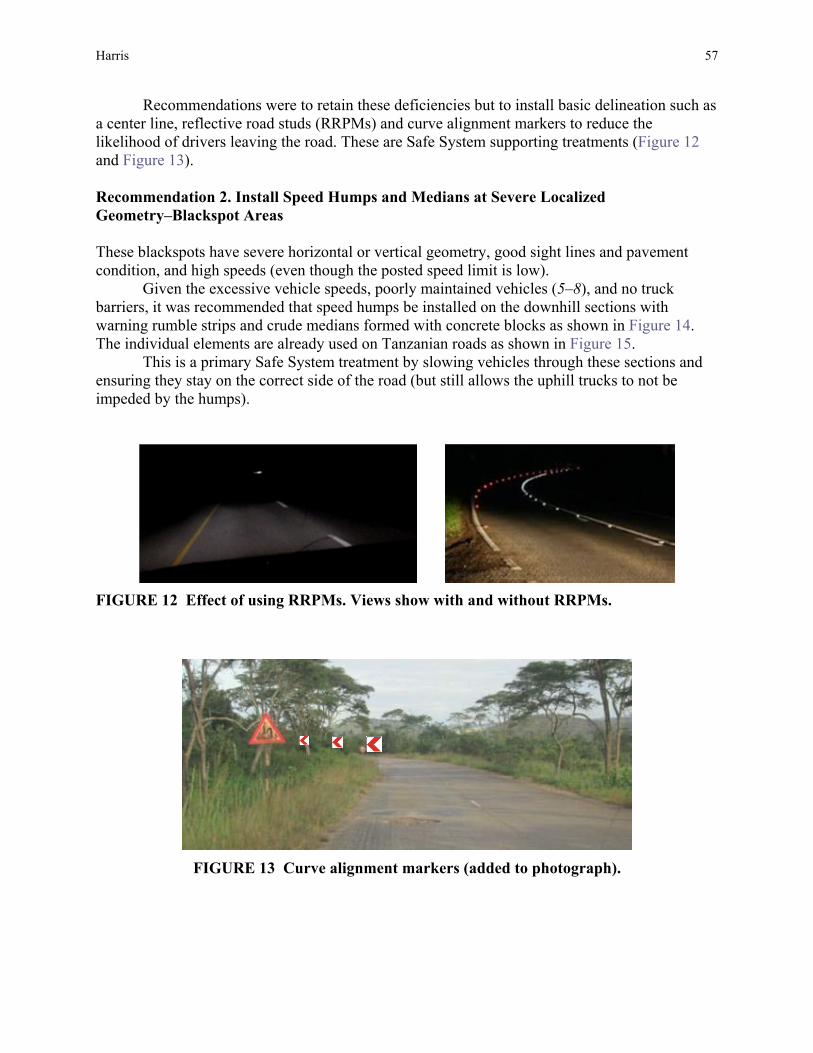
Harris 57
Recommendations were to retain these deficiencies but to install basic delineation such as a center line, reflective road studs (RRPMs) and curve alignment markers to reduce the likelihood of drivers leaving the road. These are Safe System supporting treatments (Figure 12 and Figure 13). Recommendation 2. Install Speed Humps and Medians at Severe Localized Geometry–Blackspot Areas These blackspots have severe horizontal or vertical geometry, good sight lines and pavement condition, and high speeds (even though the posted speed limit is low).
Given the excessive vehicle speeds, poorly maintained vehicles (5–8), and no truck barriers, it was recommended that speed humps be installed on the downhill sections with warning rumble strips and crude medians formed with concrete blocks as shown in Figure 14. The individual elements are already used on Tanzanian roads as shown in Figure 15.
This is a primary Safe System treatment by slowing vehicles through these sections and ensuring they stay on the correct side of the road (but still allows the uphill trucks to not be impeded by the humps).
FIGURE 12 Effect of using RRPMs. Views show with and without RRPMs.
FIGURE 13 Curve alignment markers (added to photograph).
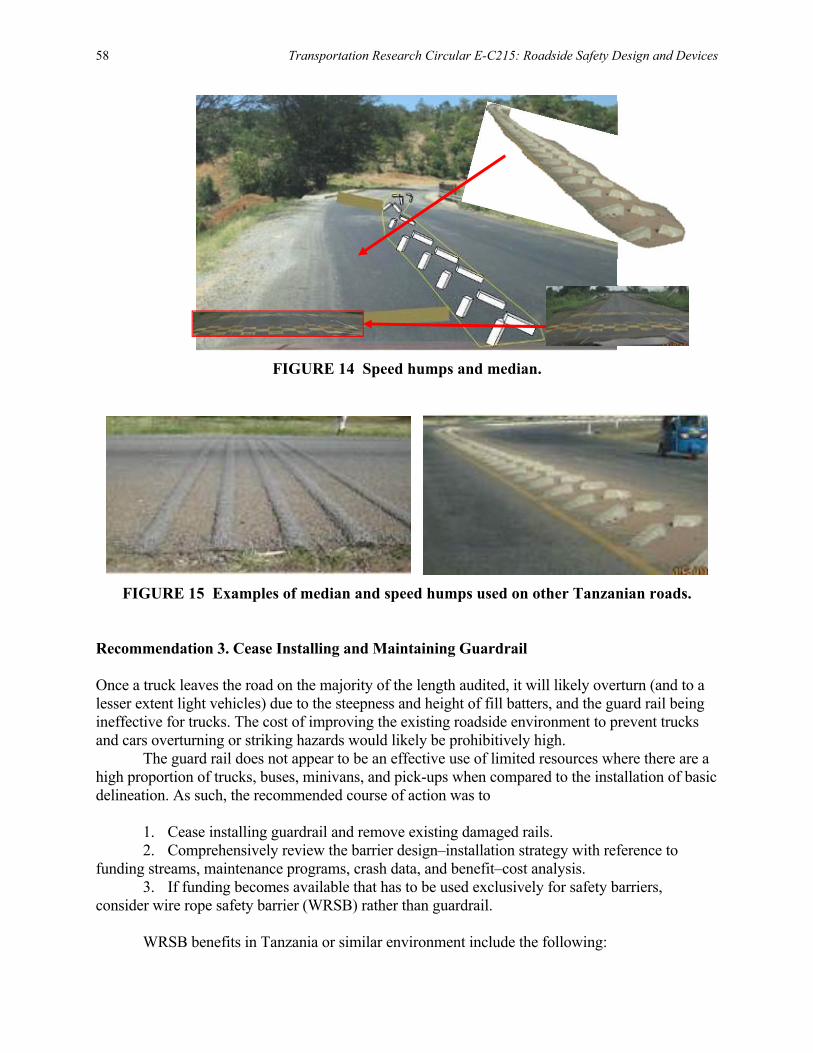
58 Transportation Research Circular E-C215: Roadside Safety Design and Devices
FIGURE 14 Speed humps and median.
FIGURE 15 Examples of median and speed humps used on other Tanzanian roads.
Recommendation 3. Cease Installing and Maintaining Guardrail Once a truck leaves the road on the majority of the length audited, it will likely overturn (and to a lesser extent light vehicles) due to the steepness and height of fill batters, and the guard rail being ineffective for trucks. The cost of improving the existing roadside environment to prevent trucks and cars overturning or striking hazards would likely be prohibitively high.
The guard rail does not appear to be an effective use of limited resources where there are a high proportion of trucks, buses, minivans, and pick-ups when compared to the installation of basic delineation. As such, the recommended course of action was to
1. Cease installing guardrail and remove existing damaged rails. 2. Comprehensively review the barrier design–installation strategy with reference to
funding streams, maintenance programs, crash data, and benefit–cost analysis. 3. If funding becomes available that has to be used exclusively for safety barriers,
consider wire rope safety barrier (WRSB) rather than guardrail. WRSB benefits in Tanzania or similar environment include the following:
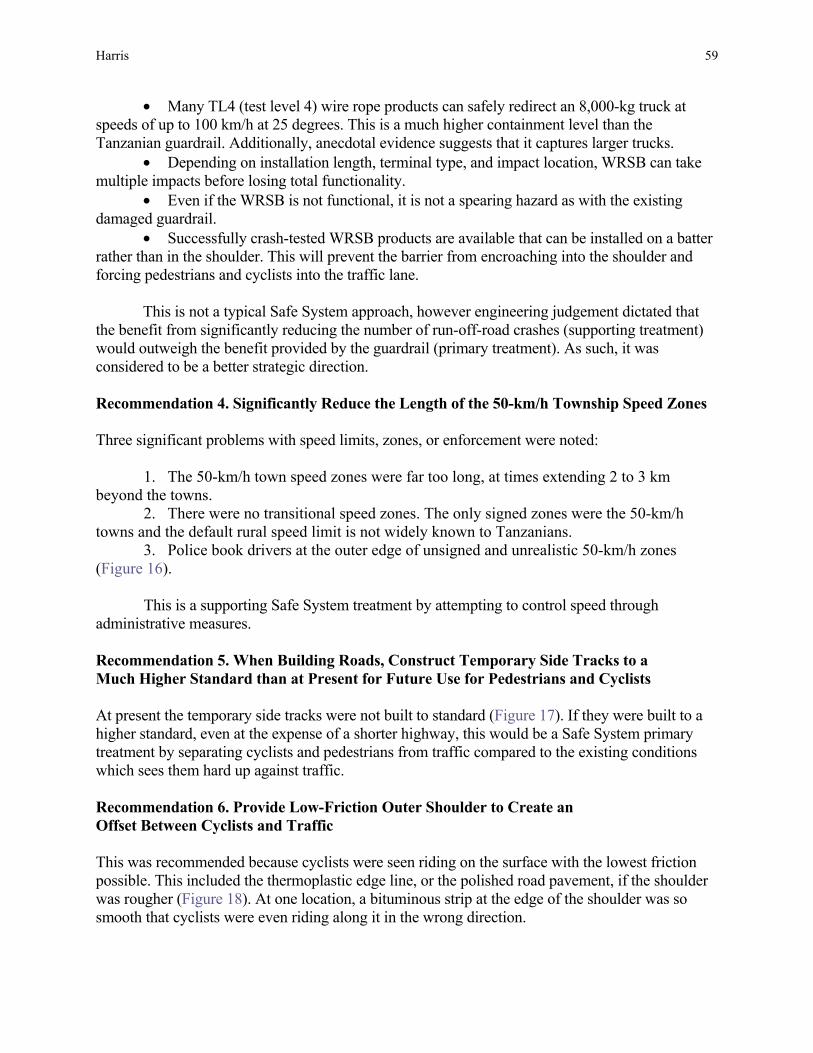
Harris 59
• Many TL4 (test level 4) wire rope products can safely redirect an 8,000-kg truck at speeds of up to 100 km/h at 25 degrees. This is a much higher containment level than the Tanzanian guardrail. Additionally, anecdotal evidence suggests that it captures larger trucks.
• Depending on installation length, terminal type, and impact location, WRSB can take multiple impacts before losing total functionality.
• Even if the WRSB is not functional, it is not a spearing hazard as with the existing damaged guardrail.
• Successfully crash-tested WRSB products are available that can be installed on a batter rather than in the shoulder. This will prevent the barrier from encroaching into the shoulder and forcing pedestrians and cyclists into the traffic lane.
This is not a typical Safe System approach, however engineering judgement dictated that the benefit from significantly reducing the number of run-off-road crashes (supporting treatment) would outweigh the benefit provided by the guardrail (primary treatment). As such, it was considered to be a better strategic direction. Recommendation 4. Significantly Reduce the Length of the 50-km/h Township Speed Zones Three significant problems with speed limits, zones, or enforcement were noted:
1. The 50-km/h town speed zones were far too long, at times extending 2 to 3 km beyond the towns.
2. There were no transitional speed zones. The only signed zones were the 50-km/h towns and the default rural speed limit is not widely known to Tanzanians.
3. Police book drivers at the outer edge of unsigned and unrealistic 50-km/h zones (Figure 16).
This is a supporting Safe System treatment by attempting to control speed through administrative measures. Recommendation 5. When Building Roads, Construct Temporary Side Tracks to a Much Higher Standard than at Present for Future Use for Pedestrians and Cyclists At present the temporary side tracks were not built to standard (Figure 17). If they were built to a higher standard, even at the expense of a shorter highway, this would be a Safe System primary treatment by separating cyclists and pedestrians from traffic compared to the existing conditions which sees them hard up against traffic. Recommendation 6. Provide Low-Friction Outer Shoulder to Create an Offset Between Cyclists and Traffic This was recommended because cyclists were seen riding on the surface with the lowest friction possible. This included the thermoplastic edge line, or the polished road pavement, if the shoulder was rougher (Figure 18). At one location, a bituminous strip at the edge of the shoulder was so smooth that cyclists were even riding along it in the wrong direction.
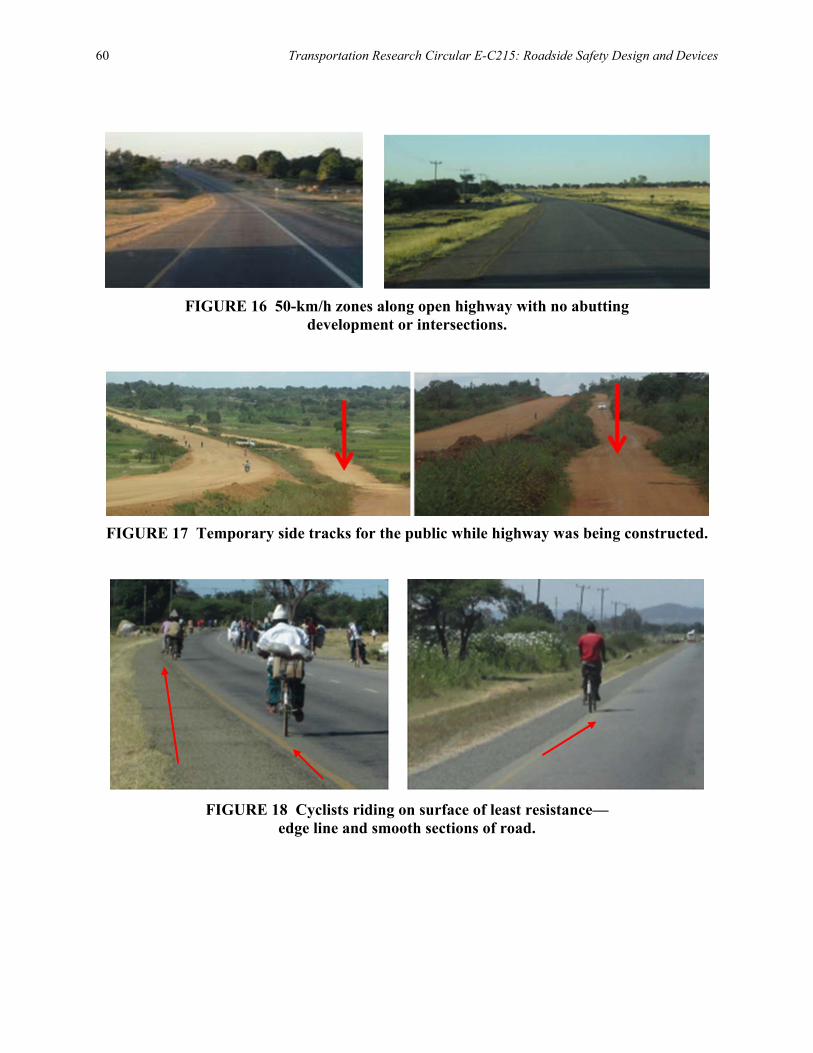
60 Transportation Research Circular E-C215: Roadside Safety Design and Devices
FIGURE 16 50-km/h zones along open highway with no abutting
development or intersections.
FIGURE 17 Temporary side tracks for the public while highway was being constructed.
FIGURE 18 Cyclists riding on surface of least resistance—
edge line and smooth sections of road.
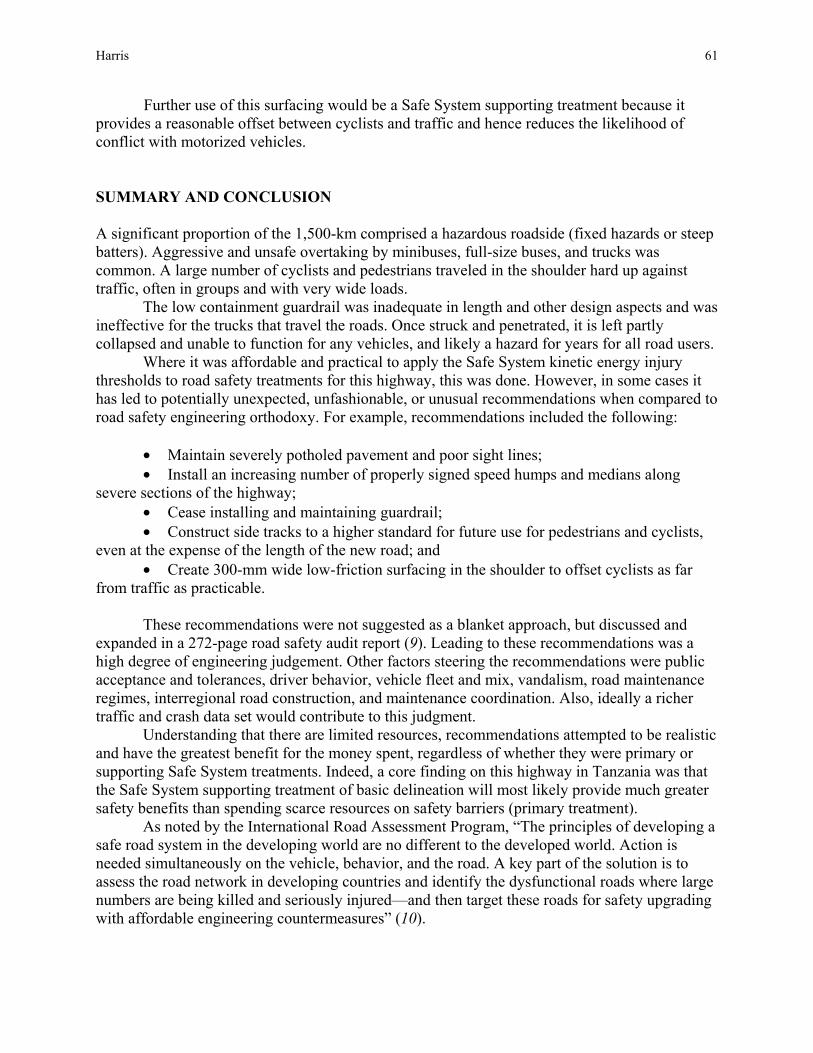
Harris 61
Further use of this surfacing would be a Safe System supporting treatment because it provides a reasonable offset between cyclists and traffic and hence reduces the likelihood of conflict with motorized vehicles. SUMMARY AND CONCLUSION A significant proportion of the 1,500-km comprised a hazardous roadside (fixed hazards or steep batters). Aggressive and unsafe overtaking by minibuses, full-size buses, and trucks was common. A large number of cyclists and pedestrians traveled in the shoulder hard up against traffic, often in groups and with very wide loads.
The low containment guardrail was inadequate in length and other design aspects and was ineffective for the trucks that travel the roads. Once struck and penetrated, it is left partly collapsed and unable to function for any vehicles, and likely a hazard for years for all road users.
Where it was affordable and practical to apply the Safe System kinetic energy injury thresholds to road safety treatments for this highway, this was done. However, in some cases it has led to potentially unexpected, unfashionable, or unusual recommendations when compared to road safety engineering orthodoxy. For example, recommendations included the following:
• Maintain severely potholed pavement and poor sight lines; • Install an increasing number of properly signed speed humps and medians along
severe sections of the highway; • Cease installing and maintaining guardrail; • Construct side tracks to a higher standard for future use for pedestrians and cyclists,
even at the expense of the length of the new road; and • Create 300-mm wide low-friction surfacing in the shoulder to offset cyclists as far
from traffic as practicable. These recommendations were not suggested as a blanket approach, but discussed and
expanded in a 272-page road safety audit report (9). Leading to these recommendations was a high degree of engineering judgement. Other factors steering the recommendations were public acceptance and tolerances, driver behavior, vehicle fleet and mix, vandalism, road maintenance regimes, interregional road construction, and maintenance coordination. Also, ideally a richer traffic and crash data set would contribute to this judgment.
Understanding that there are limited resources, recommendations attempted to be realistic and have the greatest benefit for the money spent, regardless of whether they were primary or supporting Safe System treatments. Indeed, a core finding on this highway in Tanzania was that the Safe System supporting treatment of basic delineation will most likely provide much greater safety benefits than spending scarce resources on safety barriers (primary treatment).
As noted by the International Road Assessment Program, “The principles of developing a safe road system in the developing world are no different to the developed world. Action is needed simultaneously on the vehicle, behavior, and the road. A key part of the solution is to assess the road network in developing countries and identify the dysfunctional roads where large numbers are being killed and seriously injured—and then target these roads for safety upgrading with affordable engineering countermeasures” (10).
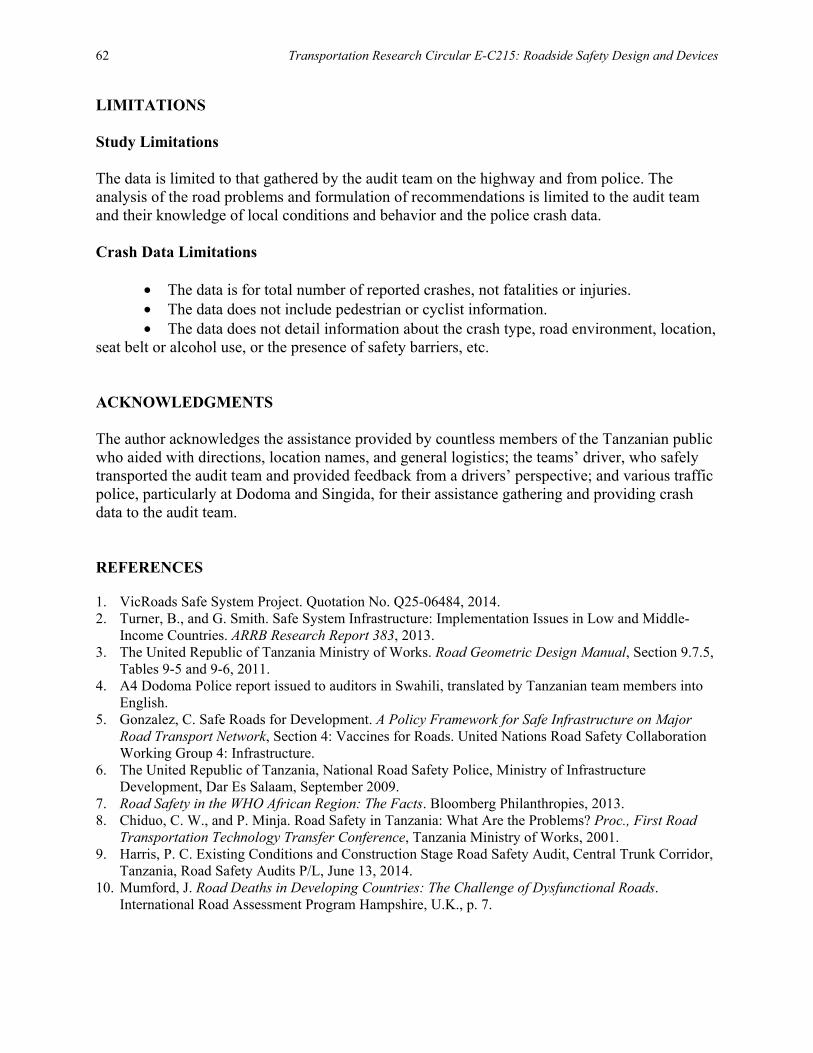
62 Transportation Research Circular E-C215: Roadside Safety Design and Devices
LIMITATIONS Study Limitations The data is limited to that gathered by the audit team on the highway and from police. The analysis of the road problems and formulation of recommendations is limited to the audit team and their knowledge of local conditions and behavior and the police crash data. Crash Data Limitations
• The data is for total number of reported crashes, not fatalities or injuries. • The data does not include pedestrian or cyclist information. • The data does not detail information about the crash type, road environment, location,
seat belt or alcohol use, or the presence of safety barriers, etc. ACKNOWLEDGMENTS The author acknowledges the assistance provided by countless members of the Tanzanian public who aided with directions, location names, and general logistics; the teams’ driver, who safely transported the audit team and provided feedback from a drivers’ perspective; and various traffic police, particularly at Dodoma and Singida, for their assistance gathering and providing crash data to the audit team. REFERENCES 1. VicRoads Safe System Project. Quotation No. Q25-06484, 2014. 2. Turner, B., and G. Smith. Safe System Infrastructure: Implementation Issues in Low and Middle-
Income Countries. ARRB Research Report 383, 2013. 3. The United Republic of Tanzania Ministry of Works. Road Geometric Design Manual, Section 9.7.5,
Tables 9-5 and 9-6, 2011. 4. A4 Dodoma Police report issued to auditors in Swahili, translated by Tanzanian team members into
English. 5. Gonzalez, C. Safe Roads for Development. A Policy Framework for Safe Infrastructure on Major
Road Transport Network, Section 4: Vaccines for Roads. United Nations Road Safety Collaboration Working Group 4: Infrastructure.
6. The United Republic of Tanzania, National Road Safety Police, Ministry of Infrastructure Development, Dar Es Salaam, September 2009.
7. Road Safety in the WHO African Region: The Facts. Bloomberg Philanthropies, 2013. 8. Chiduo, C. W., and P. Minja. Road Safety in Tanzania: What Are the Problems? Proc., First Road
Transportation Technology Transfer Conference, Tanzania Ministry of Works, 2001. 9. Harris, P. C. Existing Conditions and Construction Stage Road Safety Audit, Central Trunk Corridor,
Tanzania, Road Safety Audits P/L, June 13, 2014. 10. Mumford, J. Road Deaths in Developing Countries: The Challenge of Dysfunctional Roads.
International Road Assessment Program Hampshire, U.K., p. 7.
63
SESSION 3: SAFE SYSTEM AND ROADSIDES
Implementation and Evaluation of an Innovative Wide Centerline to Reduce Cross-Over-the-Centerline Crashes in Queensland
SIMON HARRISON
SAM ATABAK
Safer Roads, Department of Transport and Main Roads, Australia
HANFORD CHEUNG Safe Systems, ARRB Group, Australia
rashes involving vehicles crossing over center line, including head-on collisions, are one of the most severe type of crashes. In Queensland from 2007 to 2013 crossing centerline
crashes accounted for almost 31% of all fatal and serious injury (FSI) crashes, while head-on collisions accounted for 26% of all FSI crashes on high-speed roads (speed limits of 80 km/h and above). Centerline encroachments consist of an unintentional crossing of the center line, and is part of the chain of events for every cross centerline crash. Driver inattention and fatigue are thought to be leading contributing factors of cross centerline crashes.
There are a number of effective treatments to reduce cross over centerline crashes such as shoulder widening, road realignment, median retrofit, and additional lanes for overtaking. These countermeasures require substantial investment in the road infrastructure, and therefore the treatments are adopted in long-term capital programs. Wide centerline treatment (WCLT) has recently been recognized to be an effective and relatively low-cost countermeasure to reduce cross over centerline crashes, in particular head-on collisions. WCLT has been trialed in other states and overseas, but its effectiveness in reducing crashes has not been evaluated with confidence.
The WCLT provides greater separation between each lane of undivided traffic. The lines are painted as a dashed white line on sections of roads where passing is permitted, and a solid white line(s) in no passing areas. In Queensland, the traffic rule of a WCLT is the same as normal centerline markings. Where there is a double solid line marking or a double line marking where the solid line is closest to the traveling direction, overtaking is prohibited.
A technical guideline and best practices were developed by the Queensland’s Department of Transport and Main Roads (TMR) and the WCLT has been implemented on a number of key roads where cross over centerline crash rates were high and existing road width accommodated such a treatment. This paper summarizes the main findings in Queensland. LITERATURE REVIEW Previous studies have shown the effectiveness of the WCLT countermeasure in reducing cross-over-the-centerline crashes. Whittaker conducted a before and after study of the WCLT on the Bruce Highway between Cooroy and Curra using empirical Bayes statistical analysis (1). All types of crashes were significantly reduced; head-on collisions by 79% [standard deviation (SD) = 6.7%); run-off-road-left crashes by 59% (SD = 13.6%); and total crashes by 58% (SD = 7.4%).
C
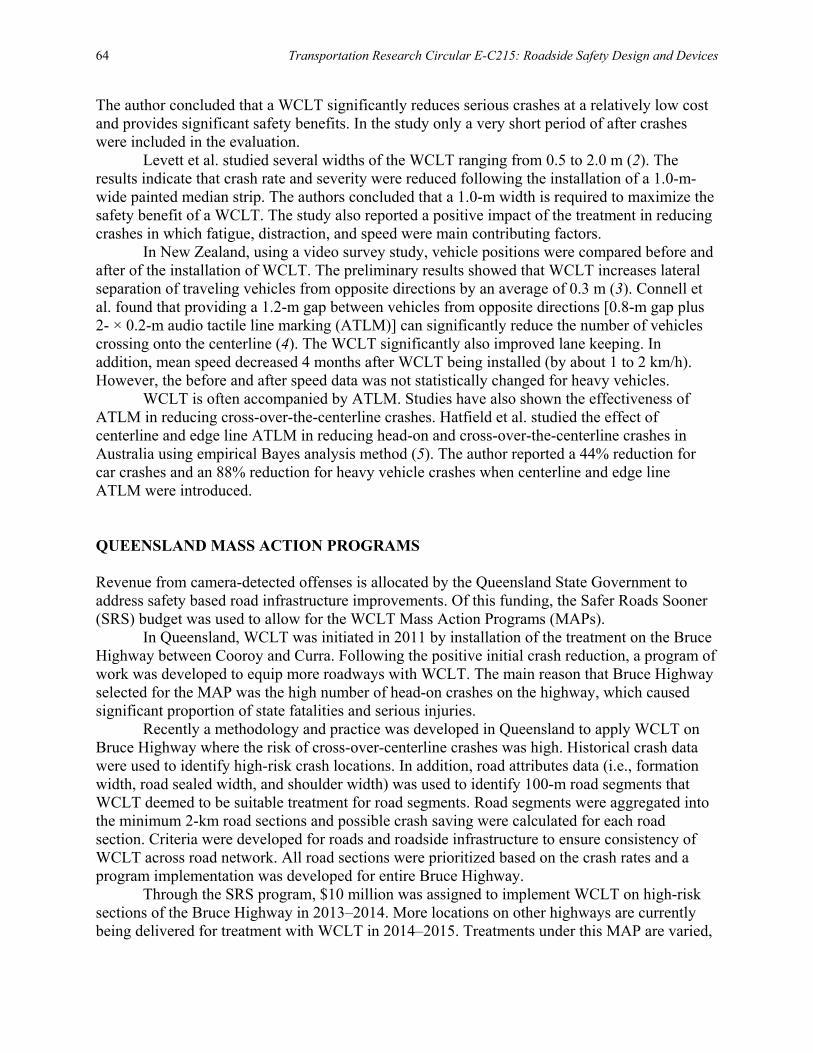
64 Transportation Research Circular E-C215: Roadside Safety Design and Devices
The author concluded that a WCLT significantly reduces serious crashes at a relatively low cost and provides significant safety benefits. In the study only a very short period of after crashes were included in the evaluation.
Levett et al. studied several widths of the WCLT ranging from 0.5 to 2.0 m (2). The results indicate that crash rate and severity were reduced following the installation of a 1.0-m-wide painted median strip. The authors concluded that a 1.0-m width is required to maximize the safety benefit of a WCLT. The study also reported a positive impact of the treatment in reducing crashes in which fatigue, distraction, and speed were main contributing factors.
In New Zealand, using a video survey study, vehicle positions were compared before and after of the installation of WCLT. The preliminary results showed that WCLT increases lateral separation of traveling vehicles from opposite directions by an average of 0.3 m (3). Connell et al. found that providing a 1.2-m gap between vehicles from opposite directions [0.8-m gap plus 2- × 0.2-m audio tactile line marking (ATLM)] can significantly reduce the number of vehicles crossing onto the centerline (4). The WCLT significantly also improved lane keeping. In addition, mean speed decreased 4 months after WCLT being installed (by about 1 to 2 km/h). However, the before and after speed data was not statistically changed for heavy vehicles.
WCLT is often accompanied by ATLM. Studies have also shown the effectiveness of ATLM in reducing cross-over-the-centerline crashes. Hatfield et al. studied the effect of centerline and edge line ATLM in reducing head-on and cross-over-the-centerline crashes in Australia using empirical Bayes analysis method (5). The author reported a 44% reduction for car crashes and an 88% reduction for heavy vehicle crashes when centerline and edge line ATLM were introduced. QUEENSLAND MASS ACTION PROGRAMS Revenue from camera-detected offenses is allocated by the Queensland State Government to address safety based road infrastructure improvements. Of this funding, the Safer Roads Sooner (SRS) budget was used to allow for the WCLT Mass Action Programs (MAPs).
In Queensland, WCLT was initiated in 2011 by installation of the treatment on the Bruce Highway between Cooroy and Curra. Following the positive initial crash reduction, a program of work was developed to equip more roadways with WCLT. The main reason that Bruce Highway selected for the MAP was the high number of head-on crashes on the highway, which caused significant proportion of state fatalities and serious injuries.
Recently a methodology and practice was developed in Queensland to apply WCLT on Bruce Highway where the risk of cross-over-centerline crashes was high. Historical crash data were used to identify high-risk crash locations. In addition, road attributes data (i.e., formation width, road sealed width, and shoulder width) was used to identify 100-m road segments that WCLT deemed to be suitable treatment for road segments. Road segments were aggregated into the minimum 2-km road sections and possible crash saving were calculated for each road section. Criteria were developed for roads and roadside infrastructure to ensure consistency of WCLT across road network. All road sections were prioritized based on the crash rates and a program implementation was developed for entire Bruce Highway.
Through the SRS program, $10 million was assigned to implement WCLT on high-risk sections of the Bruce Highway in 2013–2014. More locations on other highways are currently being delivered for treatment with WCLT in 2014–2015. Treatments under this MAP are varied,
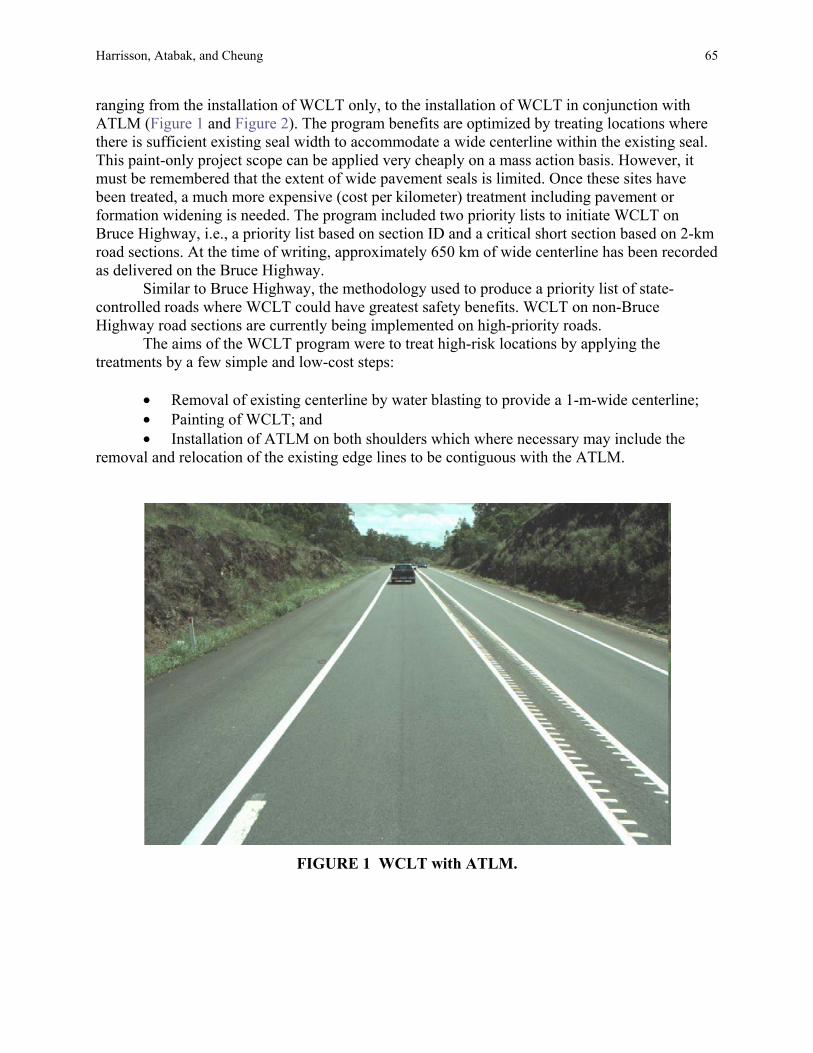
Harrisson, Atabak, and Cheung 65
ranging from the installation of WCLT only, to the installation of WCLT in conjunction with ATLM (Figure 1 and Figure 2). The program benefits are optimized by treating locations where there is sufficient existing seal width to accommodate a wide centerline within the existing seal. This paint-only project scope can be applied very cheaply on a mass action basis. However, it must be remembered that the extent of wide pavement seals is limited. Once these sites have been treated, a much more expensive (cost per kilometer) treatment including pavement or formation widening is needed. The program included two priority lists to initiate WCLT on Bruce Highway, i.e., a priority list based on section ID and a critical short section based on 2-km road sections. At the time of writing, approximately 650 km of wide centerline has been recorded as delivered on the Bruce Highway.
Similar to Bruce Highway, the methodology used to produce a priority list of state-controlled roads where WCLT could have greatest safety benefits. WCLT on non-Bruce Highway road sections are currently being implemented on high-priority roads.
The aims of the WCLT program were to treat high-risk locations by applying the treatments by a few simple and low-cost steps:
• Removal of existing centerline by water blasting to provide a 1-m-wide centerline; • Painting of WCLT; and • Installation of ATLM on both shoulders which where necessary may include the
removal and relocation of the existing edge lines to be contiguous with the ATLM.
FIGURE 1 WCLT with ATLM.
66 Transportation Research Circular E-C215: Roadside Safety Design and Devices
FIGURE 2 WCLT without ATLM.
The criteria for the locations of WCLT were • WCLT was applied to two-lane two way road sections where the existing seal was
greater than 10-m wide. • WCLT was applied to three- and four-lane road sections with overtaking facilities
where there was sufficient seal width to install the WCLT. • The posted speed limit was greater than 70 km/h. • The average annual daily traffic (AADT) of greater than 3,500 vehicles per day. • The type of WCLT treatment was dependent on existing overtaking opportunities and
provision of reasonable lengths of WCLT—namely where overtaking was prohibited—ATLM accompanied the WCLT and where directional and bidirectional overtaking was permitted, ATLM was not required.
• In the event of intersections and overtaking facilities occurring within a treatment zone, adequate transitioning zone between the above WCLT treatments was implemented.
• WCLT was appropriately tapered before and after narrow structures within the treatment section [the Guidelines for Road Design on Brownfield Sites (6) details these requirements].
• Additional signage was used to supplement WCLT treatment locations and increase motorist awareness.
• Within each treatment zone, a review of centerline markings on adjacent sections will be carried out to ensure optimal overtaking was considered and maintained.
• When installing WCLT in 10-m road width, a Design Exception Report was prepared (7). In this case, WCLT consists of two 100-mm wide painted line markings 1.0 m apart, 3.25-m traveling lanes, and 1.25-m shoulder width.
Harrisson, Atabak, and Cheung 67
• If run-off-road crashes were prevalent or traffic volume is more than 12,000 vehicles per day, then the ATLM was applied on both sides of the lane.
• WCLT may be achieved by reducing lane widths from 3.5 to 3.0 m, leaving the edge lines intact. While the speed limit was reduced on some road sections from 100 to 90 km/h, it was considered satisfactory to adopt these widths even where 100-km/h posted speed applies. SIGNS AND DELINEATION Appropriate signage and marking were installed in conjunction with WCLT. Traffic control standard drawings (TC 1978-1 to 3) provide details of delineation configurations (i.e., line marking, reflective raised pavement marking, and ATLM) for three types of WCLT: overtaking permitted in both directions, overtaking permitted in one direction, and overtaking not permitted. Details of the signage associated with WCLT are provided in traffic control standard drawings (TC 1979-1 to 4) (8). EVALUATION OF WCLT SAFETY PERFORMANCE Common approach of evaluating road safety treatments (that is, simple before–after study) contains a few known issues such as regression to the mean. Recent studies have shown that empirical Bayes methodology could address these issues and can estimate effectiveness of road safety interventions with more confidence. Empirical Bayes combines predicted crashes, using safety performance functions, and observed crashes to more precisely estimate after-treatment crashes.
Initial results from a research project by TMR and the ARRB group indicate that WCLT has been successful in reducing crashes on Bruce Highway. Total length of 70-km road sections was included in the evaluation (10A and 10B of Bruce Highway). The WCLT was implemented in August 2011.
A simple multivariate generalized linear regression was used to develop Safety Performance Functions (SPFs). Overdispersion parameter was applied to take into account variability of crash data. Three years before and 5 years after crash data were used in the evaluation.
The research showed that WCLT has reduced overall casualty crashes by approximately 25%.
The below equation was developed to estimate the number of crashes based on AADT and the WCLT length for all casualty crashes. The level of confidence in the quality of the model is higher when the model is used to predict crashes on other roads with similar conditions (that is, type of roads, AADT range, and the lengths).
SPFall casualty crashes = –2.58522274 + 0.00030048(AADT) + 1.144474825(length)
While other more-complex model techniques could have been applied, the linear regression model is a reasonable approximation as evident by the regression statistics (Table 1 and Table 2).
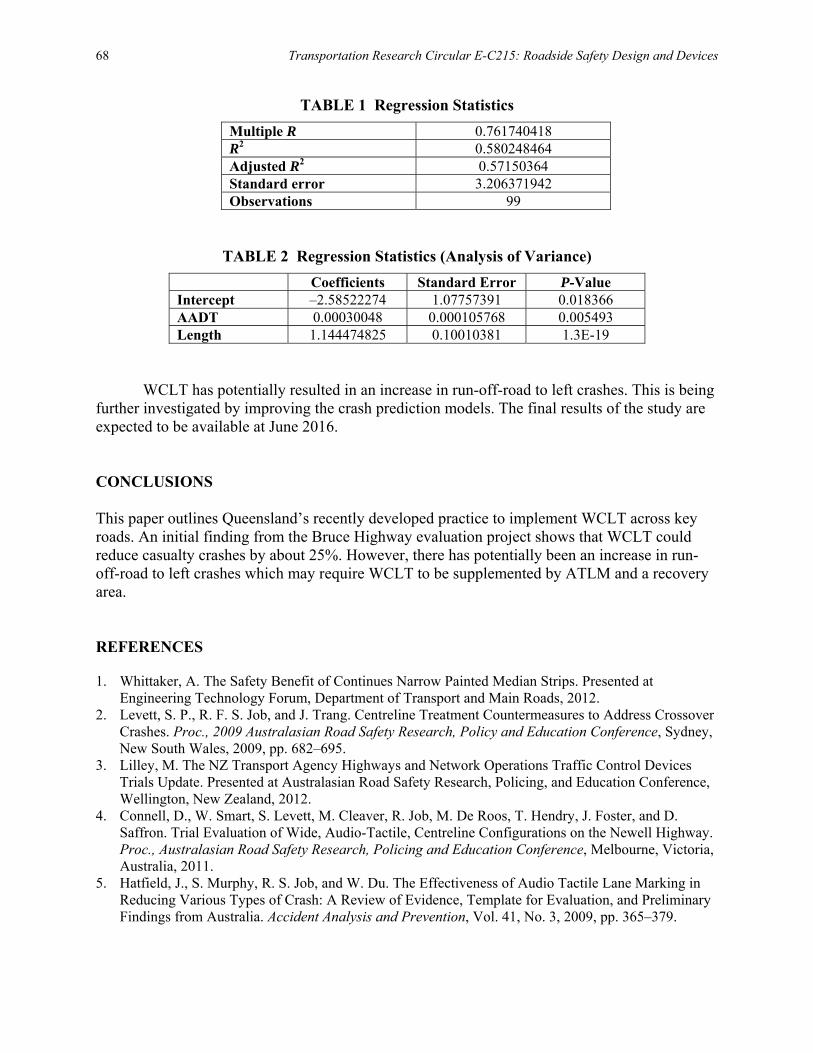
68 Transportation Research Circular E-C215: Roadside Safety Design and Devices
TABLE 1 Regression Statistics Multiple R 0.761740418 R2 0.580248464 Adjusted R2 0.57150364 Standard error 3.206371942 Observations 99
TABLE 2 Regression Statistics (Analysis of Variance) Coefficients Standard Error P-Value Intercept –2.58522274 1.07757391 0.018366 AADT 0.00030048 0.000105768 0.005493 Length 1.144474825 0.10010381 1.3E-19
WCLT has potentially resulted in an increase in run-off-road to left crashes. This is being further investigated by improving the crash prediction models. The final results of the study are expected to be available at June 2016. CONCLUSIONS This paper outlines Queensland’s recently developed practice to implement WCLT across key roads. An initial finding from the Bruce Highway evaluation project shows that WCLT could reduce casualty crashes by about 25%. However, there has potentially been an increase in run-off-road to left crashes which may require WCLT to be supplemented by ATLM and a recovery area. REFERENCES 1. Whittaker, A. The Safety Benefit of Continues Narrow Painted Median Strips. Presented at
Engineering Technology Forum, Department of Transport and Main Roads, 2012. 2. Levett, S. P., R. F. S. Job, and J. Trang. Centreline Treatment Countermeasures to Address Crossover
Crashes. Proc., 2009 Australasian Road Safety Research, Policy and Education Conference, Sydney, New South Wales, 2009, pp. 682–695.
3. Lilley, M. The NZ Transport Agency Highways and Network Operations Traffic Control Devices Trials Update. Presented at Australasian Road Safety Research, Policing, and Education Conference, Wellington, New Zealand, 2012.
4. Connell, D., W. Smart, S. Levett, M. Cleaver, R. Job, M. De Roos, T. Hendry, J. Foster, and D. Saffron. Trial Evaluation of Wide, Audio-Tactile, Centreline Configurations on the Newell Highway. Proc., Australasian Road Safety Research, Policing and Education Conference, Melbourne, Victoria, Australia, 2011.
5. Hatfield, J., S. Murphy, R. S. Job, and W. Du. The Effectiveness of Audio Tactile Lane Marking in Reducing Various Types of Crash: A Review of Evidence, Template for Evaluation, and Preliminary Findings from Australia. Accident Analysis and Prevention, Vol. 41, No. 3, 2009, pp. 365–379.

Harrisson, Atabak, and Cheung 69
6. TMR Guidelines for Road Design on Brownfield Sites. Department of Transport and Main Roads, 2013.
7. Bobbermen D. A Report to Support the Approval of the Design Exception for the Bruce Highway Wide Centre Line Treatment. Department of Transport and Main Roads, 2012.
8. Traffic Control Signs. Department of Transport and Main Roads.
70
SESSION 3: SAFE SYSTEM AND ROADSIDES
Recent Efforts to Enhance Road Safety in Nepal
TULASI SITAULA Ministry of Physical Infrastructure and Transport, Nepal
oad safety in Nepal has remained a neglected issue in the last few decades. There has been no lead agency authorized to plan, design, implement, and coordinate road safety programs.
This causes road safety to be nobody’s business. Annual traffic growth is at a double-digit rate. Loss of life due to road accidents is around five persons per day and this is a big number compared to population of 26 million and small vehicle fleet of 1.5 million vehicles.
Recently there are road safety programs and efforts dedicated to enhancing road safety. A Road Safety Council is about to be formed. A road safety strategy and action plan is in place. MEANS OF TRANSPORT IN NEPAL Roads and highways are the major form of transportation serving more than 90% of the movements of people and goods. Air transport covers about 8% of total transport movements in the country. There is only 52 km of narrow-gauge railway in Nepal, of which 29 km is operational and is now being upgraded to broad gauge with international assistance. Waterways are almost nonexistent, except for some boats run by private sector–individuals. STATUS OF ROAD SAFETY IN NEPAL The status of road safety in Nepal can be summarized as follows:
• Pedestrians are the most vulnerable groups because pedestrian safety has not been duly considered.
• People aged 15 to 40 years are most affected in road accidents followed by those older than 50 years.
• In the urban areas, there is a significant number of motorcycle accidents. • In the rural areas, there are significant numbers of truck and bus accidents. • Bus accidents along the long-distance routes are of serious concern accounting for
respectively 13% and 31% of all fatalities and serious injuries. Single-bus run-off-road crashes in mountainous terrain can result in fatal road traffic accidents of catastrophic proportions.
• About 30% to 40% of the accidents happen after sunset when traffic is low. • Driver negligence, drunk driving, random roadside parking, reckless pedestrian
crossing, poor road conditions, etc., are the major causes responsible for the accidents. • Accidents tend to cluster in urban areas at intersections and bridge approaches and in
rural areas on intersections and roadside built-up areas.
R
Harrisson, Atabak, and Cheung 71
From a conservative estimate, the economic loss from road traffic accidents in Nepal was at least 22.7 billion Nepalese rupees (US$41.2 million) annually or 0.4% of the gross national product at 2007 prices. Moreover, there is known accident underreporting. ONGOING ACTIVITIES Nepal has strong commitments to reduce the rate of accidents significantly by 2020 in line with United Nations (UN) Decade of Action for Road Safety and UNESCAP targets. The UN Decade of Action mandates member countries to develop their individual national plans for the decade (2011 to 2020) incorporating interventions under the following five pillars to road safety, which are
• Road safety management, • Safer roads and mobility, • Safer vehicles, • Safer road users, and • Post-crash response.
THE STRATEGY FOR ROAD SAFETY The government of Nepal has focus on road safety issues in its policy documents. It states “to develop a reliable, cost-effective, safe facility-oriented and sustainable transport system that promotes and sustains the economic, social, cultural and tourism development of Nepal as a whole.” Likewise, the vision and mission are well defined in National Road Safety Strategy 2013. Vision Safe road infrastructures and services backed with effective post-crash response and conducive environment resulting in little or no casualties from the road traffic accidents. Mission
1. To mitigate the loss of life, properties, and economic loss from road traffic accidents. 2. To complement the broader mission of the National Strategy on the Prevention and
Control of Violence, Injuries, and Disabilities. 3. To meet the targets of the UN Decade of Action.
[Note: Abstract prepared by the editors.]
72
SESSION 4: ROADSIDE SAFETY HARDWARE DEVELOPMENT AND TESTING
Can Australian Authorities Use a Common Guardrail Design?
BRUCE SNOOK Main Roads Western Australia
ustralia is the smallest continent and the sixth-largest country (by area) on Earth. It has a relatively small population, approaching 24 million, making its population the 56th largest,
with most people living in concentrated areas along the coast. The Australian mainland consists of five states and two territories. In addition, Tasmania, the sixth largest island, is also a state.
The eight states and territories have their own parliaments and administer themselves. Each state and territory manages its own road network and has a road authority that is responsible for the operation and infrastructure on its road network.
With the population centers separated by large distances, the development of each state and territory has been somewhat independent, resulting in differences between the infrastructure requirements of each state.
As an example of infrastructure differences, in Australia, the rail network developed three different gauge railway lines being used in different states.
In a similar vein, the public domain guardrail barrier specified by each of the eight states and territories in Australia are not the same—they are even referred to using different terminology.
This paper aims to identify the differences between the guardrails specified by the different Australian road authorities and explore how a common system may be adopted. BACKGROUND A guardrail is also referred to as a W-beam barrier, guard fence, and steel beam safety barrier, as well as proprietary terms such as Armco and flex beam.
The guardrail barrier has been used extensively around the world and originated in the United States. Its basic components consist of a horizontal steel rail supported on vertical posts.
Guardrail systems can be weak post systems or strong post systems. The differences between these systems include the following: • Weak post systems use a smaller post section and require no block out, as the post
does not cause snagging of the vehicle. • Strong post systems use a larger post section and therefore require a block out to keep
the vehicle from snagging on the post. The development of public domain guardrail systems in Australia has been based on the
strong post systems only.A public domain system is one that is not the subject of patent or other intellectual property rights.
Strong post guardrail systems consist of posts, block outs, and rail. The components are shown in Figure 1.
A
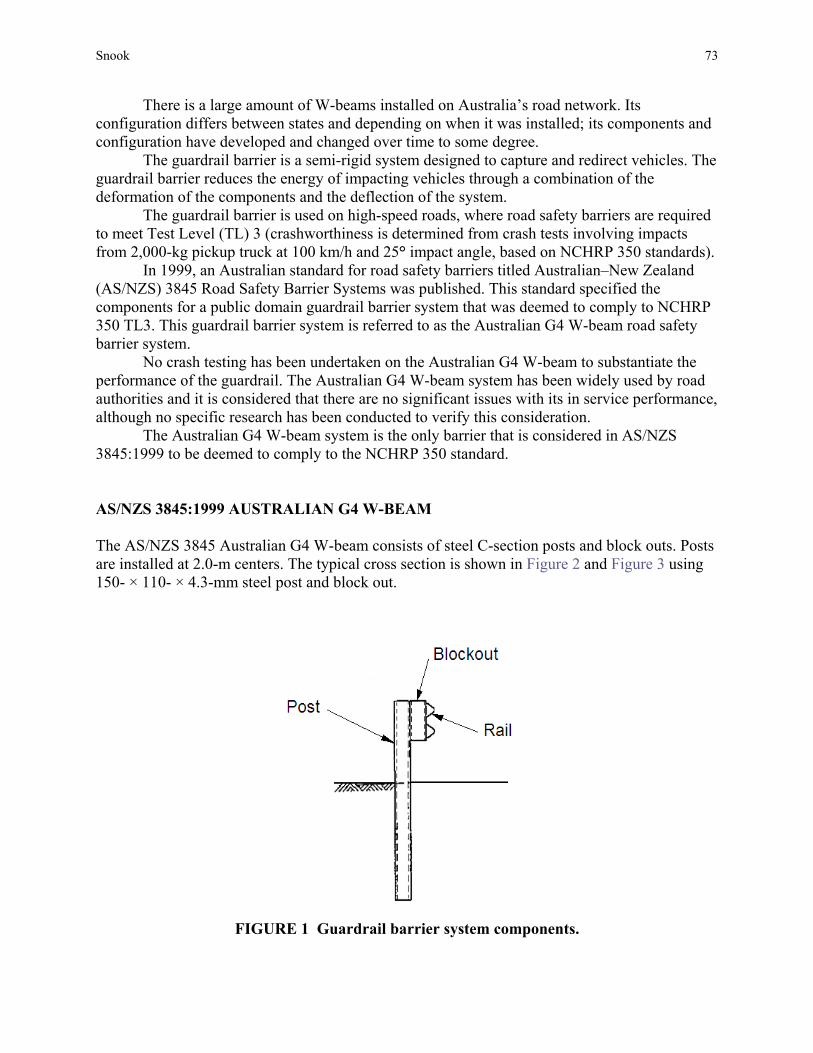
Snook 73
There is a large amount of W-beams installed on Australia’s road network. Its configuration differs between states and depending on when it was installed; its components and configuration have developed and changed over time to some degree.
The guardrail barrier is a semi-rigid system designed to capture and redirect vehicles. The guardrail barrier reduces the energy of impacting vehicles through a combination of the deformation of the components and the deflection of the system.
The guardrail barrier is used on high-speed roads, where road safety barriers are required to meet Test Level (TL) 3 (crashworthiness is determined from crash tests involving impacts from 2,000-kg pickup truck at 100 km/h and 25° impact angle, based on NCHRP 350 standards).
In 1999, an Australian standard for road safety barriers titled Australian–New Zealand (AS/NZS) 3845 Road Safety Barrier Systems was published. This standard specified the components for a public domain guardrail barrier system that was deemed to comply to NCHRP 350 TL3. This guardrail barrier system is referred to as the Australian G4 W-beam road safety barrier system.
No crash testing has been undertaken on the Australian G4 W-beam to substantiate the performance of the guardrail. The Australian G4 W-beam system has been widely used by road authorities and it is considered that there are no significant issues with its in service performance, although no specific research has been conducted to verify this consideration.
The Australian G4 W-beam system is the only barrier that is considered in AS/NZS 3845:1999 to be deemed to comply to the NCHRP 350 standard. AS/NZS 3845:1999 AUSTRALIAN G4 W-BEAM The AS/NZS 3845 Australian G4 W-beam consists of steel C-section posts and block outs. Posts are installed at 2.0-m centers. The typical cross section is shown in Figure 2 and Figure 3 using 150- × 110- × 4.3-mm steel post and block out.
FIGURE 1 Guardrail barrier system components.
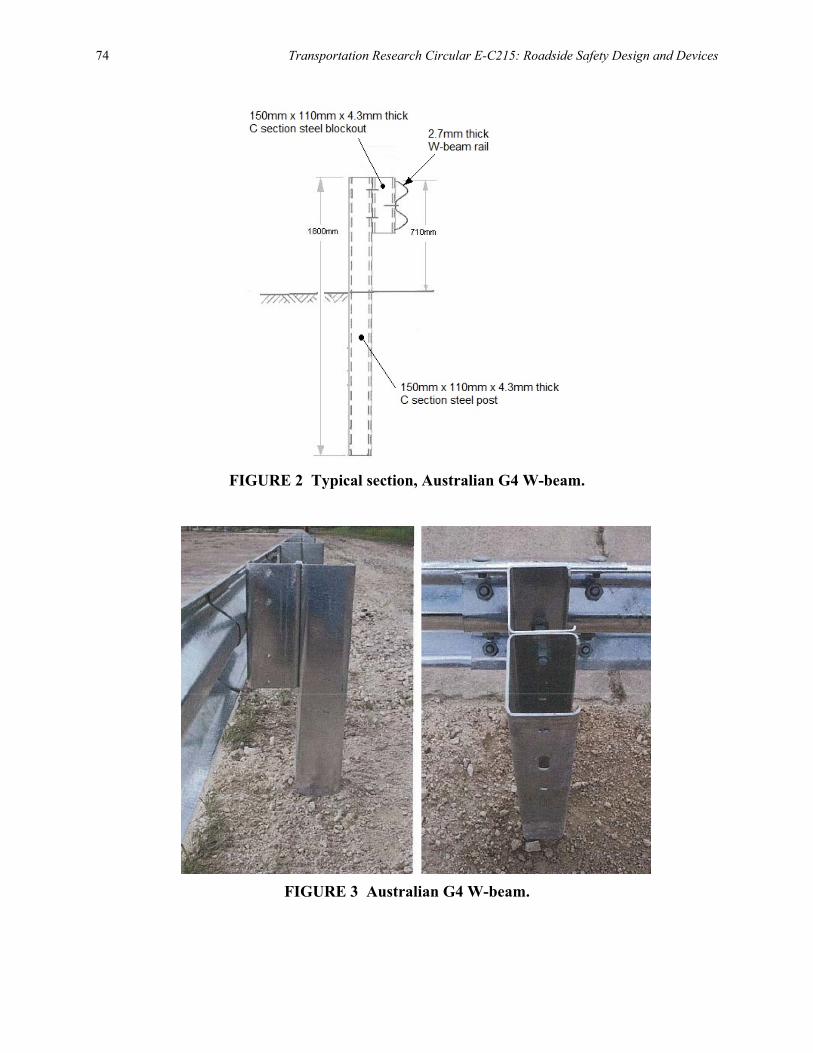
74 Transportation Research Circular E-C215: Roadside Safety Design and Devices
FIGURE 2 Typical section, Australian G4 W-beam.
FIGURE 3 Australian G4 W-beam.
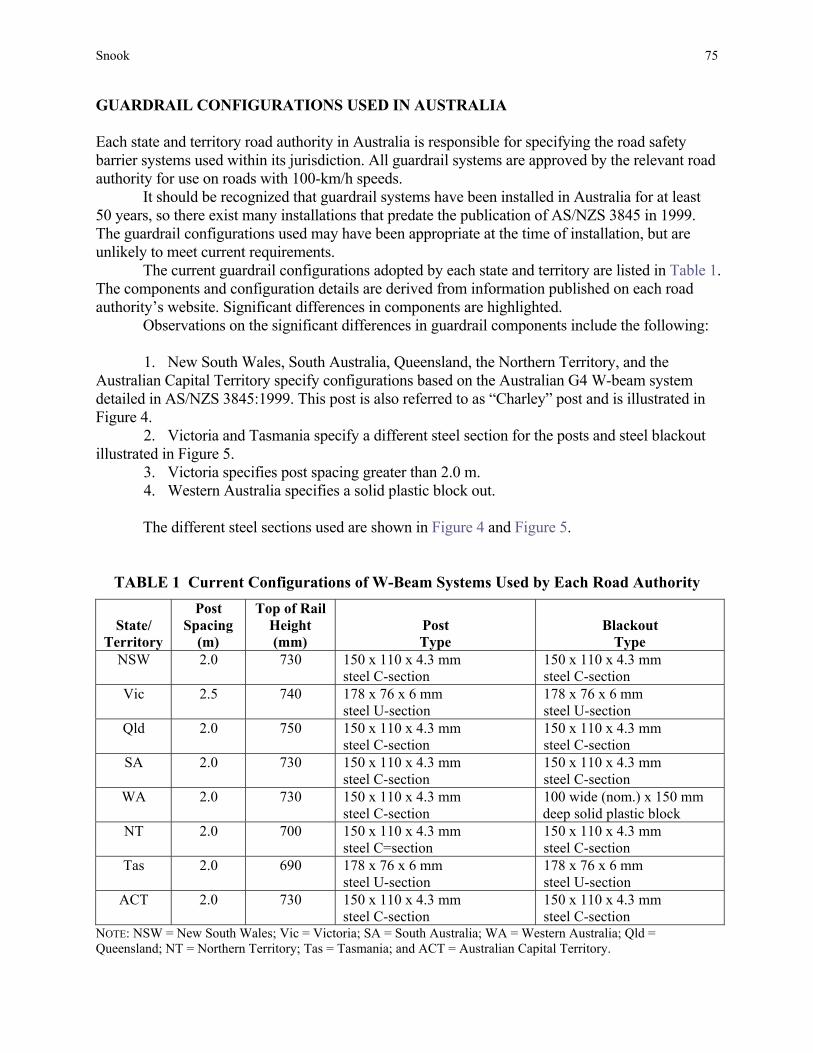
Snook 75
GUARDRAIL CONFIGURATIONS USED IN AUSTRALIA Each state and territory road authority in Australia is responsible for specifying the road safety barrier systems used within its jurisdiction. All guardrail systems are approved by the relevant road authority for use on roads with 100-km/h speeds.
It should be recognized that guardrail systems have been installed in Australia for at least 50 years, so there exist many installations that predate the publication of AS/NZS 3845 in 1999. The guardrail configurations used may have been appropriate at the time of installation, but are unlikely to meet current requirements.
The current guardrail configurations adopted by each state and territory are listed in Table 1. The components and configuration details are derived from information published on each road authority’s website. Significant differences in components are highlighted.
Observations on the significant differences in guardrail components include the following: 1. New South Wales, South Australia, Queensland, the Northern Territory, and the
Australian Capital Territory specify configurations based on the Australian G4 W-beam system detailed in AS/NZS 3845:1999. This post is also referred to as “Charley” post and is illustrated in Figure 4.
2. Victoria and Tasmania specify a different steel section for the posts and steel blackout illustrated in Figure 5.
3. Victoria specifies post spacing greater than 2.0 m. 4. Western Australia specifies a solid plastic block out.
The different steel sections used are shown in Figure 4 and Figure 5.
TABLE 1 Current Configurations of W-Beam Systems Used by Each Road Authority
State/ Territory
Post Spacing
(m)
Top of Rail Height (mm)
Post Type
Blackout Type
NSW 2.0 730 150 x 110 x 4.3 mm steel C-section
150 x 110 x 4.3 mm steel C-section
Vic 2.5 740 178 x 76 x 6 mm steel U-section
178 x 76 x 6 mm steel U-section
Qld 2.0 750 150 x 110 x 4.3 mm steel C-section
150 x 110 x 4.3 mm steel C-section
SA 2.0 730 150 x 110 x 4.3 mm steel C-section
150 x 110 x 4.3 mm steel C-section
WA 2.0 730 150 x 110 x 4.3 mm steel C-section
100 wide (nom.) x 150 mm deep solid plastic block
NT 2.0 700 150 x 110 x 4.3 mm steel C=section
150 x 110 x 4.3 mm steel C-section
Tas 2.0 690 178 x 76 x 6 mm steel U-section
178 x 76 x 6 mm steel U-section
ACT 2.0 730 150 x 110 x 4.3 mm steel C-section
150 x 110 x 4.3 mm steel C-section
NOTE: NSW = New South Wales; Vic = Victoria; SA = South Australia; WA = Western Australia; Qld = Queensland; NT = Northern Territory; Tas = Tasmania; and ACT = Australian Capital Territory.
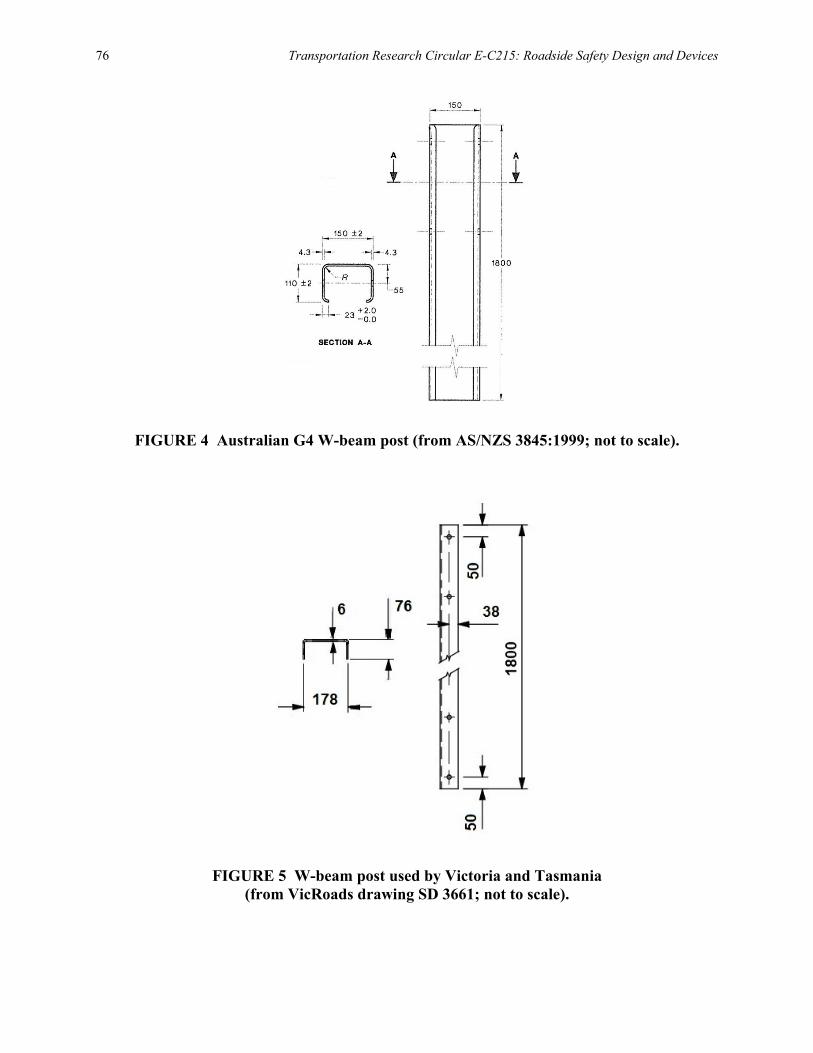
76 Transportation Research Circular E-C215: Roadside Safety Design and Devices
FIGURE 4 Australian G4 W-beam post (from AS/NZS 3845:1999; not to scale).
FIGURE 5 W-beam post used by Victoria and Tasmania
(from VicRoads drawing SD 3661; not to scale).
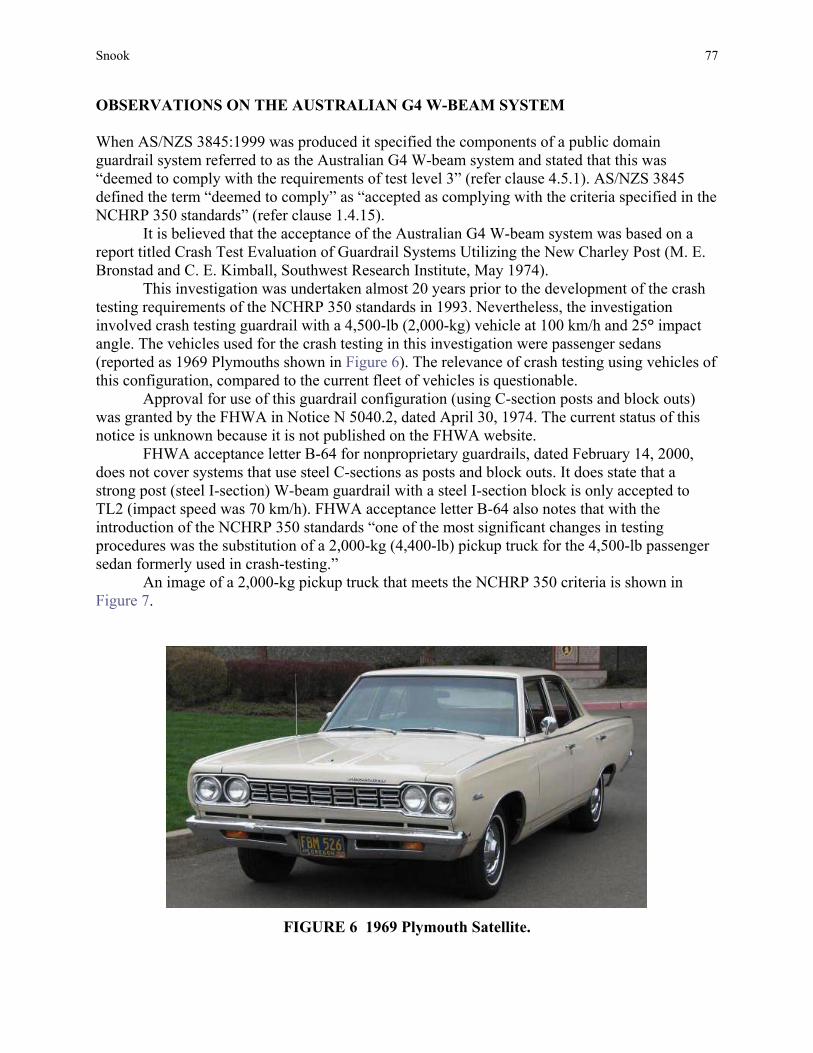
Snook 77
OBSERVATIONS ON THE AUSTRALIAN G4 W-BEAM SYSTEM When AS/NZS 3845:1999 was produced it specified the components of a public domain guardrail system referred to as the Australian G4 W-beam system and stated that this was “deemed to comply with the requirements of test level 3” (refer clause 4.5.1). AS/NZS 3845 defined the term “deemed to comply” as “accepted as complying with the criteria specified in the NCHRP 350 standards” (refer clause 1.4.15).
It is believed that the acceptance of the Australian G4 W-beam system was based on a report titled Crash Test Evaluation of Guardrail Systems Utilizing the New Charley Post (M. E. Bronstad and C. E. Kimball, Southwest Research Institute, May 1974).
This investigation was undertaken almost 20 years prior to the development of the crash testing requirements of the NCHRP 350 standards in 1993. Nevertheless, the investigation involved crash testing guardrail with a 4,500-lb (2,000-kg) vehicle at 100 km/h and 25° impact angle. The vehicles used for the crash testing in this investigation were passenger sedans (reported as 1969 Plymouths shown in Figure 6). The relevance of crash testing using vehicles of this configuration, compared to the current fleet of vehicles is questionable.
Approval for use of this guardrail configuration (using C-section posts and block outs) was granted by the FHWA in Notice N 5040.2, dated April 30, 1974. The current status of this notice is unknown because it is not published on the FHWA website.
FHWA acceptance letter B-64 for nonproprietary guardrails, dated February 14, 2000, does not cover systems that use steel C-sections as posts and block outs. It does state that a strong post (steel I-section) W-beam guardrail with a steel I-section block is only accepted to TL2 (impact speed was 70 km/h). FHWA acceptance letter B-64 also notes that with the introduction of the NCHRP 350 standards “one of the most significant changes in testing procedures was the substitution of a 2,000-kg (4,400-lb) pickup truck for the 4,500-lb passenger sedan formerly used in crash-testing.”
An image of a 2,000-kg pickup truck that meets the NCHRP 350 criteria is shown in Figure 7.
FIGURE 6 1969 Plymouth Satellite.
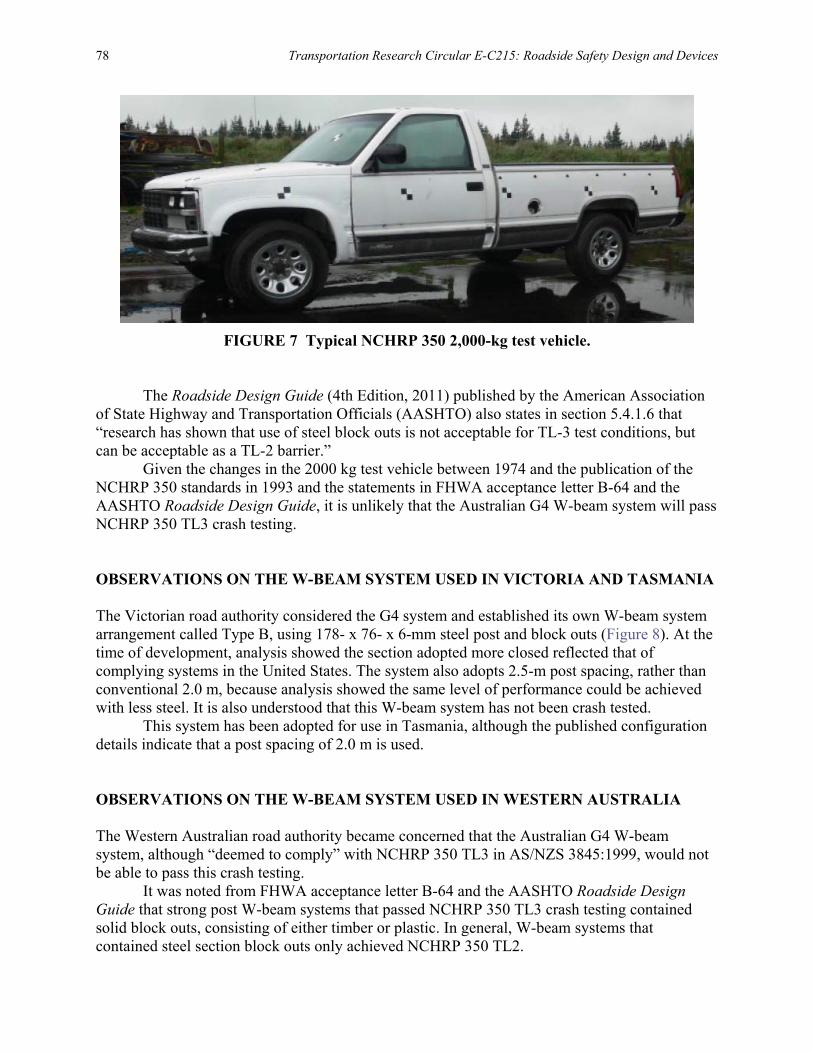
78 Transportation Research Circular E-C215: Roadside Safety Design and Devices
FIGURE 7 Typical NCHRP 350 2,000-kg test vehicle.
The Roadside Design Guide (4th Edition, 2011) published by the American Association of State Highway and Transportation Officials (AASHTO) also states in section 5.4.1.6 that “research has shown that use of steel block outs is not acceptable for TL-3 test conditions, but can be acceptable as a TL-2 barrier.”
Given the changes in the 2000 kg test vehicle between 1974 and the publication of the NCHRP 350 standards in 1993 and the statements in FHWA acceptance letter B-64 and the AASHTO Roadside Design Guide, it is unlikely that the Australian G4 W-beam system will pass NCHRP 350 TL3 crash testing. OBSERVATIONS ON THE W-BEAM SYSTEM USED IN VICTORIA AND TASMANIA The Victorian road authority considered the G4 system and established its own W-beam system arrangement called Type B, using 178- x 76- x 6-mm steel post and block outs (Figure 8). At the time of development, analysis showed the section adopted more closed reflected that of complying systems in the United States. The system also adopts 2.5-m post spacing, rather than conventional 2.0 m, because analysis showed the same level of performance could be achieved with less steel. It is also understood that this W-beam system has not been crash tested.
This system has been adopted for use in Tasmania, although the published configuration details indicate that a post spacing of 2.0 m is used. OBSERVATIONS ON THE W-BEAM SYSTEM USED IN WESTERN AUSTRALIA The Western Australian road authority became concerned that the Australian G4 W-beam system, although “deemed to comply” with NCHRP 350 TL3 in AS/NZS 3845:1999, would not be able to pass this crash testing.
It was noted from FHWA acceptance letter B-64 and the AASHTO Roadside Design Guide that strong post W-beam systems that passed NCHRP 350 TL3 crash testing contained solid block outs, consisting of either timber or plastic. In general, W-beam systems that contained steel section block outs only achieved NCHRP 350 TL2.
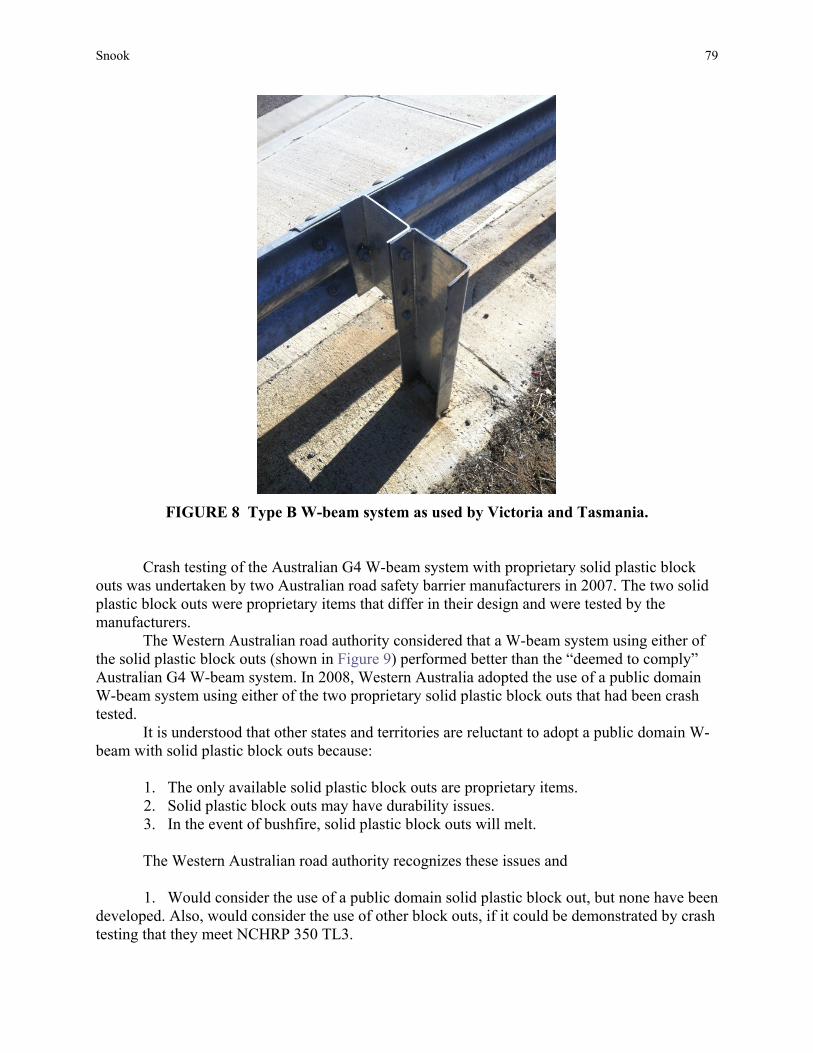
Snook 79
FIGURE 8 Type B W-beam system as used by Victoria and Tasmania.
Crash testing of the Australian G4 W-beam system with proprietary solid plastic block outs was undertaken by two Australian road safety barrier manufacturers in 2007. The two solid plastic block outs were proprietary items that differ in their design and were tested by the manufacturers.
The Western Australian road authority considered that a W-beam system using either of the solid plastic block outs (shown in Figure 9) performed better than the “deemed to comply” Australian G4 W-beam system. In 2008, Western Australia adopted the use of a public domain W-beam system using either of the two proprietary solid plastic block outs that had been crash tested.
It is understood that other states and territories are reluctant to adopt a public domain W-beam with solid plastic block outs because:
1. The only available solid plastic block outs are proprietary items. 2. Solid plastic block outs may have durability issues. 3. In the event of bushfire, solid plastic block outs will melt.
The Western Australian road authority recognizes these issues and 1. Would consider the use of a public domain solid plastic block out, but none have been
developed. Also, would consider the use of other block outs, if it could be demonstrated by crash testing that they meet NCHRP 350 TL3.
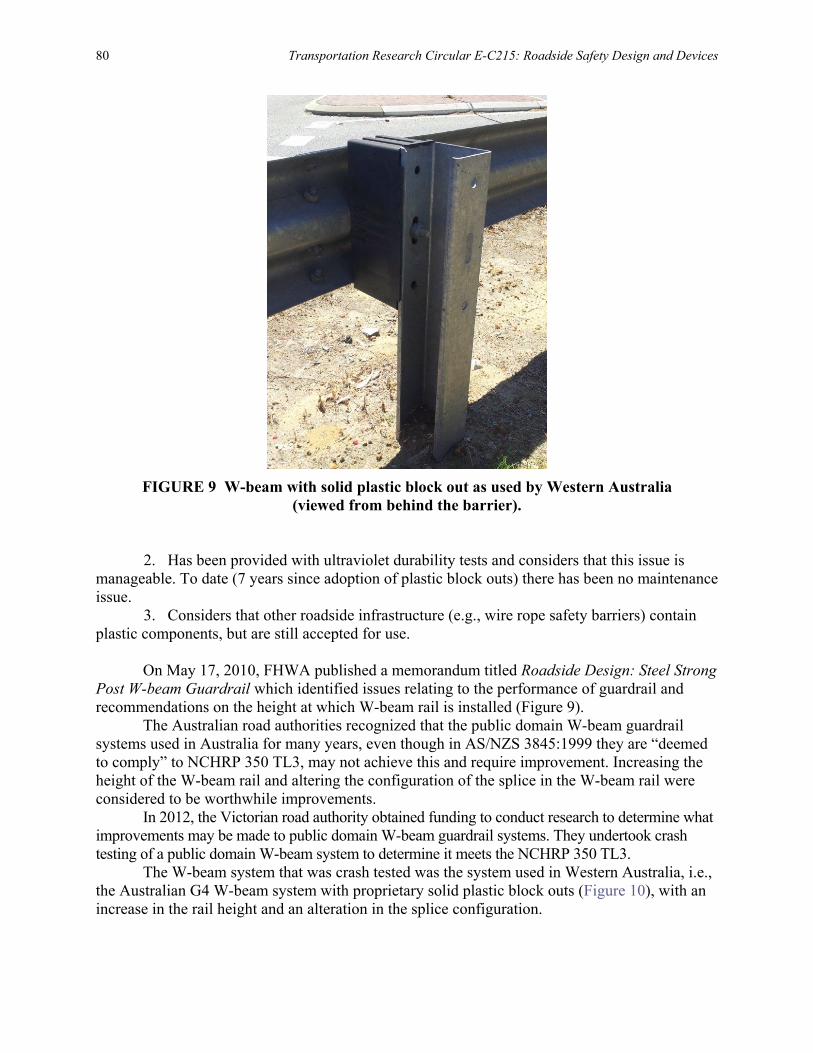
80 Transportation Research Circular E-C215: Roadside Safety Design and Devices
FIGURE 9 W-beam with solid plastic block out as used by Western Australia
(viewed from behind the barrier). 2. Has been provided with ultraviolet durability tests and considers that this issue is
manageable. To date (7 years since adoption of plastic block outs) there has been no maintenance issue.
3. Considers that other roadside infrastructure (e.g., wire rope safety barriers) contain plastic components, but are still accepted for use.
On May 17, 2010, FHWA published a memorandum titled Roadside Design: Steel Strong Post W-beam Guardrail which identified issues relating to the performance of guardrail and recommendations on the height at which W-beam rail is installed (Figure 9).
The Australian road authorities recognized that the public domain W-beam guardrail systems used in Australia for many years, even though in AS/NZS 3845:1999 they are “deemed to comply” to NCHRP 350 TL3, may not achieve this and require improvement. Increasing the height of the W-beam rail and altering the configuration of the splice in the W-beam rail were considered to be worthwhile improvements.
In 2012, the Victorian road authority obtained funding to conduct research to determine what improvements may be made to public domain W-beam guardrail systems. They undertook crash testing of a public domain W-beam system to determine it meets the NCHRP 350 TL3.
The W-beam system that was crash tested was the system used in Western Australia, i.e., the Australian G4 W-beam system with proprietary solid plastic block outs (Figure 10), with an increase in the rail height and an alteration in the splice configuration.
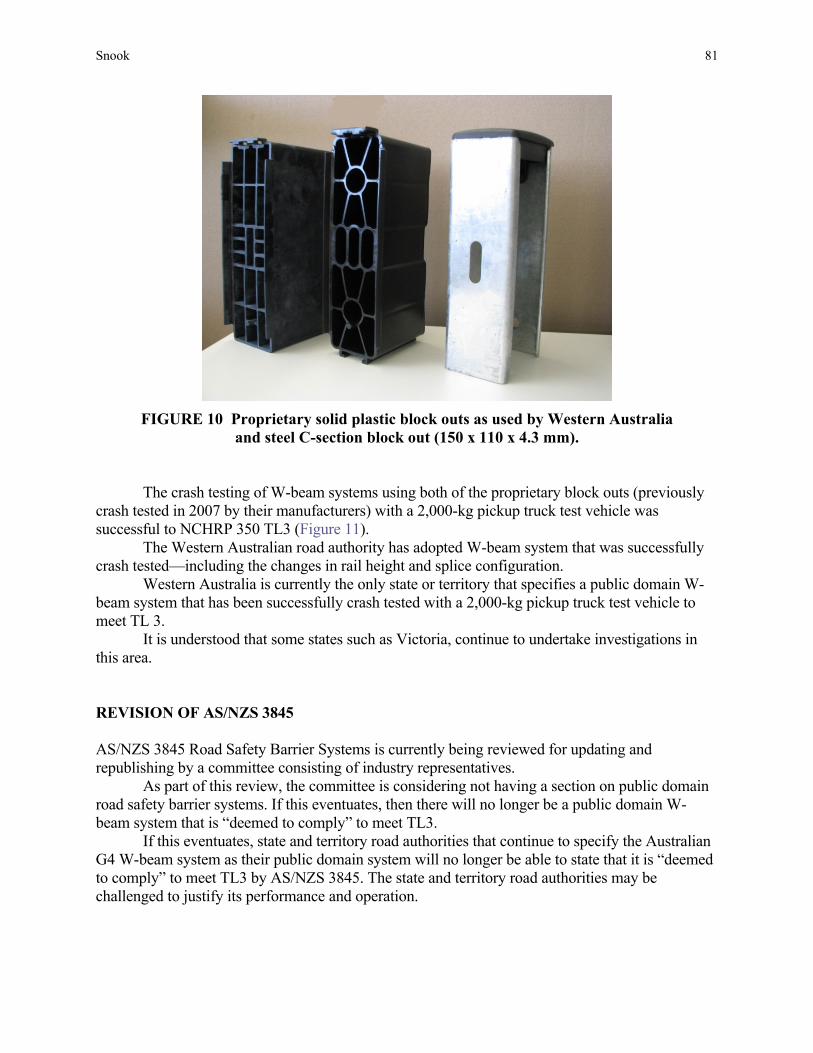
Snook 81
FIGURE 10 Proprietary solid plastic block outs as used by Western Australia
and steel C-section block out (150 x 110 x 4.3 mm). The crash testing of W-beam systems using both of the proprietary block outs (previously
crash tested in 2007 by their manufacturers) with a 2,000-kg pickup truck test vehicle was successful to NCHRP 350 TL3 (Figure 11).
The Western Australian road authority has adopted W-beam system that was successfully crash tested—including the changes in rail height and splice configuration.
Western Australia is currently the only state or territory that specifies a public domain W-beam system that has been successfully crash tested with a 2,000-kg pickup truck test vehicle to meet TL 3.
It is understood that some states such as Victoria, continue to undertake investigations in this area.
REVISION OF AS/NZS 3845 AS/NZS 3845 Road Safety Barrier Systems is currently being reviewed for updating and republishing by a committee consisting of industry representatives.
As part of this review, the committee is considering not having a section on public domain road safety barrier systems. If this eventuates, then there will no longer be a public domain W-beam system that is “deemed to comply” to meet TL3.
If this eventuates, state and territory road authorities that continue to specify the Australian G4 W-beam system as their public domain system will no longer be able to state that it is “deemed to comply” to meet TL3 by AS/NZS 3845. The state and territory road authorities may be challenged to justify its performance and operation.
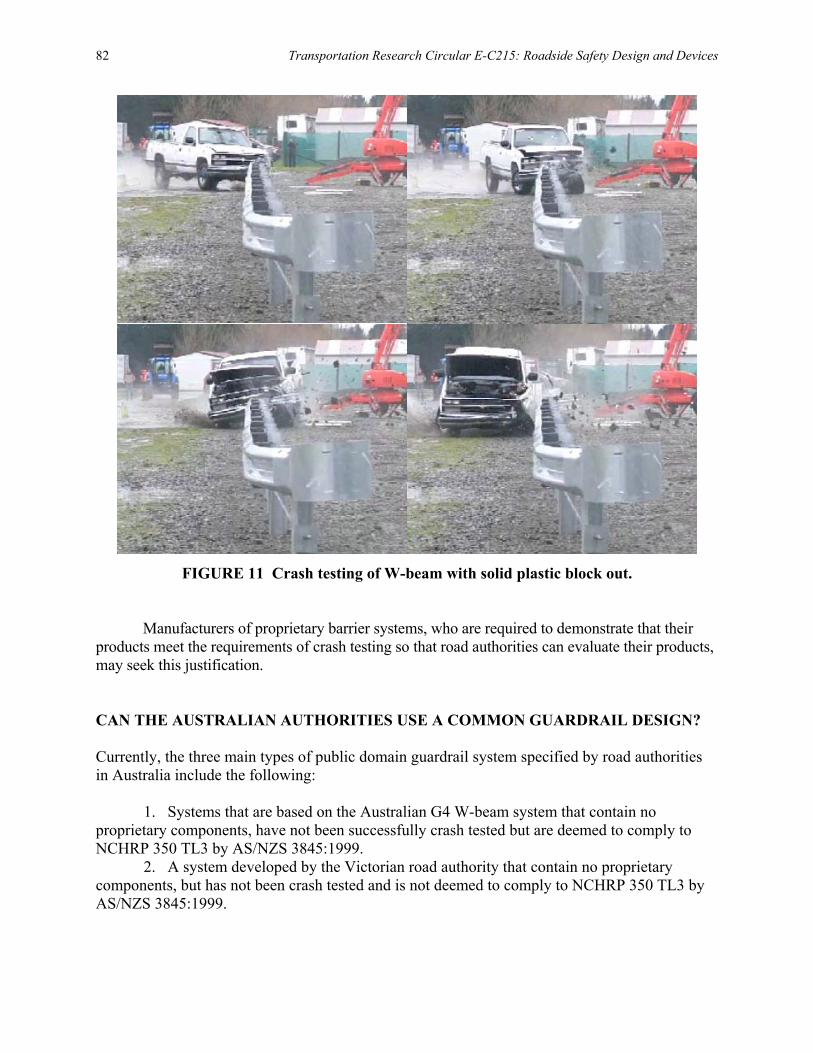
82 Transportation Research Circular E-C215: Roadside Safety Design and Devices
FIGURE 11 Crash testing of W-beam with solid plastic block out.
Manufacturers of proprietary barrier systems, who are required to demonstrate that their products meet the requirements of crash testing so that road authorities can evaluate their products, may seek this justification. CAN THE AUSTRALIAN AUTHORITIES USE A COMMON GUARDRAIL DESIGN? Currently, the three main types of public domain guardrail system specified by road authorities in Australia include the following:
1. Systems that are based on the Australian G4 W-beam system that contain no proprietary components, have not been successfully crash tested but are deemed to comply to NCHRP 350 TL3 by AS/NZS 3845:1999.
2. A system developed by the Victorian road authority that contain no proprietary components, but has not been crash tested and is not deemed to comply to NCHRP 350 TL3 by AS/NZS 3845:1999.
Snook 83
3. A system specified by the Western Australian road authority that has been successfully crash tested to NCHRP 350 TL3, but contains proprietary components that are plastic.
From this it can be observed that
• The road authorities of New South Wales, Queensland, South Australia, the Northern Territory, and the Australian Capital Territory accept the risk of specifying a public domain W-beam system that has not been successfully crash tested to NCHRP 350 TL3, but is deemed to comply to this test level by AS/NZS 3845:1999, although later American publications from the FHWA and AASHTO indicate the system is unlikely to meet this test level.
• The Victorian and Tasmanian road authorities accept the risk of specifying a public domain W-beam system that was developed by the Victorian road authority and has not been successfully crash tested to NCHRP 350 TL3, nor deemed to comply to this test level by AS/NZS 3845:1999.
• The Western Australian road authority considers it an unacceptable risk not to have a W-beam system that has been successfully crash tested to NCHRP 350 TL3.
• Until the road authorities of different states and territories agree on the relative risk associated with each aspect of the different public domain W-beam systems, then differences are likely to remain.
It is hoped that all road authorities strive to achieve the safest possible outcomes for all road users.
When AS/NZS 3845 Road Safety Barrier Systems is updated and republished, and if the public domain Australian G4 W-beam system is no longer deemed to comply to meet NCHRP 350 TL3 then the relative risk of each aspect may change for road authorities.
The road authority of each state and territory will continue to be responsible for the operation and infrastructure on its road network. It is unlikely that the states and territories would accept national jurisdiction controlling the types of infrastructure used on the states and territories roads.
If road authorities of the states and territories do change their public domain W-beam systems to a common design, then this will only affect new systems. W-beam that has been installed to date will be maintained in its current configuration—so this will be an additional maintenance issue for the road authorities.
With reference to Table 1, there are many components of the different W-beam systems that are common between the different states and territories. It is unlikely that adoption of a common public domain W-beam system by all states and territories would provide significant costs savings by reducing the number of different components. Even if a common public domain W-beam system was adopted by all states and territories, there would still be a requirement to provide components to maintain the existing W-beam systems installed across the Australian road network.
Manufacturers of public domain W-beam components also support proprietary W-beam systems that require approval of road authorities. Approval is generally only granted when performance of the barrier system has been assessed and is demonstrated through successful crash testing. Manufacturers may consider that this requirement should also be applied to public

84 Transportation Research Circular E-C215: Roadside Safety Design and Devices
domain W-beam systems, rather than road authorities accepting the deemed-to-comply statement in AS 3845:1999.
In the meantime “vive la différence.” Perhaps we should celebrate that there are only three distinct types of public domain W-beam systems specified by road authorities in an area as large as Australia.
85
SESSION 4: ROADSIDE SAFETY HARDWARE DEVELOPMENT AND TESTING
Developing a Safer Impact-Absorbing Street Lighting Pole for Urban Environments and Review of
Test Requirements and Pass–Fail Criteria
NOEL O’CALLAGHAN ADAM PYRZAKOWSKI
Department of Planning, Transport and Infrastructure, South Australia
GRAD ZIVKOVIC Automotive Safety Engineering Pty Ltd
ccording to Australian Road Transport Statistics, every third accident is a single-vehicle accident and involves a collision with a roadside object, such as trees, utility poles, bridge
fences, buildings, and others. Therefore, it is important to improve the performance of roadside street furniture in order to reduce the road toll.
This paper presents an overview of the development process for a new safer impact-absorbing street lighting pole (IASLP) using a dual crumple zone. There are two types of frangible street light poles used in Australia: slip-base street light poles (SBSLP) and IASLP. The SBSLP is commonly used in outer metropolitan areas where there is minimal or no pedestrian traffic. Its mode of operation is to detach and provide minimum resistance to an impacting out-of-control vehicle. Due to this breakaway feature, the impacting vehicle deceleration is low and could result in no injuries to the vehicle occupants. On the other hand, the IASLP is predominantly used in inner-metropolitan areas, where pedestrian traffic is significant and a probability of injuring pedestrians by the falling pole is high. The IASLP is designed to deform and absorb energy during impact. It should stay attached to the pole base, safely arrest the vehicle, and not harm its occupants. The IASLP must deform progressively and in a predictable manner so it does not present danger to the pedestrians or other road users. There are two types of footing for IASLP: in ground and base plate mounted. This paper deals with base plate-mounted IASLP which is preferred by some road authorities for maintenance reasons. The IASLPs have been used on Australian roads for more than 20 years and some have been tested using an average Australian car with a mass of 1,200 kg and traveling at 60 km/h. This type of IASLP has only one crumple zone, optimized for one impact energy level. In line with changing crash testing requirement for other road safety hardware such as crash cushions or road barriers, it was important to advance towards more-realistic and more-effective designs, utilizing smaller vehicles at lower speeds and heavier vehicles at higher speeds. A dual crumple zone pole has been developed in response to this requirement. Moreover, to improve shear strength of this pole, the column at the base has been reinforced and to produce safer response to vehicle impact, the base plate has been lowered underground.
While developing this new design for IASLP, testing authorities in Australia and overseas appear to have different interpretations of the pass–fail criteria, which may lead to acceptance of unsafe designs.
A
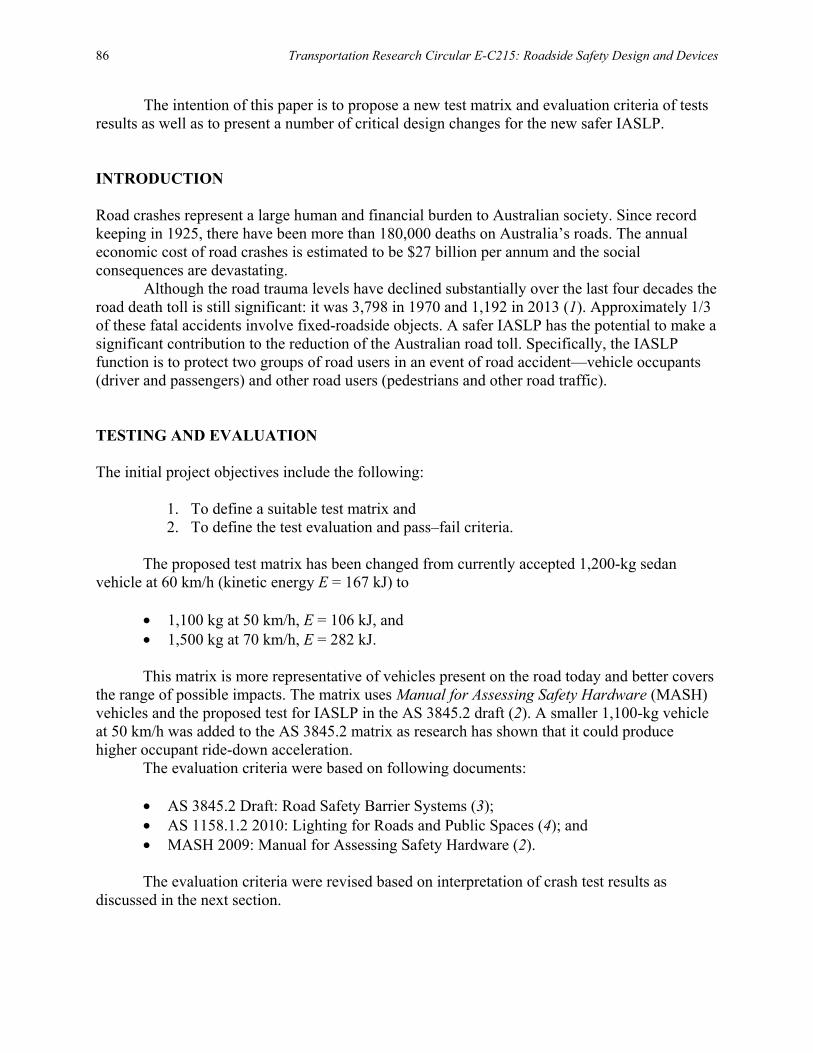
86 Transportation Research Circular E-C215: Roadside Safety Design and Devices
The intention of this paper is to propose a new test matrix and evaluation criteria of tests results as well as to present a number of critical design changes for the new safer IASLP. INTRODUCTION Road crashes represent a large human and financial burden to Australian society. Since record keeping in 1925, there have been more than 180,000 deaths on Australia’s roads. The annual economic cost of road crashes is estimated to be $27 billion per annum and the social consequences are devastating.
Although the road trauma levels have declined substantially over the last four decades the road death toll is still significant: it was 3,798 in 1970 and 1,192 in 2013 (1). Approximately 1/3 of these fatal accidents involve fixed-roadside objects. A safer IASLP has the potential to make a significant contribution to the reduction of the Australian road toll. Specifically, the IASLP function is to protect two groups of road users in an event of road accident—vehicle occupants (driver and passengers) and other road users (pedestrians and other road traffic). TESTING AND EVALUATION The initial project objectives include the following:
1. To define a suitable test matrix and 2. To define the test evaluation and pass–fail criteria.
The proposed test matrix has been changed from currently accepted 1,200-kg sedan
vehicle at 60 km/h (kinetic energy E = 167 kJ) to • 1,100 kg at 50 km/h, E = 106 kJ, and • 1,500 kg at 70 km/h, E = 282 kJ. This matrix is more representative of vehicles present on the road today and better covers
the range of possible impacts. The matrix uses Manual for Assessing Safety Hardware (MASH) vehicles and the proposed test for IASLP in the AS 3845.2 draft (2). A smaller 1,100-kg vehicle at 50 km/h was added to the AS 3845.2 matrix as research has shown that it could produce higher occupant ride-down acceleration.
The evaluation criteria were based on following documents: • AS 3845.2 Draft: Road Safety Barrier Systems (3); • AS 1158.1.2 2010: Lighting for Roads and Public Spaces (4); and • MASH 2009: Manual for Assessing Safety Hardware (2). The evaluation criteria were revised based on interpretation of crash test results as
discussed in the next section.
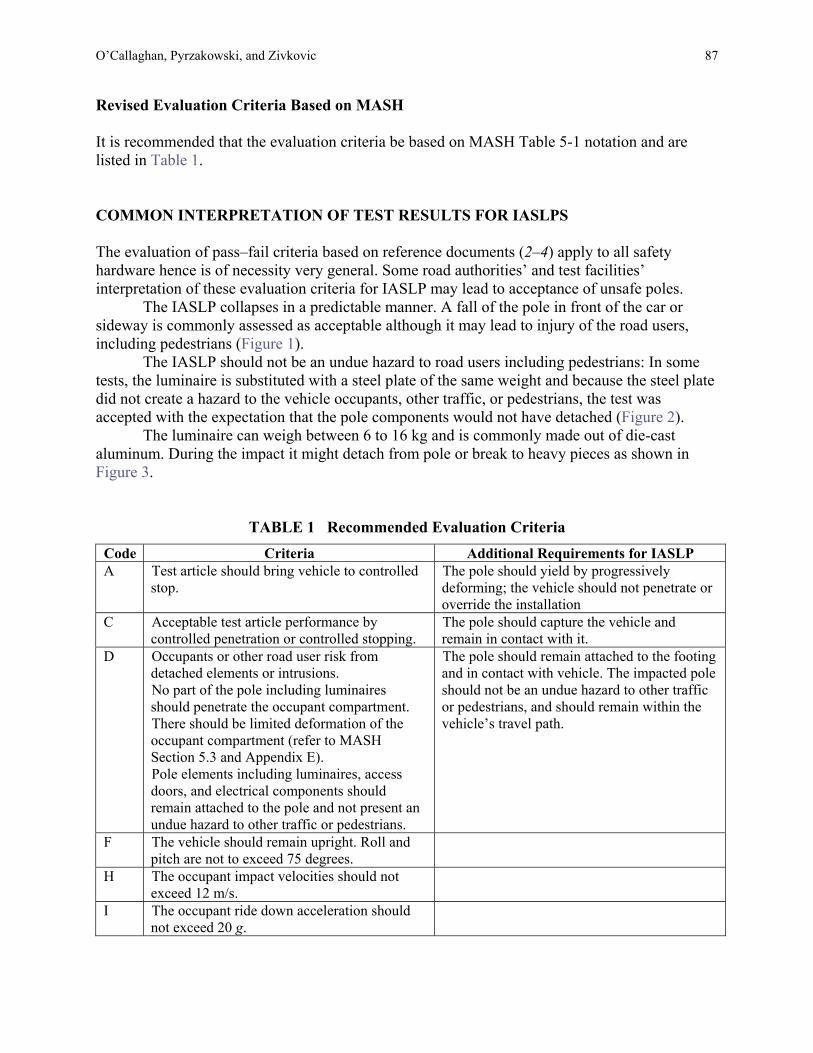
O’Callaghan, Pyrzakowski, and Zivkovic 87
Revised Evaluation Criteria Based on MASH It is recommended that the evaluation criteria be based on MASH Table 5-1 notation and are listed in Table 1. COMMON INTERPRETATION OF TEST RESULTS FOR IASLPS The evaluation of pass–fail criteria based on reference documents (2–4) apply to all safety hardware hence is of necessity very general. Some road authorities’ and test facilities’ interpretation of these evaluation criteria for IASLP may lead to acceptance of unsafe poles.
The IASLP collapses in a predictable manner. A fall of the pole in front of the car or sideway is commonly assessed as acceptable although it may lead to injury of the road users, including pedestrians (Figure 1).
The IASLP should not be an undue hazard to road users including pedestrians: In some tests, the luminaire is substituted with a steel plate of the same weight and because the steel plate did not create a hazard to the vehicle occupants, other traffic, or pedestrians, the test was accepted with the expectation that the pole components would not have detached (Figure 2).
The luminaire can weigh between 6 to 16 kg and is commonly made out of die-cast aluminum. During the impact it might detach from pole or break to heavy pieces as shown in Figure 3.
TABLE 1 Recommended Evaluation Criteria Code Criteria Additional Requirements for IASLP A Test article should bring vehicle to controlled
stop. The pole should yield by progressively deforming; the vehicle should not penetrate or override the installation
C Acceptable test article performance by controlled penetration or controlled stopping.
The pole should capture the vehicle and remain in contact with it.
D Occupants or other road user risk from detached elements or intrusions. No part of the pole including luminaires should penetrate the occupant compartment. There should be limited deformation of the occupant compartment (refer to MASH Section 5.3 and Appendix E). Pole elements including luminaires, access doors, and electrical components should remain attached to the pole and not present an undue hazard to other traffic or pedestrians.
The pole should remain attached to the footing and in contact with vehicle. The impacted pole should not be an undue hazard to other traffic or pedestrians, and should remain within the vehicle’s travel path.
F The vehicle should remain upright. Roll and pitch are not to exceed 75 degrees.
H The occupant impact velocities should not exceed 12 m/s.
I The occupant ride down acceleration should not exceed 20 g.
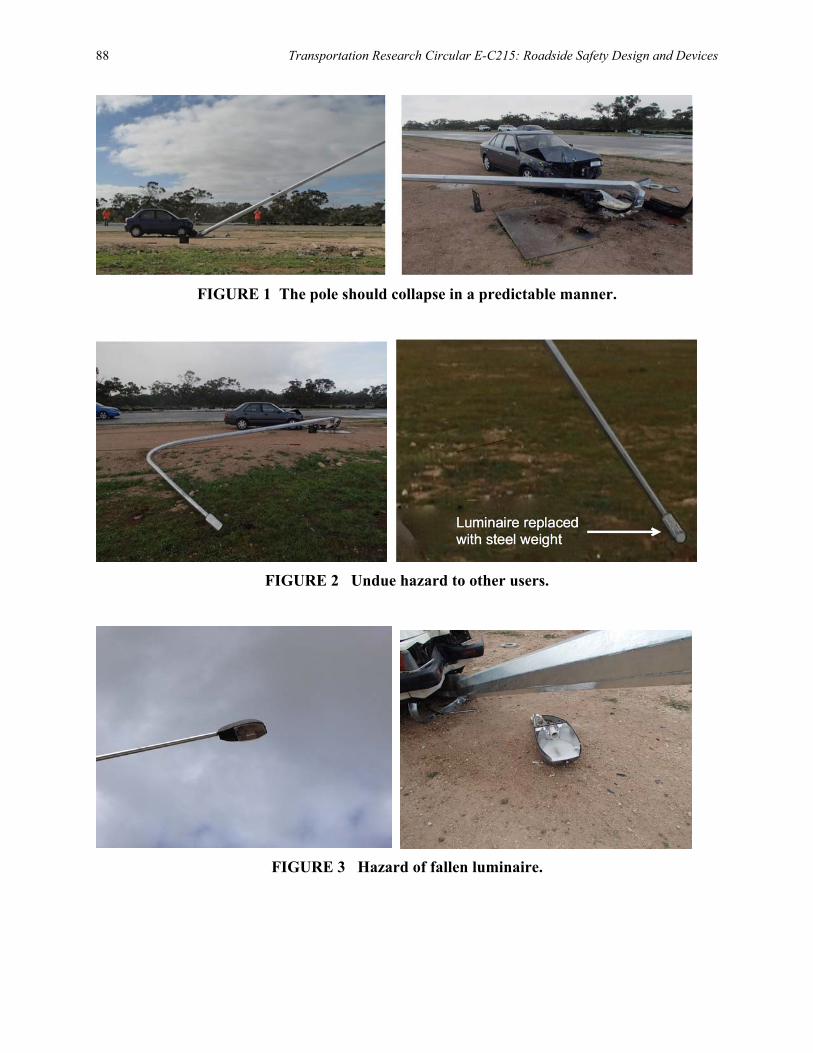
88 Transportation Research Circular E-C215: Roadside Safety Design and Devices
FIGURE 1 The pole should collapse in a predictable manner.
FIGURE 2 Undue hazard to other users.
FIGURE 3 Hazard of fallen luminaire.
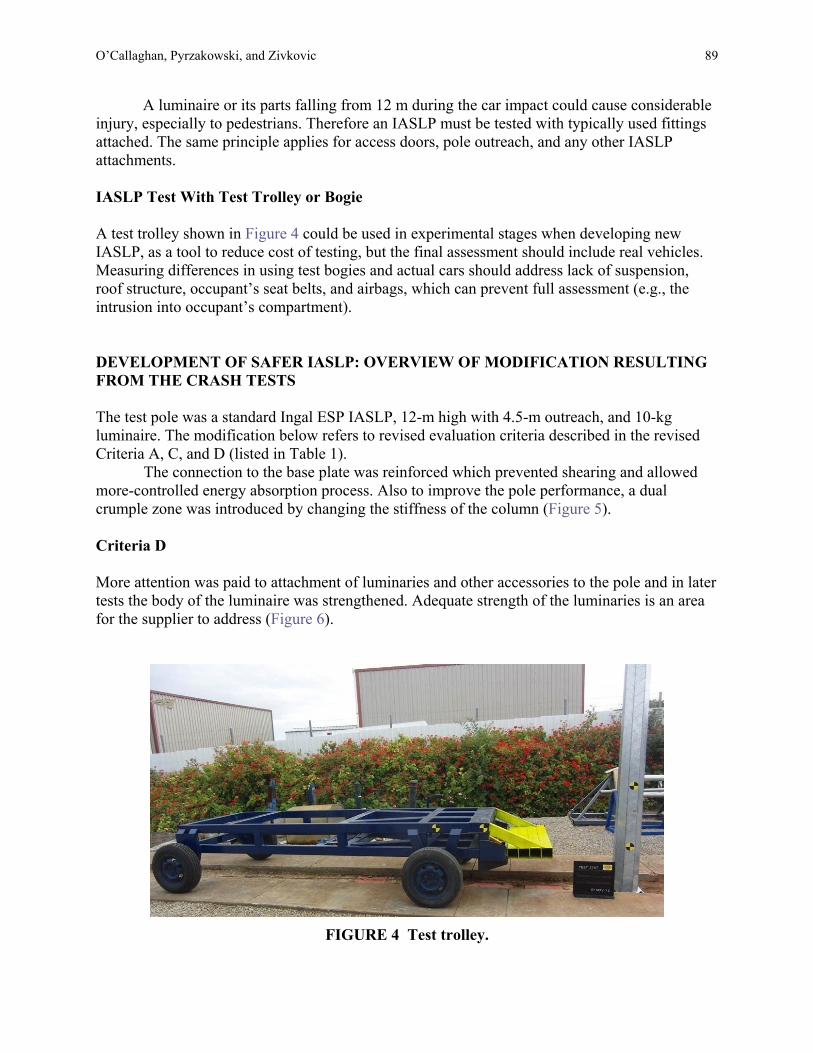
O’Callaghan, Pyrzakowski, and Zivkovic 89
A luminaire or its parts falling from 12 m during the car impact could cause considerable injury, especially to pedestrians. Therefore an IASLP must be tested with typically used fittings attached. The same principle applies for access doors, pole outreach, and any other IASLP attachments. IASLP Test With Test Trolley or Bogie A test trolley shown in Figure 4 could be used in experimental stages when developing new IASLP, as a tool to reduce cost of testing, but the final assessment should include real vehicles. Measuring differences in using test bogies and actual cars should address lack of suspension, roof structure, occupant’s seat belts, and airbags, which can prevent full assessment (e.g., the intrusion into occupant’s compartment). DEVELOPMENT OF SAFER IASLP: OVERVIEW OF MODIFICATION RESULTING FROM THE CRASH TESTS The test pole was a standard Ingal ESP IASLP, 12-m high with 4.5-m outreach, and 10-kg luminaire. The modification below refers to revised evaluation criteria described in the revised Criteria A, C, and D (listed in Table 1).
The connection to the base plate was reinforced which prevented shearing and allowed more-controlled energy absorption process. Also to improve the pole performance, a dual crumple zone was introduced by changing the stiffness of the column (Figure 5). Criteria D More attention was paid to attachment of luminaries and other accessories to the pole and in later tests the body of the luminaire was strengthened. Adequate strength of the luminaries is an area for the supplier to address (Figure 6).
FIGURE 4 Test trolley.
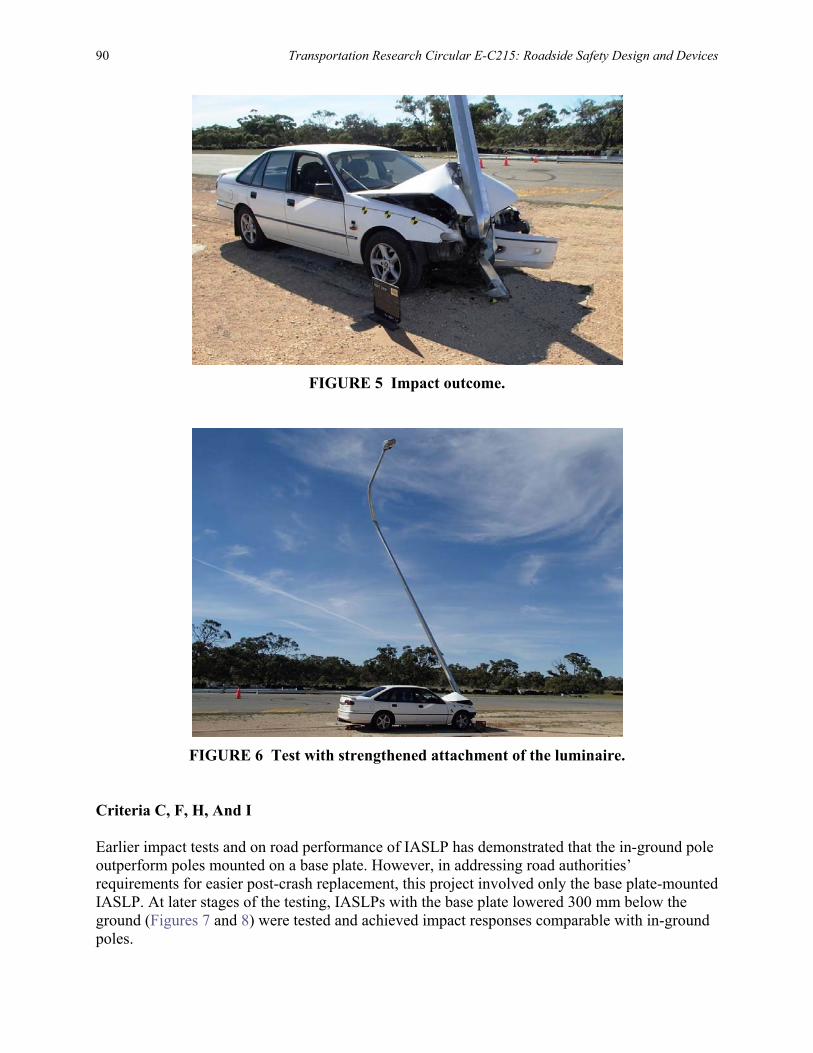
90 Transportation Research Circular E-C215: Roadside Safety Design and Devices
FIGURE 5 Impact outcome.
FIGURE 6 Test with strengthened attachment of the luminaire. Criteria C, F, H, And I Earlier impact tests and on road performance of IASLP has demonstrated that the in-ground pole outperform poles mounted on a base plate. However, in addressing road authorities’ requirements for easier post-crash replacement, this project involved only the base plate-mounted IASLP. At later stages of the testing, IASLPs with the base plate lowered 300 mm below the ground (Figures 7 and 8) were tested and achieved impact responses comparable with in-ground poles.
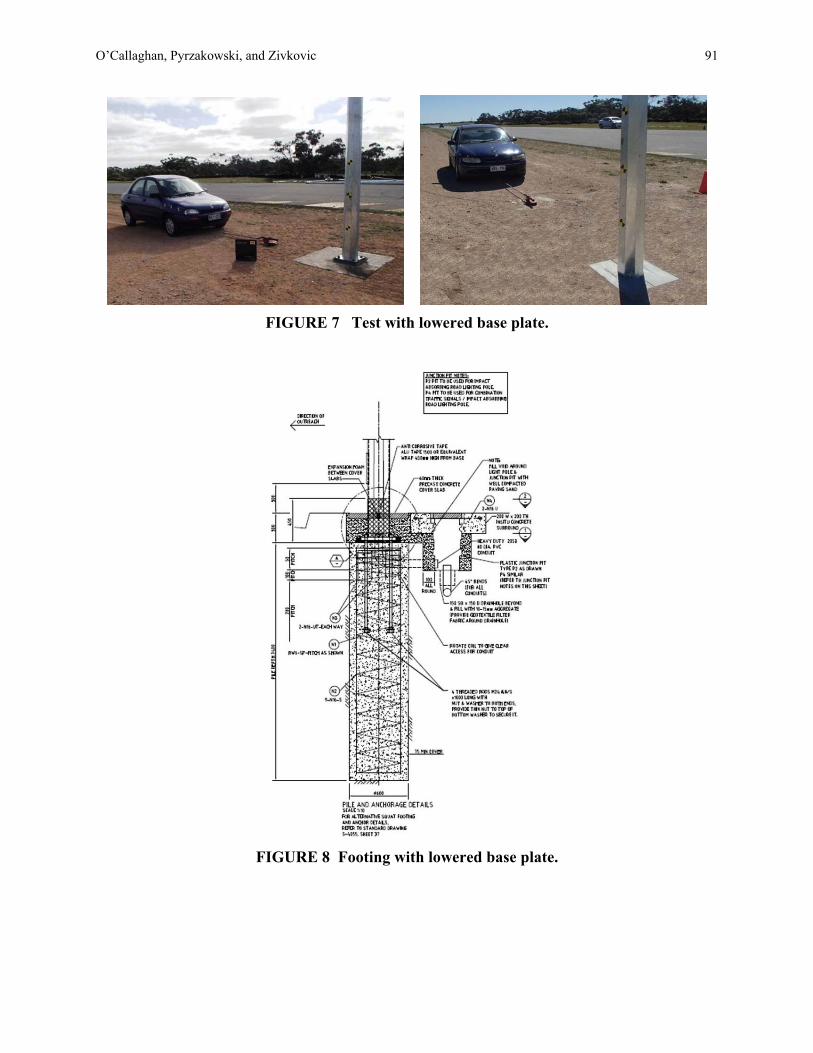
O’Callaghan, Pyrzakowski, and Zivkovic 91
FIGURE 7 Test with lowered base plate.
FIGURE 8 Footing with lowered base plate.
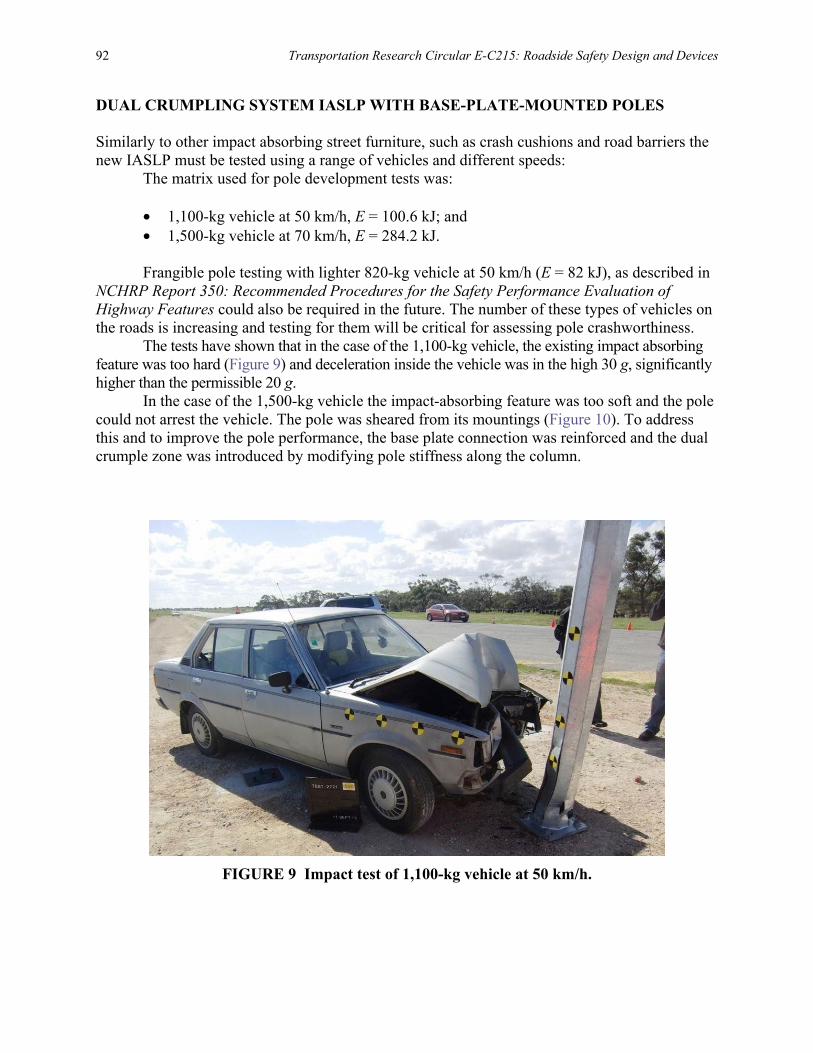
92 Transportation Research Circular E-C215: Roadside Safety Design and Devices
DUAL CRUMPLING SYSTEM IASLP WITH BASE-PLATE-MOUNTED POLES Similarly to other impact absorbing street furniture, such as crash cushions and road barriers the new IASLP must be tested using a range of vehicles and different speeds:
The matrix used for pole development tests was: • 1,100-kg vehicle at 50 km/h, E = 100.6 kJ; and • 1,500-kg vehicle at 70 km/h, E = 284.2 kJ.
Frangible pole testing with lighter 820-kg vehicle at 50 km/h (E = 82 kJ), as described in
NCHRP Report 350: Recommended Procedures for the Safety Performance Evaluation of Highway Features could also be required in the future. The number of these types of vehicles on the roads is increasing and testing for them will be critical for assessing pole crashworthiness.
The tests have shown that in the case of the 1,100-kg vehicle, the existing impact absorbing feature was too hard (Figure 9) and deceleration inside the vehicle was in the high 30 g, significantly higher than the permissible 20 g.
In the case of the 1,500-kg vehicle the impact-absorbing feature was too soft and the pole could not arrest the vehicle. The pole was sheared from its mountings (Figure 10). To address this and to improve the pole performance, the base plate connection was reinforced and the dual crumple zone was introduced by modifying pole stiffness along the column.
FIGURE 9 Impact test of 1,100-kg vehicle at 50 km/h.
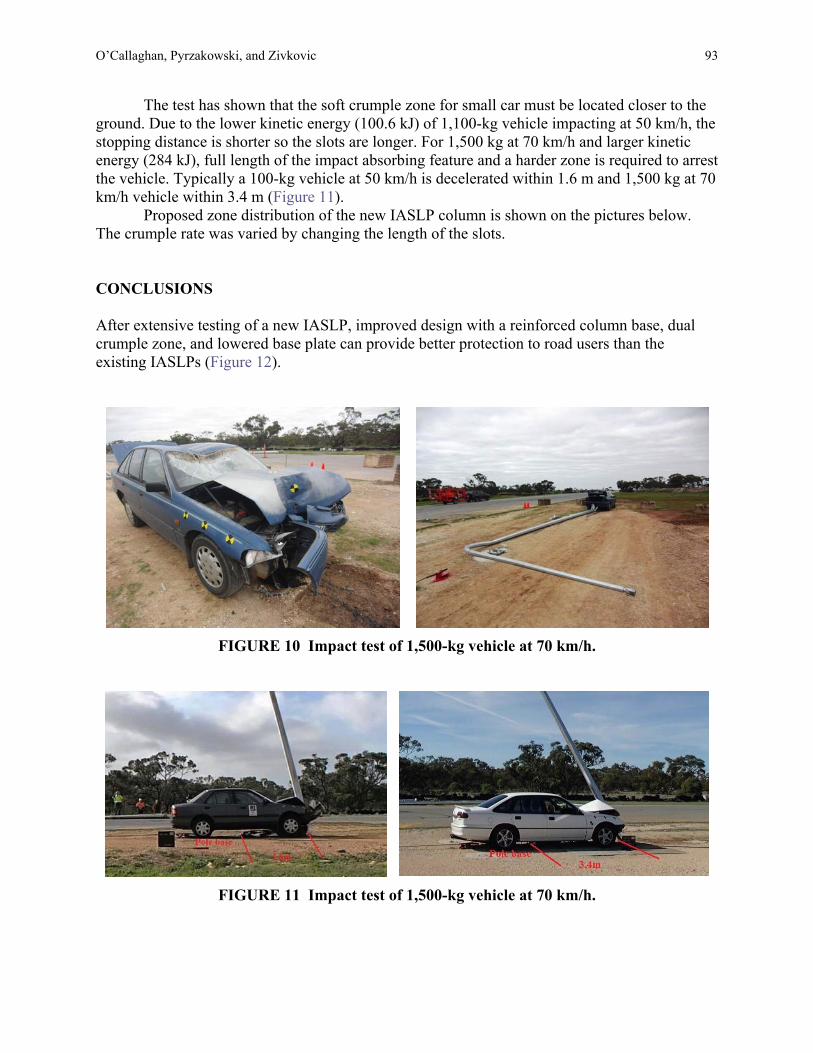
O’Callaghan, Pyrzakowski, and Zivkovic 93
The test has shown that the soft crumple zone for small car must be located closer to the ground. Due to the lower kinetic energy (100.6 kJ) of 1,100-kg vehicle impacting at 50 km/h, the stopping distance is shorter so the slots are longer. For 1,500 kg at 70 km/h and larger kinetic energy (284 kJ), full length of the impact absorbing feature and a harder zone is required to arrest the vehicle. Typically a 100-kg vehicle at 50 km/h is decelerated within 1.6 m and 1,500 kg at 70 km/h vehicle within 3.4 m (Figure 11).
Proposed zone distribution of the new IASLP column is shown on the pictures below. The crumple rate was varied by changing the length of the slots. CONCLUSIONS After extensive testing of a new IASLP, improved design with a reinforced column base, dual crumple zone, and lowered base plate can provide better protection to road users than the existing IASLPs (Figure 12).
FIGURE 10 Impact test of 1,500-kg vehicle at 70 km/h.
FIGURE 11 Impact test of 1,500-kg vehicle at 70 km/h.
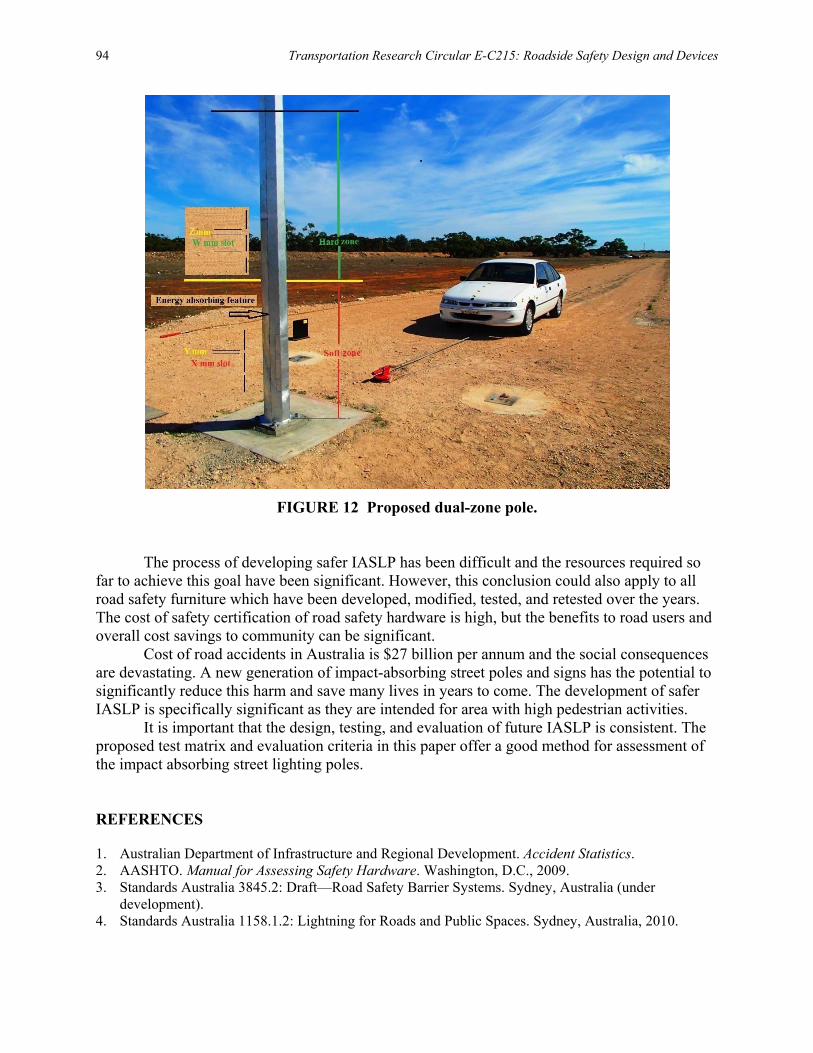
94 Transportation Research Circular E-C215: Roadside Safety Design and Devices
FIGURE 12 Proposed dual-zone pole. The process of developing safer IASLP has been difficult and the resources required so
far to achieve this goal have been significant. However, this conclusion could also apply to all road safety furniture which have been developed, modified, tested, and retested over the years. The cost of safety certification of road safety hardware is high, but the benefits to road users and overall cost savings to community can be significant.
Cost of road accidents in Australia is $27 billion per annum and the social consequences are devastating. A new generation of impact-absorbing street poles and signs has the potential to significantly reduce this harm and save many lives in years to come. The development of safer IASLP is specifically significant as they are intended for area with high pedestrian activities.
It is important that the design, testing, and evaluation of future IASLP is consistent. The proposed test matrix and evaluation criteria in this paper offer a good method for assessment of the impact absorbing street lighting poles. REFERENCES 1. Australian Department of Infrastructure and Regional Development. Accident Statistics. 2. AASHTO. Manual for Assessing Safety Hardware. Washington, D.C., 2009. 3. Standards Australia 3845.2: Draft—Road Safety Barrier Systems. Sydney, Australia (under
development). 4. Standards Australia 1158.1.2: Lightning for Roads and Public Spaces. Sydney, Australia, 2010.

O’Callaghan, Pyrzakowski, and Zivkovic 95
ADDITIONAL RESOURCES Griffiths, M., and J. Jarvie. Improving the Crash Compatibility of Cars and Roadside Poles. Presented at
the 90th Annual Meeting of the Transportation Research Board, Washington, D.C., 2011. Derbyshire, A. C., and R. J. Troutbeck. Results of a Full-Scale Crash Test into an Energy Absorbing
Lighting Pole on a Sloped Roadside. Presented at Road Safety Research, Policing, and Education Conference, 2001.
96
SESSION 4: ROADSIDE SAFETY HARDWARE DEVELOPMENT AND TESTING
EN 1317 Versus NCHRP 350 Nongating Test Level 3 Crash Cushion Versus
Redirective 110-km/h Crash Cushion
LUIGI GRASSIA Department of Industrial and Information Engineering,
The Second University of Naples, Aversa, Italy
MAURO CORSANICI Research and Development Department, Industry AMS, Marcianise, Italy
ost of the crash cushions available on the market are designed according to one of the standards, namely EN 1317, the Compliant Road Restraint Systems list, and NCHRP 350.
EN 1317 is the European standard and it is still used to certify new products, whereas NCHRP 350 is the U.S. standard and it was used up to 2010 to certify road safety products and now it has been replaced by the AASHTO Manual for Assessing Safety Hardware (MASH) standard.
It is of interest to compare the requirements of the two standards with respect their recommendations about the design of crash cushions. In particular, this paper reports a comparison between the requirements to design a nongating Test Level (TL) 3 crash cushion according to NCHRP 350 and to design a redirective 110-km/h crash cushion according to EN 1317.
NCHRP 350 prescribes to test crash cushion with two different kinds of cars: a small car with a mass of 820 kg and a pick-up of 2 tons. These vehicles are both used to certify the crash cushions for three different levels of velocity: 50 km/h (TL1); 70 km/h (TL2); and 100 km/h (TL3).
EN 1317 prescribes to run crash tests with three different types of cars: a small car with a weight of 900 kg; a medium car with a weight of 1,300 kg; and a large car with a weight of 1,500 kg. Crash cushions can be tested at four different levels of velocity: 50km/h, 80km/h, 100 km/h, and 110 km/h. The vehicle used in the test at 50 km/h is the smallest one, the small and medium car are used for the levels of velocity 80 and 100 km/h, and the small and the large cars are used for the level of velocity 110 km/h.
The capacity test is defined as the crash test characterized by the maximum level of energy in the test matrix for that level of velocity. It is the head-on impact of the heavier vehicle for the level of velocity under consideration. In NCHRP 350, the heavier vehicle is the 2,000-kg pick up truck at each velocity, where in the EN 1317, the mass of the heavier vehicle depends on the test velocity.
Figure 1 shows the energy involved in each capacity test for each level of velocity in the two standards. The red bars are for NCHRP 350 and the blue bars are for the EN 1317.
From Figure 1 it appears that the energy involved in the impacts are comparable for TL2 (NCHRP 350) and 80 km/h (EN 1317) but also for TL3 (NCHRP 350) and 110 km/h (NCHRP).
M
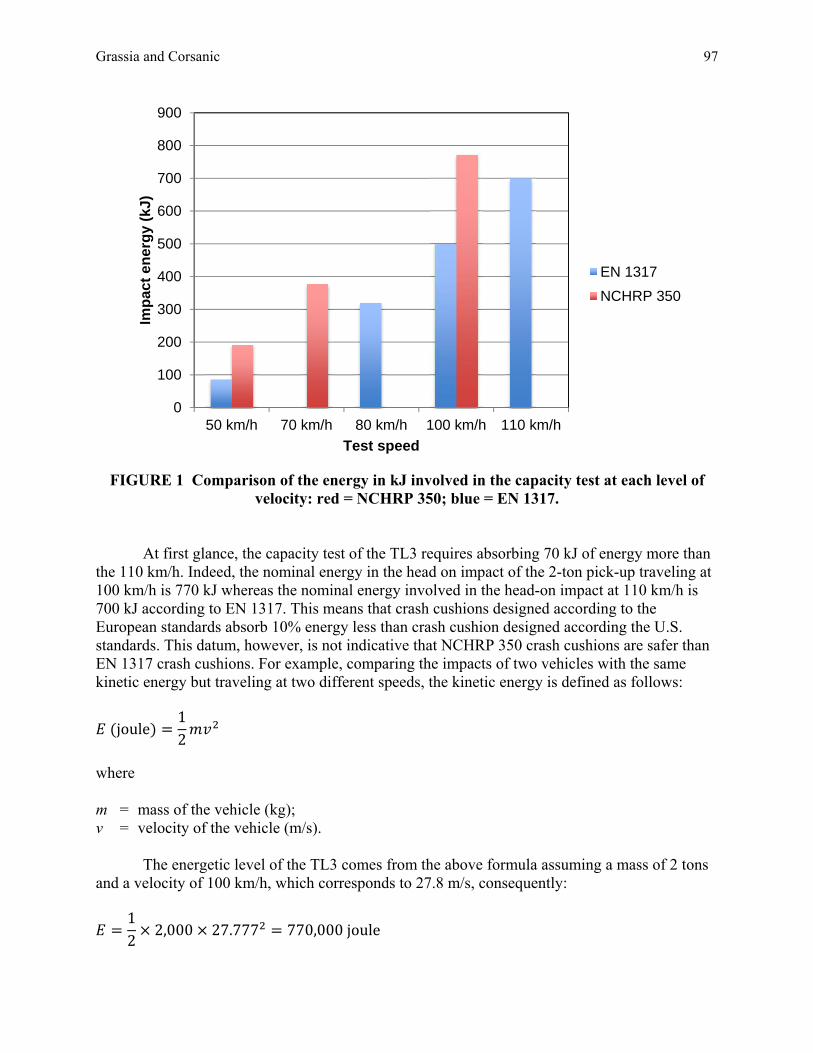
Grassia and Corsanic 97
FIGURE 1 Comparison of the energy in kJ involved in the capacity test at each level of
velocity: red = NCHRP 350; blue = EN 1317.
At first glance, the capacity test of the TL3 requires absorbing 70 kJ of energy more than the 110 km/h. Indeed, the nominal energy in the head on impact of the 2-ton pick-up traveling at 100 km/h is 770 kJ whereas the nominal energy involved in the head-on impact at 110 km/h is 700 kJ according to EN 1317. This means that crash cushions designed according to the European standards absorb 10% energy less than crash cushion designed according the U.S. standards. This datum, however, is not indicative that NCHRP 350 crash cushions are safer than EN 1317 crash cushions. For example, comparing the impacts of two vehicles with the same kinetic energy but traveling at two different speeds, the kinetic energy is defined as follows:
joule = 12
where m = mass of the vehicle (kg); v = velocity of the vehicle (m/s).
The energetic level of the TL3 comes from the above formula assuming a mass of 2 tons
and a velocity of 100 km/h, which corresponds to 27.8 m/s, consequently: = 12 × 2,000 × 27.777 = 770,000 joule
0
100
200
300
400
500
600
700
800
900
50 km/h 70 km/h 80 km/h 100 km/h 110 km/h
Impa
ct e
nerg
y (k
J)
Test speed
EN 1317NCHRP 350
98 Transportation Research Circular E-C215: Roadside Safety Design and Devices
We fix this level of energy in our example, and this level of energy can be obtained with any combination of speed and mass. For the sake of simplicity we refer two extreme cases.
• Case 1: Train with a mass of 90,000 kg. Such train will have the same kinetic energy
characteristic of the TL3 when traveling at 4.7 km/h. • Case 2: Motorcycle with a mass of 200 kg. Such motorcycle will have the same
kinetic energy characteristic of the TL3 when traveling at 315 km/h.
Assuming that the two vehicles of Cases 1 and 2 impact against a device able to absorb their kinetic energy and to stop them. It is intuitive that there is a big difference to undergo an impact at 4.7 km/h rather than at 315 km/h. The main difference arises from the deceleration involved in the impacts that will be greater at the higher speeds. The level of deceleration during the impacts is usually responsible of the injuries of the passengers and drivers.
As long as the vehicle impacts the safety device, the latter will act on the vehicle with a force, F. The average of this force multiplied by the displacement of the vehicle during the impact, S, is equal to the kinetic energy, Ec, involved in the impact, as
= ×
The force acting on the vehicle is F = m × a, where m is the mass of the vehicle and is the deceleration. Therefore, the deceleration can be calculated as follows:
= ×
The above formula shows that once the kinetic energy, Ec, involved is fixed, the average
deceleration increases as long as the vehicle mass decreases. In other words, fix the kinetic energy, Ec, and the space due to stop the vehicle, S, the vehicle traveling at higher speed (less mass) will be stopped with larger deceleration.
This simple example is useful to understanding an important aspect related to the difference between the NCHRP 350 and EN 1317. It is true that the energy level of NCHRP 350 is larger than that of EN 1317 of 70 kJ, but on the other hand, EN 1317 deals with impact at 110 km/h (i.e., at speed of 10 km/h faster than NCHRP 350) and higher speed give rise to larger decelerations. CRASH TESTS REQUIRED BY THE TWO STANDARDS In Table 1 the crash tests required by the two standards to test nongating TL3 and re-directive 110 km/h crash cushions are reported. The table is organized as follows: the tests required by NCHRP 350 are reported on the left side where the tests required by EN 1317 are reported on the right side. The frontal tests are reported at the top and the lateral tests at the bottom. The test that show similar features are reported in the same row of the table in order to create a correspondence between the two standards.
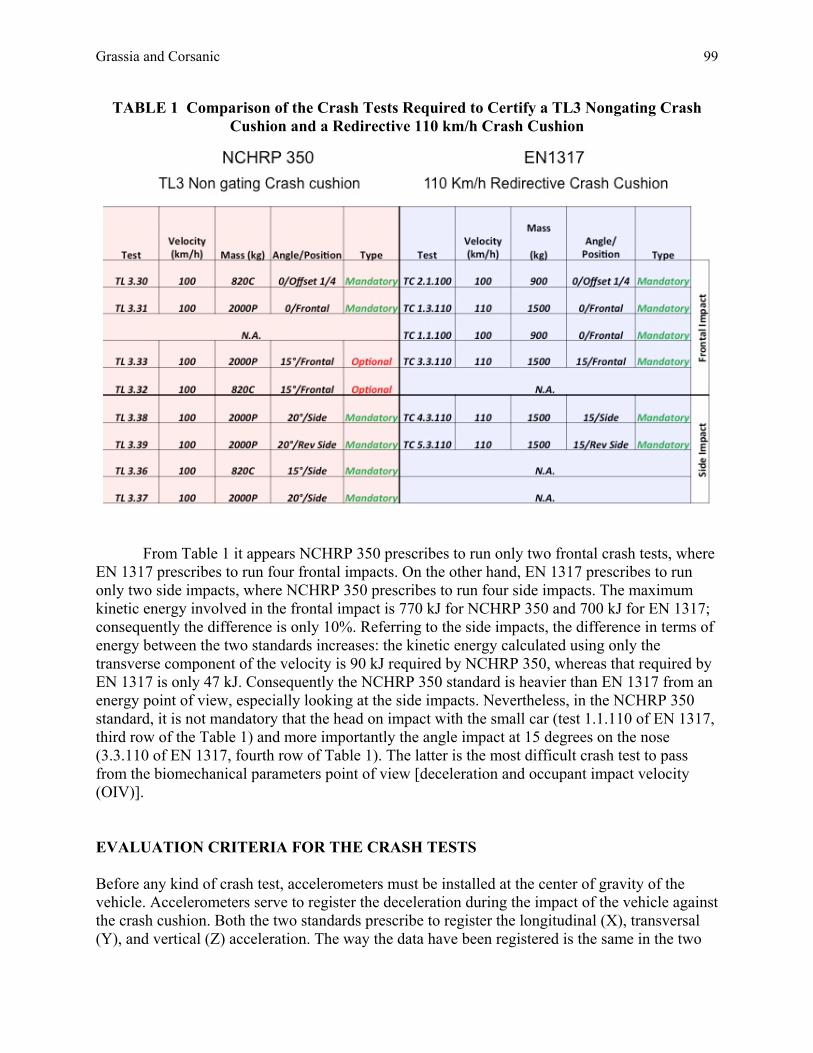
Grassia and Corsanic 99
TABLE 1 Comparison of the Crash Tests Required to Certify a TL3 Nongating Crash Cushion and a Redirective 110 km/h Crash Cushion
From Table 1 it appears NCHRP 350 prescribes to run only two frontal crash tests, where EN 1317 prescribes to run four frontal impacts. On the other hand, EN 1317 prescribes to run only two side impacts, where NCHRP 350 prescribes to run four side impacts. The maximum kinetic energy involved in the frontal impact is 770 kJ for NCHRP 350 and 700 kJ for EN 1317; consequently the difference is only 10%. Referring to the side impacts, the difference in terms of energy between the two standards increases: the kinetic energy calculated using only the transverse component of the velocity is 90 kJ required by NCHRP 350, whereas that required by EN 1317 is only 47 kJ. Consequently the NCHRP 350 standard is heavier than EN 1317 from an energy point of view, especially looking at the side impacts. Nevertheless, in the NCHRP 350 standard, it is not mandatory that the head on impact with the small car (test 1.1.110 of EN 1317, third row of the Table 1) and more importantly the angle impact at 15 degrees on the nose (3.3.110 of EN 1317, fourth row of Table 1). The latter is the most difficult crash test to pass from the biomechanical parameters point of view [deceleration and occupant impact velocity (OIV)]. EVALUATION CRITERIA FOR THE CRASH TESTS Before any kind of crash test, accelerometers must be installed at the center of gravity of the vehicle. Accelerometers serve to register the deceleration during the impact of the vehicle against the crash cushion. Both the two standards prescribe to register the longitudinal (X), transversal (Y), and vertical (Z) acceleration. The way the data have been registered is the same in the two
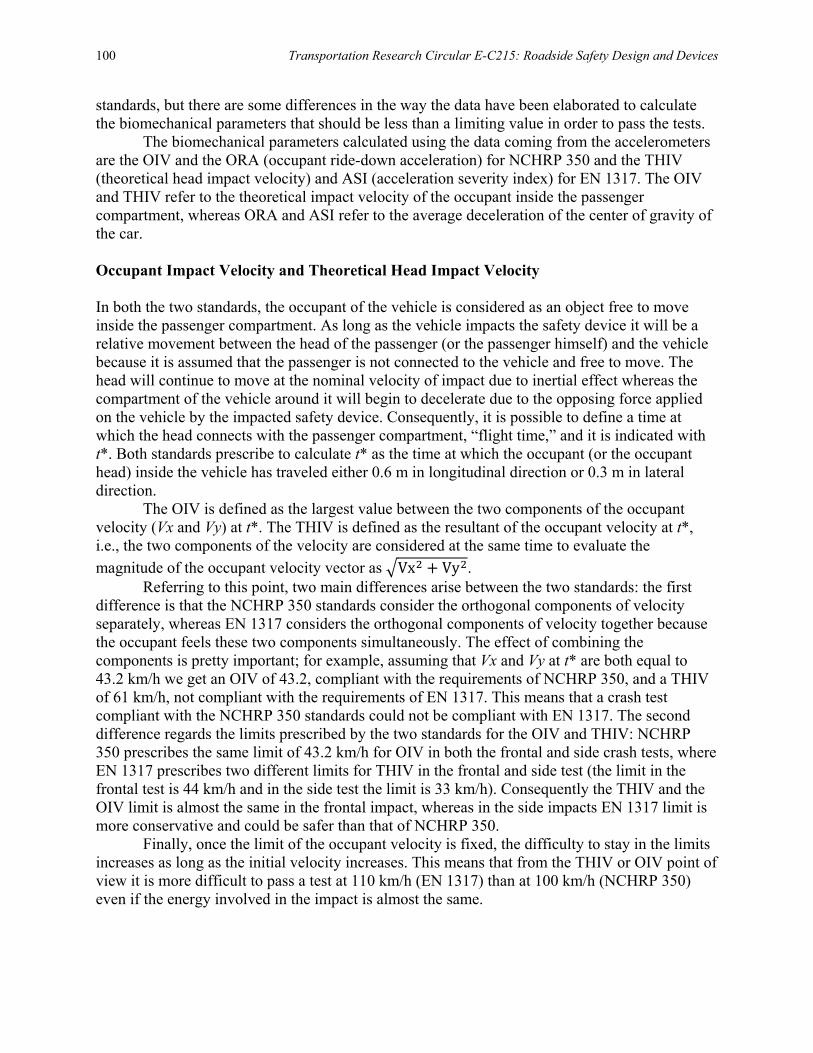
100 Transportation Research Circular E-C215: Roadside Safety Design and Devices
standards, but there are some differences in the way the data have been elaborated to calculate the biomechanical parameters that should be less than a limiting value in order to pass the tests.
The biomechanical parameters calculated using the data coming from the accelerometers are the OIV and the ORA (occupant ride-down acceleration) for NCHRP 350 and the THIV (theoretical head impact velocity) and ASI (acceleration severity index) for EN 1317. The OIV and THIV refer to the theoretical impact velocity of the occupant inside the passenger compartment, whereas ORA and ASI refer to the average deceleration of the center of gravity of the car. Occupant Impact Velocity and Theoretical Head Impact Velocity In both the two standards, the occupant of the vehicle is considered as an object free to move inside the passenger compartment. As long as the vehicle impacts the safety device it will be a relative movement between the head of the passenger (or the passenger himself) and the vehicle because it is assumed that the passenger is not connected to the vehicle and free to move. The head will continue to move at the nominal velocity of impact due to inertial effect whereas the compartment of the vehicle around it will begin to decelerate due to the opposing force applied on the vehicle by the impacted safety device. Consequently, it is possible to define a time at which the head connects with the passenger compartment, “flight time,” and it is indicated with t*. Both standards prescribe to calculate t* as the time at which the occupant (or the occupant head) inside the vehicle has traveled either 0.6 m in longitudinal direction or 0.3 m in lateral direction.
The OIV is defined as the largest value between the two components of the occupant velocity (Vx and Vy) at t*. The THIV is defined as the resultant of the occupant velocity at t*, i.e., the two components of the velocity are considered at the same time to evaluate the
magnitude of the occupant velocity vector as Vx + Vy . Referring to this point, two main differences arise between the two standards: the first
difference is that the NCHRP 350 standards consider the orthogonal components of velocity separately, whereas EN 1317 considers the orthogonal components of velocity together because the occupant feels these two components simultaneously. The effect of combining the components is pretty important; for example, assuming that Vx and Vy at t* are both equal to 43.2 km/h we get an OIV of 43.2, compliant with the requirements of NCHRP 350, and a THIV of 61 km/h, not compliant with the requirements of EN 1317. This means that a crash test compliant with the NCHRP 350 standards could not be compliant with EN 1317. The second difference regards the limits prescribed by the two standards for the OIV and THIV: NCHRP 350 prescribes the same limit of 43.2 km/h for OIV in both the frontal and side crash tests, where EN 1317 prescribes two different limits for THIV in the frontal and side test (the limit in the frontal test is 44 km/h and in the side test the limit is 33 km/h). Consequently the THIV and the OIV limit is almost the same in the frontal impact, whereas in the side impacts EN 1317 limit is more conservative and could be safer than that of NCHRP 350.
Finally, once the limit of the occupant velocity is fixed, the difficulty to stay in the limits increases as long as the initial velocity increases. This means that from the THIV or OIV point of view it is more difficult to pass a test at 110 km/h (EN 1317) than at 100 km/h (NCHRP 350) even if the energy involved in the impact is almost the same.
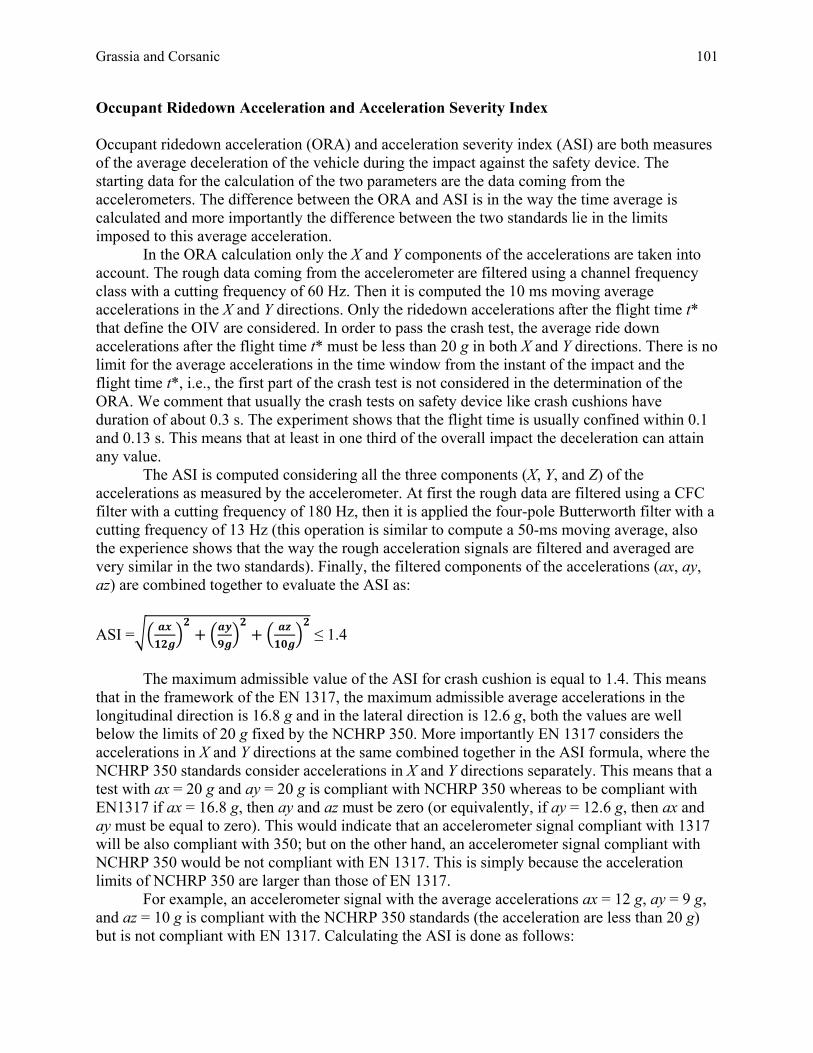
Grassia and Corsanic 101
Occupant Ridedown Acceleration and Acceleration Severity Index Occupant ridedown acceleration (ORA) and acceleration severity index (ASI) are both measures of the average deceleration of the vehicle during the impact against the safety device. The starting data for the calculation of the two parameters are the data coming from the accelerometers. The difference between the ORA and ASI is in the way the time average is calculated and more importantly the difference between the two standards lie in the limits imposed to this average acceleration.
In the ORA calculation only the X and Y components of the accelerations are taken into account. The rough data coming from the accelerometer are filtered using a channel frequency class with a cutting frequency of 60 Hz. Then it is computed the 10 ms moving average accelerations in the X and Y directions. Only the ridedown accelerations after the flight time t* that define the OIV are considered. In order to pass the crash test, the average ride down accelerations after the flight time t* must be less than 20 g in both X and Y directions. There is no limit for the average accelerations in the time window from the instant of the impact and the flight time t*, i.e., the first part of the crash test is not considered in the determination of the ORA. We comment that usually the crash tests on safety device like crash cushions have duration of about 0.3 s. The experiment shows that the flight time is usually confined within 0.1 and 0.13 s. This means that at least in one third of the overall impact the deceleration can attain any value.
The ASI is computed considering all the three components (X, Y, and Z) of the accelerations as measured by the accelerometer. At first the rough data are filtered using a CFC filter with a cutting frequency of 180 Hz, then it is applied the four-pole Butterworth filter with a cutting frequency of 13 Hz (this operation is similar to compute a 50-ms moving average, also the experience shows that the way the rough acceleration signals are filtered and averaged are very similar in the two standards). Finally, the filtered components of the accelerations (ax, ay, az) are combined together to evaluate the ASI as:
ASI = + + ≤ 1.4
The maximum admissible value of the ASI for crash cushion is equal to 1.4. This means
that in the framework of the EN 1317, the maximum admissible average accelerations in the longitudinal direction is 16.8 g and in the lateral direction is 12.6 g, both the values are well below the limits of 20 g fixed by the NCHRP 350. More importantly EN 1317 considers the accelerations in X and Y directions at the same combined together in the ASI formula, where the NCHRP 350 standards consider accelerations in X and Y directions separately. This means that a test with ax = 20 g and ay = 20 g is compliant with NCHRP 350 whereas to be compliant with EN1317 if ax = 16.8 g, then ay and az must be zero (or equivalently, if ay = 12.6 g, then ax and ay must be equal to zero). This would indicate that an accelerometer signal compliant with 1317 will be also compliant with 350; but on the other hand, an accelerometer signal compliant with NCHRP 350 would be not compliant with EN 1317. This is simply because the acceleration limits of NCHRP 350 are larger than those of EN 1317.
For example, an accelerometer signal with the average accelerations ax = 12 g, ay = 9 g, and az = 10 g is compliant with the NCHRP 350 standards (the acceleration are less than 20 g) but is not compliant with EN 1317. Calculating the ASI is done as follows:
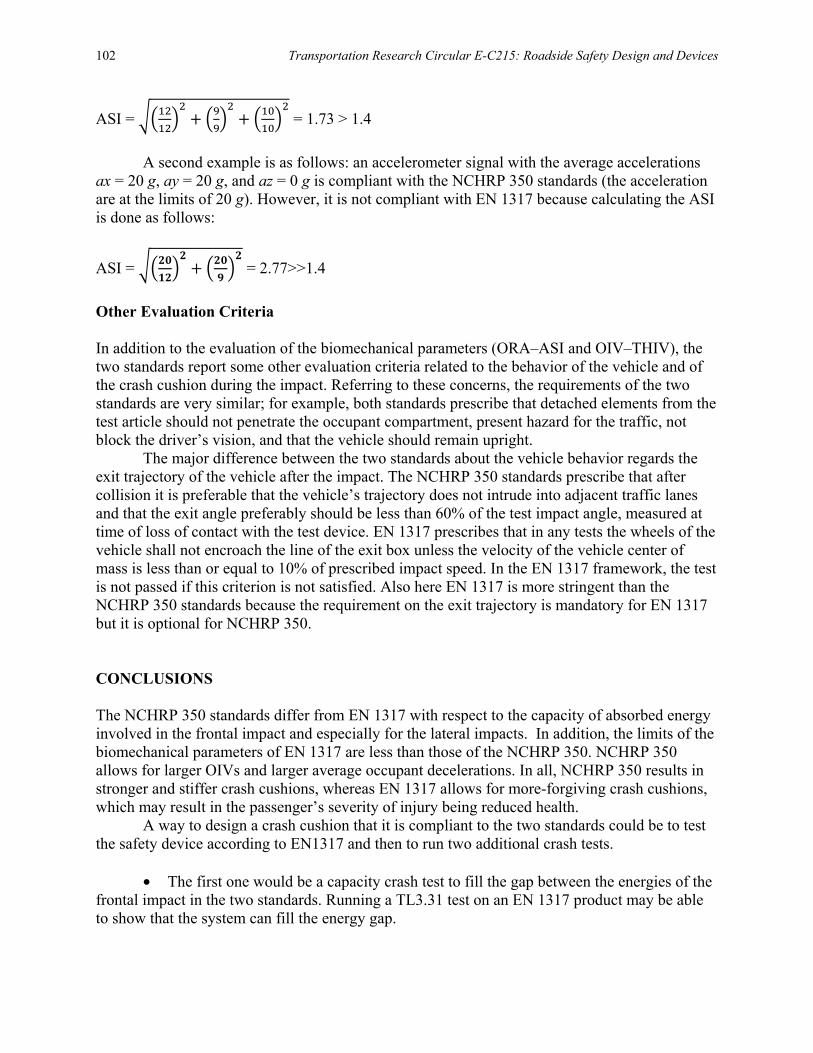
102 Transportation Research Circular E-C215: Roadside Safety Design and Devices
ASI = + + = 1.73 > 1.4
A second example is as follows: an accelerometer signal with the average accelerations
ax = 20 g, ay = 20 g, and az = 0 g is compliant with the NCHRP 350 standards (the acceleration are at the limits of 20 g). However, it is not compliant with EN 1317 because calculating the ASI is done as follows:
ASI = + = 2.77>>1.4
Other Evaluation Criteria In addition to the evaluation of the biomechanical parameters (ORA–ASI and OIV–THIV), the two standards report some other evaluation criteria related to the behavior of the vehicle and of the crash cushion during the impact. Referring to these concerns, the requirements of the two standards are very similar; for example, both standards prescribe that detached elements from the test article should not penetrate the occupant compartment, present hazard for the traffic, not block the driver’s vision, and that the vehicle should remain upright.
The major difference between the two standards about the vehicle behavior regards the exit trajectory of the vehicle after the impact. The NCHRP 350 standards prescribe that after collision it is preferable that the vehicle’s trajectory does not intrude into adjacent traffic lanes and that the exit angle preferably should be less than 60% of the test impact angle, measured at time of loss of contact with the test device. EN 1317 prescribes that in any tests the wheels of the vehicle shall not encroach the line of the exit box unless the velocity of the vehicle center of mass is less than or equal to 10% of prescribed impact speed. In the EN 1317 framework, the test is not passed if this criterion is not satisfied. Also here EN 1317 is more stringent than the NCHRP 350 standards because the requirement on the exit trajectory is mandatory for EN 1317 but it is optional for NCHRP 350. CONCLUSIONS The NCHRP 350 standards differ from EN 1317 with respect to the capacity of absorbed energy involved in the frontal impact and especially for the lateral impacts. In addition, the limits of the biomechanical parameters of EN 1317 are less than those of the NCHRP 350. NCHRP 350 allows for larger OIVs and larger average occupant decelerations. In all, NCHRP 350 results in stronger and stiffer crash cushions, whereas EN 1317 allows for more-forgiving crash cushions, which may result in the passenger’s severity of injury being reduced health.
A way to design a crash cushion that it is compliant to the two standards could be to test the safety device according to EN1317 and then to run two additional crash tests.
• The first one would be a capacity crash test to fill the gap between the energies of the
frontal impact in the two standards. Running a TL3.31 test on an EN 1317 product may be able to show that the system can fill the energy gap.
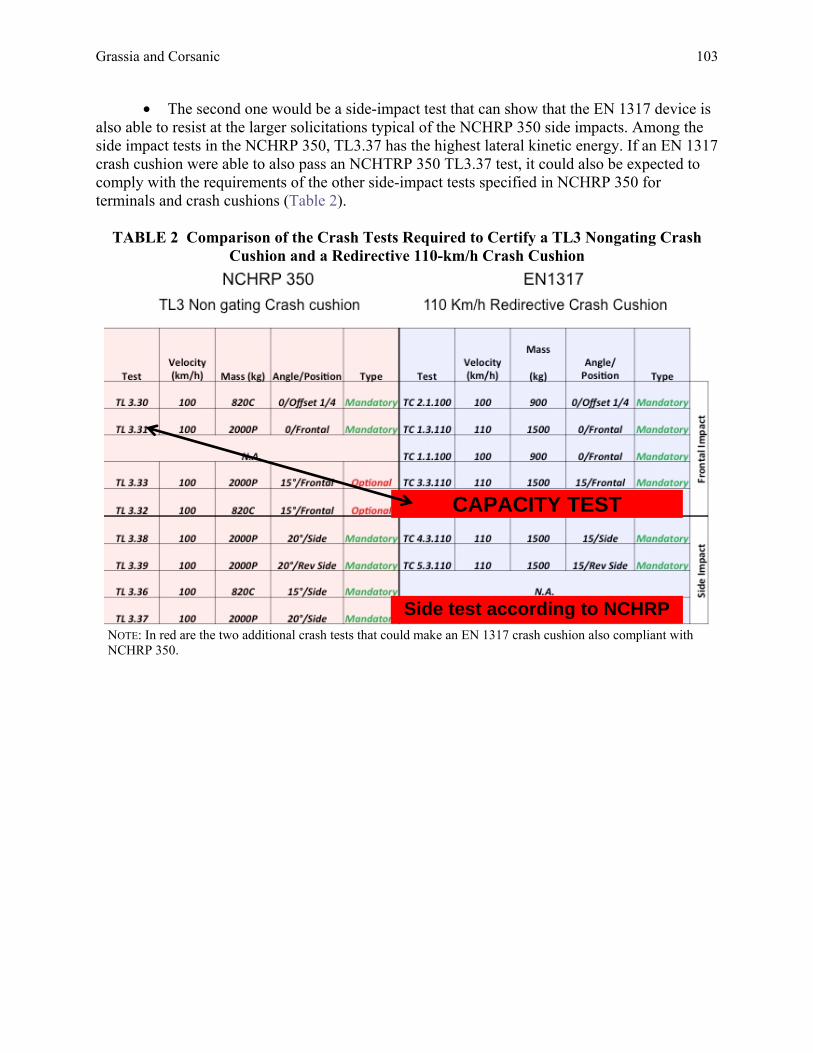
Grassia and Corsanic 103
• The second one would be a side-impact test that can show that the EN 1317 device is also able to resist at the larger solicitations typical of the NCHRP 350 side impacts. Among the side impact tests in the NCHRP 350, TL3.37 has the highest lateral kinetic energy. If an EN 1317 crash cushion were able to also pass an NCHTRP 350 TL3.37 test, it could also be expected to comply with the requirements of the other side-impact tests specified in NCHRP 350 for terminals and crash cushions (Table 2).
TABLE 2 Comparison of the Crash Tests Required to Certify a TL3 Nongating Crash Cushion and a Redirective 110-km/h Crash Cushion
NOTE: In red are the two additional crash tests that could make an EN 1317 crash cushion also compliant with NCHRP 350.
CAPACITY TEST
Side test according to NCHRP
104
SESSION 4: ROADSIDE SAFETY HARDWARE DEVELOPMENT AND TESTING
Safe Bridge Barriers Tested and Simulated to EN 1317 and MASH with Low Forces Transmitted
Australian Example Compared with European Union Example
JOSEPH MARRA DARIO GUARINO
Global Design Technology, Belgium
RYAN FINDLAYSON DANE HANSEN PAUL HANSEN IF3, Australia
istorically in Europe, the loads transmitted to a bridge deck by a vehicle restraint system (VRS) were prescribed by a table such as Table 4.9(a) of EN 1991-2 (Table 1). Because of
the Europeans’ experience in crash testing, it is now known that different VRS will impart different loadings on a bridge deck and, as such, tables like the one below are inadequate for bridge deck design purposes.
Better methodologies have been developed to determine loads on bridge decks transferred by a VRS. This paper will illustrate some of these methodologies and is focused on one that has been recently upgraded in Belgium to become the Md – Vd curve methodology detailed below. This paper will also apply the Md – Vd curve methodology to a specific reference VRS widely used in Australia and another one recently developed in Europe. FIRST METHODOLOGY: LOADS MEASUREMENT The first methodology used by some countries in Europe involves recording loads during full-scale crash testing on the proposed VRS. The recorded loadings are used to either design a new bridge deck or to determine the suitability of the proposed VRS on the existing (or moderately reinforced) bridge deck. The results of such crash testing can be seen in the French annex of EN 1991-2 (1) (Table 2).
TABLE 1 Extract of EN 1991-2: Classes for the Horizontal Force Transferred by VRS Recommended Class Horizontal Force (kN)
A 100 B 200 C 400 D 600
H
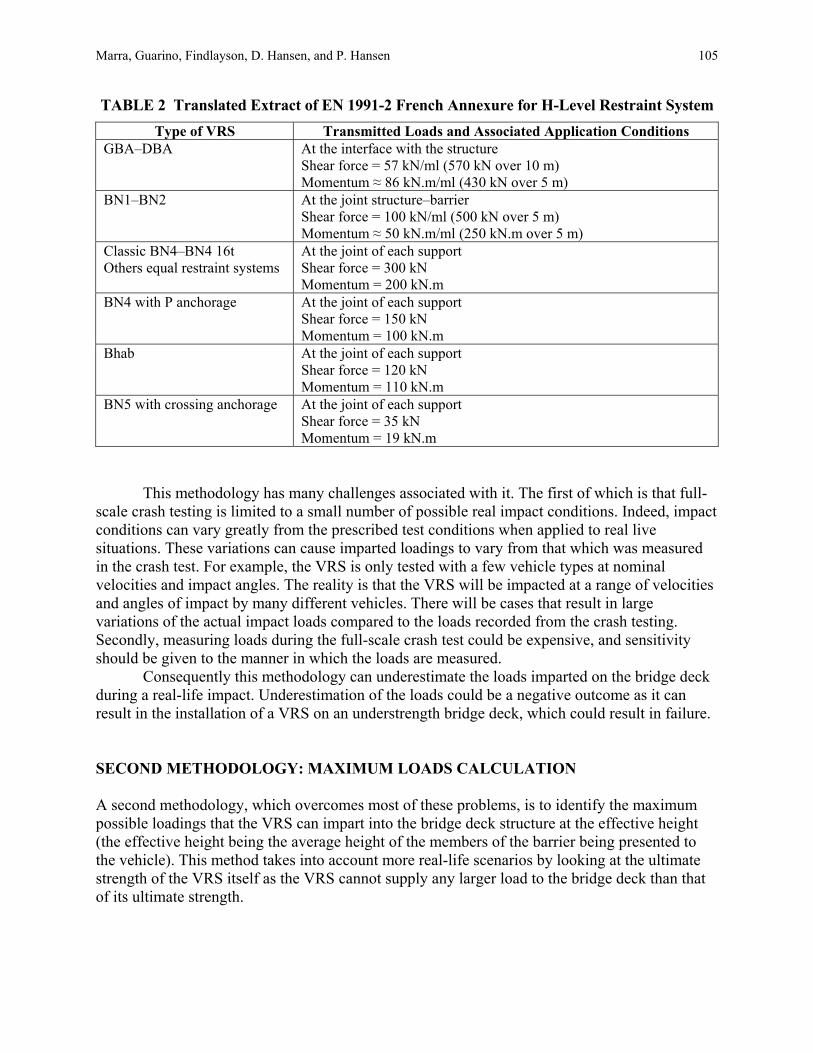
Marra, Guarino, Findlayson, D. Hansen, and P. Hansen 105
TABLE 2 Translated Extract of EN 1991-2 French Annexure for H-Level Restraint System Type of VRS Transmitted Loads and Associated Application Conditions
GBA–DBA At the interface with the structure Shear force = 57 kN/ml (570 kN over 10 m) Momentum ≈ 86 kN.m/ml (430 kN over 5 m)
BN1–BN2 At the joint structure–barrier Shear force = 100 kN/ml (500 kN over 5 m) Momentum ≈ 50 kN.m/ml (250 kN.m over 5 m)
Classic BN4–BN4 16t Others equal restraint systems
At the joint of each support Shear force = 300 kN Momentum = 200 kN.m
BN4 with P anchorage At the joint of each support Shear force = 150 kN Momentum = 100 kN.m
Bhab At the joint of each support Shear force = 120 kN Momentum = 110 kN.m
BN5 with crossing anchorage At the joint of each support Shear force = 35 kN Momentum = 19 kN.m
This methodology has many challenges associated with it. The first of which is that full-scale crash testing is limited to a small number of possible real impact conditions. Indeed, impact conditions can vary greatly from the prescribed test conditions when applied to real live situations. These variations can cause imparted loadings to vary from that which was measured in the crash test. For example, the VRS is only tested with a few vehicle types at nominal velocities and impact angles. The reality is that the VRS will be impacted at a range of velocities and angles of impact by many different vehicles. There will be cases that result in large variations of the actual impact loads compared to the loads recorded from the crash testing. Secondly, measuring loads during the full-scale crash test could be expensive, and sensitivity should be given to the manner in which the loads are measured.
Consequently this methodology can underestimate the loads imparted on the bridge deck during a real-life impact. Underestimation of the loads could be a negative outcome as it can result in the installation of a VRS on an understrength bridge deck, which could result in failure. SECOND METHODOLOGY: MAXIMUM LOADS CALCULATION A second methodology, which overcomes most of these problems, is to identify the maximum possible loadings that the VRS can impart into the bridge deck structure at the effective height (the effective height being the average height of the members of the barrier being presented to the vehicle). This method takes into account more real-life scenarios by looking at the ultimate strength of the VRS itself as the VRS cannot supply any larger load to the bridge deck than that of its ultimate strength.
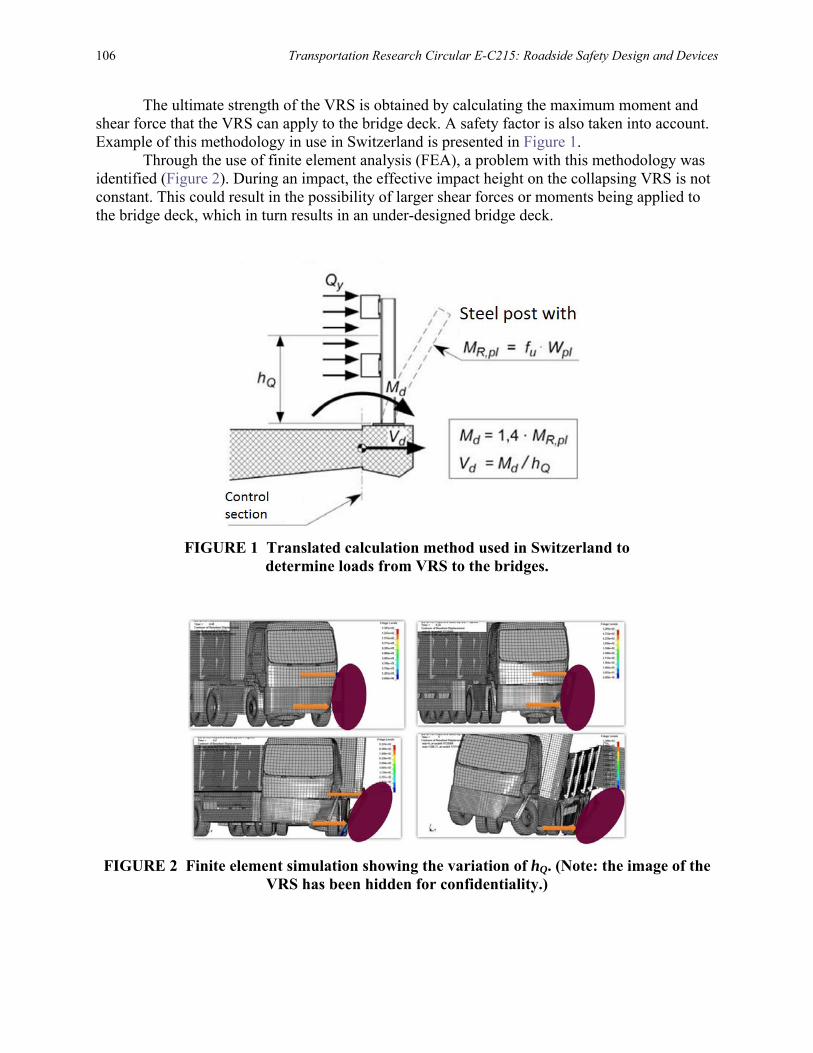
106 Transportation Research Circular E-C215: Roadside Safety Design and Devices
The ultimate strength of the VRS is obtained by calculating the maximum moment and shear force that the VRS can apply to the bridge deck. A safety factor is also taken into account. Example of this methodology in use in Switzerland is presented in Figure 1.
Through the use of finite element analysis (FEA), a problem with this methodology was identified (Figure 2). During an impact, the effective impact height on the collapsing VRS is not constant. This could result in the possibility of larger shear forces or moments being applied to the bridge deck, which in turn results in an under-designed bridge deck.
FIGURE 1 Translated calculation method used in Switzerland to determine loads from VRS to the bridges.
FIGURE 2 Finite element simulation showing the variation of hQ. (Note: the image of the VRS has been hidden for confidentiality.)
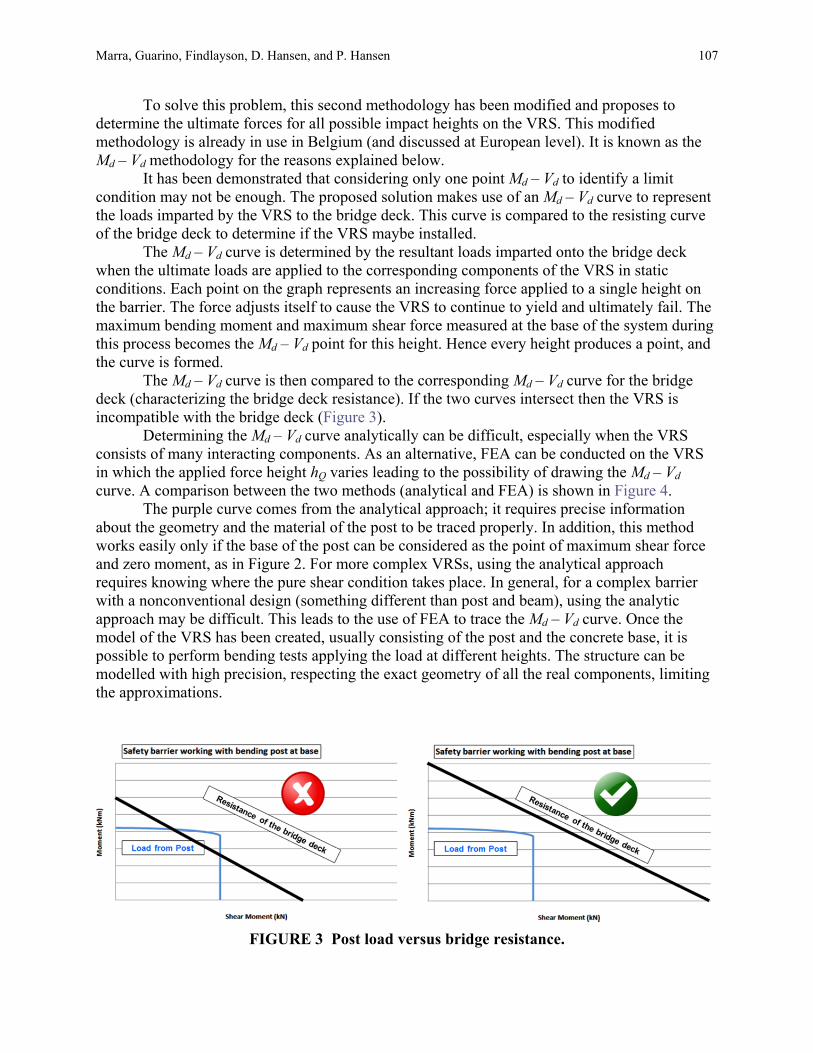
Marra, Guarino, Findlayson, D. Hansen, and P. Hansen 107
To solve this problem, this second methodology has been modified and proposes to determine the ultimate forces for all possible impact heights on the VRS. This modified methodology is already in use in Belgium (and discussed at European level). It is known as the Md – Vd methodology for the reasons explained below.
It has been demonstrated that considering only one point Md – Vd to identify a limit condition may not be enough. The proposed solution makes use of an Md – Vd curve to represent the loads imparted by the VRS to the bridge deck. This curve is compared to the resisting curve of the bridge deck to determine if the VRS maybe installed.
The Md – Vd curve is determined by the resultant loads imparted onto the bridge deck when the ultimate loads are applied to the corresponding components of the VRS in static conditions. Each point on the graph represents an increasing force applied to a single height on the barrier. The force adjusts itself to cause the VRS to continue to yield and ultimately fail. The maximum bending moment and maximum shear force measured at the base of the system during this process becomes the Md – Vd point for this height. Hence every height produces a point, and the curve is formed.
The Md – Vd curve is then compared to the corresponding Md – Vd curve for the bridge deck (characterizing the bridge deck resistance). If the two curves intersect then the VRS is incompatible with the bridge deck (Figure 3).
Determining the Md – Vd curve analytically can be difficult, especially when the VRS consists of many interacting components. As an alternative, FEA can be conducted on the VRS in which the applied force height hQ varies leading to the possibility of drawing the Md – Vd curve. A comparison between the two methods (analytical and FEA) is shown in Figure 4.
The purple curve comes from the analytical approach; it requires precise information about the geometry and the material of the post to be traced properly. In addition, this method works easily only if the base of the post can be considered as the point of maximum shear force and zero moment, as in Figure 2. For more complex VRSs, using the analytical approach requires knowing where the pure shear condition takes place. In general, for a complex barrier with a nonconventional design (something different than post and beam), using the analytic approach may be difficult. This leads to the use of FEA to trace the Md – Vd curve. Once the model of the VRS has been created, usually consisting of the post and the concrete base, it is possible to perform bending tests applying the load at different heights. The structure can be modelled with high precision, respecting the exact geometry of all the real components, limiting the approximations.
FIGURE 3 Post load versus bridge resistance.
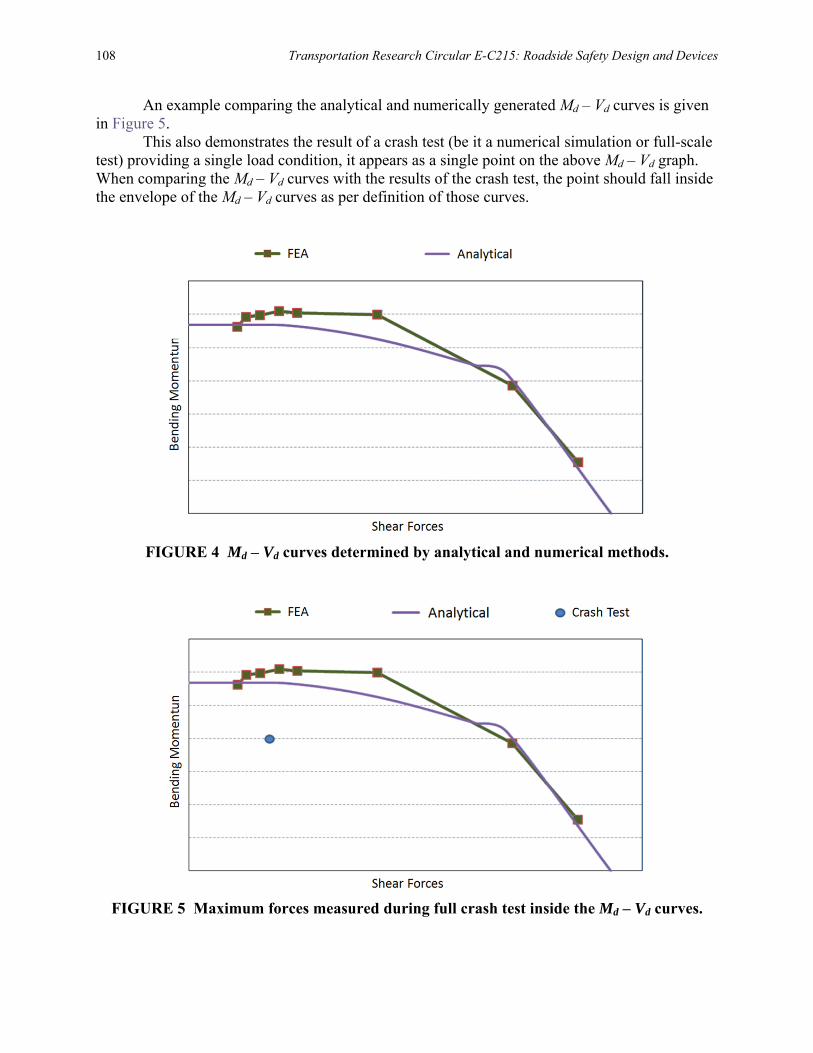
108 Transportation Research Circular E-C215: Roadside Safety Design and Devices
An example comparing the analytical and numerically generated Md – Vd curves is given in Figure 5.
This also demonstrates the result of a crash test (be it a numerical simulation or full-scale test) providing a single load condition, it appears as a single point on the above Md – Vd graph. When comparing the Md – Vd curves with the results of the crash test, the point should fall inside the envelope of the Md – Vd curves as per definition of those curves.
FIGURE 4 Md – Vd curves determined by analytical and numerical methods.
FIGURE 5 Maximum forces measured during full crash test inside the Md – Vd curves.
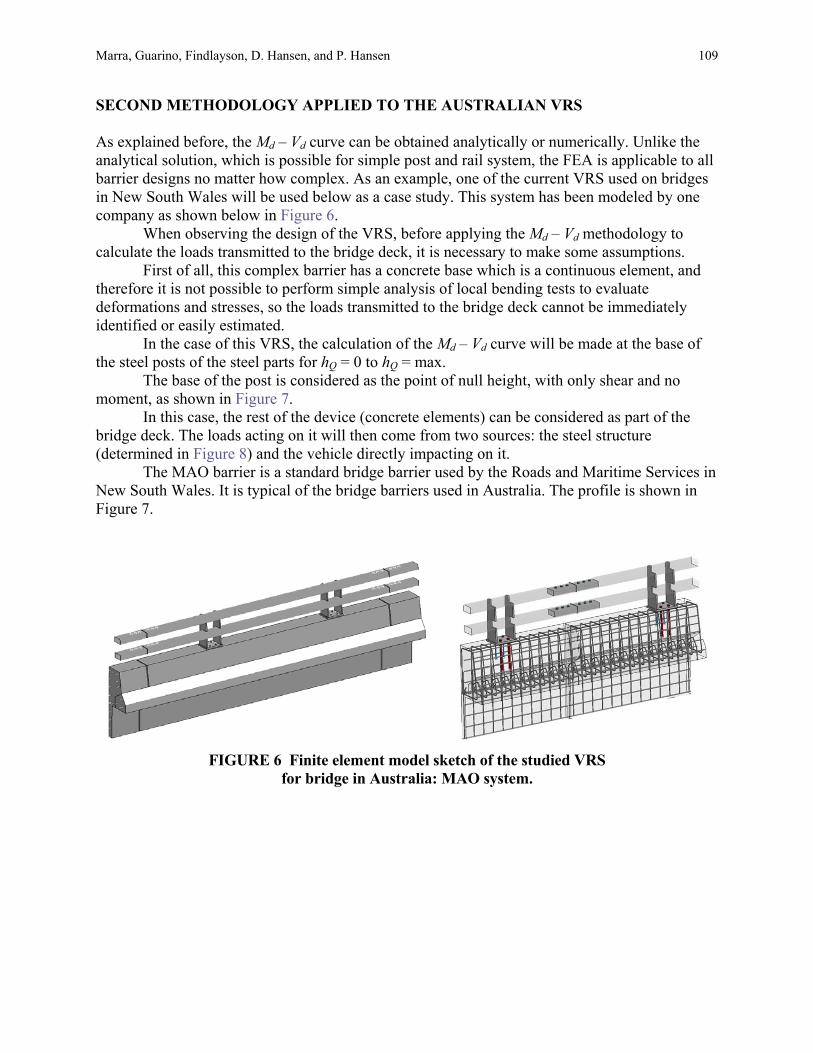
Marra, Guarino, Findlayson, D. Hansen, and P. Hansen 109
SECOND METHODOLOGY APPLIED TO THE AUSTRALIAN VRS As explained before, the Md – Vd curve can be obtained analytically or numerically. Unlike the analytical solution, which is possible for simple post and rail system, the FEA is applicable to all barrier designs no matter how complex. As an example, one of the current VRS used on bridges in New South Wales will be used below as a case study. This system has been modeled by one company as shown below in Figure 6.
When observing the design of the VRS, before applying the Md – Vd methodology to calculate the loads transmitted to the bridge deck, it is necessary to make some assumptions.
First of all, this complex barrier has a concrete base which is a continuous element, and therefore it is not possible to perform simple analysis of local bending tests to evaluate deformations and stresses, so the loads transmitted to the bridge deck cannot be immediately identified or easily estimated.
In the case of this VRS, the calculation of the Md – Vd curve will be made at the base of the steel posts of the steel parts for hQ = 0 to hQ = max.
The base of the post is considered as the point of null height, with only shear and no moment, as shown in Figure 7.
In this case, the rest of the device (concrete elements) can be considered as part of the bridge deck. The loads acting on it will then come from two sources: the steel structure (determined in Figure 8) and the vehicle directly impacting on it.
The MAO barrier is a standard bridge barrier used by the Roads and Maritime Services in New South Wales. It is typical of the bridge barriers used in Australia. The profile is shown in Figure 7.
FIGURE 6 Finite element model sketch of the studied VRS for bridge in Australia: MAO system.
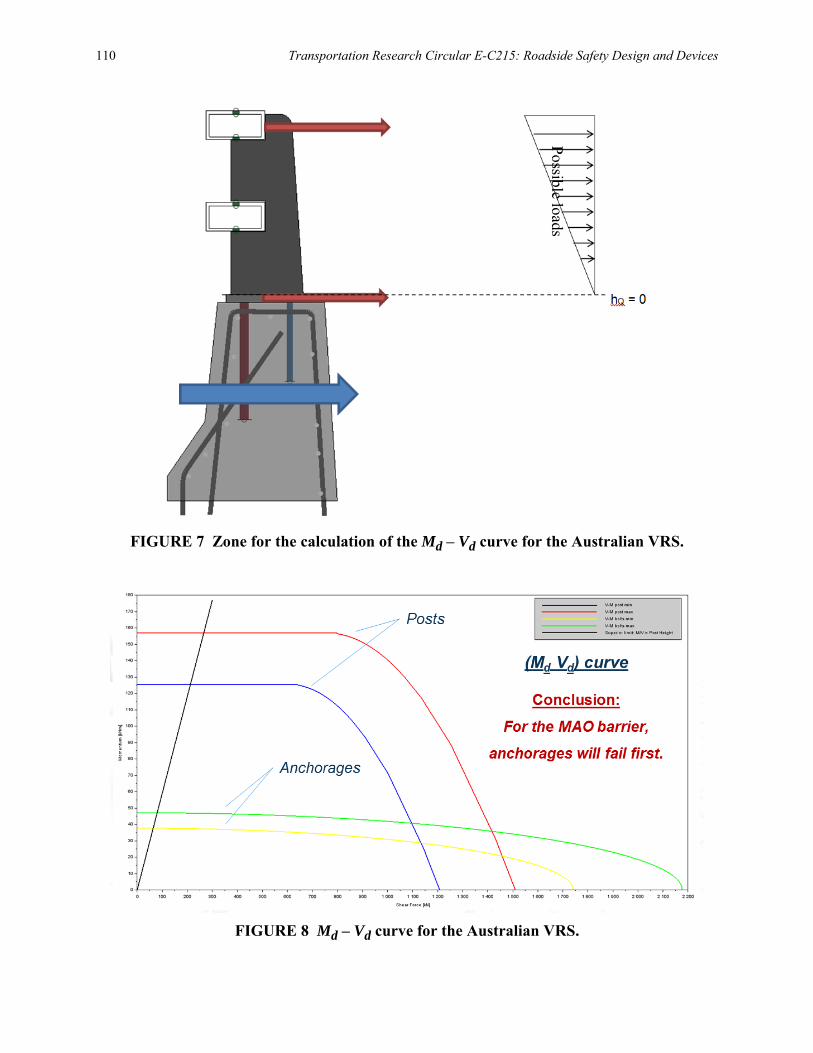
110 Transportation Research Circular E-C215: Roadside Safety Design and Devices
FIGURE 7 Zone for the calculation of the Md – Vd curve for the Australian VRS.
FIGURE 8 Md – Vd curve for the Australian VRS.
Possible loads
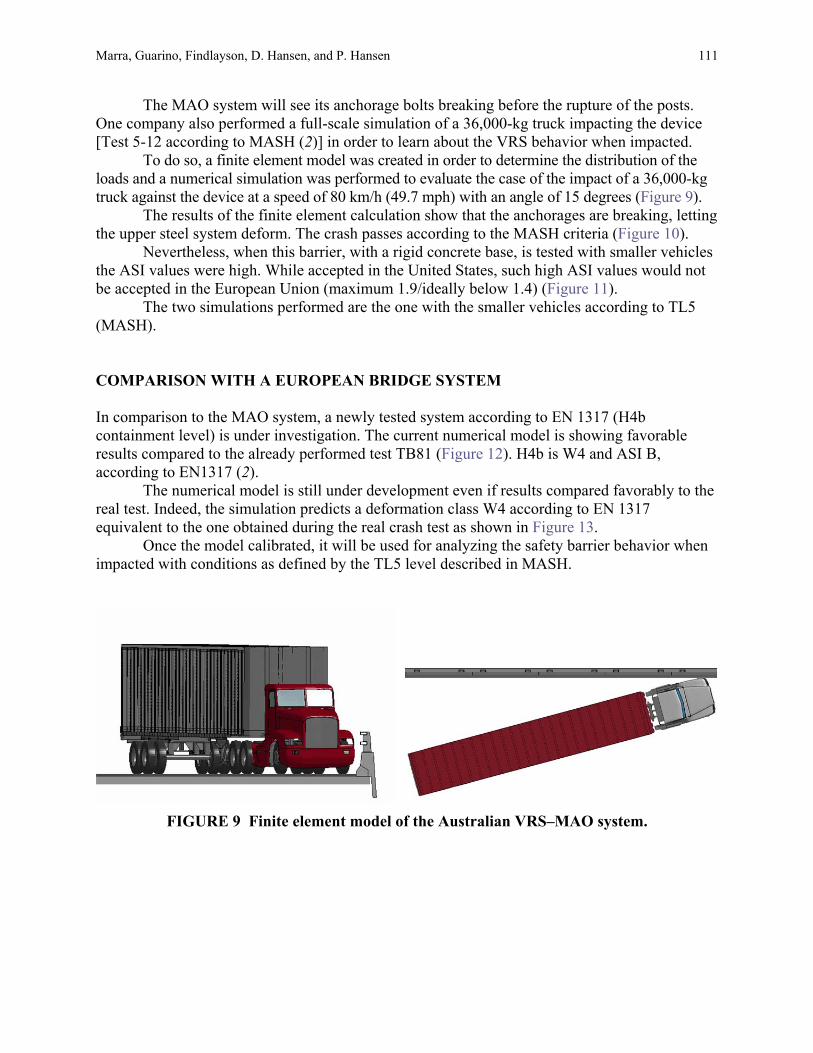
Marra, Guarino, Findlayson, D. Hansen, and P. Hansen 111
The MAO system will see its anchorage bolts breaking before the rupture of the posts. One company also performed a full-scale simulation of a 36,000-kg truck impacting the device [Test 5-12 according to MASH (2)] in order to learn about the VRS behavior when impacted.
To do so, a finite element model was created in order to determine the distribution of the loads and a numerical simulation was performed to evaluate the case of the impact of a 36,000-kg truck against the device at a speed of 80 km/h (49.7 mph) with an angle of 15 degrees (Figure 9).
The results of the finite element calculation show that the anchorages are breaking, letting the upper steel system deform. The crash passes according to the MASH criteria (Figure 10).
Nevertheless, when this barrier, with a rigid concrete base, is tested with smaller vehicles the ASI values were high. While accepted in the United States, such high ASI values would not be accepted in the European Union (maximum 1.9/ideally below 1.4) (Figure 11).
The two simulations performed are the one with the smaller vehicles according to TL5 (MASH). COMPARISON WITH A EUROPEAN BRIDGE SYSTEM In comparison to the MAO system, a newly tested system according to EN 1317 (H4b containment level) is under investigation. The current numerical model is showing favorable results compared to the already performed test TB81 (Figure 12). H4b is W4 and ASI B, according to EN1317 (2).
The numerical model is still under development even if results compared favorably to the real test. Indeed, the simulation predicts a deformation class W4 according to EN 1317 equivalent to the one obtained during the real crash test as shown in Figure 13.
Once the model calibrated, it will be used for analyzing the safety barrier behavior when impacted with conditions as defined by the TL5 level described in MASH.
FIGURE 9 Finite element model of the Australian VRS–MAO system.
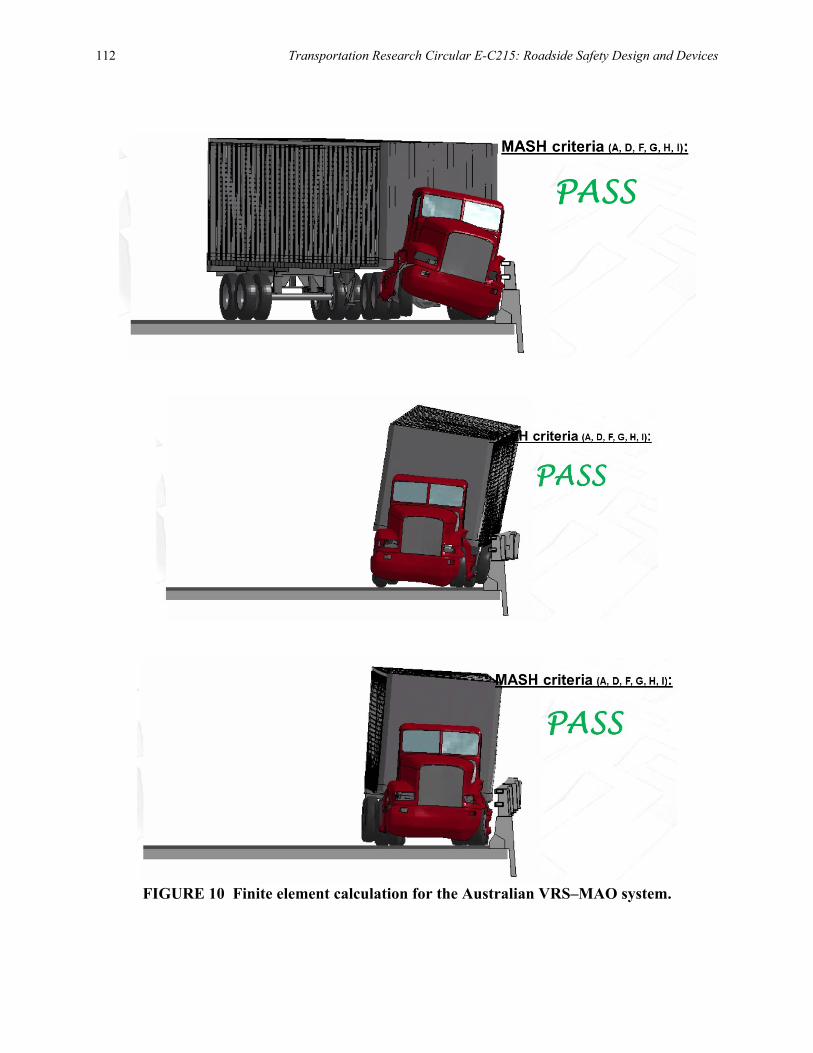
112 Transportation Research Circular E-C215: Roadside Safety Design and Devices
FIGURE 10 Finite element calculation for the Australian VRS–MAO system.
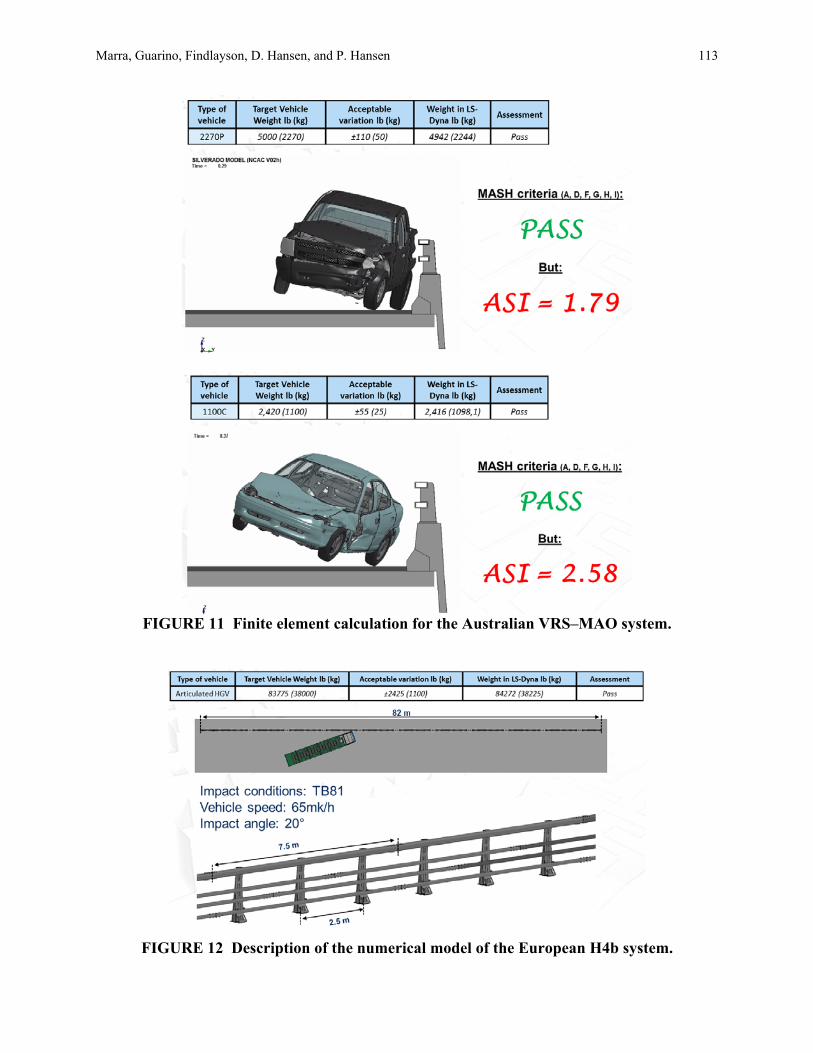
Marra, Guarino, Findlayson, D. Hansen, and P. Hansen 113
FIGURE 11 Finite element calculation for the Australian VRS–MAO system.
FIGURE 12 Description of the numerical model of the European H4b system.
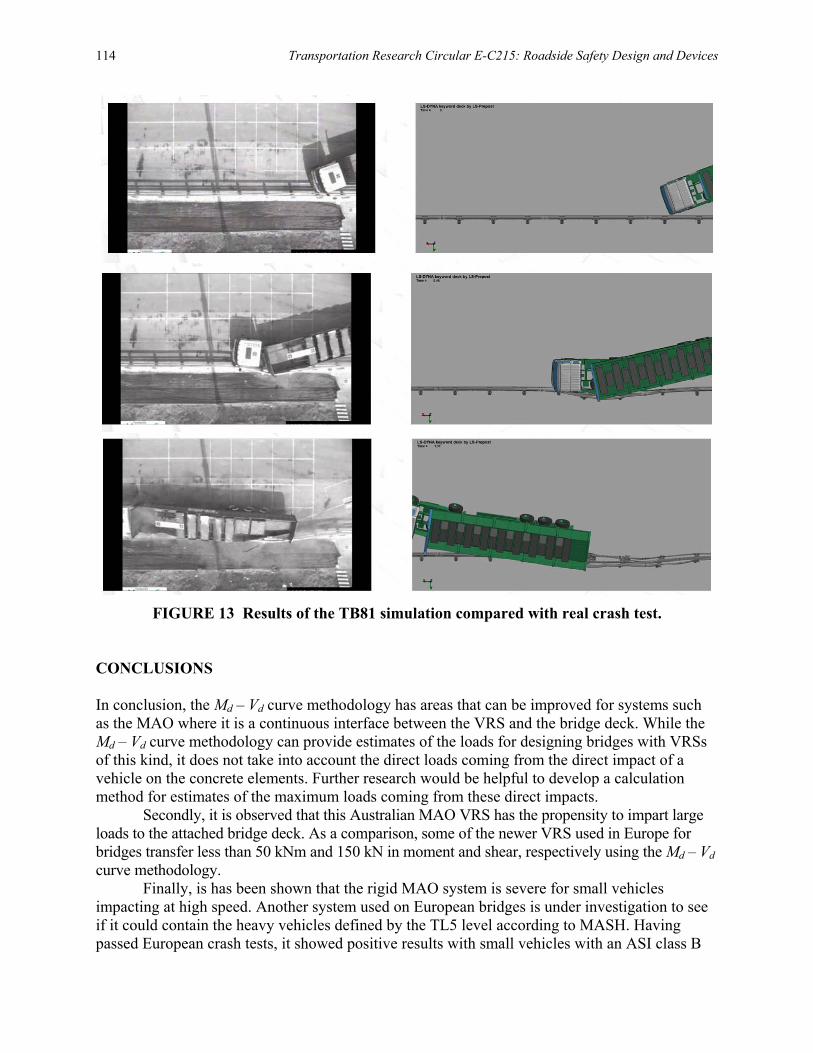
114 Transportation Research Circular E-C215: Roadside Safety Design and Devices
FIGURE 13 Results of the TB81 simulation compared with real crash test. CONCLUSIONS In conclusion, the Md – Vd curve methodology has areas that can be improved for systems such as the MAO where it is a continuous interface between the VRS and the bridge deck. While the Md – Vd curve methodology can provide estimates of the loads for designing bridges with VRSs of this kind, it does not take into account the direct loads coming from the direct impact of a vehicle on the concrete elements. Further research would be helpful to develop a calculation method for estimates of the maximum loads coming from these direct impacts.
Secondly, it is observed that this Australian MAO VRS has the propensity to impart large loads to the attached bridge deck. As a comparison, some of the newer VRS used in Europe for bridges transfer less than 50 kNm and 150 kN in moment and shear, respectively using the Md – Vd curve methodology.
Finally, is has been shown that the rigid MAO system is severe for small vehicles impacting at high speed. Another system used on European bridges is under investigation to see if it could contain the heavy vehicles defined by the TL5 level according to MASH. Having passed European crash tests, it showed positive results with small vehicles with an ASI class B
Marra, Guarino, Findlayson, D. Hansen, and P. Hansen 115
(<1.4). Currently, the numerical model of this bridge safety barrier is under development and TL5 simulation results should be available in the future. REFERENCES 1. EN1991-2: Actions on Structures—Part 2 : Traffic Loads on Bridges, European Standard. 2. American Association of State Highway and Transportation Officials. Manual for Assessing Safety
Hardware, Washington, D.C., 2009. 3. EN1317: Road Restraint Systems, European Standard. ADDITIONAL RESOURCES Barrières de sécurité pour la retenue des poids lourds—Barrières de niveau H2 ou H3. Collection du
guide technique GC, Setra, 1999. NF EN1991-2/NA—Annexe Nationale à la NF EN 1991-2: 2004—Eurocode 1—Actions sur les
structures—Partie 2: Actions sur les ponts, dues au traffic. French Standard, 2008. Grzebieta, R., and G. Rechnitzer. Interface Analysis and Design: Improving Heavy Vehicle Road Safety
Barrier Design. Transport and Road Safety Research, University of New South Wales, Australia, 2013. Austroads. Standardised Bridge Barrier Design. Research Report, 2013. Bridge Design, Part 5: Concrete. Australian Standard, 2004. NCHRP Report 350: Recommended Procedures for the Safety Performance Evaluation of Highway
Features, TRB, National Research Council, 1993.
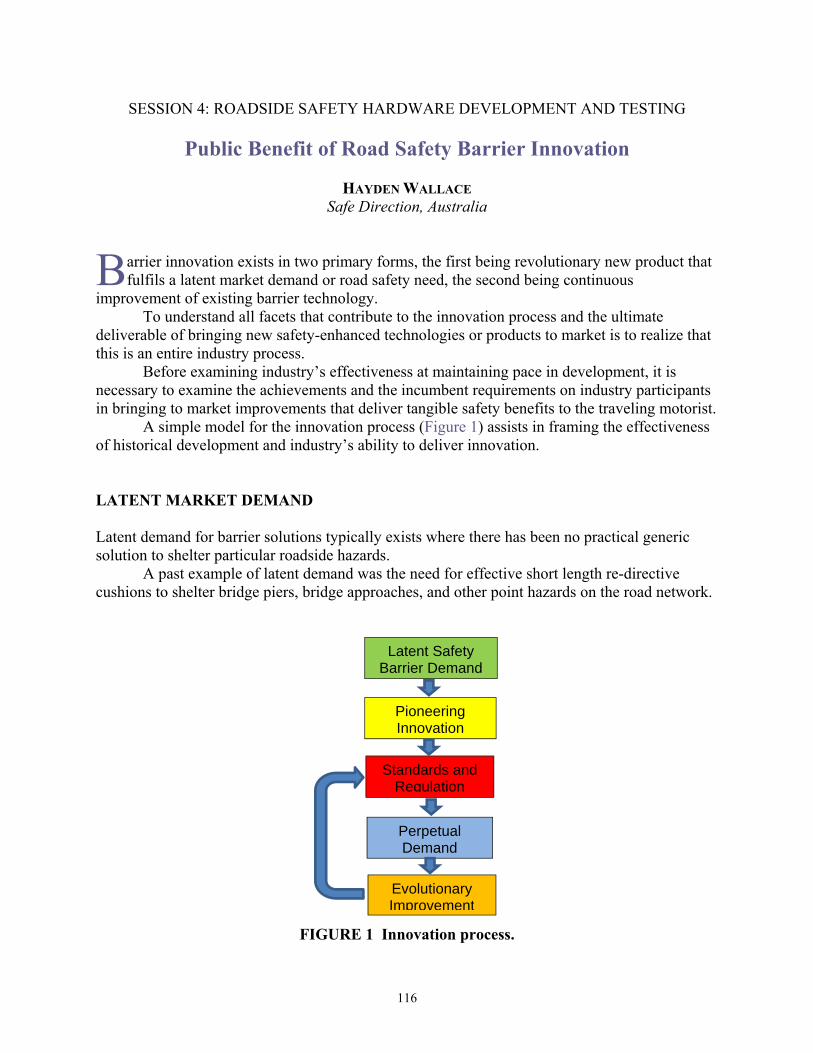
116
SESSION 4: ROADSIDE SAFETY HARDWARE DEVELOPMENT AND TESTING
Public Benefit of Road Safety Barrier Innovation
HAYDEN WALLACE Safe Direction, Australia
arrier innovation exists in two primary forms, the first being revolutionary new product that fulfils a latent market demand or road safety need, the second being continuous
improvement of existing barrier technology. To understand all facets that contribute to the innovation process and the ultimate
deliverable of bringing new safety-enhanced technologies or products to market is to realize that this is an entire industry process.
Before examining industry’s effectiveness at maintaining pace in development, it is necessary to examine the achievements and the incumbent requirements on industry participants in bringing to market improvements that deliver tangible safety benefits to the traveling motorist.
A simple model for the innovation process (Figure 1) assists in framing the effectiveness of historical development and industry’s ability to deliver innovation. LATENT MARKET DEMAND Latent demand for barrier solutions typically exists where there has been no practical generic solution to shelter particular roadside hazards.
A past example of latent demand was the need for effective short length re-directive cushions to shelter bridge piers, bridge approaches, and other point hazards on the road network.
FIGURE 1 Innovation process.
B
Latent Safety Barrier Demand
Pioneering Innovation
Standards and Regulation
Perpetual Demand
Evolutionary Improvement
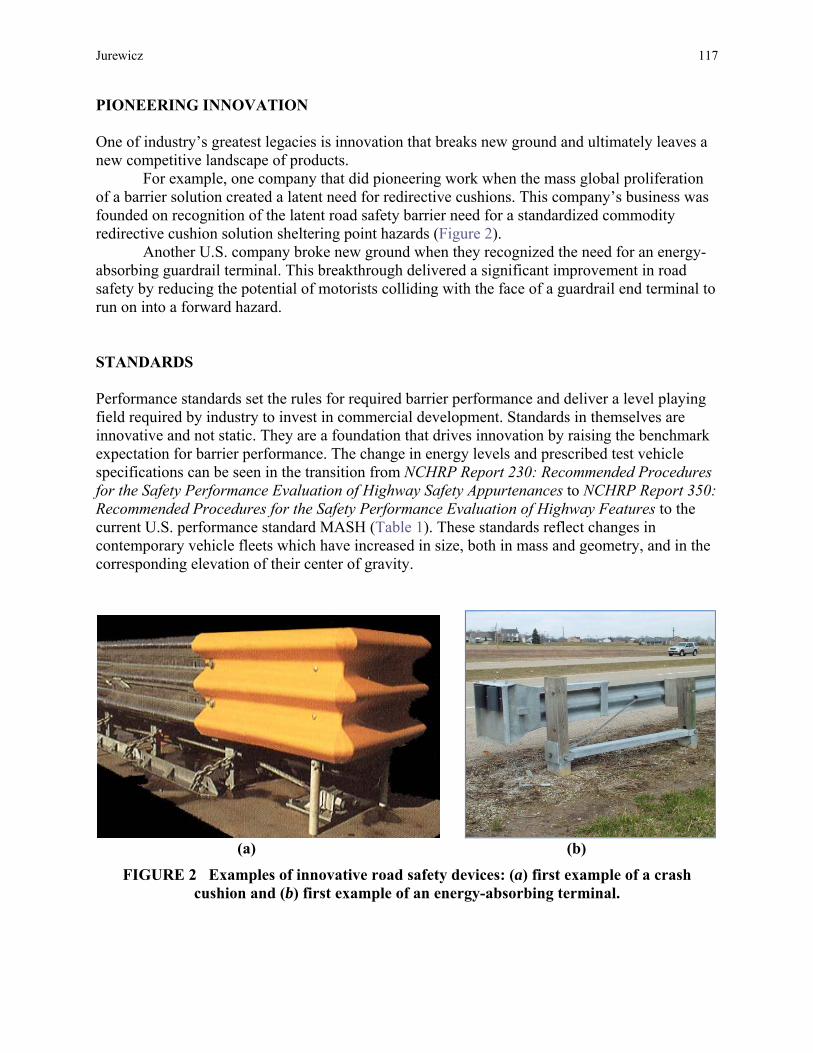
Jurewicz 117
PIONEERING INNOVATION One of industry’s greatest legacies is innovation that breaks new ground and ultimately leaves a new competitive landscape of products.
For example, one company that did pioneering work when the mass global proliferation of a barrier solution created a latent need for redirective cushions. This company’s business was founded on recognition of the latent road safety barrier need for a standardized commodity redirective cushion solution sheltering point hazards (Figure 2).
Another U.S. company broke new ground when they recognized the need for an energy-absorbing guardrail terminal. This breakthrough delivered a significant improvement in road safety by reducing the potential of motorists colliding with the face of a guardrail end terminal to run on into a forward hazard. STANDARDS Performance standards set the rules for required barrier performance and deliver a level playing field required by industry to invest in commercial development. Standards in themselves are innovative and not static. They are a foundation that drives innovation by raising the benchmark expectation for barrier performance. The change in energy levels and prescribed test vehicle specifications can be seen in the transition from NCHRP Report 230: Recommended Procedures for the Safety Performance Evaluation of Highway Safety Appurtenances to NCHRP Report 350: Recommended Procedures for the Safety Performance Evaluation of Highway Features to the current U.S. performance standard MASH (Table 1). These standards reflect changes in contemporary vehicle fleets which have increased in size, both in mass and geometry, and in the corresponding elevation of their center of gravity.
(a) (b)
FIGURE 2 Examples of innovative road safety devices: (a) first example of a crash cushion and (b) first example of an energy-absorbing terminal.
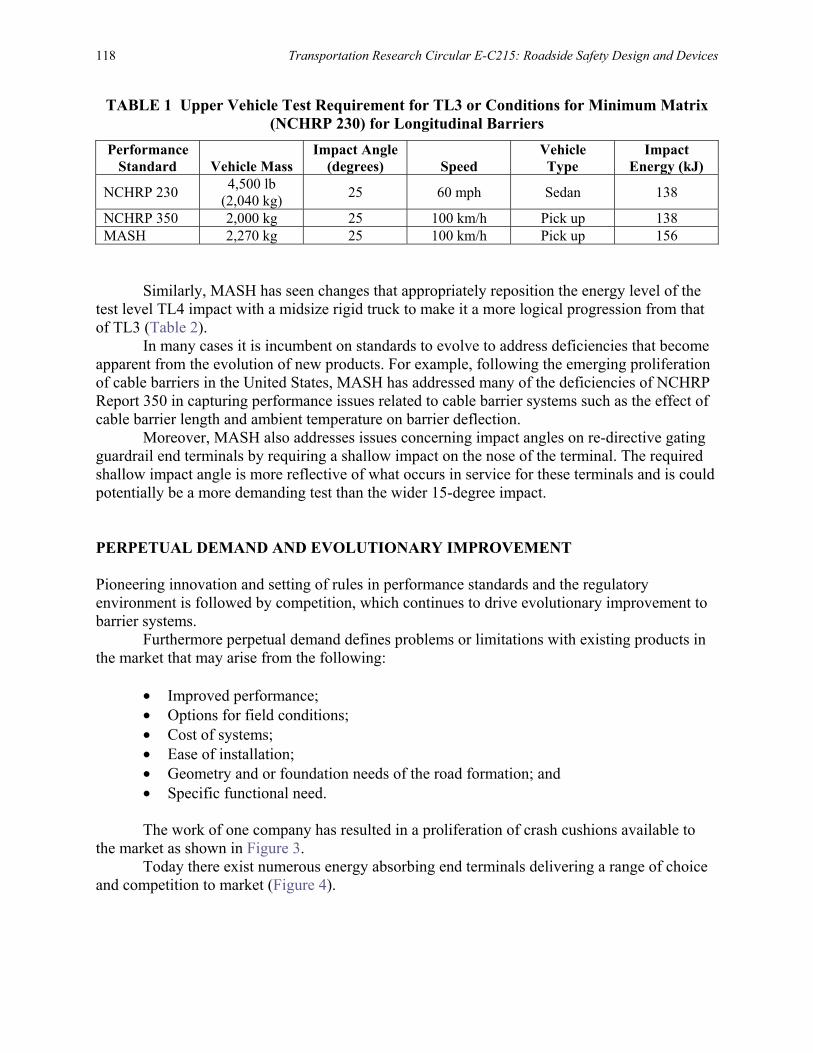
118 Transportation Research Circular E-C215: Roadside Safety Design and Devices
TABLE 1 Upper Vehicle Test Requirement for TL3 or Conditions for Minimum Matrix (NCHRP 230) for Longitudinal Barriers
Performance Standard Vehicle Mass
Impact Angle (degrees) Speed
Vehicle Type
Impact Energy (kJ)
NCHRP 230 4,500 lb
(2,040 kg) 25 60 mph Sedan 138
NCHRP 350 2,000 kg 25 100 km/h Pick up 138 MASH 2,270 kg 25 100 km/h Pick up 156
Similarly, MASH has seen changes that appropriately reposition the energy level of the test level TL4 impact with a midsize rigid truck to make it a more logical progression from that of TL3 (Table 2).
In many cases it is incumbent on standards to evolve to address deficiencies that become apparent from the evolution of new products. For example, following the emerging proliferation of cable barriers in the United States, MASH has addressed many of the deficiencies of NCHRP Report 350 in capturing performance issues related to cable barrier systems such as the effect of cable barrier length and ambient temperature on barrier deflection.
Moreover, MASH also addresses issues concerning impact angles on re-directive gating guardrail end terminals by requiring a shallow impact on the nose of the terminal. The required shallow impact angle is more reflective of what occurs in service for these terminals and is could potentially be a more demanding test than the wider 15-degree impact. PERPETUAL DEMAND AND EVOLUTIONARY IMPROVEMENT Pioneering innovation and setting of rules in performance standards and the regulatory environment is followed by competition, which continues to drive evolutionary improvement to barrier systems.
Furthermore perpetual demand defines problems or limitations with existing products in the market that may arise from the following:
• Improved performance; • Options for field conditions; • Cost of systems; • Ease of installation; • Geometry and or foundation needs of the road formation; and • Specific functional need.
The work of one company has resulted in a proliferation of crash cushions available to
the market as shown in Figure 3. Today there exist numerous energy absorbing end terminals delivering a range of choice
and competition to market (Figure 4).
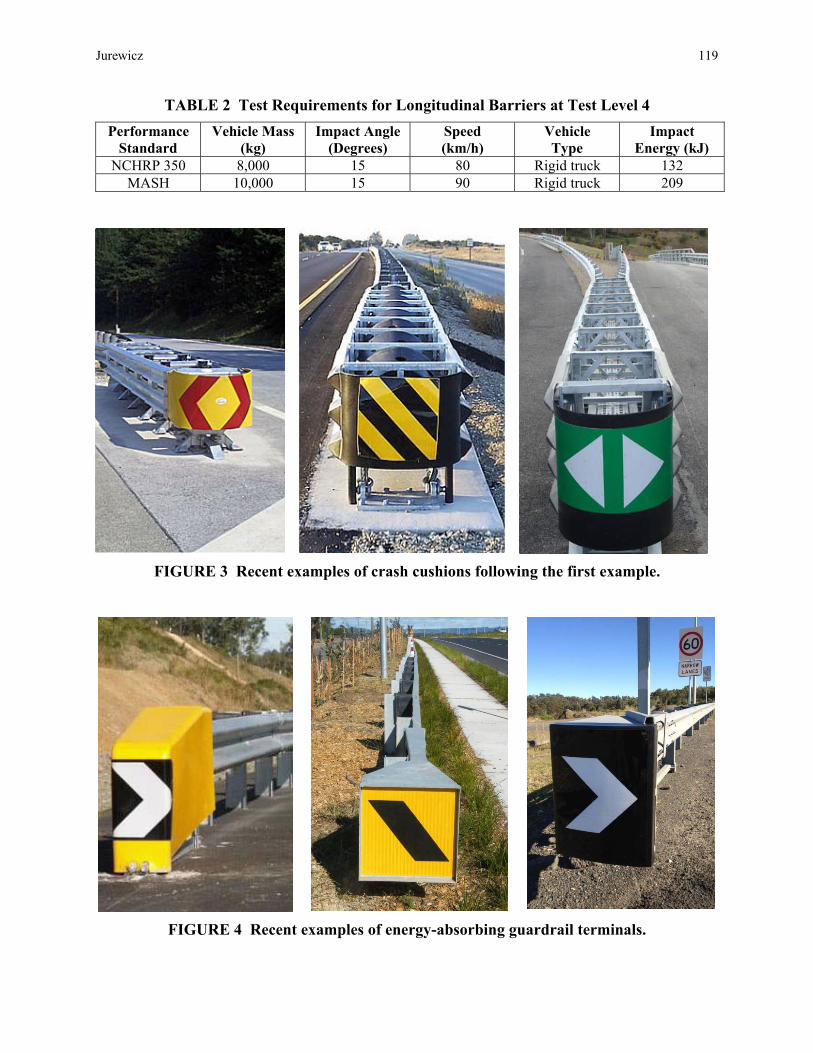
Jurewicz 119
TABLE 2 Test Requirements for Longitudinal Barriers at Test Level 4 Performance
Standard Vehicle Mass
(kg) Impact Angle
(Degrees) Speed (km/h)
Vehicle Type
Impact Energy (kJ)
NCHRP 350 8,000 15 80 Rigid truck 132 MASH 10,000 15 90 Rigid truck 209
FIGURE 3 Recent examples of crash cushions following the first example.
FIGURE 4 Recent examples of energy-absorbing guardrail terminals.
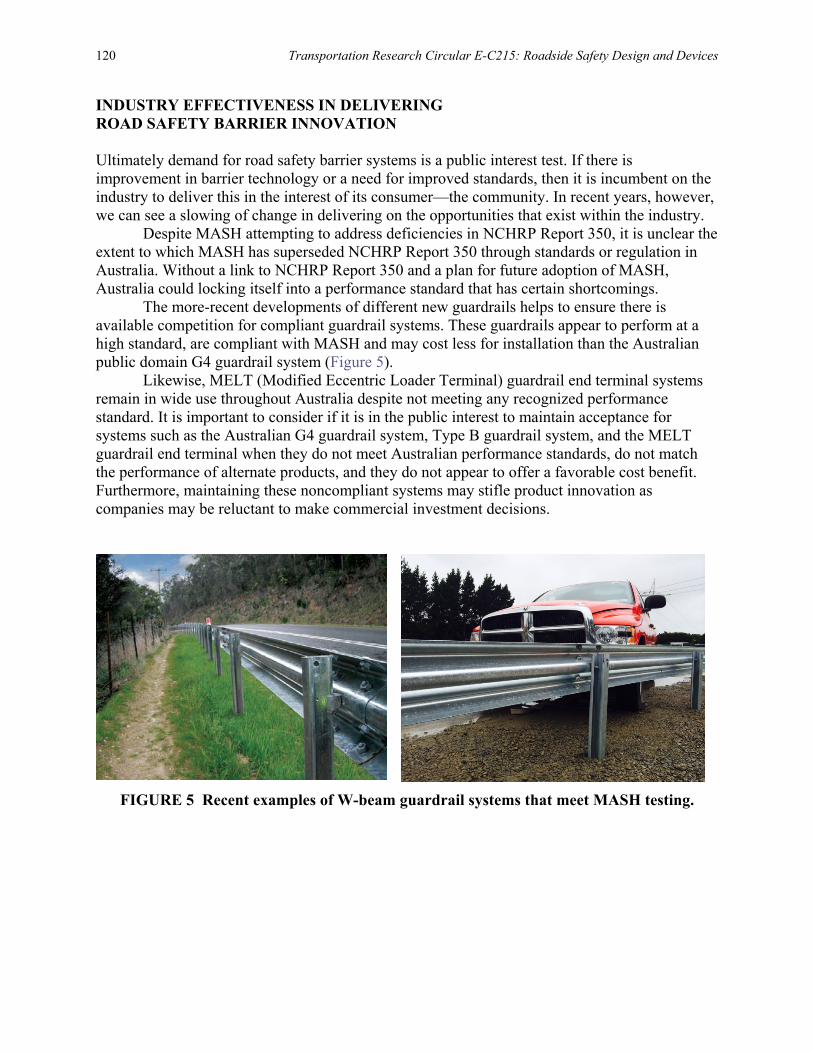
120 Transportation Research Circular E-C215: Roadside Safety Design and Devices
INDUSTRY EFFECTIVENESS IN DELIVERING ROAD SAFETY BARRIER INNOVATION Ultimately demand for road safety barrier systems is a public interest test. If there is improvement in barrier technology or a need for improved standards, then it is incumbent on the industry to deliver this in the interest of its consumer—the community. In recent years, however, we can see a slowing of change in delivering on the opportunities that exist within the industry.
Despite MASH attempting to address deficiencies in NCHRP Report 350, it is unclear the extent to which MASH has superseded NCHRP Report 350 through standards or regulation in Australia. Without a link to NCHRP Report 350 and a plan for future adoption of MASH, Australia could locking itself into a performance standard that has certain shortcomings.
The more-recent developments of different new guardrails helps to ensure there is available competition for compliant guardrail systems. These guardrails appear to perform at a high standard, are compliant with MASH and may cost less for installation than the Australian public domain G4 guardrail system (Figure 5).
Likewise, MELT (Modified Eccentric Loader Terminal) guardrail end terminal systems remain in wide use throughout Australia despite not meeting any recognized performance standard. It is important to consider if it is in the public interest to maintain acceptance for systems such as the Australian G4 guardrail system, Type B guardrail system, and the MELT guardrail end terminal when they do not meet Australian performance standards, do not match the performance of alternate products, and they do not appear to offer a favorable cost benefit. Furthermore, maintaining these noncompliant systems may stifle product innovation as companies may be reluctant to make commercial investment decisions.
FIGURE 5 Recent examples of W-beam guardrail systems that meet MASH testing.
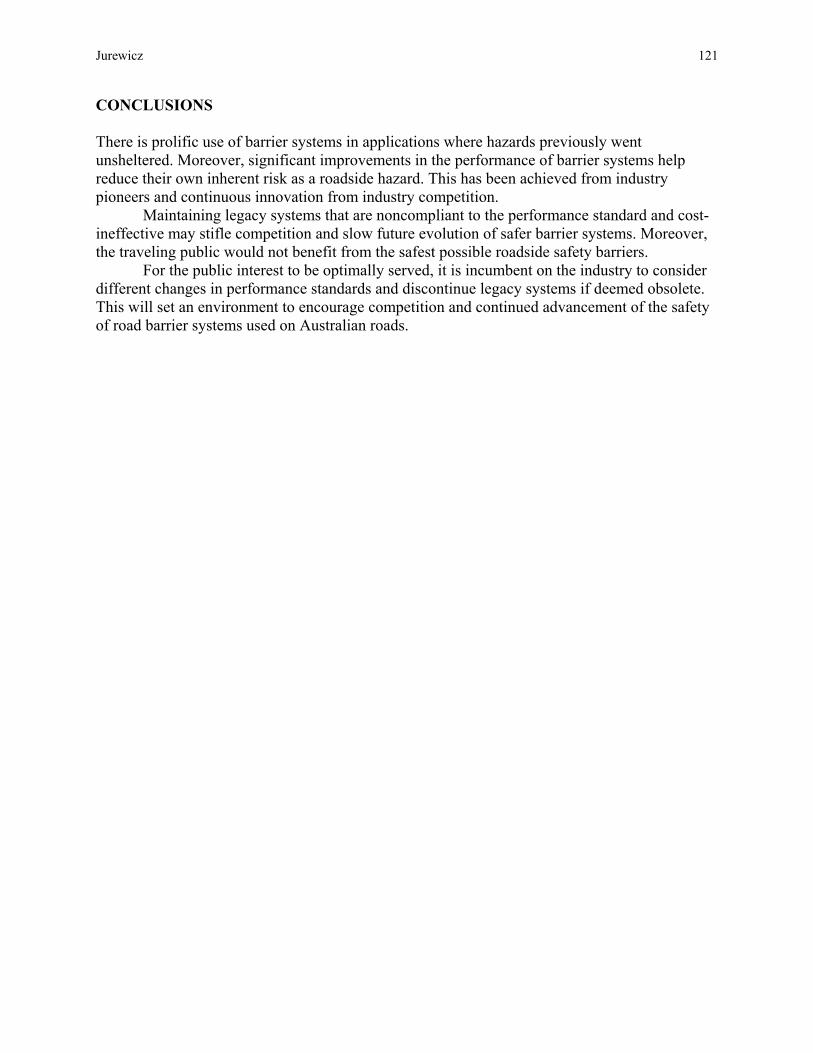
Jurewicz 121
CONCLUSIONS There is prolific use of barrier systems in applications where hazards previously went unsheltered. Moreover, significant improvements in the performance of barrier systems help reduce their own inherent risk as a roadside hazard. This has been achieved from industry pioneers and continuous innovation from industry competition.
Maintaining legacy systems that are noncompliant to the performance standard and cost-ineffective may stifle competition and slow future evolution of safer barrier systems. Moreover, the traveling public would not benefit from the safest possible roadside safety barriers.
For the public interest to be optimally served, it is incumbent on the industry to consider different changes in performance standards and discontinue legacy systems if deemed obsolete. This will set an environment to encourage competition and continued advancement of the safety of road barrier systems used on Australian roads.
122
SESSION 4: ROADSIDE SAFETY HARDWARE DEVELOPMENT AND TESTING
Analysis of In-Service Safety Performance of Wire Rope Safety Barriers
CHRIS JUREWICZ
ARRB Group, Australia
SAFETY EFFECTIVENESS OF WIRE ROPE BARRIERS Numerous studies report a reduction in severe run-off-road and head-on crashes pursuant to deployment of wire rope safety barrier (WRSB). Table 1 lists some studies and their findings. How Safe of a System Are They? Eastlink Investigation The Eastlink study used an incident data system which collected nearly all crash events on the Eastlink (a tolled motorway in Melbourne, Australia). There were 86 crash events into WRSB over an 18-month period from June 29, 2008, until December 31, 2010. The analysis focused on impacts that were close to the impact conditions in testing standards and included the following crash conditions:
• On the main roads; • Excluded heavy vehicles greater than 10 tons; and • Excluded multivehicle crashes.
There were no impacts by motorcyclists in the sample. The 61 impacts with wire rope
barriers (flexible barriers) were compared to single vehicle run-off-the-road crashes when a vehicle impacted another roadside objects (19 crashes) or when a vehicle did not hit an object (six crashes). There were no fatal crashes. The results are shown in Figure 1.
TABLE 1 Crash Studies Road Type Crash Type Crash Outcome
Continuous, rural freeway Run-off-road and cross-median head-on
79% injury crashes (1) 87% severe crashes (1)
Continuous, urban freeway
Run-off-road and cross-median head-on
86% injury crashes (1) 83% severe crashes (1)
Freeway medians Cross-median head-on 75% fatal crashes (2)
Narrow medians (e.g., 2 + 1)
All types, midblock 46% severe crashes on 110-km/h roads (3) 74% severe crashes on 90-km/h roads (3) 79% fatalities (4)
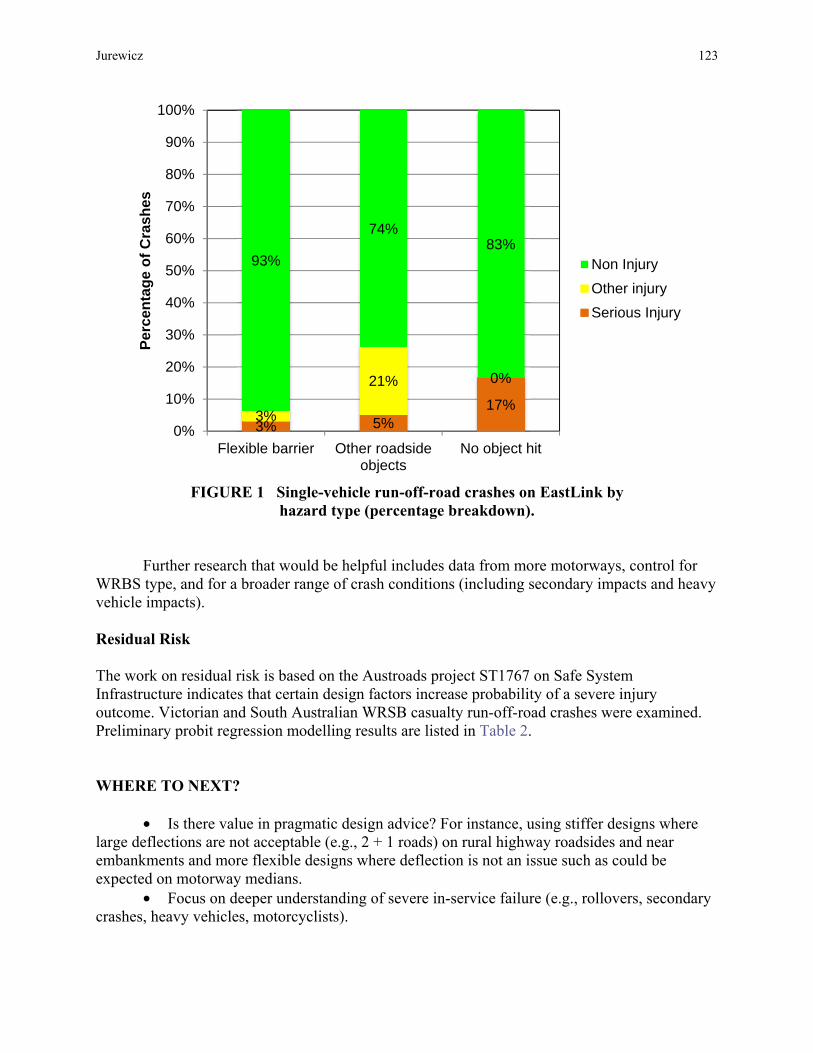
Jurewicz 123
FIGURE 1 Single-vehicle run-off-road crashes on EastLink by
hazard type (percentage breakdown).
Further research that would be helpful includes data from more motorways, control for WRBS type, and for a broader range of crash conditions (including secondary impacts and heavy vehicle impacts). Residual Risk The work on residual risk is based on the Austroads project ST1767 on Safe System Infrastructure indicates that certain design factors increase probability of a severe injury outcome. Victorian and South Australian WRSB casualty run-off-road crashes were examined. Preliminary probit regression modelling results are listed in Table 2. WHERE TO NEXT?
• Is there value in pragmatic design advice? For instance, using stiffer designs where large deflections are not acceptable (e.g., 2 + 1 roads) on rural highway roadsides and near embankments and more flexible designs where deflection is not an issue such as could be expected on motorway medians.
• Focus on deeper understanding of severe in-service failure (e.g., rollovers, secondary crashes, heavy vehicles, motorcyclists).
3% 5%17%
3%
21% 0%
93%
74%83%
0%
10%
20%
30%
40%
50%
60%
70%
80%
90%
100%
Flexible barrier Other roadsideobjects
No object hit
Perc
enta
ge o
f Cra
shes
Non InjuryOther injurySerious Injury
124 Transportation Research Circular E-C215: Roadside Safety Design and Devices
TABLE 2 Preliminary Probit Regression Analysis
Severe Crash Factors Increased Probability of a Severe Outcome
Four-rope design compared with three-rope design 30% Impact within 100 m of WRSB terminal 12%* 0.1-m reduction in WRSB post spacing 12%* Incremental 1-m increase in barrier offset from traffic lane 1%*
• Focus on WRSB design guidance refinement. • Focus on large-scale deployment of WRSB.
REFERENCES 1. Candappa, N., A. D’Elia, B. Corben, and S. Newstead. Report 291: Evaluation of the Effectiveness of
Flexible Barriers Along Victorian Roads: Final Report, Monash University Accident Research Centre, Clayton, Victoria, 2009.
2. Ray, M., C. Silvestri, C. Conron, and M. Mongiardini. Experience with Cable Median Barriers in the United States: Design Standards, Policies, and Performance. Journal of Transportation Engineering, Vol. 135, No. 10, 2009, pp. 711–20.
3. Gan, A., J. Shen, and A. Rodriguez. Update of Florida Crash Reduction Factors and Countermeasures to Improve the Development of District Safety Improvement Projects: Final Report. Florida Department of Transportation, Miami, 2005. Accessed March 25, 2008. Available at http:/ /lctr.eng.fiu.edu/Documents/CRFFinalReport.pdf.
4. Carlsson, A. Evaluation of 2+1 Roads with Cable Barrier, Final Report. Rapport 636A, Swedish National Road and Transport Research Institute, 2009.
[Note: Abstract prepared by the editors.]
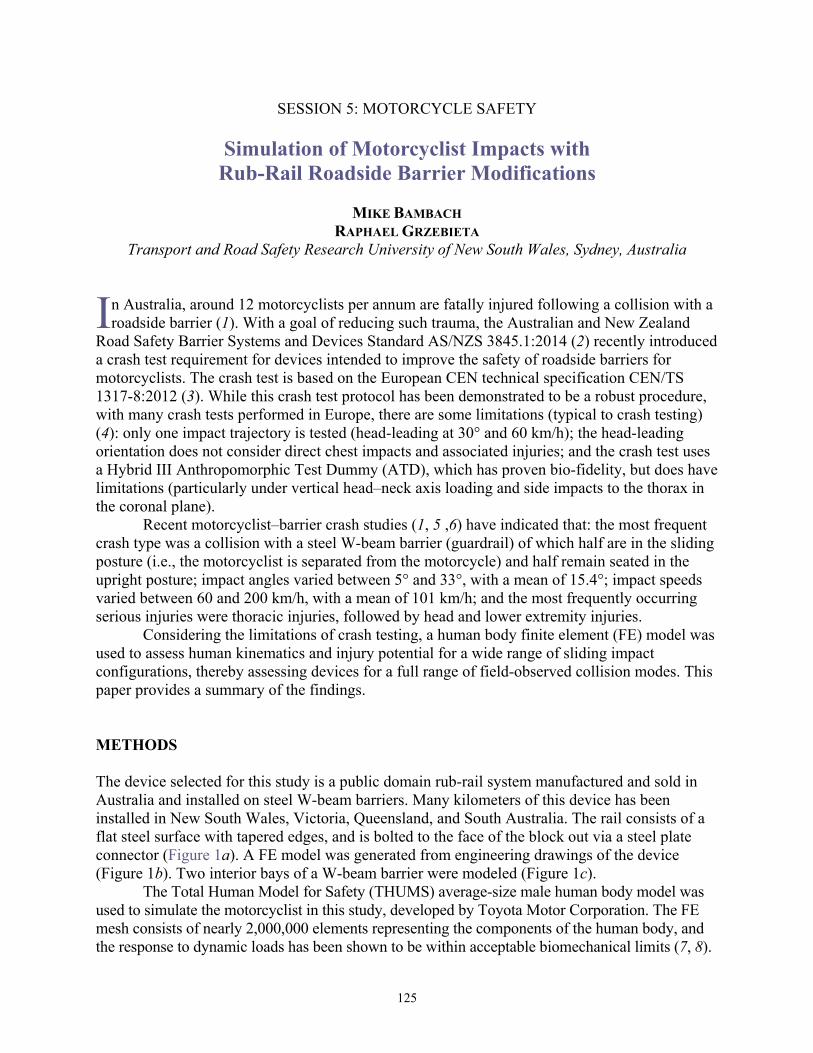
125
SESSION 5: MOTORCYCLE SAFETY
Simulation of Motorcyclist Impacts with Rub-Rail Roadside Barrier Modifications
MIKE BAMBACH
RAPHAEL GRZEBIETA Transport and Road Safety Research University of New South Wales, Sydney, Australia
n Australia, around 12 motorcyclists per annum are fatally injured following a collision with a roadside barrier (1). With a goal of reducing such trauma, the Australian and New Zealand
Road Safety Barrier Systems and Devices Standard AS/NZS 3845.1:2014 (2) recently introduced a crash test requirement for devices intended to improve the safety of roadside barriers for motorcyclists. The crash test is based on the European CEN technical specification CEN/TS 1317-8:2012 (3). While this crash test protocol has been demonstrated to be a robust procedure, with many crash tests performed in Europe, there are some limitations (typical to crash testing) (4): only one impact trajectory is tested (head-leading at 30° and 60 km/h); the head-leading orientation does not consider direct chest impacts and associated injuries; and the crash test uses a Hybrid III Anthropomorphic Test Dummy (ATD), which has proven bio-fidelity, but does have limitations (particularly under vertical head–neck axis loading and side impacts to the thorax in the coronal plane).
Recent motorcyclist–barrier crash studies (1, 5 ,6) have indicated that: the most frequent crash type was a collision with a steel W-beam barrier (guardrail) of which half are in the sliding posture (i.e., the motorcyclist is separated from the motorcycle) and half remain seated in the upright posture; impact angles varied between 5° and 33°, with a mean of 15.4°; impact speeds varied between 60 and 200 km/h, with a mean of 101 km/h; and the most frequently occurring serious injuries were thoracic injuries, followed by head and lower extremity injuries.
Considering the limitations of crash testing, a human body finite element (FE) model was used to assess human kinematics and injury potential for a wide range of sliding impact configurations, thereby assessing devices for a full range of field-observed collision modes. This paper provides a summary of the findings. METHODS The device selected for this study is a public domain rub-rail system manufactured and sold in Australia and installed on steel W-beam barriers. Many kilometers of this device has been installed in New South Wales, Victoria, Queensland, and South Australia. The rail consists of a flat steel surface with tapered edges, and is bolted to the face of the block out via a steel plate connector (Figure 1a). A FE model was generated from engineering drawings of the device (Figure 1b). Two interior bays of a W-beam barrier were modeled (Figure 1c).
The Total Human Model for Safety (THUMS) average-size male human body model was used to simulate the motorcyclist in this study, developed by Toyota Motor Corporation. The FE mesh consists of nearly 2,000,000 elements representing the components of the human body, and the response to dynamic loads has been shown to be within acceptable biomechanical limits (7, 8).
I
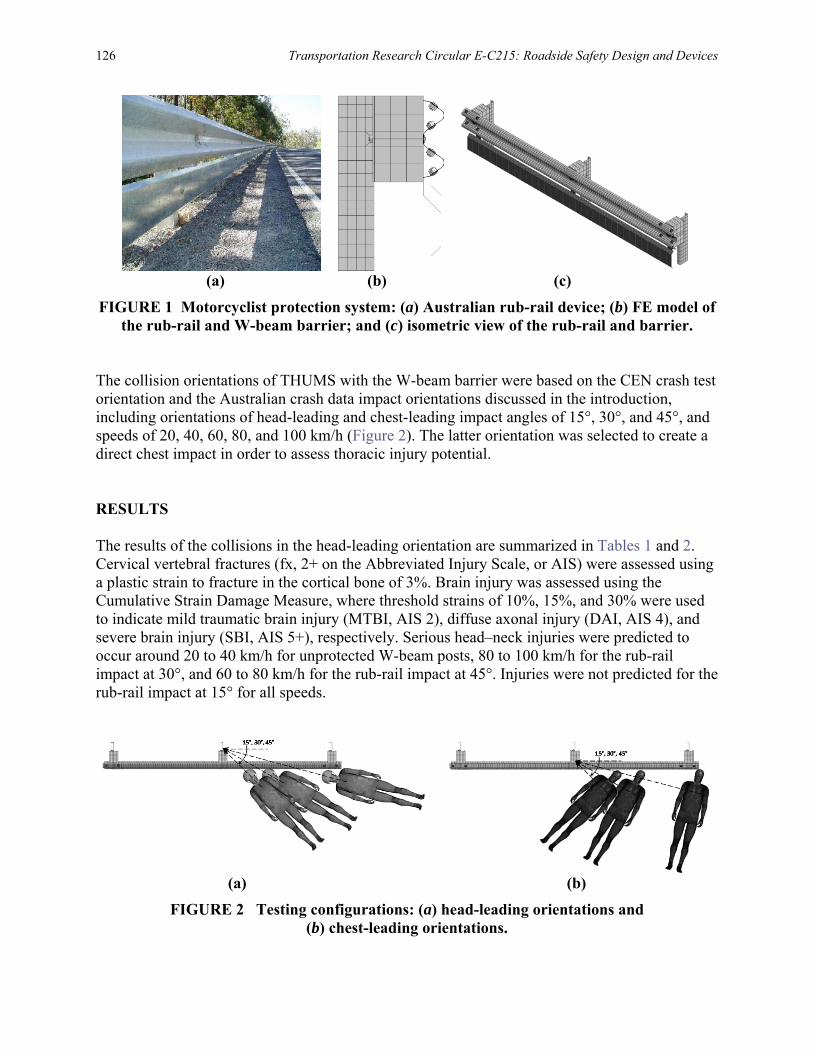
126 Transportation Research Circular E-C215: Roadside Safety Design and Devices
(a) (b) (c) FIGURE 1 Motorcyclist protection system: (a) Australian rub-rail device; (b) FE model of
the rub-rail and W-beam barrier; and (c) isometric view of the rub-rail and barrier. The collision orientations of THUMS with the W-beam barrier were based on the CEN crash test orientation and the Australian crash data impact orientations discussed in the introduction, including orientations of head-leading and chest-leading impact angles of 15°, 30°, and 45°, and speeds of 20, 40, 60, 80, and 100 km/h (Figure 2). The latter orientation was selected to create a direct chest impact in order to assess thoracic injury potential. RESULTS The results of the collisions in the head-leading orientation are summarized in Tables 1 and 2. Cervical vertebral fractures (fx, 2+ on the Abbreviated Injury Scale, or AIS) were assessed using a plastic strain to fracture in the cortical bone of 3%. Brain injury was assessed using the Cumulative Strain Damage Measure, where threshold strains of 10%, 15%, and 30% were used to indicate mild traumatic brain injury (MTBI, AIS 2), diffuse axonal injury (DAI, AIS 4), and severe brain injury (SBI, AIS 5+), respectively. Serious head–neck injuries were predicted to occur around 20 to 40 km/h for unprotected W-beam posts, 80 to 100 km/h for the rub-rail impact at 30°, and 60 to 80 km/h for the rub-rail impact at 45°. Injuries were not predicted for the rub-rail impact at 15° for all speeds.
(a) (b)
FIGURE 2 Testing configurations: (a) head-leading orientations and (b) chest-leading orientations.
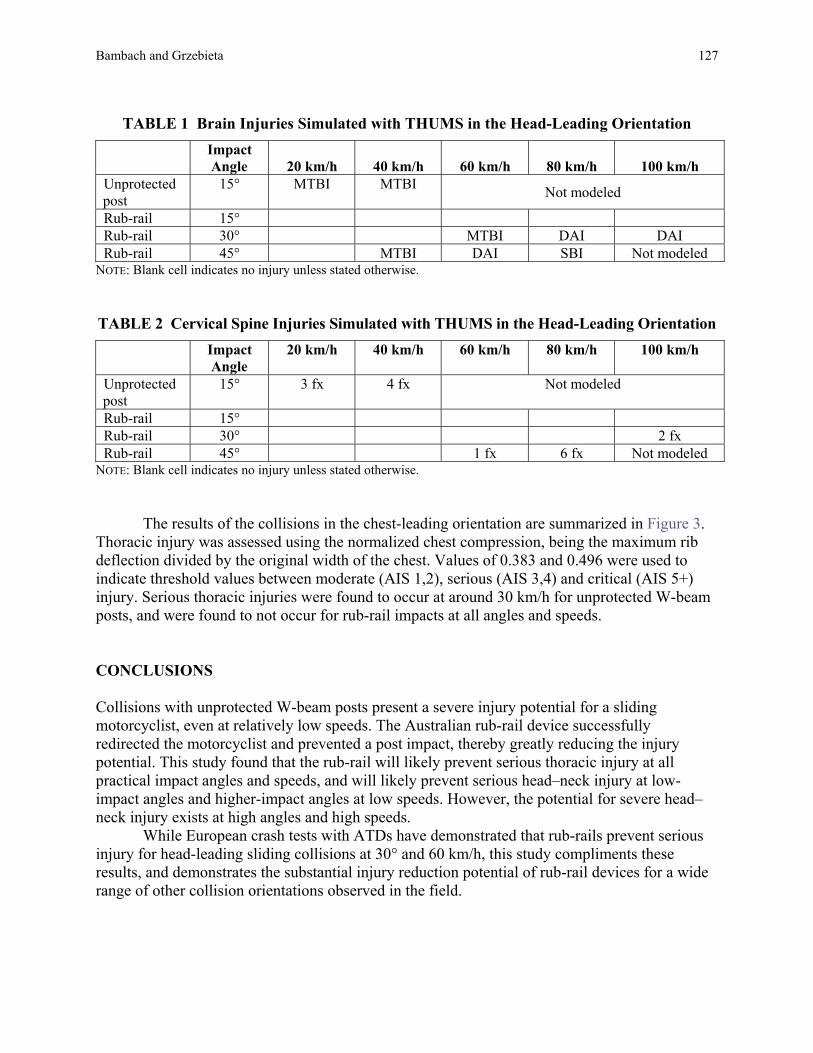
Bambach and Grzebieta 127
TABLE 1 Brain Injuries Simulated with THUMS in the Head-Leading Orientation
Impact Angle 20 km/h 40 km/h 60 km/h 80 km/h 100 km/h
Unprotected post
15° MTBI MTBI Not modeled
Rub-rail 15° Rub-rail 30° MTBI DAI DAI Rub-rail 45° MTBI DAI SBI Not modeled
NOTE: Blank cell indicates no injury unless stated otherwise. TABLE 2 Cervical Spine Injuries Simulated with THUMS in the Head-Leading Orientation
Impact Angle
20 km/h 40 km/h 60 km/h 80 km/h 100 km/h
Unprotected post
15° 3 fx 4 fx Not modeled
Rub-rail 15° Rub-rail 30° 2 fx Rub-rail 45° 1 fx 6 fx Not modeled
NOTE: Blank cell indicates no injury unless stated otherwise.
The results of the collisions in the chest-leading orientation are summarized in Figure 3. Thoracic injury was assessed using the normalized chest compression, being the maximum rib deflection divided by the original width of the chest. Values of 0.383 and 0.496 were used to indicate threshold values between moderate (AIS 1,2), serious (AIS 3,4) and critical (AIS 5+) injury. Serious thoracic injuries were found to occur at around 30 km/h for unprotected W-beam posts, and were found to not occur for rub-rail impacts at all angles and speeds. CONCLUSIONS Collisions with unprotected W-beam posts present a severe injury potential for a sliding motorcyclist, even at relatively low speeds. The Australian rub-rail device successfully redirected the motorcyclist and prevented a post impact, thereby greatly reducing the injury potential. This study found that the rub-rail will likely prevent serious thoracic injury at all practical impact angles and speeds, and will likely prevent serious head–neck injury at low-impact angles and higher-impact angles at low speeds. However, the potential for severe head–neck injury exists at high angles and high speeds.
While European crash tests with ATDs have demonstrated that rub-rails prevent serious injury for head-leading sliding collisions at 30° and 60 km/h, this study compliments these results, and demonstrates the substantial injury reduction potential of rub-rail devices for a wide range of other collision orientations observed in the field.
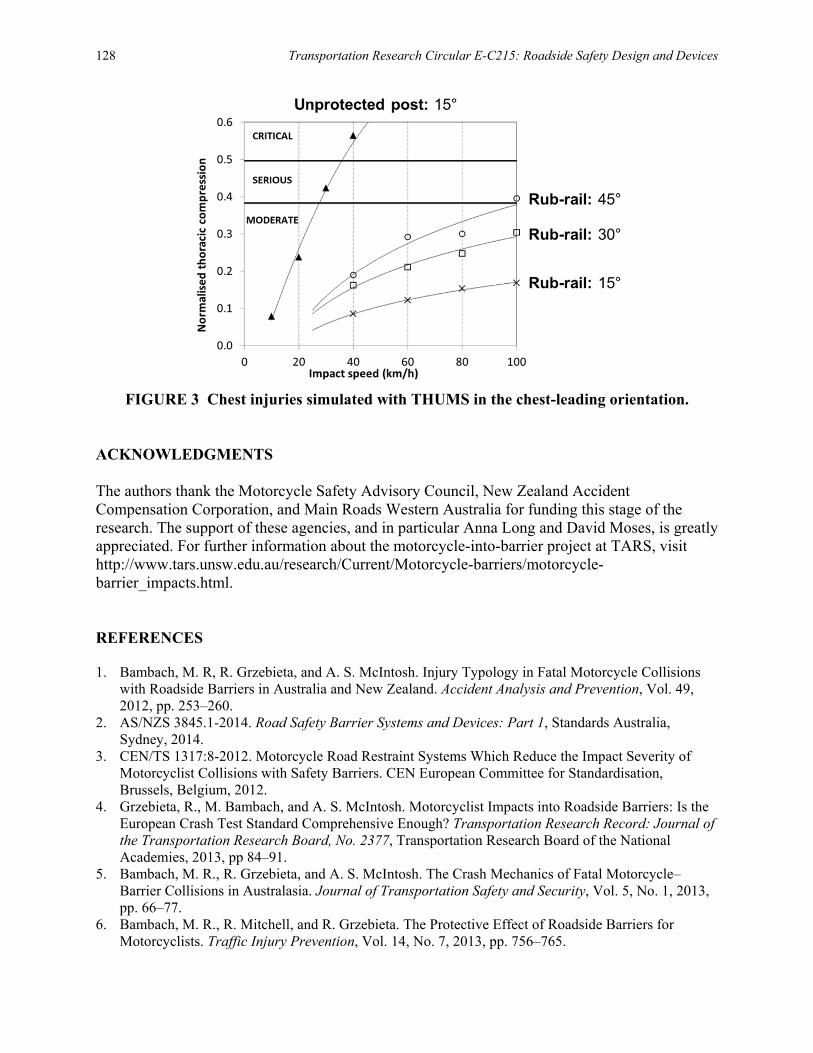
128 Transportation Research Circular E-C215: Roadside Safety Design and Devices
FIGURE 3 Chest injuries simulated with THUMS in the chest-leading orientation. ACKNOWLEDGMENTS The authors thank the Motorcycle Safety Advisory Council, New Zealand Accident Compensation Corporation, and Main Roads Western Australia for funding this stage of the research. The support of these agencies, and in particular Anna Long and David Moses, is greatly appreciated. For further information about the motorcycle-into-barrier project at TARS, visit http://www.tars.unsw.edu.au/research/Current/Motorcycle-barriers/motorcycle-barrier_impacts.html. REFERENCES 1. Bambach, M. R, R. Grzebieta, and A. S. McIntosh. Injury Typology in Fatal Motorcycle Collisions
with Roadside Barriers in Australia and New Zealand. Accident Analysis and Prevention, Vol. 49, 2012, pp. 253–260.
2. AS/NZS 3845.1-2014. Road Safety Barrier Systems and Devices: Part 1, Standards Australia, Sydney, 2014.
3. CEN/TS 1317:8-2012. Motorcycle Road Restraint Systems Which Reduce the Impact Severity of Motorcyclist Collisions with Safety Barriers. CEN European Committee for Standardisation, Brussels, Belgium, 2012.
4. Grzebieta, R., M. Bambach, and A. S. McIntosh. Motorcyclist Impacts into Roadside Barriers: Is the European Crash Test Standard Comprehensive Enough? Transportation Research Record: Journal of the Transportation Research Board, No. 2377, Transportation Research Board of the National Academies, 2013, pp 84–91.
5. Bambach, M. R., R. Grzebieta, and A. S. McIntosh. The Crash Mechanics of Fatal Motorcycle–Barrier Collisions in Australasia. Journal of Transportation Safety and Security, Vol. 5, No. 1, 2013, pp. 66–77.
6. Bambach, M. R., R. Mitchell, and R. Grzebieta. The Protective Effect of Roadside Barriers for Motorcyclists. Traffic Injury Prevention, Vol. 14, No. 7, 2013, pp. 756–765.

Bambach and Grzebieta 129
7. Bambach, M. R., and R. Grzebieta. Human Body Modelling of Motorcyclist Impacts with Guardrail Posts. Journal of the Australasian College of Road Safety, Vol. 24, No. 4, 2013, pp. 20–28.
8. Iwamoto, M., Y. Kisanuki, I. Watanabe, K. Furusu, K. Miki, and J. Hasegawa. Development of a Finite Element Model of the Total Human Model for Safety and Application to Injury Reconstruction. Proc., International Conference on the Biomechanics of Impacts, 2002, pp. 31–42.
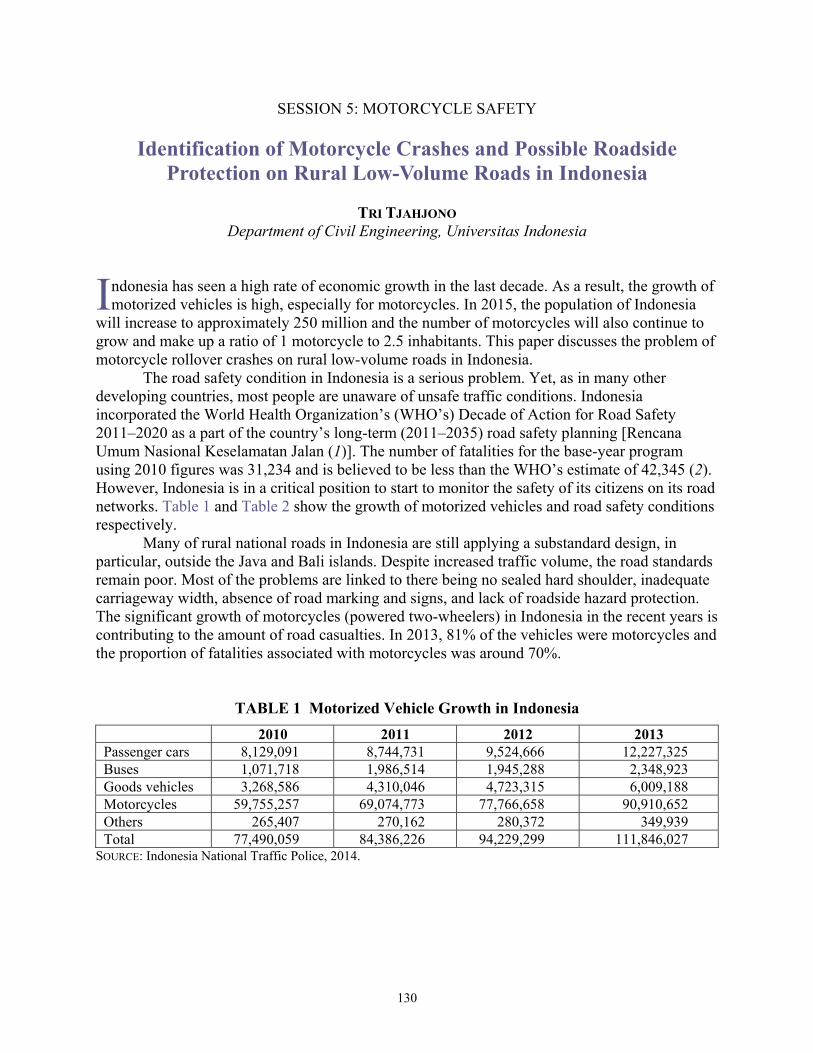
130
SESSION 5: MOTORCYCLE SAFETY
Identification of Motorcycle Crashes and Possible Roadside Protection on Rural Low-Volume Roads in Indonesia
TRI TJAHJONO
Department of Civil Engineering, Universitas Indonesia
ndonesia has seen a high rate of economic growth in the last decade. As a result, the growth of motorized vehicles is high, especially for motorcycles. In 2015, the population of Indonesia
will increase to approximately 250 million and the number of motorcycles will also continue to grow and make up a ratio of 1 motorcycle to 2.5 inhabitants. This paper discusses the problem of motorcycle rollover crashes on rural low-volume roads in Indonesia.
The road safety condition in Indonesia is a serious problem. Yet, as in many other developing countries, most people are unaware of unsafe traffic conditions. Indonesia incorporated the World Health Organization’s (WHO’s) Decade of Action for Road Safety 2011–2020 as a part of the country’s long-term (2011–2035) road safety planning [Rencana Umum Nasional Keselamatan Jalan (1)]. The number of fatalities for the base-year program using 2010 figures was 31,234 and is believed to be less than the WHO’s estimate of 42,345 (2). However, Indonesia is in a critical position to start to monitor the safety of its citizens on its road networks. Table 1 and Table 2 show the growth of motorized vehicles and road safety conditions respectively.
Many of rural national roads in Indonesia are still applying a substandard design, in particular, outside the Java and Bali islands. Despite increased traffic volume, the road standards remain poor. Most of the problems are linked to there being no sealed hard shoulder, inadequate carriageway width, absence of road marking and signs, and lack of roadside hazard protection. The significant growth of motorcycles (powered two-wheelers) in Indonesia in the recent years is contributing to the amount of road casualties. In 2013, 81% of the vehicles were motorcycles and the proportion of fatalities associated with motorcycles was around 70%.
TABLE 1 Motorized Vehicle Growth in Indonesia 2010 2011 2012 2013 Passenger cars 8,129,091 8,744,731 9,524,666 12,227,325 Buses 1,071,718 1,986,514 1,945,288 2,348,923 Goods vehicles 3,268,586 4,310,046 4,723,315 6,009,188 Motorcycles 59,755,257 69,074,773 77,766,658 90,910,652 Others 265,407 270,162 280,372 349,939 Total 77,490,059 84,386,226 94,229,299 111,846,027
SOURCE: Indonesia National Traffic Police, 2014.
I
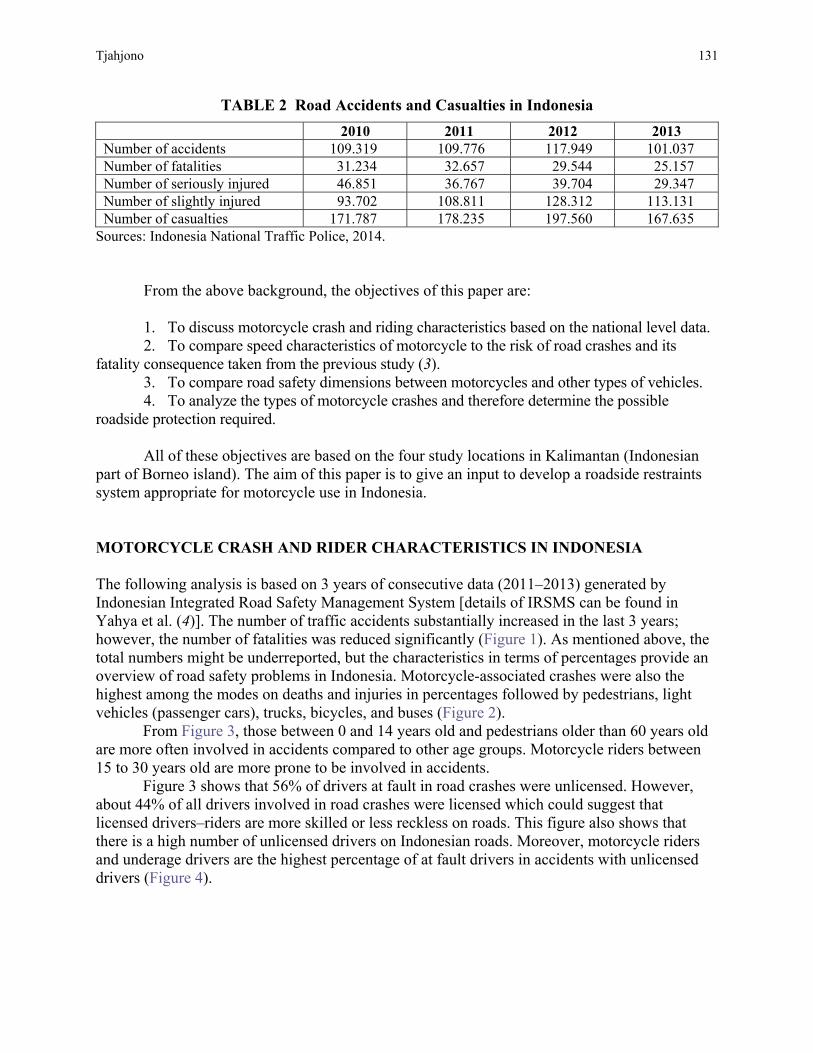
Tjahjono 131
TABLE 2 Road Accidents and Casualties in Indonesia 2010 2011 2012 2013 Number of accidents 109.319 109.776 117.949 101.037 Number of fatalities 31.234 32.657 29.544 25.157 Number of seriously injured 46.851 36.767 39.704 29.347 Number of slightly injured 93.702 108.811 128.312 113.131 Number of casualties 171.787 178.235 197.560 167.635
Sources: Indonesia National Traffic Police, 2014.
From the above background, the objectives of this paper are:
1. To discuss motorcycle crash and riding characteristics based on the national level data. 2. To compare speed characteristics of motorcycle to the risk of road crashes and its
fatality consequence taken from the previous study (3). 3. To compare road safety dimensions between motorcycles and other types of vehicles. 4. To analyze the types of motorcycle crashes and therefore determine the possible
roadside protection required.
All of these objectives are based on the four study locations in Kalimantan (Indonesian part of Borneo island). The aim of this paper is to give an input to develop a roadside restraints system appropriate for motorcycle use in Indonesia. MOTORCYCLE CRASH AND RIDER CHARACTERISTICS IN INDONESIA The following analysis is based on 3 years of consecutive data (2011–2013) generated by Indonesian Integrated Road Safety Management System [details of IRSMS can be found in Yahya et al. (4)]. The number of traffic accidents substantially increased in the last 3 years; however, the number of fatalities was reduced significantly (Figure 1). As mentioned above, the total numbers might be underreported, but the characteristics in terms of percentages provide an overview of road safety problems in Indonesia. Motorcycle-associated crashes were also the highest among the modes on deaths and injuries in percentages followed by pedestrians, light vehicles (passenger cars), trucks, bicycles, and buses (Figure 2).
From Figure 3, those between 0 and 14 years old and pedestrians older than 60 years old are more often involved in accidents compared to other age groups. Motorcycle riders between 15 to 30 years old are more prone to be involved in accidents.
Figure 3 shows that 56% of drivers at fault in road crashes were unlicensed. However, about 44% of all drivers involved in road crashes were licensed which could suggest that licensed drivers–riders are more skilled or less reckless on roads. This figure also shows that there is a high number of unlicensed drivers on Indonesian roads. Moreover, motorcycle riders and underage drivers are the highest percentage of at fault drivers in accidents with unlicensed drivers (Figure 4).
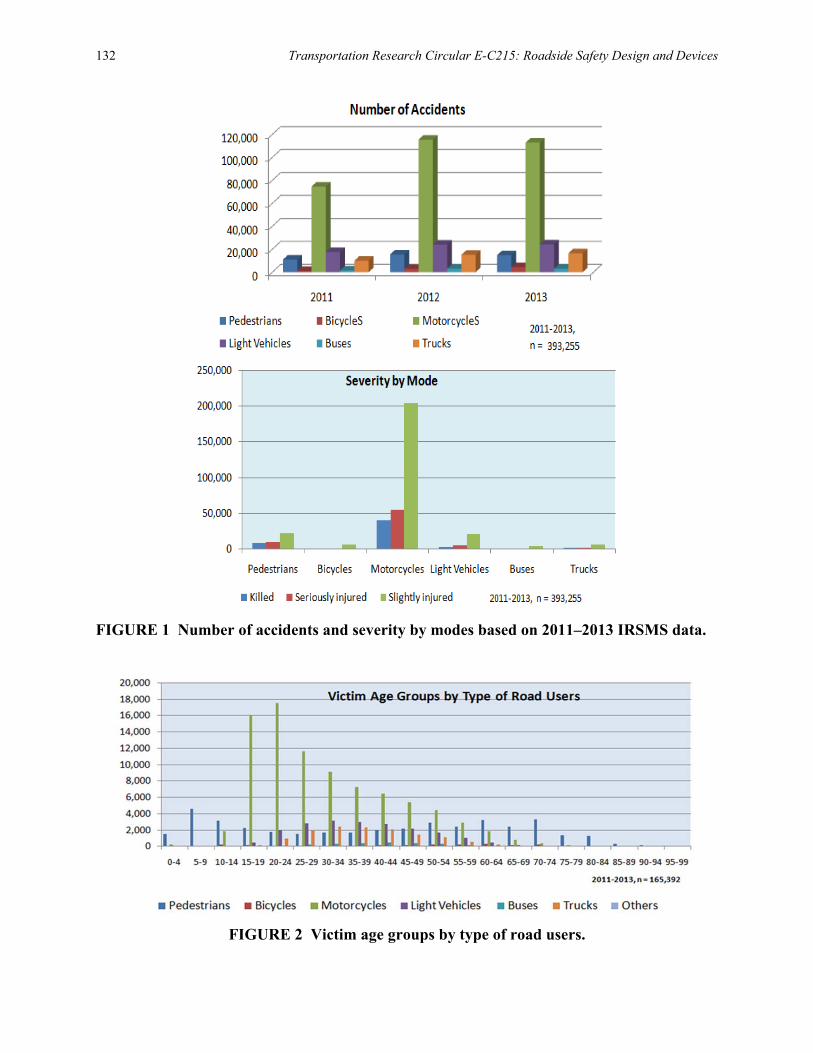
132 Transportation Research Circular E-C215: Roadside Safety Design and Devices
FIGURE 1 Number of accidents and severity by modes based on 2011–2013 IRSMS data.
FIGURE 2 Victim age groups by type of road users.
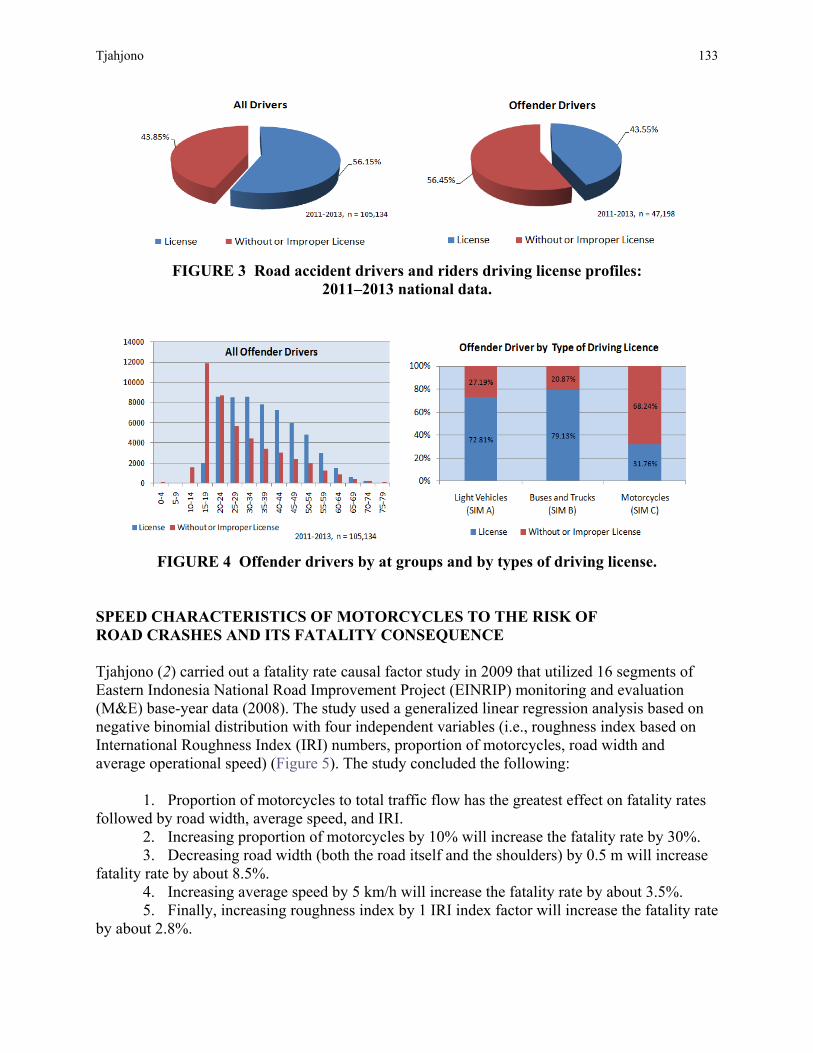
Tjahjono 133
FIGURE 3 Road accident drivers and riders driving license profiles: 2011–2013 national data.
FIGURE 4 Offender drivers by at groups and by types of driving license. SPEED CHARACTERISTICS OF MOTORCYCLES TO THE RISK OF ROAD CRASHES AND ITS FATALITY CONSEQUENCE Tjahjono (2) carried out a fatality rate causal factor study in 2009 that utilized 16 segments of Eastern Indonesia National Road Improvement Project (EINRIP) monitoring and evaluation (M&E) base-year data (2008). The study used a generalized linear regression analysis based on negative binomial distribution with four independent variables (i.e., roughness index based on International Roughness Index (IRI) numbers, proportion of motorcycles, road width and average operational speed) (Figure 5). The study concluded the following:
1. Proportion of motorcycles to total traffic flow has the greatest effect on fatality rates followed by road width, average speed, and IRI.
2. Increasing proportion of motorcycles by 10% will increase the fatality rate by 30%. 3. Decreasing road width (both the road itself and the shoulders) by 0.5 m will increase
fatality rate by about 8.5%. 4. Increasing average speed by 5 km/h will increase the fatality rate by about 3.5%. 5. Finally, increasing roughness index by 1 IRI index factor will increase the fatality rate
by about 2.8%.
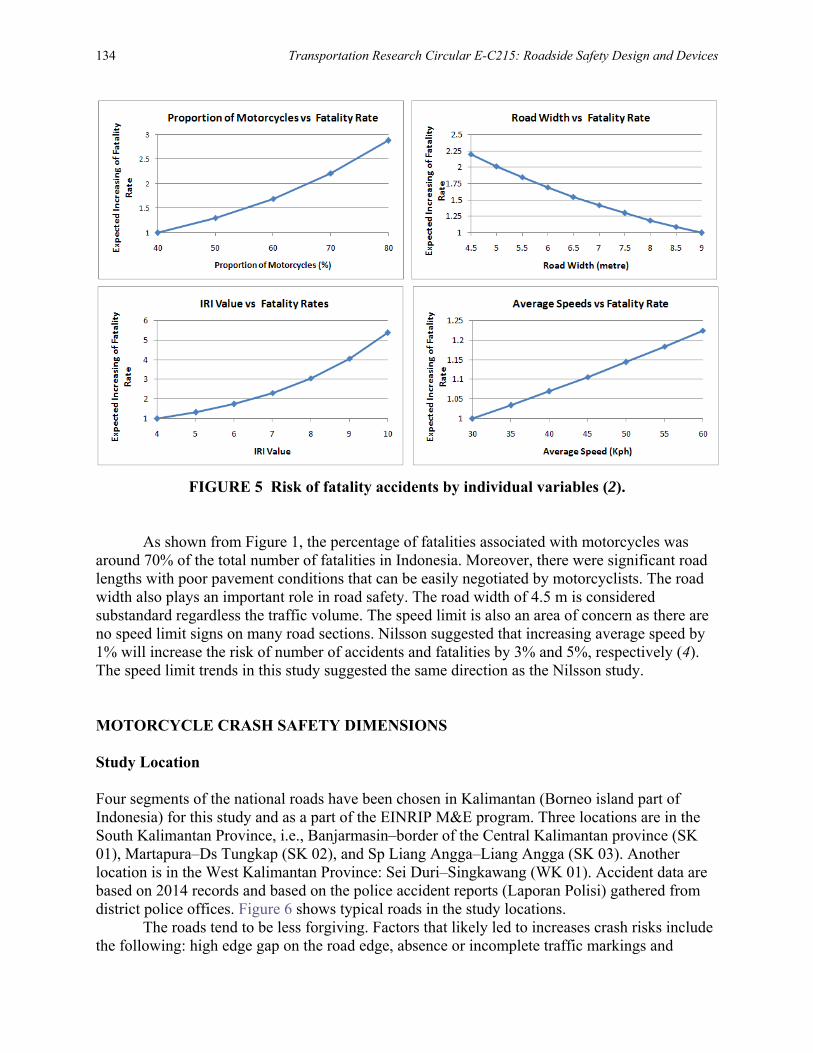
134 Transportation Research Circular E-C215: Roadside Safety Design and Devices
FIGURE 5 Risk of fatality accidents by individual variables (2).
As shown from Figure 1, the percentage of fatalities associated with motorcycles was around 70% of the total number of fatalities in Indonesia. Moreover, there were significant road lengths with poor pavement conditions that can be easily negotiated by motorcyclists. The road width also plays an important role in road safety. The road width of 4.5 m is considered substandard regardless the traffic volume. The speed limit is also an area of concern as there are no speed limit signs on many road sections. Nilsson suggested that increasing average speed by 1% will increase the risk of number of accidents and fatalities by 3% and 5%, respectively (4). The speed limit trends in this study suggested the same direction as the Nilsson study. MOTORCYCLE CRASH SAFETY DIMENSIONS Study Location Four segments of the national roads have been chosen in Kalimantan (Borneo island part of Indonesia) for this study and as a part of the EINRIP M&E program. Three locations are in the South Kalimantan Province, i.e., Banjarmasin–border of the Central Kalimantan province (SK 01), Martapura–Ds Tungkap (SK 02), and Sp Liang Angga–Liang Angga (SK 03). Another location is in the West Kalimantan Province: Sei Duri–Singkawang (WK 01). Accident data are based on 2014 records and based on the police accident reports (Laporan Polisi) gathered from district police offices. Figure 6 shows typical roads in the study locations.
The roads tend to be less forgiving. Factors that likely led to increases crash risks include the following: high edge gap on the road edge, absence or incomplete traffic markings and
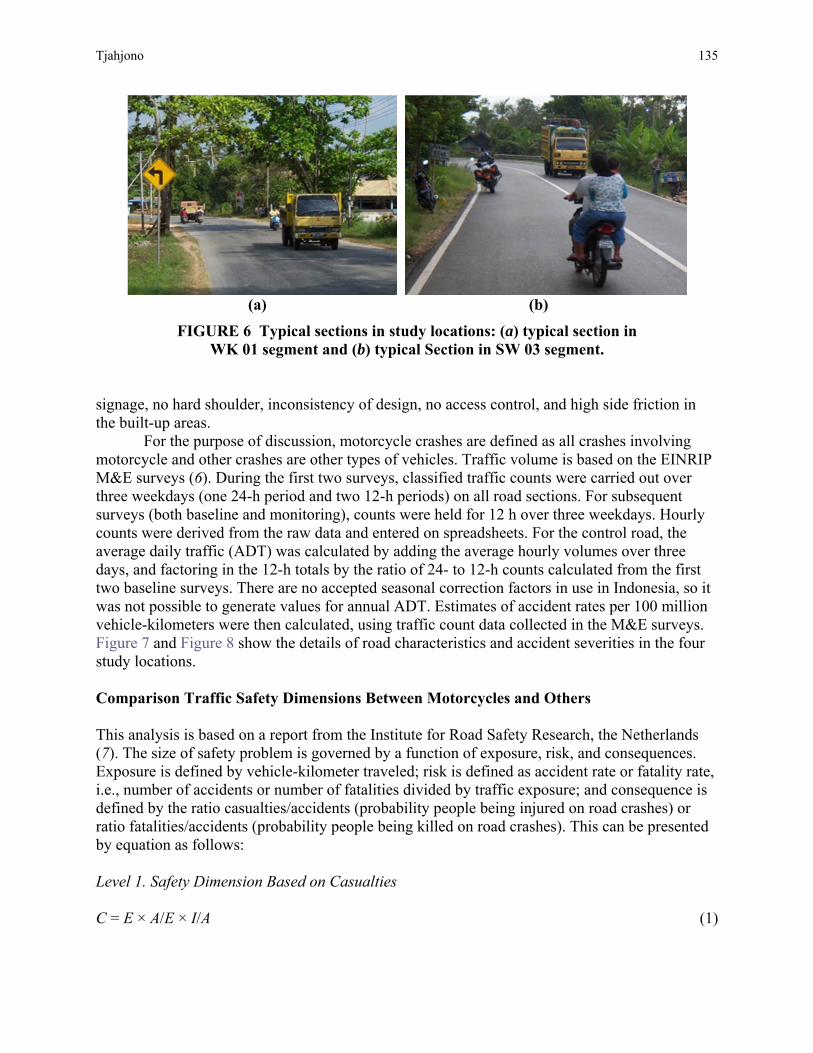
Tjahjono 135
(a) (b)
FIGURE 6 Typical sections in study locations: (a) typical section in WK 01 segment and (b) typical Section in SW 03 segment.
signage, no hard shoulder, inconsistency of design, no access control, and high side friction in the built-up areas.
For the purpose of discussion, motorcycle crashes are defined as all crashes involving motorcycle and other crashes are other types of vehicles. Traffic volume is based on the EINRIP M&E surveys (6). During the first two surveys, classified traffic counts were carried out over three weekdays (one 24-h period and two 12-h periods) on all road sections. For subsequent surveys (both baseline and monitoring), counts were held for 12 h over three weekdays. Hourly counts were derived from the raw data and entered on spreadsheets. For the control road, the average daily traffic (ADT) was calculated by adding the average hourly volumes over three days, and factoring in the 12-h totals by the ratio of 24- to 12-h counts calculated from the first two baseline surveys. There are no accepted seasonal correction factors in use in Indonesia, so it was not possible to generate values for annual ADT. Estimates of accident rates per 100 million vehicle-kilometers were then calculated, using traffic count data collected in the M&E surveys. Figure 7 and Figure 8 show the details of road characteristics and accident severities in the four study locations. Comparison Traffic Safety Dimensions Between Motorcycles and Others This analysis is based on a report from the Institute for Road Safety Research, the Netherlands (7). The size of safety problem is governed by a function of exposure, risk, and consequences. Exposure is defined by vehicle-kilometer traveled; risk is defined as accident rate or fatality rate, i.e., number of accidents or number of fatalities divided by traffic exposure; and consequence is defined by the ratio casualties/accidents (probability people being injured on road crashes) or ratio fatalities/accidents (probability people being killed on road crashes). This can be presented by equation as follows: Level 1. Safety Dimension Based on Casualties C = E × A/E × I/A (1)
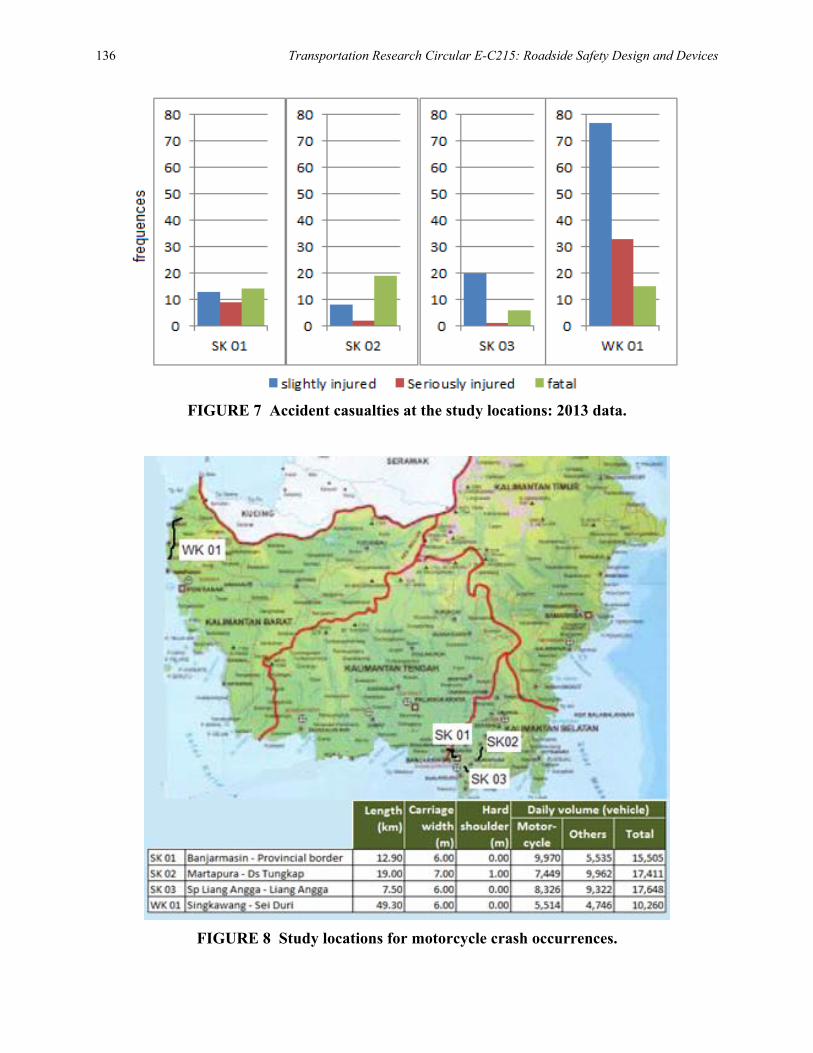
136 Transportation Research Circular E-C215: Roadside Safety Design and Devices
FIGURE 7 Accident casualties at the study locations: 2013 data.
FIGURE 8 Study locations for motorcycle crash occurrences.
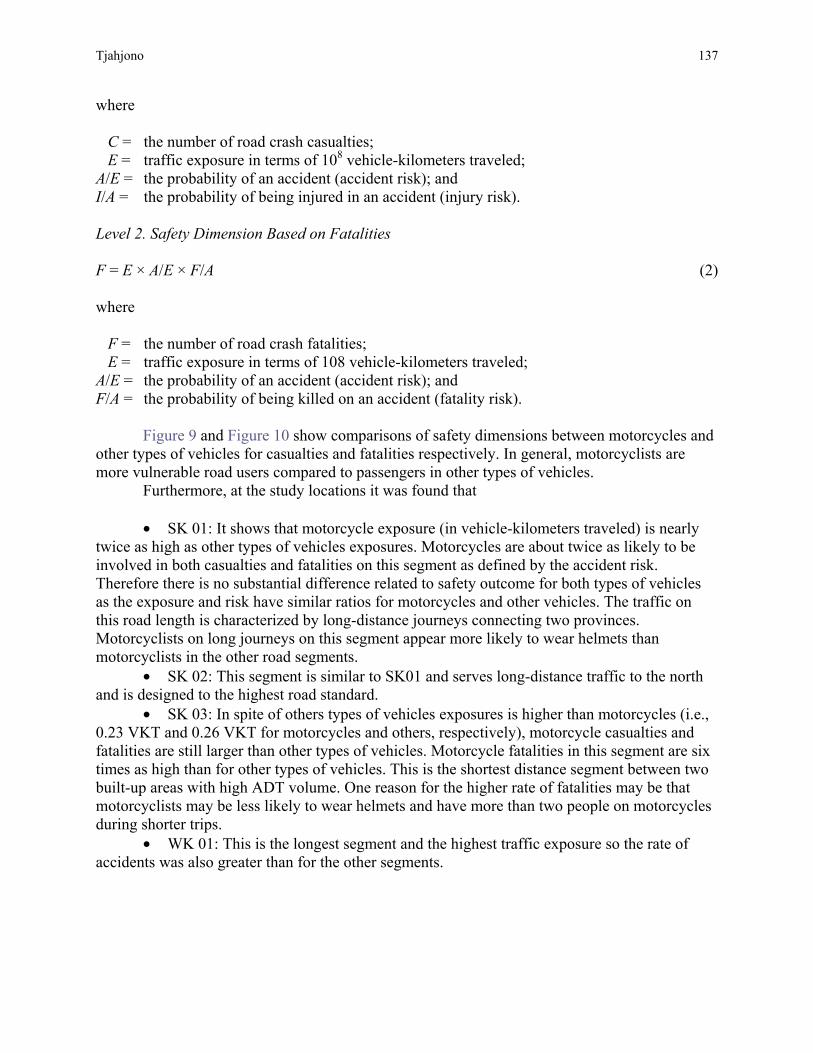
Tjahjono 137
where
C = the number of road crash casualties; E = traffic exposure in terms of 108 vehicle-kilometers traveled;
A/E = the probability of an accident (accident risk); and I/A = the probability of being injured in an accident (injury risk). Level 2. Safety Dimension Based on Fatalities F = E × A/E × F/A (2) where
F = the number of road crash fatalities; E = traffic exposure in terms of 108 vehicle-kilometers traveled;
A/E = the probability of an accident (accident risk); and F/A = the probability of being killed on an accident (fatality risk).
Figure 9 and Figure 10 show comparisons of safety dimensions between motorcycles and other types of vehicles for casualties and fatalities respectively. In general, motorcyclists are more vulnerable road users compared to passengers in other types of vehicles.
Furthermore, at the study locations it was found that
• SK 01: It shows that motorcycle exposure (in vehicle-kilometers traveled) is nearly twice as high as other types of vehicles exposures. Motorcycles are about twice as likely to be involved in both casualties and fatalities on this segment as defined by the accident risk. Therefore there is no substantial difference related to safety outcome for both types of vehicles as the exposure and risk have similar ratios for motorcycles and other vehicles. The traffic on this road length is characterized by long-distance journeys connecting two provinces. Motorcyclists on long journeys on this segment appear more likely to wear helmets than motorcyclists in the other road segments.
• SK 02: This segment is similar to SK01 and serves long-distance traffic to the north and is designed to the highest road standard.
• SK 03: In spite of others types of vehicles exposures is higher than motorcycles (i.e., 0.23 VKT and 0.26 VKT for motorcycles and others, respectively), motorcycle casualties and fatalities are still larger than other types of vehicles. Motorcycle fatalities in this segment are six times as high than for other types of vehicles. This is the shortest distance segment between two built-up areas with high ADT volume. One reason for the higher rate of fatalities may be that motorcyclists may be less likely to wear helmets and have more than two people on motorcycles during shorter trips.
• WK 01: This is the longest segment and the highest traffic exposure so the rate of accidents was also greater than for the other segments.
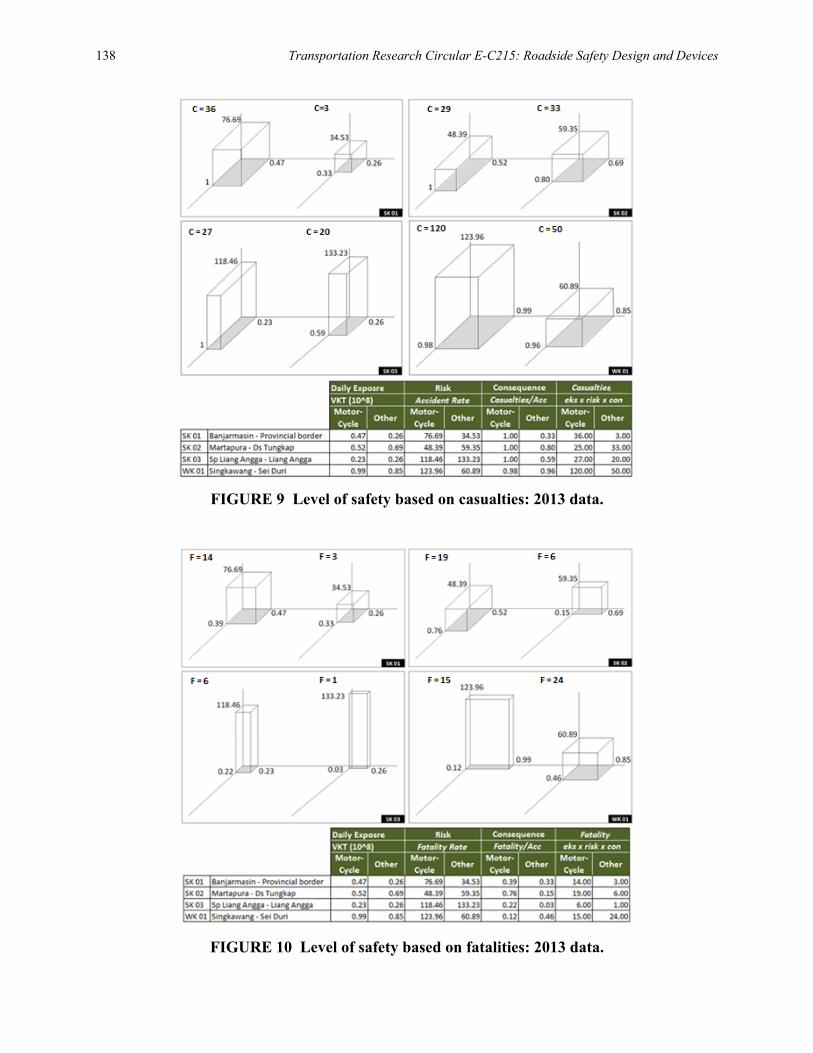
138 Transportation Research Circular E-C215: Roadside Safety Design and Devices
FIGURE 9 Level of safety based on casualties: 2013 data.
FIGURE 10 Level of safety based on fatalities: 2013 data.
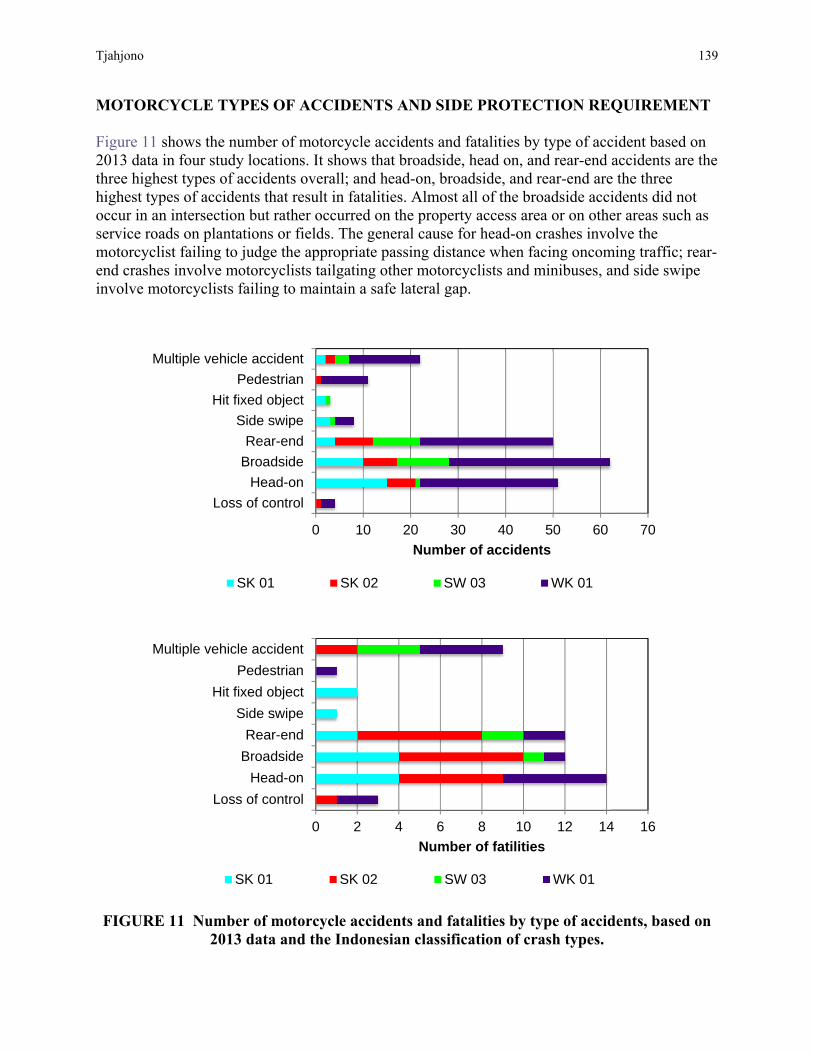
Tjahjono 139
MOTORCYCLE TYPES OF ACCIDENTS AND SIDE PROTECTION REQUIREMENT Figure 11 shows the number of motorcycle accidents and fatalities by type of accident based on 2013 data in four study locations. It shows that broadside, head on, and rear-end accidents are the three highest types of accidents overall; and head-on, broadside, and rear-end are the three highest types of accidents that result in fatalities. Almost all of the broadside accidents did not occur in an intersection but rather occurred on the property access area or on other areas such as service roads on plantations or fields. The general cause for head-on crashes involve the motorcyclist failing to judge the appropriate passing distance when facing oncoming traffic; rear-end crashes involve motorcyclists tailgating other motorcyclists and minibuses, and side swipe involve motorcyclists failing to maintain a safe lateral gap.
FIGURE 11 Number of motorcycle accidents and fatalities by type of accidents, based on 2013 data and the Indonesian classification of crash types.
0 10 20 30 40 50 60 70
Loss of controlHead-on
BroadsideRear-end
Side swipeHit fixed object
PedestrianMultiple vehicle accident
Number of accidents
SK 01 SK 02 SW 03 WK 01
0 2 4 6 8 10 12 14 16
Loss of controlHead-on
BroadsideRear-end
Side swipeHit fixed object
PedestrianMultiple vehicle accident
Number of fatilities
SK 01 SK 02 SW 03 WK 01
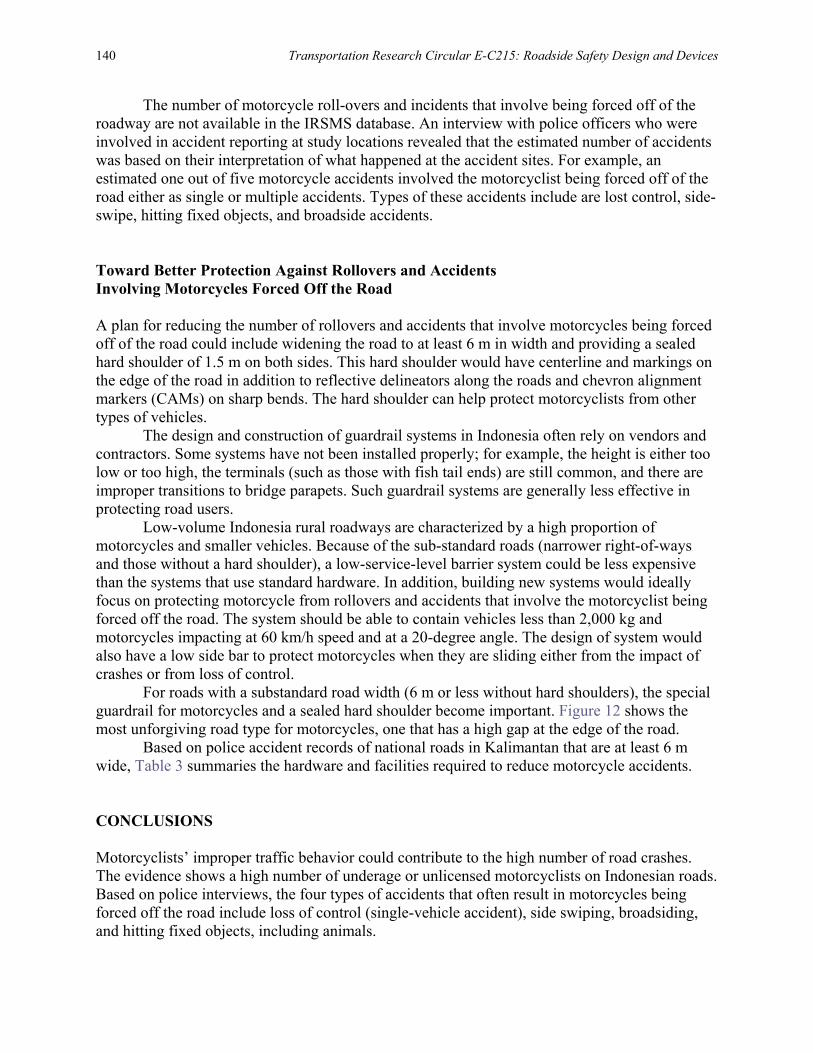
140 Transportation Research Circular E-C215: Roadside Safety Design and Devices
The number of motorcycle roll-overs and incidents that involve being forced off of the roadway are not available in the IRSMS database. An interview with police officers who were involved in accident reporting at study locations revealed that the estimated number of accidents was based on their interpretation of what happened at the accident sites. For example, an estimated one out of five motorcycle accidents involved the motorcyclist being forced off of the road either as single or multiple accidents. Types of these accidents include are lost control, side-swipe, hitting fixed objects, and broadside accidents. Toward Better Protection Against Rollovers and Accidents Involving Motorcycles Forced Off the Road A plan for reducing the number of rollovers and accidents that involve motorcycles being forced off of the road could include widening the road to at least 6 m in width and providing a sealed hard shoulder of 1.5 m on both sides. This hard shoulder would have centerline and markings on the edge of the road in addition to reflective delineators along the roads and chevron alignment markers (CAMs) on sharp bends. The hard shoulder can help protect motorcyclists from other types of vehicles.
The design and construction of guardrail systems in Indonesia often rely on vendors and contractors. Some systems have not been installed properly; for example, the height is either too low or too high, the terminals (such as those with fish tail ends) are still common, and there are improper transitions to bridge parapets. Such guardrail systems are generally less effective in protecting road users.
Low-volume Indonesia rural roadways are characterized by a high proportion of motorcycles and smaller vehicles. Because of the sub-standard roads (narrower right-of-ways and those without a hard shoulder), a low-service-level barrier system could be less expensive than the systems that use standard hardware. In addition, building new systems would ideally focus on protecting motorcycle from rollovers and accidents that involve the motorcyclist being forced off the road. The system should be able to contain vehicles less than 2,000 kg and motorcycles impacting at 60 km/h speed and at a 20-degree angle. The design of system would also have a low side bar to protect motorcycles when they are sliding either from the impact of crashes or from loss of control.
For roads with a substandard road width (6 m or less without hard shoulders), the special guardrail for motorcycles and a sealed hard shoulder become important. Figure 12 shows the most unforgiving road type for motorcycles, one that has a high gap at the edge of the road.
Based on police accident records of national roads in Kalimantan that are at least 6 m wide, Table 3 summaries the hardware and facilities required to reduce motorcycle accidents. CONCLUSIONS Motorcyclists’ improper traffic behavior could contribute to the high number of road crashes. The evidence shows a high number of underage or unlicensed motorcyclists on Indonesian roads. Based on police interviews, the four types of accidents that often result in motorcycles being forced off the road include loss of control (single-vehicle accident), side swiping, broadsiding, and hitting fixed objects, including animals.
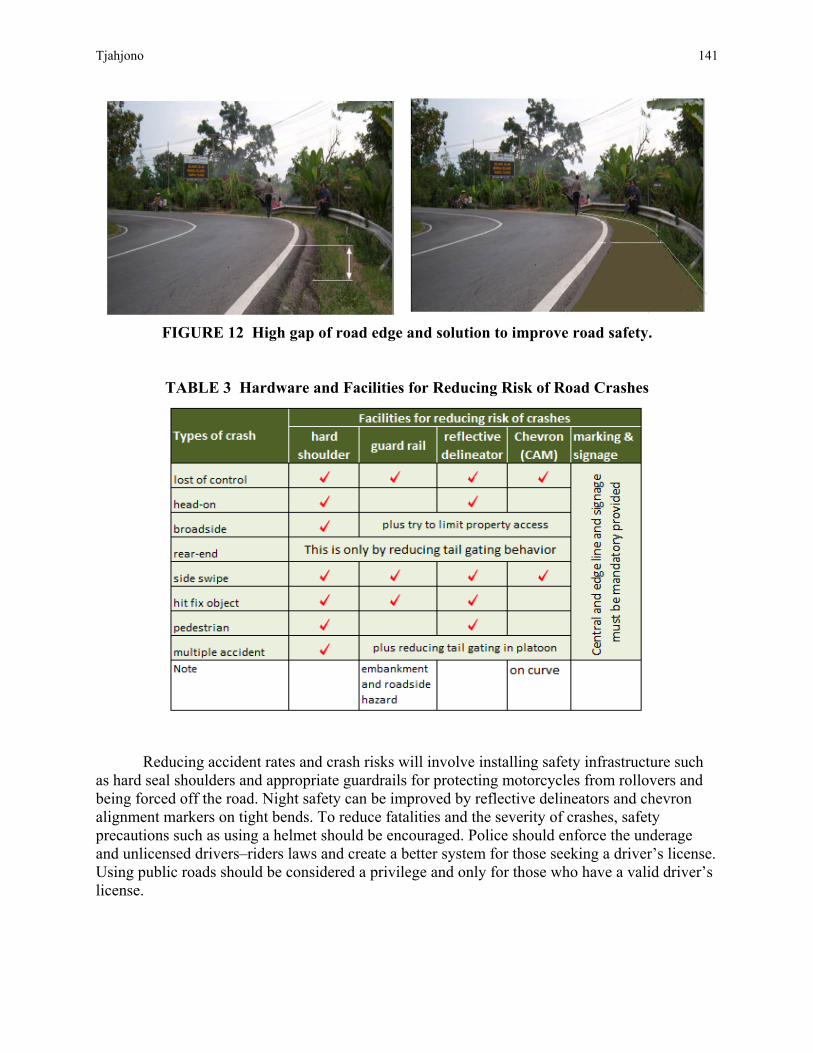
Tjahjono 141
FIGURE 12 High gap of road edge and solution to improve road safety.
TABLE 3 Hardware and Facilities for Reducing Risk of Road Crashes
Reducing accident rates and crash risks will involve installing safety infrastructure such as hard seal shoulders and appropriate guardrails for protecting motorcycles from rollovers and being forced off the road. Night safety can be improved by reflective delineators and chevron alignment markers on tight bends. To reduce fatalities and the severity of crashes, safety precautions such as using a helmet should be encouraged. Police should enforce the underage and unlicensed drivers–riders laws and create a better system for those seeking a driver’s license. Using public roads should be considered a privilege and only for those who have a valid driver’s license.
142 Transportation Research Circular E-C215: Roadside Safety Design and Devices
ACKNOWLEDGMENTS Some of the data in this paper was obtained from EINRIP Monitoring and Evaluation Program conducted annually by the EINRIP PMU funded by AusAID-DFAT. The author acknowledges the EINRIP PMU office particularly to Graham Gleave and Indonesia National Traffic Police for data gathering and local traffic police in both West Kalimantan and South Kalimantan Provinces. REFERENCES 1. Prihartono, B., E. Howard, and T. Tjahjono. Road Safety Policies in Indonesia—The Decade of
Action for Road Safety 2011–2020. Proc., 1st IRF Asia Regional Congress, Bali, Indonesia, 2014. 2. World Health Organization. Global Status Report on Road Safety 2013—Supporting a Decade of
Action, Geneva, Switzerland, 2013. 3. Tjahjono, T. The Effect of Traffic and Road Condition to the Fatality Rates on Rural Roads in Eastern
Indonesia. Journal of Eastern Asia Society for Transportation Studies, Vol. 8, 2009. 4. Yahya, M. N., I. J. Faulks, P. Hambleton, and C. Wass. Development of an Integrated Road Safety
Management System in Indonesia. Journal the Australasian College of Road Safety, Vol. 24, No. 2, 2013, pp. 28–38.
5. Nilsson, G. Traffic Safety Dimensions and the Power Model to Describe the Effect of Speed on Safety. Bulletin 221, Lund University, Sweden, 2004.
6. EINRIP. Second Monitoring Report, Final, EINRIP Monitoring and Evaluation Programme, December 2013 (unpublished).
7. Hakkert, A. S., and L. Braimaster. The Uses of Exposure and Risk in Road Safety Studies. SWOV Report R-2002-12, Institute for Road Safety Research, Netherlands, 2002.
143
SESSION 5: MOTORCYCLE SAFETY
Making Roads Motorcycle Friendly A New Zealand Perspective
JULIAN CHISNALL
New Zealand Transport Agency
FRANCES BROATCH Motorcycle Safety Advisory Council
eaths and injuries for motorcyclists on New Zealand roads are an issue that is too large to simply ignore. For the period 2009 to 2014, on average, 320 people (drivers and riders) lost
their lives on New Zealand roads and more than 13,000 sustained injuries. Of those, motorcyclists comprised 14% of deaths (44) and 9% of injuries (1,200). The number of deaths cannot be written off as statistical noise—action is required. SAFER JOURNEYS In May 2011, New Zealand signed up to meet the United Nations Decade of Action for Road Safety initiative, which is a worldwide effort to save 5 million lives over the 10-year period from 2011 to 2020. As part of its commitment, the Ministry of Transport (MOT) released their initial Safer Journeys strategy document, including the adoption of a Safe System approach to improving the safety of New Zealand roads.
Safer Journeys acknowledged the risks associated with travel on the New Zealand road network and encouraged the sector to undertake improvements.
In support of the Safer Journeys’ strategy, the MOT released its Safer Journeys 2011–2012 Action Plan, which reinforced the desired behaviors for the improvement of road safety and specifically identified motorcycling in New Zealand as an area for improvement. The action plan for 2013 to 2015 continued the specific support for safety performance improvements for motorcyclists. Initial discussions are under way for development of the next action plan with increased focus on motorcycle safety to further reduce fatalities and serious injuries on the New Zealand network. THE GUIDES As part of its actions under the Safer Journeys strategy, the New Zealand Transport Agency has produced three guides. The High Risk Rural Roads Guide and High Risk Intersections Guide deal predominantly with the broader aspects of road safety on the New Zealand road network.
The third document in the series, Safer Journeys for Motorcycling on New Zealand Roads is specifically targeted at the risks faced by motorcyclists using the network (Figure 1). It has been developed to provide road authorities, practitioners and policy makers with best practice
D
144 Transportation Research Circular E-C215: Roadside Safety Design and Devices
FIGURE 1 Cover of Safer Journeys for Motorcycling on New Zealand Roads. advice to help identify, target, and address key road safety issues on high-risk motorcycle routes in New Zealand.
It includes methods to assess and measure personal risk or crash rate (a measure of the number of high-severity crashes, per 100 million vehicle-kilometers of travel on the road) and collective risk or crash density [a measure of the number of high severity (fatal and serious) crashes, per kilometer of road per year].
In addition, it provides a range of countermeasures to assist road designers and engineers in developing appropriate best practice treatments to address road sections that are considered high-risk for motorcyclists.
The guide primarily focuses on safe roads and roadsides. However, acknowledging that this is only one of the four pillars of the Safe System approach, the guide also recognizes that safe speeds, safe vehicles, and safe road use are needed to create a Safe System for motorcyclists. The guide outlines the issues associated with each of these elements and identifies possible treatments to address them. MOTORCYCLE SAFETY ADVISORY COUNCIL While the Safer Journeys for Motorcycling on New Zealand Roads guide provides a tool for risk identification and mitigation, there was also a need to address the investment into infrastructure improvements for motorcyclist safety.
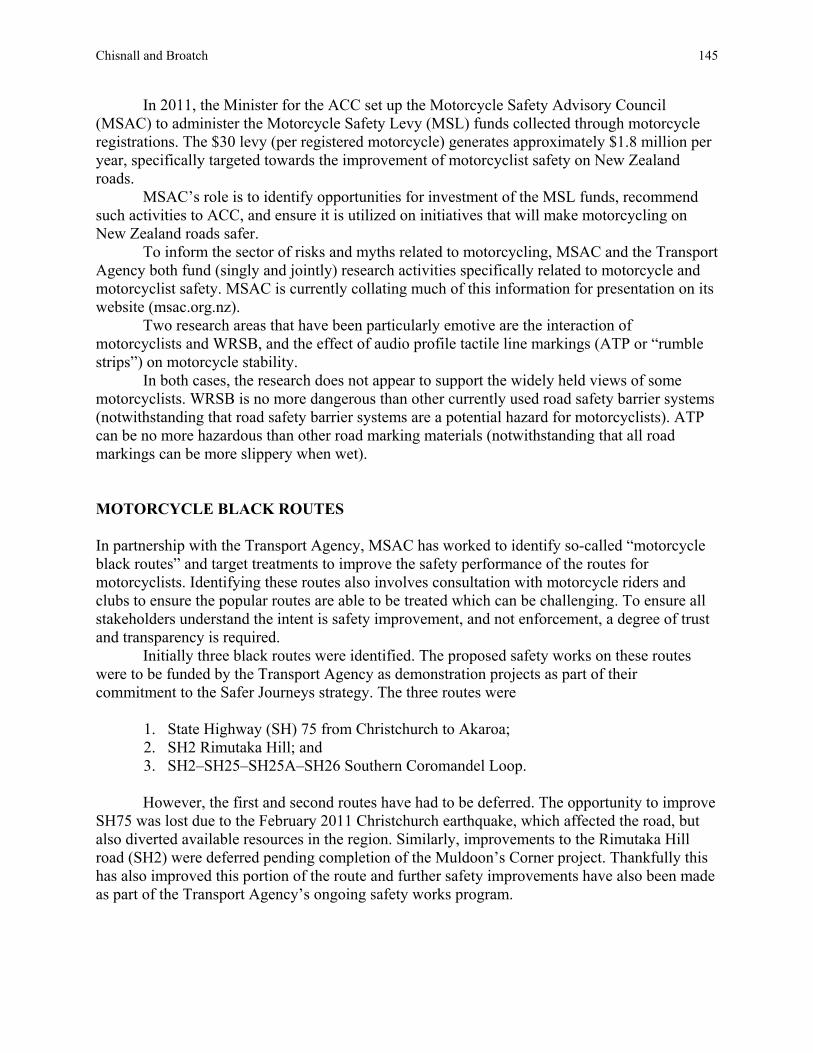
Chisnall and Broatch 145
In 2011, the Minister for the ACC set up the Motorcycle Safety Advisory Council (MSAC) to administer the Motorcycle Safety Levy (MSL) funds collected through motorcycle registrations. The $30 levy (per registered motorcycle) generates approximately $1.8 million per year, specifically targeted towards the improvement of motorcyclist safety on New Zealand roads.
MSAC’s role is to identify opportunities for investment of the MSL funds, recommend such activities to ACC, and ensure it is utilized on initiatives that will make motorcycling on New Zealand roads safer.
To inform the sector of risks and myths related to motorcycling, MSAC and the Transport Agency both fund (singly and jointly) research activities specifically related to motorcycle and motorcyclist safety. MSAC is currently collating much of this information for presentation on its website (msac.org.nz).
Two research areas that have been particularly emotive are the interaction of motorcyclists and WRSB, and the effect of audio profile tactile line markings (ATP or “rumble strips”) on motorcycle stability.
In both cases, the research does not appear to support the widely held views of some motorcyclists. WRSB is no more dangerous than other currently used road safety barrier systems (notwithstanding that road safety barrier systems are a potential hazard for motorcyclists). ATP can be no more hazardous than other road marking materials (notwithstanding that all road markings can be more slippery when wet). MOTORCYCLE BLACK ROUTES In partnership with the Transport Agency, MSAC has worked to identify so-called “motorcycle black routes” and target treatments to improve the safety performance of the routes for motorcyclists. Identifying these routes also involves consultation with motorcycle riders and clubs to ensure the popular routes are able to be treated which can be challenging. To ensure all stakeholders understand the intent is safety improvement, and not enforcement, a degree of trust and transparency is required.
Initially three black routes were identified. The proposed safety works on these routes were to be funded by the Transport Agency as demonstration projects as part of their commitment to the Safer Journeys strategy. The three routes were
1. State Highway (SH) 75 from Christchurch to Akaroa; 2. SH2 Rimutaka Hill; and 3. SH2–SH25–SH25A–SH26 Southern Coromandel Loop.
However, the first and second routes have had to be deferred. The opportunity to improve
SH75 was lost due to the February 2011 Christchurch earthquake, which affected the road, but also diverted available resources in the region. Similarly, improvements to the Rimutaka Hill road (SH2) were deferred pending completion of the Muldoon’s Corner project. Thankfully this has also improved this portion of the route and further safety improvements have also been made as part of the Transport Agency’s ongoing safety works program.
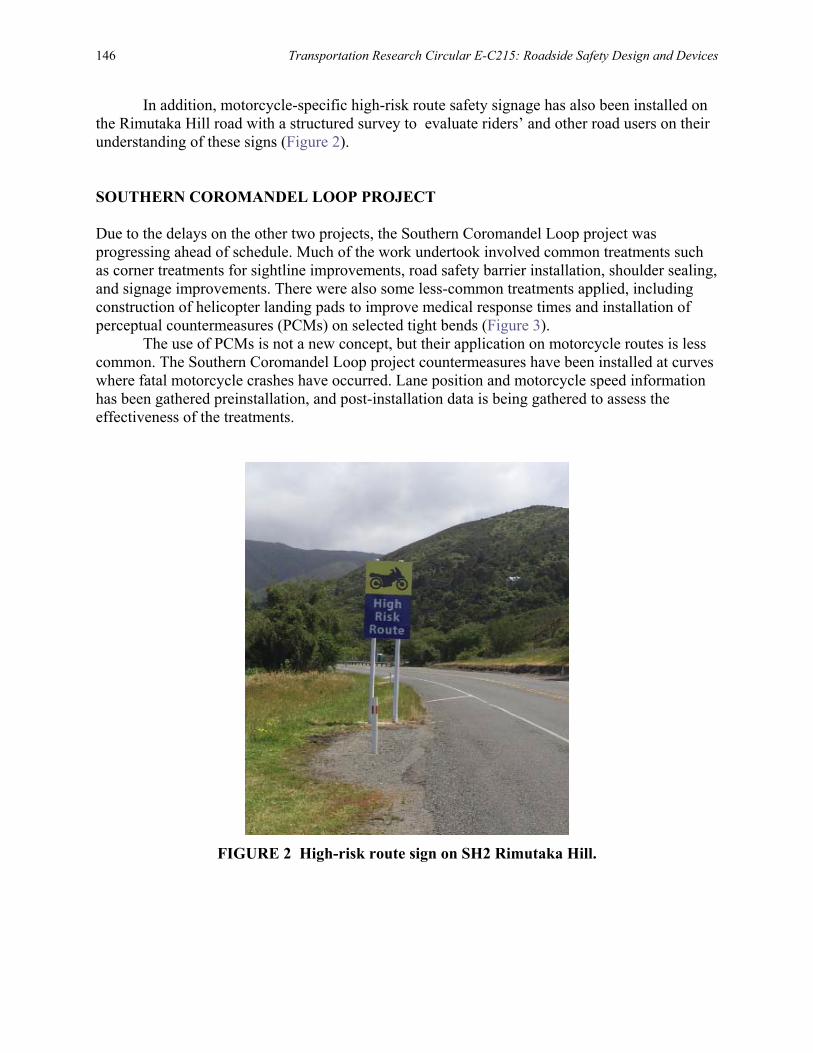
146 Transportation Research Circular E-C215: Roadside Safety Design and Devices
In addition, motorcycle-specific high-risk route safety signage has also been installed on the Rimutaka Hill road with a structured survey to evaluate riders’ and other road users on their understanding of these signs (Figure 2). SOUTHERN COROMANDEL LOOP PROJECT Due to the delays on the other two projects, the Southern Coromandel Loop project was progressing ahead of schedule. Much of the work undertook involved common treatments such as corner treatments for sightline improvements, road safety barrier installation, shoulder sealing, and signage improvements. There were also some less-common treatments applied, including construction of helicopter landing pads to improve medical response times and installation of perceptual countermeasures (PCMs) on selected tight bends (Figure 3).
The use of PCMs is not a new concept, but their application on motorcycle routes is less common. The Southern Coromandel Loop project countermeasures have been installed at curves where fatal motorcycle crashes have occurred. Lane position and motorcycle speed information has been gathered preinstallation, and post-installation data is being gathered to assess the effectiveness of the treatments.
FIGURE 2 High-risk route sign on SH2 Rimutaka Hill.
Chisnall and Broatch 147
FIGURE 3 PCMs (left) and helicopter landing area (right) on Southern Coromandel Loop. MAKING ROADS MOTORCYCLE FRIENDLY There are a number of higher-level tools available for use in identifying and treating routes with low safety performance for motorcyclists. However, MSAC recognized there was a need for a more openly targeted, easy-to-read guide to the issues. Building on the work of their Australian sister agencies, MSAC asked the Transport Agency to prepare a New Zealand version of the successful Making Roads Motorcycle Friendly (MRMF) document using New Zealand–specific examples of the common hazards (Figure 4). This document was published in September 2014 and is available from the MSAC website. MAKING ROADS MOTORCYCLE FRIENDLY SEMINAR SERIES To further reinforce the messages contained in the MRMF document, MSAC held a series of five half-day seminars across New Zealand. An open invitation to attend was sent to the consulting, contracting, and local government sectors in New Zealand. The seminars, held in Auckland, Rotorua, Dunedin, Christchurch, and Wellington during the week of February 9–13, 2015, were well attended by more than 210 people.
At the seminars, the intent and content of the MRMF document were formally presented. This was followed by an open forum during which questions were answered by an expert panel comprising representatives from the Transport Agency’s engineering, motorcycle training, and investment groups, along with a motorcycle officer from New Zealand Police. To assess the effectiveness and impact of the seminar series, a formal assessment has been undertaken, including surveys of attendees and invited nonattendees. The survey will include reasons for nonattendance and impact on behavior changes from the seminar learnings.
148 Transportation Research Circular E-C215: Roadside Safety Design and Devices
FIGURE 4 Cover of Making Roads Motorcycle Friendly. MOVING FORWARD There is still much work to be done. However, it is hoped that the development of these tools and their introduction to the sector will raise awareness of the straightforward nature of many interventions for motorcyclist safety and the benefits that such works have for all road users.
149
APPENDIX
List of Attendees
Raja Abeysekera Transport for New South Wales Tim Absalom Altus Traffic Pty Ltd Chris Allington Holmes Solutions John Annison Coates Hire Sam Atabak Queensland Department of Transport and
Main Roads Sophie Atkinson Roads Corporation of Victoria, Australia Alie Attie Ingal Civil Products Gillian Austin Aurecon Australasia Pty Ltd Mike Bambach University of New South Wales Richard Bortko Roads Corporation of Victoria, Australia Peter Boylan Boylan Group Leigh Brown Ingal Civil Products Andrew Burbridge Queensland Department of Transport and
Main Roads
Glenn Carey Cardno Daniel Cassar Roads Corporation of Victoria, Australia Tony Chau Trafficworks Julian Chisnall New Zealand Transport Agency Patrick Clancey Traffic Safety Megan Collier MWH Global Evan Coulson Roads Corporation of Victoria, Australia John Cunningham Roads Corporation of Victoria, Australia John Dignam Ingal Civil Products Mandi Dorhout Mees Roads Australia Mike Dreznes International Road Federation Wayne Duckworth Highway Care International Ben Duncker Highway Care International

150 Transportation Research Circular E-C215: Roadside Safety Design and Devices
Peter Exner Exner Engineering Pty Ltd Jessica Franklin Roads Corporation of Victoria, Australia Luke Gallagher Ingal Civil Products Dianne Godfrey Trafficworks Luigi Grassia Australian Motoring Services Pty Ltd Bruce Grey Australian Construction Products Lidia Grzebieta University of New South Wales Raphael Grzebieta University of New South Wales Dane Hansen LB Australia Holdings Pty Ltd Paul Hansen LB Australia Holdings Pty Ltd Peter Harris Road Safety Audits Pty Ltd Alan Hay Boylan Group Amin Heidarpour Monash University Simone Hewitt Roads Corporation of Victoria, Australia Dean Hislop Royal Automobile Club of Victoria
Ian Holmes Trafficworks Russell Hood Hill and Smith Pty Ltd Darren Hotchkin Saferoads Pty Ltd Pasquale Impero Australian Motoring Services Pty Ltd Dean Janse van Vuuren Safety Products NV Belgium Pam Jarvis Roads Corporation of Victoria, Australia Chris Jurewicz ARRB Group Ltd Alex Kang Beca Terry Lau MWH Global Shaun Lennard Australian Motorcycle Council Warren Makin Jacobs Group (Australia) Pty Ltd Glenn McAsey Coates Hire Justin McCann Safety Barrier Solutions Ian McLean A1 Highways Madeleine McManus Monash University
List of Attendees 151
Casey McMaster Saferoads Pty Ltd David McTiernan ARRB Group Ltd Leilani Melei Roads Corporation of Victoria, Australia Paul Mihailidis Trafficworks Allyana Miros Pas Monacella Roads Corporation of Victoria, Australia Wayne Moon Roads Corporation of Victoria, Australia Brendon Morgan Ingal Civil Products David Moule Hill and Smith Pty Ltd Raj Muthusamy Road Safety Audits Pty Ltd Noel O’Callaghan Department of Planning Transport and
Infrastructure–SA Zalman Paris Australian Construction Products Rob Partridge MWH Global Peter Pavey Ingal Civil Products Manjur Rahman Roads and Maritime Services
Swaminathan Ramamurthy LB Australia Holdings Pty Ltd Jamie Robertson Safe System Solutions Joe Southey MWH Global Henry Strachan MWH Global Mark Taylor GHD Pty Ltd Ilir Thaqi Ingal Civil Products Kailash Tiwari Egis Projects Asia Pacific Pty Ltd Tri Tjahjono Universitas Indonesia Vu Tran Roads Corporation of Victoria, Australia Rod Troutbeck Troutbeck and Associates Cade Turner 3M Australia Pty Ltd Joel Velasco Hyder Consulting Pty Ltd Marcus Waddell Ingal Civil Products Mike Wade Monash University Sue Walker CSP Pacific
152 Transportation Research Circular E-C215: Roadside Safety Design and Devices
Hayden Wallace Safe Direction Pty Ltd Hamish Webb Hamish Webb Brett Wells Ingal Civil Products Paul Williams Saferoads Pty Ltd
Allen Young TranEx Group Pty Ltd Ben Young TranEx Group Pty Ltd Gradimir Zivkovic Automotive Safety Engineering
The National Academy of Sciences was established in 1863 by an Act of Congress, signed by President Lincoln, as a private, nongovernmental institution to advise the nation on issues related to science and technology. Members are elected by their peers for outstanding contributions to research. Dr. Ralph J. Cicerone is president. The National Academy of Engineering was established in 1964 under the charter of the National Academy of Sciences to bring the practices of engineering to advising the nation. Members are elected by their peers for extraordinary contributions to engineering. Dr. C. D. Mote, Jr., is president. The National Academy of Medicine (formerly the Institute of Medicine) was established in 1970 under the charter of the National Academy of Sciences to advise the nation on medical and health issues. Members are elected by their peers for distinguished contributions to medicine and health. Dr. Victor J. Dzau is president. The three Academies work together as the National Academies of Sciences, Engineering, and Medicine to provide independent, objective analysis and advice to the nation and conduct other activities to solve complex problems and inform public policy decisions. The Academies also encourage education and research, recognize outstanding contributions to knowledge, and increase public understanding in matters of science, engineering, and medicine. Learn more about the National Academies of Sciences, Engineering, and Medicine at www.national-academies.org. The Transportation Research Board is one of seven major programs of the National Academies of Sciences, Engineering, and Medicine. The mission of the Transportation Research Board is to increase the benefits that transportation contributes to society by providing leadership in transportation innovation and progress through research and information exchange, conducted within a setting that is objective, interdisciplinary, and multimodal. The Board’s varied committees, task forces, and panels annually engage about 7,000 engineers, scientists, and other transportation researchers and practitioners from the public and private sectors and academia, all of whom contribute their expertise in the public interest. The program is supported by state transportation departments, federal agencies including the component administrations of the U.S. Department of Transportation, and other organizations and individuals interested in the development of transportation. Learn more about the Transportation Research Board at www.TRB.org.

TRANSPORTATION RESEARCH BOARD500 Fifth Street, NWWashington, DC 20001