Embed Size (px)
Citation preview
Roadway Lighting and Safety: Phase II – Monitoring Quality, Durability and Efficiency
Final ReportNovember 2011
Sponsored byIowa Highway Research Board(IHRB Project TR-601)Iowa Department of Transportation(InTrans Project 09-344)
About CTRE
The mission of the Center for Transportation Research and Education (CTRE) at Iowa State University is to develop and implement innovative methods, materials, and technologies for improving transportation efficiency, safety, and reliability while improving the learning environment of students, faculty, and staff in transportation-related fields.
Disclaimer Notice
The contents of this report reflect the views of the authors, who are responsible for the facts and the accuracy of the information presented herein. The opinions, findings and conclusions expressed in this publication are those of the authors and not necessarily those of the sponsors.
The sponsors assume no liability for the contents or use of the information contained in this document. This report does not constitute a standard, specification, or regulation.
The sponsors do not endorse products or manufacturers. Trademarks or manufacturers’ names appear in this report only because they are considered essential to the objective of the document.
Non-Discrimination Statement Iowa State University does not discriminate on the basis of race, color, age, religion, national origin, sexual orientation, gender identity, genetic information, sex, marital status, disability, or status as a U.S. veteran. Inquiries can be directed to the Director of Equal Opportunity and Compliance, 3280 Beardshear Hall, (515) 294-7612.
Iowa Department of Transportation Statements
Federal and state laws prohibit employment and/or public accommodation discrimination on the basis of age, color, creed, disability, gender identity, national origin, pregnancy, race, religion, sex, sexual orientation or veteran’s status. If you believe you have been discriminated against, please contact the Iowa Civil Rights Commission at 800-457-4416 or Iowa Department of Transportation’s affirmative action officer. If you need accommodations because of a disability to access the Iowa Department of Transportation’s services, contact the agency’s affirmative action officer at 800-262-0003.
The preparation of this (report, document, etc.) was financed in part through funds provided by the Iowa Department of Transportation through its “Agreement for the Management of Research Conducted by Iowa State University for the Iowa Department of Transportation,” and its amendments.
The opinions, findings, and conclusions expressed in this publication are those of the authors and not necessarily those of the Iowa Department of Transportation.
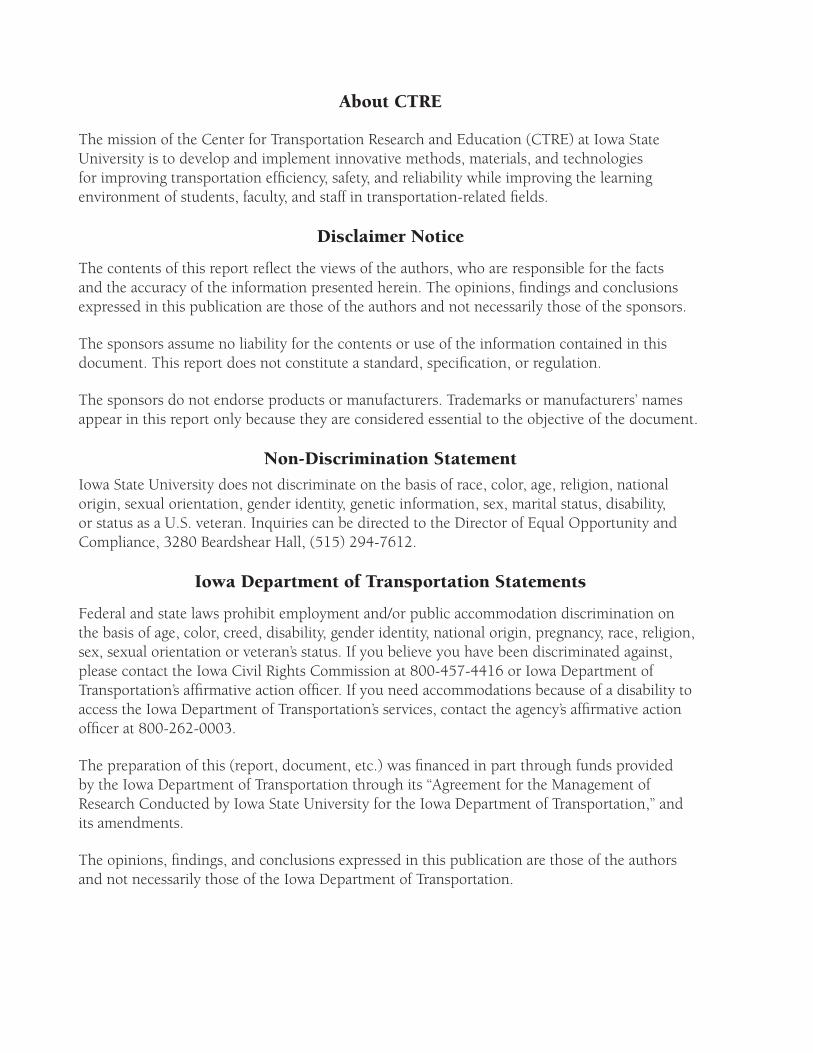
Technical Report Documentation Page
1. Report No. 2. Government Accession No. 3. Recipient’s Catalog No.
IHRB Project TR-601
4. Title and Subtitle 5. Report Date
Roadway Lighting and Safety: Phase II – Monitoring Quality, Durability, and
Efficiency
November 2011
6. Performing Organization Code
7. Author(s) 8. Performing Organization Report No.
Omar Smadi, Neal Hawkins, and Basak Aldemir-Bektas InTrans Project 09-344
9. Performing Organization Name and Address 10. Work Unit No. (TRAIS)
Center for Transportation Research and Education
Iowa State University
2711 South Loop Drive, Suite 4700
Ames, IA 50010-8664
11. Contract or Grant No.
12. Sponsoring Organization Name and Address 13. Type of Report and Period Covered
Iowa Highway Research Board
Iowa Department of Transportation
800 Lincoln Way
Ames, IA 50010
Final Report
14. Sponsoring Agency Code
15. Supplementary Notes
Visit www.intrans.iastate.edu for color PDF files of this and other research reports.
16. Abstract
This Phase II project follows a previous project titled Strategies to Address Nighttime Crashes at Rural, Unsignalized Intersections.
Based on the results of the previous study, the Iowa Highway Research Board (IHRB) indicated interest in pursuing further research to
address the quality of lighting, rather than just the presence of light, with respect to safety.
The research team supplemented the literature review from the previous study, specifically addressing lighting level in terms of
measurement, the relationship between light levels and safety, and lamp durability and efficiency.
The Center for Transportation Research and Education (CTRE) teamed with a national research leader in roadway lighting, Virginia
Tech Transportation Institute (VTTI) to collect the data.
An integral instrument to the data collection efforts was the creation of the Roadway Monitoring System (RMS). The RMS allowed the
research team to collect lighting data and approach information for each rural intersection identified in the previous phase.
After data cleanup, the final data set contained illuminance data for 101 lighted intersections (of 137 lighted intersections in the first
study).
Data analysis included a robust statistical analysis based on Bayesian techniques. Average illuminance, average glare, and average
uniformity ratio values were used to classify quality of lighting at the intersections.
17. Key Words 18. Distribution Statement
crash mitigation—illuminance—intersection lighting—lighting measurements—
nighttime traffic safety—Roadway Monitoring System—RMS—rural intersections
No restrictions.
19. Security Classification (of this
report)
20. Security Classification (of this
page)
21. No. of Pages 22. Price
Unclassified. Unclassified. 44 NA
Form DOT F 1700.7 (8-72) Reproduction of completed page authorized

ROADWAY LIGHTING AND SAFETY: PHASE II –
MONITORING QUALITY, DURABILITY, AND
EFFICIENCY
Final Report
November 2011
Principal Investigator
Omar Smadi, Research Scientist
Center for Transportation Research and Education
Iowa State University
Co-Principal Investigator
Neal Hawkins, Director
Center for Transportation Research and Education
Iowa State University
Postdoctoral Research Associate
Basak Aldemir-Bektas
Authors
Omar Smadi, Neal Hawkins, and Basak Aldemir-Bektas
Sponsored by
the Iowa Highway Research Board
(IHRB Project TR-601)
Preparation of this report was financed in part
through funds provided by the Iowa Department of Transportation
through its research management agreement with the
Institute for Transportation
(InTrans Project 09-344)
A report from
Institute for Transportation
Iowa State University
2711 South Loop Drive, Suite 4700
Ames, IA 50010-8664
Phone: 515-294-8103
Fax: 515-294-0467
www.intrans.iastate.edu

v
TABLE OF CONTENTS
ACKNOWLEDGMENTS ............................................................................................................ vii
EXECUTIVE SUMMARY ........................................................................................................... ix
INTRODUCTION ...........................................................................................................................1
Objectives ............................................................................................................................1
Research Plan .......................................................................................................................2
QUALITY OF LIGTING AT RURAL UNSIGNALIZED INTERSECTIONS .............................3
Literature Review.................................................................................................................3
Practice and Guidelines ........................................................................................................4
DATA COLLECTION ....................................................................................................................6
Phase I Data Collection ........................................................................................................6
Phase II Data Collection ......................................................................................................7
Crash Data for Phase II ......................................................................................................10
CRASH CHARACTERISTICS .....................................................................................................11
STATISTICAL ANALYSIS .........................................................................................................15
Summary of Data ...............................................................................................................15
Analysis..............................................................................................................................16
Conclusions ........................................................................................................................25
REFERENCES ..............................................................................................................................27
APPENDIX ....................................................................................................................................29
vi
LIST OF FIGURES
Figure 1. Location of selected rural intersections in Iowa ...............................................................6
Figure 2. Roadway monitoring system set-up .................................................................................8
Figure 3. Mounted cameras and data collection equipment ............................................................9
Figure 4. Plot of lighting data records for a study intersection ......................................................10
Figure 5. Distribution of independent variables for study intersections ........................................18
LIST OF TABLES
Table 1. Illuminance method – recommended maintained values* .................................................5
Table 2. Day and night crashes by severity ...................................................................................11
Table 3. Day and night crashes by severity for unlighted intersections ........................................11
Table 4. Day and night crashes by severity for lighted intersections ............................................12
Table 5. Crash counts by first harm in the crash ............................................................................12
Table 6. Crash counts by type of crash ..........................................................................................13
Table 7. Crash information for Phase II .........................................................................................15
Table 8. Crash information for Phase I ..........................................................................................15
Table 9. Lighting cluster analysis ..................................................................................................19
Table 10. Parameter estimates for day crash rate ..........................................................................21
Table 11. Parameter estimates for night to day crash ratio, presence of light ...............................22
Table 12. Parameter estimates for number of night time crashes, presence of light .....................22
Table 13. Parameter estimates for night to day crash ratio, lighting level .....................................23
Table 14. Parameter estimates for number of night time crashes, lighting level ...........................23
Table 15. Maximum likelihood estimates of crash severity model parameters .............................24
vii
ACKNOWLEDGMENTS
The authors would like to thank the Iowa Highway Research Board (IHRB) and the Iowa
Department of Transportation (DOT) for sponsoring this research. They would also like to thank
the task force members on this project.


ix
EXECUTIVE SUMMARY
This Phase II project follows a previous project titled Strategies to Address Nighttime Crashes at
Rural, Unsignalized Intersections. Based on the results of the previous study, the Iowa Highway
Research Board (IHRB) indicated interest in pursuing further research to address the quality of
lighting, rather than just the presence of light, with respect to safety.
The previous study confirmed that lighting may have an impact on driver safety at rural
intersections. The research used lighting as a strictly binary measure during analysis, meaning
that the lighting was either present or absent.
Results showed that the ratios of night-to-day and total night crashes were lower at lighted
intersections compared to unlighted intersections. While the results showed lighting enhances
driver safety, the data did not account for the quality or level of light at intersections. Moreover,
lighting levels at a few locations may detract from driver safety or may provide no safety benefit.
The Center for Transportation Research and Education (CTRE) teamed with a national research
leader in roadway lighting, Virginia Tech Transportation Institute (VTTI) to collect the data for
this phase of the study.
An integral instrument to the data collection efforts was the creation of the Roadway Monitoring
System (RMS). The RMS allowed the research team to collect lighting data and approach
information for each rural intersection identified in the previous phase.
Data analysis identified specific lighting levels for each of the data collection sites and related
this information directly to the crash statistics obtained in the first study. Data analysis included a
robust statistical analysis based on Bayesian techniques.
Average illuminance, average glare, and average uniformity ratio values were used to classify
quality of lighting at the intersections. Details of this classification are given in the statistical
analysis section of the report.
Summary of Key Findings
As with any study that includes field data and limited resources, there are limitations on
the number of available data points, randomness of data, and ranges of data values
(number of crashes, light levels, volume, and intersection control).
For all but nine of the lighted intersections, the measured illuminance levels were below
the recommended values and this limits the robustness of the cluster analysis and results
in the inability to contrast different illuminance ranges.
The negative parameter estimates for lower average illuminance and glare and higher
average illuminance and glare suggest lower night-to-day crash ratios for both groups of
lighted intersections with respect to unlighted intersections.
x
Model results suggest a lower number of nighttime crashes for lower average illuminance
intersections when compared with unlighted and higher average illuminance
intersections. However, a significant relationship cannot be found due to the high
standard deviations of the parameter estimates and there was an imbalance between the
data sets with 75 lower illuminance intersections as opposed to only 26 higher
illuminance intersections.
This project gave the research team an opportunity to determine the impact of illumination levels
on safety (nighttime crashes). Based on the findings from both the Phase I and II studies, lighted
intersections experience fewer crashes when compared to unlighted conditions.
Even with the far majority of intersections falling below standard illumination levels, the
presence of lighting still made a significant impact on safety when compared to non-lighted
locations. Identifying optimal lighting levels will likely enhance the detection of relevant driver
information and therefore provide a safety benefit.
The results obtained in Iowa suggest a need for further research. Quantifying the safety
contribution of light quality remains elusive at best. Specifically, there is a need to identify how
intersection infrastructure and geometry influence lighting levels and corresponding crash rates.
1
INTRODUCTION
Nighttime driving can be particularly problematic. In Iowa, approximately 24 percent of all
crashes and 40 percent of fatal crashes in 2003 occurred under dark conditions. The United
States Department of Transportation (USDOT) and National Highway Traffic Safety
Administration (NHTSA) report that 45 percent of fatalities occur nationally under dark
conditions versus fatalities representing 27 percent of all crashes (USDOT 2003). One study
indicated that the nighttime fatality rate is three times the daytime rate, while the general
nighttime crash rate is approximately 1.6 times the daytime rate (Hasson and Lutkevich 2002;
Opiela et al. 2003)
Recent research by Hallmark et al. (2008) has shown that lighting may have an impact on driver
safety at rural intersections. This research used lighting as a strictly binary measure during
analysis, meaning that the lighting was either present or absent. Crashes were tabulated based on
the binary measurement and ratios were created. Results showed that the ratios of night-to-day
and total night crashes were lower at lighted intersections compared to unlighted intersections.
These results show lighting enhances driver safety; however, the data does not account for the
quality or level of light at intersections. Moreover, lighting levels at a few locations may detract
from driver safety or may provide no safety benefit. Identifying optimal lighting levels will
likely enhance the detection of relevant driver information and therefore provide a safety benefit.
The results obtained in Iowa suggest a need for further research. Specifically, there is a need to
identify how intersection infrastructure and geometry influence lighting levels and corresponding
crash rates. Furthermore, recommendations can be established based specifically on lighting
levels and related crash data.
This Phase II project follows a previous project (TR-540) named Strategies to Address Nighttime
Crashes at Rural, Unsignalized Intersections) (Hallmark et al. 2008). Based on the results of the
previous study, the Iowa Highway Research Board indicated interest in pursuing further research
to address the quality of lighting rather than just the presence of light with respect to safety.
Objectives
The project objectives were as follows:
1. Collect field lighting levels for 101 study intersections from Phase I. This gave the
research team an opportunity to determine the impact of illumination levels on safety
(nighttime crashes). To accomplish this, the Center for Transportation Research and
Education (CTRE) teamed with Virginia Tech Transportation Institute (VTTI) to
complete the data collection.
2. Analyze these data to establish a relationship between crash performance and
illumination at rural unsignalized intersections. This included a robust statistical analysis
based on Bayesian techniques.
3. Investigate lighting levels at rural intersections, considering a number of factors
(uniformity, glare, lamp durability, and efficiency-energy consumption).
2
Research Plan
A breakdown of project tasks follows:
Task 1 – Synthesize state of the practice: The research team supplemented the literature review
completed for TR-540, specifically addressing lighting level in terms of measurement, the
relationship between light levels and safety, and lamp durability and efficiency.
Task 2 – Data collection: The task included all field measurement of lighting levels for all study
intersections. Staff and equipment from VTTI assist the CTRE team in this effort.
Task 3 – Data analysis: This task utilized Task 2 data to identify specific lighting levels for
each of the data collection sites and relate this information directly to the crash statistics obtained
in TR-540. To accomplish this, an extensive analysis of the data collected was completed.
Task 4 – Lighting parameters: This task focused on the relationship between illuminance and
glare in terms of their relationship to safety.
Task 5 – Final report: This task was to prepare an IHRB-formatted final report, which includes
the findings from all project research tasks, field data, photos, tables, and charts.

3
QUALITY OF LIGTING AT RURAL UNSIGNALIZED INTERSECTIONS
Literature Review
The safety literature on lighting at intersections typically focuses on before-and-after studies
where the effect of presence of lighting on nighttime crash frequency is researched (Wortman et
al. 1972; Walker and Roberts 1976; Isebrands et al. 2010; Kim et al. 2006). In general, lighting at
rural unsignalized intersections is reported to provide a positive safety benefit and a reduction in
nighttime crash frequency. Usually, studies report lower nighttime crash frequencies after
installation of lighting.
The earlier Phase I report includes a detailed literature review on the effect of presence of
lighting on nighttime crashes (Hallmark et al. 2008). This project evaluated the effect of presence
of lighting on safety performance among other intersection-related measures by a cross-sectional
analysis. The nighttime model results indicated that locations without lighting had twice as many
crashes as locations with lighting. Use of lighting at rural intersections was most likely to be
effective when there are two or more nighttime crashes in a three-year period. No statistically-
significant relationship could be established between nighttime crashes and non-lighting low
costs measures, based on available data.
While numerous before-and-after and cross-sectional analyses on the presence of lighting are
available in the literature, only a few studies that address quality of lighting were found. One
study by Monsere and Fischer studied 44 interchanges and 5.5 miles of interstate highway where
the Oregon Department of Transportation (ODOT) reduced illumination levels for saving energy.
This reduction was selective and in response to a forecasted energy shortage.
An increase in reported crashes where the lineal lighting was reduced both in total crashes (28.95
percent) and injury night crashes (39.21 percent) was reported for the lineal sections. For
interchanges, however, the study reported an unexpected decrease (35.24 percent) in total
crashes and a (39.98 percent) decrease in injury night crashes (Monsere and Fischer 2008). The
quality of lighting variable in this before-and-after study was a categorical variable that indicated
the change in lighting (e.g., full interchange lighting to partial lighting).
A study by Box (Box 1976) conducted a before-and-after safety evaluation of reducing roadway
lighting in Clearwater, Florida. The results indicated that by de-energizing alternate lighting
poles, day crashes increased by about four percent, while night crashes increased by 10 times as
much.
A later study by Richards (Richards 1981) in Austin, Texas reported a 47 percent increase in
nighttime crash frequency on a 7.2 mile stretch of I-35 where continuous freeway lighting was
turned off. Some other studies are consolidated in Elvik and Vaa’s Handbook of Road Safety
Measures (Elvik and Vaa 2004; Monsere and Fischer 2008). The best estimates of safety change
following reductions in lighting were reported as a 17 percent increase for injury crashes and a
27 percent increase for property-damage-only crashes.
4
Other than the study by Monsere and Fischer (Monsere and Fischer 2008), the researchers didn’t
find any studies that evaluate the quality of lighting on safety performance of interchanges or
intersections.
Practice and Guidelines
The Phase I report includes a chapter on lighting warrants for rural roadways and one on lighting
standards and practices in Iowa counties and cities. The latter chapter includes a survey that was
developed to question Iowa counties and cities as to their lighting standards and practices. The
survey is provided in Appendix B of the earlier report.
The American National Standard Practice for Roadway Lighting (IESNA 2005) includes three
different criteria for use in continuous roadway lighting design: illuminance, luminance, and
small target visibility (STV). This standard practice manual lists recommended design values for
these criteria, representing the lowest maintained values for specific roadways and walkways. In
this study, the recommended values for the illuminance criteria were used to categorize quality
of lighting at rural intersections; in accordance with the availability of the field data.
Illuminance (E), the density of the luminous flux incident on a surface, is the quotient of the
luminous flux by the area of the surface (measured in footcandles or lux) (IESNA 2005). The
illuminance method determines “the amount of light incident on the roadway surface from the
roadway lighting system.” Because different pavement characteristics have different reflective
properties and the amount of light seen by the driver changes accordingly, different illuminance
levels are recommended for each type of pavement. Recommendations for average maintained
lux for various road and pavement classifications are listed in the American National Standard
Practice for Roadway Lighting. Road surfaces are classified under four categories as follows:
R1: Portland cement concrete road surface, asphalt road surface with a minimum of 12
percent of the aggregates composed of artificial brightener aggregates
R2: Asphalt road surface with an aggregate composed of a minimum 60 percent gravel or
asphalt surface with 10 to 15 percent artificial brightener in aggregate mix
R3: Asphalt road surface with dark aggregates; rough texture after some months use
R4: Asphalt road surface with very smooth texture
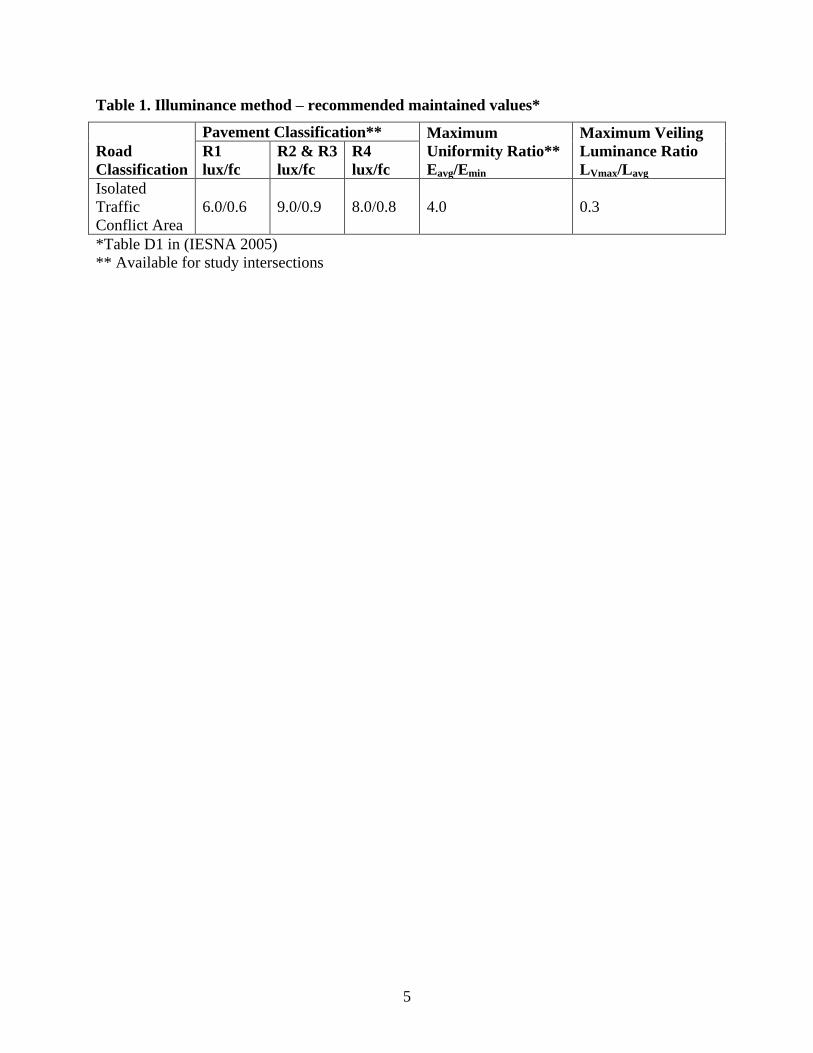
Table 1summarizes the recommended maintained values for isolated traffic conflict areas that are
the most applicable for the rural unsignalized intersections addressed in this study. Minimum
recommended maintained illuminance values are given by pavement classification. Maximum
uniformity ratio, which is the ratio of average illuminance (Eavg) to minimum illuminance (Emin),
is another parameter of the illuminance method.
5
Table 1. Illuminance method – recommended maintained values*
Road
Classification
Pavement Classification** Maximum
Uniformity Ratio**
Eavg/Emin
Maximum Veiling
Luminance Ratio
LVmax/Lavg
R1
lux/fc
R2 & R3
lux/fc
R4
lux/fc
Isolated
Traffic
Conflict Area
6.0/0.6 9.0/0.9 8.0/0.8 4.0 0.3
*Table D1 in (IESNA 2005)
** Available for study intersections
6
DATA COLLECTION
Phase I Data Collection
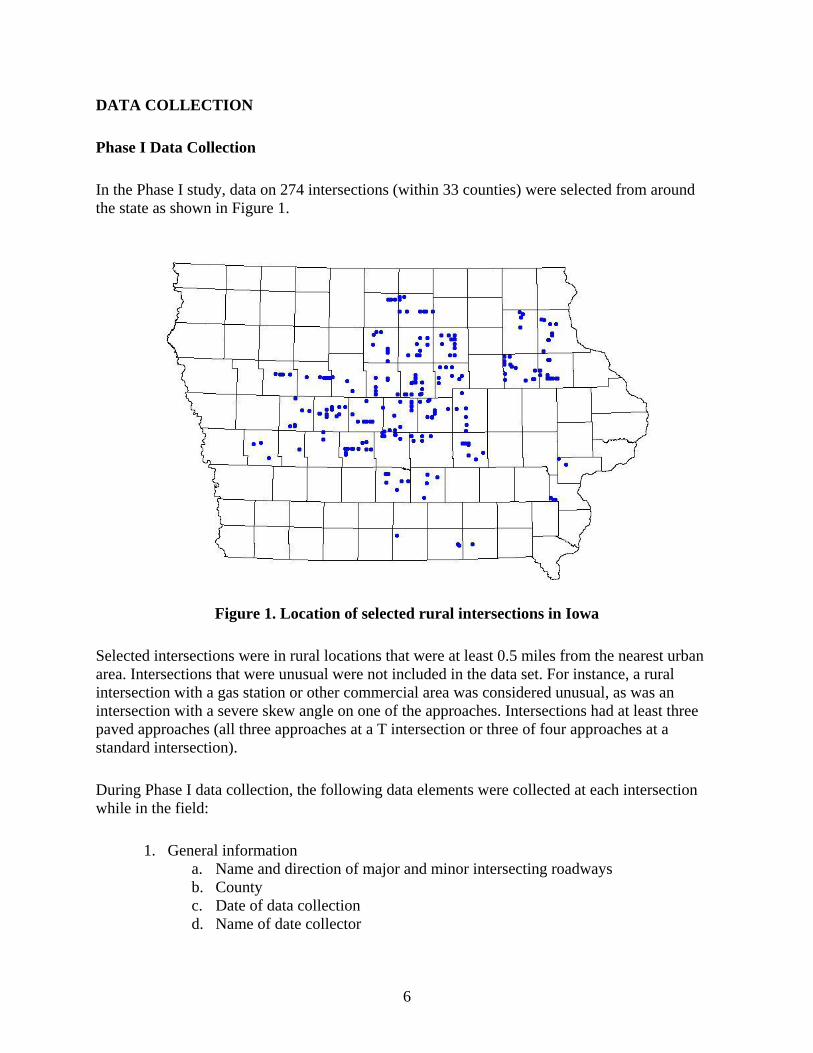
In the Phase I study, data on 274 intersections (within 33 counties) were selected from around
the state as shown in Figure 1.
Figure 1. Location of selected rural intersections in Iowa
Selected intersections were in rural locations that were at least 0.5 miles from the nearest urban
area. Intersections that were unusual were not included in the data set. For instance, a rural
intersection with a gas station or other commercial area was considered unusual, as was an
intersection with a severe skew angle on one of the approaches. Intersections had at least three
paved approaches (all three approaches at a T intersection or three of four approaches at a
standard intersection).
During Phase I data collection, the following data elements were collected at each intersection
while in the field:
1. General information
a. Name and direction of major and minor intersecting roadways
b. County
c. Date of data collection
d. Name of date collector
7
2. Information by approach
a. Surface type (asphalt, concrete, gravel)
b. Number of lanes (left, through, right)
c. Traffic control (no control, stop, yield)
d. Channelization (painted right-turn island, raised right-turn island)
e. Other traffic control (flashing red or yellow beacons, red flags on stop signs)
f. Number of rumble strips
g. Median type (undivided, grass, painted)
3. Lighting information
a. Location
b. Type of light (cobra head, flood light, other)
c. Location in relationship to the corresponding approach
Perpendicular to inbound lanes
Perpendicular to outbound lanes
Diagonal between approaches
d. Type of pole
Existing utility (light was placed on existing utility pole without
moving the pole to place the light in a particular spot)
Wood pole placed for light
Metal pole placed for light
The Phase I study analysis period was from 2003 to 2005. After data collection, each intersection
was located in a Geographic Information System (GIS) database by locating the two intersecting
roadways with the 2003 snapshot of the Iowa Department of Transportation (DOT) Geographic
Information Management System (GIMS) line work.
Average Annual Daily Traffic (AADT) reports were extracted for each roadway and one-half of
the traffic was assigned to each approach. The total intersection daily entering volume was
calculated by summing the total volume for each approach.
The Phase I study analysis was done for the 223 intersections after removing unsuitable
intersections such as the ones not following the selection criteria regarding a rural setting or
having an unusual configuration. Intersections with railroad tracks crossing an approach within
less than 50 feet were also excluded.
Phase II Data Collection
To capture quality of lighting data in the study intersections, CTRE staff arranged to team with a
national research leader in roadway lighting, VTTI. VTTI worked with CTRE to complete the
objectives of this Phase II work.
An integral instrument to the data collection efforts in this phase of research was the creation of
the Roadway Monitoring System (RMS). The RMS allowed the research team to collect lighting
data and approach information for each rural intersection identified in the previous phase. To
8
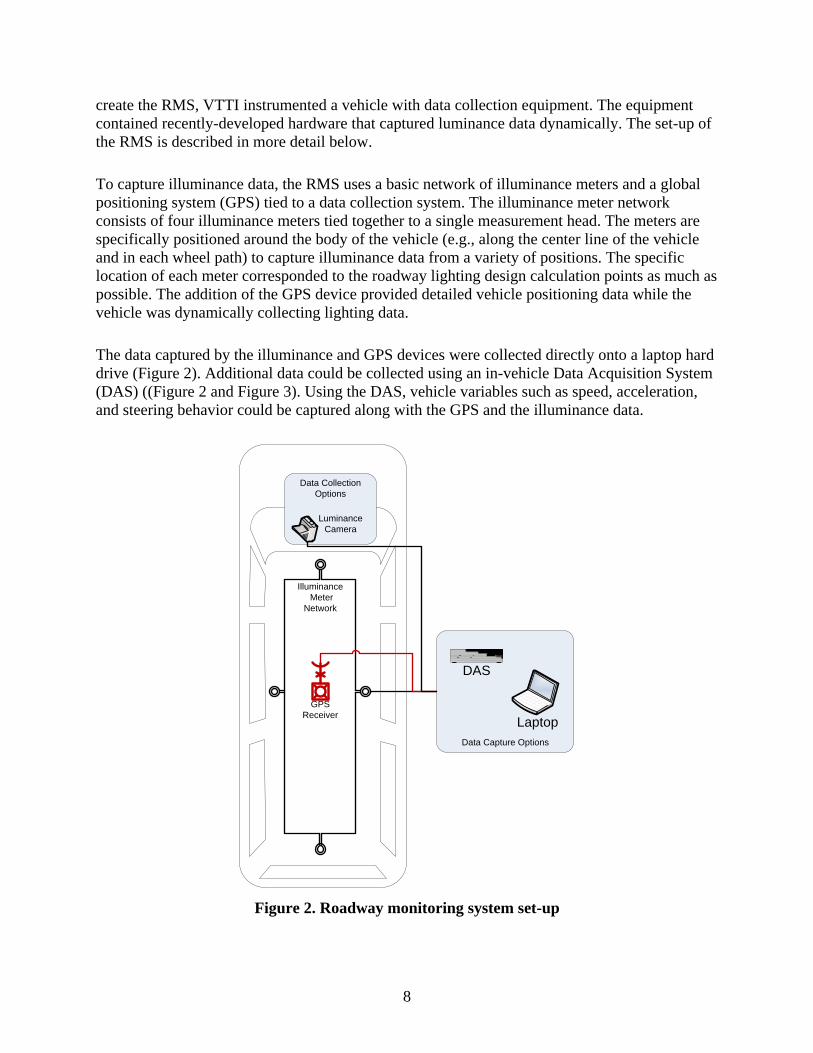
create the RMS, VTTI instrumented a vehicle with data collection equipment. The equipment
contained recently-developed hardware that captured luminance data dynamically. The set-up of
the RMS is described in more detail below.
To capture illuminance data, the RMS uses a basic network of illuminance meters and a global
positioning system (GPS) tied to a data collection system. The illuminance meter network
consists of four illuminance meters tied together to a single measurement head. The meters are
specifically positioned around the body of the vehicle (e.g., along the center line of the vehicle
and in each wheel path) to capture illuminance data from a variety of positions. The specific
location of each meter corresponded to the roadway lighting design calculation points as much as
possible. The addition of the GPS device provided detailed vehicle positioning data while the
vehicle was dynamically collecting lighting data.
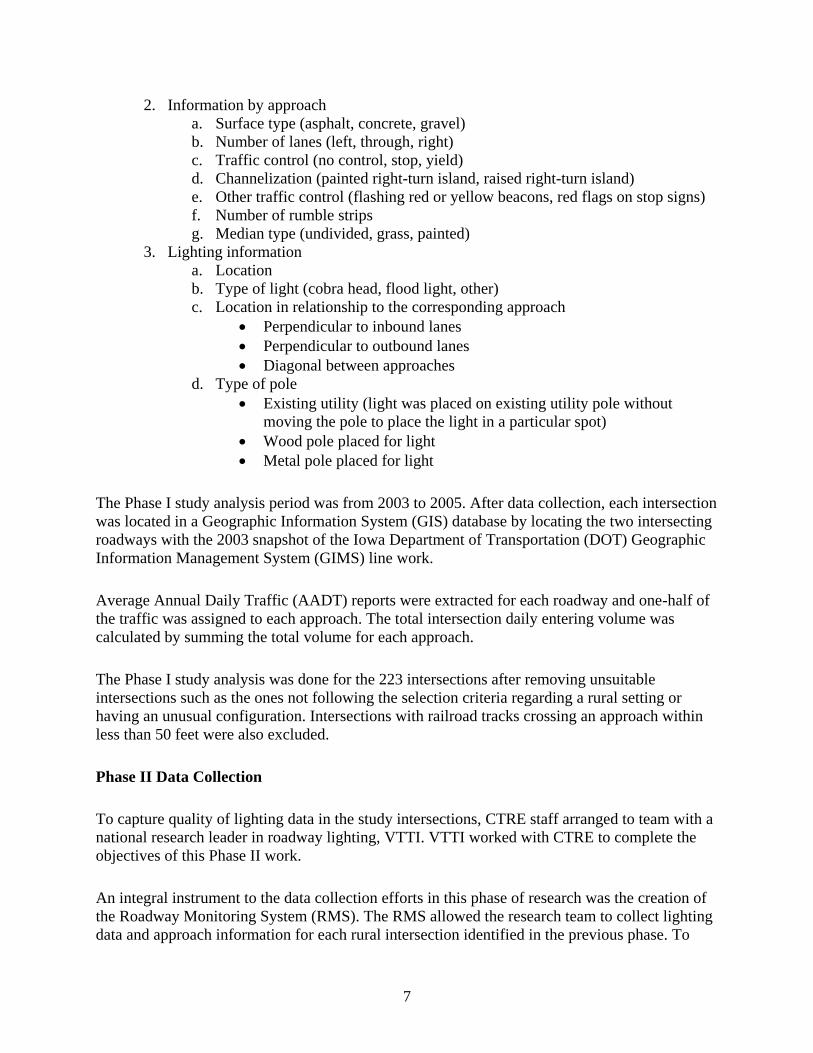
The data captured by the illuminance and GPS devices were collected directly onto a laptop hard
drive (Figure 2). Additional data could be collected using an in-vehicle Data Acquisition System
(DAS) ((Figure 2 and Figure 3). Using the DAS, vehicle variables such as speed, acceleration,
and steering behavior could be captured along with the GPS and the illuminance data.
Data Collection
Options
Data Capture Options
Illuminance
Meter
Network
GPS
ReceiverLaptop
DAS
Luminance
Camera
Figure 2. Roadway monitoring system set-up
9
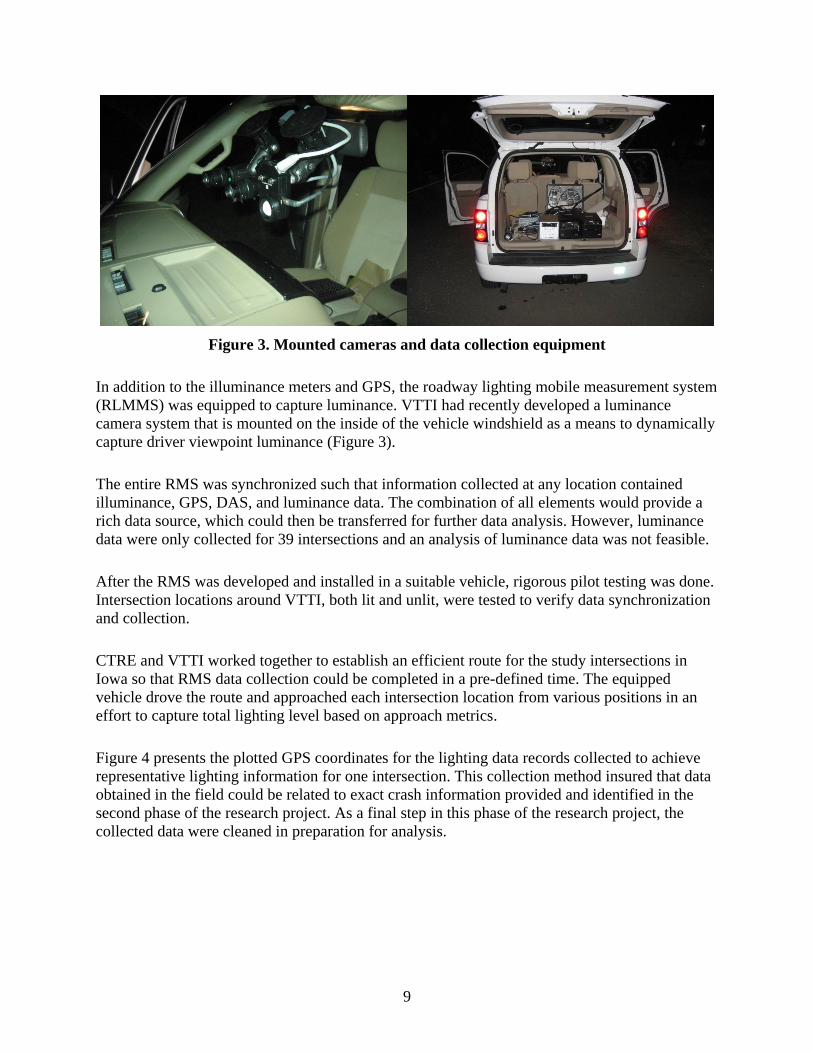
Figure 3. Mounted cameras and data collection equipment
In addition to the illuminance meters and GPS, the roadway lighting mobile measurement system
(RLMMS) was equipped to capture luminance. VTTI had recently developed a luminance
camera system that is mounted on the inside of the vehicle windshield as a means to dynamically
capture driver viewpoint luminance (Figure 3).
The entire RMS was synchronized such that information collected at any location contained
illuminance, GPS, DAS, and luminance data. The combination of all elements would provide a
rich data source, which could then be transferred for further data analysis. However, luminance
data were only collected for 39 intersections and an analysis of luminance data was not feasible.
After the RMS was developed and installed in a suitable vehicle, rigorous pilot testing was done.
Intersection locations around VTTI, both lit and unlit, were tested to verify data synchronization
and collection.
CTRE and VTTI worked together to establish an efficient route for the study intersections in
Iowa so that RMS data collection could be completed in a pre-defined time. The equipped
vehicle drove the route and approached each intersection location from various positions in an
effort to capture total lighting level based on approach metrics.
Figure 4 presents the plotted GPS coordinates for the lighting data records collected to achieve
representative lighting information for one intersection. This collection method insured that data
obtained in the field could be related to exact crash information provided and identified in the
second phase of the research project. As a final step in this phase of the research project, the
collected data were cleaned in preparation for analysis.

10
Figure 4. Plot of lighting data records for a study intersection
After data cleanup, the final data set contained illuminance data for 101 lighted intersections (of
137 lighted intersections in the first study). Average illuminance, average glare, and average
uniformity ratio values were used to classify quality of lighting at these intersections. Details of
this classification are given in the statistical analysis section of the report.
Crash Data for Phase II
The crash database included crashes from January 2006 through March 2011 from the Iowa DOT
crash database. Crashes within 150 ft of the intersections were selected. The crashes were then
categorized as day and night crashes based on the time of day and the sunrise and sunset times,
which were downloaded from the U.S. Naval Observatory web site.
Dawn or dusk crashes were omitted from the study due to the difference of natural light
conditions and any possible effect of natural light to lighting level at time of crash. The final
crash database included 300 crashes for the 187 intersections (101 lighted and 86 unlighted) in
the study.
The next section includes information on the characteristics of the crashes. Other statistics on
crash counts are provided in the statistical analysis section.
11
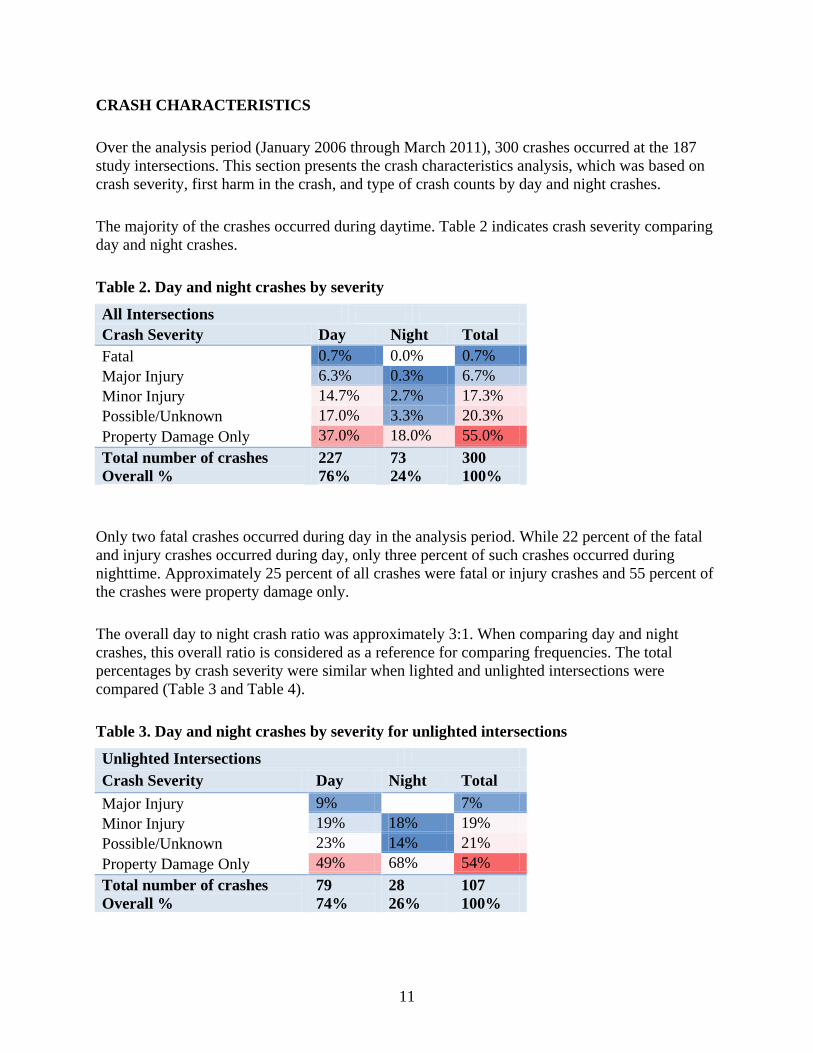
CRASH CHARACTERISTICS
Over the analysis period (January 2006 through March 2011), 300 crashes occurred at the 187
study intersections. This section presents the crash characteristics analysis, which was based on
crash severity, first harm in the crash, and type of crash counts by day and night crashes.
The majority of the crashes occurred during daytime. Table 2 indicates crash severity comparing
day and night crashes.
Table 2. Day and night crashes by severity
All Intersections
Crash Severity Day Night Total
Fatal 0.7% 0.0% 0.7%
Major Injury 6.3% 0.3% 6.7%
Minor Injury 14.7% 2.7% 17.3%
Possible/Unknown 17.0% 3.3% 20.3%
Property Damage Only 37.0% 18.0% 55.0%
Total number of crashes
Overall %
227
76%
73
24%
300
100%
Only two fatal crashes occurred during day in the analysis period. While 22 percent of the fatal
and injury crashes occurred during day, only three percent of such crashes occurred during
nighttime. Approximately 25 percent of all crashes were fatal or injury crashes and 55 percent of
the crashes were property damage only.
The overall day to night crash ratio was approximately 3:1. When comparing day and night
crashes, this overall ratio is considered as a reference for comparing frequencies. The total
percentages by crash severity were similar when lighted and unlighted intersections were
compared (Table 3 and Table 4).
Table 3. Day and night crashes by severity for unlighted intersections
Unlighted Intersections
Crash Severity Day Night Total
Major Injury 9% 7%
Minor Injury 19% 18% 19%
Possible/Unknown 23% 14% 21%
Property Damage Only 49% 68% 54%
Total number of crashes
Overall %
79
74%
28
26%
107
100%

12
Table 4. Day and night crashes by severity for lighted intersections
Lighted Intersections
Crash Severity Day Night Total
Fatal 1% 1%
Major Injury 8% 2% 7%
Minor Injury 20% 7% 17%
Possible/Unknown 22% 13% 20%
Property Damage Only 49% 78% 55%
Total number of crashes
Overall %
148
77%
45
23%
193
100%
Day and night crash percentages for unlighted and lighted intersections by crash severity were
also similar, with the exception of minor injury crashes. For unlighted intersections; the ratios of
minor injury crashes to all crashes during day (19 percent) and during night (18 percent) were
quite close, although the overall day to night crash ratio was 2.84. Nighttime major injury
crashes were twice as common at unlighted intersections (18 percent) than lighted intersections
(nine percent).
The majority of the crashes were collision crashes and almost 70 percent of all crashes were
collision with another vehicle (Table 5).
Table 5. Crash counts by first harm in the crash
First Harm in the Crash Day Night Total Day/Night
Collision with fixed object:
Bridge/bridge rail/overpass 0.7% 0.0% 0.7%
Culvert 0.3% 0.0% 0.3%
Curb/island/raised median 1.0% 0.0% 1.0%
Ditch/embankment 4.0% 1.7% 5.7% 2.4
Guardrail 0.0% 0.3% 0.3%
Poles (utility/light/etc.) 1.3% 0.3% 1.7% 4
Sign post 1.0% 0.0% 1.0%
Collision with:
Animal 3.0% 10.7% 13.7% 0.3
Other non-fixed object (explain in narrative) 0.3% 1.3% 1.7% 0.25
Vehicle in traffic 39.3% 7.0% 46.3% 5.6
Vehicle in/from other roadway 20.7% 1.7% 22.3% 12.4
Non-collision event:
Jackknife 0.7% 0.0% 0.7%
Other non-collision (explain in narrative) 0.3% 0.7% 1.0% 0.5
Overturn/rollover 3.0% 0.7% 3.7% 4.5
Total 227 73 300 3.1
13
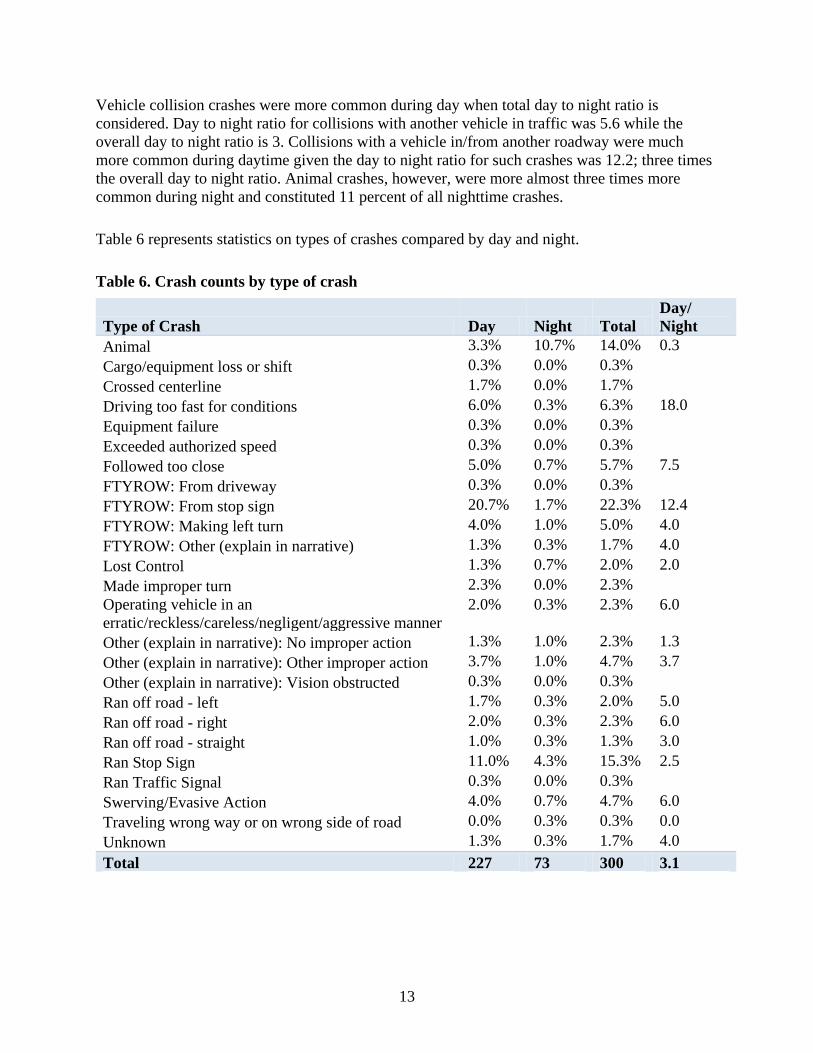
Vehicle collision crashes were more common during day when total day to night ratio is
considered. Day to night ratio for collisions with another vehicle in traffic was 5.6 while the
overall day to night ratio is 3. Collisions with a vehicle in/from another roadway were much
more common during daytime given the day to night ratio for such crashes was 12.2; three times
the overall day to night ratio. Animal crashes, however, were more almost three times more
common during night and constituted 11 percent of all nighttime crashes.
Table 6 represents statistics on types of crashes compared by day and night.
Table 6. Crash counts by type of crash
Type of Crash Day Night Total
Day/
Night
Animal 3.3% 10.7% 14.0% 0.3
Cargo/equipment loss or shift 0.3% 0.0% 0.3%
Crossed centerline 1.7% 0.0% 1.7%
Driving too fast for conditions 6.0% 0.3% 6.3% 18.0
Equipment failure 0.3% 0.0% 0.3%
Exceeded authorized speed 0.3% 0.0% 0.3%
Followed too close 5.0% 0.7% 5.7% 7.5
FTYROW: From driveway 0.3% 0.0% 0.3%
FTYROW: From stop sign 20.7% 1.7% 22.3% 12.4
FTYROW: Making left turn 4.0% 1.0% 5.0% 4.0
FTYROW: Other (explain in narrative) 1.3% 0.3% 1.7% 4.0
Lost Control 1.3% 0.7% 2.0% 2.0
Made improper turn 2.3% 0.0% 2.3%
Operating vehicle in an
erratic/reckless/careless/negligent/aggressive manner
2.0% 0.3% 2.3% 6.0
Other (explain in narrative): No improper action 1.3% 1.0% 2.3% 1.3
Other (explain in narrative): Other improper action 3.7% 1.0% 4.7% 3.7
Other (explain in narrative): Vision obstructed 0.3% 0.0% 0.3%
Ran off road - left 1.7% 0.3% 2.0% 5.0
Ran off road - right 2.0% 0.3% 2.3% 6.0
Ran off road - straight 1.0% 0.3% 1.3% 3.0
Ran Stop Sign 11.0% 4.3% 15.3% 2.5
Ran Traffic Signal 0.3% 0.0% 0.3%
Swerving/Evasive Action 4.0% 0.7% 4.7% 6.0
Traveling wrong way or on wrong side of road 0.0% 0.3% 0.3% 0.0
Unknown 1.3% 0.3% 1.7% 4.0
Total 227 73 300 3.1

14
Comparing day to night crash ratios for each type of crash with the overall day to night crash
ratio provides an understanding of relative frequency. By looking at day to night ratios we
observe again that animal crashes are more common during night. Crashes due to driving too
fast, following too close, failing to yield at stop sign, and running off the road from left or right
are some types of crashes more common during the day.
15
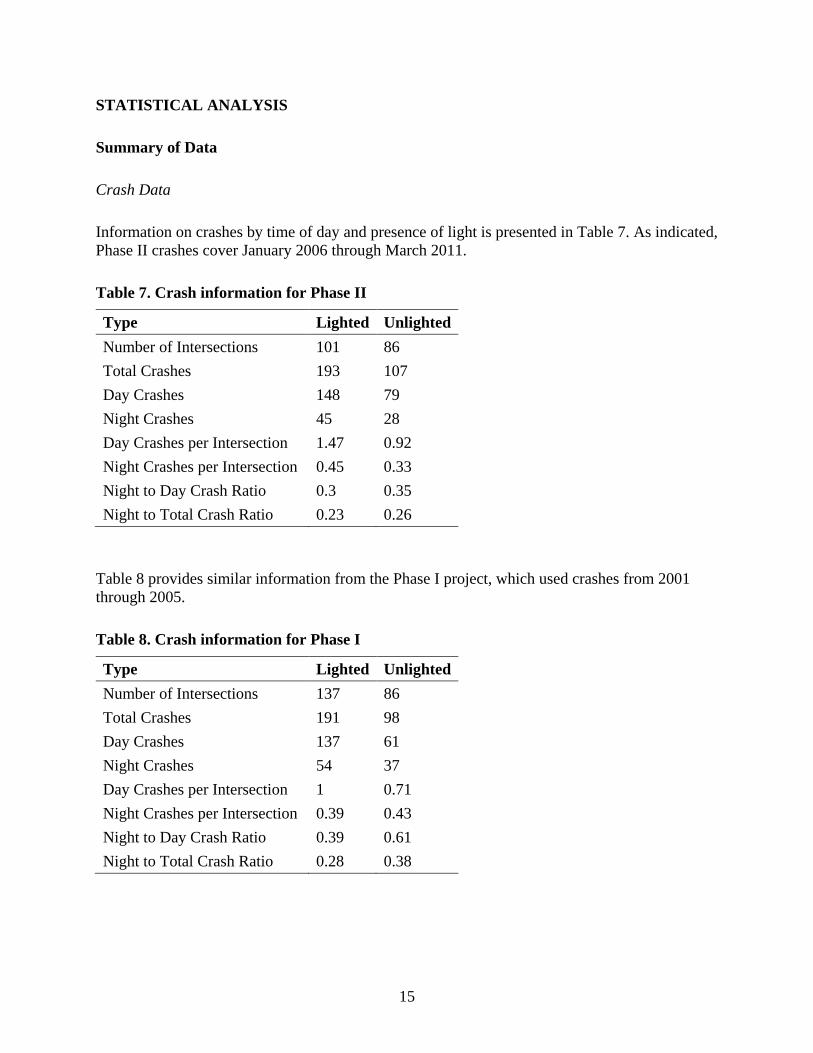
STATISTICAL ANALYSIS
Summary of Data
Crash Data
Information on crashes by time of day and presence of light is presented in Table 7. As indicated,
Phase II crashes cover January 2006 through March 2011.
Table 7. Crash information for Phase II
Type Lighted Unlighted
Number of Intersections 101 86
Total Crashes 193 107
Day Crashes 148 79
Night Crashes 45 28
Day Crashes per Intersection 1.47 0.92
Night Crashes per Intersection 0.45 0.33
Night to Day Crash Ratio 0.3 0.35
Night to Total Crash Ratio 0.23 0.26
Table 8 provides similar information from the Phase I project, which used crashes from 2001
through 2005.
Table 8. Crash information for Phase I
Type Lighted Unlighted
Number of Intersections 137 86
Total Crashes 191 98
Day Crashes 137 61
Night Crashes 54 37
Day Crashes per Intersection 1 0.71
Night Crashes per Intersection 0.39 0.43
Night to Day Crash Ratio 0.39 0.61
Night to Total Crash Ratio 0.28 0.38
16
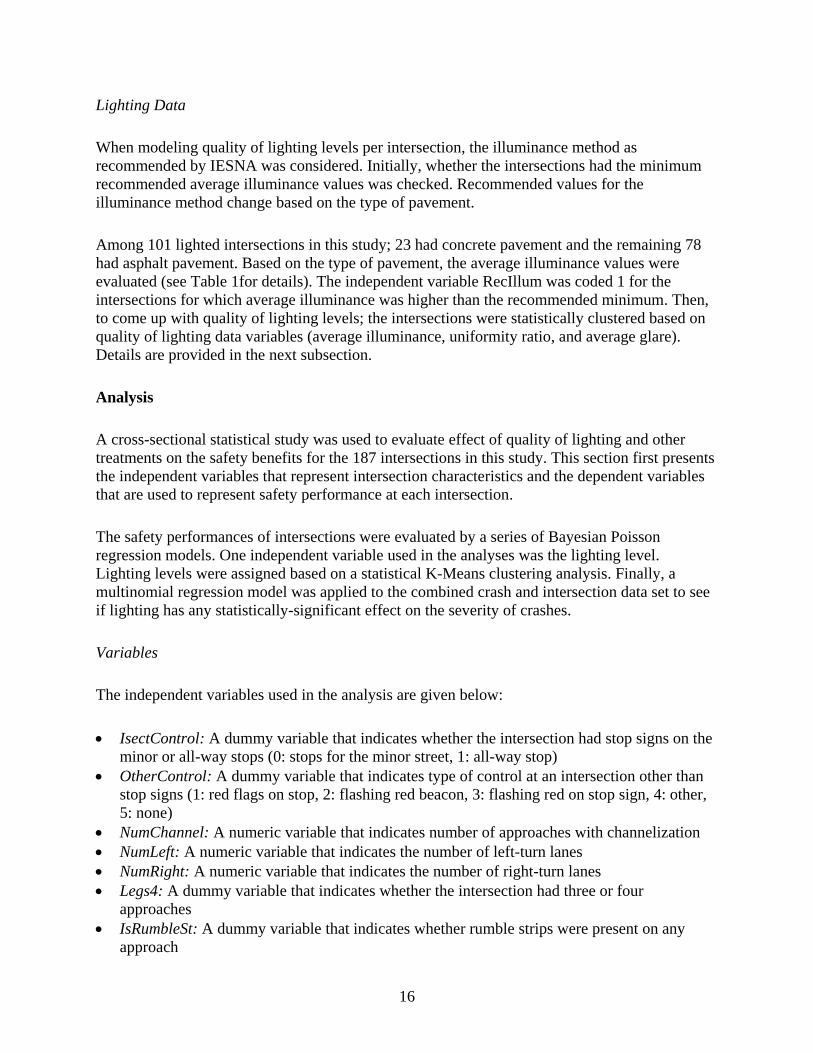
Lighting Data
When modeling quality of lighting levels per intersection, the illuminance method as
recommended by IESNA was considered. Initially, whether the intersections had the minimum
recommended average illuminance values was checked. Recommended values for the
illuminance method change based on the type of pavement.
Among 101 lighted intersections in this study; 23 had concrete pavement and the remaining 78
had asphalt pavement. Based on the type of pavement, the average illuminance values were
evaluated (see Table 1for details). The independent variable RecIllum was coded 1 for the
intersections for which average illuminance was higher than the recommended minimum. Then,
to come up with quality of lighting levels; the intersections were statistically clustered based on
quality of lighting data variables (average illuminance, uniformity ratio, and average glare).
Details are provided in the next subsection.
Analysis
A cross-sectional statistical study was used to evaluate effect of quality of lighting and other
treatments on the safety benefits for the 187 intersections in this study. This section first presents
the independent variables that represent intersection characteristics and the dependent variables
that are used to represent safety performance at each intersection.
The safety performances of intersections were evaluated by a series of Bayesian Poisson
regression models. One independent variable used in the analyses was the lighting level.
Lighting levels were assigned based on a statistical K-Means clustering analysis. Finally, a
multinomial regression model was applied to the combined crash and intersection data set to see
if lighting has any statistically-significant effect on the severity of crashes.
Variables
The independent variables used in the analysis are given below:
IsectControl: A dummy variable that indicates whether the intersection had stop signs on the
minor or all-way stops (0: stops for the minor street, 1: all-way stop)
OtherControl: A dummy variable that indicates type of control at an intersection other than
stop signs (1: red flags on stop, 2: flashing red beacon, 3: flashing red on stop sign, 4: other,
5: none)
NumChannel: A numeric variable that indicates number of approaches with channelization
NumLeft: A numeric variable that indicates the number of left-turn lanes
NumRight: A numeric variable that indicates the number of right-turn lanes
Legs4: A dummy variable that indicates whether the intersection had three or four
approaches
IsRumbleSt: A dummy variable that indicates whether rumble strips were present on any
approach

17
LogAADT: A numeric variable equal to the log of total intersection AADT (total intersection
AADT is the sum of AADT for each approach divided by 2)
ConcPvmnt: A dummy variable that indicates whether the pavement at the intersection is
concrete or asphalt (0: Asphalt, 1: Concrete)
IsLight: A dummy variable that indicates presence of lighting at the intersection (0:
Unlighted, 1: Lighted)
NumLights: A numeric variable that indicates number of lights at the intersection
Illum: A numeric variable for the average illuminance value at the intersection (lux)
RecIllum: A dummy variable that indicates whether the intersection has the minimum
recommended illuminance value (0: below, 1: above, preferred) (only six intersections were
above the minimum recommended average illuminance value by IESNA; see Table 1 for the
recommended values)
AvgGlare: A numeric variable that indicates the average glare at the intersection
RatioUni: A numeric value that indicates uniformity ratio at the intersection
LightClstr: A dummy variable that indicates lighting cluster assigned (1: Cluster 1, lower
average illuminance and glare, 2: Cluster 2, higher average illuminance and glare, 3:
unlighted intersections)
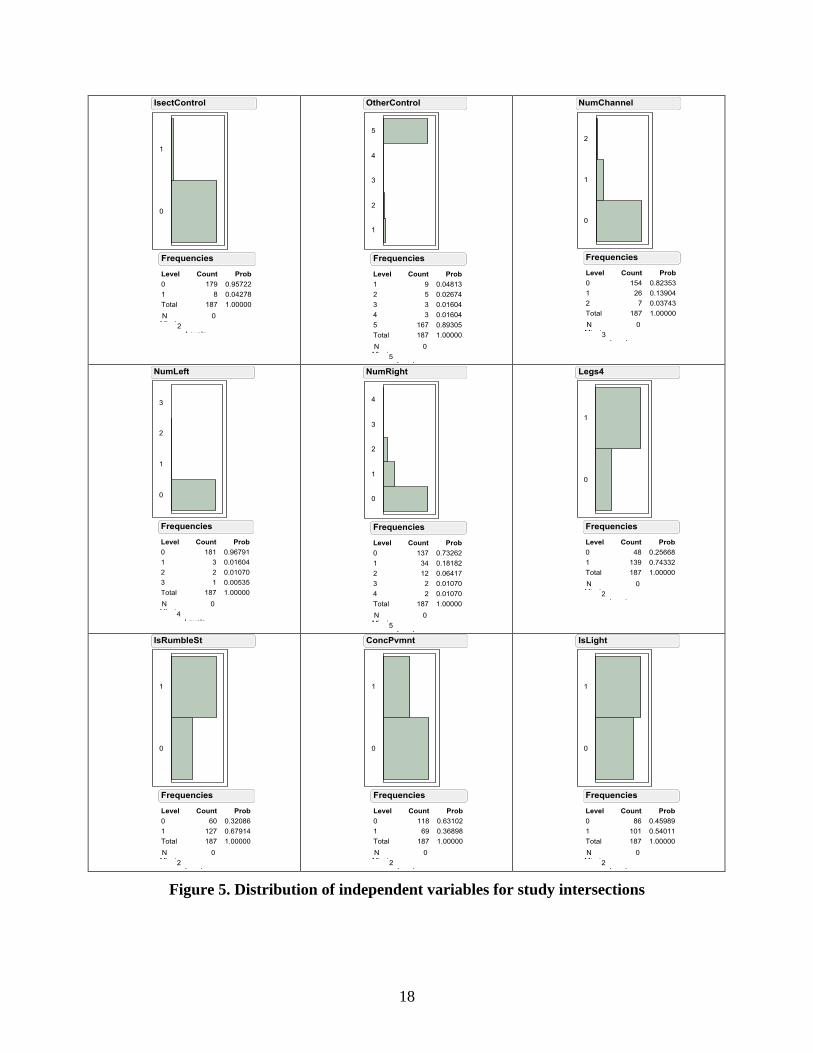
Figure 5 shows the distributions of some independent variables that are given to indicate the
frequency of the levels of intersection characteristics. Among study intersections, only eight had
all-way stop signs. Twenty intersections were observed to have other types of controls other than
stop signs. Thirty-three intersections had at least one approach with channelization and only six
intersections had left-turn lanes. Right-turn lanes were more frequent than the left turn lanes and
50 intersections had at least one right-turn lane among the study intersections. Almost 75 percent
of the intersections had four approaches and for 68 percent of the intersections, rumble strips
were present on any approach. The pavement at 118 intersections was asphalt, whereas, it was
concrete for the remaining 69 intersections. Lighted intersections were more common: 101 of
187 intersections were lighted.
The dependent variables used are as follows:
IsectNight: Number of nighttime crashes at the intersection
IsectDay: Number of daytime crashes at the intersection
IsectTotal: Number total crashes at the intersection
NightCrshRt: Nighttime crash rate at the intersection
DayCrshRt: Daytime crash rate at the intersection
TotalCrshRt: Total crash rate at the intersection
NighttoTotal: Ratio of nighttime crashes to total number of crashes
NighttoDay: Ratio of nighttime crashes to daytime crashes
CrashSev: A dummy variable that indicates crash severity (1: Fatal and major injury crashes,
2: minor injury crashes, 3: property damage only crashes)
18
Figure 5. Distribution of independent variables for study intersections

19
Crash rates defined within the dependent variables were calculated based on Equation 1
(Isebrands et al. 2006).
( )
( ) ( ) (
) (1)
where:
DEVi = Daily entering volume for an intersection (assumed to be the sum of AADT for each
approach divided by 2).
Clustering Analysis for Lighting
The K-means clustering algorithm classifies a given data set into a certain number of clusters
based on the multidimensional space of the independent variables. The algorithm first assigns
centroids for each cluster and assigns points to the nearest centroid. Then, new centroids are
calculated given the new set of cluster points. The iterative procedure continues until a metric
based on the distance between all points and their respective centroids is minimized.
For determining quality of lighting levels in this study the K-means clustering algorithm was
applied to the dataset using the SAS 9.2 statistical platform. Different numbers of clusters were
considered; however, having two clusters for lighted intersections and one for unlighted
intersections was preferred. When a higher number of clusters were considered, some clusters
ended up having too few counts to represent a lighting level.
Average illuminance, average glare, and uniformity ratio were the independent variables for this
analysis. Table 9 presents the mean values and counts for the final clusters.
Table 9. Lighting cluster analysis
Cluster Count
Character
Cluster Means
Avg.
Illuminance
Avg.
Glare
Uniformity
Ratio
1 75 Lower illuminance and glare 2.1 9.2 11.2
2 26 Higher illuminance and
glare 5.9 11.6 30.3
Cluster 1 represents the intersections with lower average illuminance, glare, and uniformity
ratios when compared with Cluster 2 intersections. As indicated, the independent variable
LightClstr was coded 1 for Cluster 1, and 2 for Cluster 2, and 3 for unlighted intersections.
20
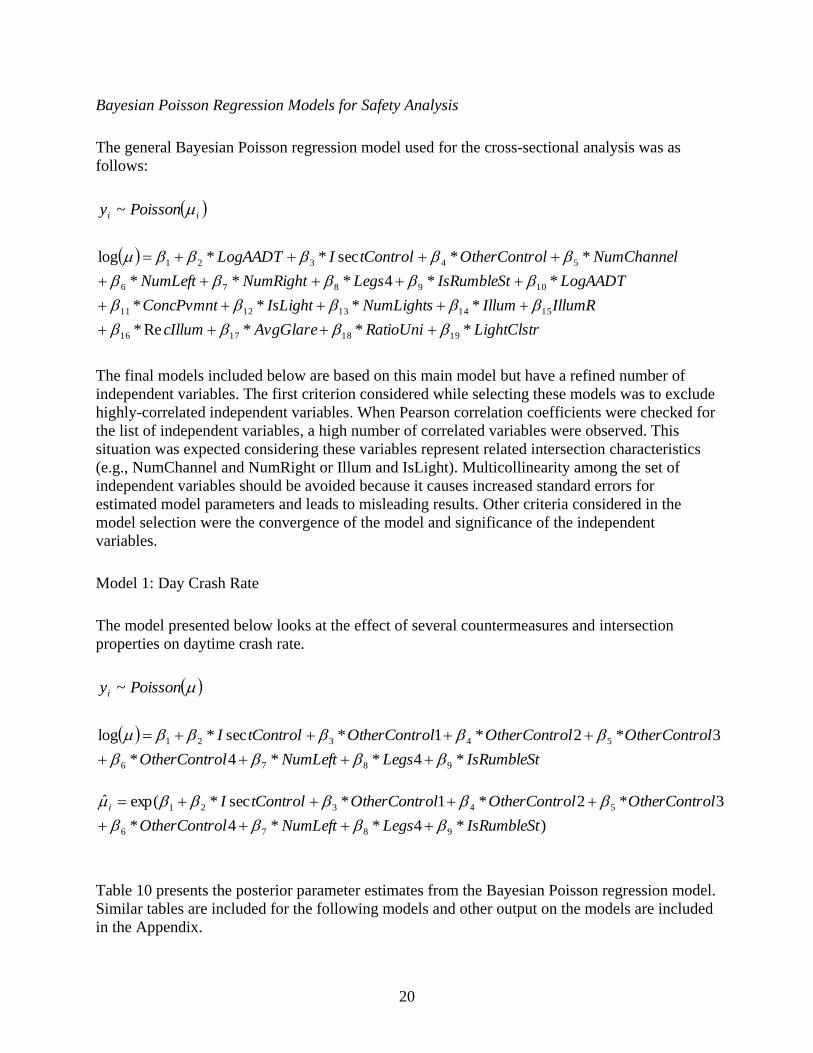
Bayesian Poisson Regression Models for Safety Analysis
The general Bayesian Poisson regression model used for the cross-sectional analysis was as
follows:
ii Poissony ~
LightClstrRatioUniAvgGlarecIllum
IllumRIllumNumLightsIsLightConcPvmnt
LogAADTIsRumbleStLegsNumRightNumLeft
NumChannelolOtherContrtControlILogAADT
***Re*
****
**4***
**sec**log
19181716
1514131211
109876
54321
The final models included below are based on this main model but have a refined number of
independent variables. The first criterion considered while selecting these models was to exclude
highly-correlated independent variables. When Pearson correlation coefficients were checked for
the list of independent variables, a high number of correlated variables were observed. This
situation was expected considering these variables represent related intersection characteristics
(e.g., NumChannel and NumRight or Illum and IsLight). Multicollinearity among the set of
independent variables should be avoided because it causes increased standard errors for
estimated model parameters and leads to misleading results. Other criteria considered in the
model selection were the convergence of the model and significance of the independent
variables.
Model 1: Day Crash Rate
The model presented below looks at the effect of several countermeasures and intersection
properties on daytime crash rate.
Poissonyi ~
IsRumbleStLegsNumLeftolOtherContr
olOtherControlOtherControlOtherContrtControlI
*4**4*
3*2*1*sec*log
9876
54321
)*4**4*
3*2*1*sec*exp(ˆ
9876
54321
IsRumbleStLegsNumLeftolOtherContr
olOtherControlOtherControlOtherContrtControlIi
Table 10 presents the posterior parameter estimates from the Bayesian Poisson regression model.
Similar tables are included for the following models and other output on the models are included
in the Appendix.

21
Table 10. Parameter estimates for day crash rate
Posterior Summaries(DayCrshRt)
Parameter N Mean
Standard
Deviation
Percentile
25% 50% 75%
β1 Intercept 10000 -0.1659 0.231 -0.3189 -0.159 -0.00672
β2 IsectControl 10000 -1.0945 1.0092 -1.6933 -0.9801 -0.3794
β3 OtherControl1* 10000 -0.02 0.7077 -0.439 0.0523 0.4709
β4 OtherControl2*,** 10000 1.401 0.5517 1.0546 1.4394 1.7802
β5 OtherControl3* 10000 1.007 0.8931 0.466 1.1103 1.6414
β6 OtherControl4* 10000 1.2123 0.9681 0.6495 1.322 1.9028
β7 NumLeft 10000 -1.3901 1.0113 -1.9659 -1.2082 -0.6408
β8 Legs4** 10000 -0.8649 0.2853 -1.0562 -0.8615 -0.6744
β9 IsRumbleSt** 10000 -0.8497 0.2691 -1.0271 -0.8482 -0.6718
*Comparison group: OtherControl5
**Significantly different from zero at 95 percent posterior probability interval
In this model, for parameters with significant positive estimates, higher day crash rates were
observed while negative estimates suggest lower day crash rates. The estimates with high
standard deviation values relative to the mean value are weak estimates.
The percentile values for the estimates give information on the distribution of the estimate. For
example, for OtherControl1, β3 is estimated at -0.02 with a standard deviation of 0.71. The
percentile values range from negative to positive values and include zero. Given the range
includes zero, the model does not suggest a relationship between OtherControl1 (red flags on
stop) and the daytime crash rate.
The weak but negative parameter estimate for IsectControl suggests reduction in day crash rates
when stop signs were present on all roads instead of only on minor roads. Positive parameter
estimates for OtherControl2-4 suggest that day crash rates are higher at intersections with
additional controls such as flashing red beacon (OtherControl2), flashing red on stop sign
(OtherControl3), or other controls (OtherControl4) versus intersections with only stop signs for
control.
The parameter estimates for Legs4 and IsRumbleSt are stronger estimates and significantly
different from zero at the 95 percent confidence level. The estimates suggest a reduction in day
crash rate when the intersections have rumble strips on any approach or when they are four-leg
intersections (with respect to three-leg intersections).
Model 2: Presence of Light
The effect of presence of lighting on safety performance was evaluated by two models. Table 11
gives the subsequent summaries for the parameters when the dependent variable is night to day
crash ratio. Expectedly, model results suggest an increasing night to day crash ratio with
increasing volume.

22
Table 11. Parameter estimates for night to day crash ratio, presence of light
Posterior Summaries(NighttoDay)
Parameter N Mean
Standard
Deviation
Percentile
25% 50% 75%
β1 Intercept* 10000 -15.6260 3.1585 -17.6692 -15.4820 -13.4437
β2 LogAADT* 10000 4.1095 0.9099 3.4808 4.0670 4.7097
β3 IsLight 10000 -0.4383 0.4104 -0.7146 -0.4466 -0.1704
β4 IsectControl 10000 -4.1801 3.5895 -6.4283 -3.4124 -1.4433
β5 OtherControl1 10000 -0.4002 1.3158 -1.1656 -0.1999 0.5482
β6 OtherControl2 10000 -1.5819 2.0461 -2.7591 -1.2187 -0.0597
β7 OtherControl3* 10000 -41.8889 24.7853 -63.4215 -41.6007 -20.7552
β8 OtherControl4 10000 -0.7568 1.3844 -1.5371 -0.5378 0.2433
*Significantly different from zero at 95 percent posterior probability interval
The parameter estimate for presence of light is negative and suggests a reduction in night to day
crash ratio at lighted intersections. However, the standard deviation is very close to the mean
value and, therefore, this is not a strong estimate. Given this, a likely reduction in the night to
day crash ratio with presence of lighting can be suggested but this relationship is weak.
The negative parameter estimate for OtherControl3 suggests that the night to day crash ratio is
lower at the intersections with flashing red on stop sign when compared with intersections with
only stop signs for control.
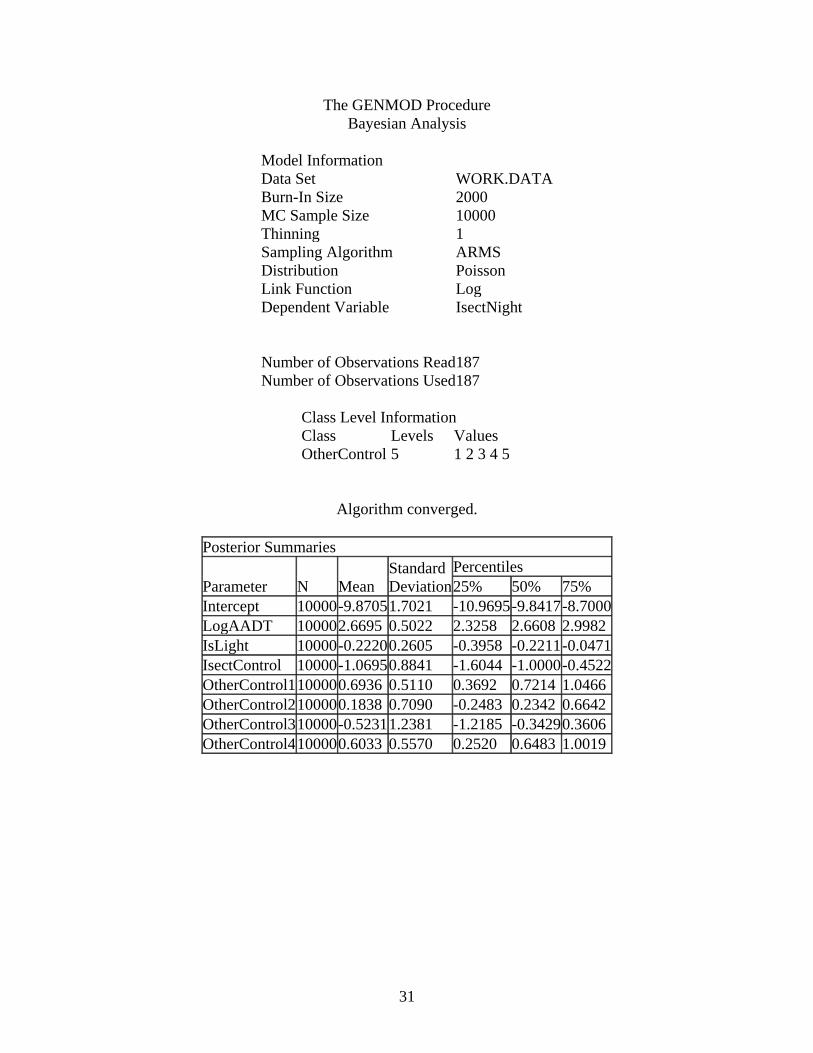
The parameter estimates when the dependent variable is the number of nighttime crashes are
presented in Table 12. IsectControl has again a negative but weak mean parameter estimate due
to the high standard deviation. The only significant parameter estimate at the 95 percent
confidence level is volume.
Table 12. Parameter estimates for number of night time crashes, presence of light
Posterior Summaries(IsectNight)
Parameter N Mean
Standard
Deviation
Percentile
25% 50% 75%
β1 Intercept* 10000 -9.8705 1.7021 -10.9695 -9.8417 -8.7000
β2 LogAADT* 10000 2.6695 0.5022 2.3258 2.6608 2.9982
β3 IsLight 10000 -0.2220 0.2605 -0.3958 -0.2211 -0.0471
β4 IsectControl 10000 -1.0695 0.8841 -1.6044 -1.0000 -0.4522
β5 OtherControl1 10000 0.6936 0.5110 0.3692 0.7214 1.0466
β6 OtherControl2 10000 0.1838 0.7090 -0.2483 0.2342 0.6642
β7 OtherControl3 10000 -0.5231 1.2381 -1.2185 -0.3429 0.3606
β8 OtherControl4 10000 0.6033 0.5570 0.2520 0.6483 1.0019
*Significantly different from zero at 95 percent posterior probability interval
23
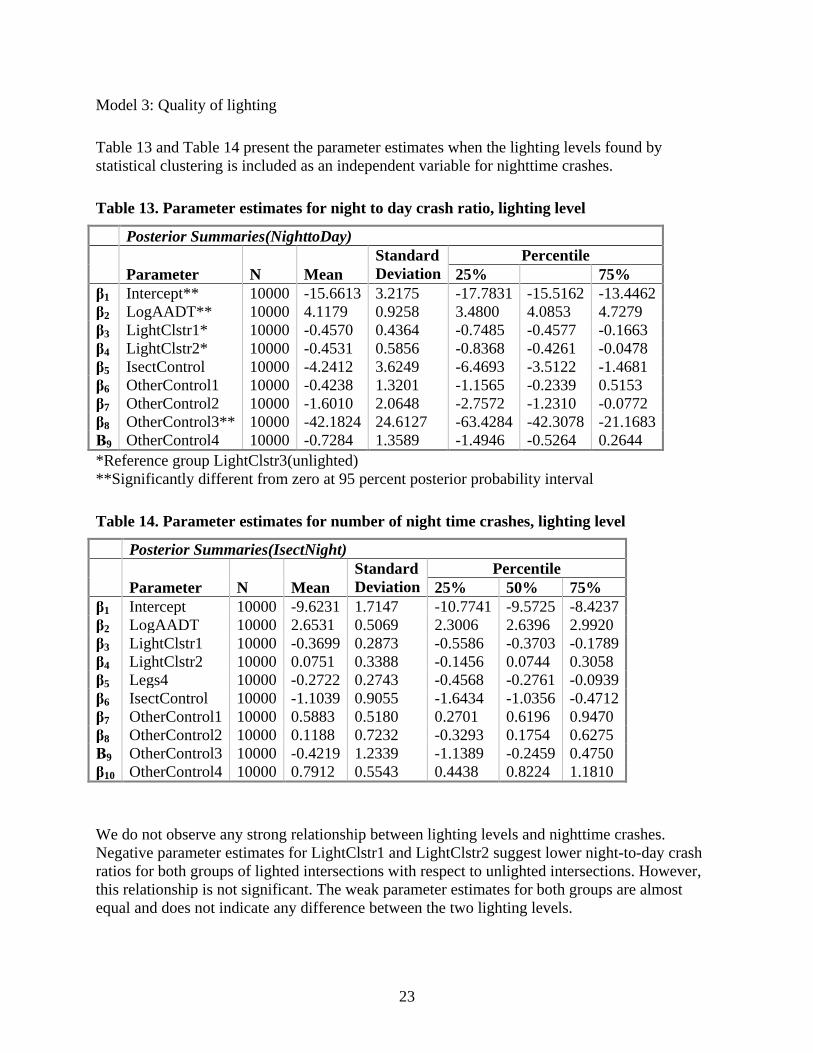
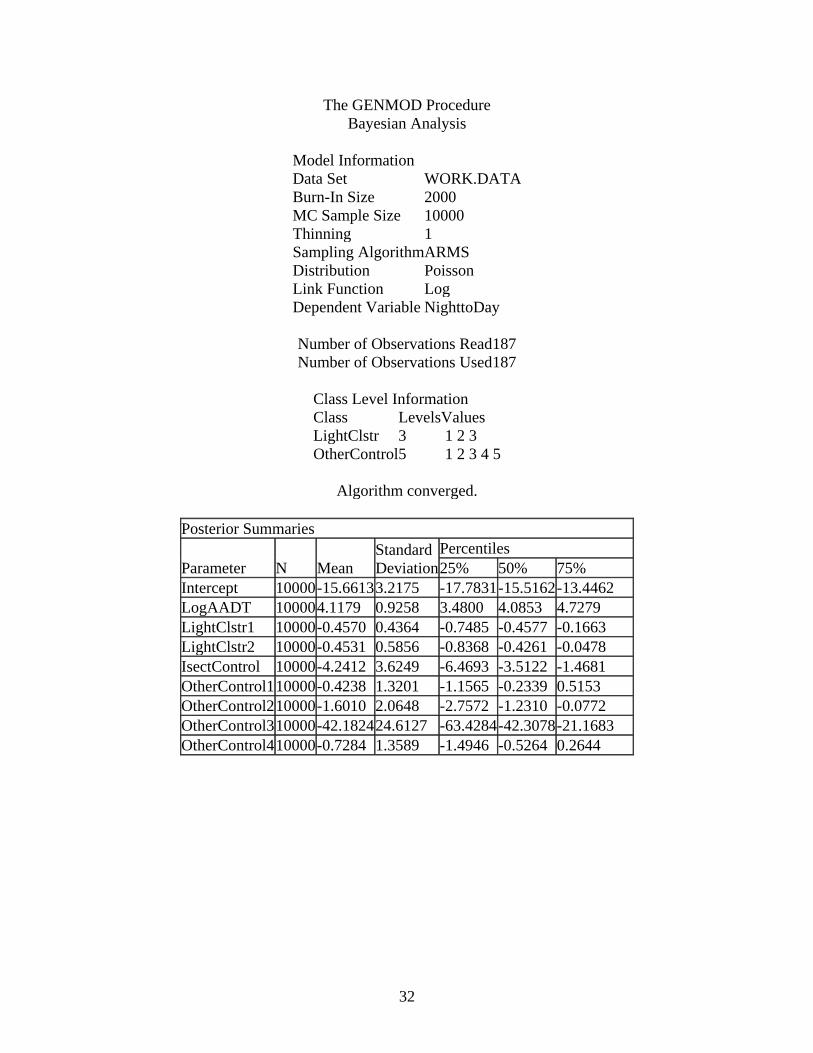
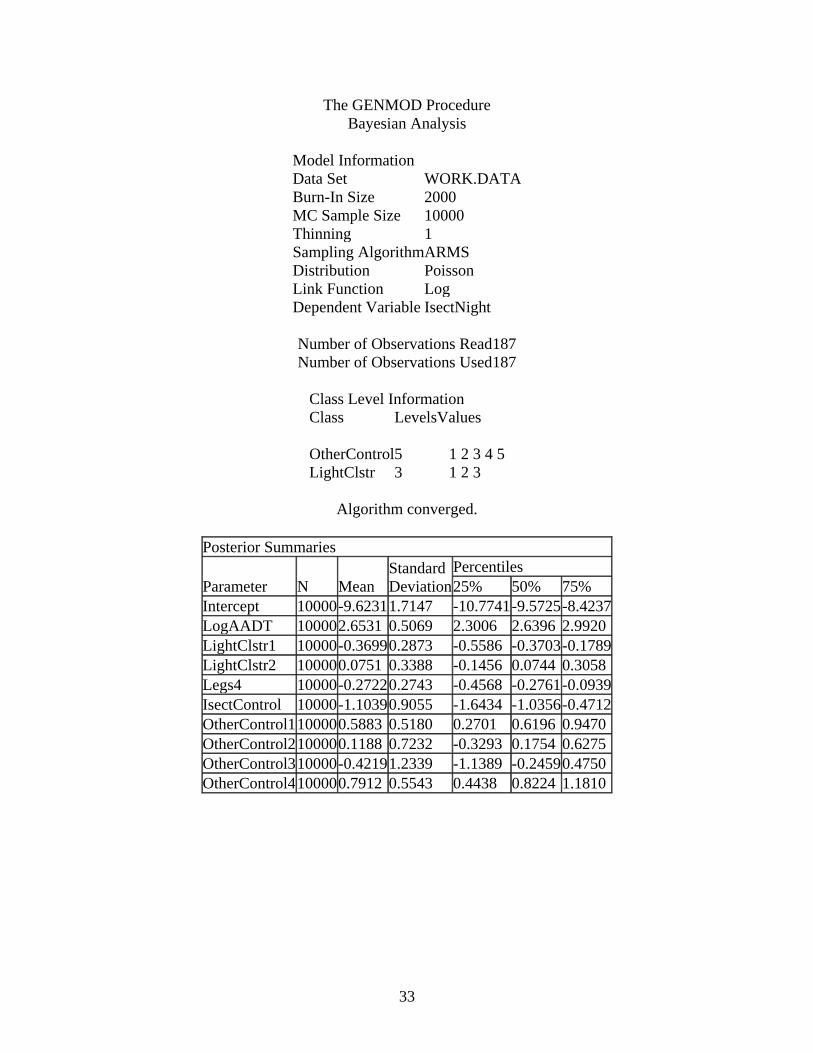
Model 3: Quality of lighting
Table 13 and Table 14 present the parameter estimates when the lighting levels found by
statistical clustering is included as an independent variable for nighttime crashes.
Table 13. Parameter estimates for night to day crash ratio, lighting level
Posterior Summaries(NighttoDay)
Parameter N Mean
Standard
Deviation
Percentile
25% 75%
β1 Intercept** 10000 -15.6613 3.2175 -17.7831 -15.5162 -13.4462
β2 LogAADT** 10000 4.1179 0.9258 3.4800 4.0853 4.7279
β3 LightClstr1* 10000 -0.4570 0.4364 -0.7485 -0.4577 -0.1663
β4 LightClstr2* 10000 -0.4531 0.5856 -0.8368 -0.4261 -0.0478
β5 IsectControl 10000 -4.2412 3.6249 -6.4693 -3.5122 -1.4681
β6 OtherControl1 10000 -0.4238 1.3201 -1.1565 -0.2339 0.5153
β7 OtherControl2 10000 -1.6010 2.0648 -2.7572 -1.2310 -0.0772
β8 OtherControl3** 10000 -42.1824 24.6127 -63.4284 -42.3078 -21.1683
Β9 OtherControl4 10000 -0.7284 1.3589 -1.4946 -0.5264 0.2644
*Reference group LightClstr3(unlighted)
**Significantly different from zero at 95 percent posterior probability interval
Table 14. Parameter estimates for number of night time crashes, lighting level
Posterior Summaries(IsectNight)
Parameter N Mean
Standard
Deviation
Percentile
25% 50% 75%
β1 Intercept 10000 -9.6231 1.7147 -10.7741 -9.5725 -8.4237
β2 LogAADT 10000 2.6531 0.5069 2.3006 2.6396 2.9920
β3 LightClstr1 10000 -0.3699 0.2873 -0.5586 -0.3703 -0.1789
β4 LightClstr2 10000 0.0751 0.3388 -0.1456 0.0744 0.3058
β5 Legs4 10000 -0.2722 0.2743 -0.4568 -0.2761 -0.0939
β6 IsectControl 10000 -1.1039 0.9055 -1.6434 -1.0356 -0.4712
β7 OtherControl1 10000 0.5883 0.5180 0.2701 0.6196 0.9470
β8 OtherControl2 10000 0.1188 0.7232 -0.3293 0.1754 0.6275
Β9 OtherControl3 10000 -0.4219 1.2339 -1.1389 -0.2459 0.4750
β10 OtherControl4 10000 0.7912 0.5543 0.4438 0.8224 1.1810
We do not observe any strong relationship between lighting levels and nighttime crashes.
Negative parameter estimates for LightClstr1 and LightClstr2 suggest lower night-to-day crash
ratios for both groups of lighted intersections with respect to unlighted intersections. However,
this relationship is not significant. The weak parameter estimates for both groups are almost
equal and does not indicate any difference between the two lighting levels.
24
When we look at number of nighttime crashes (Table 14); model results suggest a lower number
of nighttime crashes for lower average illuminance intersections (LightClstr1) when compared
with unlighted and higher average illuminance intersections (LightClstr2). However, a
significant relationship cannot be found due to the high standard deviations of the parameter
estimates. The only significant parameter for this model is volume.
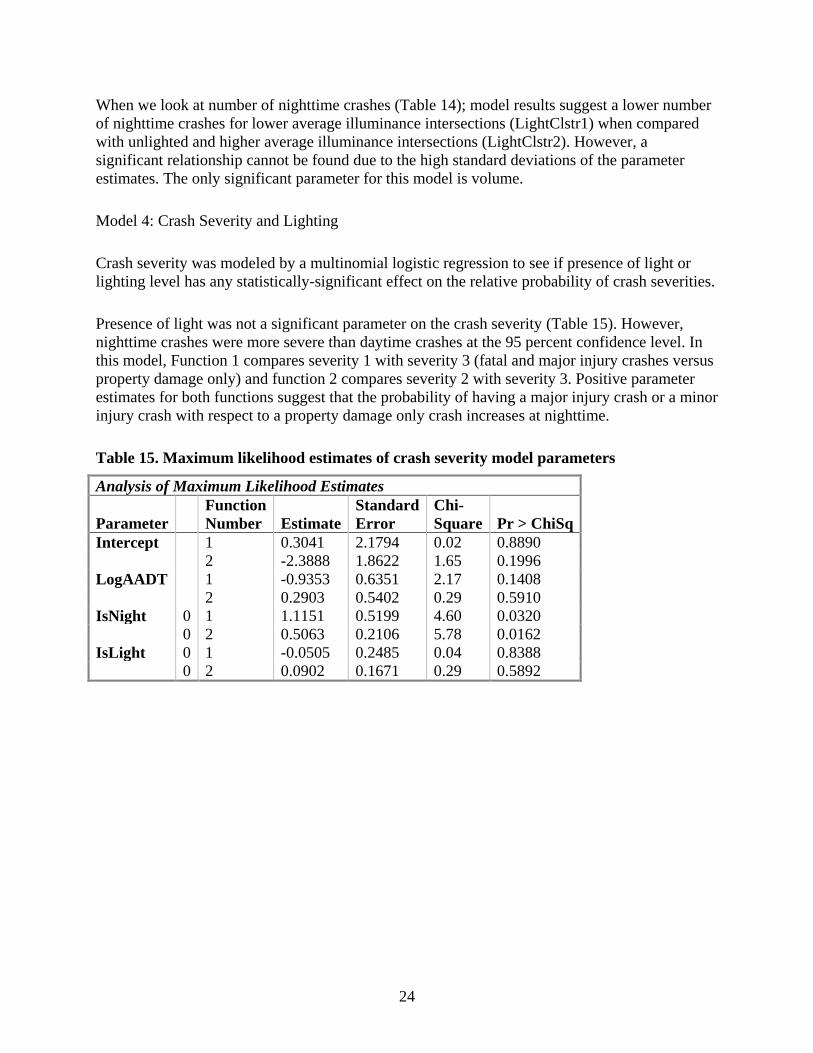
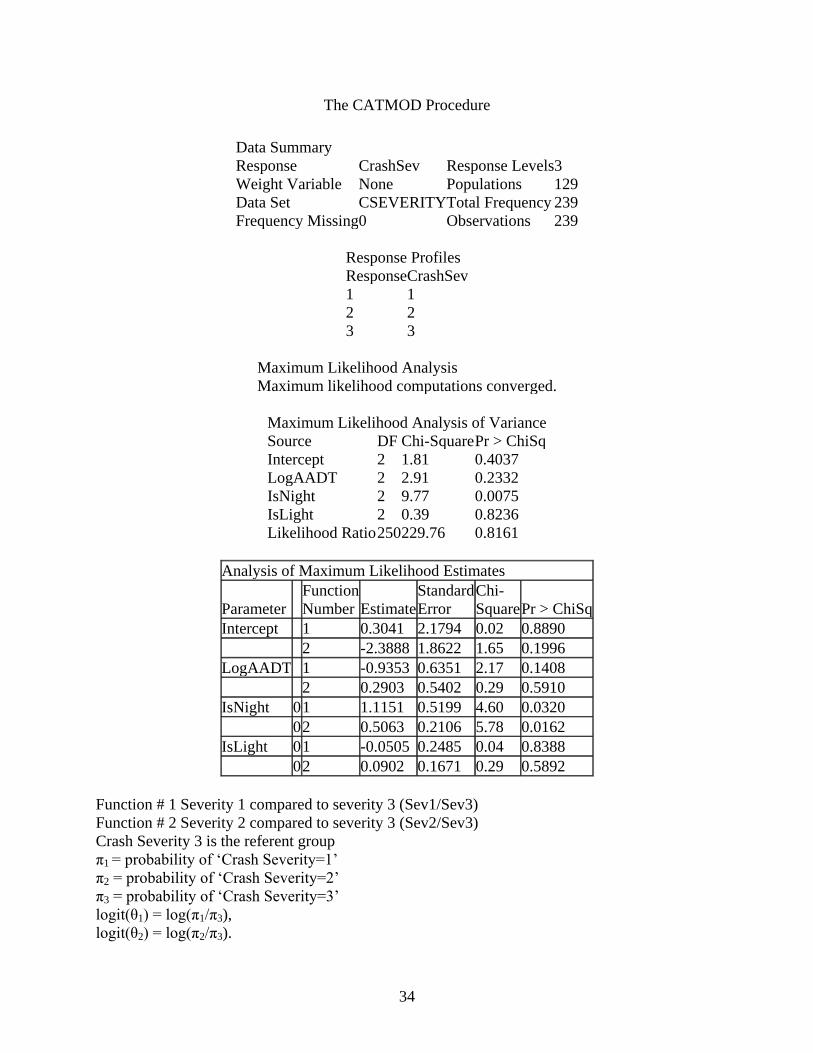
Model 4: Crash Severity and Lighting
Crash severity was modeled by a multinomial logistic regression to see if presence of light or
lighting level has any statistically-significant effect on the relative probability of crash severities.
Presence of light was not a significant parameter on the crash severity (Table 15). However,
nighttime crashes were more severe than daytime crashes at the 95 percent confidence level. In
this model, Function 1 compares severity 1 with severity 3 (fatal and major injury crashes versus
property damage only) and function 2 compares severity 2 with severity 3. Positive parameter
estimates for both functions suggest that the probability of having a major injury crash or a minor
injury crash with respect to a property damage only crash increases at nighttime.
Table 15. Maximum likelihood estimates of crash severity model parameters
Analysis of Maximum Likelihood Estimates
Parameter
Function
Number Estimate
Standard
Error
Chi-
Square Pr > ChiSq
Intercept 1 0.3041 2.1794 0.02 0.8890
2 -2.3888 1.8622 1.65 0.1996
LogAADT 1 -0.9353 0.6351 2.17 0.1408
2 0.2903 0.5402 0.29 0.5910
IsNight 0 1 1.1151 0.5199 4.60 0.0320
0 2 0.5063 0.2106 5.78 0.0162
IsLight 0 1 -0.0505 0.2485 0.04 0.8388
0 2 0.0902 0.1671 0.29 0.5892
25
Conclusions
This cross-sectional statistical study evaluated the effect of the quality of lighting and other
treatments on the safety benefits for 101 lighted rural intersections as compared to 86 unlighted
rural intersections. Based on the results of the analysis, the following conclusions can be made:
As with any study that includes field data and limited resources, there are limitations on
the number of available data points, randomness of data, and ranges of data values
(number of crashes, light levels, volume, and intersection control).
For all but nine of the lighted intersections, the measured illuminance levels were below
the recommended values and this limits the robustness of the cluster analysis and results
in the inability to contrast different illuminance ranges.
The negative parameter estimates for lower average illuminance and glare (LightClstr1)
and higher average illuminance and glare (LightClstr2) suggest lower night-to-day crash
ratios for both groups of lighted intersections with respect to unlighted intersections.
Model results suggest a lower number of nighttime crashes for lower average illuminance
intersections (LightClstr1) when compared with unlighted and higher average
illuminance intersections (LightClstr2). However, a significant relationship cannot be
found due to the high standard deviations of the parameter estimates and there was an
imbalance between the data sets with 75 lower illuminance intersections as opposed to
only 26 higher illuminance intersections.
Based on the findings from both the Phase I and II studies, lighted intersections experience fewer
crashes when compared to unlighted conditions. Quantifying the safety contribution of light
quality remains elusive at best. Even with the far majority of intersections falling below standard
illumination levels, the presence of lighting still made a significant impact on safety when
compared to non-lighted locations.

27
REFERENCES
Box, P.C. 1976. "Effect of lighting reduction on an urban major route." Traffic Engineering no.
46:26-27.
Elvik, R., and T. Vaa. 2004. Handbook of Road Safety Measures: Elsevier, Oxford, United
Kingdom.
Hallmark, S., N. Hawkins, O. Smadi, C. Kinsenbaw, M. Orellana, Z. Hans, and H. Isebrands.
2008. Strategies to Address Nighttime Crashes at Rural, Unsignalized Intersections.
Center for Transportation Research and Education (CTRE).
Hasson, Patrick, and Paul Lutkevich. 2002. "Roadway Lighting Revisited." Public Roads no.
May/June 2002. .
IESNA. 2005. American National Standard Practice for Roadway Lighting, ANSI / IESNA RP-8-
00. New York.
Isebrands, Hillary, Shauna Hallmark, Zach Hans, Tom McDonald, Howard Preston, and Richard
Storm. 2006. Safety Impacts Of Street Lighting at Isolated Rural Intersections – Part II.
Center for Transportation Research and Education at Iowa State University.
Isebrands, Hillary N., Shauna L. Hallmark, Wen Li, Tom McDonald, Richard Storm, and
Howard Preston. 2010. "Roadway Lighting Shows Safety Benefits at Rural
Intersections." Journal of Transportation Engineering no. 136 (11):949-955. doi:
10.1061/(asce)te.1943-5436.0000161.
Kim, Do-Gyeong, Simon Washington, and Jutaek Oh. 2006. "Modeling Crash Types: New
Insights into the Effects of Covariates on Crashes at Rural Intersections." Journal of
Transportation Engineering no. 132 (4):282-292. doi: 10.1061/(asce)0733-
947x(2006)132:4(282).
Monsere, Christopher M., and Edward L. Fischer. 2008. "Safety effects of reducing freeway
illumination for energy conservation." Accident Analysis & Prevention no. 40 (5):1773-
1780. doi: 10.1016/j.aap.2008.06.018.
Opiela, Kenneth, Carl K. Andersen, and Greg Schertz. 2003. "Driving After Dark." Public Roads
no. January/February 2003.
Richards, S.H. 1981. "Effects of turning off selected roadway lighting as an energy conservation
measure." Transportation Research Record: Journal of the TransportationResearch
Board no. 811:23-25.
USDOT. 2003. Traffic Safety Facts 2003. US Department of Transportation and National
Highway Traffic Safety Administration.
Walker, Fred W., and S.E. Roberts. 1976. "Influence of Lighting on Accident Frequency at
Highway Intersections." Transportation Research Record no. 562:73-78.
Wortman, R.H., E. Lipinski, L.B. Fricke, W.P. Grimwade, and A.F. Kyle. 1972. Development of
Warrants for Rural At-Grade Intersection Illumination. In Illinois Cooperative Highway
Research Program Series No. 135: University of Illinois.


29
APPENDIX
The GENMOD Procedure
Bayesian Analysis
Model Information
Data Set WORK.DATA
Burn-In Size 2000
MC Sample Size 10000
Thinning 1
Sampling Algorithm ARMS
Distribution Poisson
Link Function Log
Dependent Variable DayCrshRt
Number of Observations Read 187
Number of Observations Used 187
Class Level Information
Class Levels Values
OtherControl 5 1 2 3 4 5
Algorithm converged.
Posterior Summaries
Parameter N Mean
Standard
Deviation
Percentiles
25% 50% 75%
Intercept 10000 -0.1659 0.2310 -0.3189 -0.1590 -0.00672
IsectControl 10000 -1.0945 1.0092 -1.6933 -0.9801 -0.3794
OtherControl1 10000 -0.0200 0.7077 -0.4390 0.0523 0.4709
OtherControl2 10000 1.4010 0.5517 1.0546 1.4394 1.7802
OtherControl3 10000 1.0070 0.8931 0.4660 1.1103 1.6414
OtherControl4 10000 1.2123 0.9681 0.6495 1.3220 1.9028
NumLeft 10000 -1.3901 1.0113 -1.9659 -1.2082 -0.6408
Legs4 10000 -0.8649 0.2853 -1.0562 -0.8615 -0.6744
IsRumbleSt 10000 -0.8497 0.2691 -1.0271 -0.8482 -0.6718
30
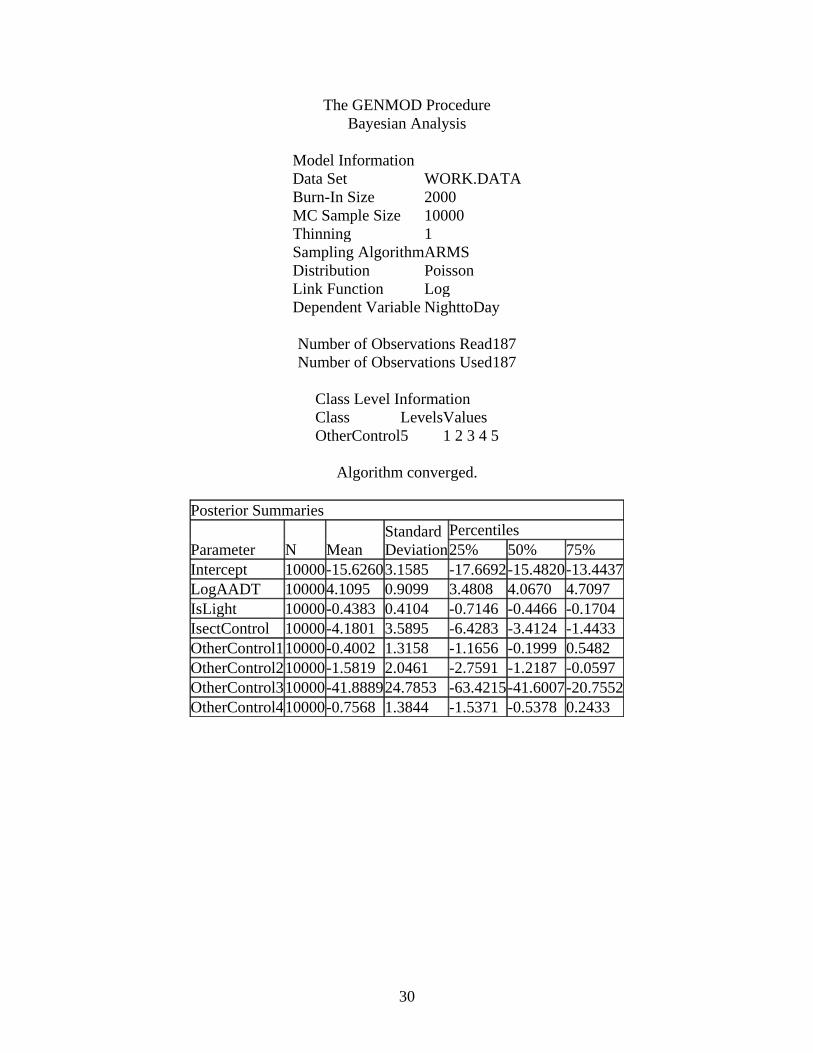
The GENMOD Procedure
Bayesian Analysis
Model Information
Data Set WORK.DATA
Burn-In Size 2000
MC Sample Size 10000
Thinning 1
Sampling Algorithm ARMS
Distribution Poisson
Link Function Log
Dependent Variable NighttoDay
Number of Observations Read 187
Number of Observations Used 187
Class Level Information
Class Levels Values
OtherControl 5 1 2 3 4 5
Algorithm converged.
Posterior Summaries
Parameter N Mean
Standard
Deviation
Percentiles
25% 50% 75%
Intercept 10000 -15.6260 3.1585 -17.6692 -15.4820 -13.4437
LogAADT 10000 4.1095 0.9099 3.4808 4.0670 4.7097
IsLight 10000 -0.4383 0.4104 -0.7146 -0.4466 -0.1704
IsectControl 10000 -4.1801 3.5895 -6.4283 -3.4124 -1.4433
OtherControl1 10000 -0.4002 1.3158 -1.1656 -0.1999 0.5482
OtherControl2 10000 -1.5819 2.0461 -2.7591 -1.2187 -0.0597
OtherControl3 10000 -41.8889 24.7853 -63.4215 -41.6007 -20.7552
OtherControl4 10000 -0.7568 1.3844 -1.5371 -0.5378 0.2433
31
The GENMOD Procedure
Bayesian Analysis
Model Information
Data Set WORK.DATA
Burn-In Size 2000
MC Sample Size 10000
Thinning 1
Sampling Algorithm ARMS
Distribution Poisson
Link Function Log
Dependent Variable IsectNight
Number of Observations Read 187
Number of Observations Used 187
Class Level Information
Class Levels Values
OtherControl 5 1 2 3 4 5
Algorithm converged.
Posterior Summaries
Parameter N Mean
Standard
Deviation
Percentiles
25% 50% 75%
Intercept 10000 -9.8705 1.7021 -10.9695 -9.8417 -8.7000
LogAADT 10000 2.6695 0.5022 2.3258 2.6608 2.9982
IsLight 10000 -0.2220 0.2605 -0.3958 -0.2211 -0.0471
IsectControl 10000 -1.0695 0.8841 -1.6044 -1.0000 -0.4522
OtherControl1 10000 0.6936 0.5110 0.3692 0.7214 1.0466
OtherControl2 10000 0.1838 0.7090 -0.2483 0.2342 0.6642
OtherControl3 10000 -0.5231 1.2381 -1.2185 -0.3429 0.3606
OtherControl4 10000 0.6033 0.5570 0.2520 0.6483 1.0019
32
The GENMOD Procedure
Bayesian Analysis
Model Information
Data Set WORK.DATA
Burn-In Size 2000
MC Sample Size 10000
Thinning 1
Sampling Algorithm ARMS
Distribution Poisson
Link Function Log
Dependent Variable NighttoDay
Number of Observations Read 187
Number of Observations Used 187
Class Level Information
Class Levels Values
LightClstr 3 1 2 3
OtherControl 5 1 2 3 4 5
Algorithm converged.
Posterior Summaries
Parameter N Mean
Standard
Deviation
Percentiles
25% 50% 75%
Intercept 10000 -15.6613 3.2175 -17.7831 -15.5162 -13.4462
LogAADT 10000 4.1179 0.9258 3.4800 4.0853 4.7279
LightClstr1 10000 -0.4570 0.4364 -0.7485 -0.4577 -0.1663
LightClstr2 10000 -0.4531 0.5856 -0.8368 -0.4261 -0.0478
IsectControl 10000 -4.2412 3.6249 -6.4693 -3.5122 -1.4681
OtherControl1 10000 -0.4238 1.3201 -1.1565 -0.2339 0.5153
OtherControl2 10000 -1.6010 2.0648 -2.7572 -1.2310 -0.0772
OtherControl3 10000 -42.1824 24.6127 -63.4284 -42.3078 -21.1683
OtherControl4 10000 -0.7284 1.3589 -1.4946 -0.5264 0.2644
33
The GENMOD Procedure
Bayesian Analysis
Model Information
Data Set WORK.DATA
Burn-In Size 2000
MC Sample Size 10000
Thinning 1
Sampling Algorithm ARMS
Distribution Poisson
Link Function Log
Dependent Variable IsectNight
Number of Observations Read 187
Number of Observations Used 187
Class Level Information
Class Levels Values
OtherControl 5 1 2 3 4 5
LightClstr 3 1 2 3
Algorithm converged.
Posterior Summaries
Parameter N Mean
Standard
Deviation
Percentiles
25% 50% 75%
Intercept 10000 -9.6231 1.7147 -10.7741 -9.5725 -8.4237
LogAADT 10000 2.6531 0.5069 2.3006 2.6396 2.9920
LightClstr1 10000 -0.3699 0.2873 -0.5586 -0.3703 -0.1789
LightClstr2 10000 0.0751 0.3388 -0.1456 0.0744 0.3058
Legs4 10000 -0.2722 0.2743 -0.4568 -0.2761 -0.0939
IsectControl 10000 -1.1039 0.9055 -1.6434 -1.0356 -0.4712
OtherControl1 10000 0.5883 0.5180 0.2701 0.6196 0.9470
OtherControl2 10000 0.1188 0.7232 -0.3293 0.1754 0.6275
OtherControl3 10000 -0.4219 1.2339 -1.1389 -0.2459 0.4750
OtherControl4 10000 0.7912 0.5543 0.4438 0.8224 1.1810
34
The CATMOD Procedure
Data Summary
Response CrashSev Response Levels 3
Weight Variable None Populations 129
Data Set CSEVERITY Total Frequency 239
Frequency Missing 0 Observations 239
Response Profiles
Response CrashSev
1 1
2 2
3 3
Maximum Likelihood Analysis
Maximum likelihood computations converged.
Maximum Likelihood Analysis of Variance
Source DF Chi-Square Pr > ChiSq
Intercept 2 1.81 0.4037
LogAADT 2 2.91 0.2332
IsNight 2 9.77 0.0075
IsLight 2 0.39 0.8236
Likelihood Ratio 250 229.76 0.8161
Analysis of Maximum Likelihood Estimates
Parameter
Function
Number Estimate
Standard
Error
Chi-
Square Pr > ChiSq
Intercept 1 0.3041 2.1794 0.02 0.8890
2 -2.3888 1.8622 1.65 0.1996
LogAADT 1 -0.9353 0.6351 2.17 0.1408
2 0.2903 0.5402 0.29 0.5910
IsNight 0 1 1.1151 0.5199 4.60 0.0320
0 2 0.5063 0.2106 5.78 0.0162
IsLight 0 1 -0.0505 0.2485 0.04 0.8388
0 2 0.0902 0.1671 0.29 0.5892
Function # 1 Severity 1 compared to severity 3 (Sev1/Sev3)
Function # 2 Severity 2 compared to severity 3 (Sev2/Sev3)
Crash Severity 3 is the referent group
π1 = probability of ‘Crash Severity=1’
π2 = probability of ‘Crash Severity=2’
π3 = probability of ‘Crash Severity=3’
logit(θ1) = log(π1/π3),
logit(θ2) = log(π2/π3).