Embed Size (px)
Citation preview

Restricted - Confidential Information
© GSMA 2011
All GSMA meetings are conducted in full compliance with the GSMA’s anti-trust compliance policy
CONFIDENTIAL - GSMA
Roaming in Sub Saharan Africa
May 2012 Cotonou, Benin
SG3 Seminar
Vikram Raval - Roaming Regulation
2
Agenda
• Overview of African roaming situation
• Regional challenges to roaming market
development
• Market trends and opportunities
• Risk of regulating roaming
• Key Takeaways
3
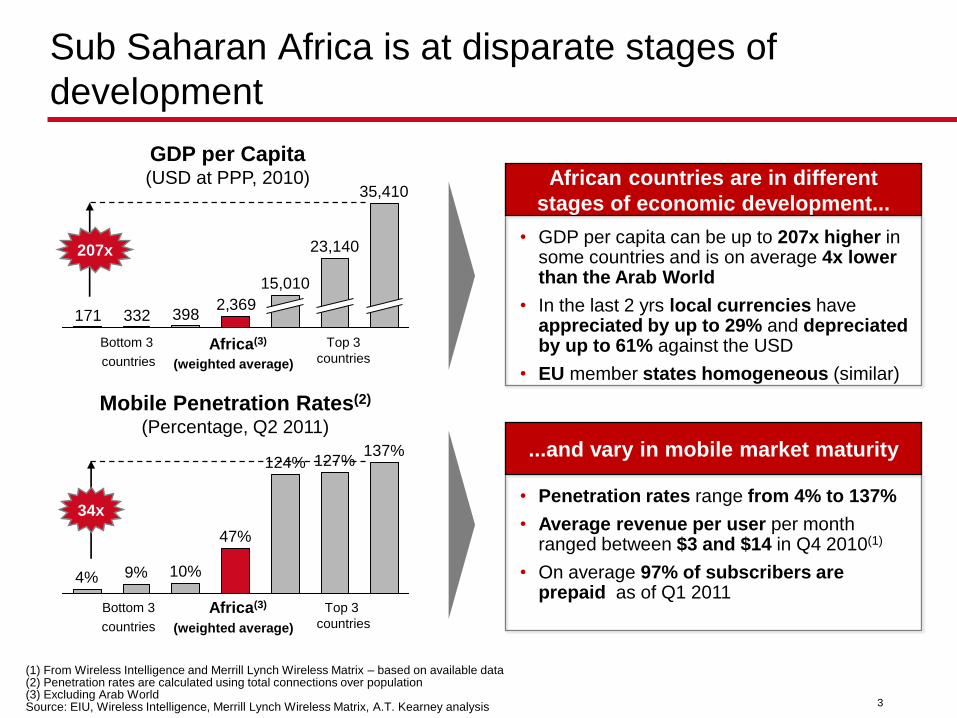
• GDP per capita can be up to 207x higher in some countries and is on average 4x lower than the Arab World
• In the last 2 yrs local currencies have appreciated by up to 29% and depreciated by up to 61% against the USD
• EU member states homogeneous (similar)
African countries are in different
stages of economic development...
Sub Saharan Africa is at disparate stages of
development
• Penetration rates range from 4% to 137%
• Average revenue per user per month ranged between $3 and $14 in Q4 2010(1)
• On average 97% of subscribers are prepaid as of Q1 2011
...and vary in mobile market maturity
(1) From Wireless Intelligence and Merrill Lynch Wireless Matrix – based on available data (2) Penetration rates are calculated using total connections over population (3) Excluding Arab World Source: EIU, Wireless Intelligence, Merrill Lynch Wireless Matrix, A.T. Kearney analysis
Mobile Penetration Rates(2) (Percentage, Q2 2011)
GDP per Capita (USD at PPP, 2010)
3983321712,369
35,410
23,140
15,010
Top 3
countries
Bottom 3
countries
207x
127%
10% 4% 9%
47%
124% 137%
34x
(weighted average)
Africa(3)
(weighted average)
Top 3
countries
Bottom 3
countries
Africa(3)
4
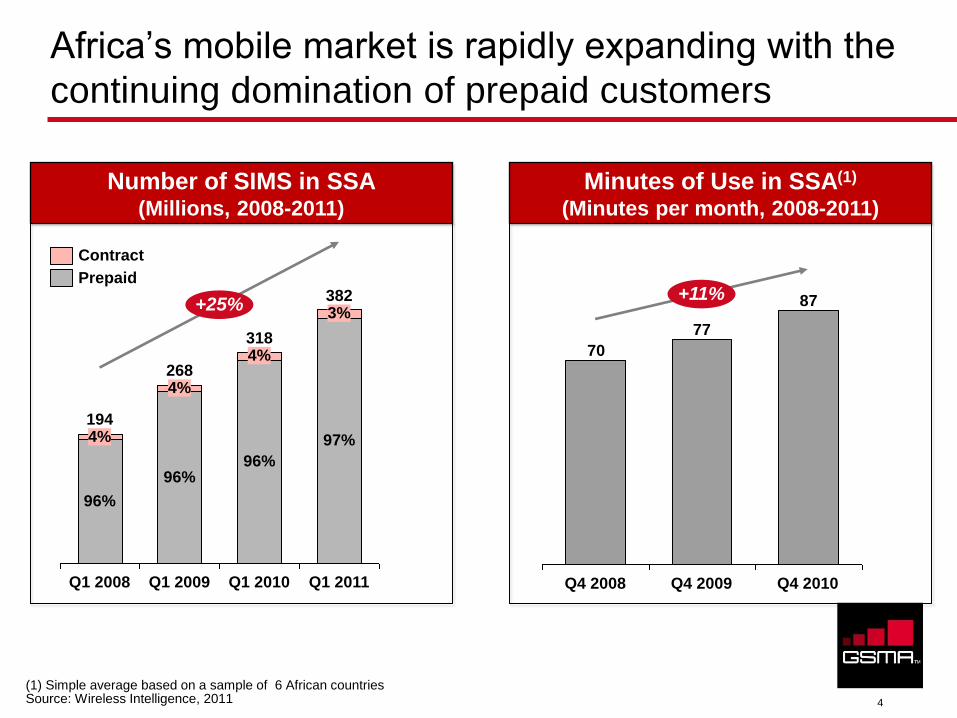
Africa’s mobile market is rapidly expanding with the
continuing domination of prepaid customers
4%
Q1 2009
268
96%
194
96%
4%
4%
Q1 2008 Q1 2010
318
96%
+25%
Q1 2011
382
97%
3%
(1) Simple average based on a sample of 6 African countries Source: Wireless Intelligence, 2011
87
77
70
+11%
Q4 2010 Q4 2009 Q4 2008
Contract
Prepaid
Number of SIMS in SSA (Millions, 2008-2011)
Minutes of Use in SSA(1)
(Minutes per month, 2008-2011)
5
Trips originating from SSA(5)
Million trips, 2005-2010
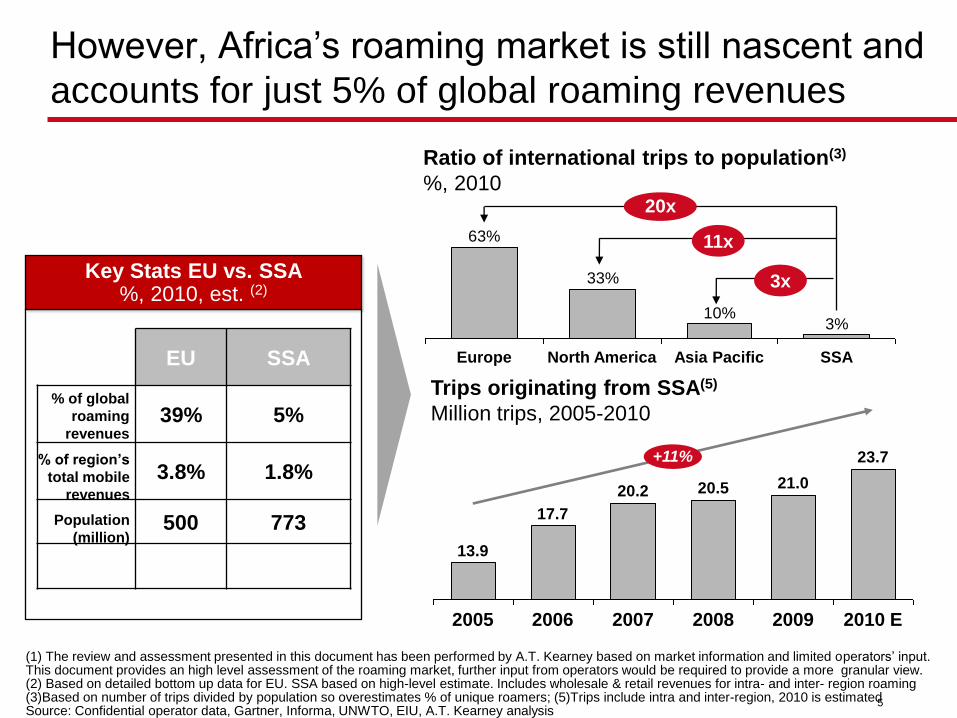
However, Africa’s roaming market is still nascent and
accounts for just 5% of global roaming revenues
(1) The review and assessment presented in this document has been performed by A.T. Kearney based on market information and limited operators’ input. This document provides an high level assessment of the roaming market, further input from operators would be required to provide a more granular view. (2) Based on detailed bottom up data for EU. SSA based on high-level estimate. Includes wholesale & retail revenues for intra- and inter- region roaming (3)Based on number of trips divided by population so overestimates % of unique roamers; (5)Trips include intra and inter-region, 2010 is estimated Source: Confidential operator data, Gartner, Informa, UNWTO, EIU, A.T. Kearney analysis
EU SSA
39% 5%
3.8% 1.8%
500 773 Population
(million)
% of global
roaming
revenues
% of region’s
total mobile
revenues
Key Stats EU vs. SSA %, 2010, est. (2)
Ratio of international trips to population(3)
%, 2010
3%10%
33%
63%
20x
SSA Asia Pacific North America Europe
11x
3x
+11%
2010 E
23.7
2009
21.0
2008
20.5
2007
20.2
2006
17.7
2005
13.9

6
Agenda
• Overview of African roaming situation
• Regional challenges to roaming
market development
• Market trends and opportunities
• Risk of regulating roaming
• Key Takeaways

7
Even with widespread use of roaming, prices could
remain high on routes with monopolised IGW’s
IGW: International Gateway (1) Based on ITU 2005-2010 data. Sample for Sub Saharan Africa based on 31 countries – data not available for 12 Source: ITU, GSMA Gateway Liberalisation Report 2007
• Around 2/3 of roaming calls are international
calls back home
• Although there has been much improvement
in the level of competition, international
gateway monopolies still exist in at least 56%
of African countries
International gateway status(1)
EU
82%
11%
7%
Africa
42%
35%
23%
Liberalised
Partially
liberalised
Monopoly
• IOT’s for monopolised roaming routes are
likely to remain high
• Even with volume growth, there is no
bargaining power for operators whilst
gateways are not liberalised
• International roaming call prices between
Arab countries with liberalised gateways
are significantly lower than between Arab
countries with gateway monopolies. We would
expect the same to occur with liberalisation in
Africa
IGW status in Africa
Implications for end-users
8
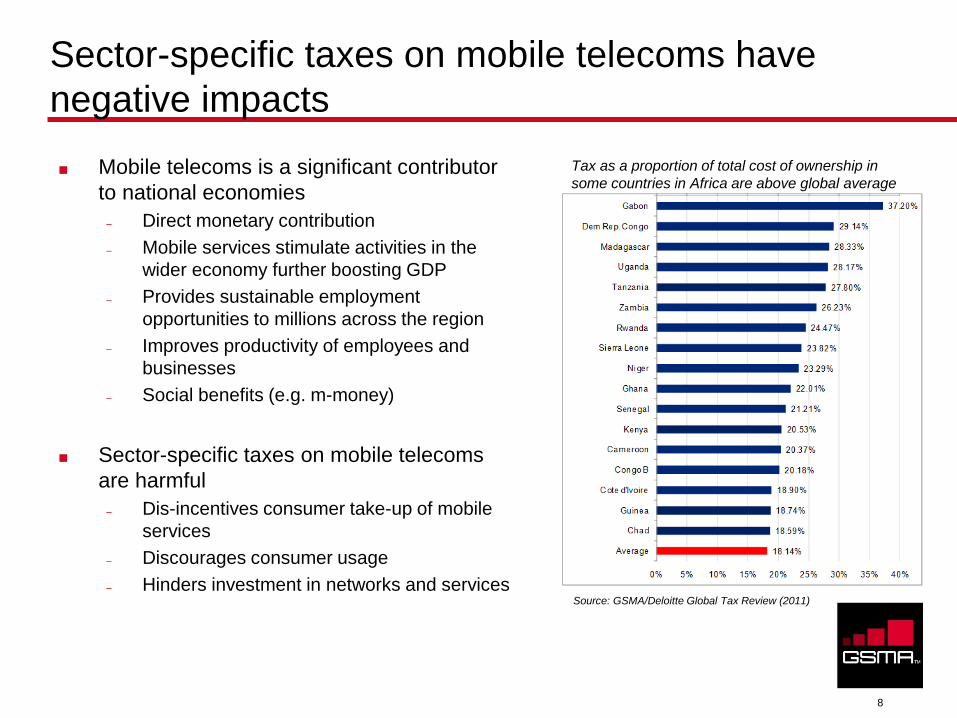
Sector-specific taxes on mobile telecoms have
negative impacts
Mobile telecoms is a significant contributor
to national economies
– Direct monetary contribution
– Mobile services stimulate activities in the
wider economy further boosting GDP
– Provides sustainable employment
opportunities to millions across the region
– Improves productivity of employees and
businesses
– Social benefits (e.g. m-money)
Sector-specific taxes on mobile telecoms
are harmful
– Dis-incentives consumer take-up of mobile
services
– Discourages consumer usage
– Hinders investment in networks and services
Tax as a proportion of total cost of ownership in
some countries in Africa are above global average
Source: GSMA/Deloitte Global Tax Review (2011)
9
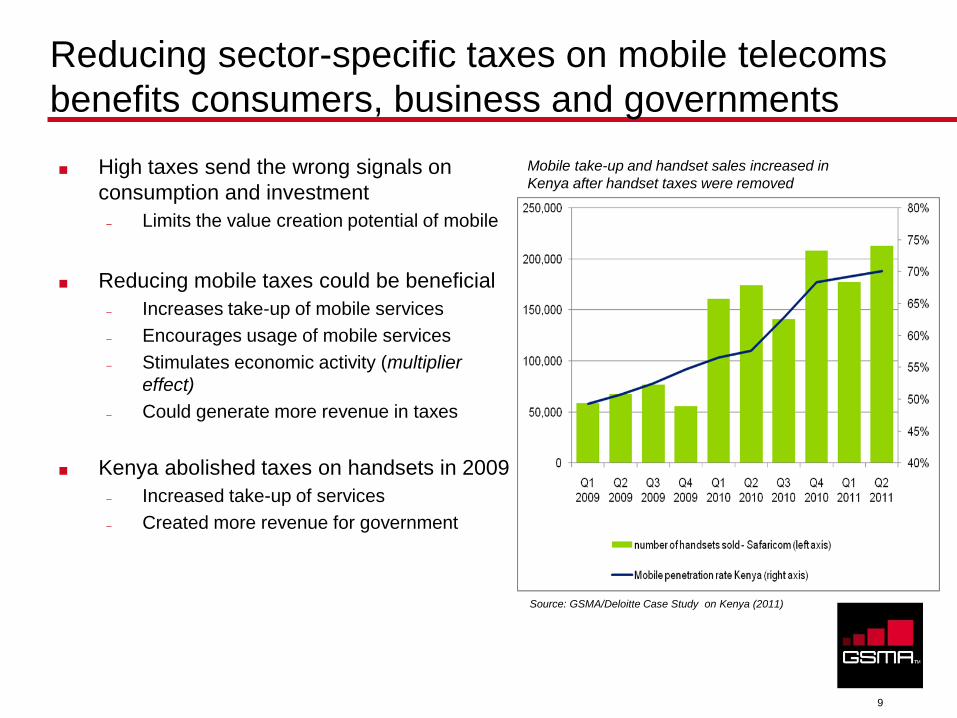
Reducing sector-specific taxes on mobile telecoms
benefits consumers, business and governments
High taxes send the wrong signals on
consumption and investment
– Limits the value creation potential of mobile
Reducing mobile taxes could be beneficial
– Increases take-up of mobile services
– Encourages usage of mobile services
– Stimulates economic activity (multiplier
effect)
– Could generate more revenue in taxes
Kenya abolished taxes on handsets in 2009
– Increased take-up of services
– Created more revenue for government
Mobile take-up and handset sales increased in
Kenya after handset taxes were removed
Source: GSMA/Deloitte Case Study on Kenya (2011)
10
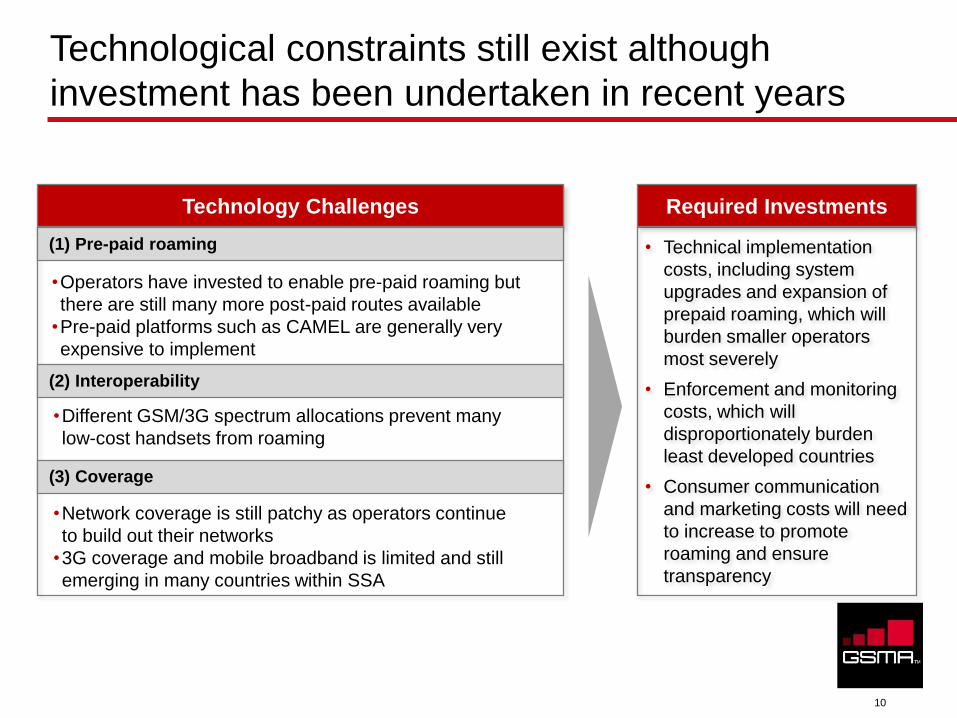
Technology Challenges
(2) Interoperability
•Different GSM/3G spectrum allocations prevent many
low-cost handsets from roaming
(3) Coverage
(1) Pre-paid roaming
•Network coverage is still patchy as operators continue
to build out their networks
•3G coverage and mobile broadband is limited and still
emerging in many countries within SSA
• Technical implementation
costs, including system
upgrades and expansion of
prepaid roaming, which will
burden smaller operators
most severely
• Enforcement and monitoring
costs, which will
disproportionately burden
least developed countries
• Consumer communication
and marketing costs will need
to increase to promote
roaming and ensure
transparency
Required Investments
Technological constraints still exist although
investment has been undertaken in recent years
•Operators have invested to enable pre-paid roaming but
there are still many more post-paid routes available
•Pre-paid platforms such as CAMEL are generally very
expensive to implement
11
Agenda
• Overview of African roaming situation
• Regional challenges to roaming market
development
• Market trends and opportunities
• Risk of regulating roaming
• Key Takeaways
12
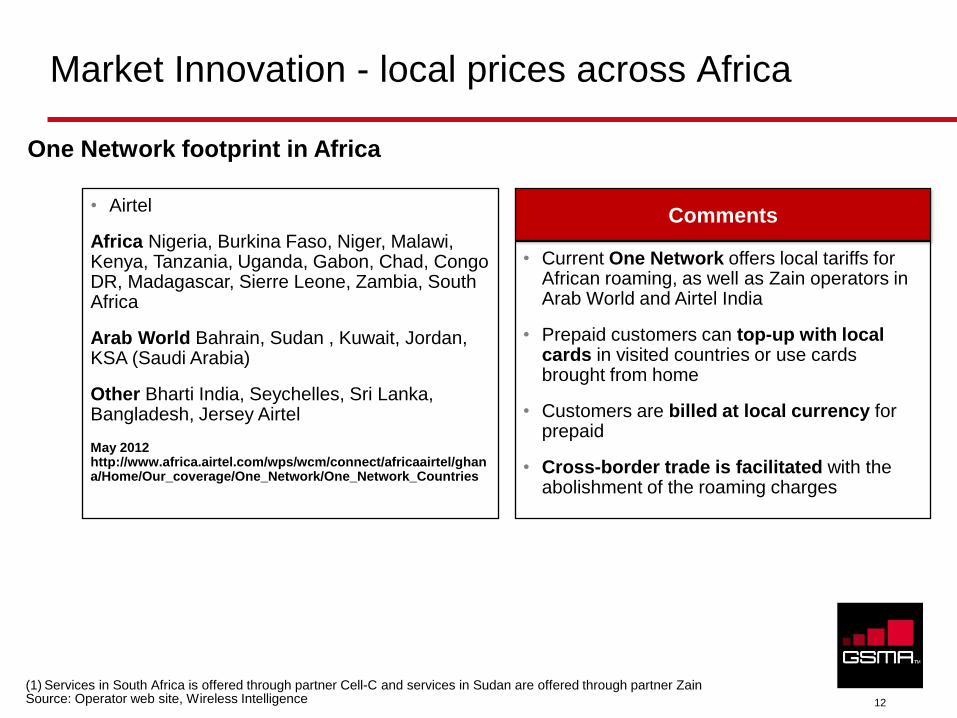
Market Innovation - local prices across Africa
Comments
• Current One Network offers local tariffs for African roaming, as well as Zain operators in Arab World and Airtel India
• Prepaid customers can top-up with local cards in visited countries or use cards brought from home
• Customers are billed at local currency for prepaid
• Cross-border trade is facilitated with the abolishment of the roaming charges
(1) Services in South Africa is offered through partner Cell-C and services in Sudan are offered through partner Zain Source: Operator web site, Wireless Intelligence
One Network footprint in Africa
• Airtel
Africa Nigeria, Burkina Faso, Niger, Malawi, Kenya, Tanzania, Uganda, Gabon, Chad, Congo DR, Madagascar, Sierre Leone, Zambia, South Africa
Arab World Bahrain, Sudan , Kuwait, Jordan, KSA (Saudi Arabia)
Other Bharti India, Seychelles, Sri Lanka, Bangladesh, Jersey Airtel
May 2012 http://www.africa.airtel.com/wps/wcm/connect/africaairtel/ghana/Home/Our_coverage/One_Network/One_Network_Countries
13
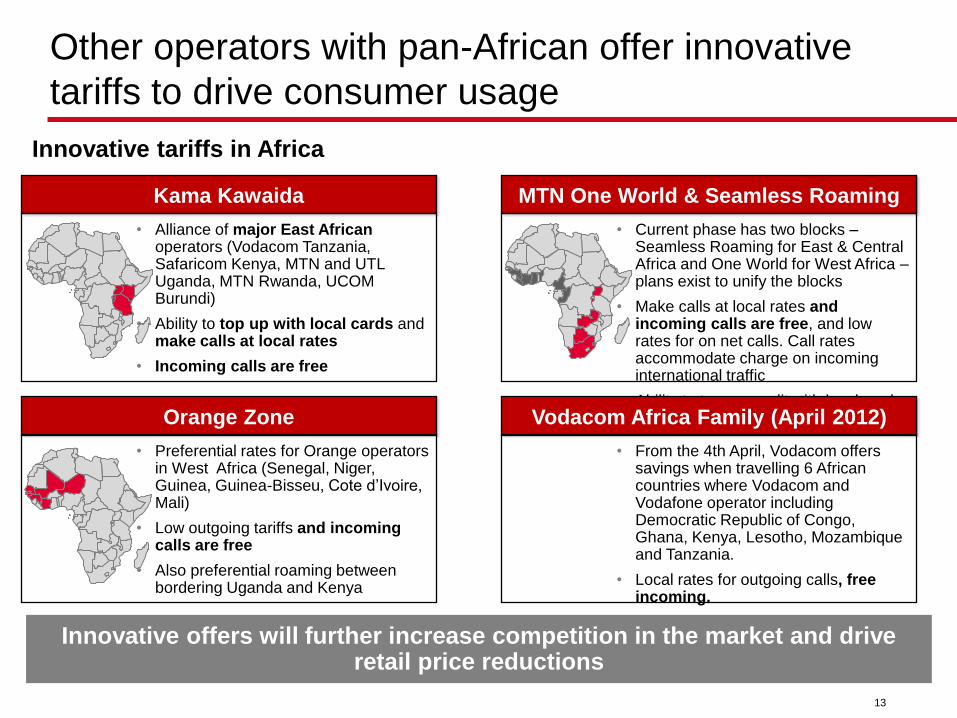
Other operators with pan-African offer innovative
tariffs to drive consumer usage
Innovative offers will further increase competition in the market and drive retail price reductions
Kama Kawaida
• Alliance of major East African operators (Vodacom Tanzania, Safaricom Kenya, MTN and UTL Uganda, MTN Rwanda, UCOM Burundi)
• Ability to top up with local cards and make calls at local rates
• Incoming calls are free
Orange Zone
• Preferential rates for Orange operators in West Africa (Senegal, Niger, Guinea, Guinea-Bisseu, Cote d’Ivoire, Mali)
• Low outgoing tariffs and incoming calls are free
• Also preferential roaming between bordering Uganda and Kenya
MTN One World & Seamless Roaming
• Current phase has two blocks – Seamless Roaming for East & Central Africa and One World for West Africa – plans exist to unify the blocks
• Make calls at local rates and incoming calls are free, and low rates for on net calls. Call rates accommodate charge on incoming international traffic
• Ability to top-up credit with local cards Vodacom Africa Family (April 2012)
• From the 4th April, Vodacom offers savings when travelling 6 African countries where Vodacom and Vodafone operator including Democratic Republic of Congo, Ghana, Kenya, Lesotho, Mozambique and Tanzania.
• Local rates for outgoing calls, free incoming.
Innovative tariffs in Africa

14
Transparency operators continue to increase
customer experience
Simple, clear websites to inform
consumers
Top-up with local cards while travelling
Simplified retail tariffs in local
currencies with zones
• Clear and concise explanatory website
• Simplified and easy to understand roaming tariffs
• Tariffs priced in local currency and/or access to
accessible conversion rates
• Clear, banded pricing based on geography not
network
• Countries are classified into different zones and retail
tariffs are published in local currencies according to
the zone
• Customer avoids bill shocks by knowing what rate
would be charged regardless of which operator
he/she is roaming on and avoids currency
fluctuations
• Local cards and home cards can be used for
prepaid top-up
• Easy accessible, free of charge customer support
when abroad
Vodafone Ghana
Orange Mauritius
MTN Nigeria You can make and receive calls and SMSs to any
of the countries mentioned below at affordable
rates. Now you can even buy local airtime
vouchers in Southern and Eastern Africa (Zambia,
Uganda, Swaziland, Rwanda and Mascom in
Botswana). This is a first from MTN!
How to load airtime while roaming?
It‘s easy as A, B, C. Dial *222* PIN number # on
your phone while roaming in Southern Eastern
Africa regions.
Best Practices Examples
Source: Operator websites as of 3rd August

15
Agenda
• Overview of African roaming situation
• Regional challenges to roaming market
development
• Market trends and opportunities
• Risk of regulating roaming
• Key Takeaways

16
Size and footprint Small operator
Large operator with pan-Africa
footprint & large economies of
scale Bargaining power
with international
transit providers
Small/non-integrated
operator
Large integrated operator
with own gateway
Profitability Marginally
profitable
Highly
profitable
Reliance on
roaming revenues Low roaming
revenues reliance
High (e.g. tourist
destinations)
Net roaming
traffic flow Predominantly exporter
(retail roaming)
Predominantly importer
(wholesale roaming)
Corporate
structure Independent
Operator
Part of group or
alliance
Differential revenue impact across
different operator types and countries
Operator Segmentation Parameters and Impact
Relatively higher impact
Whilst all operators would be impacted by regulation,
some will be disproportionately disadvantaged
17
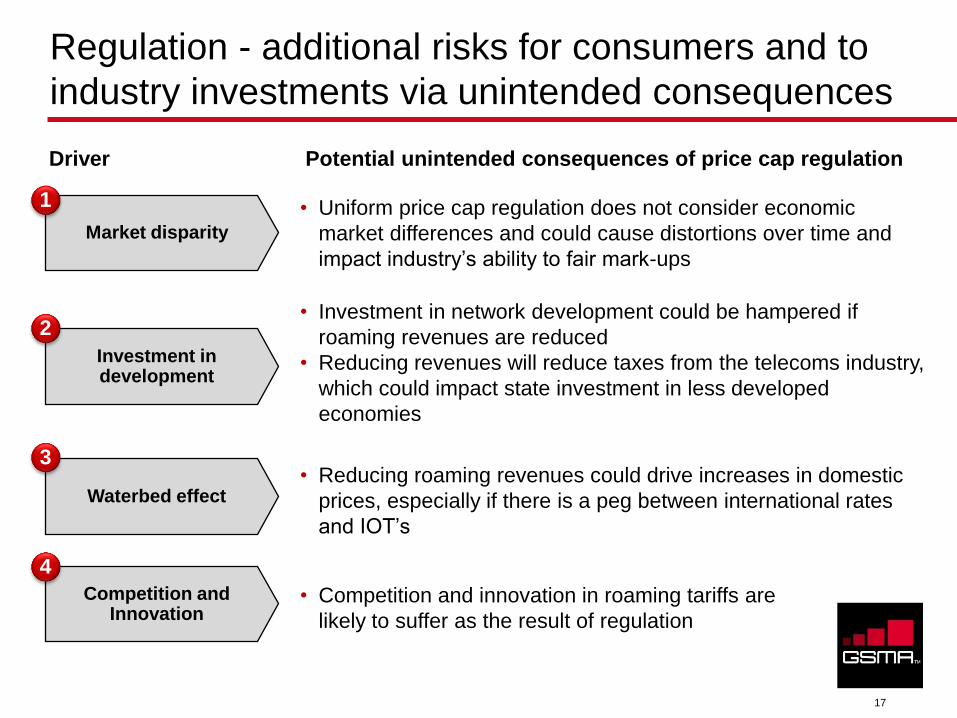
Regulation - additional risks for consumers and to
industry investments via unintended consequences
Market disparity
Investment in development
Waterbed effect
1
2
3
• Uniform price cap regulation does not consider economic
market differences and could cause distortions over time and
impact industry’s ability to fair mark-ups
Driver Potential unintended consequences of price cap regulation
Competition and Innovation
• Investment in network development could be hampered if
roaming revenues are reduced
• Reducing revenues will reduce taxes from the telecoms industry,
which could impact state investment in less developed
economies
• Competition and innovation in roaming tariffs are
likely to suffer as the result of regulation
• Reducing roaming revenues could drive increases in domestic
prices, especially if there is a peg between international rates
and IOT’s
4
18
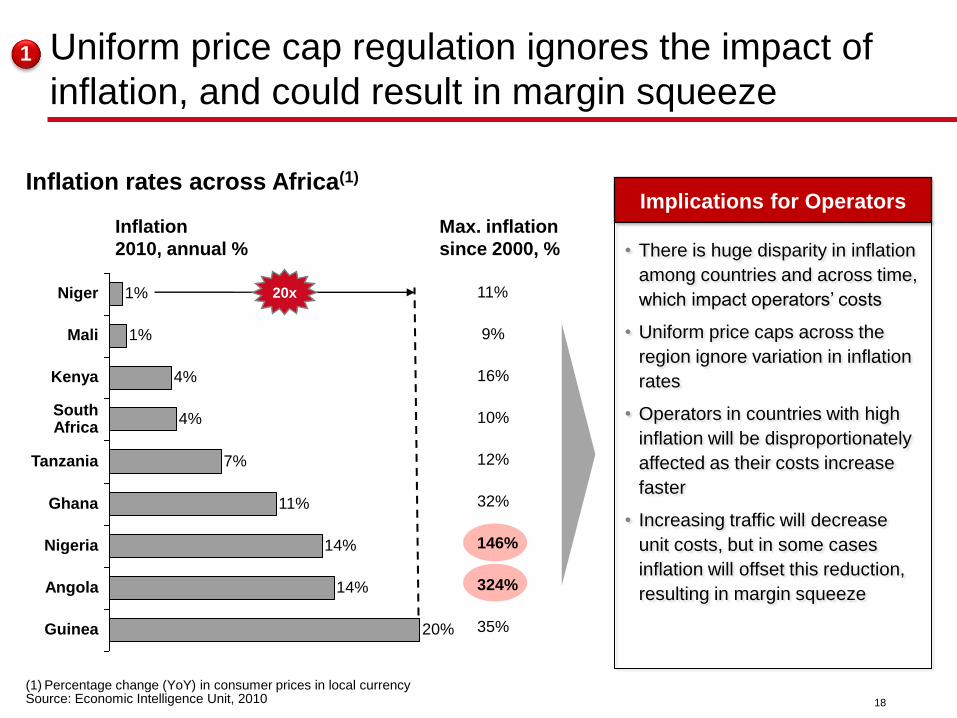
Uniform price cap regulation ignores the impact of
inflation, and could result in margin squeeze
Niger
Guinea 20%
14%
Tanzania
4%
1%
Ghana
7%
14%
Kenya
1%
Nigeria
11%
South Africa
4%
Mali
Angola
Inflation rates across Africa(1)
Inflation
2010, annual %
20x
Max. inflation
since 2000, %
11%
9%
16%
10%
12%
32%
146%
324%
35%
(1) Percentage change (YoY) in consumer prices in local currency Source: Economic Intelligence Unit, 2010
1
Implications for Operators
• There is huge disparity in inflation
among countries and across time,
which impact operators’ costs
• Uniform price caps across the
region ignore variation in inflation
rates
• Operators in countries with high
inflation will be disproportionately
affected as their costs increase
faster
• Increasing traffic will decrease
unit costs, but in some cases
inflation will offset this reduction,
resulting in margin squeeze

19
Margin squeeze if tariffs are priced in USD
• Operators must incur fixed costs in local
currency, which remain the same
• A fixed USD price cap would prevent retail tariffs
from rising if local currency strengthens
• This would squeeze operator margins – e.g. for
a $1 call with costs of 80 LCU:
Poor transparency if tariffs are priced in LCU
• Tariffs priced in local currency could require
frequent price adjustments to comply with a
USD price cap which would reduce consumer
transparency
Applying caps in uniform currency could squeeze
margins and reduce transparency due to FX volatility
45%
40%
35%
30%
25%
20%
15%
10%
5%
0%
-5%
-10%
Q2 2011
Q1 2011
Q4 2010
Q3 2010
Q2 2010
Q1 2010
Q4 2009
Kenya
Guinea
Angola Tanzania
South Africa
Quarterly exchange rates of selected currencies To USD, indexed with Q4 2006 = 0%
LCU: Local Currency Unit Source: OANDA, as of August 9th 2011
35%
16%
14%
10%
-10%
Y
Y+1
$/min
$1
$1
Revenue Cost Margin
100
80
$:LCU
100
80
80
80
+20
0
= -
= -
1
Implications
20
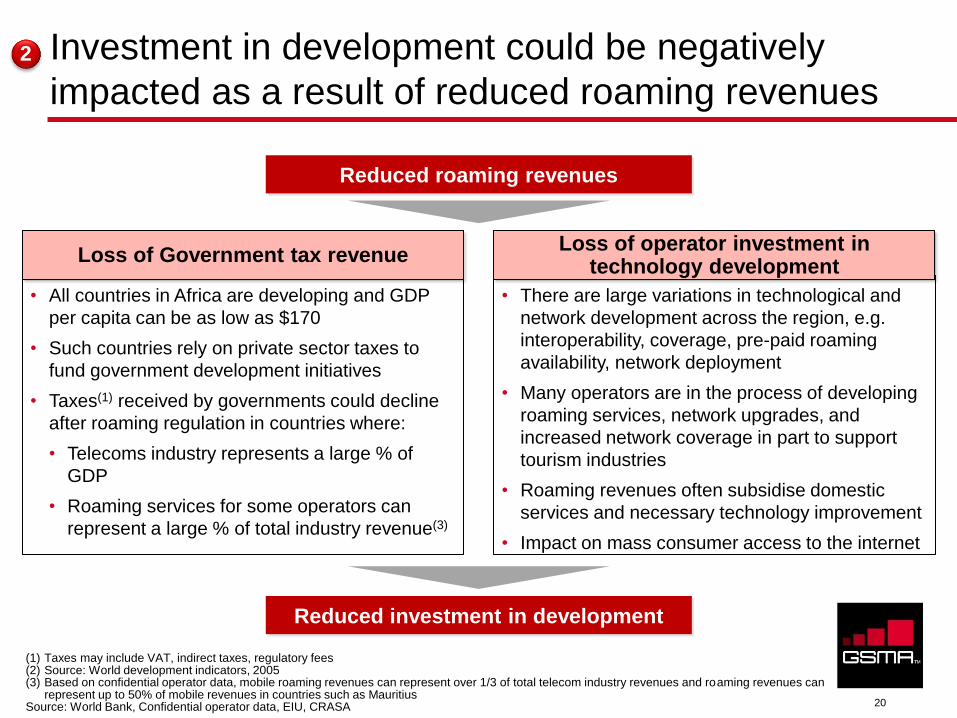
Investment in development could be negatively
impacted as a result of reduced roaming revenues 2
(1) Taxes may include VAT, indirect taxes, regulatory fees (2) Source: World development indicators, 2005 (3) Based on confidential operator data, mobile roaming revenues can represent over 1/3 of total telecom industry revenues and roaming revenues can
represent up to 50% of mobile revenues in countries such as Mauritius Source: World Bank, Confidential operator data, EIU, CRASA
Reduced roaming revenues
• All countries in Africa are developing and GDP
per capita can be as low as $170
• Such countries rely on private sector taxes to
fund government development initiatives
• Taxes(1) received by governments could decline
after roaming regulation in countries where:
• Telecoms industry represents a large % of
GDP
• Roaming services for some operators can
represent a large % of total industry revenue(3)
• There are large variations in technological and
network development across the region, e.g.
interoperability, coverage, pre-paid roaming
availability, network deployment
• Many operators are in the process of developing
roaming services, network upgrades, and
increased network coverage in part to support
tourism industries
• Roaming revenues often subsidise domestic
services and necessary technology improvement
• Impact on mass consumer access to the internet
Reduced investment in development
Loss of Government tax revenue Loss of operator investment in
technology development
21
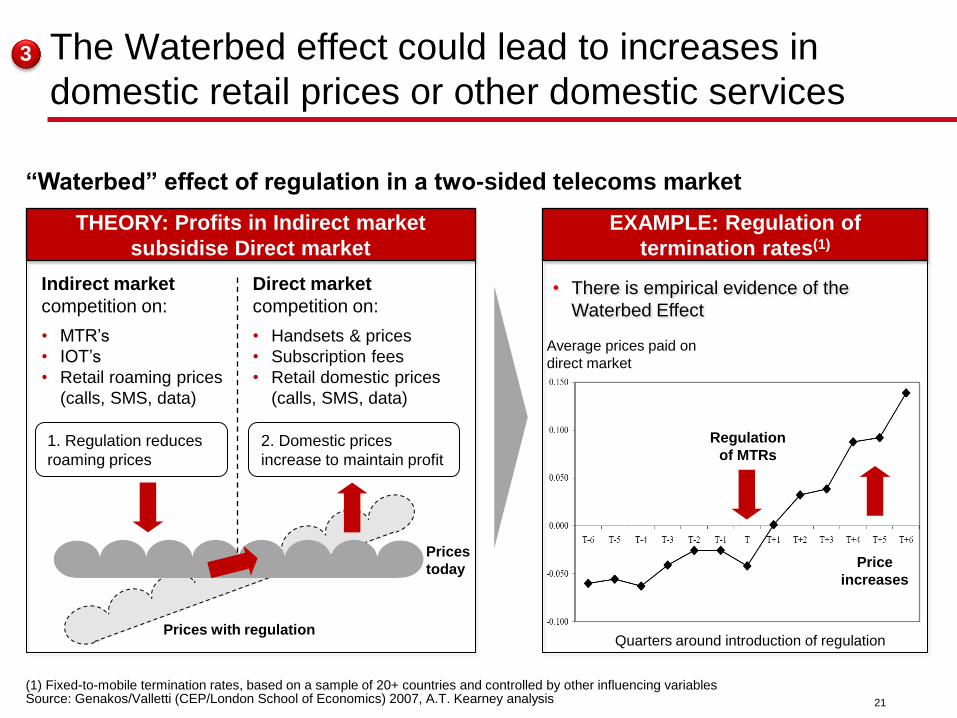
• There is empirical evidence of the
Waterbed Effect
The Waterbed effect could lead to increases in
domestic retail prices or other domestic services 3
(1) Fixed-to-mobile termination rates, based on a sample of 20+ countries and controlled by other influencing variables Source: Genakos/Valletti (CEP/London School of Economics) 2007, A.T. Kearney analysis
“Waterbed” effect of regulation in a two-sided telecoms market
THEORY: Profits in Indirect market
subsidise Direct market
Indirect market
competition on:
• MTR’s
• IOT’s
• Retail roaming prices
(calls, SMS, data)
Direct market
competition on:
• Handsets & prices
• Subscription fees
• Retail domestic prices
(calls, SMS, data)
Prices
today
Prices with regulation
1. Regulation reduces
roaming prices
2. Domestic prices
increase to maintain profit
EXAMPLE: Regulation of
termination rates(1)
Average prices paid on
direct market
Quarters around introduction of regulation
Regulation
of MTRs
Price
increases
22
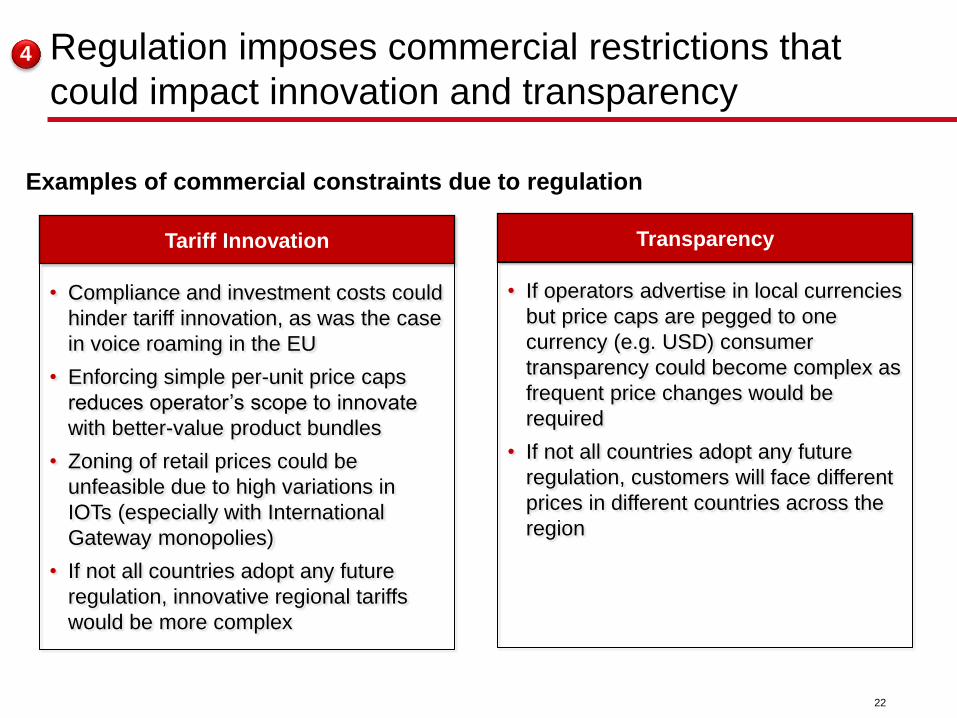
Regulation imposes commercial restrictions that
could impact innovation and transparency 4
Examples of commercial constraints due to regulation
Tariff Innovation
• Compliance and investment costs could
hinder tariff innovation, as was the case
in voice roaming in the EU
• Enforcing simple per-unit price caps
reduces operator’s scope to innovate
with better-value product bundles
• Zoning of retail prices could be
unfeasible due to high variations in
IOTs (especially with International
Gateway monopolies)
• If not all countries adopt any future
regulation, innovative regional tariffs
would be more complex
Transparency
• If operators advertise in local currencies
but price caps are pegged to one
currency (e.g. USD) consumer
transparency could become complex as
frequent price changes would be
required
• If not all countries adopt any future
regulation, customers will face different
prices in different countries across the
region
23
Agenda
• Overview of African roaming situation
• Regional challenges to roaming market
development
• Market trends and opportunities
• Risk of regulating roaming
• Key Takeaways
24
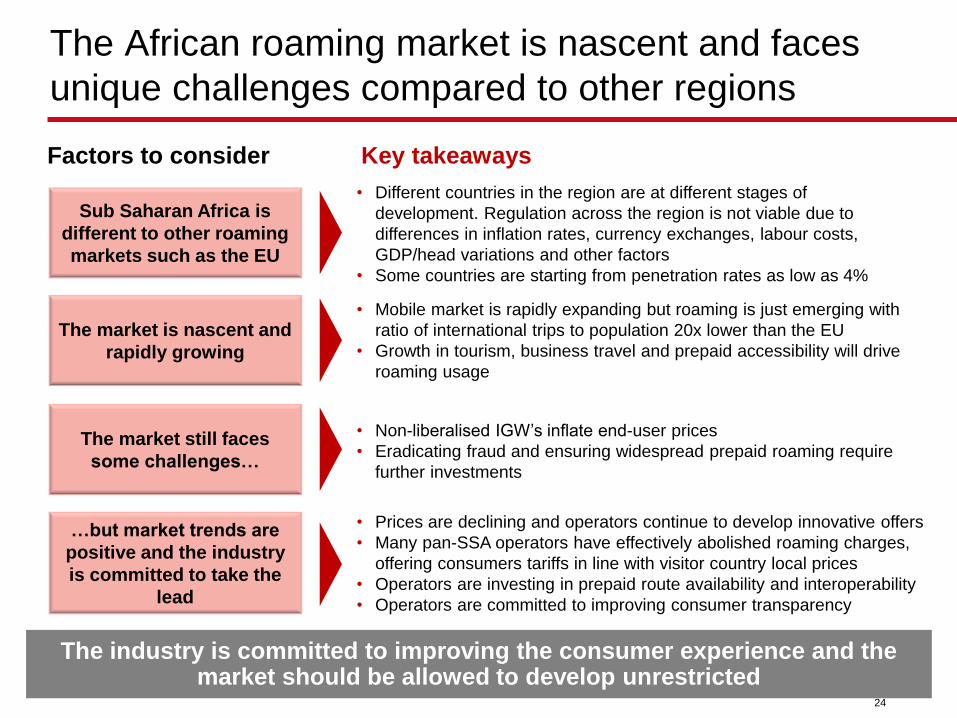
The African roaming market is nascent and faces
unique challenges compared to other regions
Factors to consider
The market is nascent and
rapidly growing
Sub Saharan Africa is
different to other roaming
markets such as the EU
The market still faces
some challenges…
…but market trends are
positive and the industry
is committed to take the
lead
Key takeaways
• Mobile market is rapidly expanding but roaming is just emerging with
ratio of international trips to population 20x lower than the EU
• Growth in tourism, business travel and prepaid accessibility will drive
roaming usage
• Different countries in the region are at different stages of
development. Regulation across the region is not viable due to
differences in inflation rates, currency exchanges, labour costs,
GDP/head variations and other factors
• Some countries are starting from penetration rates as low as 4%
• Non-liberalised IGW’s inflate end-user prices
• Eradicating fraud and ensuring widespread prepaid roaming require
further investments
• Prices are declining and operators continue to develop innovative offers
• Many pan-SSA operators have effectively abolished roaming charges,
offering consumers tariffs in line with visitor country local prices
• Operators are investing in prepaid route availability and interoperability
• Operators are committed to improving consumer transparency
The industry is committed to improving the consumer experience and the market should be allowed to develop unrestricted
25
Encourage operators to take measures that enhance consumer awareness
Address structural barriers that increase costs for service providers and consumers,
such as double taxation and international gateway monopolies, including those barriers
that hold back the development of market based substitutes
Only consider price regulation as a last resort after:
1. The other measures have been given sufficient time to conclude there is a
persistent problem;
2. It is clearly shown that operators offering roaming services have market power -
that is, competition in the market for roaming services is limited;
3. It is clearly shown that the firm derives its market power from owning a natural
monopoly; and,
4. It is clearly shown that the benefit exceeds the cost of regulation.
Approach to regulation