Embed Size (px)
Citation preview

Area of Study: Household Economic Indicators
8/1/2009
This publication made possible in part by support from the United Way of Roanoke Valley
Roanoke Regional Community Indicators 2009 Edition
Council of Community Services 2009 Edition Roanoke Regional Community Indicators Page 2
Table of Contents Introduction .................................................................................................................................................. 4
Methodology ................................................................................................................................................. 5
Aging Demographics ................................................................................................................................... 7
Education Related Indicators ....................................................................................................................... 8
3rd Grade Proficiency Assessments ....................................................................................................... 9
5th Grade Assessments ......................................................................................................................... 21
8th Grade Assessments ........................................................................................................................... 32
Percent Graduating High School ......................................................................................................... 43
Educational Attainment-high school diploma or higher .................................................................. 44
Educational Attainment-bachelor’s degree or higher ....................................................................... 45
Job Related Indicators ................................................................................................................................. 46
Unemployment Rate ............................................................................................................................ 47
Unemployment Insurance Payments .................................................................................................. 48
Net Employment Growth .................................................................................................................... 49
Job Growth by Industry ....................................................................................................................... 52
Income and Asset Related Indicators ......................................................................................................... 53
Per Capita Income ................................................................................................................................ 54
Annual Average Wage .......................................................................................................................... 55
Consumer Price Index ........................................................................................................................... 56
Housing Related Indicators ......................................................................................................................... 57
Average Rental Costs ............................................................................................................................ 58
Length of Residency .............................................................................................................................. 59
Owner Occupied Housing Units ......................................................................................................... 60
Renter-Occupied Housing Units .......................................................................................................... 61
Single-Family Residential Building Permits ......................................................................................... 62
Housing Units Lacking Complete Plumbing Facilities ....................................................................... 63
Public Assistance/Low Income Indicators ................................................................................................... 64
Children Eligible for Free/Reduced Lunch .......................................................................................... 65
Supplemental Security Income Recipients (SSI) ................................................................................. 66
TANF Recipients .................................................................................................................................... 67

Council of Community Services 2009 Edition Roanoke Regional Community Indicators Page 3
Food Stamp Recipients ......................................................................................................................... 68
Poverty Rate .......................................................................................................................................... 69
Childcare Subsidy Recipients ................................................................................................................ 72
Poverty Rate for Children .................................................................................................................... 73
Other Related Indicators ............................................................................................................................. 74
Percent of Households with No Vehicle ............................................................................................ 75
Health Insurance Coverage .................................................................................................................. 76
Food Bank Distributions ....................................................................................................................... 77
Appendix A: Roanoke Region Indicator Criteria ......................................................................................... 78
Appendix B: Demographics by Jurisdiction ................................................................................................ 80
Alleghany County ..................................................................................................................................... 81
Botetourt County ...................................................................................................................................... 82
Craig County ............................................................................................................................................. 83
Franklin County ........................................................................................................................................ 84
Roanoke County ....................................................................................................................................... 85
Covington .................................................................................................................................................. 86
Roanoke City ............................................................................................................................................. 87
Salem .......................................................................................................................................................... 88
Region ........................................................................................................................................................ 89
Virginia ....................................................................................................................................................... 90
Appendix C: Race and Ethnicity * ............................................................................................................... 91
Race and Ethnicity .................................................................................................................................... 92
Appendix D: Indicators for which only local numbers are provided as no regional numbers could be calculated .................................................................................................................................................... 94
Affordability of a Single Family Home All Locations ....................................................................... 95
Births to mothers with less than a high school education ................................................................ 96
Median income for seniors 65 and older ........................................................................................ 101
Appendix E: Definitions and Sources .................................................................................................... 103
Conclusion ................................................................................................................................................. 106
Regional Trends .................................................................................................................................. 107
Council of Community Services 2009 Edition Roanoke Regional Community Indicators Page 4
Introduction
In October 2008 the Council of Community Services published the first Roanoke Regional Community Indicators Report1, the purpose of which was to identify and track key human services indicators. Because a lack of financial resources was deemed to be a primary reason for needing human services, the area of focus for the 2008 report was the household economy. Indicators are presentations of valuable data that show changes over time. They help to answer important questions such as how well the economy is functioning; whether children in the Roanoke Region are performing to standards in school or to what extent the teen pregnancy rate is decreasing. Indicators are powerful tools for measuring and tracking the overall quality of life and comparing performance against goals or benchmarks. The measurements help communities monitor changes or give them a baseline against which future changes can be measured.
The research conducted for the 2008 report was guided by a steering committee of 38 leaders representing 26 organizations and agencies. The Indicators Steering Committee set the entire Roanoke Region as the geographic focus of the 2008 project. Because there was a strong consensus by the 2008 Steering Committee that multi-jurisdictional planning and Valley-wide action would be stimulated if data were researched and presented that addressed the needs of the entire region, this 2009 Edition of the Roanoke Regional Community Indicators report continues looking at the region as a whole; defined in this report to include Alleghany County, Botetourt County, Covington City, Craig County, Franklin County, the City of Roanoke, Roanoke County and the City of Salem.
As in the original report, indicator data in this 2009 Edition are presented with a purpose of showing trends over time for each jurisdiction in the region while comparing the performance of the Roanoke Region to that of the Commonwealth of Virginia overall. To our knowledge there is no other single source of information that provides such a detailed and in-depth look at the economic well being of people residing in the Roanoke Region.
The Council of Community Services through its division of Planning and Consultation now tracks and stores indicator data as it becomes available on an ongoing basis. Data are stored in a newly created electronic Indicator Library making access to information on community needs more readily available through the use of simple pivot tables. This 2009 Edition of the Roanoke Regional Community Indicators Report contains 42 indicators, those deemed by the Steering Committee to be most closely related to poverty plus 5th grade and 8th grade proficiency assessments, the Indicator Library itself contains over 150 indicators providing information on a wide range of community needs. The data in this report were extracted from the Indicator Library.
It is our hope during this challenging period of economic downturn, that data contained in this 2009 Edition of the Roanoke Regional Community Indicators Report will assist policymakers, business and program leaders as they come together cross jurisdictional boundaries to find common cause and solutions to economic and social problems facing children and families in our communities.
Chairman Indicators Steering Committee President and CEO Freedom First Federal Credit Union
1 The 2008 Roanoke Regional Community Indicators report can be found on the Council of Community Services website. www.councilofcommunityservices.org
Council of Community Services 2009 Edition Roanoke Regional Community Indicators Page 5
Methodology2
The primary focus of the research and data collection team was to find the most recent, credible, locality-specific data available that could be used to calculate an aggregate regional figure for each indicator. This aggregate regional figure was then used as a comparison to state data to provide the reader with a point of reference as to where the region stands. It was also decided that, wherever possible, three cycles of data would be tracked to provide a trend line measuring change over time; with no data cycles prior to 1990 to be included. As the project moved forward, difficulties were encountered regarding the inclusion of old data, the inclusion of data gathered from sources with a relatively high margin of error and the calculation of regional figures for some indicators.
The inclusion of relatively old data was an initial concern as the research and data collection process began. The challenge arose as it was found that to get locality-specific data for a significant number of indicators, either old data would have to be used, primarily from the U.S. Census Bureau with 2000 being the most recent cycle available, or those indicators for which more recent data could not be located would have to be dropped from the report. It was determined that while the 1990 and 2000 Census data cycles were not optimal, it was all that was available to compile a truly comprehensive regional report with locality-specific data and that it would be included.
The inclusion of data with a relatively high margin of error was another issue that was confronted as the report was being compiled. The American Community Survey (ACS) of the U.S. Census was found to be a possible supplement to some of the older data for Roanoke County and the City of Roanoke for a number of the Census-sourced indicators (Roanoke County and the City of Roanoke are the only localities in the region covered by the ACS as only localities with populations of 65,000 or more are tracked). The Small Area Income and Poverty Estimates (SAIPE) of the Census were also found to be a more recent set of data for several of the indicators. Unlike the American Community Survey, the SAIPE was available for all localities in the region. The reliability of these sources was, however, a concern as the margin of error for some of the indicators was significant. This concern was taken into consideration and it was decided that the ACS data would be included for Roanoke County and the City of Roanoke in the tables, but would not be graphed or used in any calculations of regional figures. The SAIPE would also be included in the report and would be used as the primary data source for those indicators for which they were available. Because data was accessible for all localities in the region through the SAIPE, an aggregate regional figure was able to be calculated using consistent data for all localities. It was thought that even with the reliability issues associated with the ACS and the SAIPE that this data may still be useful to community leaders when seeking data for grant applications or in other instances where more recent data may be needed.
Calculating a regional figure3 for some indicators was also a challenge. Since all the data necessary to compile a regional figure for the indicators was not always accessible, an aggregate regional figure could not be calculated for several of the indicators. For instance, for the births to mothers with less than a high school education indicator, the data for total births and the total number of births to mothers that did not have a high school education for the given year were not available through the Virginia Department of Health. The only number available was the percentage of total births that were to mothers with less than a high school
2 Methodology for the 2009 Edition is the same as that for the 2008 report. Because this 2009 Edition is intended to be a stand-alone report, the methodology section is included even though it is a repeat of the that contained in 2008 3 Regional figures for the indicators for which all the necessary data was available and accessible was done as a simple
calculation of the aggregate compilation of data for all localities in the region; no weighted average calculations were made.
Council of Community Services 2009 Edition Roanoke Regional Community Indicators Page 6
education. Therefore, without the numbers of total births and the total number of births to mothers with less than a high school education, a regional figure could not be calculated. Because of this deficiency of data with several indicators, the numbers for the individual localities was included as a comparison to the state with no regional figure being calculated.
The indicators for which no regional figure could be calculated include: median family income, median income – seniors aged 65-74, median income – seniors aged 75 and over, affordability of a single-family home, births to mothers with less than a high school diploma and typical monthly household utility costs. These indicators have been included in a separate appendix (Appendix B) as it was felt that even though these indicators contain valuable data and are worth including, their inclusion with the indicators for which regional data could be calculated would detract from the regional approach that has been a primary focus of this report.
While the methodology that was used in compiling this report was by no means perfect or optimal, the intention was to create a sense of community and interconnectedness within the region. It was felt that this intention was best served by using the chosen methods. In the future, as conversations within the community take place and as cooperation amongst agencies and organizations within the region increases, more recent and relevant data will, hopefully, be made available through indicator reports similar to this.
Modifications in the 2009 Report
In the 2009 Edition there are few modifications to the 2008 report. There are two indicators not included in the 2009 report that were in the 2008 report. These were “number of chapter 7 and 13 bankruptcies”, and “typical monthly household utility costs”. Data were not readily accessible for either of these indicators and were not included. Another indicator that changed from the 2008 report was “adults without health insurance” to “no health insurance coverage”. There were concerns about the accessibility and reliability of the data source for “adults without health insurance”. The Census Bureau released its Small Area Health Insurance Estimates (SAHIE) for Counties and States in July 2005. This program is akin to the Small Area Income and Poverty Estimates program (SAIPE) and reports county-level estimates on health insurance coverage for all counties and is not available elsewhere. No health insurance coverage is now a part of the 2009 Edition and is reported by locality for age (under 65), all levels of income, and both sexes. The data are easily accessible and reliable and will be included in future publications.
Fifth and eighth grade assessments have been added as education indicators in the 2009 report. The reason for adding these indicators was to begin tracking where upward trends in academic performance begins to reverse. As can be seen in the pages of this report, the period between 5th and 8th grade (adolescence) represents the area where performance falls for the region.
In December 2008, the Census released its 2005-2007 3 yr. estimates. These estimates are for areas with populations of 20,000 or more, which includes Botetourt, Franklin county, and Salem. Data were collected over a three year period and thus have a larger sample making the estimates more precise. Roanoke County and Salem continue to have one and three year estimates due to their size. Three year estimates are included in the 2009 report and used as measures on thirteen indicators but there are no graphs or Region calculations using the data from the 3 yr. estimates.
Council of Community Services 2009 Edition Roanoke Regional Community Indicators Page 7
Aging Demographics
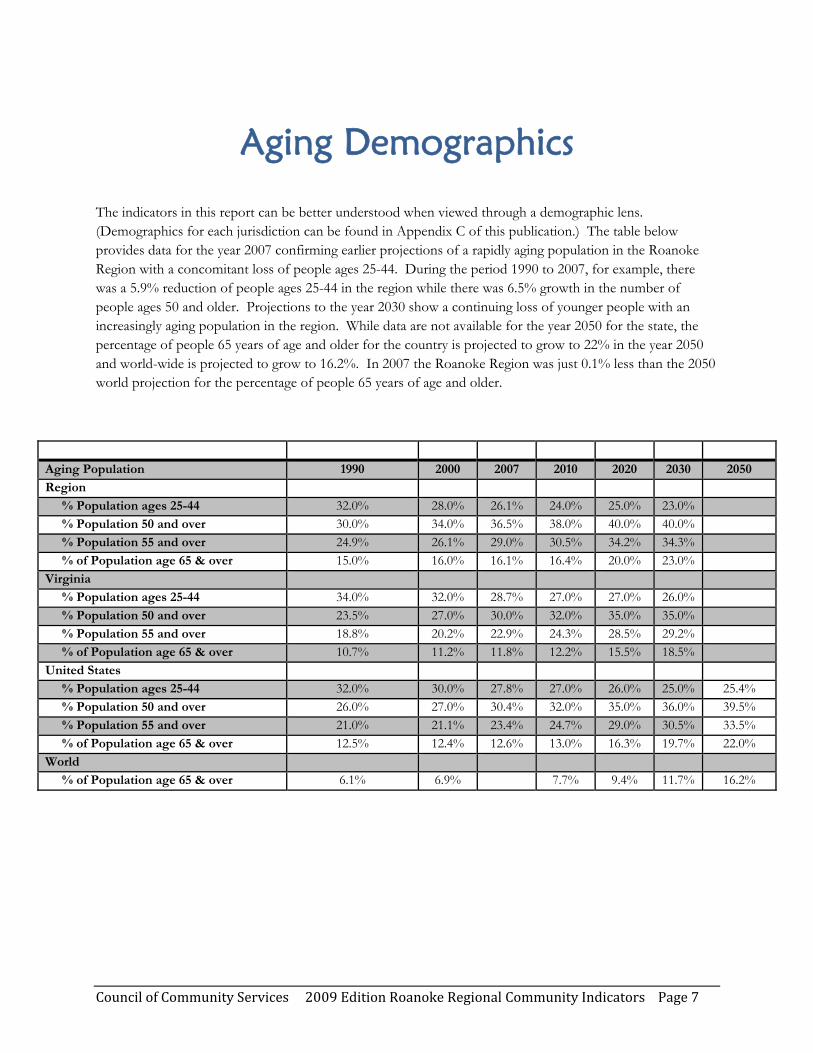
The indicators in this report can be better understood when viewed through a demographic lens. (Demographics for each jurisdiction can be found in Appendix C of this publication.) The table below provides data for the year 2007 confirming earlier projections of a rapidly aging population in the Roanoke Region with a concomitant loss of people ages 25-44. During the period 1990 to 2007, for example, there was a 5.9% reduction of people ages 25-44 in the region while there was 6.5% growth in the number of people ages 50 and older. Projections to the year 2030 show a continuing loss of younger people with an increasingly aging population in the region. While data are not available for the year 2050 for the state, the percentage of people 65 years of age and older for the country is projected to grow to 22% in the year 2050 and world-wide is projected to grow to 16.2%. In 2007 the Roanoke Region was just 0.1% less than the 2050 world projection for the percentage of people 65 years of age and older.
Aging Population 1990 2000 2007 2010 2020 2030 2050
Region
% Population ages 25-44 32.0% 28.0% 26.1% 24.0% 25.0% 23.0% % Population 50 and over 30.0% 34.0% 36.5% 38.0% 40.0% 40.0% % Population 55 and over 24.9% 26.1% 29.0% 30.5% 34.2% 34.3% % of Population age 65 & over 15.0% 16.0% 16.1% 16.4% 20.0% 23.0%
Virginia
% Population ages 25-44 34.0% 32.0% 28.7% 27.0% 27.0% 26.0% % Population 50 and over 23.5% 27.0% 30.0% 32.0% 35.0% 35.0% % Population 55 and over 18.8% 20.2% 22.9% 24.3% 28.5% 29.2% % of Population age 65 & over 10.7% 11.2% 11.8% 12.2% 15.5% 18.5%
United States
% Population ages 25-44 32.0% 30.0% 27.8% 27.0% 26.0% 25.0% 25.4% % Population 50 and over 26.0% 27.0% 30.4% 32.0% 35.0% 36.0% 39.5% % Population 55 and over 21.0% 21.1% 23.4% 24.7% 29.0% 30.5% 33.5% % of Population age 65 & over 12.5% 12.4% 12.6% 13.0% 16.3% 19.7% 22.0%
World
% of Population age 65 & over 6.1% 6.9% 7.7% 9.4% 11.7% 16.2%

Council of Community Services 2009 Edition Roanoke Regional Community Indicators Page 8
Education Related Indicators
• Third Grade Proficiency Assessments
o History and Social Science
o Mathematics
o Reading
o Science
• Fifth Grade Proficiency Assessments
o Mathematics
o Reading
o Science
• Eighth Grade Proficiency Assessments
o Mathematics
o Reading
o Science
• Percent Graduating High School
• Educational Attainment – High School Diploma or Higher
• Educational Attainment – Bachelor’s Degree or Higher
Education and the economy are inextricably linked. The Steering Committee identified the indicators above as
particularly important predictors of economic well being.
Council of Community Services 2009 Edition Roanoke Regional Community Indicators Page 9
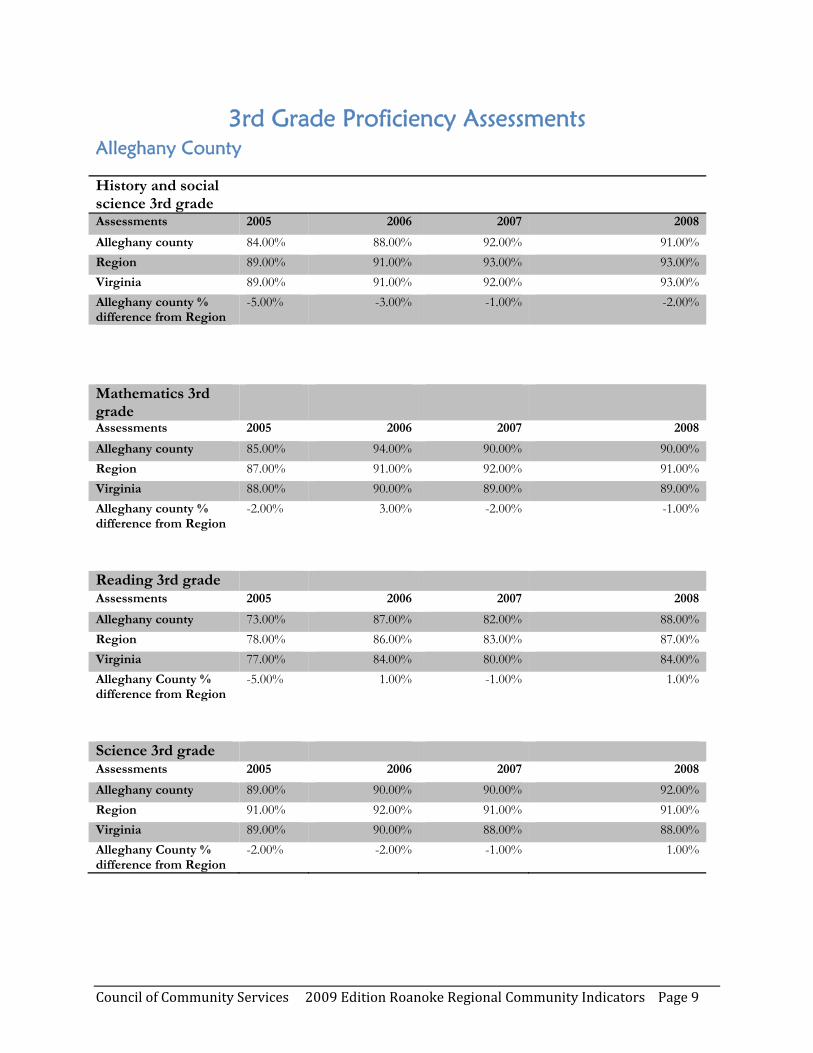
3rd Grade Proficiency Assessments Alleghany County
History and social science 3rd grade
Assessments 2005 2006 2007 2008
Alleghany county 84.00% 88.00% 92.00% 91.00%Region 89.00% 91.00% 93.00% 93.00%Virginia 89.00% 91.00% 92.00% 93.00%Alleghany county % difference from Region
-5.00% -3.00% -1.00% -2.00%
Mathematics 3rd grade
Assessments 2005 2006 2007 2008
Alleghany county 85.00% 94.00% 90.00% 90.00%Region 87.00% 91.00% 92.00% 91.00%Virginia 88.00% 90.00% 89.00% 89.00%Alleghany county % difference from Region
-2.00% 3.00% -2.00% -1.00%
Reading 3rd grade Assessments 2005 2006 2007 2008
Alleghany county 73.00% 87.00% 82.00% 88.00%Region 78.00% 86.00% 83.00% 87.00%Virginia 77.00% 84.00% 80.00% 84.00%Alleghany County % difference from Region
-5.00% 1.00% -1.00% 1.00%
Science 3rd grade Assessments 2005 2006 2007 2008
Alleghany county 89.00% 90.00% 90.00% 92.00%Region 91.00% 92.00% 91.00% 91.00%Virginia 89.00% 90.00% 88.00% 88.00%Alleghany County % difference from Region
-2.00% -2.00% -1.00% 1.00%
Council of Community Services 2009 Edition Roanoke Regional Community Indicators Page 10
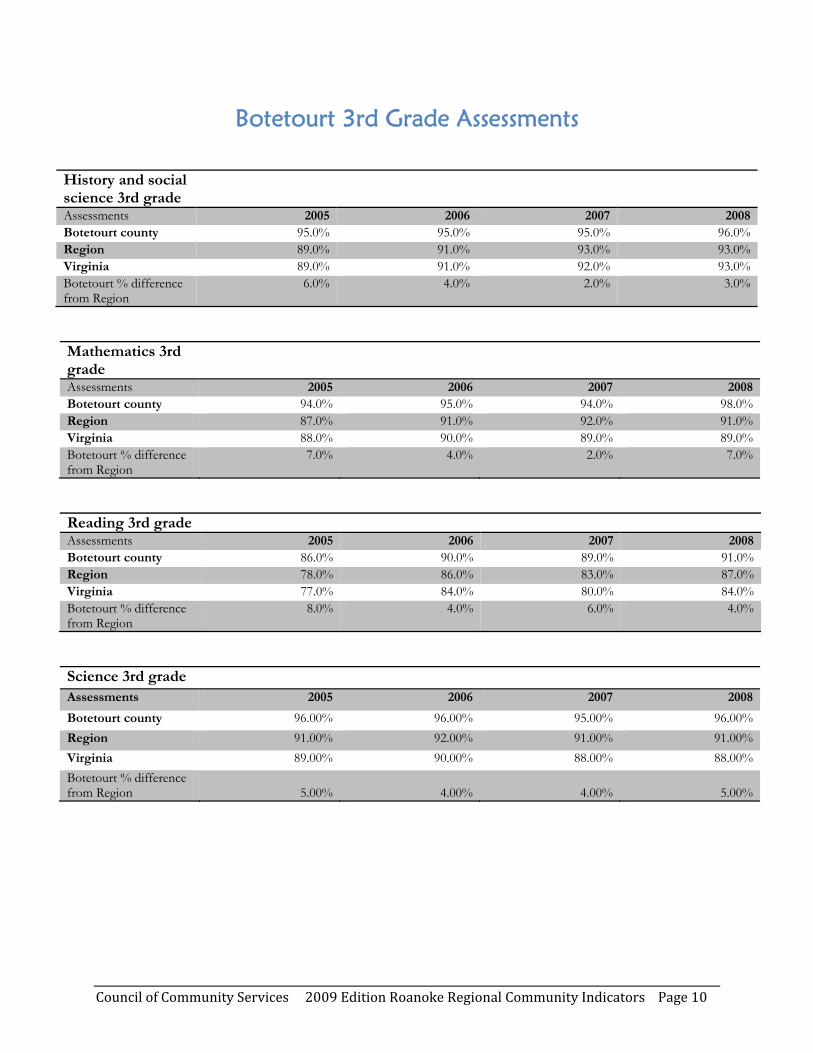
Botetourt 3rd Grade Assessments
Mathematics 3rd grade
Assessments 2005 2006 2007 2008Botetourt county 94.0% 95.0% 94.0% 98.0%Region 87.0% 91.0% 92.0% 91.0%Virginia 88.0% 90.0% 89.0% 89.0%Botetourt % difference from Region
7.0% 4.0% 2.0% 7.0%
Reading 3rd grade Assessments 2005 2006 2007 2008Botetourt county 86.0% 90.0% 89.0% 91.0%Region 78.0% 86.0% 83.0% 87.0%Virginia 77.0% 84.0% 80.0% 84.0%Botetourt % difference from Region
8.0% 4.0% 6.0% 4.0%
Science 3rd grade
Assessments 2005 2006 2007 2008
Botetourt county 96.00% 96.00% 95.00% 96.00%Region 91.00% 92.00% 91.00% 91.00%Virginia 89.00% 90.00% 88.00% 88.00%Botetourt % difference from Region 5.00% 4.00% 4.00% 5.00%
History and social science 3rd grade
Assessments 2005 2006 2007 2008Botetourt county 95.0% 95.0% 95.0% 96.0%Region 89.0% 91.0% 93.0% 93.0%Virginia 89.0% 91.0% 92.0% 93.0%Botetourt % difference from Region
6.0% 4.0% 2.0% 3.0%
Council of Community Services 2009 Edition Roanoke Regional Community Indicators Page 11
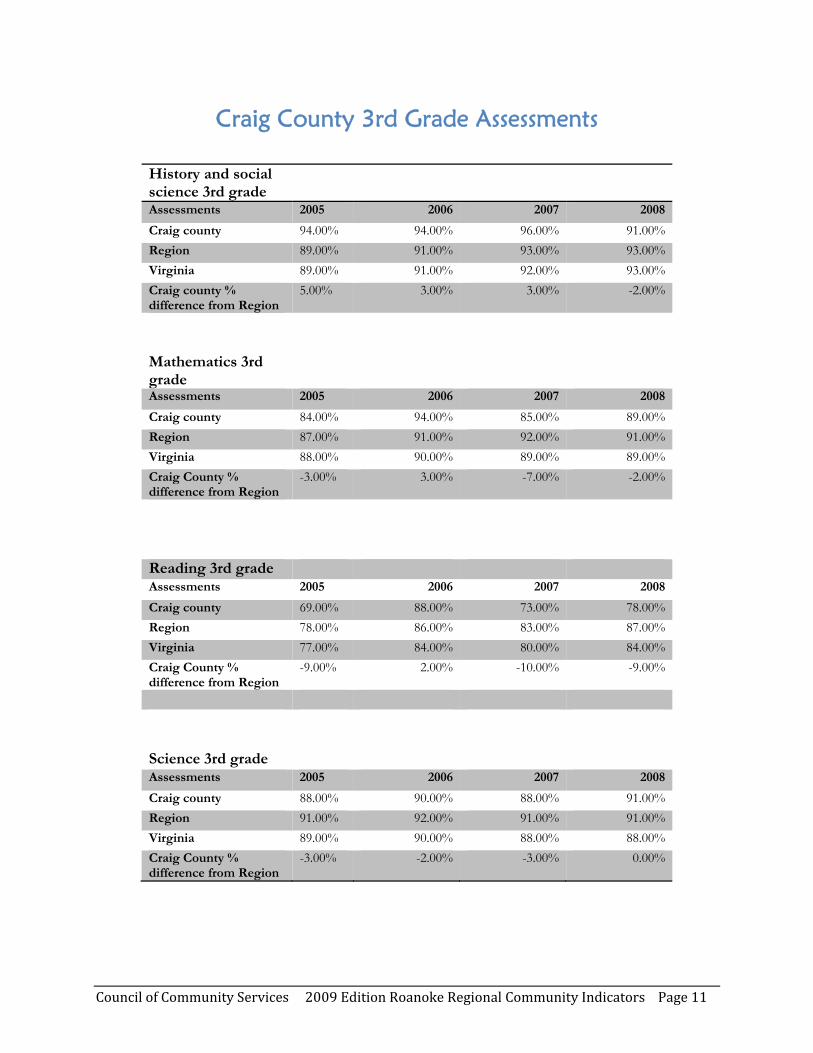
Craig County 3rd Grade Assessments
History and social science 3rd grade
Assessments 2005 2006 2007 2008
Craig county 94.00% 94.00% 96.00% 91.00%Region 89.00% 91.00% 93.00% 93.00%Virginia 89.00% 91.00% 92.00% 93.00%Craig county % difference from Region
5.00% 3.00% 3.00% -2.00%
Mathematics 3rd grade
Assessments 2005 2006 2007 2008
Craig county 84.00% 94.00% 85.00% 89.00%Region 87.00% 91.00% 92.00% 91.00%Virginia 88.00% 90.00% 89.00% 89.00%Craig County % difference from Region
-3.00% 3.00% -7.00% -2.00%
Reading 3rd grade Assessments 2005 2006 2007 2008
Craig county 69.00% 88.00% 73.00% 78.00%Region 78.00% 86.00% 83.00% 87.00%Virginia 77.00% 84.00% 80.00% 84.00%Craig County % difference from Region
-9.00% 2.00% -10.00% -9.00%
Science 3rd grade Assessments 2005 2006 2007 2008
Craig county 88.00% 90.00% 88.00% 91.00%Region 91.00% 92.00% 91.00% 91.00%Virginia 89.00% 90.00% 88.00% 88.00%Craig County % difference from Region
-3.00% -2.00% -3.00% 0.00%

Council of Community Services 2009 Edition Roanoke Regional Community Indicators Page 12
Franklin County 3rd Grade Assessments
History and social science 3rd grade
Assessments 2005 2006 2007 2008
Franklin county 94.00% 96.00% 97.00% 96.00%Region 89.00% 91.00% 93.00% 93.00%Virginia 89.00% 91.00% 92.00% 93.00%Franklin county % difference from Region
5.00% 5.00% 4.00% 3.00%
Mathematics 3rd grade Assessments 2005 2006 2007 2008
Franklin county 94.00% 94.00% 95.00% 97.00%Region 87.00% 91.00% 92.00% 91.00%Virginia 88.00% 90.00% 89.00% 89.00%Franklin county % difference from Region
7.00% 3.00% 3.00% 6.00%
Reading 3rd grade Assessments 2005 2006 2007 2008
Franklin county 84.00% 92.00% 89.00% 90.00%Region 78.00% 86.00% 83.00% 87.00%Virginia 77.00% 84.00% 80.00% 84.00%Franklin county % difference from Region
6.00% 6.00% 6.00% 3.00%
Science 3rd grade Assessments 2005 2006 2007 2008
Franklin county 95.00% 95.00% 95.00% 94.00%Region 91.00% 92.00% 91.00% 91.00%Virginia 89.00% 90.00% 88.00% 88.00%Franklin county % difference from Region
4.00% 3.00% 4.00% 3.00%
Council of Community Services 2009 Edition Roanoke Regional Community Indicators Page 13
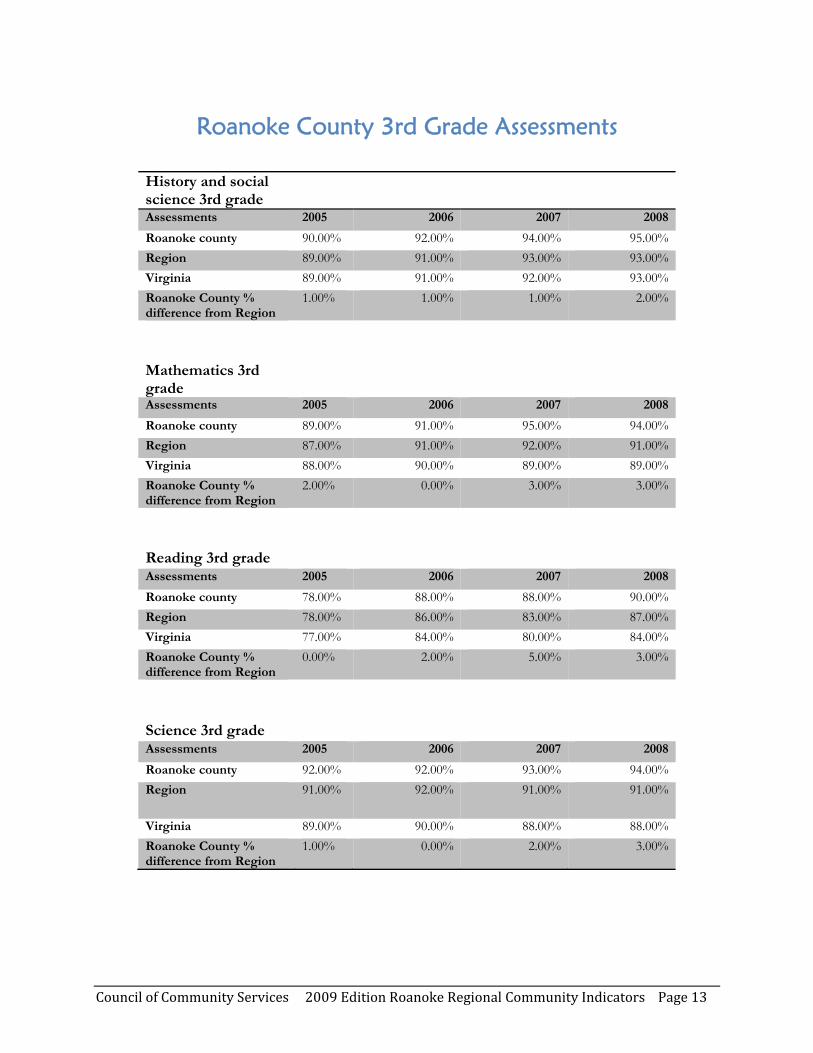
Roanoke County 3rd Grade Assessments
History and social science 3rd grade
Assessments 2005 2006 2007 2008
Roanoke county 90.00% 92.00% 94.00% 95.00%Region 89.00% 91.00% 93.00% 93.00%Virginia 89.00% 91.00% 92.00% 93.00%Roanoke County % difference from Region
1.00% 1.00% 1.00% 2.00%
Mathematics 3rd grade
Assessments 2005 2006 2007 2008
Roanoke county 89.00% 91.00% 95.00% 94.00%Region 87.00% 91.00% 92.00% 91.00%Virginia 88.00% 90.00% 89.00% 89.00%Roanoke County % difference from Region
2.00% 0.00% 3.00% 3.00%
Reading 3rd grade Assessments 2005 2006 2007 2008
Roanoke county 78.00% 88.00% 88.00% 90.00%Region 78.00% 86.00% 83.00% 87.00%Virginia 77.00% 84.00% 80.00% 84.00%Roanoke County % difference from Region
0.00% 2.00% 5.00% 3.00%
Science 3rd grade Assessments 2005 2006 2007 2008
Roanoke county 92.00% 92.00% 93.00% 94.00%Region 91.00% 92.00% 91.00% 91.00%
Virginia 89.00% 90.00% 88.00% 88.00%Roanoke County % difference from Region
1.00% 0.00% 2.00% 3.00%

Council of Community Services 2009 Edition Roanoke Regional Community Indicators Page 14
Covington 3rd Grade Assessments
History and social science 3rd grade
Assessments 2005 2006 2007 2008
Covington city 95.00% 89.00% 100.00% 95.00%Region 89.00% 91.00% 93.00% 93.00%Virginia 89.00% 91.00% 92.00% 93.00%Covington % difference from Region
6.00% -2.00% 7.00% 2.00%
Mathematics 3rd grade
Assessments 2005 2006 2007 2008
Covington city 97.00% 85.00% 100.00% 91.00%Region 87.00% 91.00% 92.00% 91.00%Virginia 88.00% 90.00% 89.00% 89.00%Covington % difference from Region
10.00% -6.00% 8.00% 0.00%
Reading 3rd grade Assessments 2005 2006 2007 2008
Covington city 88.00% 80.00% 94.00% 89.00%Region 78.0% 86.0% 83.0% 87.0%Virginia 77.0% 84.0% 80.0% 84.0%Covington % difference from Region
10.0% -6.00% 11.0% 2.00%
Science 3rd grade Assessments 2005 2006 2007 2008
Covington city 97.0% 84.00% 100.00% 86.00%Region 91.00% 92.00% 91.00% 91.00%Virginia 89.00% 90.00% 88.00% 88.00%Covington % difference from Region
6.00% -8.00% 9.00% -5.00%
Council of Community Services 2009 Edition Roanoke Regional Community Indicators Page 15
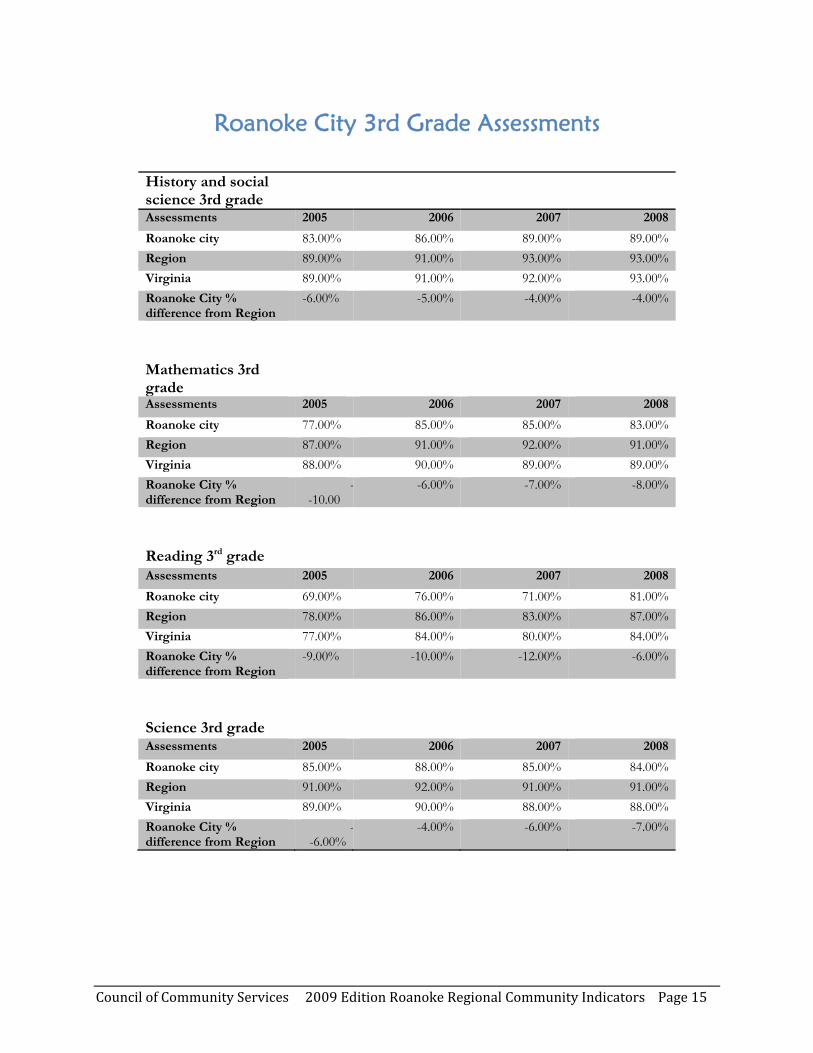
Roanoke City 3rd Grade Assessments
History and social science 3rd grade
Assessments 2005 2006 2007 2008
Roanoke city 83.00% 86.00% 89.00% 89.00%Region 89.00% 91.00% 93.00% 93.00%Virginia 89.00% 91.00% 92.00% 93.00%Roanoke City % difference from Region
-6.00% -5.00% -4.00% -4.00%
Mathematics 3rd grade
Assessments 2005 2006 2007 2008
Roanoke city 77.00% 85.00% 85.00% 83.00%Region 87.00% 91.00% 92.00% 91.00%Virginia 88.00% 90.00% 89.00% 89.00%Roanoke City % difference from Region
--10.00
-6.00% -7.00% -8.00%
Reading 3rd grade Assessments 2005 2006 2007 2008
Roanoke city 69.00% 76.00% 71.00% 81.00%Region 78.00% 86.00% 83.00% 87.00%Virginia 77.00% 84.00% 80.00% 84.00%Roanoke City % difference from Region
-9.00% -10.00% -12.00% -6.00%
Science 3rd grade Assessments 2005 2006 2007 2008
Roanoke city 85.00% 88.00% 85.00% 84.00%Region 91.00% 92.00% 91.00% 91.00%Virginia 89.00% 90.00% 88.00% 88.00%Roanoke City % difference from Region
--6.00%
-4.00% -6.00% -7.00%

Council of Community Services 2009 Edition Roanoke Regional Community Indicators Page 16
Salem City 3rd Grade Assessments
History and social science 3rd grade
Assessments 2005 2006 2007 2008
Salem city 95.00% 97.00% 95.00% 97.00%Region 89.00% 91.00% 93.00% 93.00%Virginia 89.00% 91.00% 92.00% 93.00%Salem City % difference from Region
6.00% 6.00% 2.00% 4.00%
Mathematics 3rd grade
Assessments 2005 2006 2007 2008
Salem city 94.00% 97.00% 93.00% 97.00%Region 87.00% 91.00% 92.00% 91.00%Virginia 88.00% 90.00% 89.00% 89.00%Salem City % difference from Region
7.00% 6.00% 1.0 0% 6.00%
Reading 3rd grade Assessments 2005 2006 2007 2008
Salem city 84.00% 92.00% 86.00% 91.00%Region 78.00% 86.00% 83.00% 87.00%Virginia 77.00% 84.00% 80.00% 84.00%Salem City % difference from Region
6.00% 6.00% 3.00% 4.00%
Science 3rd grade Assessments 2005 2006 2007 2008
Salem city 94.00% 96.00% 94.00% 91.00%Region 91.00% 92.00% 91.00% 91.00%Virginia 89.00% 90.00% 88.00% 88.00%Salem City % difference from Region
3.0 0% 4.00% 3.00% 0.00%

Council of Community Services 2009 Edition Roanoke Regional Community Indicators Page 17
Region 3rd Grade Assessments-History & Social Science
2005 2006 2007 2008
Region 89.0% 91.0% 93.0% 93.0%
Virginia 89.0% 91.0% 92.0% 93.0%
87.0%88.0%89.0%90.0%91.0%92.0%93.0%94.0%
Axis Title
History & Social Science 3rd Grade Assessments
History and social science 3rd grade
Assessments 2005 2006 2007 2008Region 89.0% 91.0% 93.0% 93.0%Virginia 89.0% 91.0% 92.0% 93.0%Roanoke Region % Difference from Virginia
0.0% 0.0% 1.0% 0.0%
Assessment scores remained the same in 2008 with the state
showing a 1% improvement to match the Region in history &
social science.

Council of Community Services 2009 Edition Roanoke Regional Community Indicators Page 18
Region 3rd Grade Assessments-Mathematics
2005 2006 2007 2008
Region 87.0% 91.0% 92.0% 91.0%
Virginia 88.0% 90.0% 89.0% 89.0%
84.0%85.0%86.0%87.0%88.0%89.0%90.0%91.0%92.0%93.0%
Axis Title
Mathematics 3rd Grade Assessments
Mathematics 3rd grade Assessments 2005 2006 2007 2008Region 87.0% 91.0% 92.0% 91.0%Virginia 88.0% 90.0% 89.0% 89.0%Roanoke Region % Difference from Virginia
-1.0% 1.0% 3.0% 2.0%
The Region dropped one percentage point in 2008 in math assessments but remained two percentage points ahead of the
state.

Council of Community Services 2009 Edition Roanoke Regional Community Indicators Page 19
Region 3rd Grade Assessments-Reading
2005 2006 2007 2008
Region 78.0% 86.0% 83.0% 87.0%
Virginia 77.0% 84.0% 80.0% 84.0%
72.0%
74.0%
76.0%
78.0%
80.0%
82.0%
84.0%
86.0%
88.0%
Axis Title
Reading 3rd Grade Assessments
Reading 3rd grade Assessments 2005 2006 2007 2008Region 78.0% 86.0% 83.0% 87.0%Virginia 77.0% 84.0% 80.0% 84.0%Roanoke Region % Difference from Virginia
1.0% 2.0% 3.0% 3.0%
Reading assessment scores for the Region improved 4% over 2007 and the Region continues to
outperform the state.
Council of Community Services 2009 Edition Roanoke Regional Community Indicators Page 20
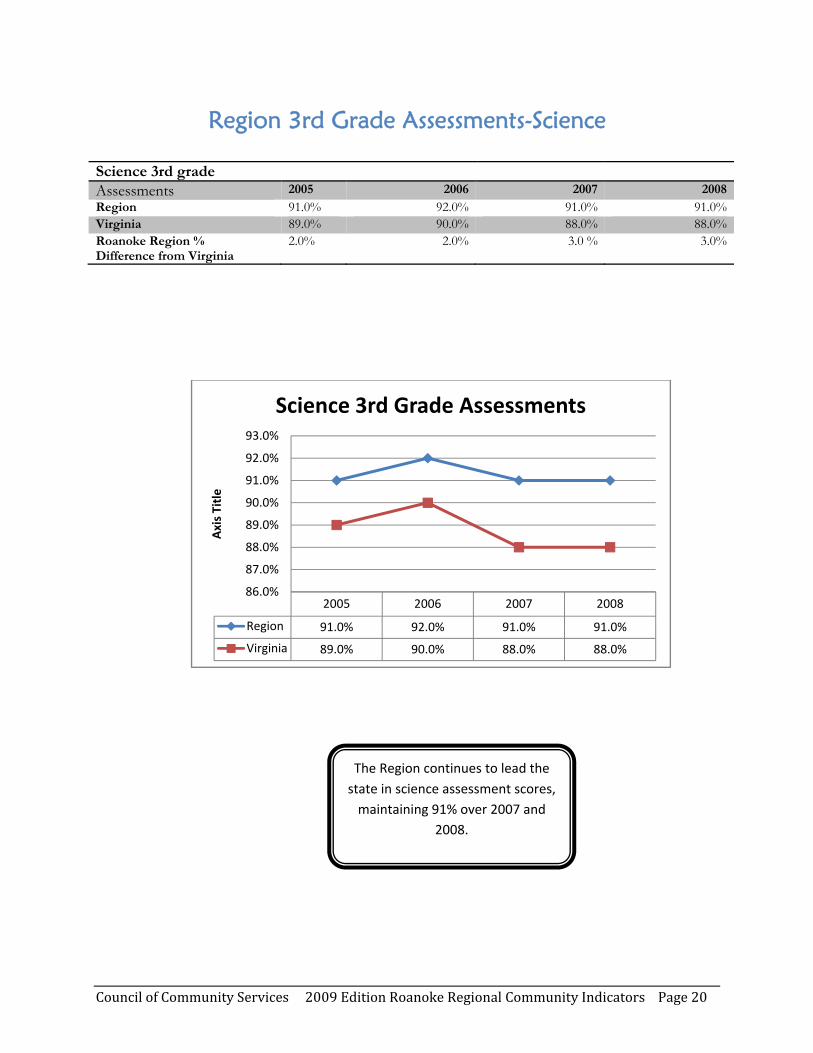
Region 3rd Grade Assessments-Science
2005 2006 2007 2008
Region 91.0% 92.0% 91.0% 91.0%
Virginia 89.0% 90.0% 88.0% 88.0%
86.0%
87.0%
88.0%
89.0%
90.0%
91.0%
92.0%
93.0%
Axis Title
Science 3rd Grade Assessments
Science 3rd grade Assessments 2005 2006 2007 2008Region 91.0% 92.0% 91.0% 91.0%Virginia 89.0% 90.0% 88.0% 88.0%Roanoke Region % Difference from Virginia
2.0% 2.0% 3.0 % 3.0%
The Region continues to lead the state in science assessment scores, maintaining 91% over 2007 and
2008.
Council of Community Services 2009 Edition Roanoke Regional Community Indicators Page 21
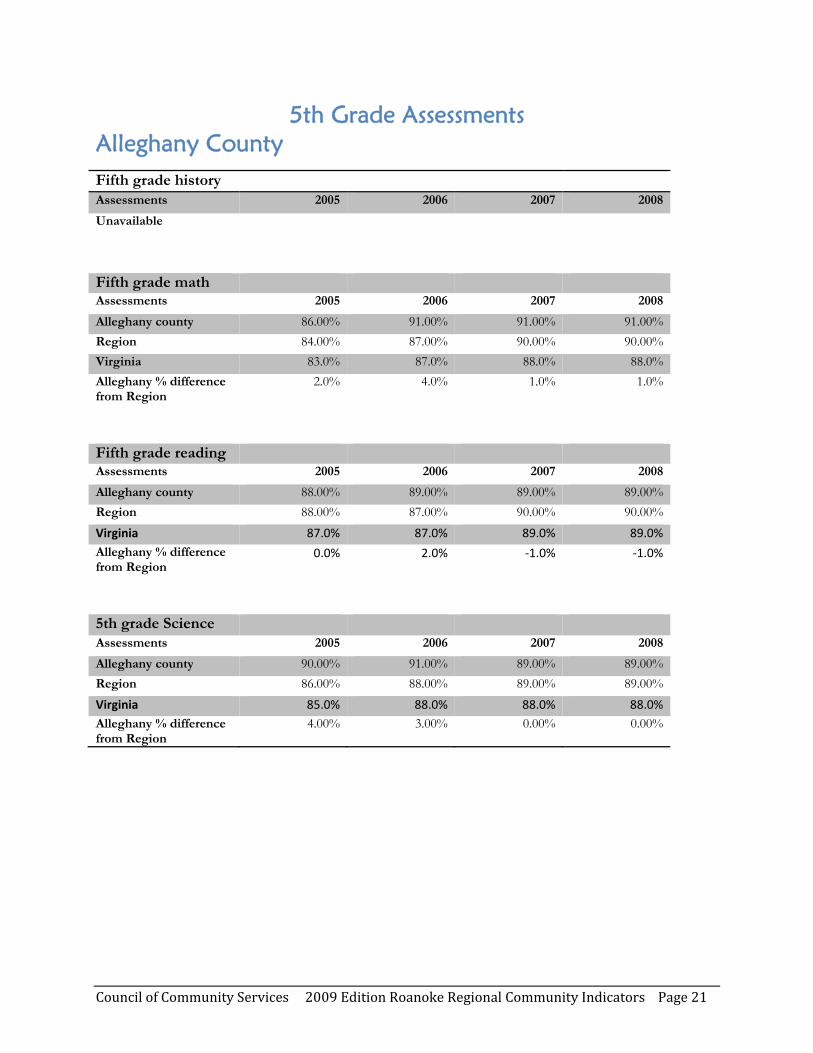
5th Grade Assessments
Alleghany County
Fifth grade history
Assessments 2005 2006 2007 2008
Unavailable
Fifth grade math Assessments 2005 2006 2007 2008
Alleghany county 86.00% 91.00% 91.00% 91.00%Region 84.00% 87.00% 90.00% 90.00%Virginia 83.0% 87.0% 88.0% 88.0%Alleghany % difference from Region
2.0% 4.0% 1.0% 1.0%
Fifth grade reading Assessments 2005 2006 2007 2008
Alleghany county 88.00% 89.00% 89.00% 89.00%Region 88.00% 87.00% 90.00% 90.00%Virginia 87.0% 87.0% 89.0% 89.0%Alleghany % difference from Region
0.0% 2.0% ‐1.0% ‐1.0%
5th grade Science Assessments 2005 2006 2007 2008
Alleghany county 90.00% 91.00% 89.00% 89.00%Region 86.00% 88.00% 89.00% 89.00%Virginia 85.0% 88.0% 88.0% 88.0%Alleghany % difference from Region
4.00% 3.00% 0.00% 0.00%

Council of Community Services 2009 Edition Roanoke Regional Community Indicators Page 22
Botetourt 5th Grade Assessments
Fifth grade history
Assessments 2005 2006 2007 2008
Unavailable
Fifth grade math Assessments 2005 2006 2007 2008
Botetourt county 90.0% 89.0% 90.0% 90.0%Region 84.0% 87.0% 90.0% 90.0%Virginia 83.0% 87.0% 88.0% 88.0%Botetourt % difference from Region
6.0% 2.0% 0.0% 0.0%
Fifth grade reading Assessments 2005 2006 2007 2008
Botetourt county 95.0% 96.0% 92.0% 92.0%Region 88.0% 87.0% 90.0% 90.0%Virginia 87.0% 87.0% 89.0% 89.0%Botetourt % difference from Region
7.0% 9.0% 2.0% 2.0%
5th grade Science Assessments 2005 2006 2007 2008
Botetourt county 94.0% 94.0% 90.0% 90.0%Region 86.0% 88.0% 89.0% 89.0%Virginia 85.0% 88.0% 88.0% 88.0%Botetourt % difference from Region
8.0% 6.0% 1.0% 1.0%
Council of Community Services 2009 Edition Roanoke Regional Community Indicators Page 23
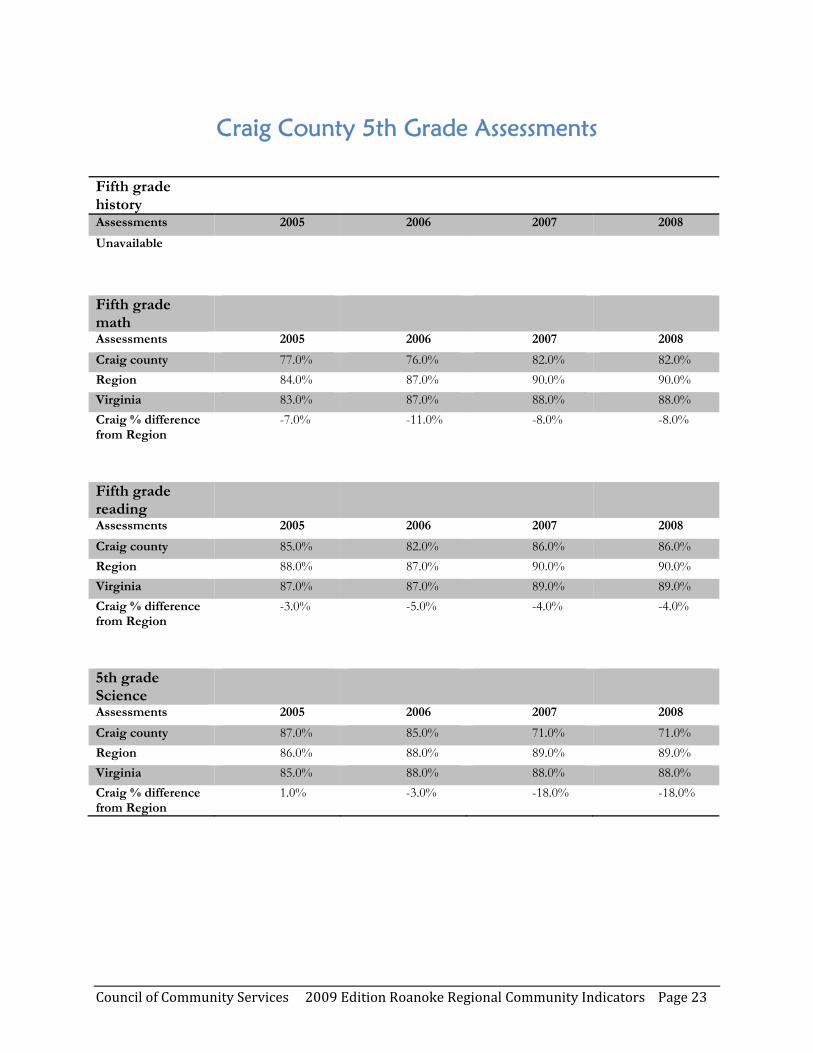
Craig County 5th Grade Assessments
Fifth grade history
Assessments 2005 2006 2007 2008
Unavailable
Fifth grade math
Assessments 2005 2006 2007 2008
Craig county 77.0% 76.0% 82.0% 82.0%Region 84.0% 87.0% 90.0% 90.0%Virginia 83.0% 87.0% 88.0% 88.0%Craig % difference from Region
-7.0% -11.0% -8.0% -8.0%
Fifth grade reading
Assessments 2005 2006 2007 2008
Craig county 85.0% 82.0% 86.0% 86.0%Region 88.0% 87.0% 90.0% 90.0%Virginia 87.0% 87.0% 89.0% 89.0%Craig % difference from Region
-3.0% -5.0% -4.0% -4.0%
5th grade Science
Assessments 2005 2006 2007 2008
Craig county 87.0% 85.0% 71.0% 71.0%Region 86.0% 88.0% 89.0% 89.0%Virginia 85.0% 88.0% 88.0% 88.0%Craig % difference from Region
1.0% -3.0% -18.0% -18.0%
Council of Community Services 2009 Edition Roanoke Regional Community Indicators Page 24
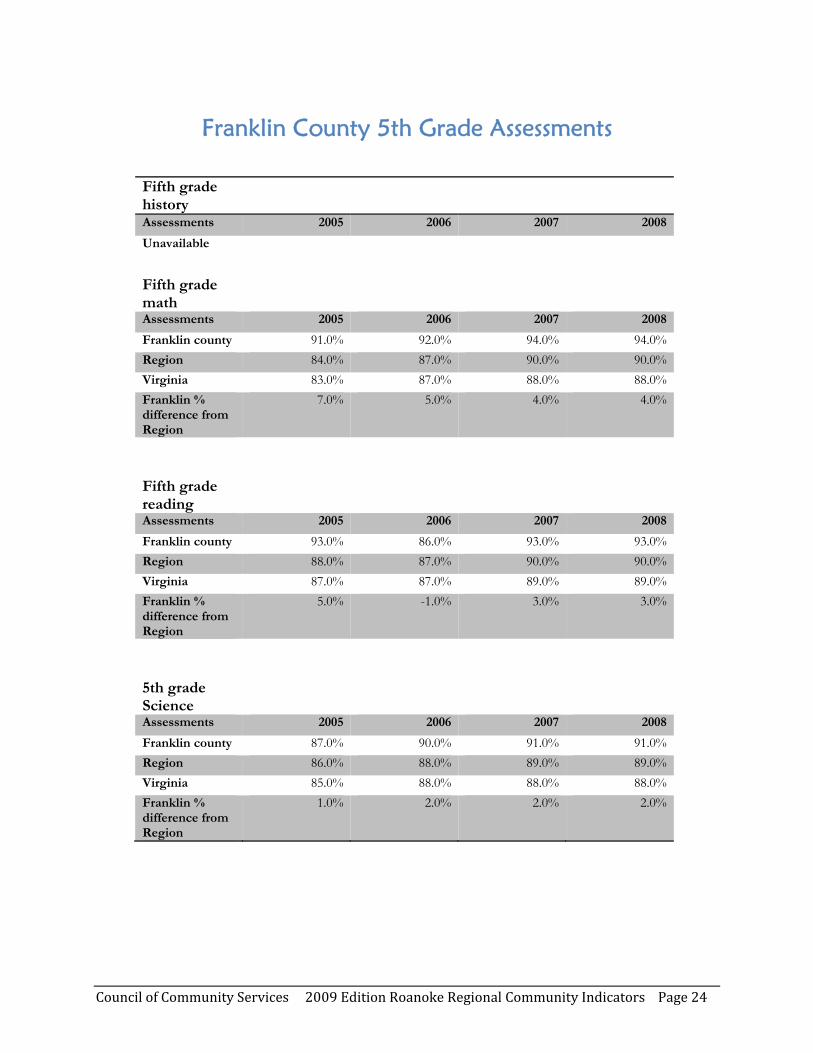
Franklin County 5th Grade Assessments
Fifth grade history
Assessments 2005 2006 2007 2008
Unavailable
Fifth grade math
Assessments 2005 2006 2007 2008
Franklin county 91.0% 92.0% 94.0% 94.0%Region 84.0% 87.0% 90.0% 90.0%Virginia 83.0% 87.0% 88.0% 88.0%Franklin % difference from Region
7.0% 5.0% 4.0% 4.0%
Fifth grade reading
Assessments 2005 2006 2007 2008
Franklin county 93.0% 86.0% 93.0% 93.0%Region 88.0% 87.0% 90.0% 90.0%Virginia 87.0% 87.0% 89.0% 89.0%Franklin % difference from Region
5.0% -1.0% 3.0% 3.0%
5th grade Science
Assessments 2005 2006 2007 2008
Franklin county 87.0% 90.0% 91.0% 91.0%Region 86.0% 88.0% 89.0% 89.0%Virginia 85.0% 88.0% 88.0% 88.0%Franklin % difference from Region
1.0% 2.0% 2.0% 2.0%
Council of Community Services 2009 Edition Roanoke Regional Community Indicators Page 25
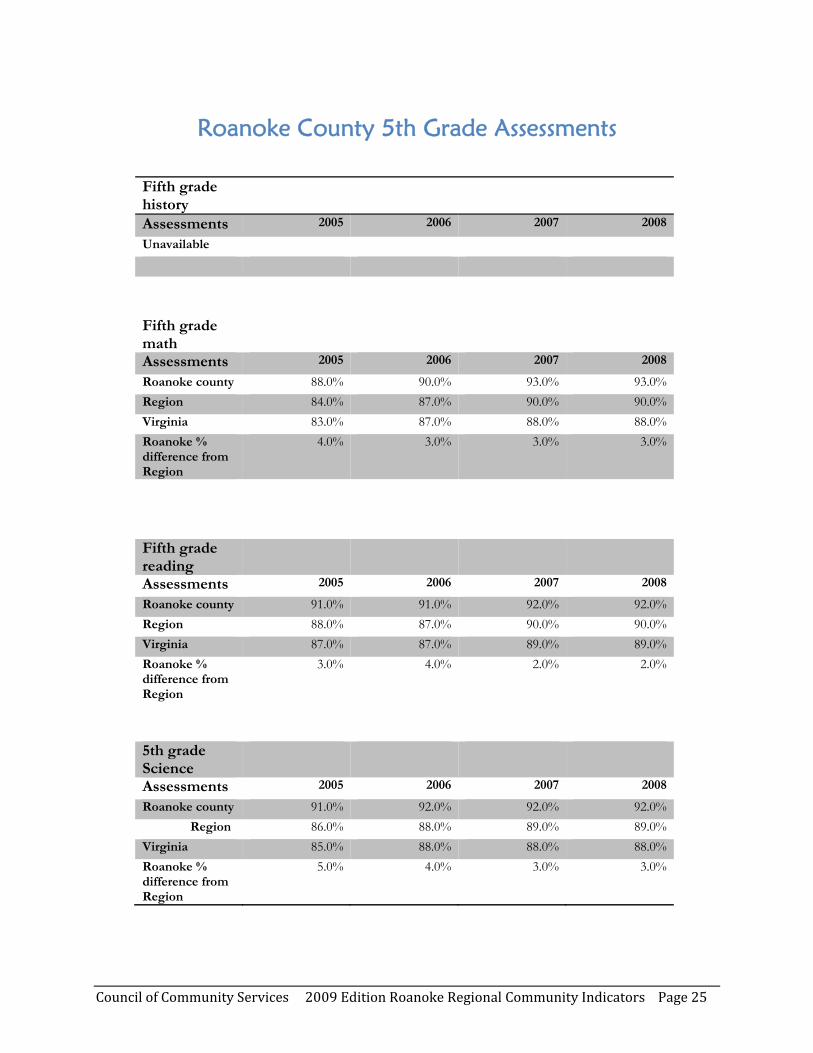
Roanoke County 5th Grade Assessments
Fifth grade history
Assessments 2005 2006 2007 2008
Unavailable
Fifth grade math
Assessments 2005 2006 2007 2008
Roanoke county 88.0% 90.0% 93.0% 93.0%Region 84.0% 87.0% 90.0% 90.0%Virginia 83.0% 87.0% 88.0% 88.0%Roanoke % difference from Region
4.0% 3.0% 3.0% 3.0%
Fifth grade reading
Assessments 2005 2006 2007 2008
Roanoke county 91.0% 91.0% 92.0% 92.0%Region 88.0% 87.0% 90.0% 90.0%Virginia 87.0% 87.0% 89.0% 89.0%Roanoke % difference from Region
3.0% 4.0% 2.0% 2.0%
5th grade Science
Assessments 2005 2006 2007 2008
Roanoke county 91.0% 92.0% 92.0% 92.0%Region 86.0% 88.0% 89.0% 89.0%
Virginia 85.0% 88.0% 88.0% 88.0%Roanoke % difference from Region
5.0% 4.0% 3.0% 3.0%
Council of Community Services 2009 Edition Roanoke Regional Community Indicators Page 26
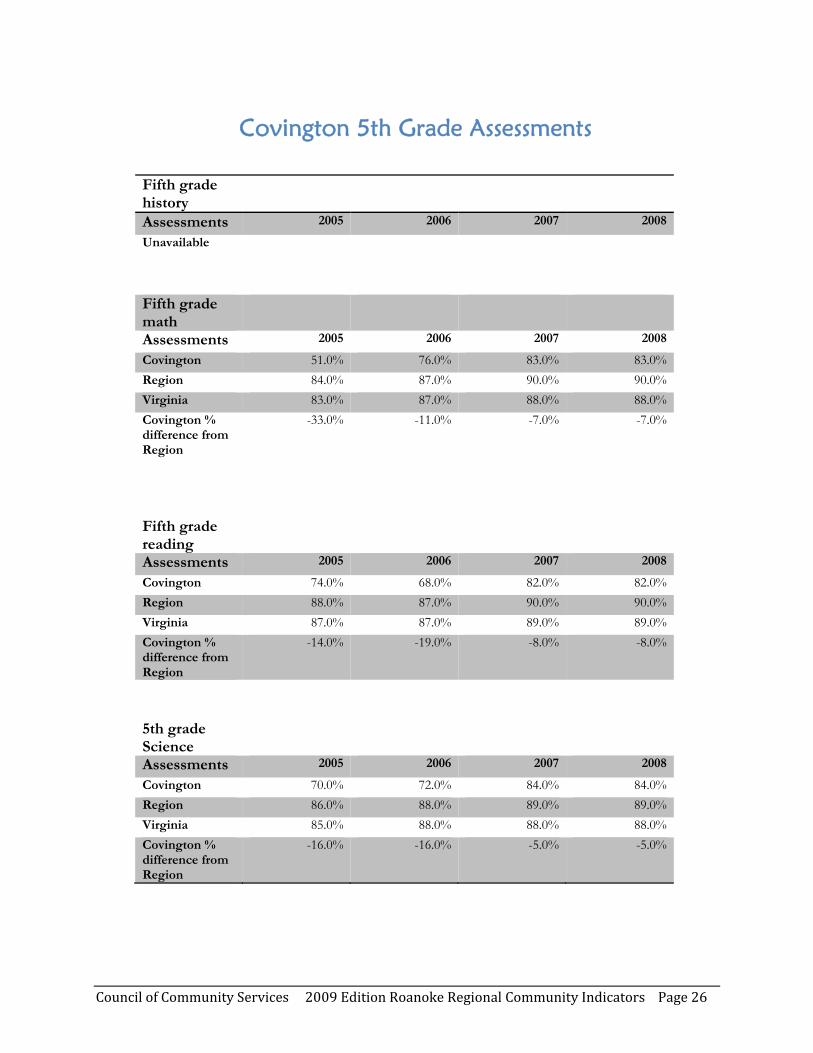
Covington 5th Grade Assessments
Fifth grade history
Assessments 2005 2006 2007 2008
Unavailable
Fifth grade math
Assessments 2005 2006 2007 2008
Covington 51.0% 76.0% 83.0% 83.0%Region 84.0% 87.0% 90.0% 90.0%Virginia 83.0% 87.0% 88.0% 88.0%Covington % difference from Region
-33.0% -11.0% -7.0% -7.0%
Fifth grade reading
Assessments 2005 2006 2007 2008
Covington 74.0% 68.0% 82.0% 82.0%Region 88.0% 87.0% 90.0% 90.0%Virginia 87.0% 87.0% 89.0% 89.0%Covington % difference from Region
-14.0% -19.0% -8.0% -8.0%
5th grade Science
Assessments 2005 2006 2007 2008
Covington 70.0% 72.0% 84.0% 84.0%Region 86.0% 88.0% 89.0% 89.0%Virginia 85.0% 88.0% 88.0% 88.0%Covington % difference from Region
-16.0% -16.0% -5.0% -5.0%
Council of Community Services 2009 Edition Roanoke Regional Community Indicators Page 27
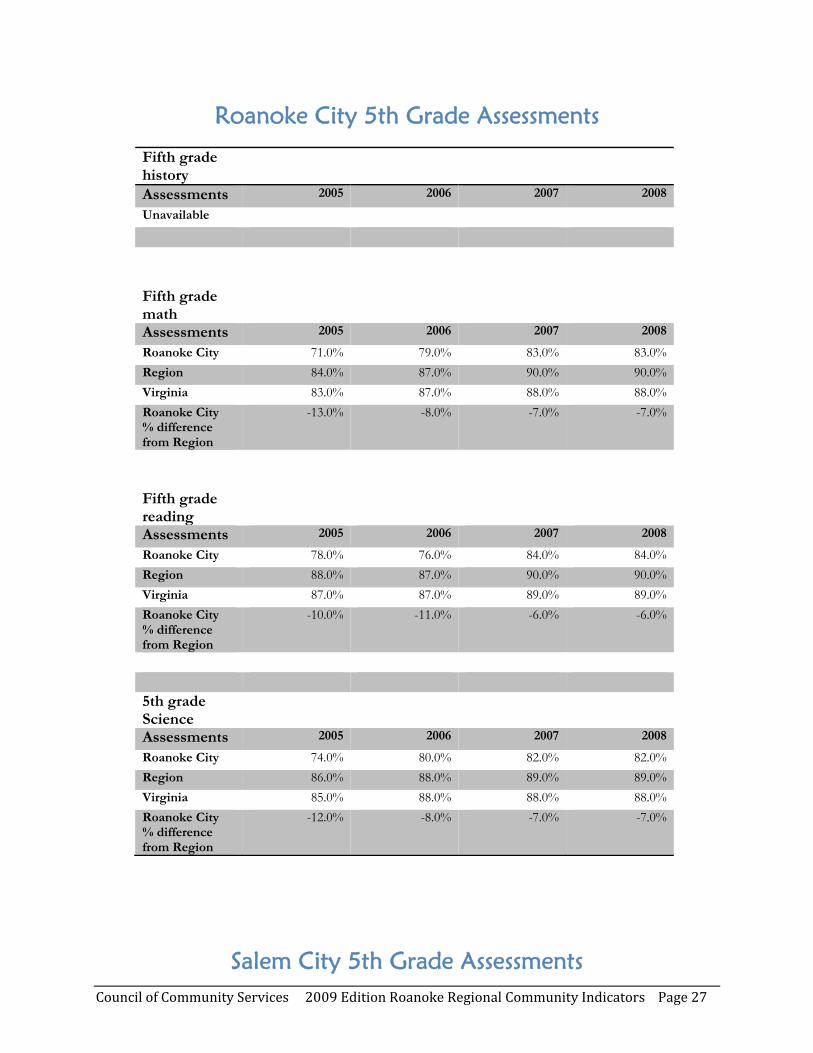
Roanoke City 5th Grade Assessments
Fifth grade history
Assessments 2005 2006 2007 2008
Unavailable
Fifth grade math
Assessments 2005 2006 2007 2008
Roanoke City 71.0% 79.0% 83.0% 83.0%Region 84.0% 87.0% 90.0% 90.0%Virginia 83.0% 87.0% 88.0% 88.0%Roanoke City % difference from Region
-13.0% -8.0% -7.0% -7.0%
Fifth grade reading
Assessments 2005 2006 2007 2008
Roanoke City 78.0% 76.0% 84.0% 84.0%Region 88.0% 87.0% 90.0% 90.0%Virginia 87.0% 87.0% 89.0% 89.0%Roanoke City % difference from Region
-10.0% -11.0% -6.0% -6.0%
5th grade Science
Assessments 2005 2006 2007 2008
Roanoke City 74.0% 80.0% 82.0% 82.0%Region 86.0% 88.0% 89.0% 89.0%Virginia 85.0% 88.0% 88.0% 88.0%Roanoke City % difference from Region
-12.0% -8.0% -7.0% -7.0%
Salem City 5th Grade Assessments
Council of Community Services 2009 Edition Roanoke Regional Community Indicators Page 28
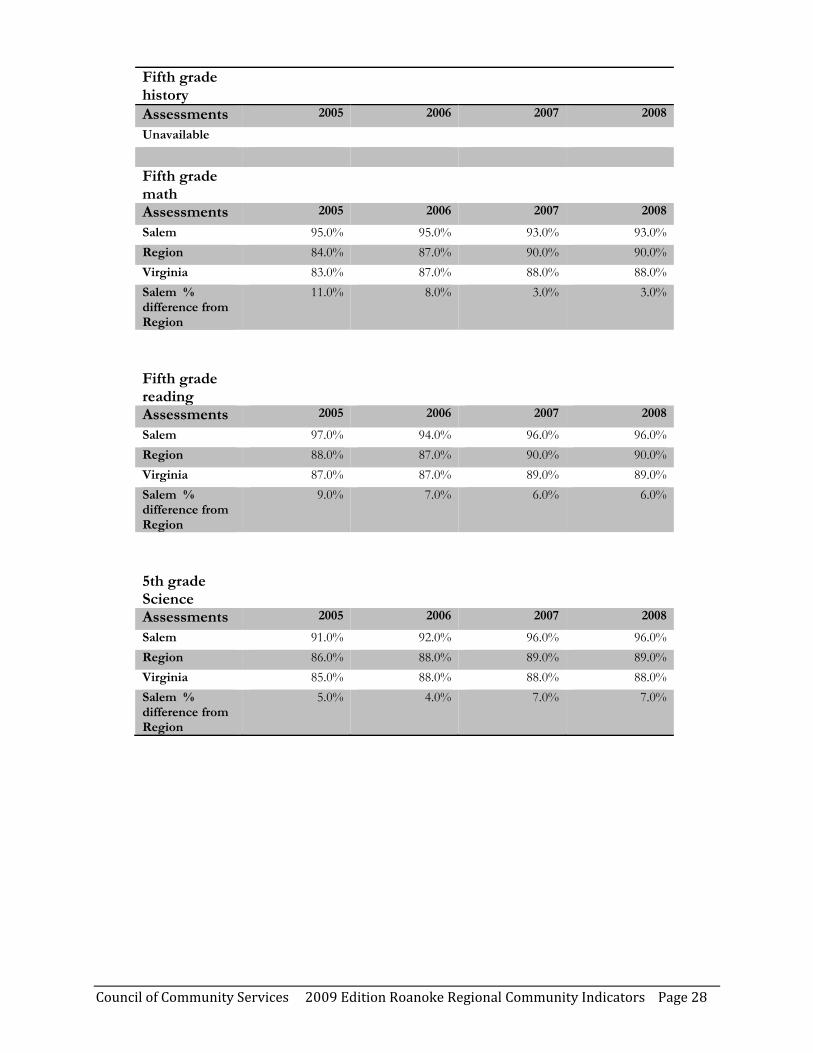
Fifth grade history
Assessments 2005 2006 2007 2008
Unavailable
Fifth grade math
Assessments 2005 2006 2007 2008
Salem 95.0% 95.0% 93.0% 93.0%Region 84.0% 87.0% 90.0% 90.0%Virginia 83.0% 87.0% 88.0% 88.0%Salem % difference from Region
11.0% 8.0% 3.0% 3.0%
Fifth grade reading
Assessments 2005 2006 2007 2008
Salem 97.0% 94.0% 96.0% 96.0%Region 88.0% 87.0% 90.0% 90.0%Virginia 87.0% 87.0% 89.0% 89.0%Salem % difference from Region
9.0% 7.0% 6.0% 6.0%
5th grade Science
Assessments 2005 2006 2007 2008
Salem 91.0% 92.0% 96.0% 96.0%Region 86.0% 88.0% 89.0% 89.0%Virginia 85.0% 88.0% 88.0% 88.0%Salem % difference from Region
5.0% 4.0% 7.0% 7.0%

Council of Community Services 2009 Edition Roanoke Regional Community Indicators Page 29
Region 5th Grade Assessments-Mathematics
2005 2006 2007 2008
Region 84.0% 87.0% 90.0% 90.0%
Virginia 83.0% 87.0% 88.0% 88.0%
78.0%
80.0%
82.0%
84.0%
86.0%
88.0%
90.0%
92.0%
Axis Title
Mathematics‐5th Grade Assessments
Fifth grade Math
Assessments 2005 2006 2007 2008Region 84.0% 87.0% 90.0% 90.0%Virginia 83.0% 87.0% 88.0% 88.0%Roanoke Region % difference from Virginia
1.0% 0.0% 2.0% 2.0%
Over the past two years the Region’s mathematics assessment scores have remained at 90%
which exceeds the scores of the state by two percentage points.
Council of Community Services 2009 Edition Roanoke Regional Community Indicators Page 30
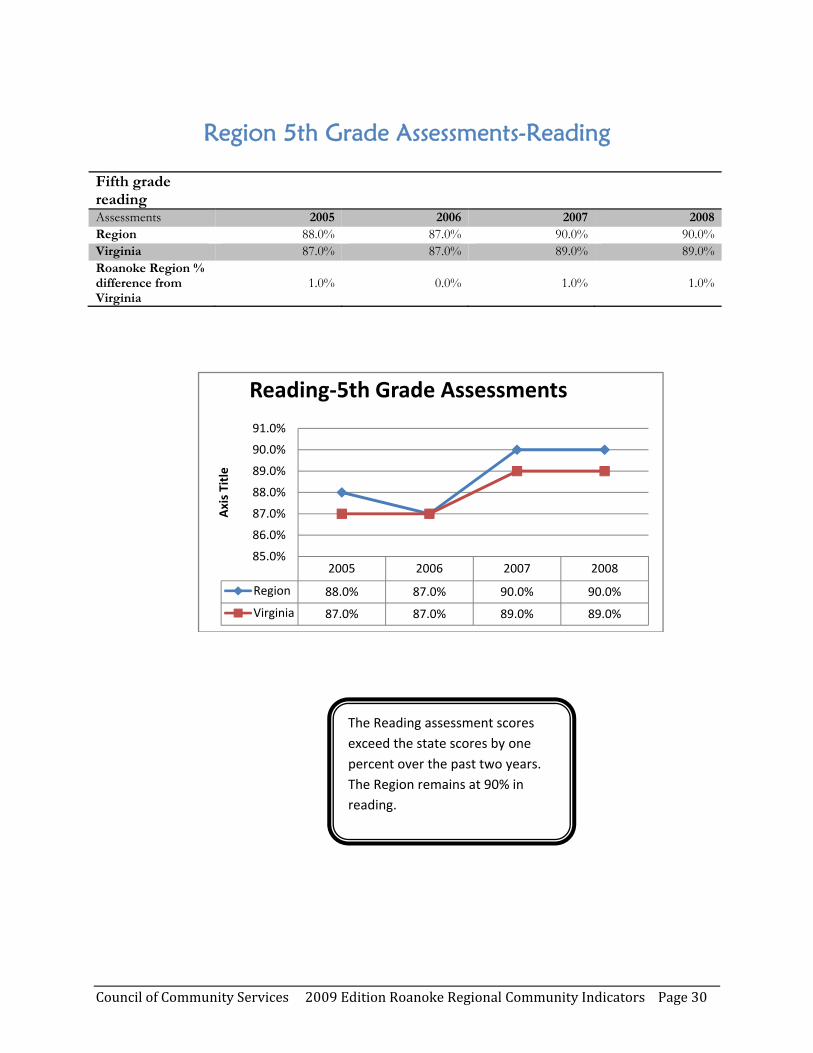
Region 5th Grade Assessments-Reading
2005 2006 2007 2008
Region 88.0% 87.0% 90.0% 90.0%
Virginia 87.0% 87.0% 89.0% 89.0%
85.0%
86.0%
87.0%
88.0%
89.0%
90.0%
91.0%
Axis Title
Reading‐5th Grade Assessments
Fifth grade reading
Assessments 2005 2006 2007 2008Region 88.0% 87.0% 90.0% 90.0%Virginia 87.0% 87.0% 89.0% 89.0%Roanoke Region % difference from Virginia
1.0% 0.0% 1.0% 1.0%
The Reading assessment scores exceed the state scores by one percent over the past two years. The Region remains at 90% in reading.
Council of Community Services 2009 Edition Roanoke Regional Community Indicators Page 31
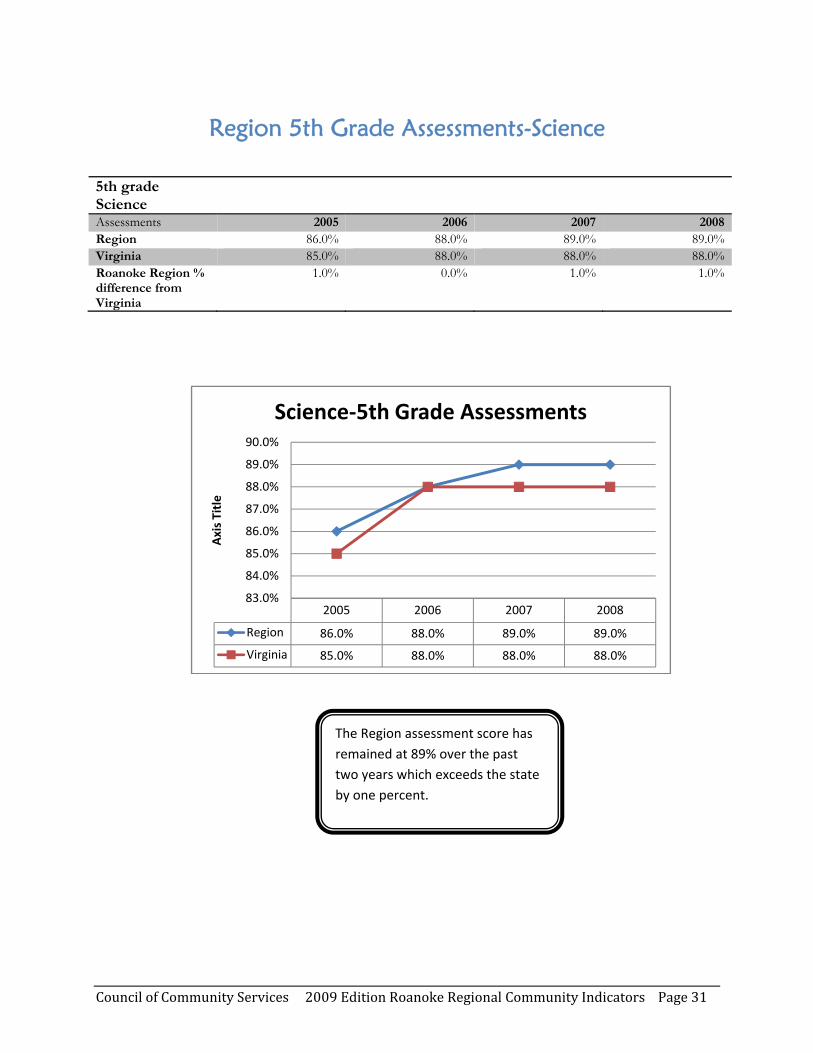
Region 5th Grade Assessments-Science
2005 2006 2007 2008
Region 86.0% 88.0% 89.0% 89.0%
Virginia 85.0% 88.0% 88.0% 88.0%
83.0%
84.0%
85.0%
86.0%
87.0%
88.0%
89.0%
90.0%
Axis Title
Science‐5th Grade Assessments
5th grade Science
Assessments 2005 2006 2007 2008Region 86.0% 88.0% 89.0% 89.0%Virginia 85.0% 88.0% 88.0% 88.0%Roanoke Region % difference from Virginia
1.0% 0.0% 1.0% 1.0%
The Region assessment score has remained at 89% over the past two years which exceeds the state by one percent.

Council of Community Services 2009 Edition Roanoke Regional Community Indicators Page 32
8th Grade Assessments
Alleghany County
Eighth grade science
Assessments 2005 2006 2007 2008
Alleghany county 90.0% 87.0% 90.0% 90.0% Region 90.0% 89.0% 90.0% 90.0% Virginia 87.0% 89.0% 90.0% 90.0% % difference from Region
0.0% -2.0% 0.0% 0.0%
Eighth grade math
Assessments 2005 2006 2007 2008
Alleghany county 75.0% 84.0% 89.0% 89.0% Region 81.0% 81.0% 85.0% 85.0% Virginia 76.0% 77.0% 83.0% 83.0% % difference from Region
-6.0% 3.0% 4.0% 4.0%
Eighth grade reading
Assessments 2005 2006 2007 2008
Alleghany county 90.0% 90.0% 87.0% 87.0% Region 83.0% 80.0% 84.0% 84.0% Virginia 78.0% 80.0% 83.0% 83.0% % difference from Region
7.0% 10.0% 3.0% 3.0%
Council of Community Services 2009 Edition Roanoke Regional Community Indicators Page 33
Botetourt County 8th Grade Assessments
Eighth grade science
Assessments 2005 2006 2007 2008
Botetourt county
94.0% 94.0% 96.0% 96.0%
Region 90.0% 89.0% 90.0% 90.0%Virginia 87.0% 89.0% 90.0% 90.0%% difference from Region
4.0% 5.0% 6.0% 6.0%
Eighth grade math
Assessments 2005 2006 2007 2008
Botetourt county
83.0% 87.0% 92.0% 92.0%
Region 81.0% 81.0% 85.0% 85.0%Virginia 76.0% 77.0% 83.0% 83.0%% difference from Region
2.0% 6.0% 7.0% 7.0%
Eighth grade reading
Assessments 2005 2006 2007 2008
Botetourt county
83.0% 89.0% 86.0% 86.0%
Region 83.0% 80.0% 84.0% 84.0%Virginia 78.0% 80.0% 83.0% 83.0%% difference from Region
0.0% 9.0% 2.0% 2.0%
Council of Community Services 2009 Edition Roanoke Regional Community Indicators Page 34
Craig County 8th Grade Assessments
Eighth grade science
Assessments 2005 2006 2007 2008
Craig county 89.0% 91.0% 94.0% 94.0%Region 90.0% 89.0% 90.0% 90.0%Virginia 87.0% 89.0% 90.0% 90.0%% difference from Region
-1.0% 2.0% 4.0% 4.0%
Eighth grade math
Assessments 2005 2006 2007 2008
Craig county 52.0% 56.0% 85.0% 85.0%Region 81.0% 81.0% 85.0% 85.0%Virginia 76.0% 77.0% 83.0% 83.0%% difference from Region
-29.0% -25.0% 0.0% 0.0%
Eighth grade reading
Assessments 2005 2006 2007 2008
Craig county 73.0% 77.0% 92.0% 92.0%Region 83.0% 80.0% 84.0% 84.0%Virginia 78.0% 80.0% 83.0% 83.0%% difference from Region
-10.0% -3.0% 8.0% 8.0%
Council of Community Services 2009 Edition Roanoke Regional Community Indicators Page 35
Franklin County 8th Grade Assessments
Eighth grade science
Assessments 2005 2006 2007 2008
Franklin county 92.0% 91.0% 89.0% 89.0%Region 90.0% 89.0% 90.0% 90.0%Virginia 87.0% 89.0% 90.0% 90.0%% difference from Region
2.0% 2.0% -1.0% -1.0%
Eighth grade math
Assessments 2005 2006 2007 2008
Franklin county 84.0% 85.0% 88.0% 88.0%Region 81.0% 81.0% 85.0% 85.0%Virginia 76.0% 77.0% 83.0% 83.0%% difference from Region
3.0% 4.0% 3.0% 3.0%
Eighth grade reading
Assessments 2005 2006 2007 2008
Franklin county 87.0% 85.0% 85.0% 85.0%Region 83.0% 80.0% 84.0% 84.0%Virginia 78.0% 80.0% 83.0% 83.0%% difference from Region
4.0% 5.0% 1.0% 1.0%
Council of Community Services 2009 Edition Roanoke Regional Community Indicators Page 36
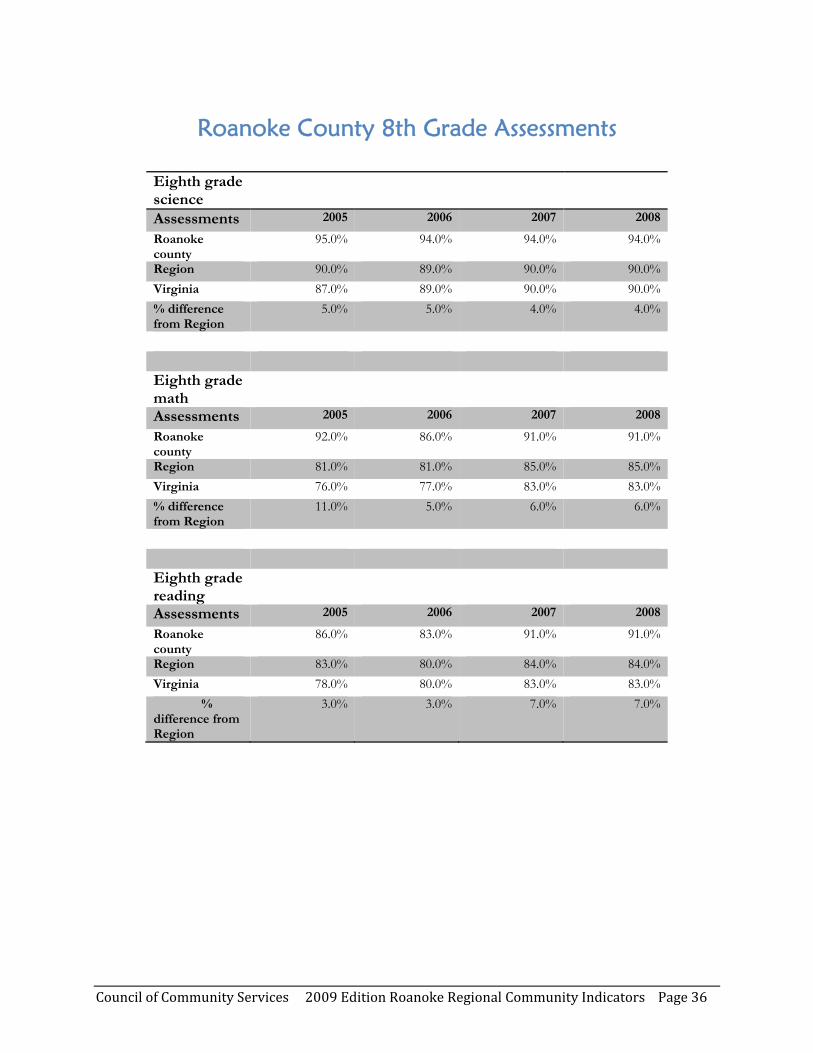
Roanoke County 8th Grade Assessments
Eighth grade science
Assessments 2005 2006 2007 2008
Roanoke county
95.0% 94.0% 94.0% 94.0%
Region 90.0% 89.0% 90.0% 90.0%Virginia 87.0% 89.0% 90.0% 90.0%% difference from Region
5.0% 5.0% 4.0% 4.0%
Eighth grade math
Assessments 2005 2006 2007 2008
Roanoke county
92.0% 86.0% 91.0% 91.0%
Region 81.0% 81.0% 85.0% 85.0%Virginia 76.0% 77.0% 83.0% 83.0%% difference from Region
11.0% 5.0% 6.0% 6.0%
Eighth grade reading
Assessments 2005 2006 2007 2008
Roanoke county
86.0% 83.0% 91.0% 91.0%
Region 83.0% 80.0% 84.0% 84.0%Virginia 78.0% 80.0% 83.0% 83.0%
% difference from Region
3.0% 3.0% 7.0% 7.0%

Council of Community Services 2009 Edition Roanoke Regional Community Indicators Page 37
Covington 8th Grade Assessments
Eighth grade science
Assessments 2005 2006 2007 2008
Covington 89.0% 88.0% 86.0% 86.0%Region 90.0% 89.0% 90.0% 90.0%Virginia 87.0% 89.0% 90.0% 90.0%% difference from Region
-1.0% -1.0% -4.0% -4.0%
Eighth grade math
Assessments 2005 2006 2007 2008
Covington 79.0% 62.0% 60.0% 60.0%Region 81.0% 81.0% 85.0% 85.0%Virginia 76.0% 77.0% 83.0% 83.0%% difference from Region
-2.0% -19.0% -25.0% -25.0%
Eighth grade reading
Assessments 2005 2006 2007 2008
Covington 89.0% 61.0% 69.0% 69.0%Region 83.0% 80.0% 84.0% 84.0%Virginia 78.0% 80.0% 83.0% 83.0%% difference from Region
6.0% -19.0% -15.0% -15.0%

Council of Community Services 2009 Edition Roanoke Regional Community Indicators Page 38
Roanoke City 8th Grade Assessments
Eighth grade science
Assessments 2005 2006 2007 2008
Roanoke City 78.0% 78.0% 81.0% 81.0%Region 90.0% 89.0% 90.0% 90.0%Virginia 87.0% 89.0% 90.0% 90.0%% difference from Region
-12.0% -11.0% -9.0% -9.0%
Eighth grade math
Assessments 2005 2006 2007 2008
Roanoke City 62.0% 70.0% 70.0% 70.0%Region 81.0% 81.0% 85.0% 85.0%Virginia 76.0% 77.0% 83.0% 83.0%% difference from Region
-19.0% -11.0% -15.0% -15.0%
Eighth grade reading
Assessments 2005 2006 2007 2008
Roanoke City 72.0% 67.0% 69.0% 69.0%Region 83.0% 80.0% 84.0% 84.0%Virginia 78.0% 80.0% 83.0% 83.0%% difference from Region
-11.0% -13.0% -15.0% -15.0%
Council of Community Services 2009 Edition Roanoke Regional Community Indicators Page 39
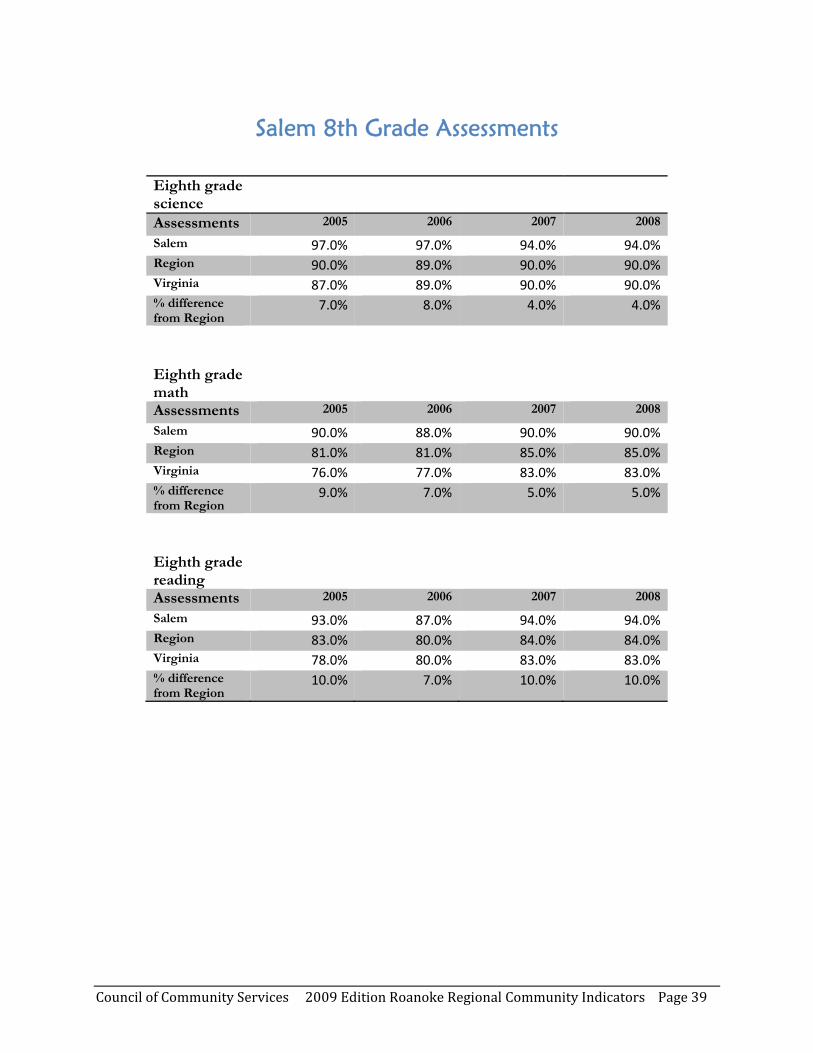
Salem 8th Grade Assessments
Eighth grade science
Assessments 2005 2006 2007 2008
Salem 97.0% 97.0% 94.0% 94.0%Region 90.0% 89.0% 90.0% 90.0%Virginia 87.0% 89.0% 90.0% 90.0%% difference from Region
7.0% 8.0% 4.0% 4.0%
Eighth grade math
Assessments 2005 2006 2007 2008
Salem 90.0% 88.0% 90.0% 90.0%Region 81.0% 81.0% 85.0% 85.0%Virginia 76.0% 77.0% 83.0% 83.0%% difference from Region
9.0% 7.0% 5.0% 5.0%
Eighth grade reading
Assessments 2005 2006 2007 2008
Salem 93.0% 87.0% 94.0% 94.0%Region 83.0% 80.0% 84.0% 84.0%Virginia 78.0% 80.0% 83.0% 83.0%% difference from Region
10.0% 7.0% 10.0% 10.0%
Council of Community Services 2009 Edition Roanoke Regional Community Indicators Page 40
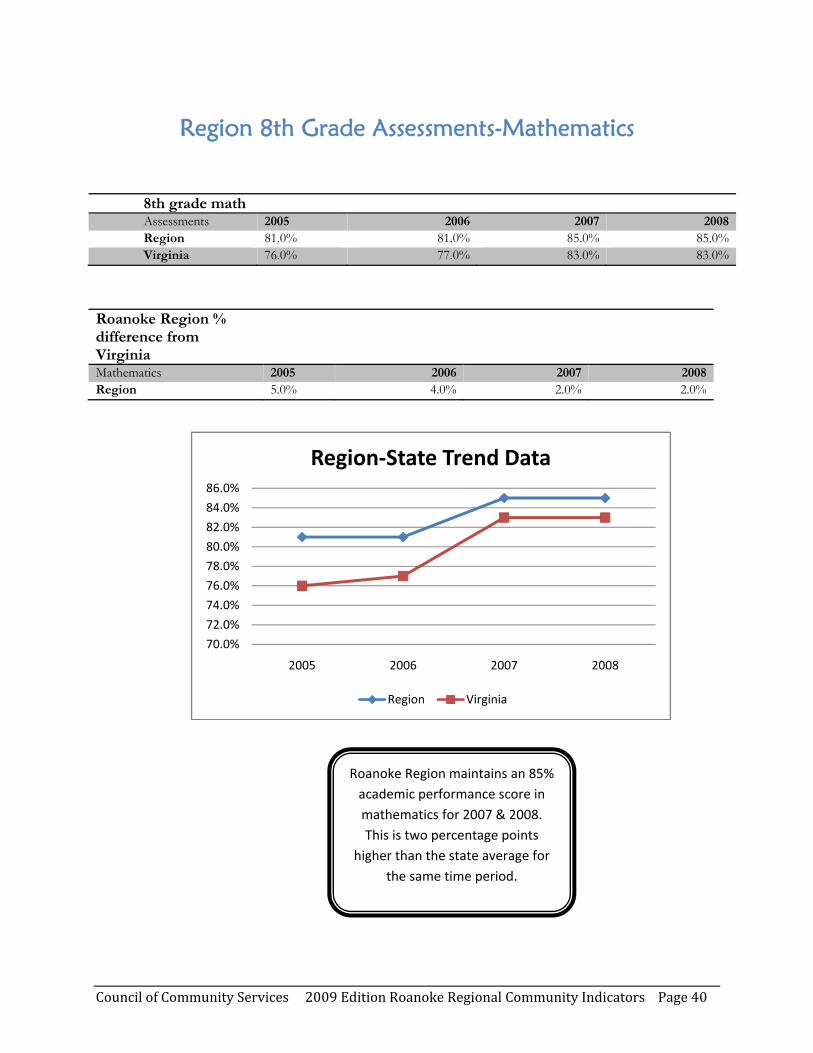
Region 8th Grade Assessments-Mathematics
8th grade math Assessments 2005 2006 2007 2008Region 81.0% 81.0% 85.0% 85.0%Virginia 76.0% 77.0% 83.0% 83.0%
Roanoke Region % difference from Virginia
Mathematics 2005 2006 2007 2008Region 5.0% 4.0% 2.0% 2.0%
70.0%
72.0%
74.0%
76.0%
78.0%
80.0%
82.0%
84.0%
86.0%
2005 2006 2007 2008
Region‐State Trend Data
Region Virginia
Roanoke Region maintains an 85% academic performance score in mathematics for 2007 & 2008. This is two percentage points
higher than the state average for the same time period.
Council of Community Services 2009 Edition Roanoke Regional Community Indicators Page 41
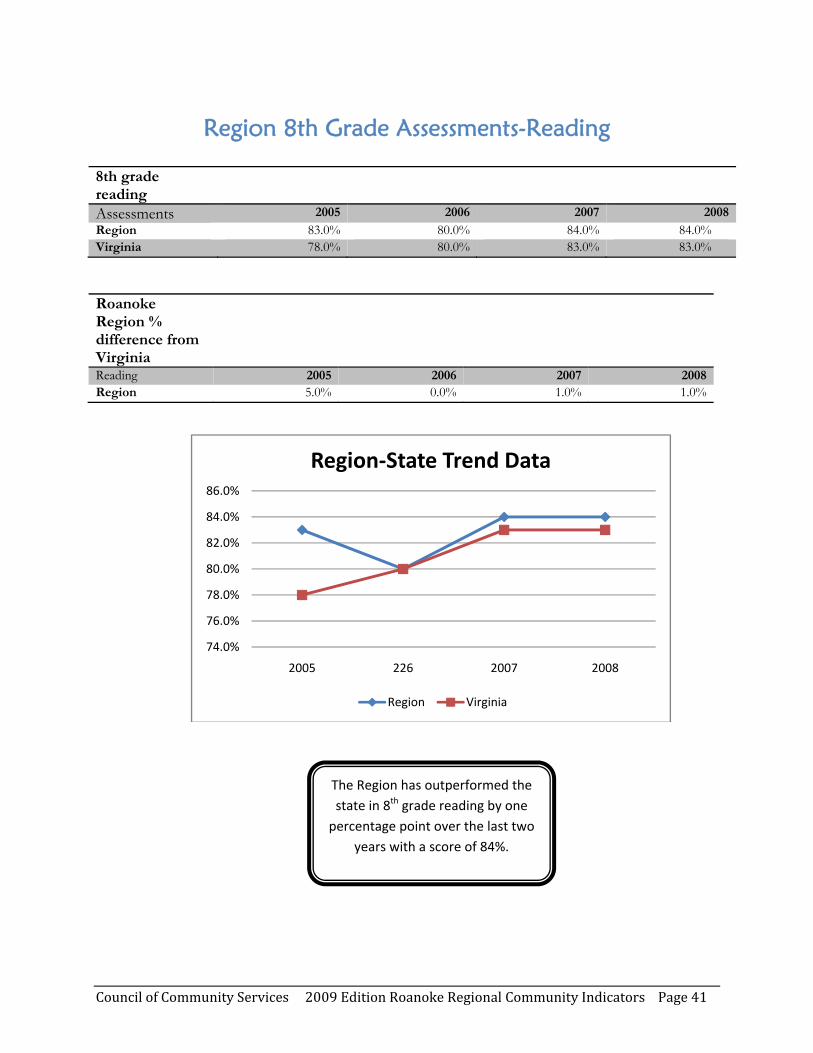
Region 8th Grade Assessments-Reading
Roanoke Region % difference from Virginia
Reading 2005 2006 2007 2008Region 5.0% 0.0% 1.0% 1.0%
74.0%
76.0%
78.0%
80.0%
82.0%
84.0%
86.0%
2005 226 2007 2008
Region‐State Trend Data
Region Virginia
8th grade reading
Assessments 2005 2006 2007 2008Region 83.0% 80.0% 84.0% 84.0%Virginia 78.0% 80.0% 83.0% 83.0%
The Region has outperformed the state in 8th grade reading by one percentage point over the last two
years with a score of 84%.
Council of Community Services 2009 Edition Roanoke Regional Community Indicators Page 42
Region 8th Grade Assessments-Science
Roanoke
Region % difference from Virginia
Science 2005 2006 2007 2008Region 3.0% 0.0% 0.0% 0.0%
85.0%
86.0%
87.0%
88.0%
89.0%
90.0%
91.0%
2005 2006 2007 2008
Region‐State Trend Data
Region Virginia
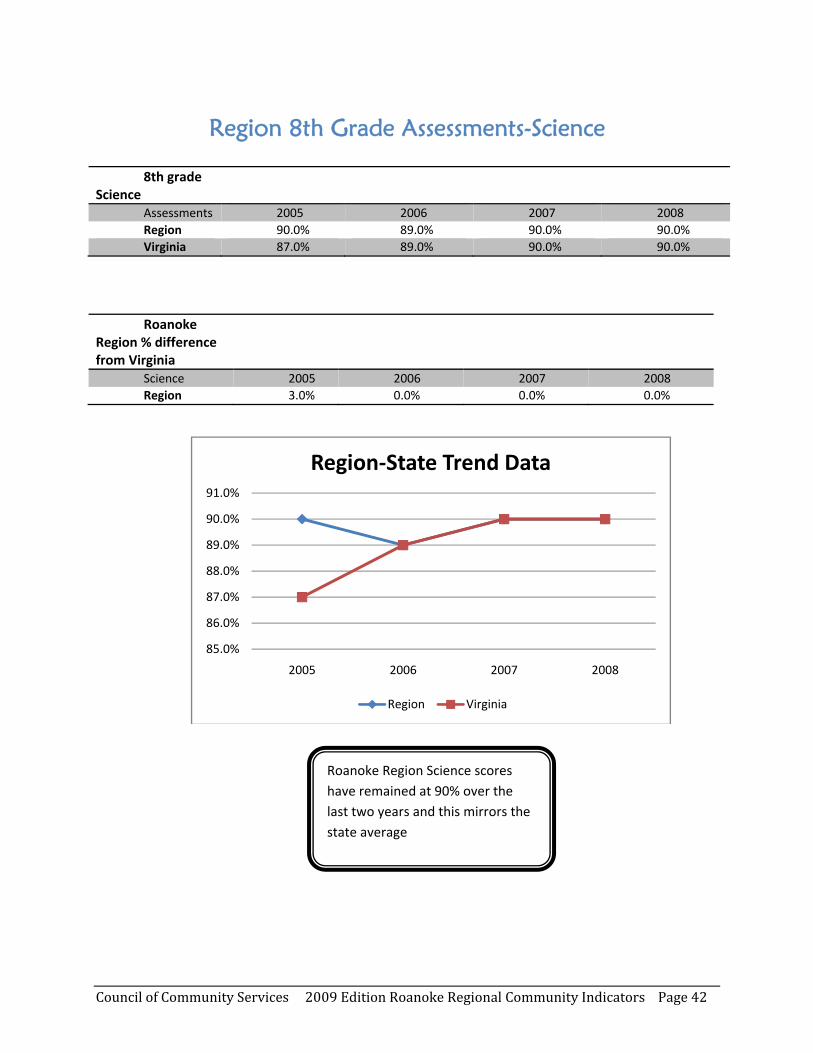
8th grade Science
Assessments 2005 2006 2007 2008Region 90.0% 89.0% 90.0% 90.0%Virginia 87.0% 89.0% 90.0% 90.0%
Roanoke Region Science scores have remained at 90% over the last two years and this mirrors the state average
Council of Community Services 2009 Edition Roanoke Regional Community Indicators Page 43
Percent Graduating High School
High school
Graduate 2005 2006 2007 2008
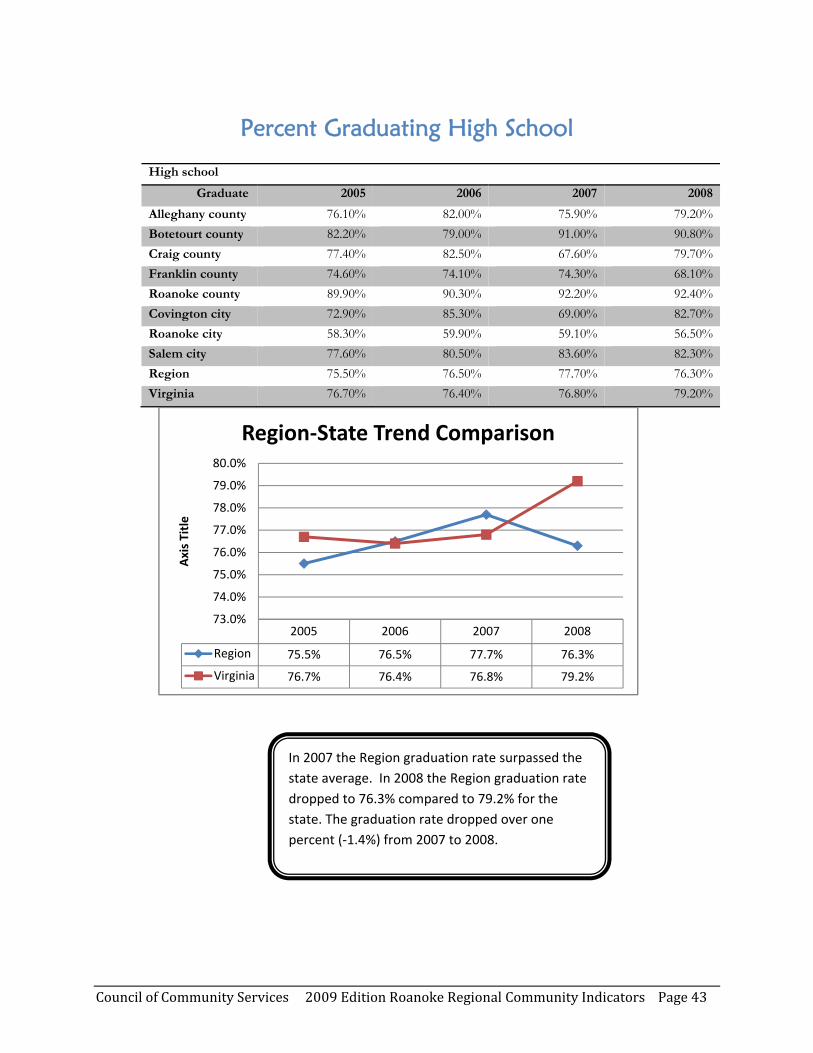
Alleghany county 76.10% 82.00% 75.90% 79.20%Botetourt county 82.20% 79.00% 91.00% 90.80%Craig county 77.40% 82.50% 67.60% 79.70%Franklin county 74.60% 74.10% 74.30% 68.10%Roanoke county 89.90% 90.30% 92.20% 92.40%Covington city 72.90% 85.30% 69.00% 82.70%Roanoke city 58.30% 59.90% 59.10% 56.50%Salem city 77.60% 80.50% 83.60% 82.30%Region 75.50% 76.50% 77.70% 76.30%Virginia 76.70% 76.40% 76.80% 79.20%
2005 2006 2007 2008
Region 75.5% 76.5% 77.7% 76.3%
Virginia 76.7% 76.4% 76.8% 79.2%
73.0%
74.0%
75.0%
76.0%
77.0%
78.0%
79.0%
80.0%
Axis Title
Region‐State Trend Comparison
In 2007 the Region graduation rate surpassed the state average. In 2008 the Region graduation rate dropped to 76.3% compared to 79.2% for the state. The graduation rate dropped over one percent (‐1.4%) from 2007 to 2008.
Council of Community Services 2009 Edition Roanoke Regional Community Indicators Page 44
Educational Attainment-high school diploma or higher
High school diploma or
Higher 1990 2000 2005-2007
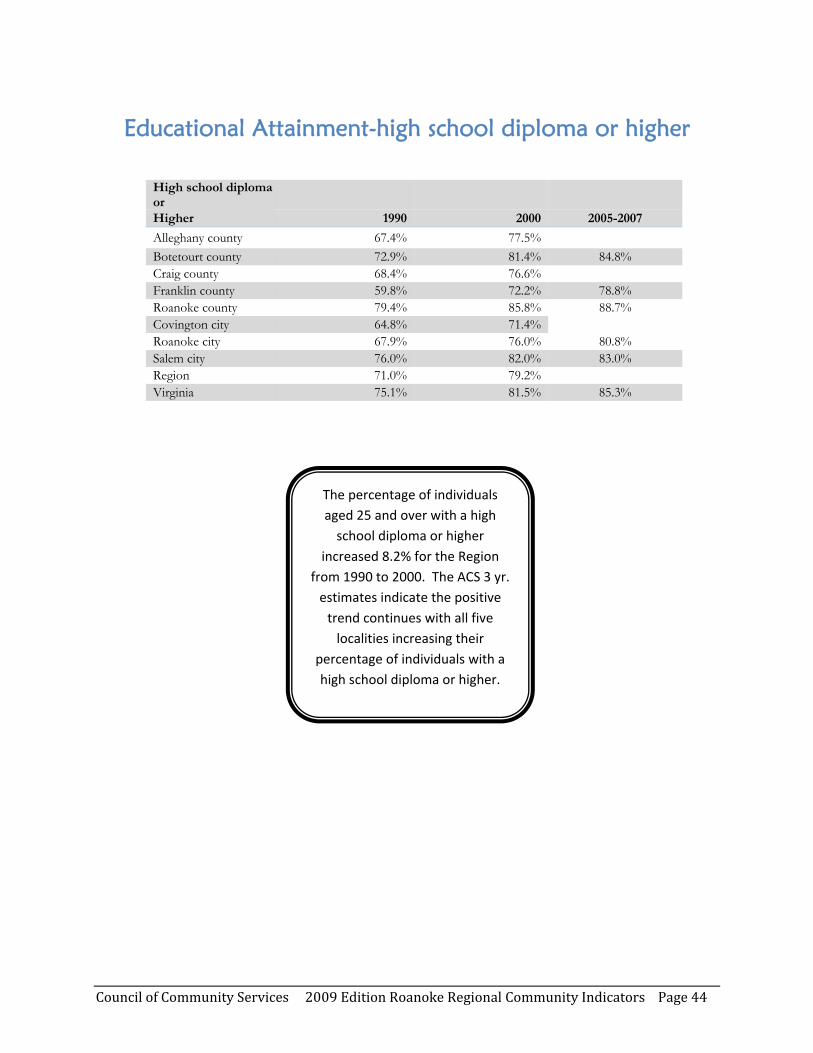
Alleghany county 67.4% 77.5% Botetourt county 72.9% 81.4% 84.8% Craig county 68.4% 76.6% Franklin county 59.8% 72.2% 78.8% Roanoke county 79.4% 85.8% 88.7% Covington city 64.8% 71.4% Roanoke city 67.9% 76.0% 80.8% Salem city 76.0% 82.0% 83.0% Region 71.0% 79.2% Virginia 75.1% 81.5% 85.3%
The percentage of individuals aged 25 and over with a high school diploma or higher
increased 8.2% for the Region from 1990 to 2000. The ACS 3 yr. estimates indicate the positive trend continues with all five localities increasing their
percentage of individuals with a high school diploma or higher.
Council of Community Services 2009 Edition Roanoke Regional Community Indicators Page 45
Educational Attainment-bachelor’s degree or higher
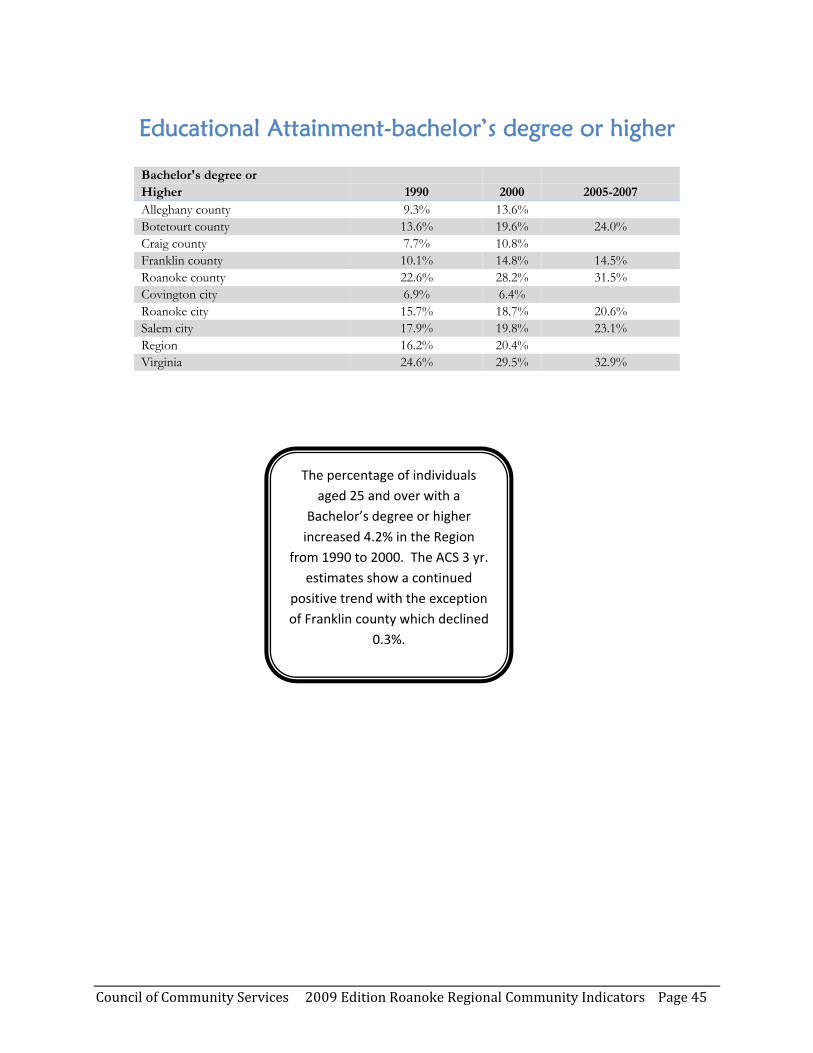
Bachelor's degree or Higher 1990 2000 2005-2007 Alleghany county 9.3% 13.6% Botetourt county 13.6% 19.6% 24.0% Craig county 7.7% 10.8% Franklin county 10.1% 14.8% 14.5% Roanoke county 22.6% 28.2% 31.5% Covington city 6.9% 6.4% Roanoke city 15.7% 18.7% 20.6% Salem city 17.9% 19.8% 23.1% Region 16.2% 20.4% Virginia 24.6% 29.5% 32.9%
The percentage of individuals aged 25 and over with a
Bachelor’s degree or higher increased 4.2% in the Region
from 1990 to 2000. The ACS 3 yr. estimates show a continued
positive trend with the exception of Franklin county which declined
0.3%.
Council of Community Services 2009 Edition Roanoke Regional Community Indicators Page 46
Job Related Indicators • Unemployment Rate
• Unemployment Insurance Payments
• Net Employment Growth
• Job Growth by Industry
Job related indicators are key to describing and understanding the well being of the household economy.

Council of Community Services 2009 Edition Roanoke Regional Community Indicators Page 47
Unemployment Rate Unemployment rate 2005 2006 2007 2008
Alleghany county 4.60% 4.80% 4.30% 5.50% Botetourt county 3.00% 2.60% 2.60% 3.40% Craig county 3.80% 3.40% 3.70% 4.20% Franklin county 3.60% 3.10% 3.30% 5.10% Roanoke county 2.90% 2.60% 2.50% 3.30% Covington city 5.60% 7.10% 5.80% 7.00% Roanoke city 4.10% 3.70% 3.80% 4.80% Salem city 3.10% 2.90% 3.00% 3.80% Region 3.50% 3.20% 3.20% 4.20% Virginia 3.50% 3.00% 3.00% 4.20% % change from 2005 2006 2007 2008 Alleghany county 0.20% -0.30% 0.90% Botetourt county -0.40% -0.40% 0.40% Craig county -0.40% -0.10% 0.40% Franklin county -0.50% -0.30% 1.50% Roanoke county -0.30% -0.40% 0.40% Covington city 1.50% 0.20% 1.40% Roanoke city -0.40% -0.30% 0.70% Salem city -0.20% -0.10% 0.70% Region -0.30% -0.30% 0.70% Virginia -0.50% -0.50% 0.70%
2005 2006 2007 2008
Region 3.5% 3.2% 3.2% 4.2%
Virginia 3.5% 3.0% 3.0% 4.2%
0.0%0.5%1.0%1.5%2.0%2.5%3.0%3.5%4.0%4.5%
Axis Title
Unemployment Rate
Unemployment in every locality showed a decline except Covington from 2005 to 2007. In 2008 unemployment increased in every locality from 2005 with Franklin and Covington leading the way.
Council of Community Services 2009 Edition Roanoke Regional Community Indicators Page 48
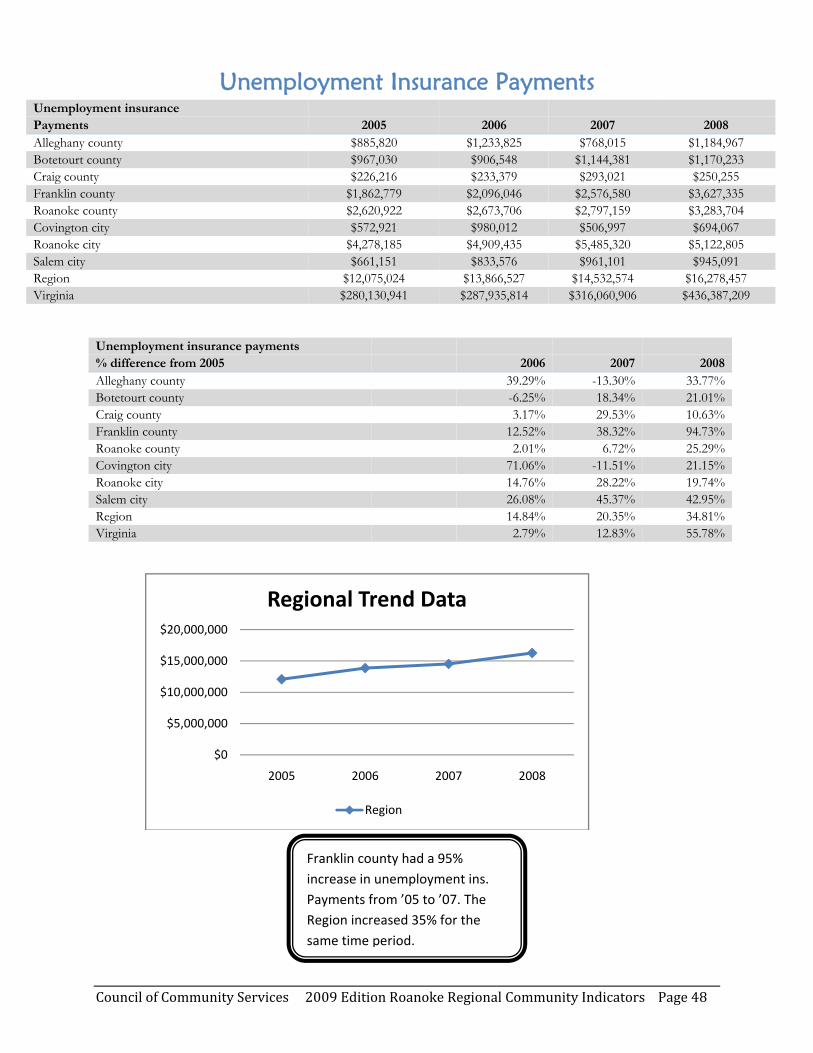
Unemployment Insurance Payments Unemployment insurance Payments 2005 2006 2007 2008 Alleghany county $885,820 $1,233,825 $768,015 $1,184,967 Botetourt county $967,030 $906,548 $1,144,381 $1,170,233 Craig county $226,216 $233,379 $293,021 $250,255 Franklin county $1,862,779 $2,096,046 $2,576,580 $3,627,335 Roanoke county $2,620,922 $2,673,706 $2,797,159 $3,283,704 Covington city $572,921 $980,012 $506,997 $694,067 Roanoke city $4,278,185 $4,909,435 $5,485,320 $5,122,805 Salem city $661,151 $833,576 $961,101 $945,091 Region $12,075,024 $13,866,527 $14,532,574 $16,278,457 Virginia $280,130,941 $287,935,814 $316,060,906 $436,387,209
Unemployment insurance payments % difference from 2005 2006 2007 2008Alleghany county 39.29% -13.30% 33.77%Botetourt county -6.25% 18.34% 21.01%Craig county 3.17% 29.53% 10.63%Franklin county 12.52% 38.32% 94.73%Roanoke county 2.01% 6.72% 25.29%Covington city 71.06% -11.51% 21.15%Roanoke city 14.76% 28.22% 19.74%Salem city 26.08% 45.37% 42.95%Region 14.84% 20.35% 34.81%Virginia 2.79% 12.83% 55.78%
$0
$5,000,000
$10,000,000
$15,000,000
$20,000,000
2005 2006 2007 2008
Regional Trend Data
Region
Franklin county had a 95% increase in unemployment ins. Payments from ’05 to ’07. The Region increased 35% for the same time period.
Council of Community Services 2009 Edition Roanoke Regional Community Indicators Page 49
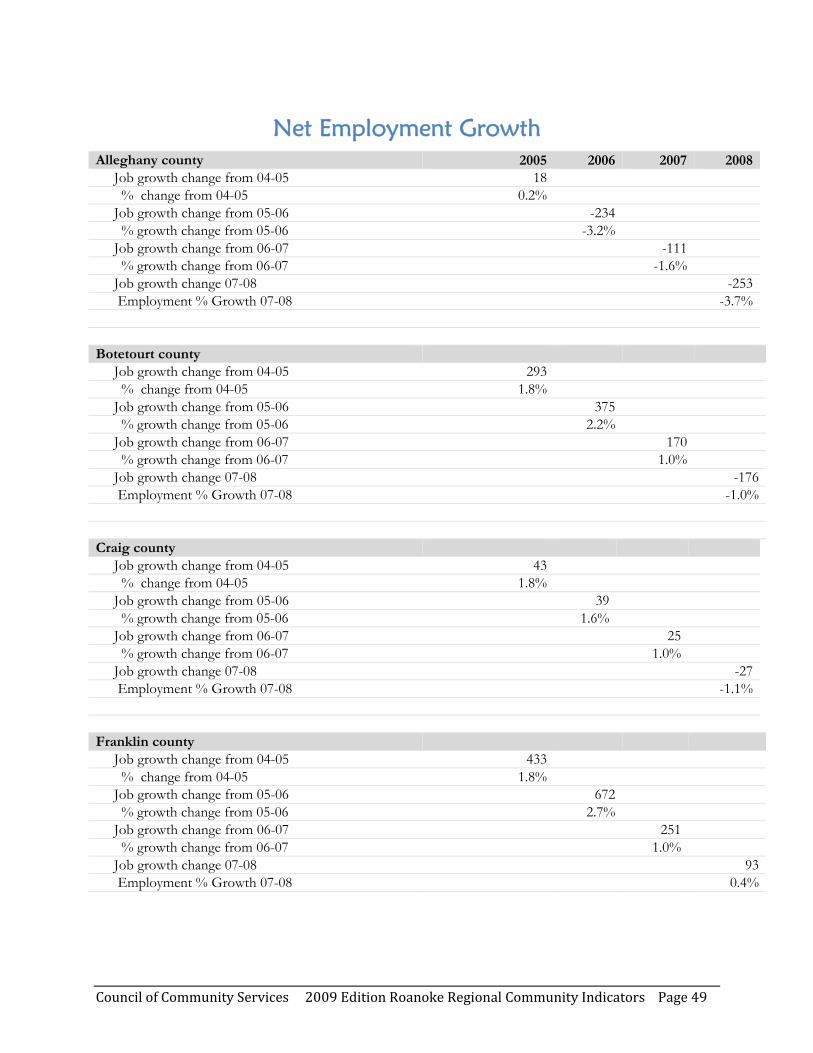
Net Employment Growth
Alleghany county 2005 2006 2007 2008 Job growth change from 04-05 18 % change from 04-05 0.2% Job growth change from 05-06 -234 % growth change from 05-06 -3.2% Job growth change from 06-07 -111 % growth change from 06-07 -1.6% Job growth change 07-08 -253 Employment % Growth 07-08 -3.7%
Botetourt county Job growth change from 04-05 293 % change from 04-05 1.8% Job growth change from 05-06 375 % growth change from 05-06 2.2% Job growth change from 06-07 170 % growth change from 06-07 1.0% Job growth change 07-08 -176 Employment % Growth 07-08 -1.0%
Craig county Job growth change from 04-05 43 % change from 04-05 1.8% Job growth change from 05-06 39 % growth change from 05-06 1.6% Job growth change from 06-07 25 % growth change from 06-07 1.0% Job growth change 07-08 -27 Employment % Growth 07-08 -1.1%
Franklin county Job growth change from 04-05 433 % change from 04-05 1.8% Job growth change from 05-06 672 % growth change from 05-06 2.7% Job growth change from 06-07 251 % growth change from 06-07 1.0% Job growth change 07-08 93 Employment % Growth 07-08 0.4%
Council of Community Services 2009 Edition Roanoke Regional Community Indicators Page 50
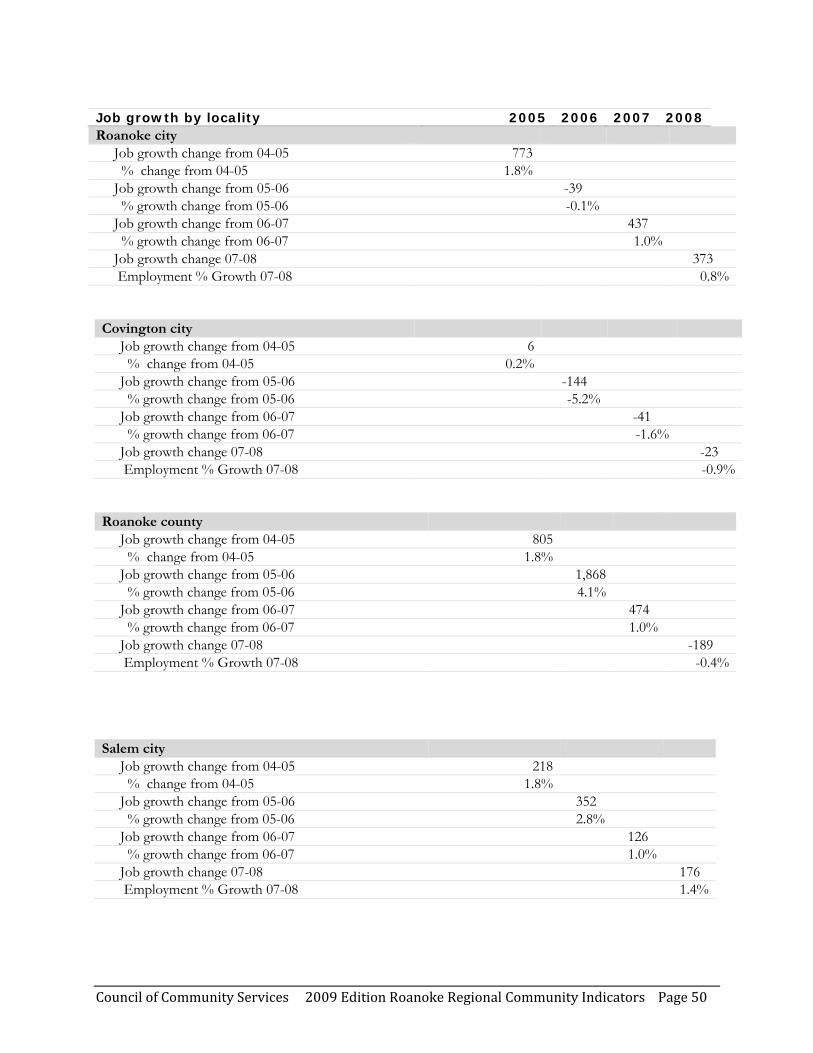
Roanoke city Job growth change from 04-05 773 % change from 04-05 1.8% Job growth change from 05-06 -39 % growth change from 05-06 -0.1% Job growth change from 06-07 437 % growth change from 06-07 1.0% Job growth change 07-08 373 Employment % Growth 07-08 0.8%
Covington city Job growth change from 04-05 6 % change from 04-05 0.2% Job growth change from 05-06 -144 % growth change from 05-06 -5.2% Job growth change from 06-07 -41 % growth change from 06-07 -1.6% Job growth change 07-08 -23 Employment % Growth 07-08 -0.9%
Roanoke county Job growth change from 04-05 805 % change from 04-05 1.8% Job growth change from 05-06 1,868 % growth change from 05-06 4.1% Job growth change from 06-07 474 % growth change from 06-07 1.0% Job growth change 07-08 -189 Employment % Growth 07-08 -0.4%
Salem city Job growth change from 04-05 218 % change from 04-05 1.8% Job growth change from 05-06 352 % growth change from 05-06 2.8% Job growth change from 06-07 126 % growth change from 06-07 1.0% Job growth change 07-08 176 Employment % Growth 07-08 1.4%
Job growth by locality 2005 2006 2007 2008
Council of Community Services 2009 Edition Roanoke Regional Community Indicators Page 51
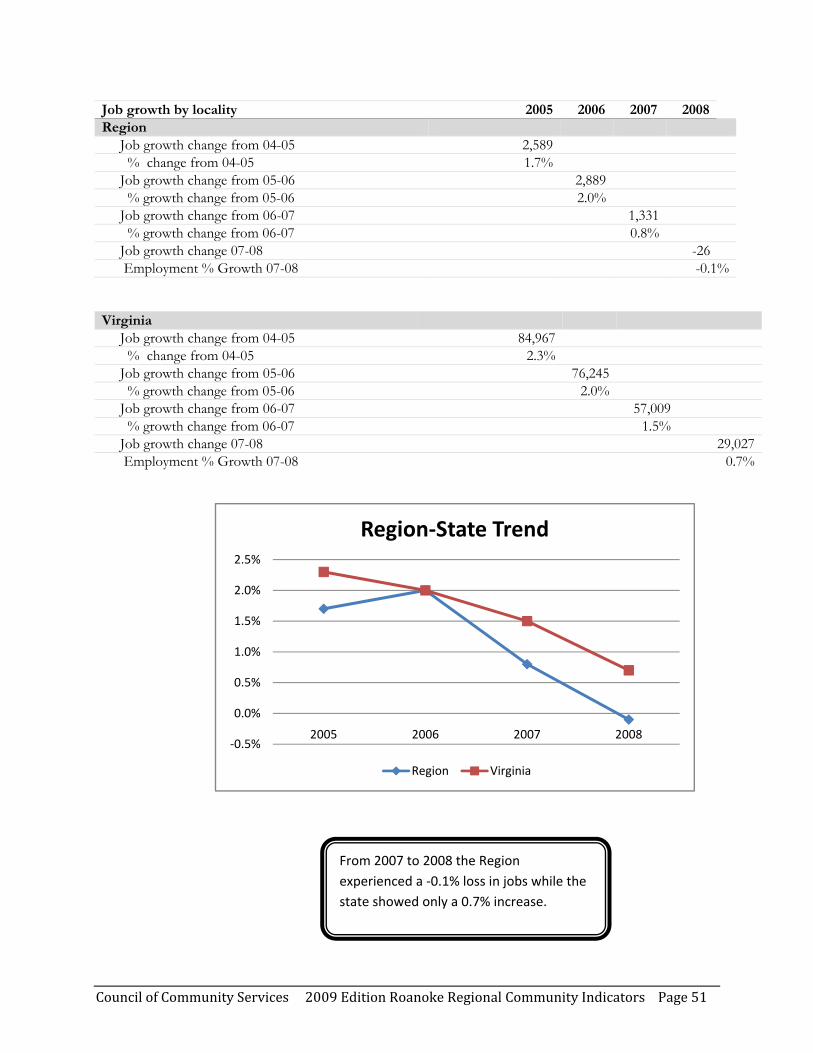
Job growth by locality 2005 2006 2007 2008Region
Job growth change from 04-05 2,589 % change from 04-05 1.7% Job growth change from 05-06 2,889 % growth change from 05-06 2.0% Job growth change from 06-07 1,331 % growth change from 06-07 0.8% Job growth change 07-08 -26 Employment % Growth 07-08 -0.1%
Virginia Job growth change from 04-05 84,967 % change from 04-05 2.3% Job growth change from 05-06 76,245 % growth change from 05-06 2.0% Job growth change from 06-07 57,009 % growth change from 06-07 1.5% Job growth change 07-08 29,027 Employment % Growth 07-08 0.7%
‐0.5%
0.0%
0.5%
1.0%
1.5%
2.0%
2.5%
2005 2006 2007 2008
Region‐State Trend
Region Virginia
From 2007 to 2008 the Region experienced a ‐0.1% loss in jobs while the state showed only a 0.7% increase.
Council of Community Services 2009 Edition Roanoke Regional Community Indicators Page 52
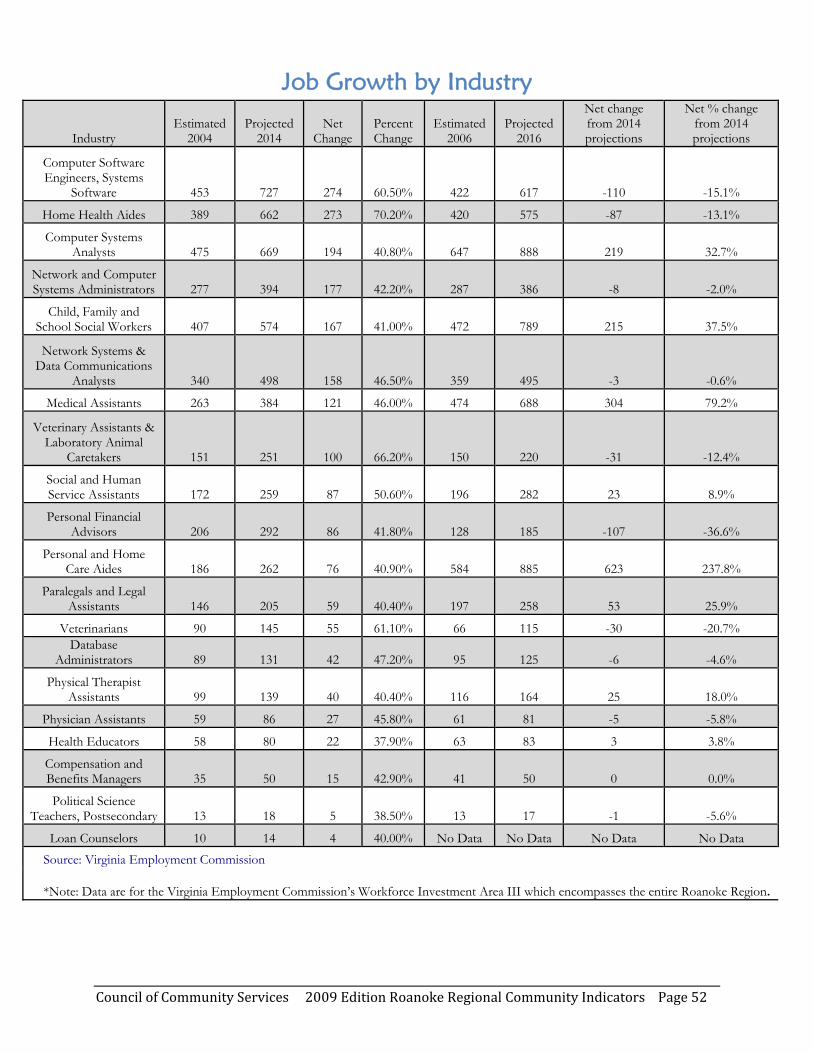
Job Growth by Industry
Industry Estimated
2004 Projected
2014 Net
Change Percent Change
Estimated 2006
Projected 2016
Net change from 2014 projections
Net % change from 2014 projections
Computer Software Engineers, Systems
Software 453 727 274 60.50% 422 617 -110 -15.1%
Home Health Aides 389 662 273 70.20% 420 575 -87 -13.1%
Computer Systems Analysts 475 669 194 40.80% 647 888 219 32.7%
Network and Computer Systems Administrators 277 394 177 42.20% 287 386 -8 -2.0%
Child, Family and School Social Workers 407 574 167 41.00% 472 789 215 37.5%
Network Systems & Data Communications
Analysts 340 498 158 46.50% 359 495 -3 -0.6%
Medical Assistants 263 384 121 46.00% 474 688 304 79.2%
Veterinary Assistants & Laboratory Animal
Caretakers 151 251 100 66.20% 150 220 -31 -12.4%
Social and Human Service Assistants 172 259 87 50.60% 196 282 23 8.9%
Personal Financial Advisors 206 292 86 41.80% 128 185 -107 -36.6%
Personal and Home Care Aides 186 262 76 40.90% 584 885 623 237.8%
Paralegals and Legal Assistants 146 205 59 40.40% 197 258 53 25.9%
Veterinarians 90 145 55 61.10% 66 115 -30 -20.7% Database
Administrators 89 131 42 47.20% 95 125 -6 -4.6%
Physical Therapist Assistants 99 139 40 40.40% 116 164 25 18.0%
Physician Assistants 59 86 27 45.80% 61 81 -5 -5.8%
Health Educators 58 80 22 37.90% 63 83 3 3.8%
Compensation and Benefits Managers 35 50 15 42.90% 41 50 0 0.0%
Political Science Teachers, Postsecondary 13 18 5 38.50% 13 17 -1 -5.6%
Loan Counselors 10 14 4 40.00% No Data No Data No Data No Data Source: Virginia Employment Commission
*Note: Data are for the Virginia Employment Commission’s Workforce Investment Area III which encompasses the entire Roanoke Region.

Council of Community Services 2009 Edition Roanoke Regional Community Indicators Page 53
Income and Asset Related Indicators • Per Capita Income
• Annual Average Wage
• Consumer Price Index
This cluster of income and asset related indicators paints a picture of the income and
purchasing power of households in the region. As such, they are helpful in assessing the state of
the regional household economy.

Council of Community Services 2009 Edition Roanoke Regional Community Indicators Page 54
Per Capita Income Per capita Income* 2004 2005 2006 2007 Alleghany county $24,702 $25,685 $26,466 $27,793 Botetourt county $31,012 $33,641 $35,070 $38,127 Craig county $24,319 $25,963 $27,158 $27,896 Franklin county $26,873 $27,674 $28,893 $30,248 Roanoke county $34,296 $34,823 $35,978 $37,324 Covington city $24,702 $25,685 $26,466 $27,793 Roanoke city $30,693 $31,616 $33,358 $34,482 Salem city $34,296 $34,823 $35,978 $37,324 Region $31,305 $32,250 $33,447 $34,163 Virginia $35,841 $37,968 $39,540 $41,727 United States $33,157 $34,690 $36,794 $38,615
$0
$20,000
$40,000
$60,000
2004 2005 2006 2007
Region‐State Trend
Region Virginia
Per capita % differencefrom base year 2004 2005 2006 2007 Alleghany county 3.98% 7.14% 12.51% Botetourt county 8.48% 13.09% 22.94% Craig county 6.76% 11.67% 14.71% Franklin county 2.98% 7.52% 12.56% Roanoke county 1.54% 4.90% 8.83% Covington city 3.98% 7.14% 12.51% Roanoke city 3.01% 8.68% 12.34% Salem city 1.54% 4.90% 8.83% Region 3.02% 6.84% 9.13% Virginia 5.93% 10.32% 16.42%
Per capita income for the Region increased 9.13% since 2004 but the state increase was 16.42% for the same time period.
Council of Community Services 2009 Edition Roanoke Regional Community Indicators Page 55
Annual Average Wage
$0
$10,000
$20,000
$30,000
$40,000
$50,000
2005 2006 2007 2008
Region‐State Trend
Region Virginia
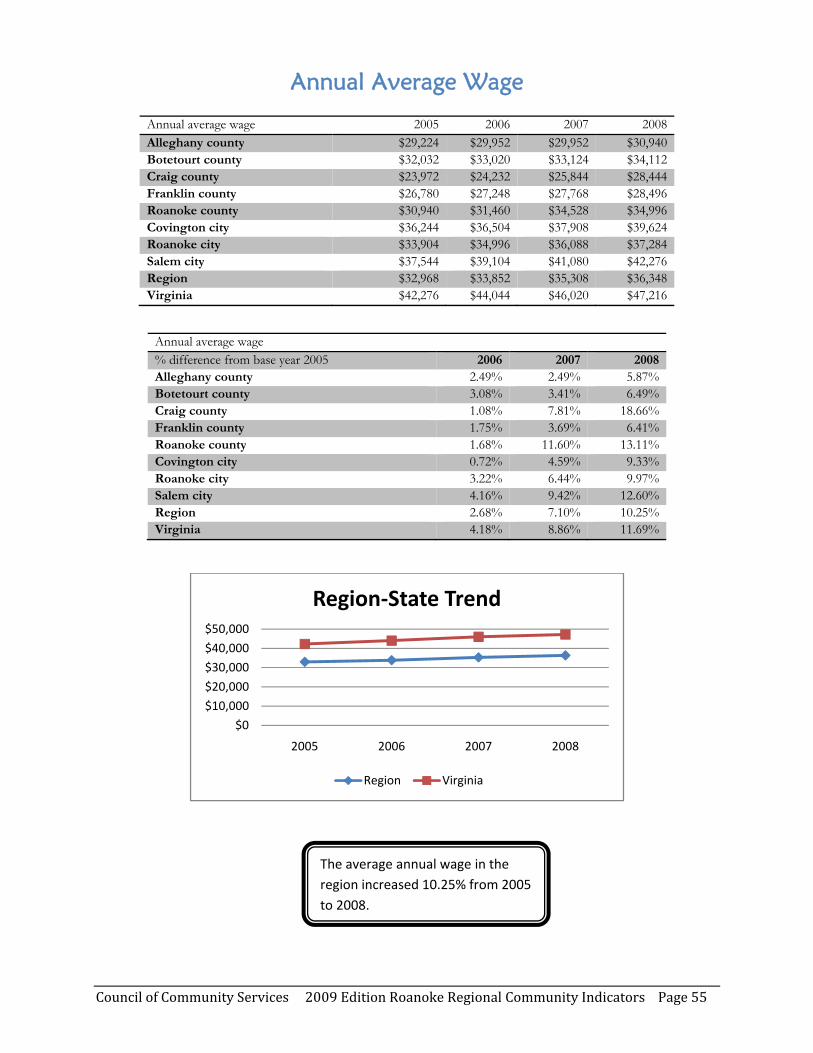
Annual average wage 2005 2006 2007 2008Alleghany county $29,224 $29,952 $29,952 $30,940Botetourt county $32,032 $33,020 $33,124 $34,112Craig county $23,972 $24,232 $25,844 $28,444Franklin county $26,780 $27,248 $27,768 $28,496Roanoke county $30,940 $31,460 $34,528 $34,996Covington city $36,244 $36,504 $37,908 $39,624Roanoke city $33,904 $34,996 $36,088 $37,284Salem city $37,544 $39,104 $41,080 $42,276Region $32,968 $33,852 $35,308 $36,348Virginia $42,276 $44,044 $46,020 $47,216
Annual average wage % difference from base year 2005 2006 2007 2008Alleghany county 2.49% 2.49% 5.87%Botetourt county 3.08% 3.41% 6.49%Craig county 1.08% 7.81% 18.66%Franklin county 1.75% 3.69% 6.41%Roanoke county 1.68% 11.60% 13.11%Covington city 0.72% 4.59% 9.33%Roanoke city 3.22% 6.44% 9.97%Salem city 4.16% 9.42% 12.60%Region 2.68% 7.10% 10.25%Virginia 4.18% 8.86% 11.69%
The average annual wage in the region increased 10.25% from 2005 to 2008.
Council of Community Services 2009 Edition Roanoke Regional Community Indicators Page 56
Consumer Price Index
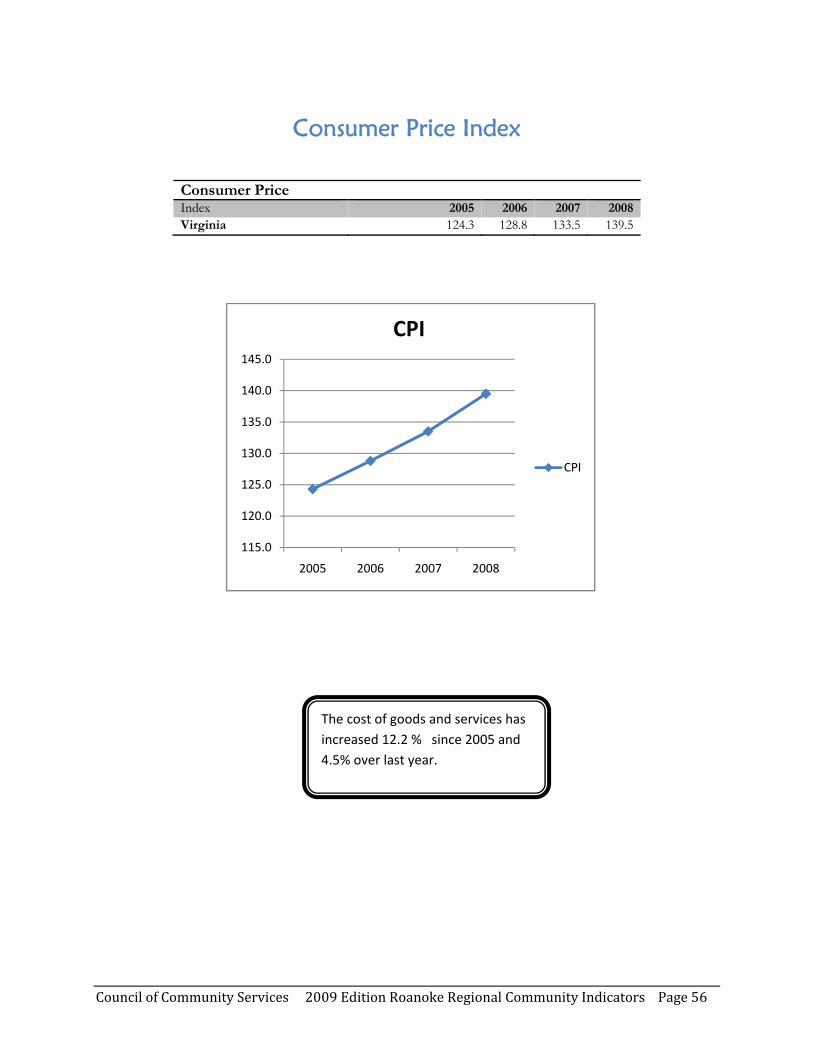
Consumer Price Index 2005 2006 2007 2008 Virginia 124.3 128.8 133.5 139.5
115.0
120.0
125.0
130.0
135.0
140.0
145.0
2005 2006 2007 2008
CPI
CPI
The cost of goods and services has increased 12.2 % since 2005 and 4.5% over last year.

Council of Community Services 2009 Edition Roanoke Regional Community Indicators Page 57
Housing Related Indicators • Average Rental Costs
• Length of Residency
• Owner-Occupied Housing Units
• Renter-Occupied Housing Units
• Single-Family Residential Building Permits
• Housing Units Lacking Complete Plumbing Facilities
These housing related indicators help provide insight into the status of the regional household economy
Council of Community Services 2009 Edition Roanoke Regional Community Indicators Page 58
Average Rental Costs
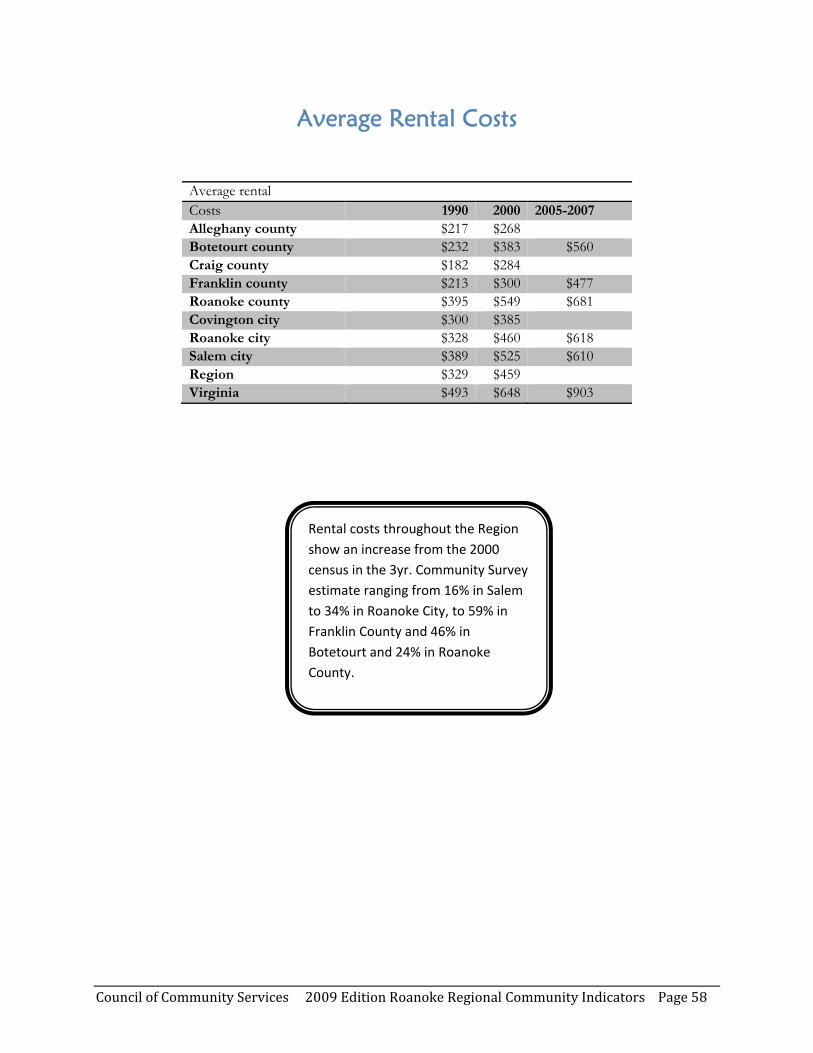
Average rental Costs 1990 2000 2005-2007 Alleghany county $217 $268 Botetourt county $232 $383 $560 Craig county $182 $284 Franklin county $213 $300 $477 Roanoke county $395 $549 $681 Covington city $300 $385 Roanoke city $328 $460 $618 Salem city $389 $525 $610 Region $329 $459 Virginia $493 $648 $903
Rental costs throughout the Region show an increase from the 2000 census in the 3yr. Community Survey estimate ranging from 16% in Salem to 34% in Roanoke City, to 59% in Franklin County and 46% in Botetourt and 24% in Roanoke County.
Council of Community Services 2009 Edition Roanoke Regional Community Indicators Page 59
Length of Residency
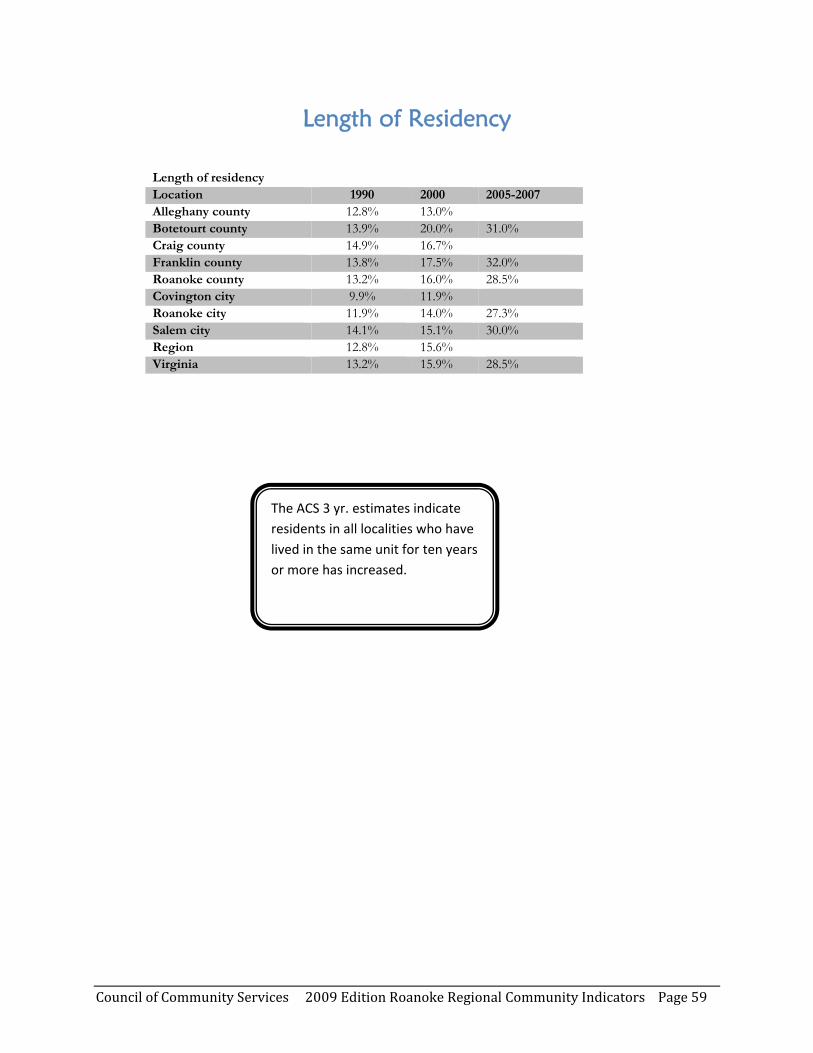
Length of residency Location 1990 2000 2005-2007Alleghany county 12.8% 13.0%Botetourt county 13.9% 20.0% 31.0%Craig county 14.9% 16.7%Franklin county 13.8% 17.5% 32.0%Roanoke county 13.2% 16.0% 28.5%Covington city 9.9% 11.9%Roanoke city 11.9% 14.0% 27.3%Salem city 14.1% 15.1% 30.0%Region 12.8% 15.6%Virginia 13.2% 15.9% 28.5%
The ACS 3 yr. estimates indicate residents in all localities who have lived in the same unit for ten years or more has increased.
Council of Community Services 2009 Edition Roanoke Regional Community Indicators Page 60
Owner Occupied Housing Units
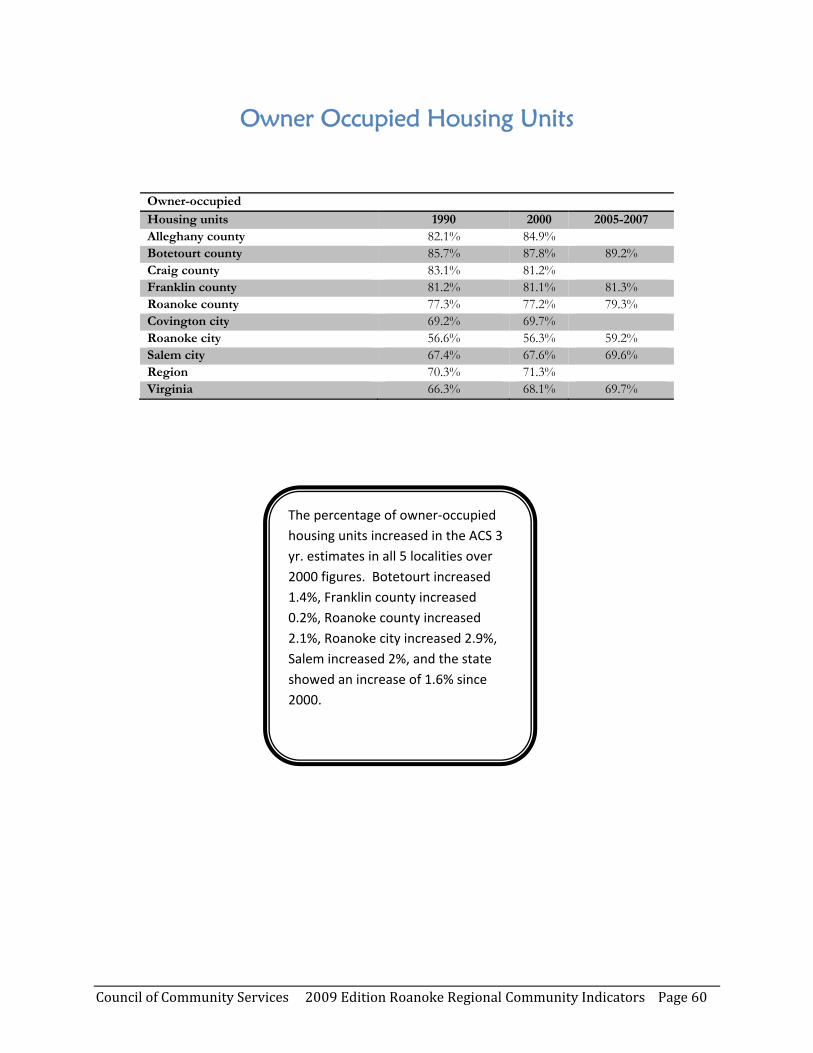
Owner-occupied Housing units 1990 2000 2005-2007 Alleghany county 82.1% 84.9% Botetourt county 85.7% 87.8% 89.2% Craig county 83.1% 81.2% Franklin county 81.2% 81.1% 81.3% Roanoke county 77.3% 77.2% 79.3% Covington city 69.2% 69.7% Roanoke city 56.6% 56.3% 59.2% Salem city 67.4% 67.6% 69.6% Region 70.3% 71.3% Virginia 66.3% 68.1% 69.7%
The percentage of owner‐occupied housing units increased in the ACS 3 yr. estimates in all 5 localities over 2000 figures. Botetourt increased 1.4%, Franklin county increased 0.2%, Roanoke county increased 2.1%, Roanoke city increased 2.9%, Salem increased 2%, and the state showed an increase of 1.6% since 2000.
Council of Community Services 2009 Edition Roanoke Regional Community Indicators Page 61
Renter-Occupied Housing Units
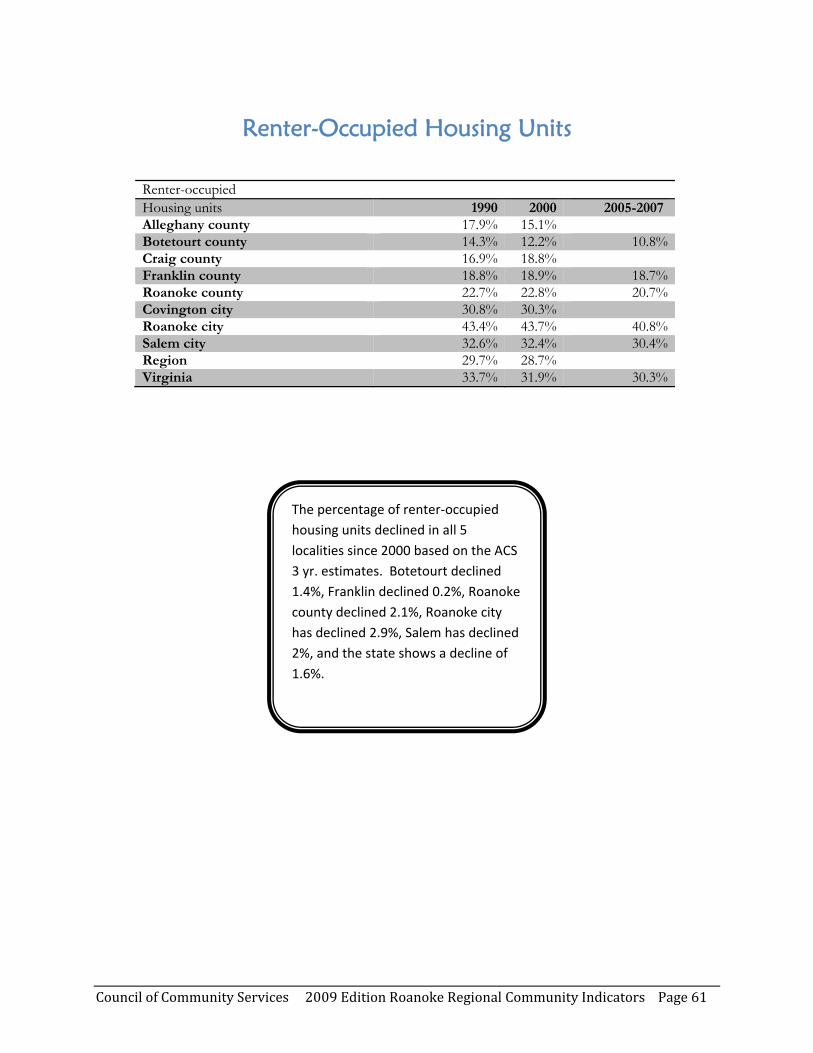
Renter-occupied Housing units 1990 2000 2005-2007 Alleghany county 17.9% 15.1% Botetourt county 14.3% 12.2% 10.8%Craig county 16.9% 18.8% Franklin county 18.8% 18.9% 18.7%Roanoke county 22.7% 22.8% 20.7%Covington city 30.8% 30.3% Roanoke city 43.4% 43.7% 40.8%Salem city 32.6% 32.4% 30.4%Region 29.7% 28.7% Virginia 33.7% 31.9% 30.3%
The percentage of renter‐occupied housing units declined in all 5 localities since 2000 based on the ACS 3 yr. estimates. Botetourt declined 1.4%, Franklin declined 0.2%, Roanoke county declined 2.1%, Roanoke city has declined 2.9%, Salem has declined 2%, and the state shows a decline of 1.6%.

Council of Community Services 2009 Edition Roanoke Regional Community Indicators Page 62
Single-Family Residential Building Permits
0
200
400
600
800
1,000
1,200
1,400
1,600
2005 2006 2007 2008
Regional Trend Data
Region
Single-family residential Building permits 2005 2006 2007 2008Alleghany county 31 29 21 23Botetourt county 273 194 137 104Craig county 34 34 26 23Franklin county 509 475 374 244Roanoke county 381 396 347 219Covington city 6 3 3 2Roanoke city 151 80 89 140Salem city 62 10 8 44Region 1,447 1,221 1,005 799
The number of single family building permits authorized in the Region has declined 45% from 2005 to 2008, and has dropped 20% from 2007 to 2008. Alleghany, Roanoke city, and Salem show an increase from 2007 to 2008 in the number of permits authorized.
Council of Community Services 2009 Edition Roanoke Regional Community Indicators Page 63
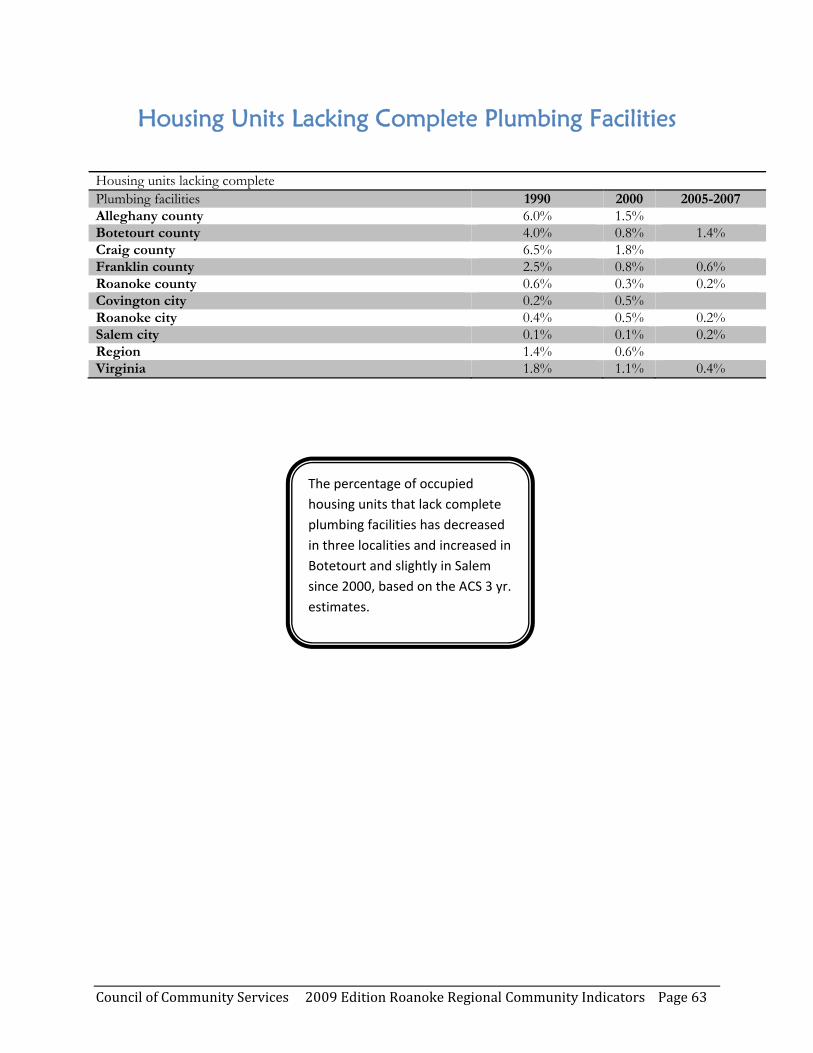
Housing Units Lacking Complete Plumbing Facilities
Housing units lacking complete Plumbing facilities 1990 2000 2005-2007 Alleghany county 6.0% 1.5% Botetourt county 4.0% 0.8% 1.4% Craig county 6.5% 1.8% Franklin county 2.5% 0.8% 0.6% Roanoke county 0.6% 0.3% 0.2% Covington city 0.2% 0.5% Roanoke city 0.4% 0.5% 0.2% Salem city 0.1% 0.1% 0.2% Region 1.4% 0.6% Virginia 1.8% 1.1% 0.4%
The percentage of occupied housing units that lack complete plumbing facilities has decreased in three localities and increased in Botetourt and slightly in Salem since 2000, based on the ACS 3 yr. estimates.
Council of Community Services 2009 Edition Roanoke Regional Community Indicators Page 64
Public Assistance/Low Income Indicators • Children Eligible for Free/Reduced Lunch
• Supplemental Security Income Recipients (SSI)
• TANF Recipients
• Food Stamp Recipients
• Poverty Rate
• Poverty Rate for Seniors
• Poverty Rate – People with Disabilities
• Childcare Subsidy Recipients
• Poverty Rate for Children
As can be seen from the number of indicators included in this section, tracking as much
information as possible on public assistance efforts and low income populations is central to
describing the well being of the household economy.
Council of Community Services 2009 Edition Roanoke Regional Community Indicators Page 65
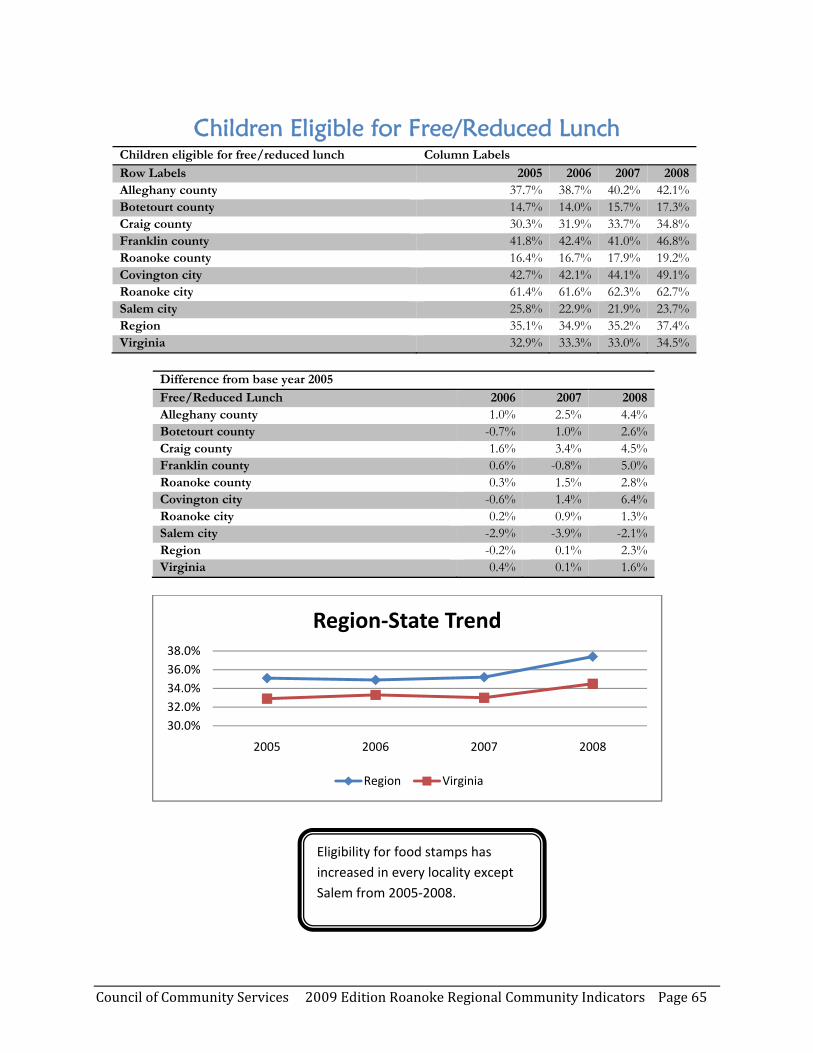
Children Eligible for Free/Reduced Lunch Children eligible for free/reduced lunch Column Labels Row Labels 2005 2006 2007 2008Alleghany county 37.7% 38.7% 40.2% 42.1%Botetourt county 14.7% 14.0% 15.7% 17.3%Craig county 30.3% 31.9% 33.7% 34.8%Franklin county 41.8% 42.4% 41.0% 46.8%Roanoke county 16.4% 16.7% 17.9% 19.2%Covington city 42.7% 42.1% 44.1% 49.1%Roanoke city 61.4% 61.6% 62.3% 62.7%Salem city 25.8% 22.9% 21.9% 23.7%Region 35.1% 34.9% 35.2% 37.4%Virginia 32.9% 33.3% 33.0% 34.5%
Difference from base year 2005 Free/Reduced Lunch 2006 2007 2008 Alleghany county 1.0% 2.5% 4.4% Botetourt county -0.7% 1.0% 2.6% Craig county 1.6% 3.4% 4.5% Franklin county 0.6% -0.8% 5.0% Roanoke county 0.3% 1.5% 2.8% Covington city -0.6% 1.4% 6.4% Roanoke city 0.2% 0.9% 1.3% Salem city -2.9% -3.9% -2.1% Region -0.2% 0.1% 2.3% Virginia 0.4% 0.1% 1.6%
30.0%32.0%34.0%36.0%38.0%
2005 2006 2007 2008
Region‐State Trend
Region Virginia
Eligibility for food stamps has increased in every locality except Salem from 2005‐2008.

Council of Community Services 2009 Edition Roanoke Regional Community Indicators Page 66
Supplemental Security Income Recipients (SSI) Supplemental security Recipients 2005 2006 2007 2008Alleghany county 485 492 484 488Botetourt county 331 350 390 403Craig county 120 118 122 120Franklin county 934 972 991 1,055Roanoke county 948 992 1,033 1,054Covington city 278 285 311 324Roanoke city 3,518 3,528 3,571 3,698Salem city 338 357 374 375Region 6,952 7,094 7,276 7,517Virginia 137,662 139,464 140,678 142,022
% difference from base year 2005 SSI Recipients 2006 2007 2008 Alleghany county 1.44% -0.21% 0.62% Botetourt county 5.74% 17.82% 21.75% Craig county -1.67% 1.67% 0.00% Franklin county 4.07% 6.10% 12.96% Roanoke county 4.64% 8.97% 11.18% Covington city 2.52% 11.87% 16.55% Roanoke city 0.28% 1.51% 5.12% Salem city 5.62% 10.65% 10.95% Region 2.04% 4.66% 8.13% Virginia 1.31% 2.19% 3.17%
6,600
6,800
7,000
7,200
7,400
7,600
2005 2006 2007 2008
Regional Trend Data
Region
SSI recipients in the region have increased 8.1% since 2005.

Council of Community Services 2009 Edition Roanoke Regional Community Indicators Page 67
TANF Recipients
% difference from base year 2006 TANF Recipients* 2007 2008 Alleghany county 39.06% 39.84% Botetourt county 11.67% -26.67% Craig county -56.52% -26.09% Franklin county 0.24% 15.29% Roanoke county/Salem 6.39% 14.77% Covington city -7.69% -37.50% Roanoke city -1.78% 8.93% Region 0.88% 9.43% Virginia -9.17% -0.13%
3,200
3,300
3,400
3,500
3,600
3,700
3,800
2006 2007 2008
Regional Trend Data
Region
TANF Recipients* 2006 2007 2008 Alleghany county 128 178 179 Botetourt county 60 67 44 Craig county 23 10 17 Franklin county 412 413 475 Roanoke county/Salem 501 533 575 Covington city 104 96 65 Roanoke city 2,196 2,157 2,392 Region 3,424 3,454 3,747 Virginia 68,311 62,044 68,223
TANF recipients in the Region have increased 9.4% since 2006 and 8.5% from 2007 to 2008.
Council of Community Services 2009 Edition Roanoke Regional Community Indicators Page 68
Food Stamp Recipients
0
10,000
20,000
30,000
40,000
2005 2006 2007 2008
Region
Region
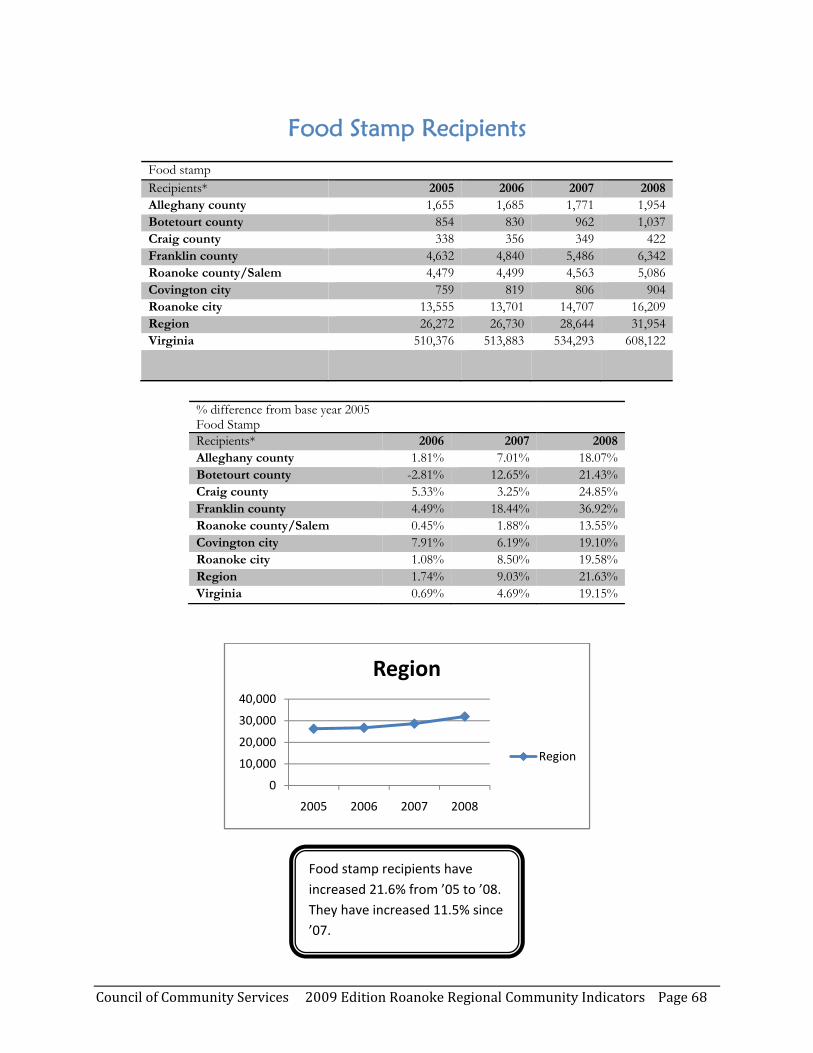
Food stamp Recipients* 2005 2006 2007 2008Alleghany county 1,655 1,685 1,771 1,954Botetourt county 854 830 962 1,037Craig county 338 356 349 422Franklin county 4,632 4,840 5,486 6,342Roanoke county/Salem 4,479 4,499 4,563 5,086Covington city 759 819 806 904Roanoke city 13,555 13,701 14,707 16,209Region 26,272 26,730 28,644 31,954Virginia 510,376 513,883 534,293 608,122
% difference from base year 2005 Food Stamp Recipients* 2006 2007 2008 Alleghany county 1.81% 7.01% 18.07% Botetourt county -2.81% 12.65% 21.43% Craig county 5.33% 3.25% 24.85% Franklin county 4.49% 18.44% 36.92% Roanoke county/Salem 0.45% 1.88% 13.55% Covington city 7.91% 6.19% 19.10% Roanoke city 1.08% 8.50% 19.58% Region 1.74% 9.03% 21.63% Virginia 0.69% 4.69% 19.15%
Food stamp recipients have increased 21.6% from ’05 to ’08. They have increased 11.5% since ’07.
Council of Community Services 2009 Edition Roanoke Regional Community Indicators Page 69
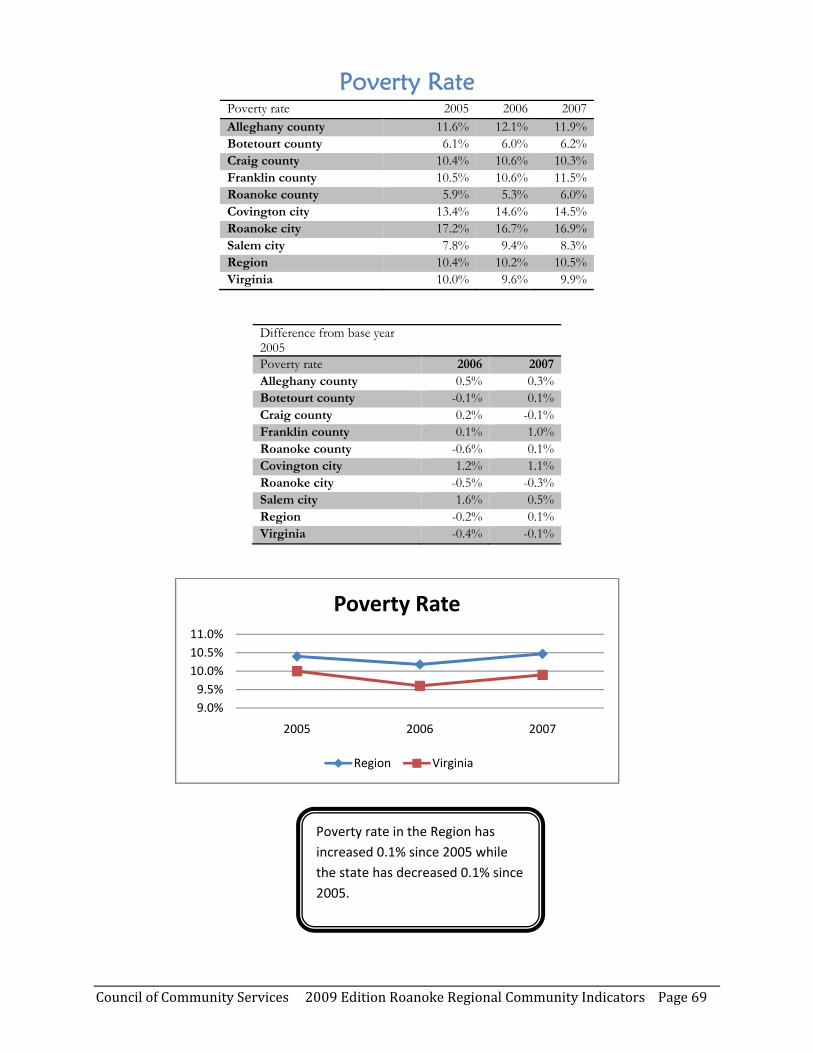
Poverty Rate Poverty rate 2005 2006 2007 Alleghany county 11.6% 12.1% 11.9% Botetourt county 6.1% 6.0% 6.2% Craig county 10.4% 10.6% 10.3% Franklin county 10.5% 10.6% 11.5% Roanoke county 5.9% 5.3% 6.0% Covington city 13.4% 14.6% 14.5% Roanoke city 17.2% 16.7% 16.9% Salem city 7.8% 9.4% 8.3% Region 10.4% 10.2% 10.5% Virginia 10.0% 9.6% 9.9%
Difference from base year 2005 Poverty rate 2006 2007Alleghany county 0.5% 0.3%Botetourt county -0.1% 0.1%Craig county 0.2% -0.1%Franklin county 0.1% 1.0%Roanoke county -0.6% 0.1%Covington city 1.2% 1.1%Roanoke city -0.5% -0.3%Salem city 1.6% 0.5%Region -0.2% 0.1%Virginia -0.4% -0.1%
9.0%9.5%10.0%10.5%11.0%
2005 2006 2007
Poverty Rate
Region Virginia
Poverty rate in the Region has increased 0.1% since 2005 while the state has decreased 0.1% since 2005.
Council of Community Services 2009 Edition Roanoke Regional Community Indicators Page 70
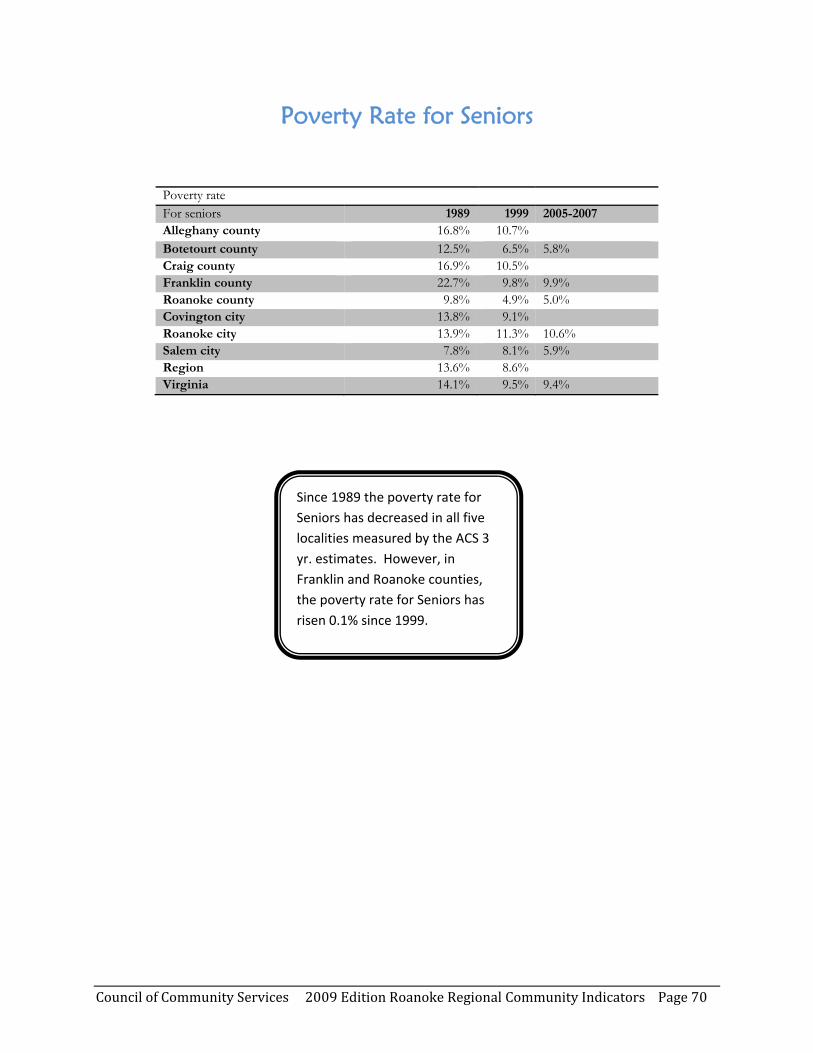
Poverty Rate for Seniors
Poverty rate For seniors 1989 1999 2005-2007 Alleghany county 16.8% 10.7%Botetourt county 12.5% 6.5% 5.8%Craig county 16.9% 10.5%Franklin county 22.7% 9.8% 9.9%Roanoke county 9.8% 4.9% 5.0%Covington city 13.8% 9.1%Roanoke city 13.9% 11.3% 10.6% Salem city 7.8% 8.1% 5.9%Region 13.6% 8.6%Virginia 14.1% 9.5% 9.4%
Since 1989 the poverty rate for Seniors has decreased in all five localities measured by the ACS 3 yr. estimates. However, in Franklin and Roanoke counties, the poverty rate for Seniors has risen 0.1% since 1999.
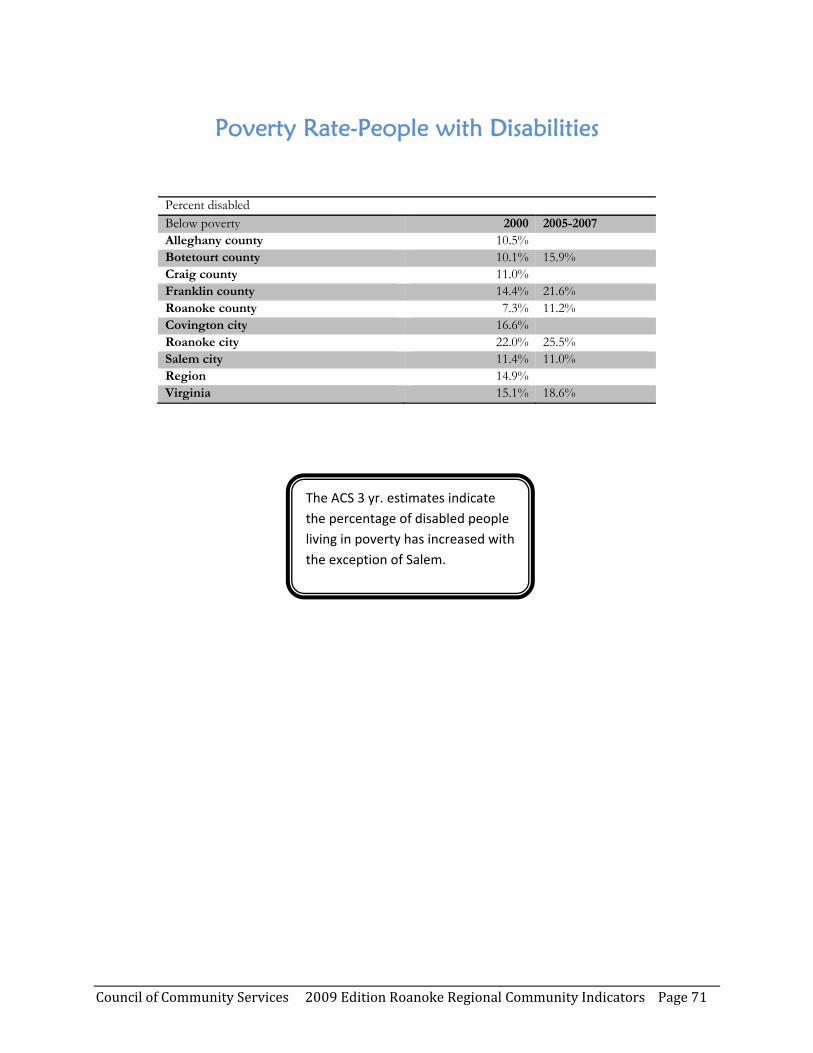
Council of Community Services 2009 Edition Roanoke Regional Community Indicators Page 71
Poverty Rate-People with Disabilities
Percent disabled Below poverty 2000 2005-2007 Alleghany county 10.5%Botetourt county 10.1% 15.9% Craig county 11.0%Franklin county 14.4% 21.6% Roanoke county 7.3% 11.2% Covington city 16.6%Roanoke city 22.0% 25.5% Salem city 11.4% 11.0% Region 14.9%Virginia 15.1% 18.6%
The ACS 3 yr. estimates indicate the percentage of disabled people living in poverty has increased with the exception of Salem.

Council of Community Services 2009 Edition Roanoke Regional Community Indicators Page 72
Childcare Subsidy Recipients
0
1,000
2,000
3,000
2005 2006 2007 2008
Regional Trend Data
Region
Childcare subsidy Recipients* 2005 2006 2007 2008Alleghany county 156 146 157 57Botetourt county 80 68 75 148Craig county 18 14 17 24Franklin county 259 299 291 171Roanoke county/Salem 630 676 693 454Covington city 97 72 68 372Roanoke city 1,472 1,429 1,527 88Region 2,712 2,704 2,828 1,817Virginia 62,213 57,991 57,411 56,554
% difference from base year 2005 for childcare subsidy
Recipients* 2006 2007 2008 Alleghany county -6.41% 0.64% -63.46% Botetourt county -15.00% -6.25% 85.00% Craig county -22.22% -5.56% 33.33% Franklin county 15.44% 12.36% -33.98% Roanoke county/Salem 7.30% 10.00% -27.94% Covington city -25.77% -29.90% 283.51% Roanoke city -2.92% 3.74% -94.02% Region -0.29% 4.28% -33.00% Virginia -6.79% -7.72% -9.10%
Data for Roanoke City and Covington seem to be inconsistent with trends but is listed here as recorded by source “Kids Count “
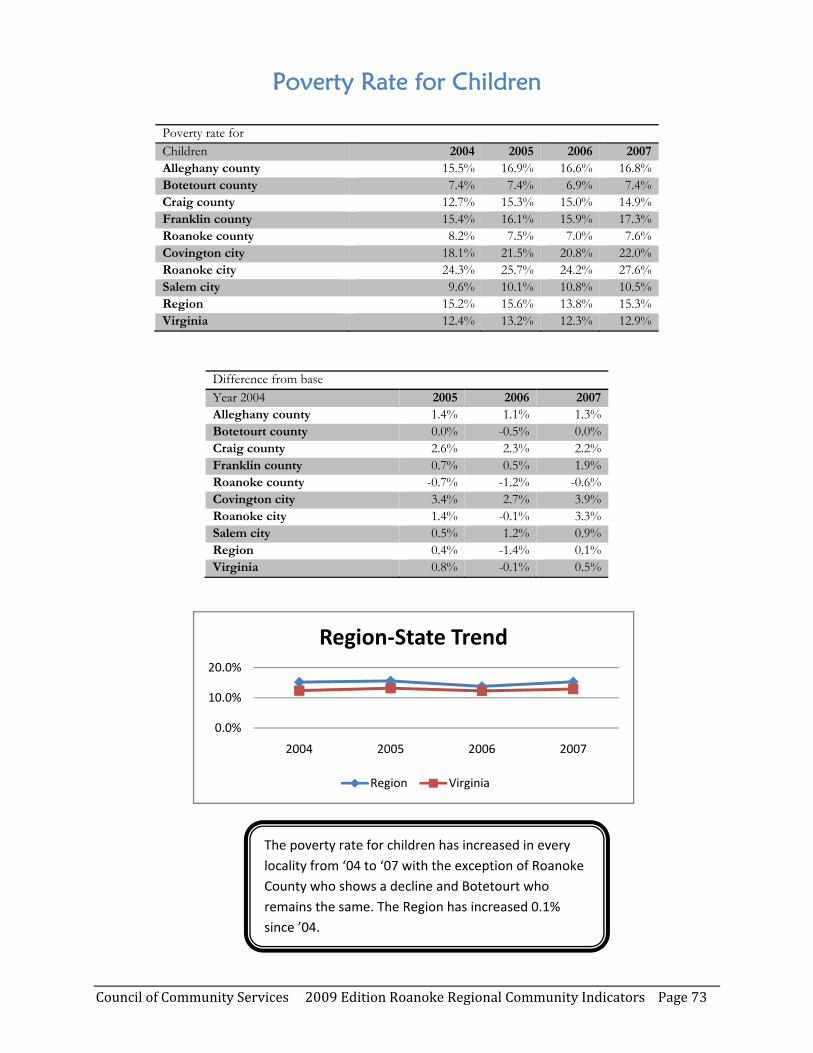
Council of Community Services 2009 Edition Roanoke Regional Community Indicators Page 73
Poverty Rate for Children
Difference from base Year 2004 2005 2006 2007 Alleghany county 1.4% 1.1% 1.3% Botetourt county 0.0% -0.5% 0.0% Craig county 2.6% 2.3% 2.2% Franklin county 0.7% 0.5% 1.9% Roanoke county -0.7% -1.2% -0.6% Covington city 3.4% 2.7% 3.9% Roanoke city 1.4% -0.1% 3.3% Salem city 0.5% 1.2% 0.9% Region 0.4% -1.4% 0.1% Virginia 0.8% -0.1% 0.5%
0.0%
10.0%
20.0%
2004 2005 2006 2007
Region‐State Trend
Region Virginia
Poverty rate for Children 2004 2005 2006 2007 Alleghany county 15.5% 16.9% 16.6% 16.8% Botetourt county 7.4% 7.4% 6.9% 7.4% Craig county 12.7% 15.3% 15.0% 14.9% Franklin county 15.4% 16.1% 15.9% 17.3% Roanoke county 8.2% 7.5% 7.0% 7.6% Covington city 18.1% 21.5% 20.8% 22.0% Roanoke city 24.3% 25.7% 24.2% 27.6% Salem city 9.6% 10.1% 10.8% 10.5% Region 15.2% 15.6% 13.8% 15.3% Virginia 12.4% 13.2% 12.3% 12.9%
The poverty rate for children has increased in every locality from ‘04 to ‘07 with the exception of Roanoke County who shows a decline and Botetourt who remains the same. The Region has increased 0.1% since ’04.

Council of Community Services 2009 Edition Roanoke Regional Community Indicators Page 74
Other Related Indicators • Percent of Households with No Vehicle
• Health Insurance Coverage
• Food Bank Distributions (lbs.)
Even though these indicators do not fit neatly in any of the other categorized
clusters of indicators, they are necessary factors in assessing the state of the regional
household economy.
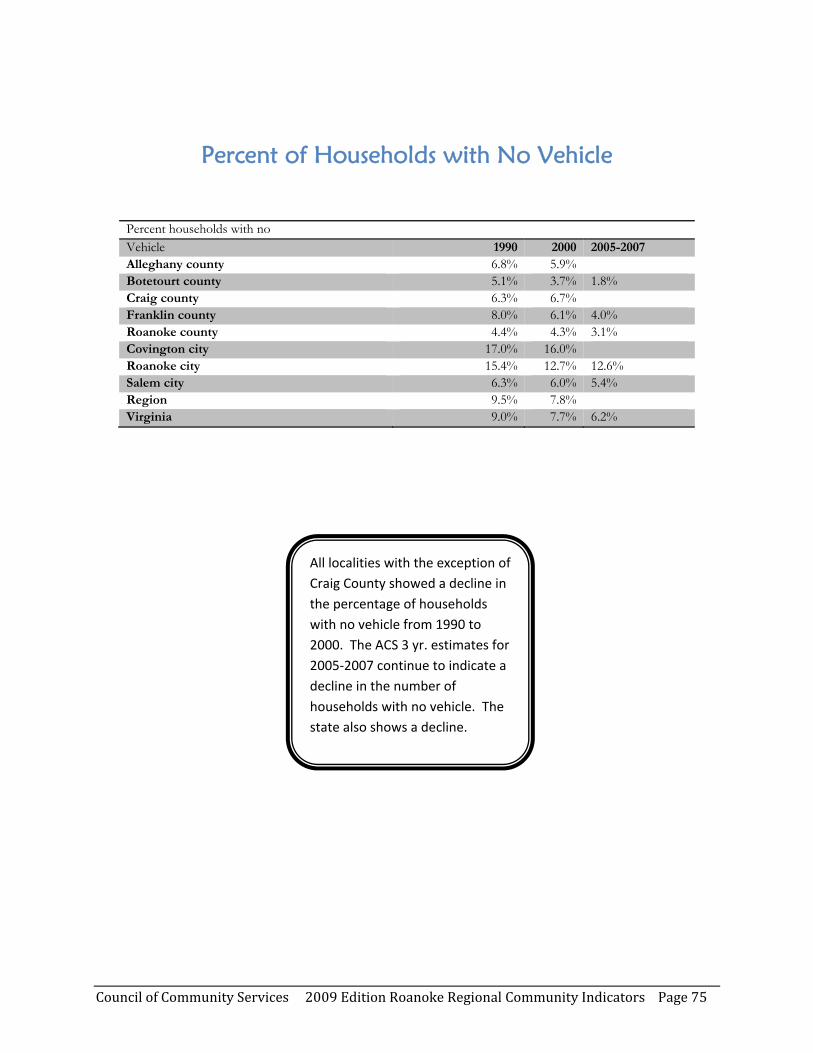
Council of Community Services 2009 Edition Roanoke Regional Community Indicators Page 75
Percent of Households with No Vehicle
Percent households with no Vehicle 1990 2000 2005-2007 Alleghany county 6.8% 5.9% Botetourt county 5.1% 3.7% 1.8% Craig county 6.3% 6.7% Franklin county 8.0% 6.1% 4.0% Roanoke county 4.4% 4.3% 3.1% Covington city 17.0% 16.0% Roanoke city 15.4% 12.7% 12.6% Salem city 6.3% 6.0% 5.4% Region 9.5% 7.8% Virginia 9.0% 7.7% 6.2%
All localities with the exception of Craig County showed a decline in the percentage of households with no vehicle from 1990 to 2000. The ACS 3 yr. estimates for 2005‐2007 continue to indicate a decline in the number of households with no vehicle. The state also shows a decline.

Council of Community Services 2009 Edition Roanoke Regional Community Indicators Page 76
Health Insurance Coverage
0.0%
5.0%
10.0%
15.0%
2000 2005 2006
Region
Region
No health insurance 2000 2005 2006Alleghany county 8.9% 11.7% 14.2%Botetourt county 6.6% 13.5% 13.7%Craig county 8.7% 17.5% 18.3%Franklin county 11.0% 16.4% 17.5%Roanoke county 6.7% 13.3% 14.6%Covington city 11.5% 11.0% 14.5%Roanoke city 14.4% 12.3% 11.3%Salem city 5.6% 9.0% 9.6%Region 9.9% 13.5% 13.7%Virginia 12.2% 14.5% 15.5%
Difference from base year 2000 for No health Ins. coverage 2005 2006 Alleghany county 2.8% 5.3% Botetourt county 6.9% 7.1% Craig county 8.8% 9.6% Franklin county 5.4% 6.5% Roanoke county 6.6% 7.9% Covington city -0.5% 3.0% Roanoke city -2.1% -3.1% Salem city 3.4% 4.0% Region 3.6% 3.8% Virginia 2.3% 3.3%
People without health insurance in the Region has increased 3.8% from ’00 to ’06 for all income levels, under age 65, and both sexes.
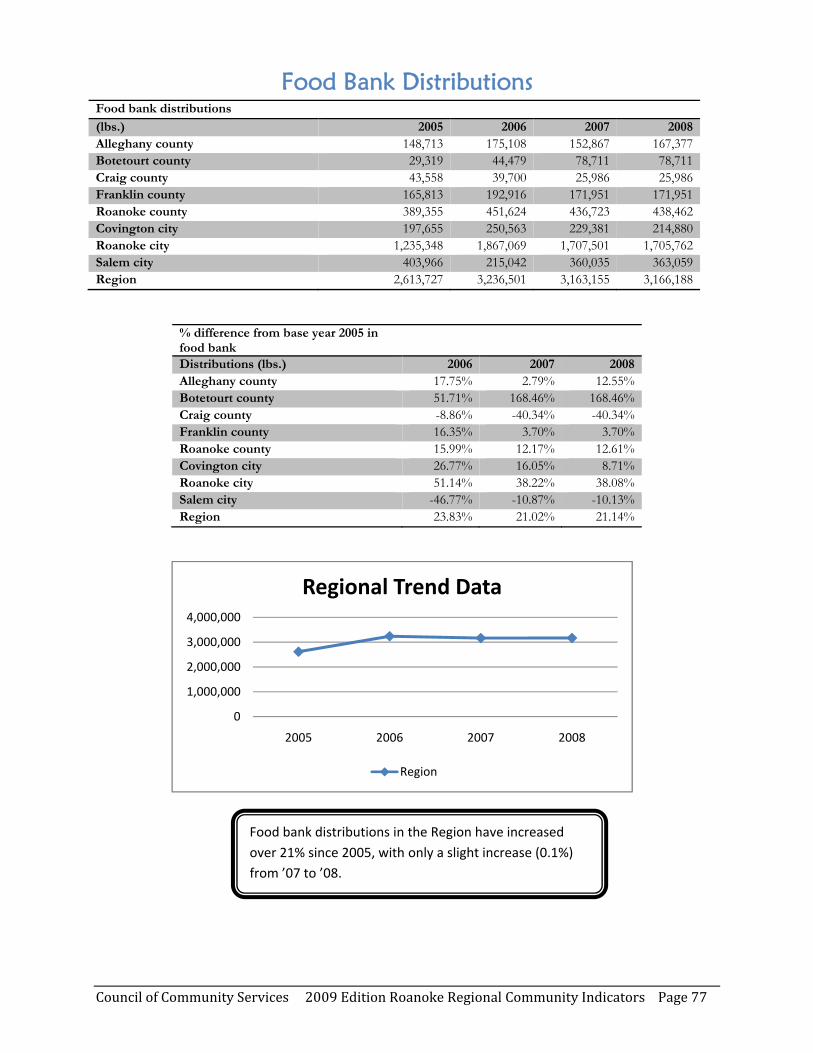
Council of Community Services 2009 Edition Roanoke Regional Community Indicators Page 77
Food Bank Distributions Food bank distributions (lbs.) 2005 2006 2007 2008Alleghany county 148,713 175,108 152,867 167,377Botetourt county 29,319 44,479 78,711 78,711Craig county 43,558 39,700 25,986 25,986Franklin county 165,813 192,916 171,951 171,951Roanoke county 389,355 451,624 436,723 438,462Covington city 197,655 250,563 229,381 214,880Roanoke city 1,235,348 1,867,069 1,707,501 1,705,762Salem city 403,966 215,042 360,035 363,059Region 2,613,727 3,236,501 3,163,155 3,166,188
% difference from base year 2005 in food bank Distributions (lbs.) 2006 2007 2008 Alleghany county 17.75% 2.79% 12.55% Botetourt county 51.71% 168.46% 168.46% Craig county -8.86% -40.34% -40.34% Franklin county 16.35% 3.70% 3.70% Roanoke county 15.99% 12.17% 12.61% Covington city 26.77% 16.05% 8.71% Roanoke city 51.14% 38.22% 38.08% Salem city -46.77% -10.87% -10.13% Region 23.83% 21.02% 21.14%
0
1,000,000
2,000,000
3,000,000
4,000,000
2005 2006 2007 2008
Regional Trend Data
Region
Food bank distributions in the Region have increased over 21% since 2005, with only a slight increase (0.1%) from ’07 to ’08.
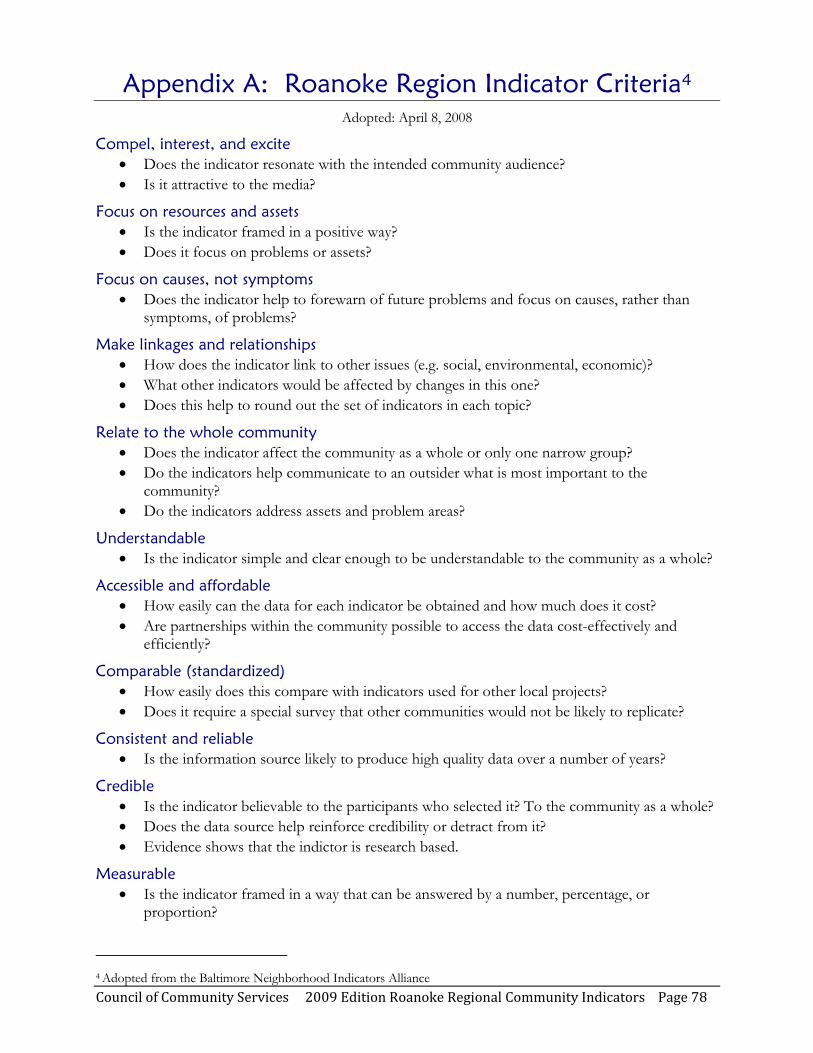
Council of Community Services 2009 Edition Roanoke Regional Community Indicators Page 78
Appendix A: Roanoke Region Indicator Criteria4 Adopted: April 8, 2008
Compel, interest, and excite • Does the indicator resonate with the intended community audience? • Is it attractive to the media?
Focus on resources and assets • Is the indicator framed in a positive way? • Does it focus on problems or assets?
Focus on causes, not symptoms • Does the indicator help to forewarn of future problems and focus on causes, rather than
symptoms, of problems?
Make linkages and relationships • How does the indicator link to other issues (e.g. social, environmental, economic)? • What other indicators would be affected by changes in this one? • Does this help to round out the set of indicators in each topic?
Relate to the whole community • Does the indicator affect the community as a whole or only one narrow group? • Do the indicators help communicate to an outsider what is most important to the
community? • Do the indicators address assets and problem areas?
Understandable • Is the indicator simple and clear enough to be understandable to the community as a whole?
Accessible and affordable • How easily can the data for each indicator be obtained and how much does it cost? • Are partnerships within the community possible to access the data cost-effectively and
efficiently?
Comparable (standardized) • How easily does this compare with indicators used for other local projects? • Does it require a special survey that other communities would not be likely to replicate?
Consistent and reliable • Is the information source likely to produce high quality data over a number of years?
Credible • Is the indicator believable to the participants who selected it? To the community as a whole? • Does the data source help reinforce credibility or detract from it? • Evidence shows that the indictor is research based.
Measurable • Is the indicator framed in a way that can be answered by a number, percentage, or
proportion?
4 Adopted from the Baltimore Neighborhood Indicators Alliance

Council of Community Services 2009 Edition Roanoke Regional Community Indicators Page 79
• Does the data exist to address the indicator, or is there a practical way to obtain the data
needed? • Is the indicator outcome oriented?
Relevant • Does the indicator help us move toward establishing a community goal? • Does it address the issue the community wants to know about? • Does it help to communicate what is important? • Is the indicator truly measuring what it is intended to measure, and not a by-product? • Is the indicator well grounded and founded in fact? • Can you support, defend, and justify it in logical or scientific terms?
Valid • Is the indicator truly measuring what it is intended to measure, and not a by-product? • Is the indicator well grounded and founded in fact? • Can you support, defend, and justify it in logical or scientific terms?
Council of Community Services 2009 Edition Roanoke Regional Community Indicators Page 80
Appendix B: Demographics by Jurisdiction5
• Alleghany County • Botetourt County • Craig County • Franklin County • Roanoke County • Covington City • Roanoke City • Salem
• Roanoke Region • Virginia
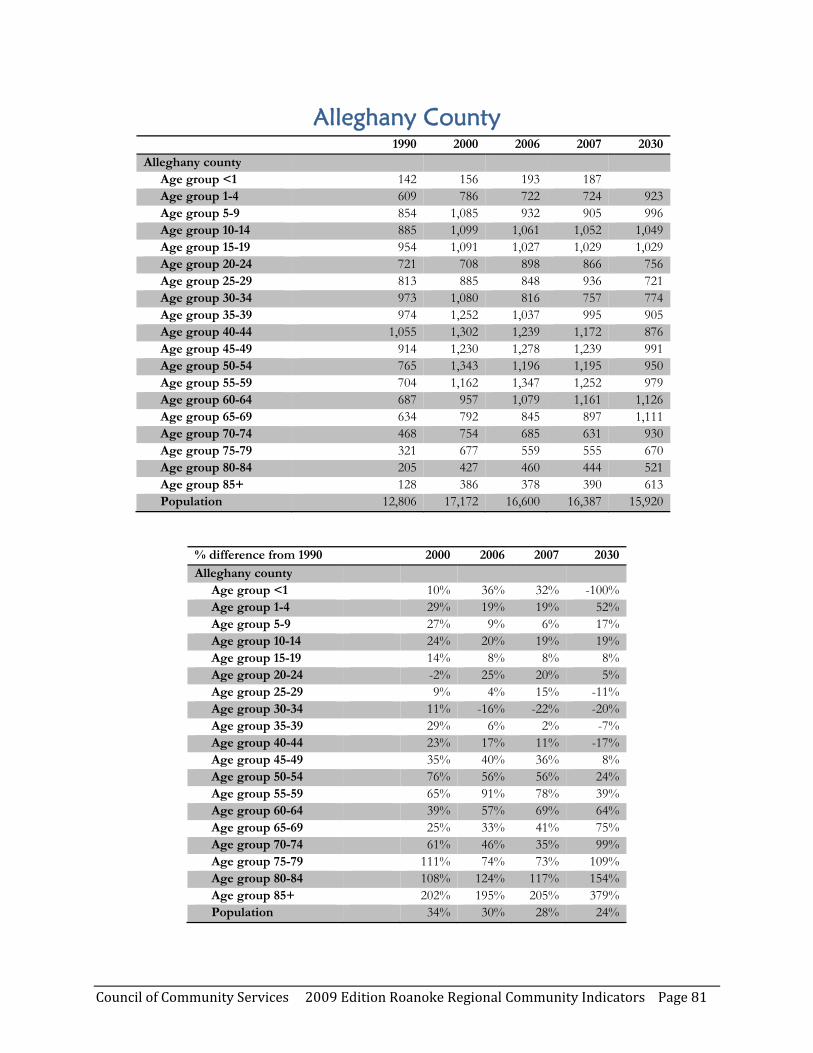
Council of Community Services 2009 Edition Roanoke Regional Community Indicators Page 81
Alleghany County 1990 2000 2006 2007 2030
Alleghany county Age group <1 142 156 193 187 Age group 1-4 609 786 722 724 923 Age group 5-9 854 1,085 932 905 996 Age group 10-14 885 1,099 1,061 1,052 1,049 Age group 15-19 954 1,091 1,027 1,029 1,029 Age group 20-24 721 708 898 866 756 Age group 25-29 813 885 848 936 721 Age group 30-34 973 1,080 816 757 774 Age group 35-39 974 1,252 1,037 995 905 Age group 40-44 1,055 1,302 1,239 1,172 876 Age group 45-49 914 1,230 1,278 1,239 991 Age group 50-54 765 1,343 1,196 1,195 950 Age group 55-59 704 1,162 1,347 1,252 979 Age group 60-64 687 957 1,079 1,161 1,126 Age group 65-69 634 792 845 897 1,111 Age group 70-74 468 754 685 631 930 Age group 75-79 321 677 559 555 670 Age group 80-84 205 427 460 444 521 Age group 85+ 128 386 378 390 613 Population 12,806 17,172 16,600 16,387 15,920
% difference from 1990 2000 2006 2007 2030
Alleghany county Age group <1 10% 36% 32% -100% Age group 1-4 29% 19% 19% 52% Age group 5-9 27% 9% 6% 17% Age group 10-14 24% 20% 19% 19% Age group 15-19 14% 8% 8% 8% Age group 20-24 -2% 25% 20% 5% Age group 25-29 9% 4% 15% -11% Age group 30-34 11% -16% -22% -20% Age group 35-39 29% 6% 2% -7% Age group 40-44 23% 17% 11% -17% Age group 45-49 35% 40% 36% 8% Age group 50-54 76% 56% 56% 24% Age group 55-59 65% 91% 78% 39% Age group 60-64 39% 57% 69% 64% Age group 65-69 25% 33% 41% 75% Age group 70-74 61% 46% 35% 99% Age group 75-79 111% 74% 73% 109% Age group 80-84 108% 124% 117% 154% Age group 85+ 202% 195% 205% 379% Population 34% 30% 28% 24%
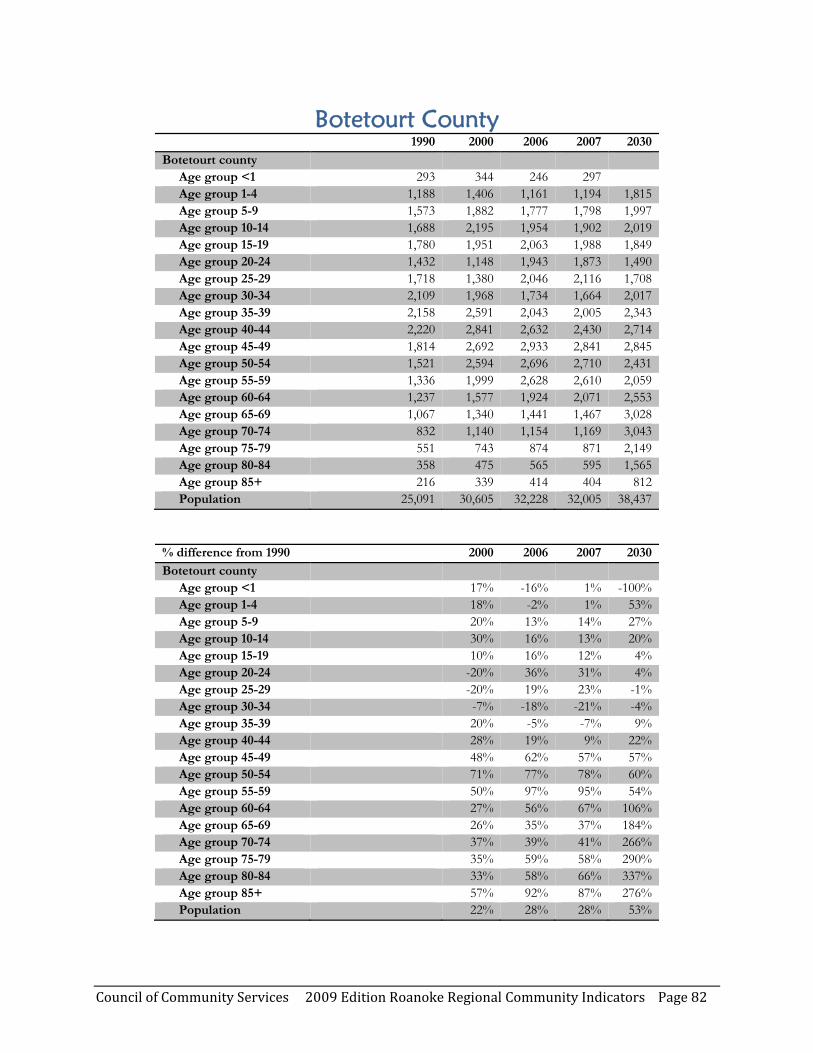
Council of Community Services 2009 Edition Roanoke Regional Community Indicators Page 82
Botetourt County 1990 2000 2006 2007 2030 Botetourt county
Age group <1 293 344 246 297 Age group 1-4 1,188 1,406 1,161 1,194 1,815 Age group 5-9 1,573 1,882 1,777 1,798 1,997 Age group 10-14 1,688 2,195 1,954 1,902 2,019 Age group 15-19 1,780 1,951 2,063 1,988 1,849 Age group 20-24 1,432 1,148 1,943 1,873 1,490 Age group 25-29 1,718 1,380 2,046 2,116 1,708 Age group 30-34 2,109 1,968 1,734 1,664 2,017 Age group 35-39 2,158 2,591 2,043 2,005 2,343 Age group 40-44 2,220 2,841 2,632 2,430 2,714 Age group 45-49 1,814 2,692 2,933 2,841 2,845 Age group 50-54 1,521 2,594 2,696 2,710 2,431 Age group 55-59 1,336 1,999 2,628 2,610 2,059 Age group 60-64 1,237 1,577 1,924 2,071 2,553 Age group 65-69 1,067 1,340 1,441 1,467 3,028 Age group 70-74 832 1,140 1,154 1,169 3,043 Age group 75-79 551 743 874 871 2,149 Age group 80-84 358 475 565 595 1,565 Age group 85+ 216 339 414 404 812 Population 25,091 30,605 32,228 32,005 38,437
% difference from 1990 2000 2006 2007 2030 Botetourt county
Age group <1 17% -16% 1% -100% Age group 1-4 18% -2% 1% 53% Age group 5-9 20% 13% 14% 27% Age group 10-14 30% 16% 13% 20% Age group 15-19 10% 16% 12% 4% Age group 20-24 -20% 36% 31% 4% Age group 25-29 -20% 19% 23% -1% Age group 30-34 -7% -18% -21% -4% Age group 35-39 20% -5% -7% 9% Age group 40-44 28% 19% 9% 22% Age group 45-49 48% 62% 57% 57% Age group 50-54 71% 77% 78% 60% Age group 55-59 50% 97% 95% 54% Age group 60-64 27% 56% 67% 106% Age group 65-69 26% 35% 37% 184% Age group 70-74 37% 39% 41% 266% Age group 75-79 35% 59% 58% 290% Age group 80-84 33% 58% 66% 337% Age group 85+ 57% 92% 87% 276% Population 22% 28% 28% 53%
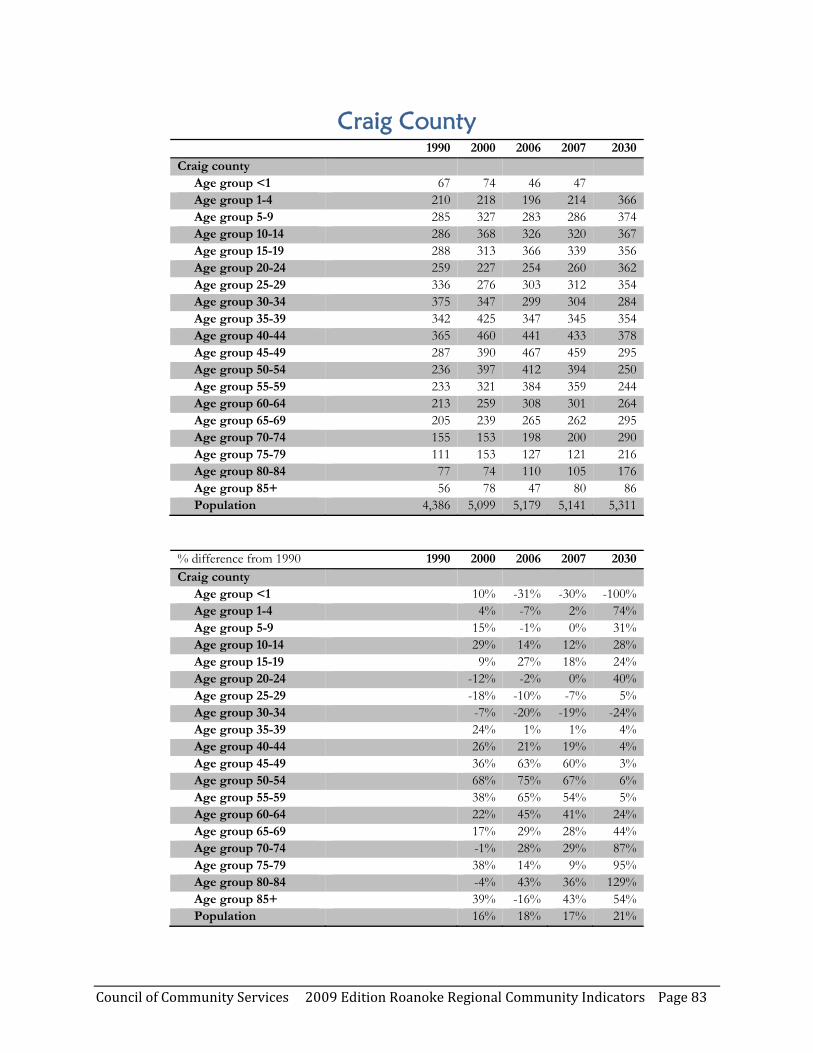
Council of Community Services 2009 Edition Roanoke Regional Community Indicators Page 83
Craig County 1990 2000 2006 2007 2030
Craig county Age group <1 67 74 46 47 Age group 1-4 210 218 196 214 366 Age group 5-9 285 327 283 286 374 Age group 10-14 286 368 326 320 367 Age group 15-19 288 313 366 339 356 Age group 20-24 259 227 254 260 362 Age group 25-29 336 276 303 312 354 Age group 30-34 375 347 299 304 284 Age group 35-39 342 425 347 345 354 Age group 40-44 365 460 441 433 378 Age group 45-49 287 390 467 459 295 Age group 50-54 236 397 412 394 250 Age group 55-59 233 321 384 359 244 Age group 60-64 213 259 308 301 264 Age group 65-69 205 239 265 262 295 Age group 70-74 155 153 198 200 290 Age group 75-79 111 153 127 121 216 Age group 80-84 77 74 110 105 176 Age group 85+ 56 78 47 80 86 Population 4,386 5,099 5,179 5,141 5,311
% difference from 1990 1990 2000 2006 2007 2030
Craig county Age group <1 10% -31% -30% -100% Age group 1-4 4% -7% 2% 74% Age group 5-9 15% -1% 0% 31% Age group 10-14 29% 14% 12% 28% Age group 15-19 9% 27% 18% 24% Age group 20-24 -12% -2% 0% 40% Age group 25-29 -18% -10% -7% 5% Age group 30-34 -7% -20% -19% -24% Age group 35-39 24% 1% 1% 4% Age group 40-44 26% 21% 19% 4% Age group 45-49 36% 63% 60% 3% Age group 50-54 68% 75% 67% 6% Age group 55-59 38% 65% 54% 5% Age group 60-64 22% 45% 41% 24% Age group 65-69 17% 29% 28% 44% Age group 70-74 -1% 28% 29% 87% Age group 75-79 38% 14% 9% 95% Age group 80-84 -4% 43% 36% 129% Age group 85+ 39% -16% 43% 54% Population 16% 18% 17% 21%
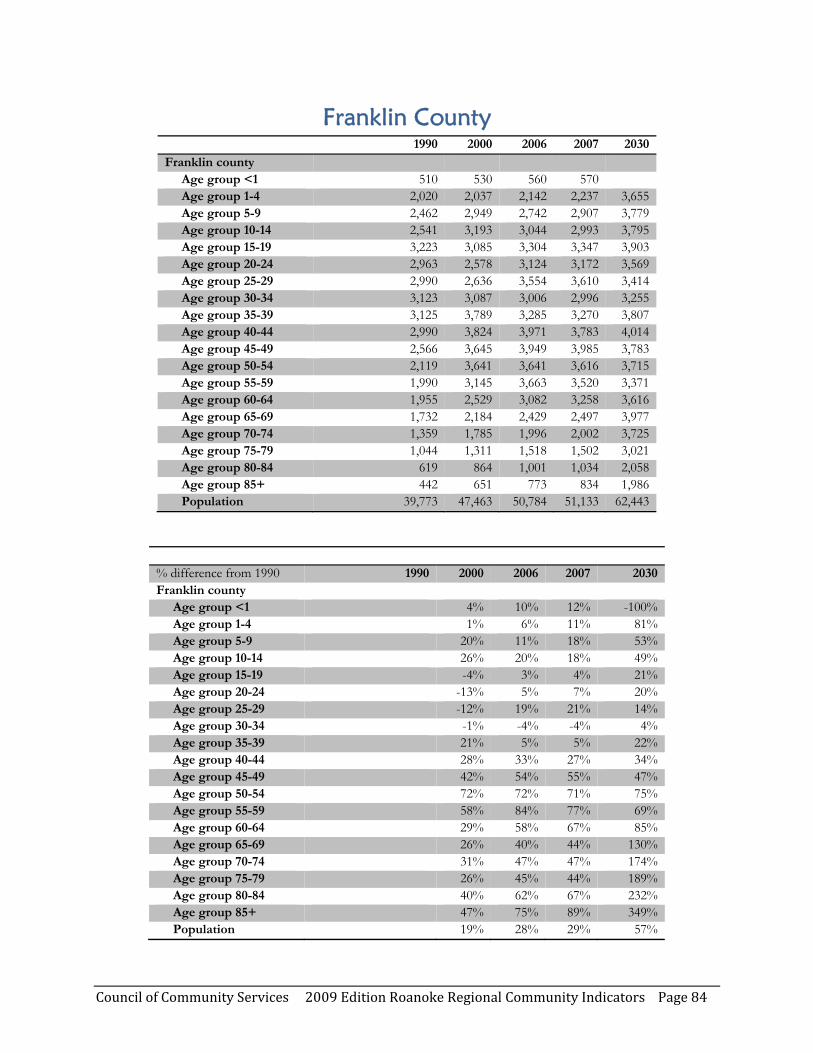
Council of Community Services 2009 Edition Roanoke Regional Community Indicators Page 84
Franklin County 1990 2000 2006 2007 2030
Franklin county Age group <1 510 530 560 570 Age group 1-4 2,020 2,037 2,142 2,237 3,655 Age group 5-9 2,462 2,949 2,742 2,907 3,779 Age group 10-14 2,541 3,193 3,044 2,993 3,795 Age group 15-19 3,223 3,085 3,304 3,347 3,903 Age group 20-24 2,963 2,578 3,124 3,172 3,569 Age group 25-29 2,990 2,636 3,554 3,610 3,414 Age group 30-34 3,123 3,087 3,006 2,996 3,255 Age group 35-39 3,125 3,789 3,285 3,270 3,807 Age group 40-44 2,990 3,824 3,971 3,783 4,014 Age group 45-49 2,566 3,645 3,949 3,985 3,783 Age group 50-54 2,119 3,641 3,641 3,616 3,715 Age group 55-59 1,990 3,145 3,663 3,520 3,371 Age group 60-64 1,955 2,529 3,082 3,258 3,616 Age group 65-69 1,732 2,184 2,429 2,497 3,977 Age group 70-74 1,359 1,785 1,996 2,002 3,725 Age group 75-79 1,044 1,311 1,518 1,502 3,021 Age group 80-84 619 864 1,001 1,034 2,058 Age group 85+ 442 651 773 834 1,986 Population 39,773 47,463 50,784 51,133 62,443
% difference from 1990 1990 2000 2006 2007 2030Franklin county
Age group <1 4% 10% 12% -100% Age group 1-4 1% 6% 11% 81% Age group 5-9 20% 11% 18% 53% Age group 10-14 26% 20% 18% 49% Age group 15-19 -4% 3% 4% 21% Age group 20-24 -13% 5% 7% 20% Age group 25-29 -12% 19% 21% 14% Age group 30-34 -1% -4% -4% 4% Age group 35-39 21% 5% 5% 22% Age group 40-44 28% 33% 27% 34% Age group 45-49 42% 54% 55% 47% Age group 50-54 72% 72% 71% 75% Age group 55-59 58% 84% 77% 69% Age group 60-64 29% 58% 67% 85% Age group 65-69 26% 40% 44% 130% Age group 70-74 31% 47% 47% 174% Age group 75-79 26% 45% 44% 189% Age group 80-84 40% 62% 67% 232% Age group 85+ 47% 75% 89% 349% Population 19% 28% 29% 57%
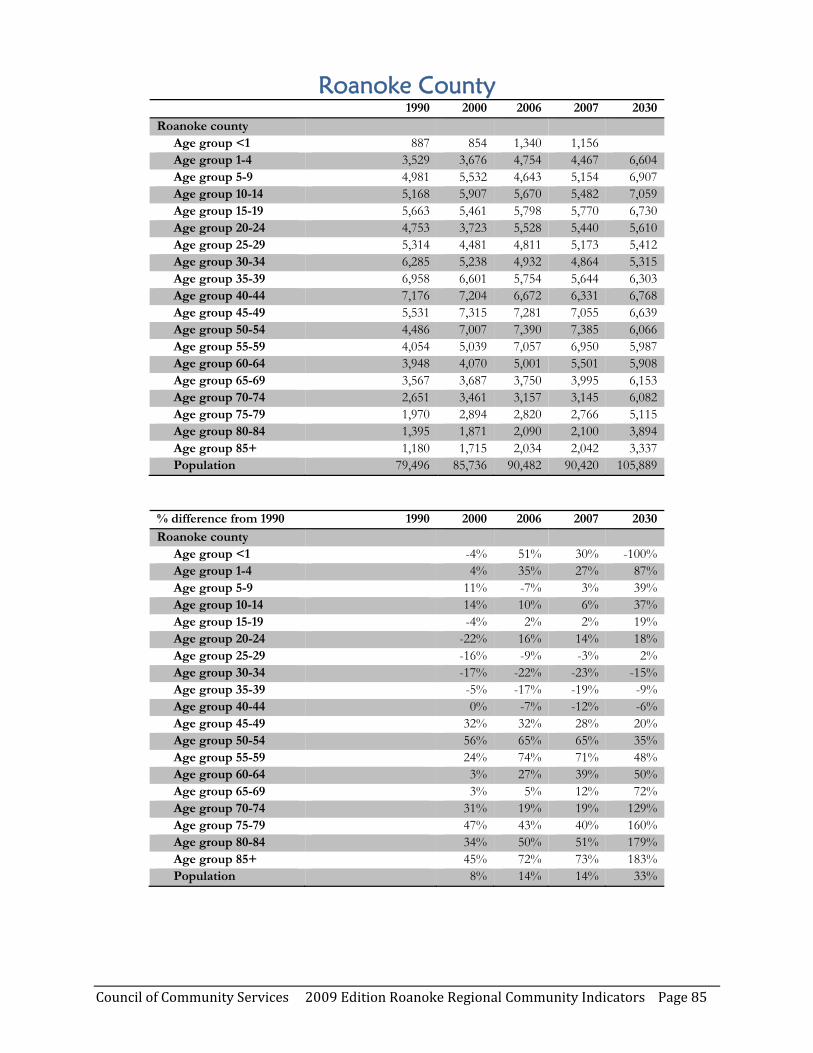
Council of Community Services 2009 Edition Roanoke Regional Community Indicators Page 85
Roanoke County 1990 2000 2006 2007 2030
Roanoke county Age group <1 887 854 1,340 1,156 Age group 1-4 3,529 3,676 4,754 4,467 6,604 Age group 5-9 4,981 5,532 4,643 5,154 6,907 Age group 10-14 5,168 5,907 5,670 5,482 7,059 Age group 15-19 5,663 5,461 5,798 5,770 6,730 Age group 20-24 4,753 3,723 5,528 5,440 5,610 Age group 25-29 5,314 4,481 4,811 5,173 5,412 Age group 30-34 6,285 5,238 4,932 4,864 5,315 Age group 35-39 6,958 6,601 5,754 5,644 6,303 Age group 40-44 7,176 7,204 6,672 6,331 6,768 Age group 45-49 5,531 7,315 7,281 7,055 6,639 Age group 50-54 4,486 7,007 7,390 7,385 6,066 Age group 55-59 4,054 5,039 7,057 6,950 5,987 Age group 60-64 3,948 4,070 5,001 5,501 5,908 Age group 65-69 3,567 3,687 3,750 3,995 6,153 Age group 70-74 2,651 3,461 3,157 3,145 6,082 Age group 75-79 1,970 2,894 2,820 2,766 5,115 Age group 80-84 1,395 1,871 2,090 2,100 3,894 Age group 85+ 1,180 1,715 2,034 2,042 3,337 Population 79,496 85,736 90,482 90,420 105,889
% difference from 1990 1990 2000 2006 2007 2030
Roanoke county Age group <1 -4% 51% 30% -100% Age group 1-4 4% 35% 27% 87% Age group 5-9 11% -7% 3% 39% Age group 10-14 14% 10% 6% 37% Age group 15-19 -4% 2% 2% 19% Age group 20-24 -22% 16% 14% 18% Age group 25-29 -16% -9% -3% 2% Age group 30-34 -17% -22% -23% -15% Age group 35-39 -5% -17% -19% -9% Age group 40-44 0% -7% -12% -6% Age group 45-49 32% 32% 28% 20% Age group 50-54 56% 65% 65% 35% Age group 55-59 24% 74% 71% 48% Age group 60-64 3% 27% 39% 50% Age group 65-69 3% 5% 12% 72% Age group 70-74 31% 19% 19% 129% Age group 75-79 47% 43% 40% 160% Age group 80-84 34% 50% 51% 179% Age group 85+ 45% 72% 73% 183% Population 8% 14% 14% 33%

Council of Community Services 2009 Edition Roanoke Regional Community Indicators Page 86
Covington 1990 2000 2006 2007 2030
Covington city Age group <1 85 82 29 43 Age group 1-4 346 313 221 208 403 Age group 5-9 412 387 390 368 388 Age group 10-14 413 354 389 397 370 Age group 15-19 441 352 349 353 318 Age group 20-24 520 386 276 306 396 Age group 25-29 580 415 479 496 405 Age group 30-34 507 395 382 394 361 Age group 35-39 427 420 368 395 305 Age group 40-44 487 421 420 420 301 Age group 45-49 428 404 414 421 305 Age group 50-54 362 414 405 389 263 Age group 55-59 346 388 410 390 283 Age group 60-64 401 301 314 369 335 Age group 65-69 434 314 294 297 351 Age group 70-74 402 308 258 257 331 Age group 75-79 382 272 251 234 256 Age group 80-84 236 188 206 183 198 Age group 85+ 123 190 218 248 377 Population 7,332 6,304 6,073 6,168 5,946
% difference from 1990 2000 2006 2007 2030
Covington city Age group <1 -4% -66% -49% -100% Age group 1-4 -10% -36% -40% 16% Age group 5-9 -6% -5% -11% -6% Age group 10-14 -14% -6% -4% -10% Age group 15-19 -20% -21% -20% -28% Age group 20-24 -26% -47% -41% -24% Age group 25-29 -28% -17% -14% -30% Age group 30-34 -22% -25% -22% -29% Age group 35-39 -2% -14% -7% -29% Age group 40-44 -14% -14% -14% -38% Age group 45-49 -6% -3% -2% -29% Age group 50-54 14% 12% 7% -27% Age group 55-59 12% 18% 13% -18% Age group 60-64 -25% -22% -8% -16% Age group 65-69 -28% -32% -32% -19% Age group 70-74 -23% -36% -36% -18% Age group 75-79 -29% -34% -39% -33% Age group 80-84 -20% -13% -22% -16% Age group 85+ 54% 77% 102% 207% Population -14% -17% -16% -19%
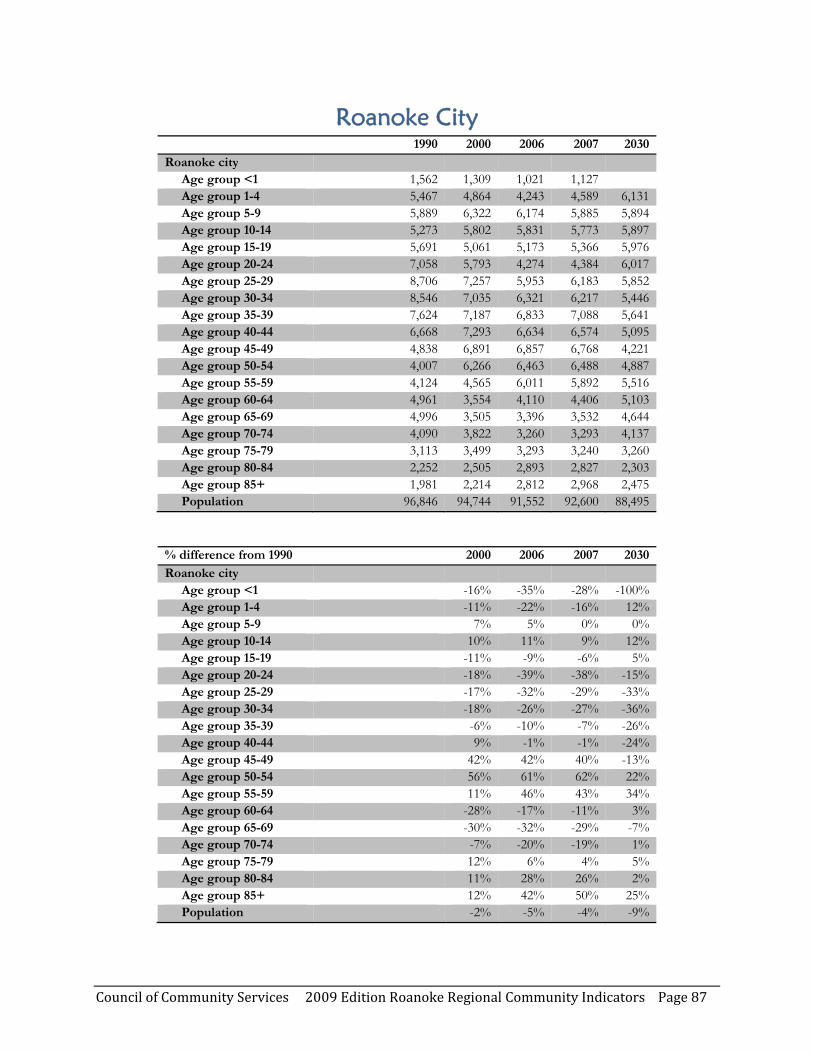
Council of Community Services 2009 Edition Roanoke Regional Community Indicators Page 87
Roanoke City 1990 2000 2006 2007 2030
Roanoke city Age group <1 1,562 1,309 1,021 1,127 Age group 1-4 5,467 4,864 4,243 4,589 6,131 Age group 5-9 5,889 6,322 6,174 5,885 5,894 Age group 10-14 5,273 5,802 5,831 5,773 5,897 Age group 15-19 5,691 5,061 5,173 5,366 5,976 Age group 20-24 7,058 5,793 4,274 4,384 6,017 Age group 25-29 8,706 7,257 5,953 6,183 5,852 Age group 30-34 8,546 7,035 6,321 6,217 5,446 Age group 35-39 7,624 7,187 6,833 7,088 5,641 Age group 40-44 6,668 7,293 6,634 6,574 5,095 Age group 45-49 4,838 6,891 6,857 6,768 4,221 Age group 50-54 4,007 6,266 6,463 6,488 4,887 Age group 55-59 4,124 4,565 6,011 5,892 5,516 Age group 60-64 4,961 3,554 4,110 4,406 5,103 Age group 65-69 4,996 3,505 3,396 3,532 4,644 Age group 70-74 4,090 3,822 3,260 3,293 4,137 Age group 75-79 3,113 3,499 3,293 3,240 3,260 Age group 80-84 2,252 2,505 2,893 2,827 2,303 Age group 85+ 1,981 2,214 2,812 2,968 2,475 Population 96,846 94,744 91,552 92,600 88,495
% difference from 1990 2000 2006 2007 2030
Roanoke city Age group <1 -16% -35% -28% -100% Age group 1-4 -11% -22% -16% 12% Age group 5-9 7% 5% 0% 0% Age group 10-14 10% 11% 9% 12% Age group 15-19 -11% -9% -6% 5% Age group 20-24 -18% -39% -38% -15% Age group 25-29 -17% -32% -29% -33% Age group 30-34 -18% -26% -27% -36% Age group 35-39 -6% -10% -7% -26% Age group 40-44 9% -1% -1% -24% Age group 45-49 42% 42% 40% -13% Age group 50-54 56% 61% 62% 22% Age group 55-59 11% 46% 43% 34% Age group 60-64 -28% -17% -11% 3% Age group 65-69 -30% -32% -29% -7% Age group 70-74 -7% -20% -19% 1% Age group 75-79 12% 6% 4% 5% Age group 80-84 11% 28% 26% 2% Age group 85+ 12% 42% 50% 25% Population -2% -5% -4% -9%

Council of Community Services 2009 Edition Roanoke Regional Community Indicators Page 88
Salem 1990 2000 2006 2007 2030
Salem city Age group <1 244 217 232 245 Age group 1-4 1,006 989 945 965 1,248 Age group 5-9 1,321 1,444 1,174 1,200 1,434 Age group 10-14 1,350 1,539 1,439 1,432 1,458 Age group 15-19 1,887 1,999 2,038 2,100 1,875 Age group 20-24 1,888 1,882 2,079 2,189 1,791 Age group 25-29 1,651 1,417 1,591 1,717 1,389 Age group 30-34 1,835 1,489 1,373 1,326 1,216 Age group 35-39 1,792 1,725 1,496 1,576 1,342 Age group 40-44 1,738 1,984 1,683 1,635 1,408 Age group 45-49 1,385 1,797 1,942 1,818 1,369 Age group 50-54 1,243 1,673 1,768 1,811 1,172 Age group 55-59 1,256 1,333 1,659 1,643 1,187 Age group 60-64 1,296 1,147 1,216 1,329 1,276 Age group 65-69 1,294 1,126 1,095 1,155 1,519 Age group 70-74 1,012 1,047 969 979 1,483 Age group 75-79 756 901 854 852 1,293 Age group 80-84 488 582 683 674 935 Age group 85+ 406 491 589 587 748 Population 23,848 24,782 24,825 25,233 24,143
% difference from 1990 1990 2000 2006 2007 2030
Salem city Age group <1 -11% -5% 0% -100% Age group 1-4 -2% -6% -4% 24% Age group 5-9 9% -11% -9% 9% Age group 10-14 14% 7% 6% 8% Age group 15-19 6% 8% 11% -1% Age group 20-24 0% 10% 16% -5% Age group 25-29 -14% -4% 4% -16% Age group 30-34 -19% -25% -28% -34% Age group 35-39 -4% -17% -12% -25% Age group 40-44 14% -3% -6% -19% Age group 45-49 30% 40% 31% -1% Age group 50-54 35% 42% 46% -6% Age group 55-59 6% 32% 31% -5% Age group 60-64 -11% -6% 3% -2% Age group 65-69 -13% -15% -11% 17% Age group 70-74 3% -4% -3% 47% Age group 75-79 19% 13% 13% 71% Age group 80-84 19% 40% 38% 92% Age group 85+ 21% 45% 45% 84% Population 4% 4% 6% 1%

Council of Community Services 2009 Edition Roanoke Regional Community Indicators Page 89
Region 1990 2000 2006 2007 2030
Region Age group <1 3,790 3,566 3,667 3,672 Age group 1-4 14,375 14,289 14,384 14,598 21,145Age group 5-9 17,777 19,928 18,115 18,503 21,769
Age group 10-14 17,604 20,457 19,714 19,351 22,014Age group 15-19 19,927 19,313 20,118 20,292 22,036Age group 20-24 19,594 16,445 18,376 18,490 19,991Age group 25-29 22,108 18,747 19,585 20,543 19,255Age group 30-34 23,753 20,639 18,863 18,522 18,668Age group 35-39 23,400 23,990 21,163 21,318 21,000Age group 40-44 22,699 25,329 23,692 22,778 21,554Age group 45-49 17,763 24,364 25,121 24,586 20,448Age group 50-54 14,739 23,335 23,971 23,988 19,734Age group 55-59 14,043 17,952 23,159 22,616 19,626Age group 60-64 14,698 14,394 17,034 18,396 20,181Age group 65-69 13,929 13,187 13,515 14,102 21,078Age group 70-74 10,969 12,470 11,677 11,676 20,021Age group 75-79 8,248 10,450 10,296 10,141 15,980Age group 80-84 5,630 6,986 8,008 7,962 11,650Age group 85+ 4,532 6,064 7,265 7,553 10,434
Population 289,578 311,905 317,723 319,087 346,584
% difference from State 1990 2000 2006 2007 2030
Region Age group <1 -6% -3% -3% -100%Age group 1-4 -1% 0% 2% 47%Age group 5-9 12% 2% 4% 22%
Age group 10-14 16% 12% 10% 25%Age group 15-19 -3% 1% 2% 11%Age group 20-24 -16% -6% -6% 2%Age group 25-29 -15% -11% -7% -13%Age group 30-34 -13% -21% -22% -21%Age group 35-39 3% -10% -9% -10%Age group 40-44 12% 4% 0% -5%Age group 45-49 37% 41% 38% 15%Age group 50-54 58% 63% 63% 34%Age group 55-59 28% 65% 61% 40%Age group 60-64 -2% 16% 25% 37%Age group 65-69 -5% -3% 1% 51%Age group 70-74 14% 6% 6% 83%Age group 75-79 27% 25% 23% 94%Age group 80-84 24% 42% 41% 107%Age group 85+ 34% 60% 67% 130%
Population 8% 10% 10% 20%
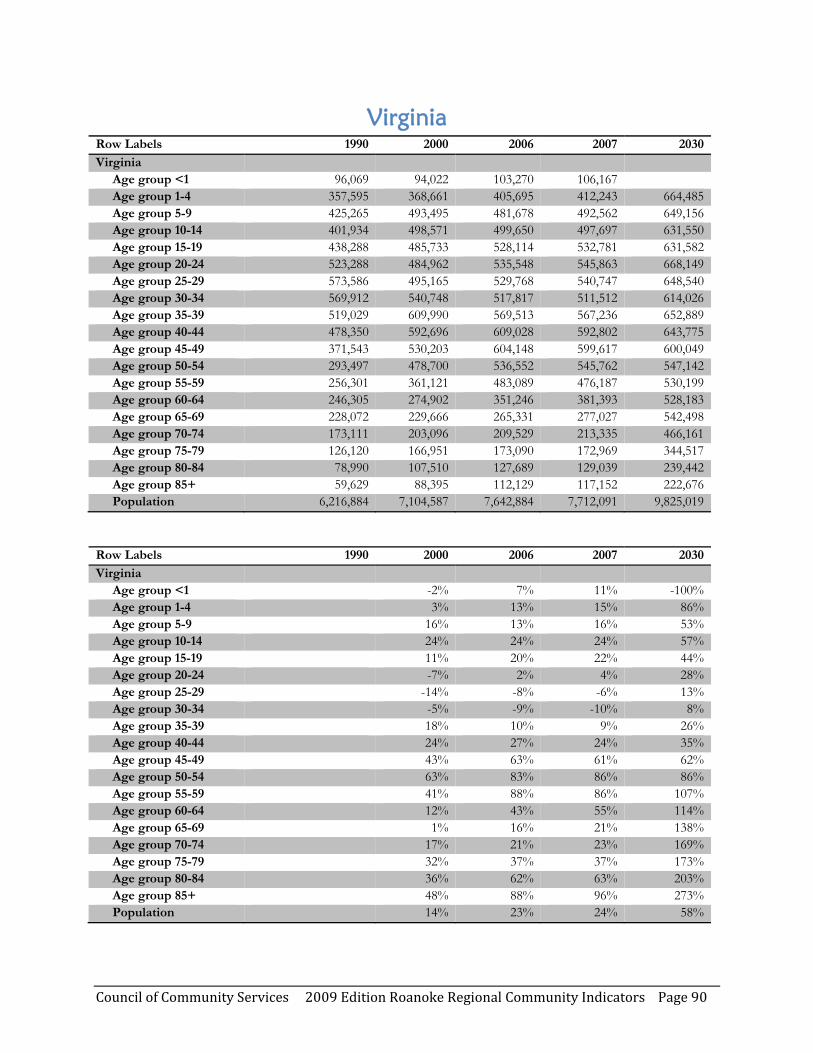
Council of Community Services 2009 Edition Roanoke Regional Community Indicators Page 90
Virginia Row Labels 1990 2000 2006 2007 2030
Virginia Age group <1 96,069 94,022 103,270 106,167 Age group 1-4 357,595 368,661 405,695 412,243 664,485 Age group 5-9 425,265 493,495 481,678 492,562 649,156 Age group 10-14 401,934 498,571 499,650 497,697 631,550 Age group 15-19 438,288 485,733 528,114 532,781 631,582 Age group 20-24 523,288 484,962 535,548 545,863 668,149 Age group 25-29 573,586 495,165 529,768 540,747 648,540 Age group 30-34 569,912 540,748 517,817 511,512 614,026 Age group 35-39 519,029 609,990 569,513 567,236 652,889 Age group 40-44 478,350 592,696 609,028 592,802 643,775 Age group 45-49 371,543 530,203 604,148 599,617 600,049 Age group 50-54 293,497 478,700 536,552 545,762 547,142 Age group 55-59 256,301 361,121 483,089 476,187 530,199 Age group 60-64 246,305 274,902 351,246 381,393 528,183 Age group 65-69 228,072 229,666 265,331 277,027 542,498 Age group 70-74 173,111 203,096 209,529 213,335 466,161 Age group 75-79 126,120 166,951 173,090 172,969 344,517 Age group 80-84 78,990 107,510 127,689 129,039 239,442 Age group 85+ 59,629 88,395 112,129 117,152 222,676 Population 6,216,884 7,104,587 7,642,884 7,712,091 9,825,019
Row Labels 1990 2000 2006 2007 2030
Virginia Age group <1 -2% 7% 11% -100% Age group 1-4 3% 13% 15% 86% Age group 5-9 16% 13% 16% 53% Age group 10-14 24% 24% 24% 57% Age group 15-19 11% 20% 22% 44% Age group 20-24 -7% 2% 4% 28% Age group 25-29 -14% -8% -6% 13% Age group 30-34 -5% -9% -10% 8% Age group 35-39 18% 10% 9% 26% Age group 40-44 24% 27% 24% 35% Age group 45-49 43% 63% 61% 62% Age group 50-54 63% 83% 86% 86% Age group 55-59 41% 88% 86% 107% Age group 60-64 12% 43% 55% 114% Age group 65-69 1% 16% 21% 138% Age group 70-74 17% 21% 23% 169% Age group 75-79 32% 37% 37% 173% Age group 80-84 36% 62% 63% 203% Age group 85+ 48% 88% 96% 273% Population 14% 23% 24% 58%

Council of Community Services 2009 Edition Roanoke Regional Community Indicators Page 91
Appendix C: Race and Ethnicity * *All data for race/ethnicity and population tables for years 1990, 2000, 2006 and 2007 were derived
from United States Department of Health and Human Services, Centers for Disease Control and Prevention, National Center for Health Statistics, Bridged-Race Population Estimates, United States July 1st resident population by state, county, age, sex, bridged-race and Hispanic origin, compiled from 1990-1999 bridged-race intercensal population estimates and 2000-2006 (Vintage 2006; Vintage 2007) bridged-race postcensal population estimates, on CDC WONDER On –line Database accessed at http://www.wonder.cdc.gov
Projections for the year 2010 and 2030 were calculated from the Virginia Employment Commission, Virginia Workforce Connection at http://www.vaworkconnect.com

Council of Community Services 2009 Edition Roanoke Regional Community Indicators Page 92
Race and Ethnicity 2000 2006 2007 2010 2030
Alleghany county Black % of total population 6.0% 6.0% 6.2% 6.0% 8.4% White % of total population 93.0% 93.0% 92.5% 93.0% 90.5% Hispanic % of total population 0.5% 0.7% 0.7% 0.6% 0.7% Asian % of total population 0.2% 0.3% 0.3% 0.1% 0.4% Am. Indian % of total population 0.2% 0.2% 0.2% 0.0% 0.1%
Botetourt county Black % of total population 4.0% 4.0% 4.6% 4.0% 3.4% White % of total population 95.0% 94.0% 93.3% 94.0% 94.1% Hispanic % of total population 0.6% 1.0% 1.1% 0.8% 1.1% Asian % of total population 0.5% 0.7% 0.8% 0.8% 1.2% Am. Indian % of total population 0.2% 0.2% 0.2% 0.2% 0.2%
Craig county Black % of total population 0.5% 0.5% 0.6% 0.5% 0.4% White % of total population 99.0% 99.0% 98.4% 99.0% 99.0% Hispanic % of total population 0.3% 0.4% 0.5% 0.3% 0.2% Asian % of total population 0.1% 0.3% 0.3% 0.2% 0.3% Am. Indian % of total population 0.2% 0.2% 0.2% 0.2% 0.1%
Franklin county Black % of total population 9.5% 9.0% 9.2% 9.0% 9.7% White % of total population 89.0% 89.0% 88.1% 89.0% 87.5% Hispanic % of total population 1.0% 1.6% 2.1% 1.5% 2.2% Asian % of total population 0.4% 0.4% 0.4% 0.4% 0.6% Am. Indian % of total population 0.2% 0.2% 0.2% 0.2% 0.1%
Roanoke county Black % of total population 3.0% 5.0% 5.4% 5.0% 6.3% White % of total population 94.0% 91.0% 90.3% 91.0% 88.1% Hispanic % of total population 1.0% 1.8% 1.9% 1.7% 2.6% Asian % of total population 1.7% 2.0% 2.2% 2.0% 3.0% Am. Indian % of total population 0.1% 0.1% 0.1% 0.1% 0.1%

Council of Community Services 2009 Edition Roanoke Regional Community Indicators Page 93
2000 2006 2007 2010 2030
Covington city Black % of total population 14.0% 15.0% 14.5% 16.0% 19.8% White % of total population 84.0% 82.0% 82.8% 83.0% 78.2% Hispanic % of total population 0.7% 1.0% 1.4% 0.5% 0.7% Asian % of total population 0.7% 1.1% 1.0% 0.6% 1.1% Am. Indian % of total population 0.4% 0.4% 0.4% 0.2% 0.1%
Roanoke city Black % of total population 27.0% 28.0% 27.6% 29.0% 32.3% White % of total population 70.0% 68.0% 68.2% 66.0% 61.8% Hispanic % of total population 1.5% 2.3% 2.5% 2.3% 3.4% Asian % of total population 1.0% 1.4% 1.4% 1.7% 2.4% Am. Indian % of total population 0.2% 0.2% 0.2% 0.2% 0.2%
Salem city Black % of total population 6.0% 7.0% 7.1% 7.0% 9.4% White % of total population 92.0% 90.0% 90.0% 91.0% 86.6% Hispanic % of total population 0.9% 1.3% 1.4% 1.1% 2.0% Asian % of total population 1.0% 1.3% 1.4% 1.2% 1.9% Am. Indian % of total population 0.1% 0.2% 0.1% 0.1% 0.1%
Region Black % of total population 12.0% 12.0% 12.7% 13.0% 13.7% White % of total population 85.0% 84.0% 83.9% 84.0% 82.0% Hispanic % of total population 1.0% 1.7% 1.9% 1.6% 2.3% Asian % of total population 1.0% 1.3% 1.3% 1.4% 1.9% Am. Indian % of total population 0.2% 0.2% 0.2% 0.2% 0.1%
Virginia Black % of total population 20.0% 20.0% 20.0% 20.0% 21.1% White % of total population 71.0% 68.0% 68.0% 67.0% 60.6% Hispanic % of total population 4.7% 6.0% 6.6% 7.0% 10.1% Asian % of total population 4.0% 5.0% 5.1% 5.0% 8.0% Am. Indian % of total population 0.3% 0.3% 0.3% 0.3% 0.2%
Council of Community Services 2009 Edition Roanoke Regional Community Indicators Page 94
Appendix D: Indicators for which only local numbers are
provided as no regional numbers could be calculated • Affordability of a single family home
• Births to mothers with less than a high school diploma
• Median Income for Seniors 65-74
• Median Income for Seniors 75 and older
• Median Family Income

Council of Community Services 2009 Edition Roanoke Regional Community Indicators Page 95
Affordability of a Single Family Home All Locations Location 1990 2000 2005-2007Alleghany county
Median value of a single family home $50,200 $77,500 Median family income 31,145 45,843 Affordability of single-family home 1.61 1.69
Botetourt county Median value of a single family home $72,900 $130,500 $177,700 Median family income 37,116 55,125 68,085 Affordability of single-family home 1.96 2.37 2.61
Craig county Median value of a single family home $50,800 $85,400 Median family income 28,530 41,750 Affordability of single-family home 1.78 2.05
Franklin county Median value of a single family home $63,100 $105,000 $142,900 Median family income 29,958 45,163 50,647 Affordability of single-family home 2.11 2.32 2.82
Roanoke county Median value of a single family home $80,100 $118,100 $165,400 Median family income 42,223 56,450 71,504 Affordability of single-family home 1.89 2.09 2.31
Covington city Median value of a single family home $38,500 $52,500 Median family income 26,091 36,640 Affordability of single-family home 1.48 1.43
Roanoke city Median value of a single family home $53,700 $80,300 $116,000 Median family income 28,203 37,826 46,737 Affordability of single-family home 1.90 2.12 2.48
Salem city Median value of a single family home $69,100 $104,200 $146,100 Median family income 35,619 47,174 64,363 Affordability of single-family home 1.94 2.21 2.27
Virginia Median value of a single family home $90,400 $125,400 $238,600 Median family income 38,213 54,169 69,609 Affordability of single-family home 2.37 2.31 3.43
The ACS 3 yr. estimates indicate the increase in the affordability of a single family home in the five localities measured by the ACS.
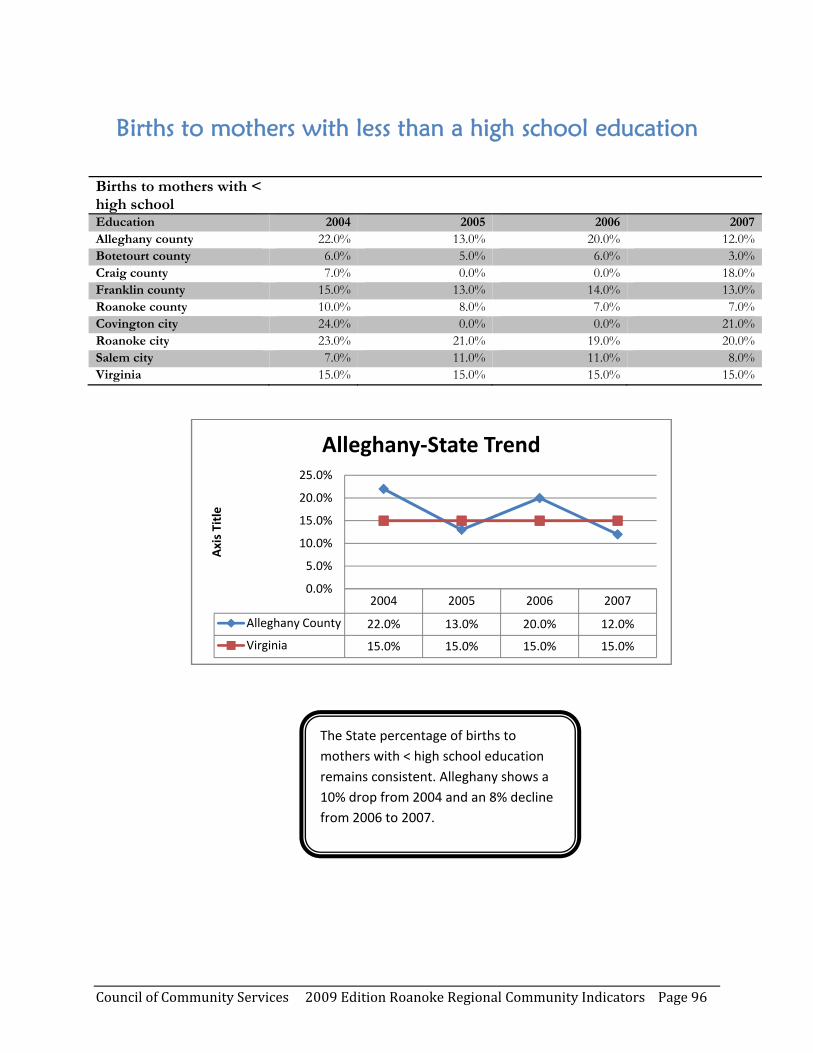
Council of Community Services 2009 Edition Roanoke Regional Community Indicators Page 96
Births to mothers with less than a high school education
2004 2005 2006 2007
Alleghany County 22.0% 13.0% 20.0% 12.0%
Virginia 15.0% 15.0% 15.0% 15.0%
0.0%
5.0%
10.0%
15.0%
20.0%
25.0%
Axis Title
Alleghany‐State Trend
Births to mothers with < high school
Education 2004 2005 2006 2007Alleghany county 22.0% 13.0% 20.0% 12.0%Botetourt county 6.0% 5.0% 6.0% 3.0%Craig county 7.0% 0.0% 0.0% 18.0%Franklin county 15.0% 13.0% 14.0% 13.0%Roanoke county 10.0% 8.0% 7.0% 7.0%Covington city 24.0% 0.0% 0.0% 21.0%Roanoke city 23.0% 21.0% 19.0% 20.0%Salem city 7.0% 11.0% 11.0% 8.0%Virginia 15.0% 15.0% 15.0% 15.0%
The State percentage of births to mothers with < high school education remains consistent. Alleghany shows a 10% drop from 2004 and an 8% decline from 2006 to 2007.
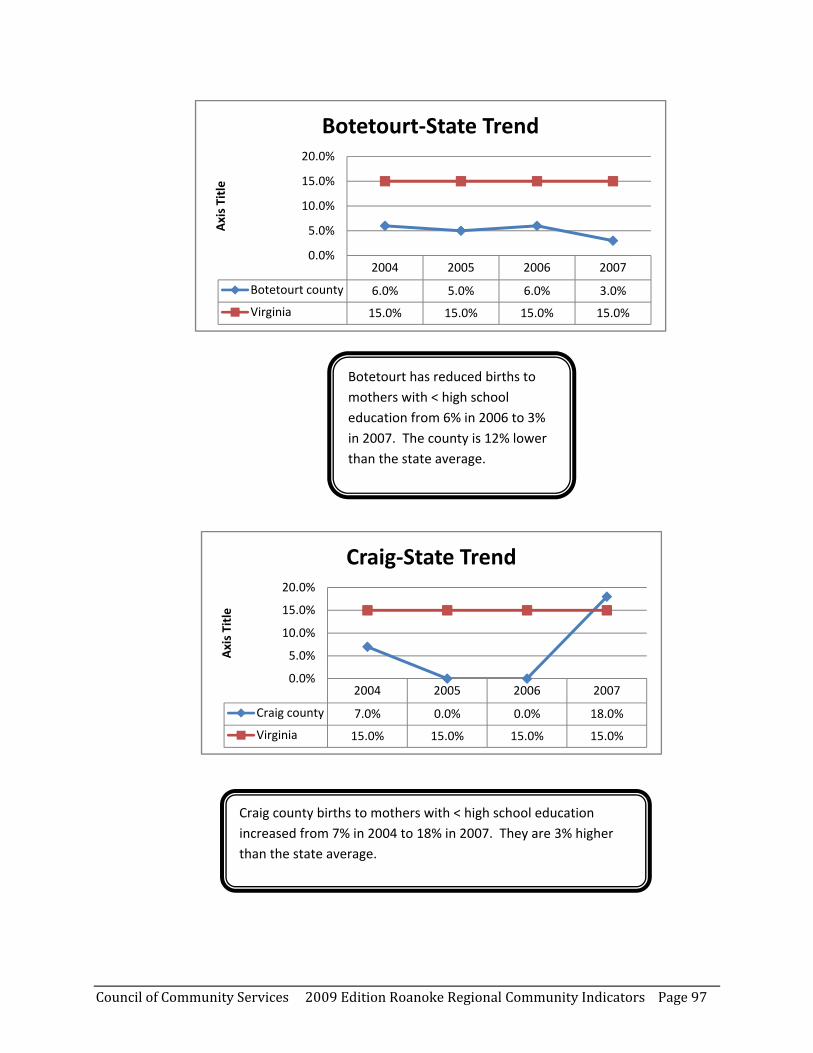
Council of Community Services 2009 Edition Roanoke Regional Community Indicators Page 97
2004 2005 2006 2007
Botetourt county 6.0% 5.0% 6.0% 3.0%
Virginia 15.0% 15.0% 15.0% 15.0%
0.0%
5.0%
10.0%
15.0%
20.0%
Axis Title
Botetourt‐State Trend
2004 2005 2006 2007
Craig county 7.0% 0.0% 0.0% 18.0%
Virginia 15.0% 15.0% 15.0% 15.0%
0.0%
5.0%
10.0%
15.0%
20.0%
Axis Title
Craig‐State Trend
Botetourt has reduced births to mothers with < high school education from 6% in 2006 to 3% in 2007. The county is 12% lower than the state average.
Craig county births to mothers with < high school education increased from 7% in 2004 to 18% in 2007. They are 3% higher than the state average.
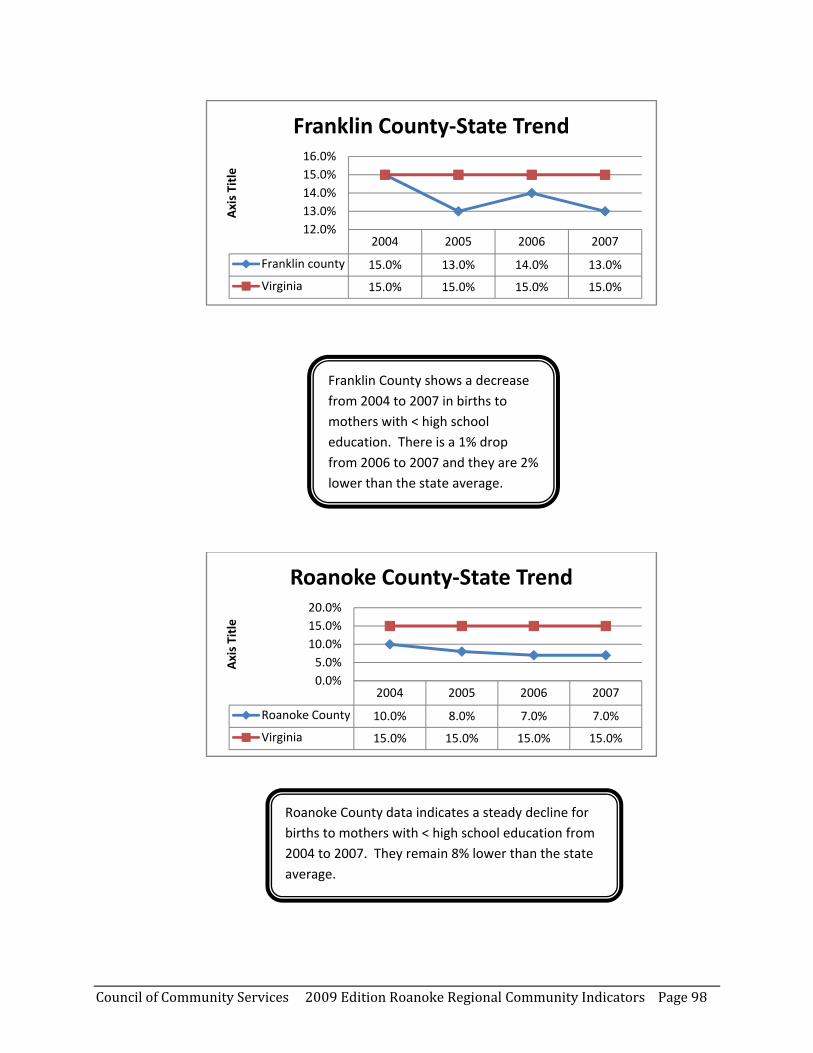
Council of Community Services 2009 Edition Roanoke Regional Community Indicators Page 98
2004 2005 2006 2007
Franklin county 15.0% 13.0% 14.0% 13.0%
Virginia 15.0% 15.0% 15.0% 15.0%
12.0%13.0%14.0%15.0%16.0%
Axis Title
Franklin County‐State Trend
2004 2005 2006 2007
Roanoke County 10.0% 8.0% 7.0% 7.0%
Virginia 15.0% 15.0% 15.0% 15.0%
0.0%5.0%
10.0%15.0%20.0%
Axis Title
Roanoke County‐State Trend
Franklin County shows a decrease from 2004 to 2007 in births to mothers with < high school education. There is a 1% drop from 2006 to 2007 and they are 2% lower than the state average.
Roanoke County data indicates a steady decline for births to mothers with < high school education from 2004 to 2007. They remain 8% lower than the state average.
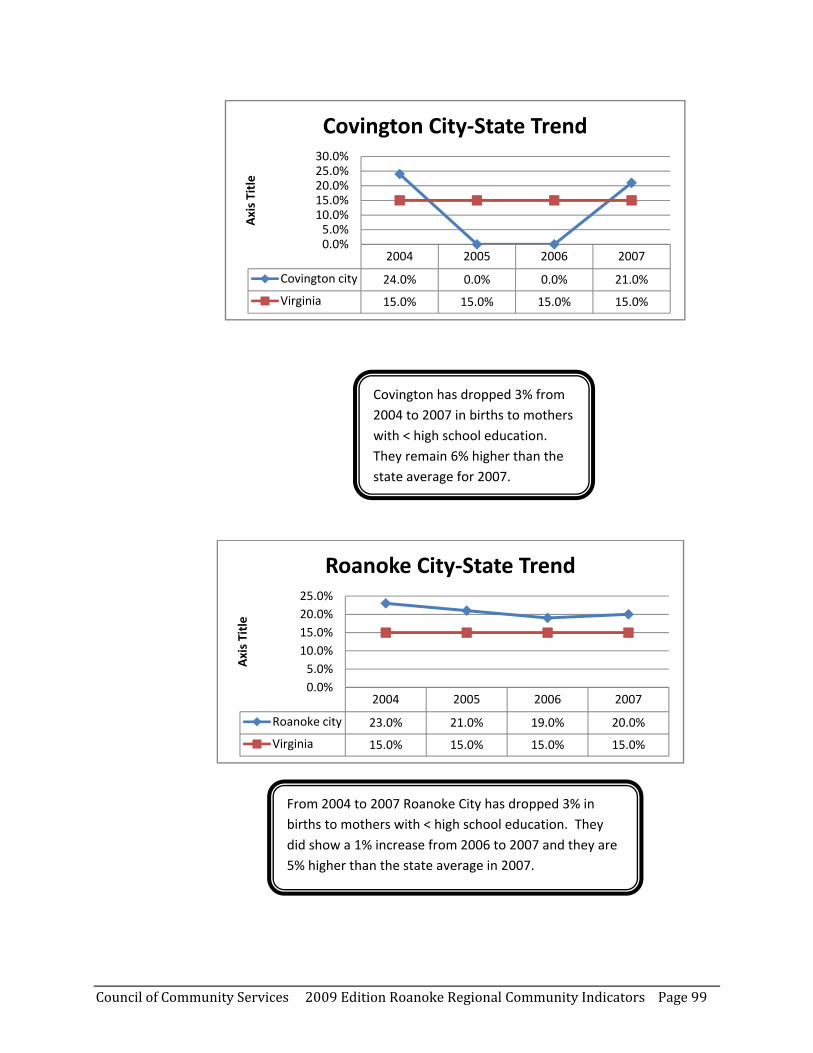
Council of Community Services 2009 Edition Roanoke Regional Community Indicators Page 99
2004 2005 2006 2007
Covington city 24.0% 0.0% 0.0% 21.0%
Virginia 15.0% 15.0% 15.0% 15.0%
0.0%5.0%10.0%15.0%20.0%25.0%30.0%
Axis Title
Covington City‐State Trend
2004 2005 2006 2007
Roanoke city 23.0% 21.0% 19.0% 20.0%
Virginia 15.0% 15.0% 15.0% 15.0%
0.0%5.0%
10.0%15.0%20.0%25.0%
Axis Title
Roanoke City‐State Trend
Covington has dropped 3% from 2004 to 2007 in births to mothers with < high school education. They remain 6% higher than the state average for 2007.
From 2004 to 2007 Roanoke City has dropped 3% in births to mothers with < high school education. They did show a 1% increase from 2006 to 2007 and they are 5% higher than the state average in 2007.

Council of Community Services 2009 Edition Roanoke Regional Community Indicators Page 100
2004 2005 2006 2007
Salem city 7.0% 11.0% 11.0% 8.0%
Virginia 15.0% 15.0% 15.0% 15.0%
0.0%5.0%10.0%15.0%20.0%
Axis Title
Salem‐State Trend
Salem had a 3% decline in births to mothers with < high school education from 2006 to 2007. They have increased by 1% over 2004 but are 7% lower than the state average for 2007.
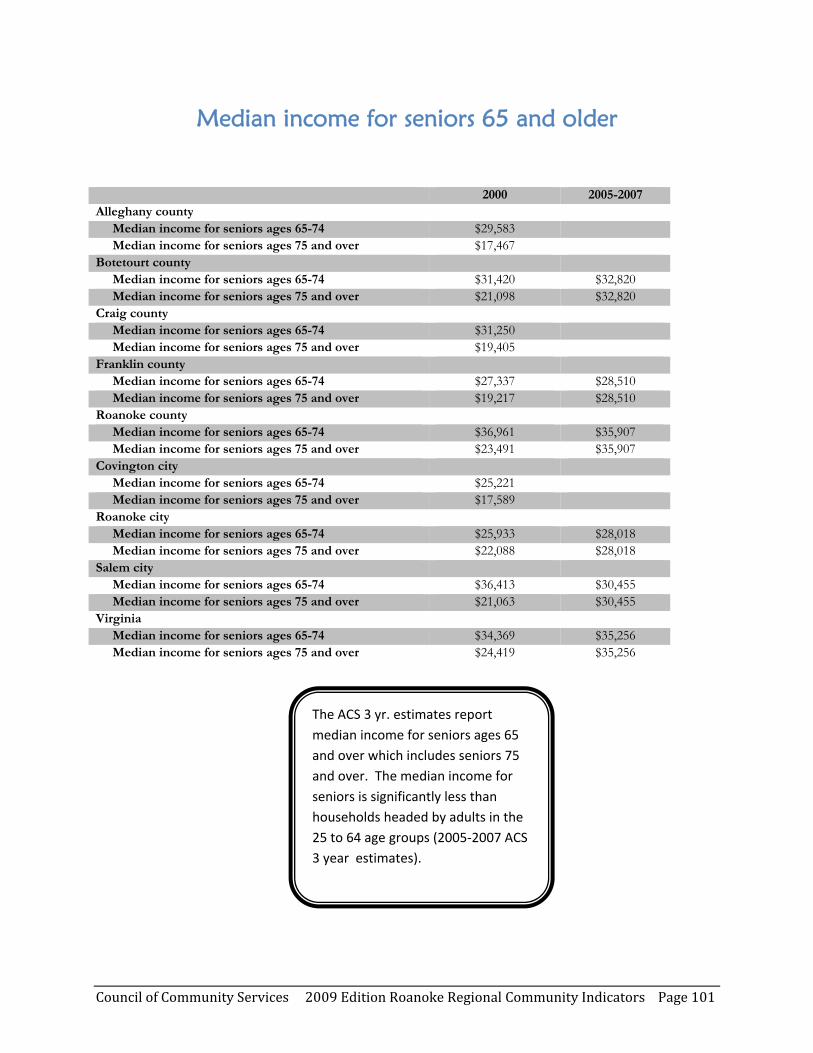
Council of Community Services 2009 Edition Roanoke Regional Community Indicators Page 101
Median income for seniors 65 and older
2000 2005-2007 Alleghany county
Median income for seniors ages 65-74 $29,583 Median income for seniors ages 75 and over $17,467
Botetourt county Median income for seniors ages 65-74 $31,420 $32,820 Median income for seniors ages 75 and over $21,098 $32,820
Craig county Median income for seniors ages 65-74 $31,250 Median income for seniors ages 75 and over $19,405
Franklin county Median income for seniors ages 65-74 $27,337 $28,510 Median income for seniors ages 75 and over $19,217 $28,510
Roanoke county Median income for seniors ages 65-74 $36,961 $35,907 Median income for seniors ages 75 and over $23,491 $35,907
Covington city Median income for seniors ages 65-74 $25,221 Median income for seniors ages 75 and over $17,589
Roanoke city Median income for seniors ages 65-74 $25,933 $28,018 Median income for seniors ages 75 and over $22,088 $28,018
Salem city Median income for seniors ages 65-74 $36,413 $30,455 Median income for seniors ages 75 and over $21,063 $30,455
Virginia Median income for seniors ages 65-74 $34,369 $35,256 Median income for seniors ages 75 and over $24,419 $35,256
The ACS 3 yr. estimates report median income for seniors ages 65 and over which includes seniors 75 and over. The median income for seniors is significantly less than households headed by adults in the 25 to 64 age groups (2005‐2007 ACS 3 year estimates).

Council of Community Services 2009 Edition Roanoke Regional Community Indicators Page 102
Median Family Income
Median family Income 1990 2000 2005-2007 Alleghany county $31,145 $45,843 Botetourt county $37,116 $55,125 $68,085 Craig county $28,530 $41,750 Franklin county $29,958 $45,163 $50,647 Roanoke county $42,223 $56,450 $71,504 Covington city $26,091 $36,640 Roanoke city $28,203 $37,826 $46,737 Salem city $35,619 $47,174 $64,363 Virginia $38,213 $54,169 $69,609
The median family income reported in the ACS 3 yr. estimates indicate a 23.5% increase in Botetourt over 2000, a 12.1% increase in Franklin county, 27% increase in Roanoke county, 24% increase in Roanoke city, and a 36% increase in Salem. The state median income has increased by 28.5% over 2000.
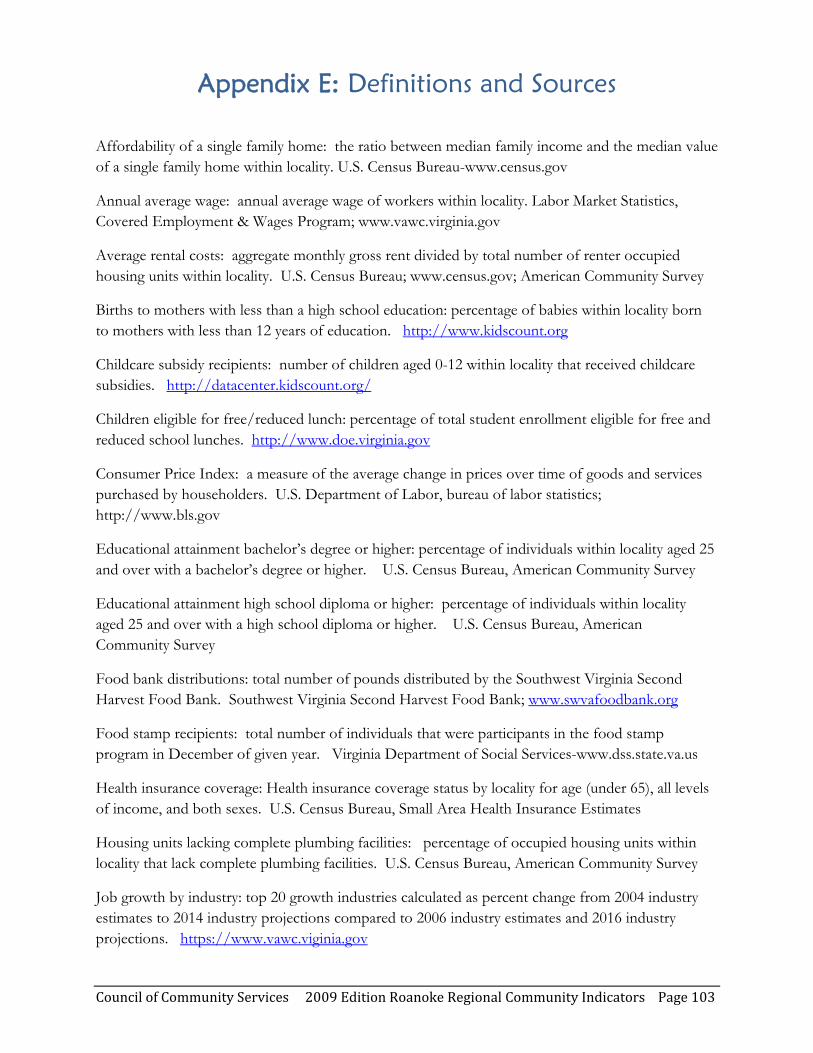
Council of Community Services 2009 Edition Roanoke Regional Community Indicators Page 103
Appendix E: Definitions and Sources
Affordability of a single family home: the ratio between median family income and the median value of a single family home within locality. U.S. Census Bureau-www.census.gov
Annual average wage: annual average wage of workers within locality. Labor Market Statistics, Covered Employment & Wages Program; www.vawc.virginia.gov
Average rental costs: aggregate monthly gross rent divided by total number of renter occupied housing units within locality. U.S. Census Bureau; www.census.gov; American Community Survey
Births to mothers with less than a high school education: percentage of babies within locality born to mothers with less than 12 years of education. http://www.kidscount.org
Childcare subsidy recipients: number of children aged 0-12 within locality that received childcare subsidies. http://datacenter.kidscount.org/
Children eligible for free/reduced lunch: percentage of total student enrollment eligible for free and reduced school lunches. http://www.doe.virginia.gov
Consumer Price Index: a measure of the average change in prices over time of goods and services purchased by householders. U.S. Department of Labor, bureau of labor statistics; http://www.bls.gov
Educational attainment bachelor’s degree or higher: percentage of individuals within locality aged 25 and over with a bachelor’s degree or higher. U.S. Census Bureau, American Community Survey
Educational attainment high school diploma or higher: percentage of individuals within locality aged 25 and over with a high school diploma or higher. U.S. Census Bureau, American Community Survey
Food bank distributions: total number of pounds distributed by the Southwest Virginia Second Harvest Food Bank. Southwest Virginia Second Harvest Food Bank; www.swvafoodbank.org
Food stamp recipients: total number of individuals that were participants in the food stamp program in December of given year. Virginia Department of Social Services-www.dss.state.va.us
Health insurance coverage: Health insurance coverage status by locality for age (under 65), all levels of income, and both sexes. U.S. Census Bureau, Small Area Health Insurance Estimates
Housing units lacking complete plumbing facilities: percentage of occupied housing units within locality that lack complete plumbing facilities. U.S. Census Bureau, American Community Survey
Job growth by industry: top 20 growth industries calculated as percent change from 2004 industry estimates to 2014 industry projections compared to 2006 industry estimates and 2016 industry projections. https://www.vawc.viginia.gov
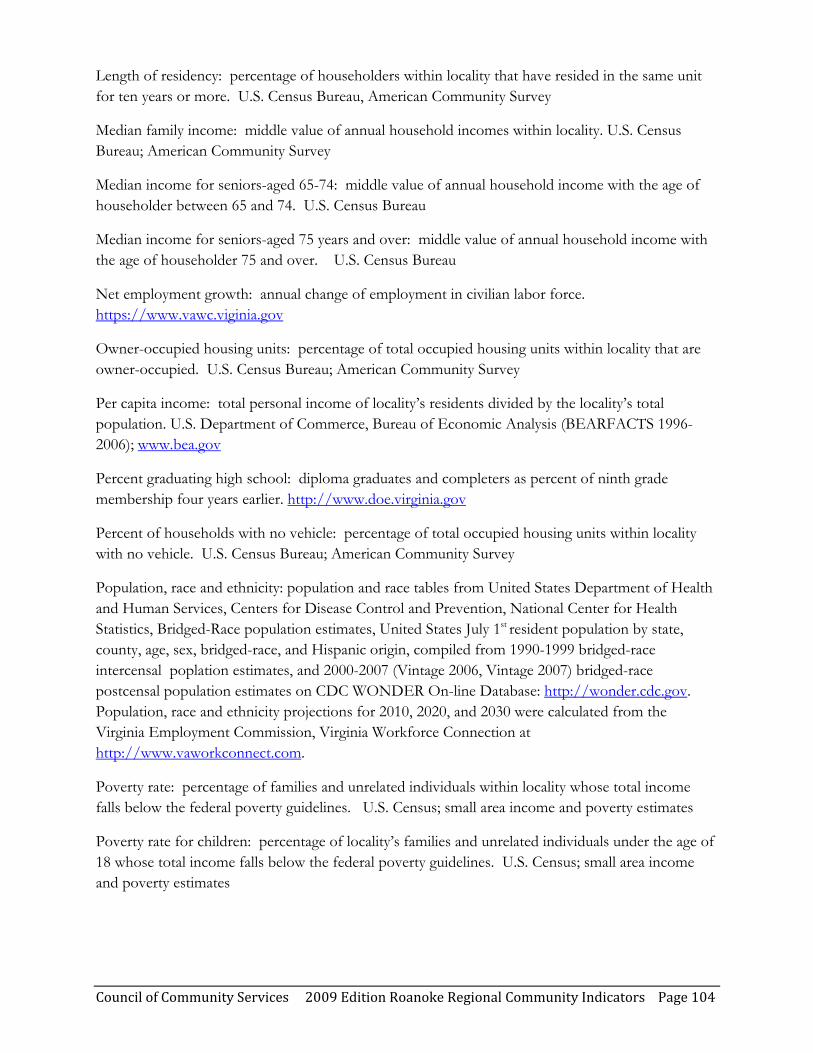
Council of Community Services 2009 Edition Roanoke Regional Community Indicators Page 104
Length of residency: percentage of householders within locality that have resided in the same unit for ten years or more. U.S. Census Bureau, American Community Survey
Median family income: middle value of annual household incomes within locality. U.S. Census Bureau; American Community Survey
Median income for seniors-aged 65-74: middle value of annual household income with the age of householder between 65 and 74. U.S. Census Bureau
Median income for seniors-aged 75 years and over: middle value of annual household income with the age of householder 75 and over. U.S. Census Bureau
Net employment growth: annual change of employment in civilian labor force. https://www.vawc.viginia.gov
Owner-occupied housing units: percentage of total occupied housing units within locality that are owner-occupied. U.S. Census Bureau; American Community Survey
Per capita income: total personal income of locality’s residents divided by the locality’s total population. U.S. Department of Commerce, Bureau of Economic Analysis (BEARFACTS 1996-2006); www.bea.gov
Percent graduating high school: diploma graduates and completers as percent of ninth grade membership four years earlier. http://www.doe.virginia.gov
Percent of households with no vehicle: percentage of total occupied housing units within locality with no vehicle. U.S. Census Bureau; American Community Survey
Population, race and ethnicity: population and race tables from United States Department of Health and Human Services, Centers for Disease Control and Prevention, National Center for Health Statistics, Bridged-Race population estimates, United States July 1st resident population by state, county, age, sex, bridged-race, and Hispanic origin, compiled from 1990-1999 bridged-race intercensal poplation estimates, and 2000-2007 (Vintage 2006, Vintage 2007) bridged-race postcensal population estimates on CDC WONDER On-line Database: http://wonder.cdc.gov. Population, race and ethnicity projections for 2010, 2020, and 2030 were calculated from the Virginia Employment Commission, Virginia Workforce Connection at http://www.vaworkconnect.com.
Poverty rate: percentage of families and unrelated individuals within locality whose total income falls below the federal poverty guidelines. U.S. Census; small area income and poverty estimates
Poverty rate for children: percentage of locality’s families and unrelated individuals under the age of 18 whose total income falls below the federal poverty guidelines. U.S. Census; small area income and poverty estimates
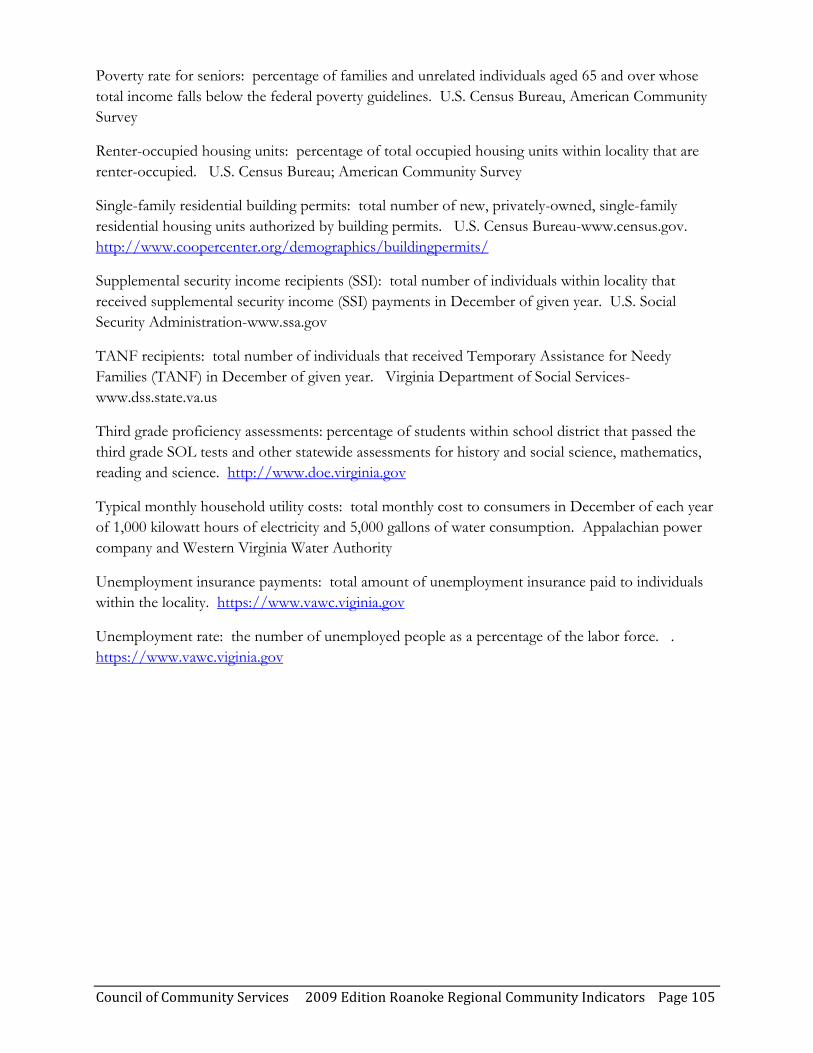
Council of Community Services 2009 Edition Roanoke Regional Community Indicators Page 105
Poverty rate for seniors: percentage of families and unrelated individuals aged 65 and over whose total income falls below the federal poverty guidelines. U.S. Census Bureau, American Community Survey
Renter-occupied housing units: percentage of total occupied housing units within locality that are renter-occupied. U.S. Census Bureau; American Community Survey
Single-family residential building permits: total number of new, privately-owned, single-family residential housing units authorized by building permits. U.S. Census Bureau-www.census.gov. http://www.coopercenter.org/demographics/buildingpermits/
Supplemental security income recipients (SSI): total number of individuals within locality that received supplemental security income (SSI) payments in December of given year. U.S. Social Security Administration-www.ssa.gov
TANF recipients: total number of individuals that received Temporary Assistance for Needy Families (TANF) in December of given year. Virginia Department of Social Services-www.dss.state.va.us
Third grade proficiency assessments: percentage of students within school district that passed the third grade SOL tests and other statewide assessments for history and social science, mathematics, reading and science. http://www.doe.virginia.gov
Typical monthly household utility costs: total monthly cost to consumers in December of each year of 1,000 kilowatt hours of electricity and 5,000 gallons of water consumption. Appalachian power company and Western Virginia Water Authority
Unemployment insurance payments: total amount of unemployment insurance paid to individuals within the locality. https://www.vawc.viginia.gov
Unemployment rate: the number of unemployed people as a percentage of the labor force. . https://www.vawc.viginia.gov
Council of Community Services 2009 Edition Roanoke Regional Community Indicators Page 106
Conclusion • Regional Trends
• Data Implications
• Summary

Council of Community Services 2009 Edition Roanoke Regional Community Indicators Page 107
6Regional Trends7
6 N/A’s indicate data measures for 2009 report were from ACS 3 yr. estimates and Regional calculations and trends could not be determined. 7 For clarification, positive and negative trend classifications do not necessarily have a direct correlation to upward or downward trend movement. For instance, a downward trend movement for the region’s poverty rate would result in a positive trend classification for this indicator as this is a reflection of a decrease in the percentage of individuals living below the federal poverty threshold
Indicator 2007 Positive Trend
2008 Positive Trend
2008 Negative Trend
2008 No Change
Percent Graduating High School
3rd Grade Proficiency – Reading
3rd Grade Proficiency - Mathematics
3rd Grade Proficiency – Science
3rd Grade Proficiency – History/Social Science
Individuals 25+ w/H.S. Diploma or Higher n/a
Individuals 25+ w/Bachelor’s Degree or Higher n/a
Unemployment Rate
Unemployment Benefit Claims
Net Employment Growth
Per Capita Income
Consumer Price Index
Number of Chapter 7 and 13 Bankruptcies n/a
Annual Average Wage
Average Rental Costs n/a
Housing Units Lacking Plumbing n/a
Length of Residency n/a
Owner-Occupied Housing Units n/a
Renter-Occupied Housing Units n/a
Residential Building Permits
Free/Reduced Lunches
SSI Recipients
TANF Recipients
Food Stamp Recipients
Poverty Rate
Poverty Rate - Seniors n/a
Childcare Subsidy Recipients
Poverty Rate - Children
Percent of Households with No Vehicle n/a
Housing Units Lacking Plumbing n/a
No Health Insurance n/a
Food Bank Distributions (lbs.)
Council of Community Services 2009 Edition Roanoke Regional Community Indicators Page 108
Because of changes in the way data is reported, it is not possible to compare trends for all indicators. As noted in the footnote on page 107, this 2009 report uses ACS 3 year estimates making trend comparison with 2008 data impossible for twelve indicators. For those indicators where trends were possible; comparing performance this year over last shows a decline in the overall performance in the Region. In 2007 there were positive trends in 20 (63%) of the 32 indicators listed on the chart above. In 2008 that positive trend number drops to 4 (20%) of the 20 indicators with Regional trends. Where it was possible to report that the region was generally moving in the right direction one year ago, new data and trends suggest that the region lost ground and is beginning to show a decline in performance against these selected indicators.
Data Implications
• Job Related: Key job related indicators such as unemployment rates, unemployment benefits claims and net employment growth all fell from the positive to the negative trend column on the chart above over the past year.
• Income and Asset Related: While trends were still positive in the income and asset related indicators, the region continues to lag behind the state in annual average wage (-$10,868), and per capita income (-$7564.00). At the same time the consumer price index increased for this region of the state by 4.5%.
• Public Assistance: The growing need of families for assistance can clearly be seen in the 9.4
increase in TANF recipients over the past two year. Children eligible for free and reduced lunch in
the region jumped to a high of 37.4% in 2008. Food Stamps also showed big increases moving from
9.03% of the region in 2007 to 21.63% in 2008.
• Education Related: Another key indicator showing a reversal from a positive trend to a negative is percentage graduating high school. In 2007, the percentage graduating high school (77.7%) exceeded that of state (76.8%). One year later in 2008, the region’s performance had fallen to 76.3% compared to an increase to 79.2% at the state level thus placing the region below the performance of the state for the first time since 2006.
Summary
The value of indicators is underscored when viewed as a constellation of factors affecting the well being of the Roanoke Region. When these indicators are viewed as a whole they clearly define the beginning of the severe economic downturn of late 2008 and its effect on the people residing in the region. The region has lost the positive trend of the majority of indicators over the past year. While the 2008 Report contained reasons for optimism, this 2009 Report shows little evidence of specific strengths in the region other than education performance in grades 3, 5 and 8 but even those strengths are dampened by the falling number of high school graduates in the region as compared to increasing numbers at the state level.
This 2009 Edition of the Roanoke Region Community Indicators presents data that are a clarion call for government and people to work together cross jurisdictional boundaries to find innovative solutions to the growing social and economic problems faced by all who reside in our communities.