Embed Size (px)
Citation preview
Rob Cribbie Quantitative Methods Program
Department of Psychology York University
The statistical summarization of the effects from a set of studies investigating the same research question ◦ However, the term ‘meta-analysis’ often also
applies to the entire process of generating a research question, finding studies that investigate the research question, extracting the necessary info from the studies, and combining the results from the related studies
A single study cannot be used to definitively quantify the magnitude of an effect ◦ Results (effects) vary from study to study due to
sampling error, nature of the population, methodological procedures, etc.
Unsystematic or narrative reviews of the
literature are often extremely biased from both the perspective of the methods and the researcher ◦ E.g., the researcher usually has an a priori inclination
regarding the nature of the effects under exploration
Publications ◦ Journals, as well as other researchers, encourage meta-
analyses ◦ Meta-analyses provide a great starting point for
research, as they help contextualize a new study New Research ◦ Meta-analyses can be used as a tool to help researchers
avoid recreating the wheel, or to find promising research areas by investigating past studies
Grant Applications ◦ Meta-analyses are highly regarding in grant
applications, as they frame the proposed research within existing research Some funding agencies now require a meta-analysis of
existing research as part of the grant application
In some instances “systematic review” and “meta-analysis” are used interchangeably, whereas in other instances the term systematic review refers to the procedures used to collect the studies of interest (i.e., those to be combined), and meta-analysis refers to the statistical combination of the effects from these studies ◦ Systematic Review A review of studies addressing a research question
that is conducted according to clearly stated methods
1952: Hans Eysenck concluded that there were no favorable effects of psychotherapy, starting a raging debate 20 years of evaluation research and hundreds of
studies failed to resolve the debate 1978: To prove Eysenck wrong, Gene Glass
statistically aggregated the findings of 375 psychotherapy outcome studies Glass concluded that psychotherapy did indeed
work Glass called his method “meta-analysis”
6
Ideas behind meta-analysis predate Glass’ work by several decades Karl Pearson (1904) Averaged correlations for studies of the effectiveness of
inoculation for typhoid fever R. A. Fisher (1944) We can combine the results of several studies to get an
appreciation for the probability associated with the aggregated data
Dealt primarily with combining p-values The start of the idea of cumulating probability
values, although not specifically focused on effect sizes
7
W. G. Cochran (1953) Discussed a method for averaging means across
independent studies Cochran was responsible for much of the
statistical foundation that modern meta-analysis is built upon
Cochrane Collaboration A group of researchers from around the world that
conduct systematic reviews of health care interventions and diagnostic tests and publish them in the Cochrane Library E.g., https://canada.cochrane.org/
8
Traditional methods of review usually focus on statistical significance testing E.g., the effect was statistically significant in 4 out of 7
studies However, we know that null hypothesis significance
testing (NHST) is highly related to sample size, focuses on dichotomous decisions, etc.
Meta-analysis focuses on the direction and
magnitude of the effects across studies, not statistical significance Direction and magnitude are represented by the effect
size
9
Studies are empirical, not theoretical Results are quantitative, not
qualitative Studies examine the same research
question Results can be quantified in a
comparable statistical form i.e., effect size
10
Central tendency research Focus in on means Pre-post contrasts Group contrasts
Experimentally created groups E.g., change in perfectionism for CBT vs control
Naturally occurring groups E.g., perfectionism in anorexia nervosa vs controls
Associations among variables Focus is on correlations/regression coefficients E.g., correlation between perfectionism and depression
11

Central tendency research Focus in on means Pre-post contrasts Group contrasts
Experimentally created groups E.g., change in perfectionism for CBT vs control
Naturally occurring groups E.g., perfectionism in anorexia nervosa vs controls
Associations among variables Focus is on correlations/regression coefficients E.g., correlation between perfectionism and depression
12
Frequency research Focus in on odds ratios Group contrasts
E.g., clinically significant treatment response (Y/N) for CBT vs control
Be careful when using odds ratios
13
Unanswerable Research Questions (vague) ◦ What is the best strategy to reduce maladaptive
perfectionism? ◦ How do we eliminate racism?
Answerable Research Questions (specific) ◦ Are online interventions effective in reducing
maladaptive perfectionism? E.g., maladaptive perfectionism from pre-intervention
to post-intervention ◦ Are males more racist than females?
Should be as inclusive as possible ◦ Need to find ALL studies ◦ Published studies are easy to find … UNPUBLISHED
STUDIES ARE NOT The inclusion of unpublished studies helps to
minimize the effects of publication bias
Apples and Oranges ◦ A priori inclusion and exclusion criteria must be
laid out It is imperative that the studies being meta-analyzed
address the same research question
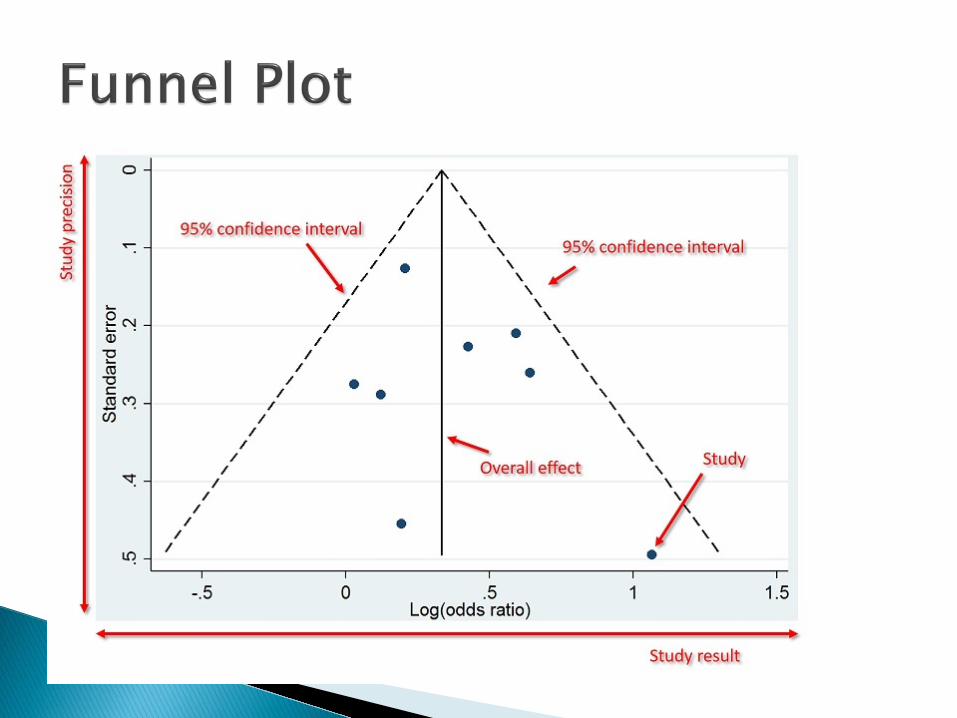
Funnel plot ◦ A plot of the size of the effect of a study against the
precision of a study ◦ Symmetrical funnel plots provide evidence of a lack
of publication bias, where asymmetrical funnel plots highlight that publication bias might be present E.g., if effects with low precision seem to all have
larger effects then publication bias is likely
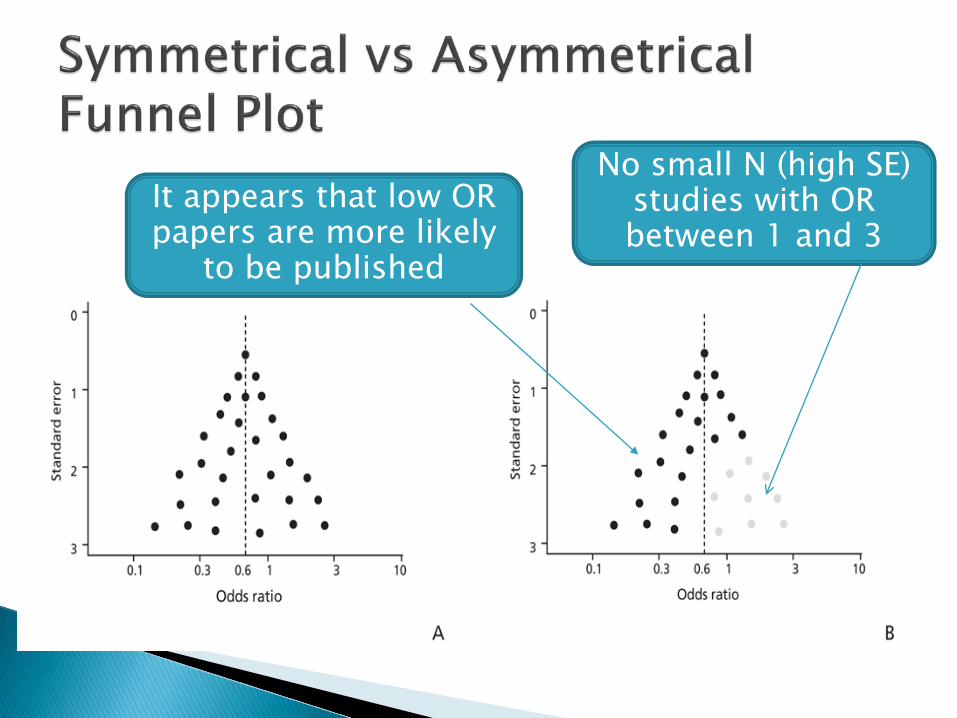
No small N (high SE) studies with OR between 1 and 3
It appears that low OR papers are more likely
to be published

Computerized bibliographic databases ◦ Google Scholar, Psycinfo, Medline, ERIC
Authors working in the research domain ◦ Personal websites (e.g., Institutional Websites,
Researchgate, Open Science Framework, PsyArXiv)
Conference programs
Dissertations
Reference lists from relevant articles
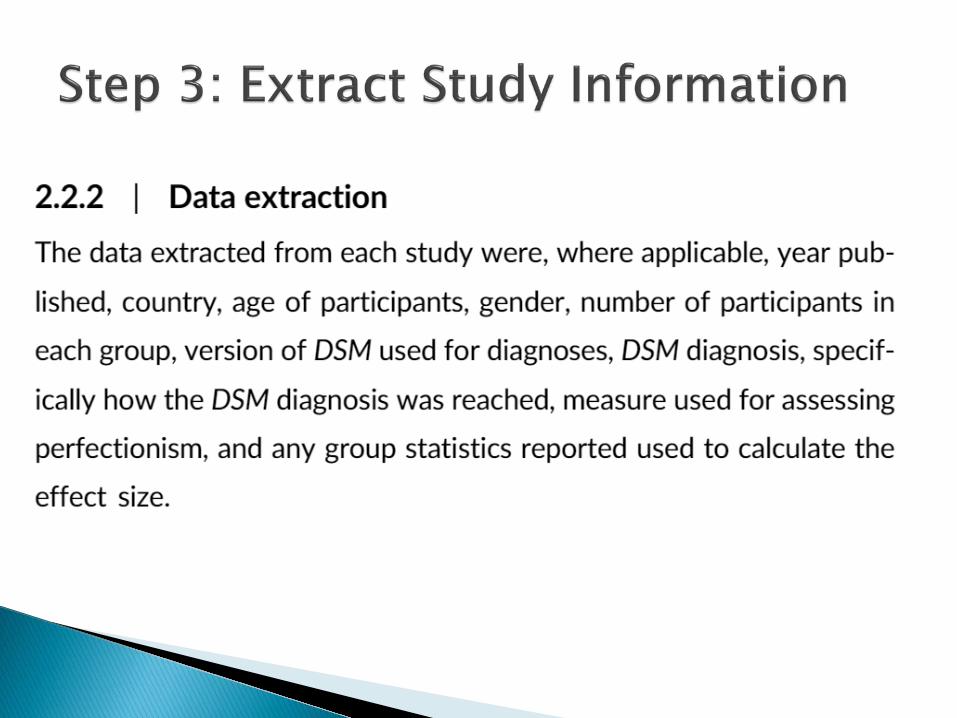
Think about these long and hard before starting data collection … it sucks to have to go back and recollect data ◦ Publication details Or specific location details for unpublished studies
◦ Study design ◦ Population details (N, characteristics) ◦ Intervention/Design details ◦ Operational Definitions of Variables ◦ Demographics and other potential moderators ◦ Outcomes E.g., Means, SDs, correlations, regression coefficients,
variability of coefficients, sample sizes
Lower quality studies can have biased outcome results
◦ E.g., Allocation to Treatment/Control Inadequate allocation concealment (e.g., investigators
playing a role in allocation) exaggerated treatment effects by about 35% (Moher, 1998; Schulz, 1995)
◦ E.g., Blinding Lack of blinding of subjects exaggerated treatment
effects by 17% (Schulz, 1995), or increased the effect size by about a half a SD (Hróbjartsson et al., 2014)
◦ Selection bias ◦ Allocation bias ◦ Confounds ◦ Blinding ◦ Data collection methods ◦ Withdrawals and drop-outs ◦ Statistical analysis ◦ Intervention integrity
Summary: Lots of ways that bias can be introduced into research!
The most common way to assess and report study quality has been using a composite, numerical scoring instrument ◦ Many different quality assessment instruments are
available, with most designed for randomized clinical trials
E.g., Jadad Score for Experiments (0-3) ◦ Was the study described as randomized? ◦ Was the study described as double-blind? ◦ Was there a description of withdrawals and
dropouts?
Include or exclude low quality studies? The findings of all studies are potentially in error
(methodological quality is a continuum, not a dichotomy) Being too restrictive may limit ability to generalize Being too inclusive may weaken the confidence that can be
placed in the findings Methodological quality is often subjective You must strike a balance that is appropriate to your
research question When including low quality studies you can
weight effects by study quality or explore study quality as a moderator
Replications can range from “conceptual” replications to “pure” or “direct” replications ◦ Direct replications are the repetition of an experimental
procedure to as exact a degree as possible, whereas a conceptual replication is the use of different methods/procedures to repeat the test of a hypothesis
You must be able to argue that the collection of studies you are meta-analyzing examine the same relationship
The closer to pure replications your collection of studies, the easier it is to argue comparability of the effect from each study
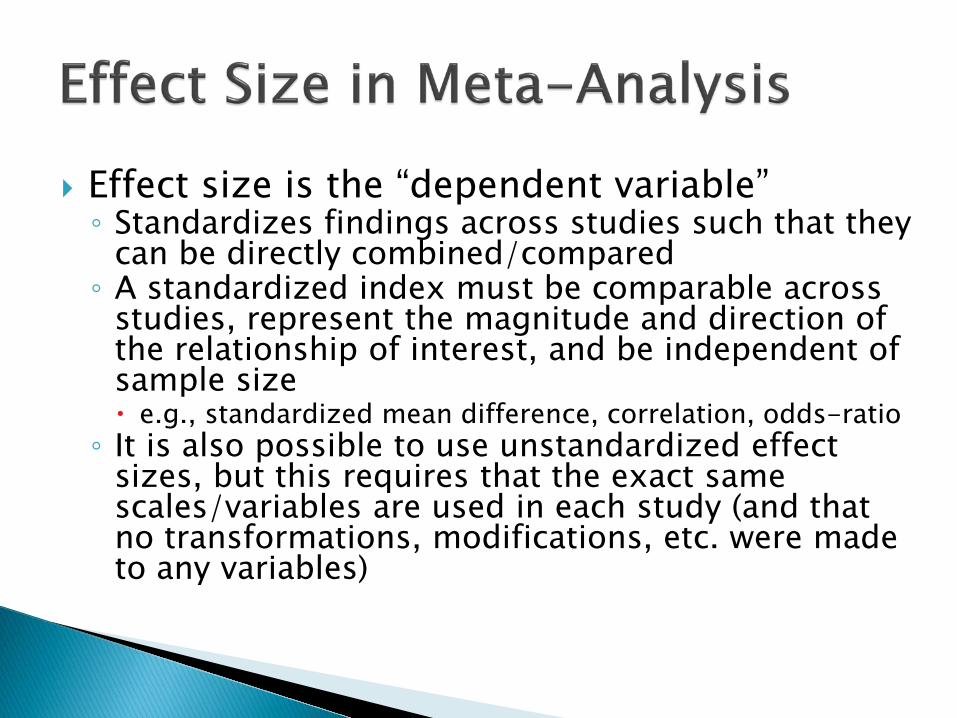
Effect size is the “dependent variable” ◦ Standardizes findings across studies such that they
can be directly combined/compared ◦ A standardized index must be comparable across
studies, represent the magnitude and direction of the relationship of interest, and be independent of sample size e.g., standardized mean difference, correlation, odds-ratio ◦ It is also possible to use unstandardized effect
sizes, but this requires that the exact same scales/variables are used in each study (and that no transformations, modifications, etc. were made to any variables)
Note that in some testing situations it might be tricky to obtain a proper effect size estimate ◦ Take, for example, a study that looks at the
difference between boys and girls in vocabulary development over 6 months from 18 months to 24 months using a latent growth model
Typical methods that convert t/z statistics to d will be incorrect for repeated measures studies, and corrections need to be applied in order to minimize bias
A visual representation of the effect sizes (and confidence intervals for the effect sizes) of the multiple studies included in a meta-analysis ◦ All effects must be measured in the same metric, e.g.,
correlation ◦ It is often straightforward to transform from one effect
size to another The area of the effect size icons (usually squares)
indicates the “weight” of the study to the combined effect ◦ E.g., larger N studies have a higher weight
The plot also shows the effect size (and confidence interval for the effect size) of the combined effect across studies
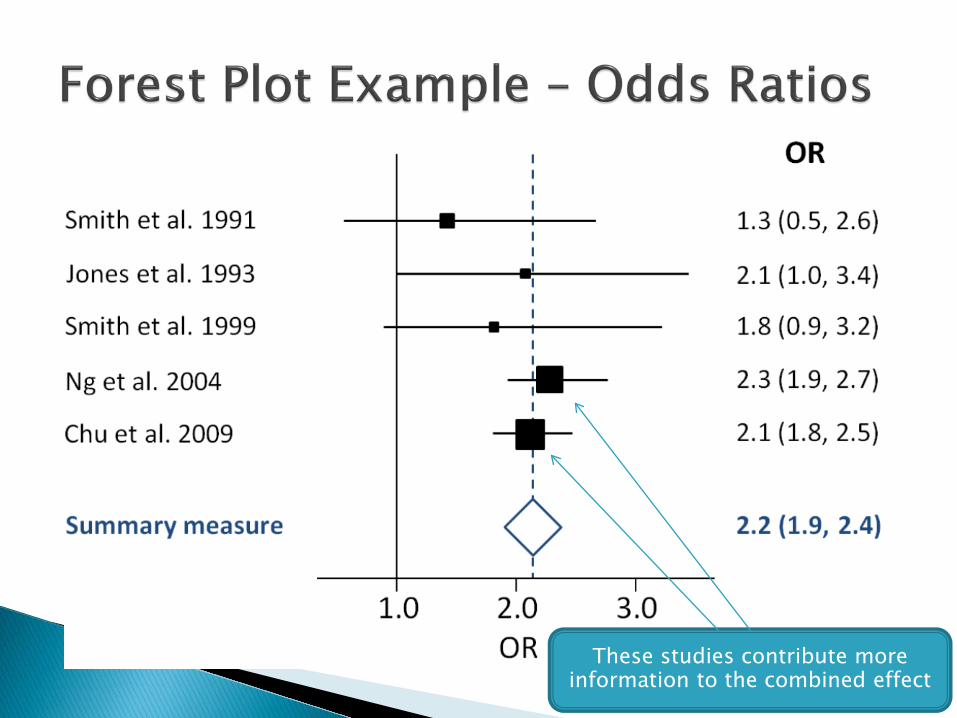
These studies contribute more information to the combined effect
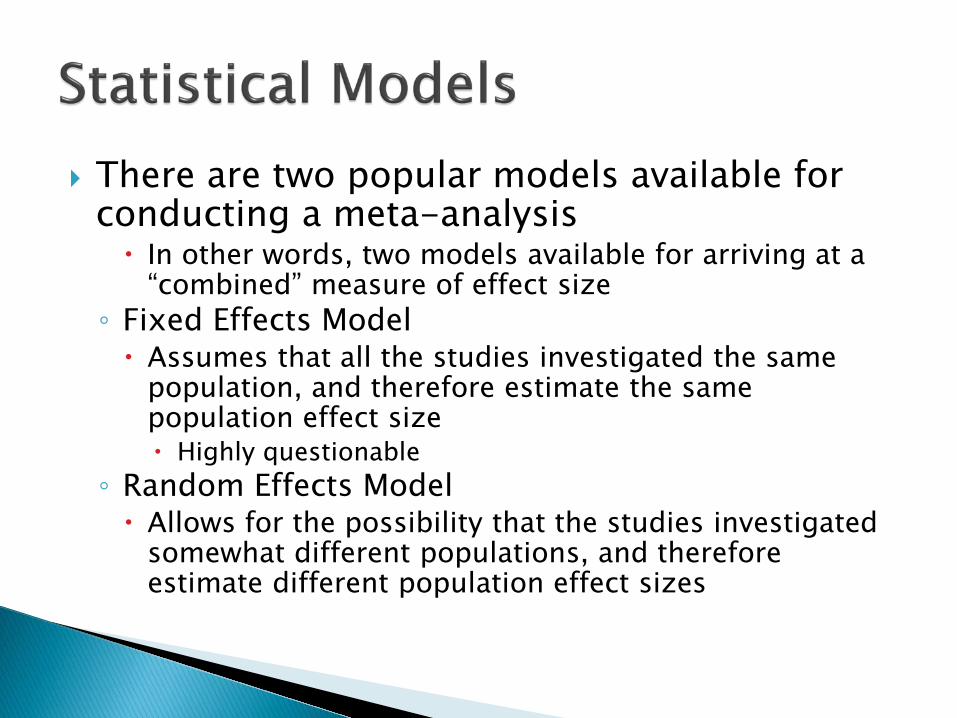
There are two popular models available for conducting a meta-analysis In other words, two models available for arriving at a
“combined” measure of effect size ◦ Fixed Effects Model Assumes that all the studies investigated the same
population, and therefore estimate the same population effect size Highly questionable
◦ Random Effects Model Allows for the possibility that the studies investigated
somewhat different populations, and therefore estimate different population effect sizes
It is difficult to imagine a setting in which multiple studies conducted in different locations, with different samples, and with potentially different measures are all studying the same population (and thus after a single population effect size)
The random effects model is more realistic and provides a basis for understanding the heterogeneity of effect sizes ◦ Further, the models give the same answer if there is only
a single population, so it is hard to find a reason for a researcher to prefer a fixed effects model
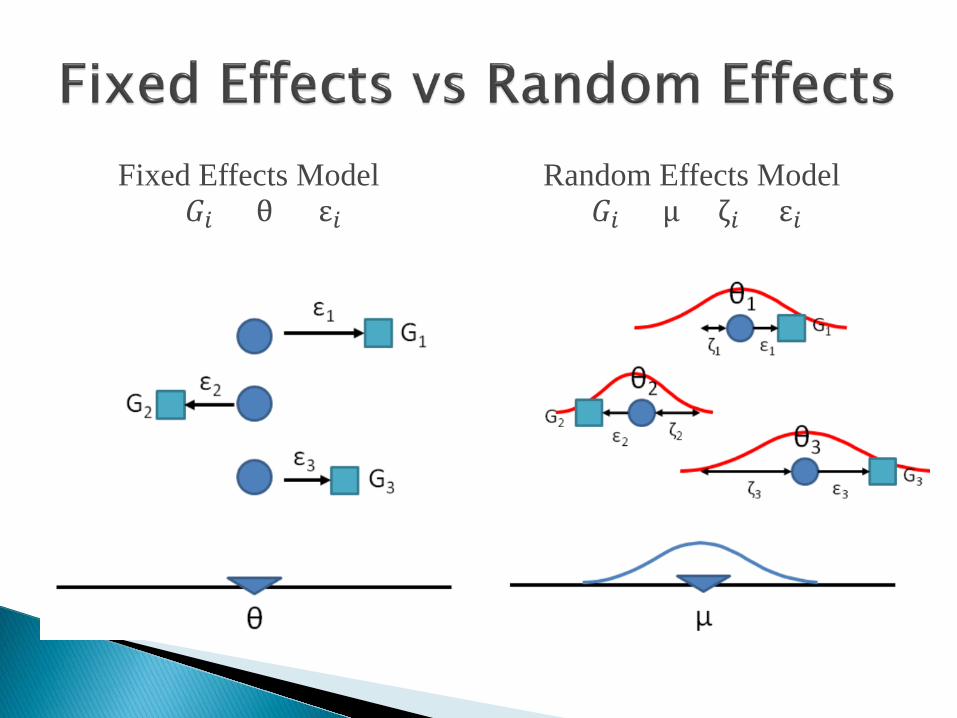
Fixed Effects Model 𝐺𝐺𝑖𝑖 = θ + ε𝑖𝑖
Random Effects Model 𝐺𝐺𝑖𝑖 = µ + ζ𝑖𝑖 + ε𝑖𝑖
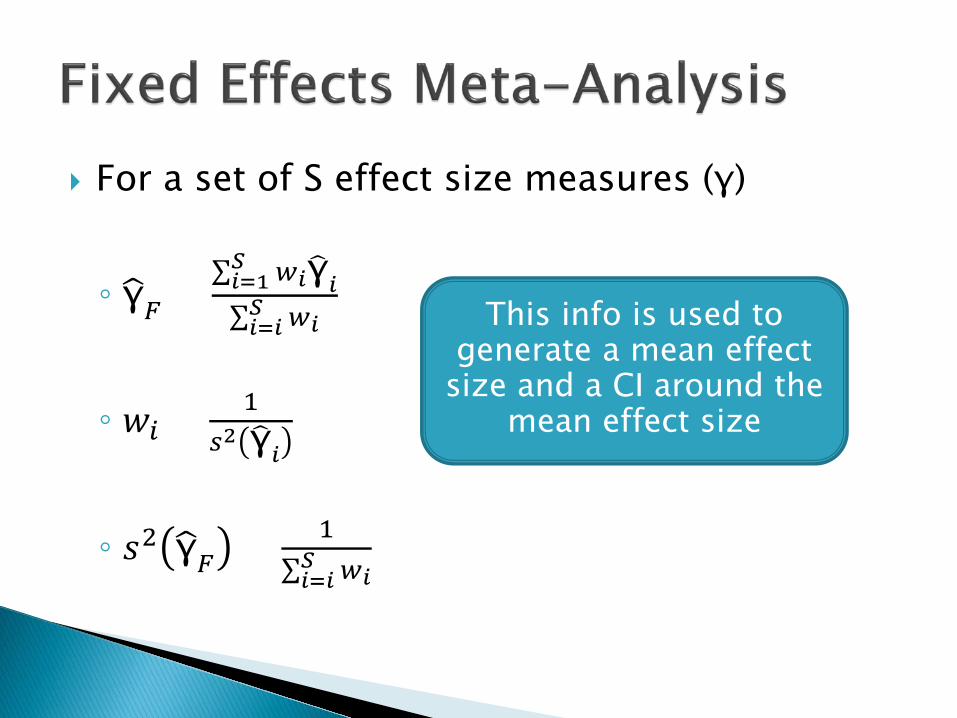
For a set of S effect size measures (γ)
◦ γ�𝐹𝐹 =∑ 𝑤𝑤𝑖𝑖γ�𝑖𝑖𝑆𝑆𝑖𝑖=1∑ 𝑤𝑤𝑖𝑖𝑆𝑆𝑖𝑖=𝑖𝑖
◦ 𝑤𝑤𝑖𝑖 = 1
𝑠𝑠2 γ�𝑖𝑖
◦ 𝑠𝑠2 γ�𝐹𝐹 = 1
∑ 𝑤𝑤𝑖𝑖𝑆𝑆𝑖𝑖=𝑖𝑖
This info is used to generate a mean effect
size and a CI around the mean effect size
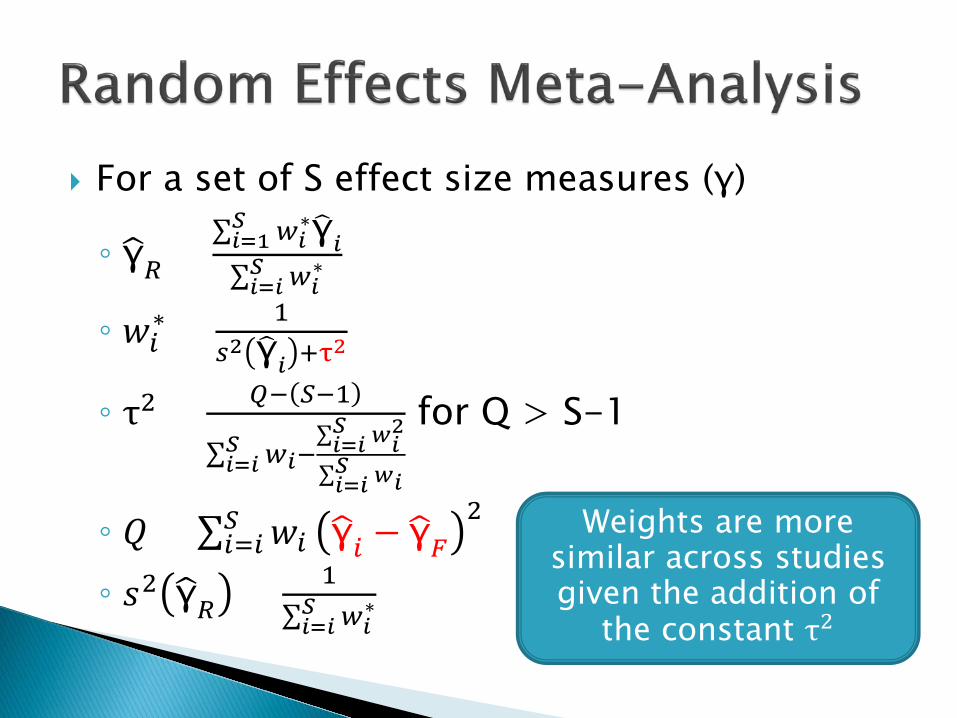
For a set of S effect size measures (γ)
◦ γ�𝑅𝑅 =∑ 𝑤𝑤𝑖𝑖
∗γ�𝑖𝑖𝑆𝑆𝑖𝑖=1∑ 𝑤𝑤𝑖𝑖
∗𝑆𝑆𝑖𝑖=𝑖𝑖
◦ 𝑤𝑤𝑖𝑖∗ = 1𝑠𝑠2 γ�𝑖𝑖 +τ2
◦ τ2 = 𝑄𝑄− 𝑆𝑆−1
∑ 𝑤𝑤𝑖𝑖𝑆𝑆𝑖𝑖=𝑖𝑖 −
∑ 𝑤𝑤𝑖𝑖2𝑆𝑆
𝑖𝑖=𝑖𝑖∑ 𝑤𝑤𝑖𝑖𝑆𝑆𝑖𝑖=𝑖𝑖
for Q > S-1
◦ 𝑄𝑄 = ∑ 𝑤𝑤𝑖𝑖𝑆𝑆𝑖𝑖=𝑖𝑖 γ�𝑖𝑖 − γ�𝐹𝐹
2 ◦ 𝑠𝑠2 γ�𝑅𝑅 = 1
∑ 𝑤𝑤𝑖𝑖∗𝑆𝑆
𝑖𝑖=𝑖𝑖
Weights are more similar across studies given the addition of
the constant τ2
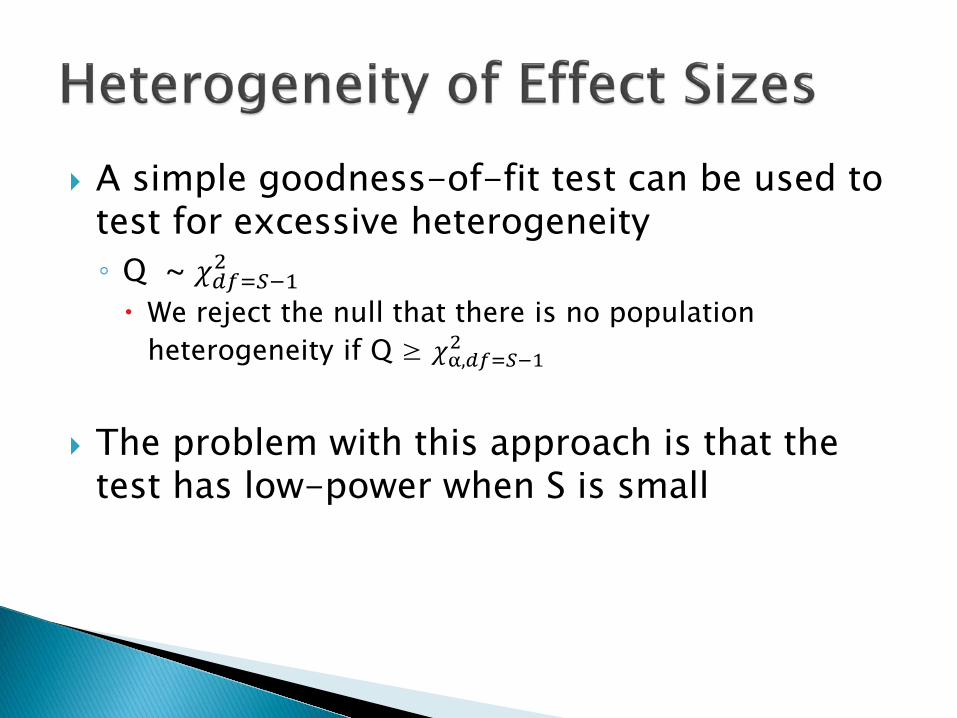
A simple goodness-of-fit test can be used to test for excessive heterogeneity ◦ Q ~ 𝜒𝜒𝑑𝑑𝑑𝑑=𝑆𝑆−12 We reject the null that there is no population
heterogeneity if Q ≥ 𝜒𝜒α,𝑑𝑑𝑑𝑑=𝑆𝑆−12
The problem with this approach is that the
test has low-power when S is small
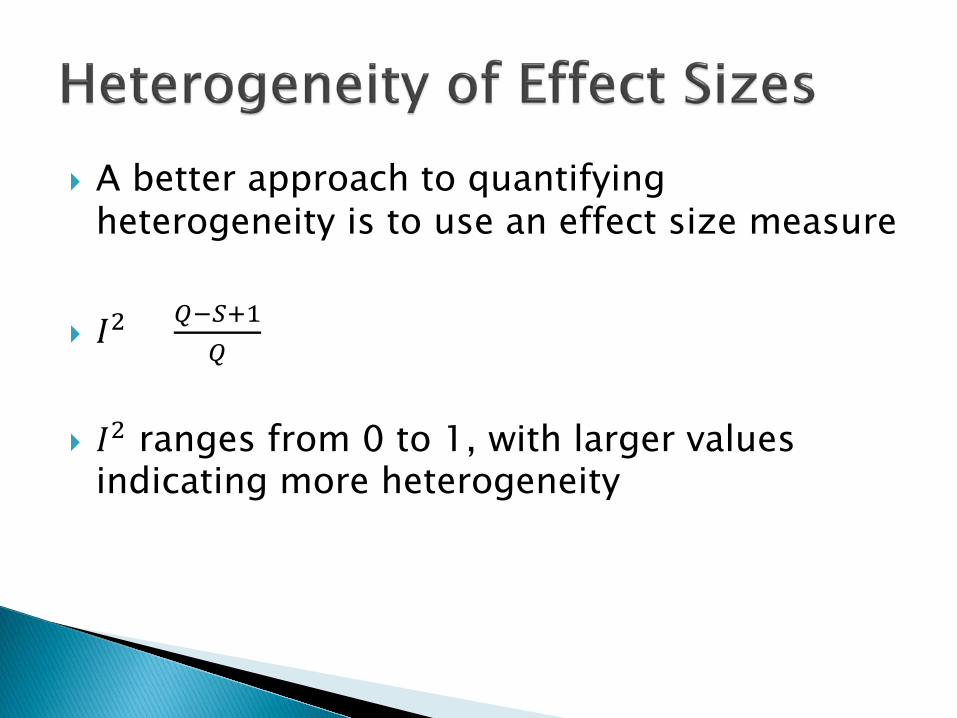
A better approach to quantifying heterogeneity is to use an effect size measure
𝐼𝐼2 = 𝑄𝑄−𝑆𝑆+1𝑄𝑄
𝐼𝐼2 ranges from 0 to 1, with larger values indicating more heterogeneity
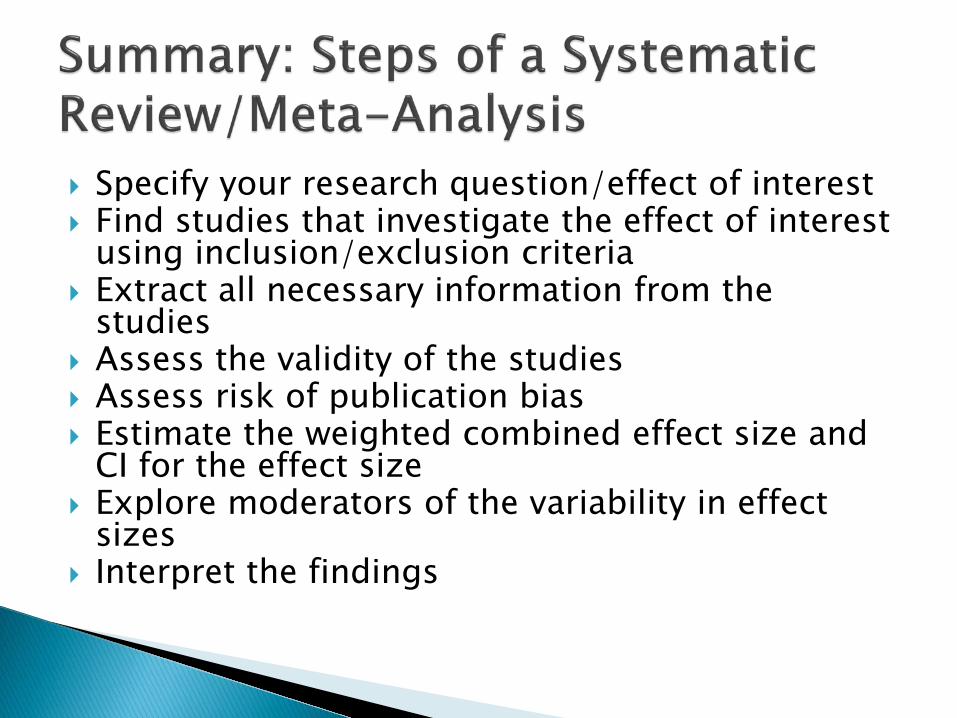
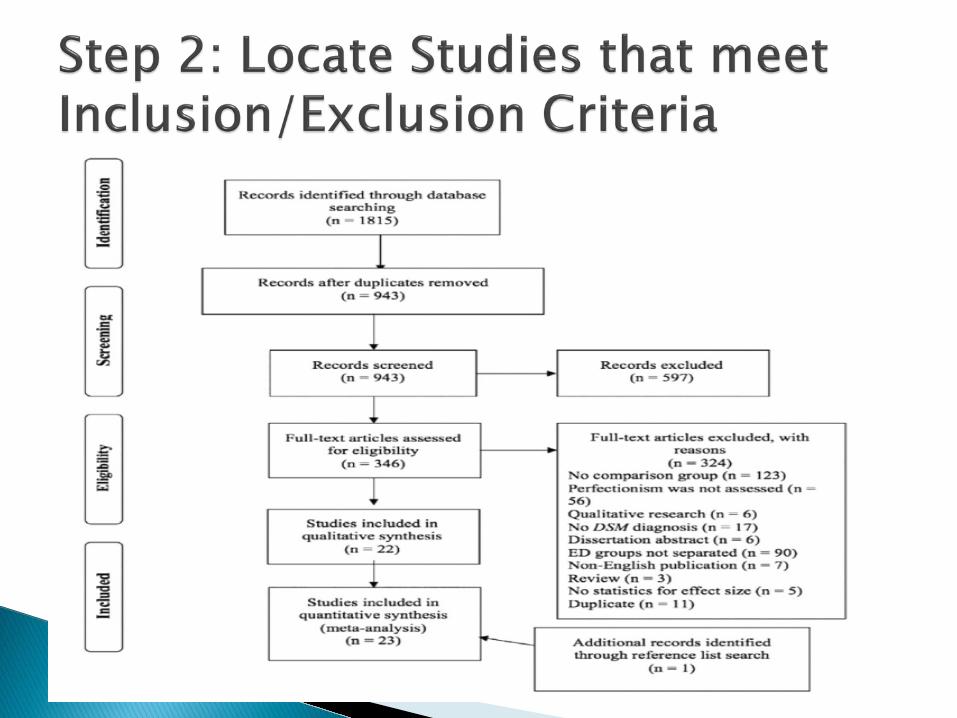
Specify your research question/effect of interest Find studies that investigate the effect of interest
using inclusion/exclusion criteria Extract all necessary information from the
studies Assess the validity of the studies Assess risk of publication bias Estimate the weighted combined effect size and
CI for the effect size Explore moderators of the variability in effect
sizes Interpret the findings

Imposes strict procedures on the process of summing up research findings
Represents findings in a more sophisticated manner than conventional reviews
Capable of finding relationships across studies that are obscured in other approaches or without amalgamation
Capable of detecting moderators of effects Can handle a large numbers of studies, which
would be difficult in a qualitative review
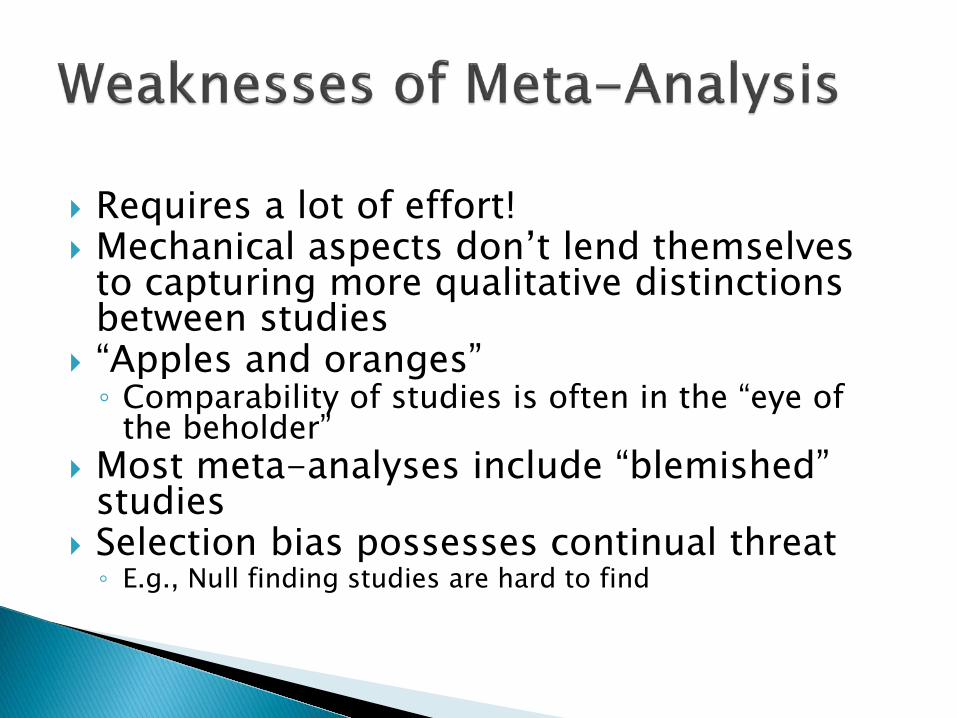
Requires a lot of effort! Mechanical aspects don’t lend themselves
to capturing more qualitative distinctions between studies
“Apples and oranges” ◦ Comparability of studies is often in the “eye of
the beholder” Most meta-analyses include “blemished”
studies Selection bias possesses continual threat ◦ E.g., Null finding studies are hard to find
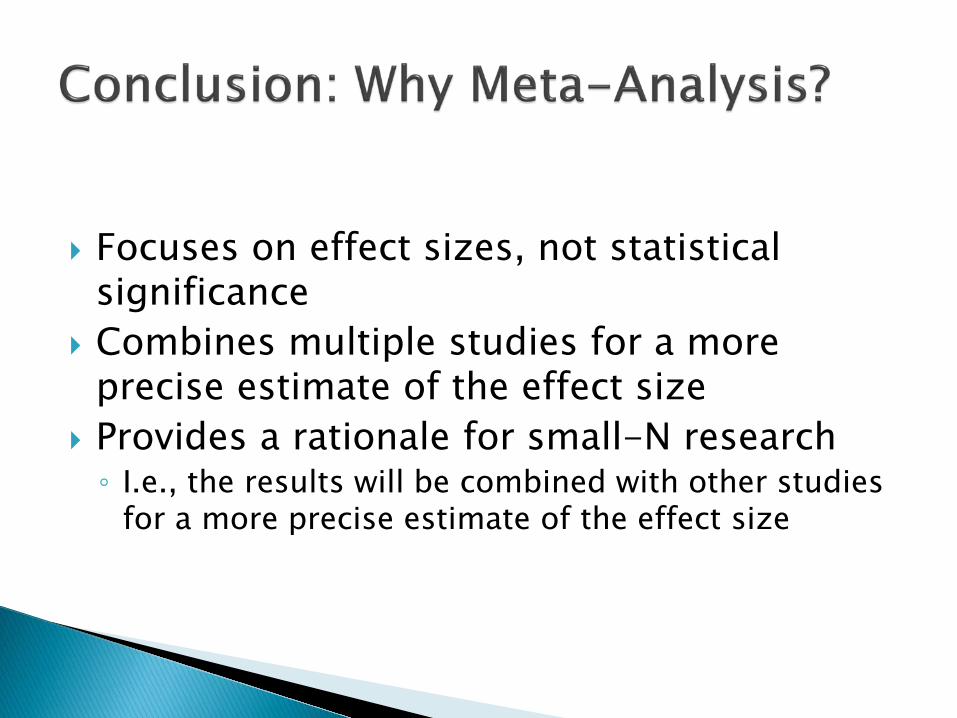
Focuses on effect sizes, not statistical significance
Combines multiple studies for a more precise estimate of the effect size
Provides a rationale for small-N research ◦ I.e., the results will be combined with other studies
for a more precise estimate of the effect size
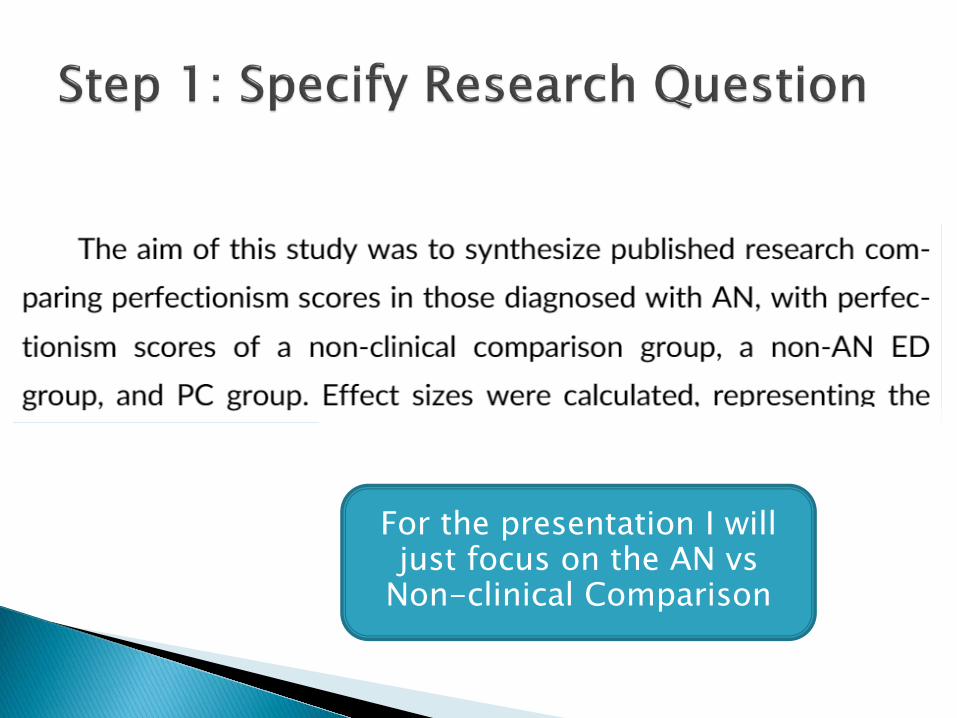
For the presentation I will just focus on the AN vs
Non-clinical Comparison
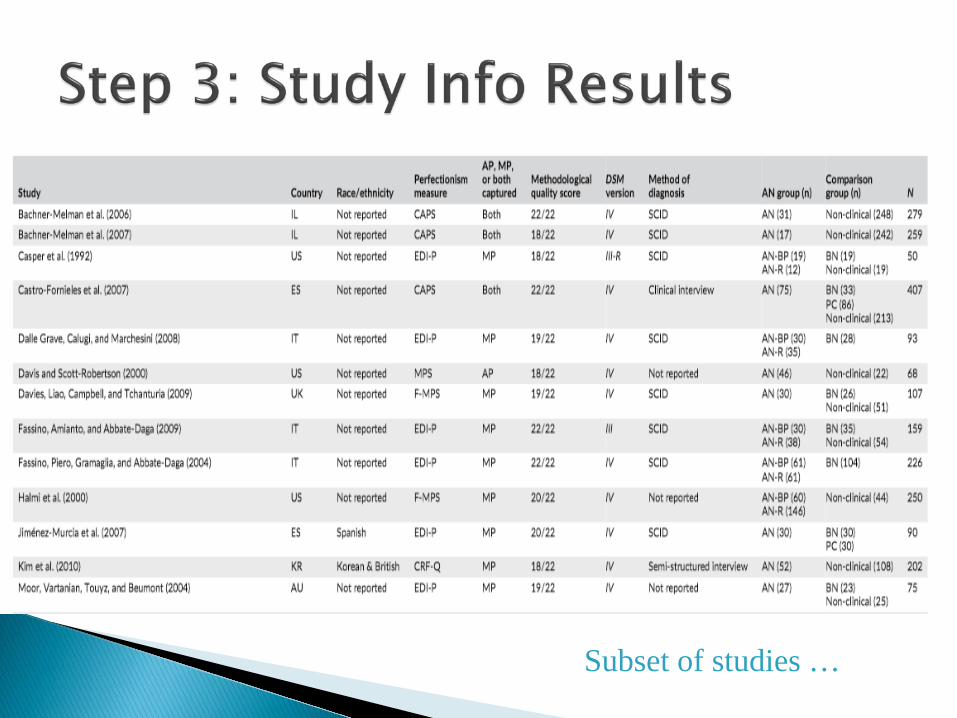
Subset of studies …
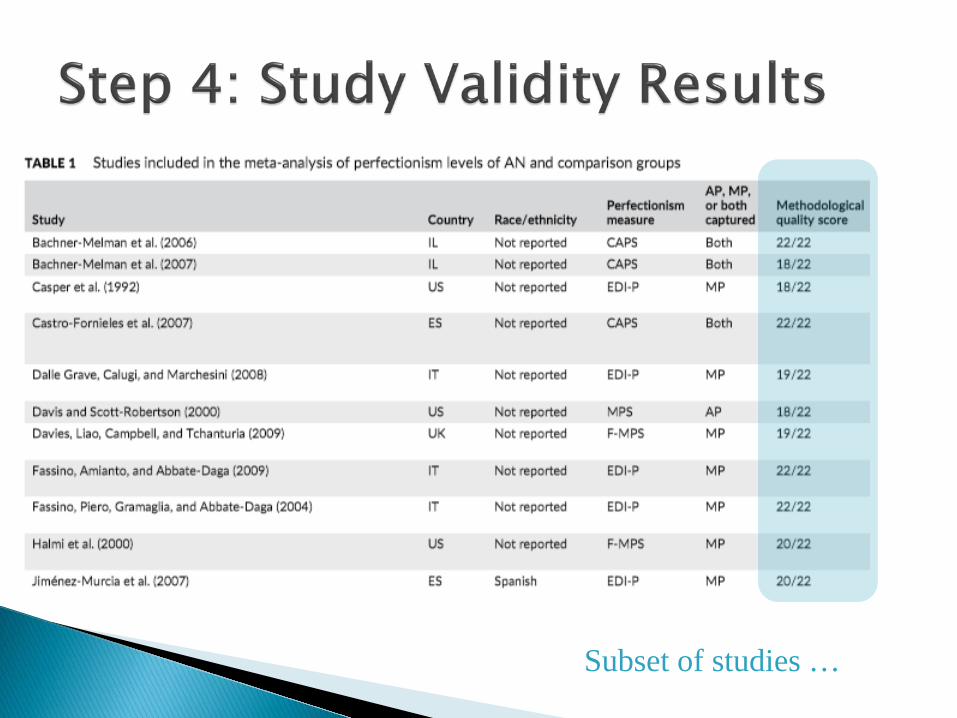
Subset of studies …
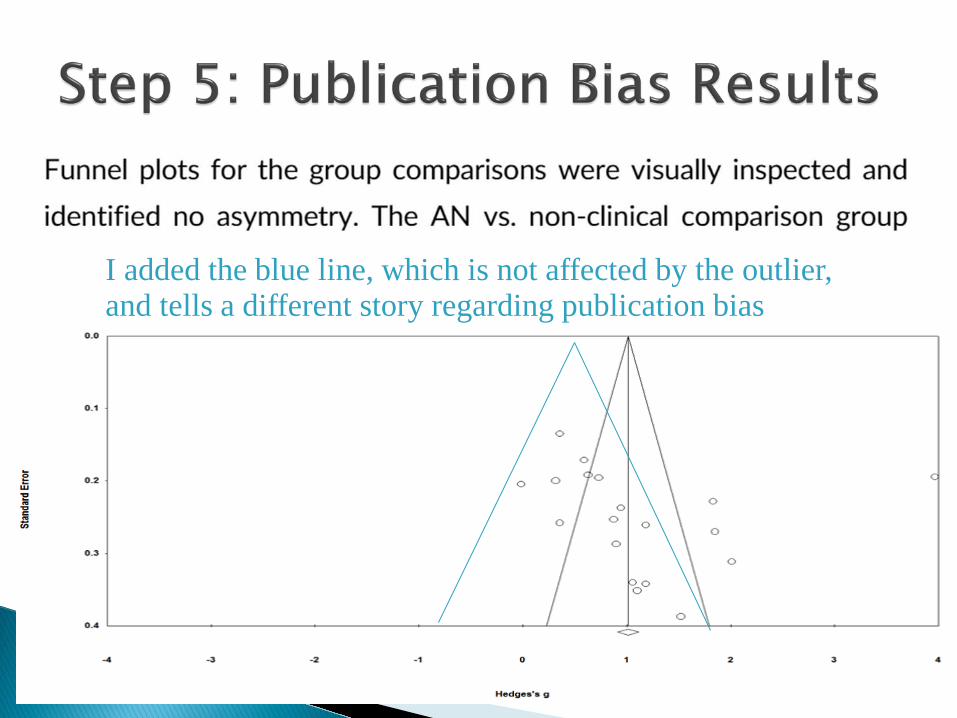
I added the blue line, which is not affected by the outlier, and tells a different story regarding publication bias
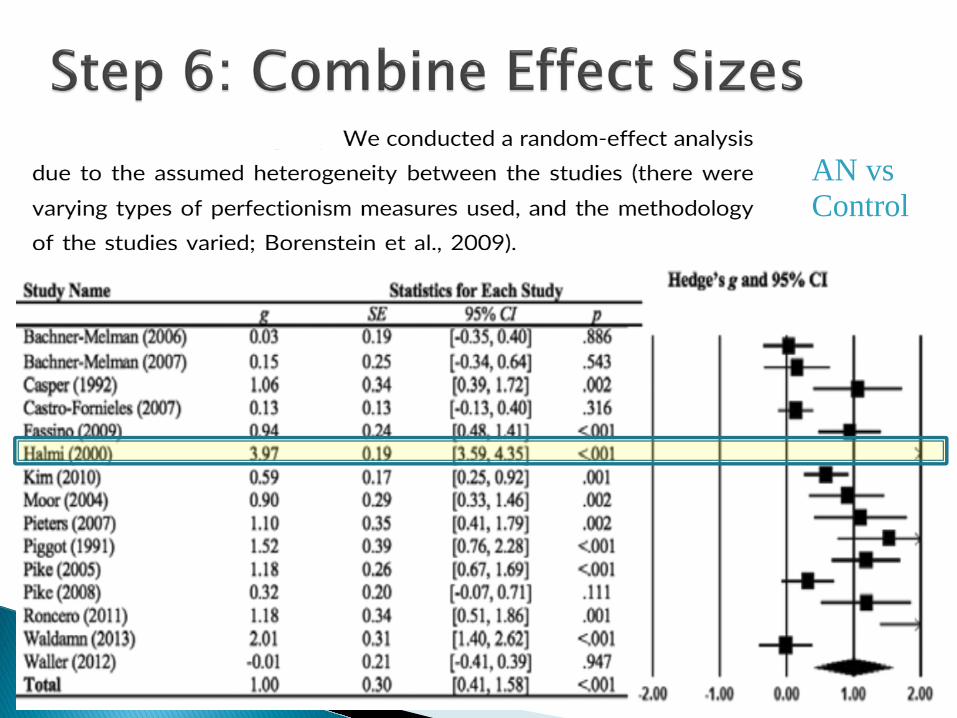
AN vs Control
Meta-analysis is a valuable tool for combining results (effect sizes) from multiple studies and providing a sense of the overall magnitude of the effect
Researchers in Psychology are slowly warming up to the value of meta-analyses, and it is important that we are now familiar with meta-analyses in our fields ◦ And conduct them when they are missing!