Embed Size (px)
Citation preview
Robert D. Gardner, Gregory L. Helmsb, William C. Hiscoxb, Egan J. Lohmana, Brent M. Peytona, Robin Gerlacha, and Keith E. Cookseyc
Department of Bioproducts and Biosystems EngineeringWest Central Research and Outreach Center
University of MinnesotaaDept. of Chemical Engineering and the Center for Biofilm Engineering, Montana State University, Bozeman MT.bCenter for NMR Spectroscopy, Washington State University, Pulman WA.cEvironmental Biotechnology Consultants, Manhattan MT.
Insight into lipid biogenesis during TAG accumulation using stable isotope tracers coupled with NMR spectroscopy and mass spectrometry
Overview
1) Bicarbonate-Enhanced Growth and Bicarbonate-Induced TAG Accumulation (See poster 204 – Brent Peyton)
i) Background and nitrogen dependency
2) NMR and MS to monitor inorganic carbon fixation (See poster 123 – Greg Helms)
i) NMR for real time analysis
ii) Verified using MS techniques on the molecular ion
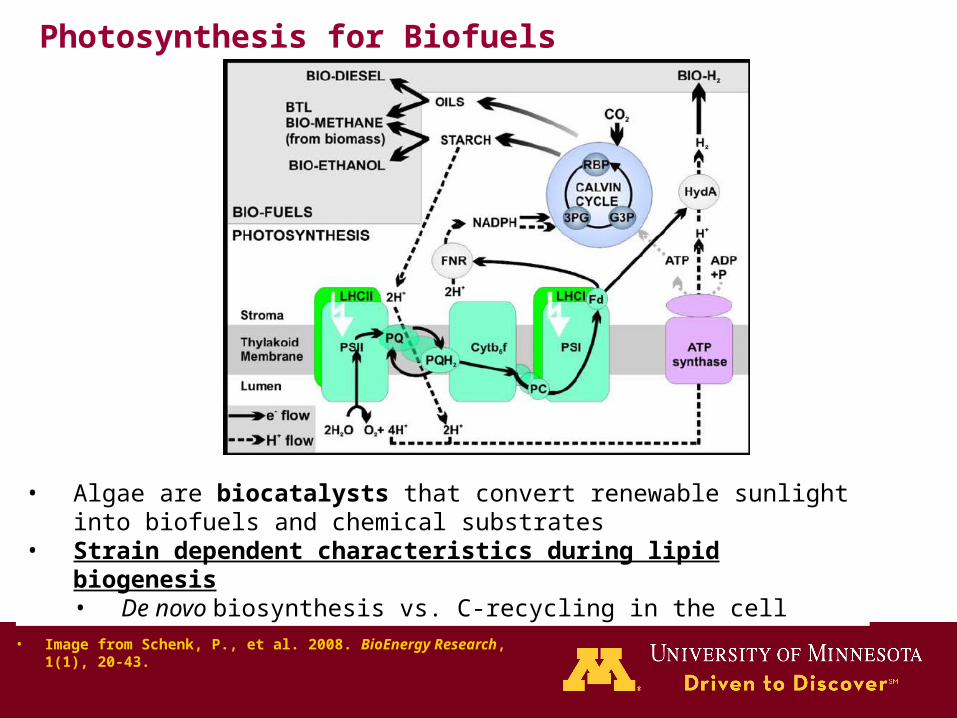
• Image from Schenk, P., et al. 2008. BioEnergy Research, 1(1), 20-43.
• Algae are biocatalysts that convert renewable sunlight into biofuels and chemical substrates
• Strain dependent characteristics during lipid biogenesis• De novo biosynthesis vs. C-recycling in the cell
Photosynthesis for Biofuels
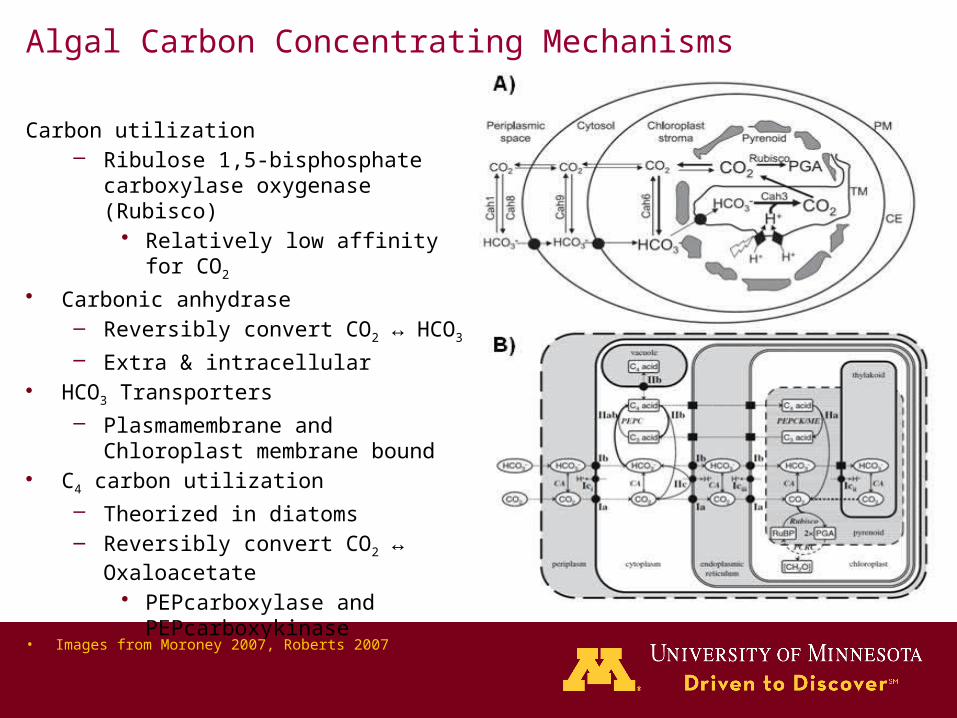
Algal Carbon Concentrating Mechanisms
Carbon utilization– Ribulose 1,5-bisphosphate carboxylase
oxygenase (Rubisco)• Relatively low affinity for CO2
• Carbonic anhydrase– Reversibly convert CO2 ↔ HCO3
– Extra & intracellular• HCO3 Transporters
– Plasmamembrane and Chloroplast membrane bound
• C4 carbon utilization
– Theorized in diatoms– Reversibly convert CO2 ↔
Oxaloacetate• PEPcarboxylase and
PEPcarboxykinase
• Images from Moroney 2007, Roberts 2007
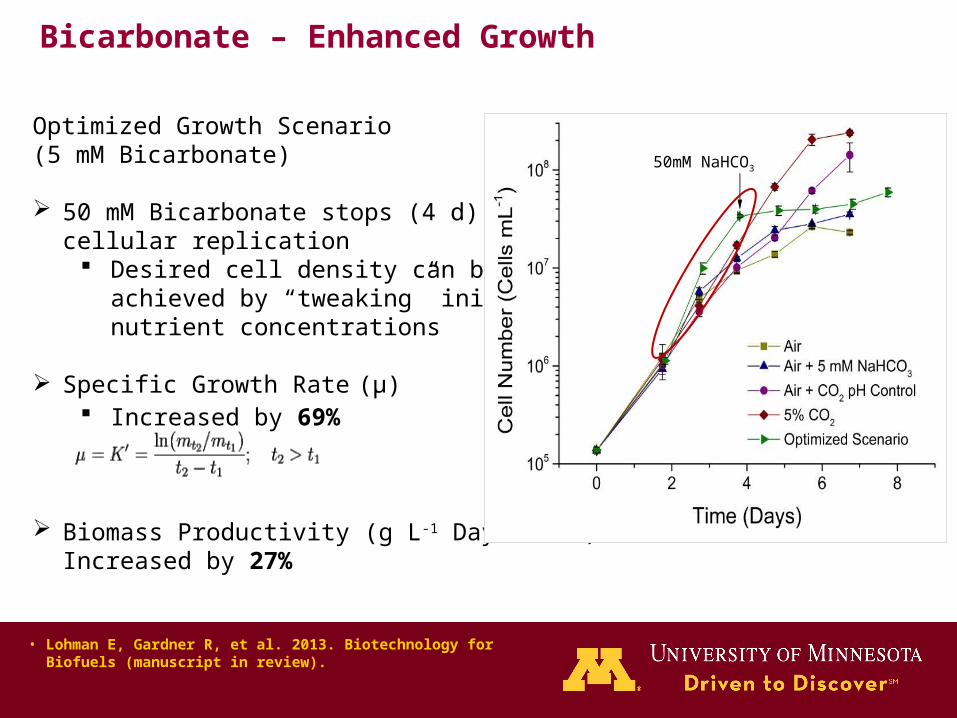
Bicarbonate – Enhanced Growth
Optimized Growth Scenario (5 mM Bicarbonate)
50 mM Bicarbonate stops (4 d)cellular replication
Desired cell density can beachieved by “tweaking” initialnutrient concentrations
Specific Growth Rate (µ) Increased by 69%
Biomass Productivity (g L-1 Day-1: DCW)Increased by 27%
• Lohman E, Gardner R, et al. 2013. Biotechnology for Biofuels (manuscript in review).
50mM NaHCO3

An Optimized DIC Regime – Enhanced Growth
Optimized Growth Scenario
Optimal system had significantly higher chlorophyll content
More photosynthetically active More efficient DIC fixation
• Lohman E, Gardner R, et al. 2013. Biotechnology for Biofuels (manuscript in review).
• Gardner R, et al. 2013. Journal of Applied Phycology. 24(5): 1311-1320
• Gardner R, et al. 2013. Biotechnology and Bioengineering 110(1): 87-96
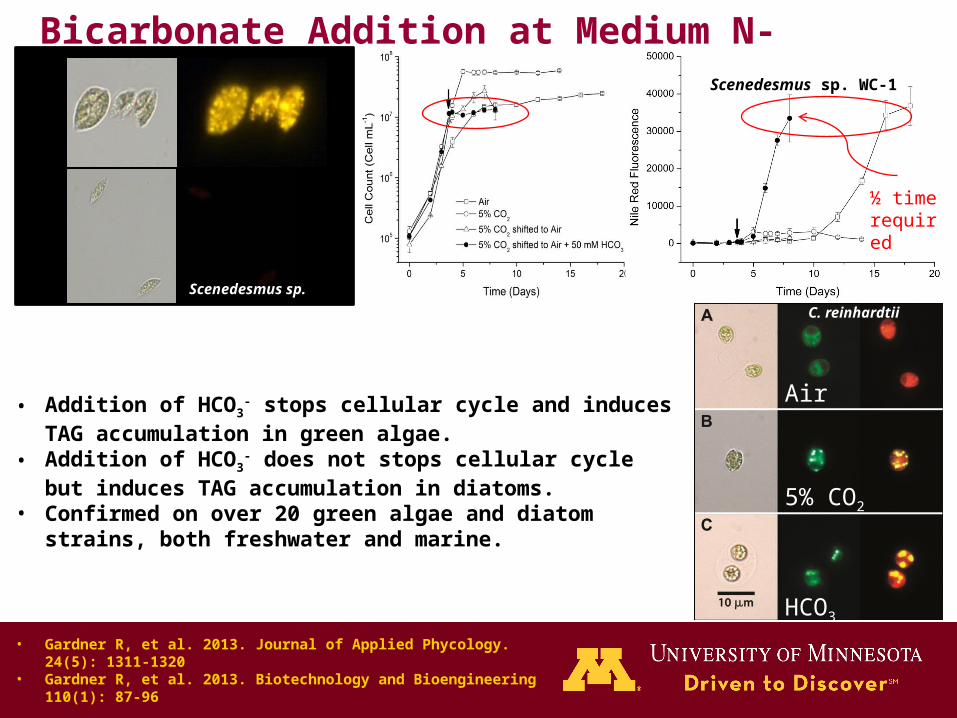
Bicarbonate Addition at Medium N-Depletion
• Addition of HCO3- stops cellular cycle and induces
TAG accumulation in green algae.• Addition of HCO3
- does not stops cellular cycle but induces TAG accumulation in diatoms.
• Confirmed on over 20 green algae and diatom strains, both freshwater and marine.
Scenedesmus sp. WC-1
C. reinhardtii
½ time required
Air
5% CO2
HCO3
Scenedesmus sp.
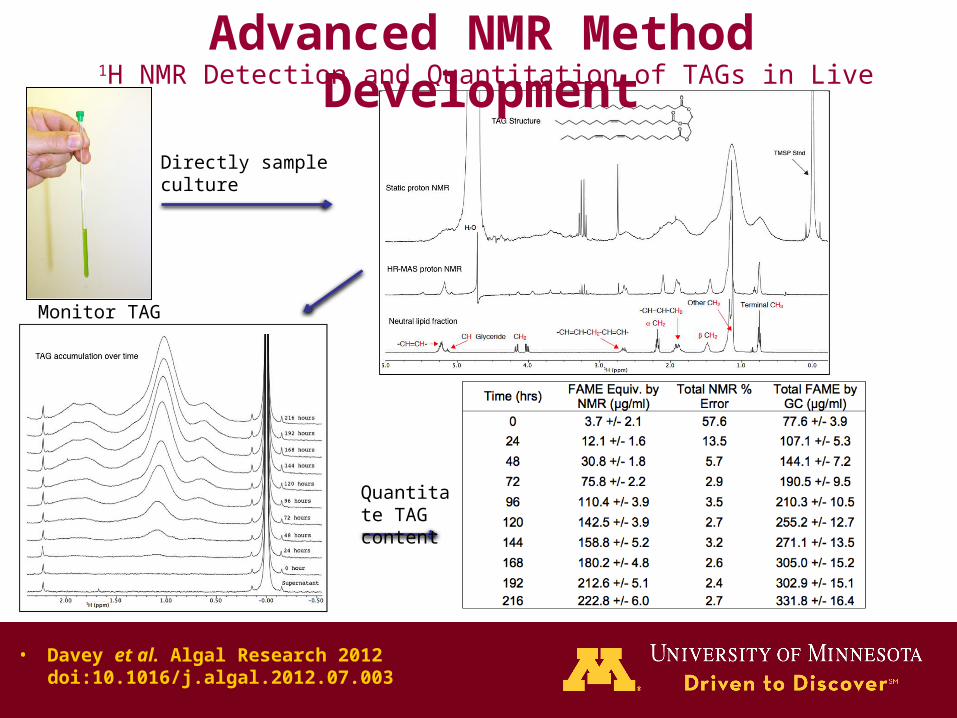
1H NMR Detection and Quantitation of TAGs in Live Algal Cells
Directly sample culture
Monitor TAG accumulation
Quantitate TAG content
• Davey et al. Algal Research 2012 doi:10.1016/j.algal.2012.07.003
Advanced NMR Method Development
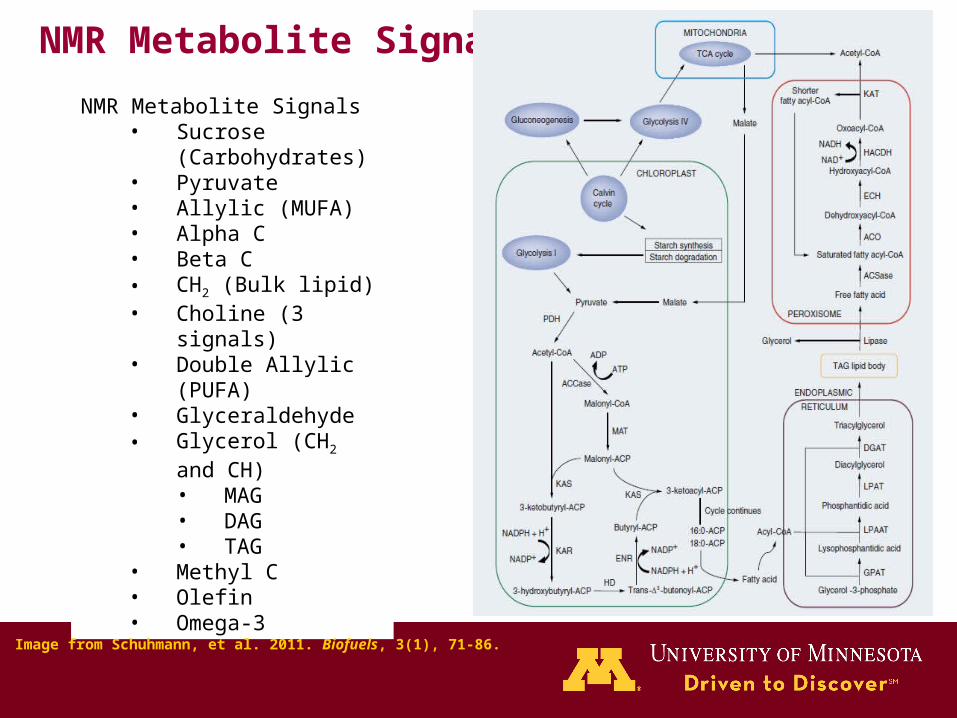
NMR Metabolite Signals
NMR Metabolite Signals• Sucrose
(Carbohydrates)• Pyruvate• Allylic (MUFA)• Alpha C• Beta C• CH2 (Bulk lipid)• Choline (3 signals)• Double Allylic
(PUFA)• Glyceraldehyde• Glycerol (CH2 and
CH)• MAG• DAG• TAG
• Methyl C• Olefin• Omega-3
Image from Schuhmann, et al. 2011. Biofuels, 3(1), 71-86.
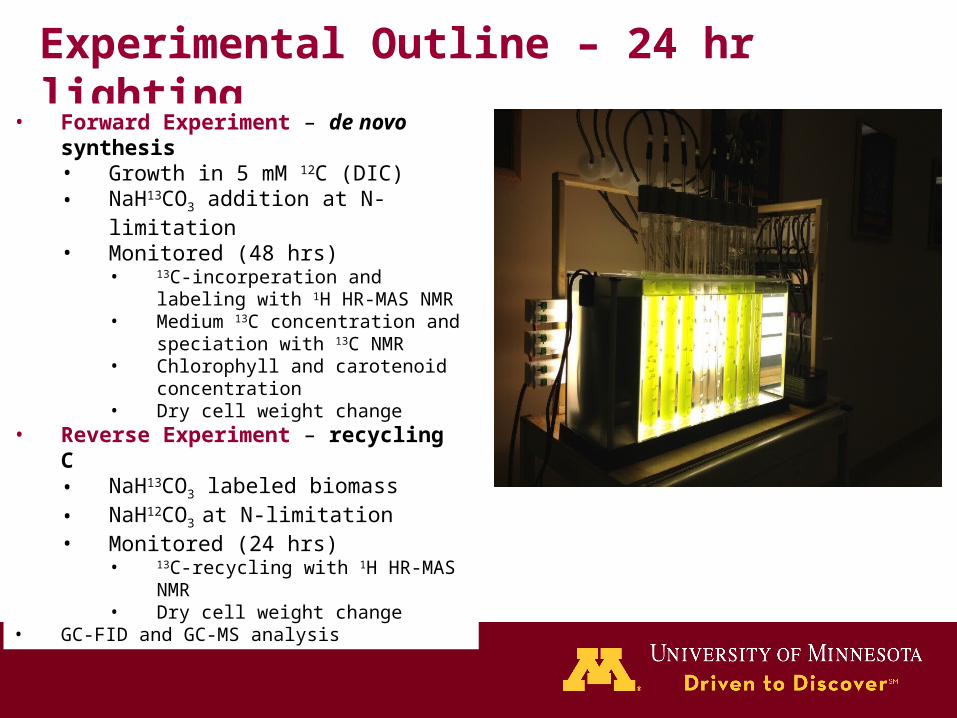
Experimental Outline – 24 hr lighting
• Forward Experiment – de novo synthesis• Growth in 5 mM 12C (DIC)• NaH13CO3 addition at N-limitation• Monitored (48 hrs)
• 13C-incorperation and labeling with 1H HR-MAS NMR
• Medium 13C concentration and speciation with 13C NMR
• Chlorophyll and carotenoid concentration
• Dry cell weight change• Reverse Experiment – recycling C
• NaH13CO3 labeled biomass• NaH12CO3 at N-limitation• Monitored (24 hrs)
• 13C-recycling with 1H HR-MAS NMR
• Dry cell weight change• GC-FID and GC-MS analysis

Experimental Results (GC analysis)
Compound Average stdev Average stdev Average stdevC14 FFA 1.18 0.01 0.49 0.02 0.41 0.03C16 FFA 0.99 0.04 1.51 0.11 1.54 0.21C18 FFA 1.00 0.04 1.57 0.13 1.34 0.22C16 MAG 0.50 0.11 0.26 0.02 0.21 0.07C18 MAG 0.48 0.03 0.35 0.01 0.24 0.03C16 DAG 0.54 0.02 1.04 0.08 0.73 0.04C18 DAG 0.37 0.03 0.82 0.13 0.35 0.08C16 TAG 0.01 0.00 4.10 0.34 1.52 0.06C18 TAG 0.00 0.00 12.87 0.96 4.34 0.12Total (% Biomass) 5.07 0.15 23.02 1.56 10.69 0.79
T=0 Forward/Reverse T=48 hr Forward T=24 hr ReverseCompound Average stdev Average stdev Average stdevFFA 3.18 0.08 3.57 0.23 3.29 0.41MAG 0.98 0.14 0.61 0.02 0.45 0.09DAG 0.91 0.05 1.86 0.21 1.08 0.12TAG 0.01 0.00 16.97 1.29 5.87 0.18Total (% Biomass) 5.07 0.15 23.02 1.56 10.69 0.79
T=0 Forward/Reverse T=48 hr Forward T=24 hr Reverse
FAME Average stdev Average stdev Average stdevC14:0 0.11 0.04 0.07 0.00C16:0 0.9 0.1 5.74 0.07 2.98 0.16C16:1 0.2 0.1 0.28 0.02 0.20 0.01Other 0.04 0.01 0.02 0.00C16:2 0.1 0.1 0.20 0.01 0.19 0.02C16:3 0.4 0.1 0.82 0.12 0.46 0.09PUFA 0.3 0.1 0.47 0.05 0.27 0.08C18:0 0.11 0.05 0.08 0.01C18:1 0.2 0.0 7.61 0.77 3.26 0.16C18:2 0.8 0.1 3.15 0.04 1.95 0.16C18:3 1.7 0.5 3.91 0.54 2.16 0.39Total (% Biomass) 4.61 0.16 22.43 0.49 11.65 1.02
T=0 Forward/Reverse T=48 hr Forward T=24 hr ReverseFAME Average stdev Average stdev Average stdevC14:0 0.5 0.2 0.6 0.0C16:0 19.2 4.3 25.6 0.4 25.7 1.0C16:1 3.7 1.5 1.2 0.1 1.7 0.1Other 0.2 0.0 0.2 0.0C16:2 3.2 1.1 0.9 0.1 1.6 0.0C16:3 8.1 0.7 3.7 0.6 3.9 0.4PUFA 6.0 2.6 2.1 0.2 2.3 0.5C18:0 0.5 0.2 0.7 0.0C18:1 5.4 1.0 33.9 3.1 28.1 1.5C18:2 17.9 2.5 14.0 0.3 16.7 0.1C18:3 36.6 6.5 17.4 2.5 18.4 1.8Total (% FAMEs) 100.0 100.0 100.0
T=0 Forward/Reverse T=48 hr Forward T=24 hr Reverse
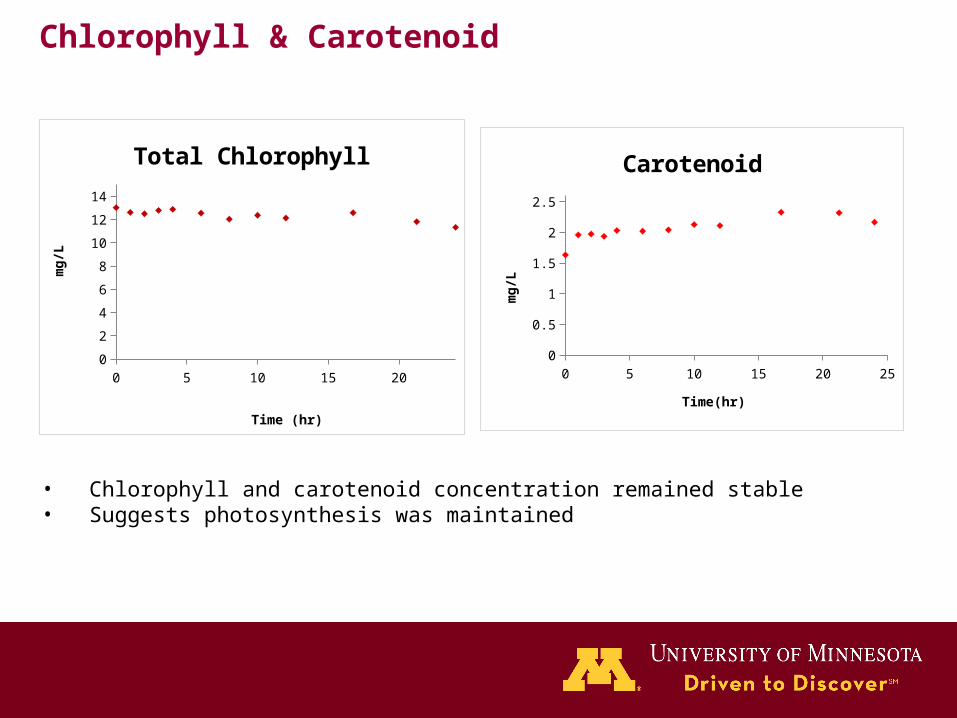
Chlorophyll & Carotenoid
• Chlorophyll and carotenoid concentration remained stable• Suggests photosynthesis was maintained
0 5 10 15 200
2
4
6
8
10
12
14
Total Chlorophyll
Time (hr)
mg
/L
0 5 10 15 20 250
0.5
1
1.5
2
2.5
Carotenoid
Time(hr)
mg
/L
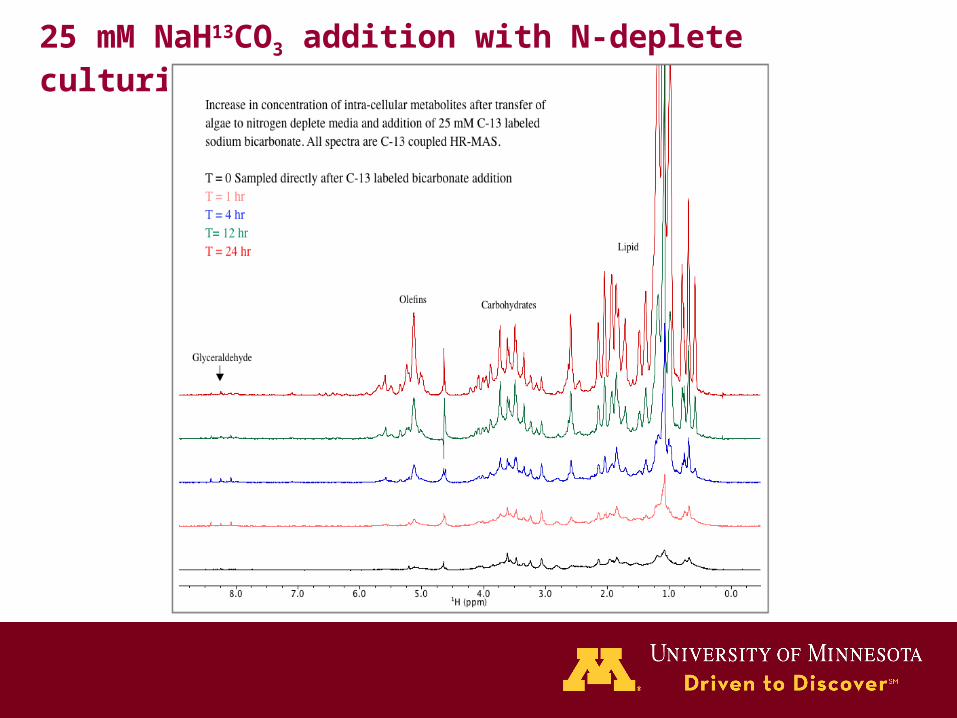
25 mM NaH13CO3 addition with N-deplete culturing

Quantification of the terminal methyl group

Quantification of the terminal methyl group
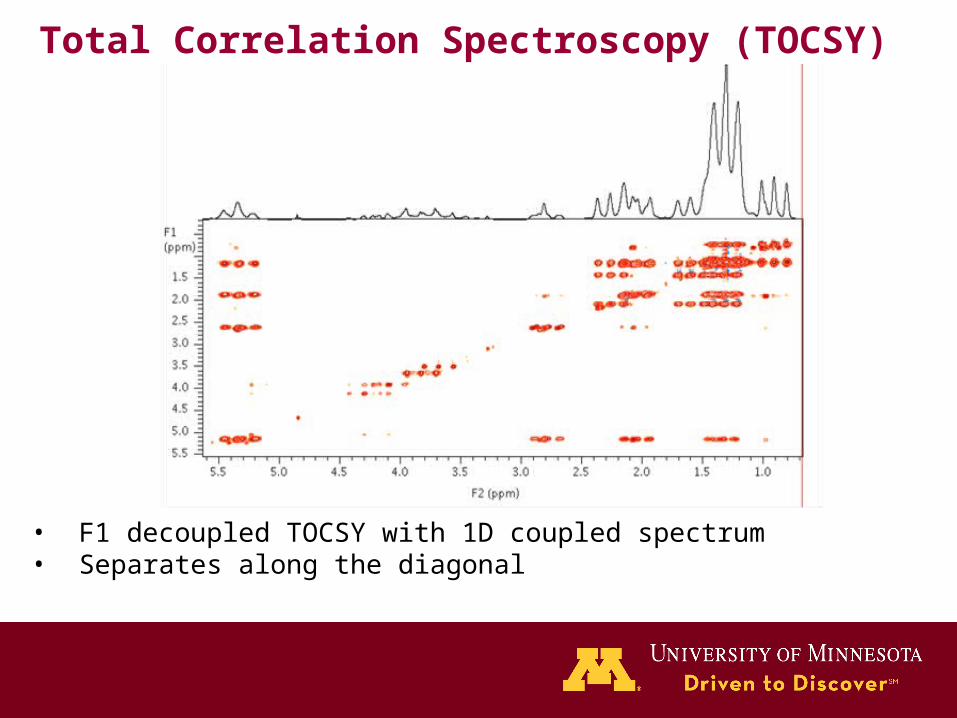
Total Correlation Spectroscopy (TOCSY)
• F1 decoupled TOCSY with 1D coupled spectrum• Separates along the diagonal

Sucrose and Bulk Lipid
Sucrose (>80% de novo synthesis at 24 hrs)• Rapid DIC incorporation (within 15 min)• Metabolic switch (steady-state) after 10 hrs
Bulk CH2 (>70% de novo synthesis at 24 hrs)• DIC incorporation and recycled biomass for 8 hrs, after which increased
rate of DIC incorporation

Allylic (MUFA) and Double Allylic (PUFA)
• MUFA (Allylic) (>60% de novo synthesis at 24 hrs)• Initial recycling• High DIC incorporation after 12 hrs
• PUFA (double allylic) (>60% recycled C at 24 hrs)• High initial and continued incorporation of recycled carbon• De novo synthesis using DIC after 6 hrs

Omega-3
• Omega-3 (>80% recycled C at 24 hrs)• Initial C-recycling and unobservable de novo synthesis from DIC• C-recycling continues and de novo synthesis begins after 10 hrs
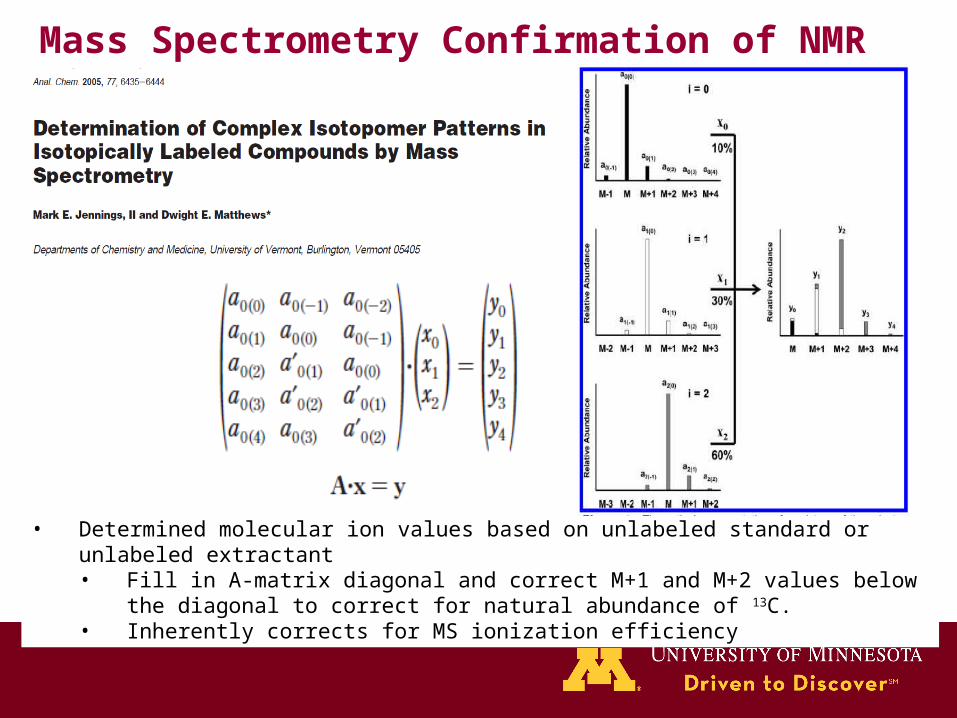
Mass Spectrometry Confirmation of NMR Findings
• Determined molecular ion values based on unlabeled standard or unlabeled extractant• Fill in A-matrix diagonal and correct M+1 and M+2 values below the
diagonal to correct for natural abundance of 13C.• Inherently corrects for MS ionization efficiency
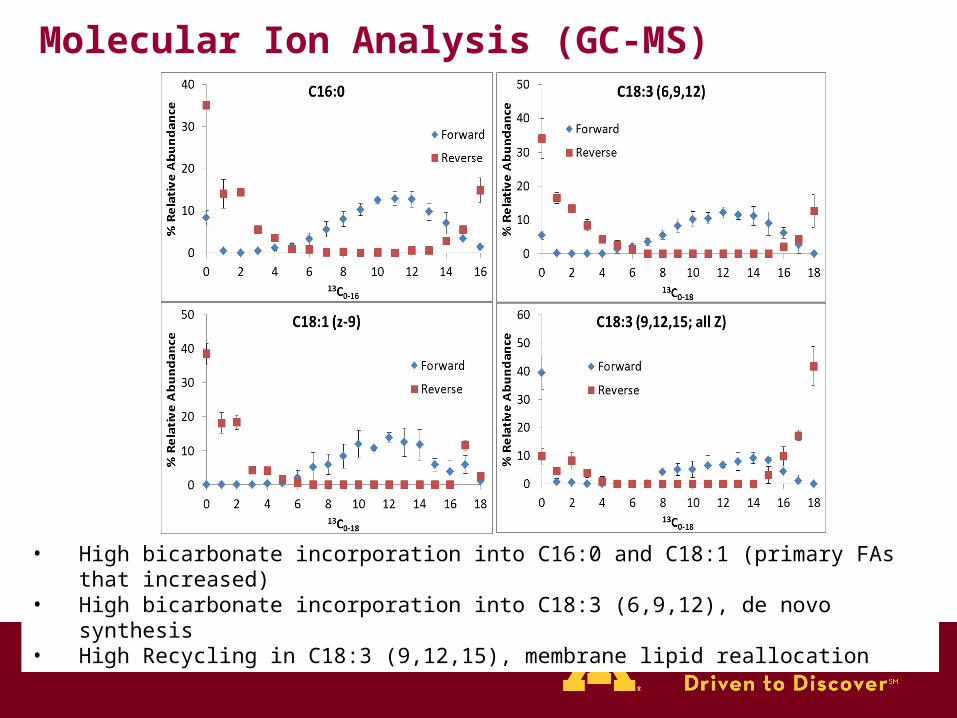
Molecular Ion Analysis (GC-MS)
• High bicarbonate incorporation into C16:0 and C18:1 (primary FAs that increased)• High bicarbonate incorporation into C18:3 (6,9,12), de novo synthesis• High Recycling in C18:3 (9,12,15), membrane lipid reallocation

• PUFA signal• 3 signals make up the overall PUFA signal• One does not incorporate bicarbonate, one
~30%, the other ~65%
Total Correlation Spectroscopy (TOCSY)
• NMR can be used as a metabolic microscope to track carbon from bicarbonate to TAG.
• Carbon rates of incorporation are being processed.
• Initial carbon source is identified (i.e., bicarbonate, CO2, or biomass).
• Fundamental and controversial questions are being answered (i.e., de novo or carbon recycling in fatty acid synthesis).
• Additional deconvolution and fluxomic developments are in process.
Summary – Key Points

U of MN BBE Dept. & WCROC• Greg Helms & Bill Hiscox (WSU)
Collaborators• University of Minnesota• Montana State University• Washington State University
Contributors & MSU Biofuels Group Members• Brent Peyton (Peyton Lab Group) • Robin Gerlach
*Environmental and Biofilm Mass Spectrometry Facility
• Keith Cooksey
Funding• NSF IGERT Program in Geobiological Systems• Church & Dwight Co., Inc.• US DoE/DoD
Acknowledgements