Embed Size (px)
Citation preview

Supporting Information for “Particle Size Distribution, Concentration, and Magnetic Attraction
Affect Transport of Polymer-modified Fe0 Nanoparticles in Sand Columns” by Tanapon
Phenrat1, Hye-Jin Kim
1, Fritjof Fagerlund
2, Tissa Illangasekare
2,
Robert D. Tilton3,4
, Gregory V. Lowry1,3*
Center for Environmental Implications of Nanotechnology (CEINT) and 1 Department of Civil &
Environmental Engineering, 3
Department of Chemical Engineering, 4
Department of Biomedical
Engineering, Carnegie Mellon University, Pittsburgh, PA 15213-3890, USA.
2Center for Experimental Study of Subsurface Environmental Processes at Colorado School of Mines
Submitted to
Environmental Science and Technology
*Corresponding author: Greg Lowry ([email protected]) 412-268-2948(ph) 412-268-7813 (fax)
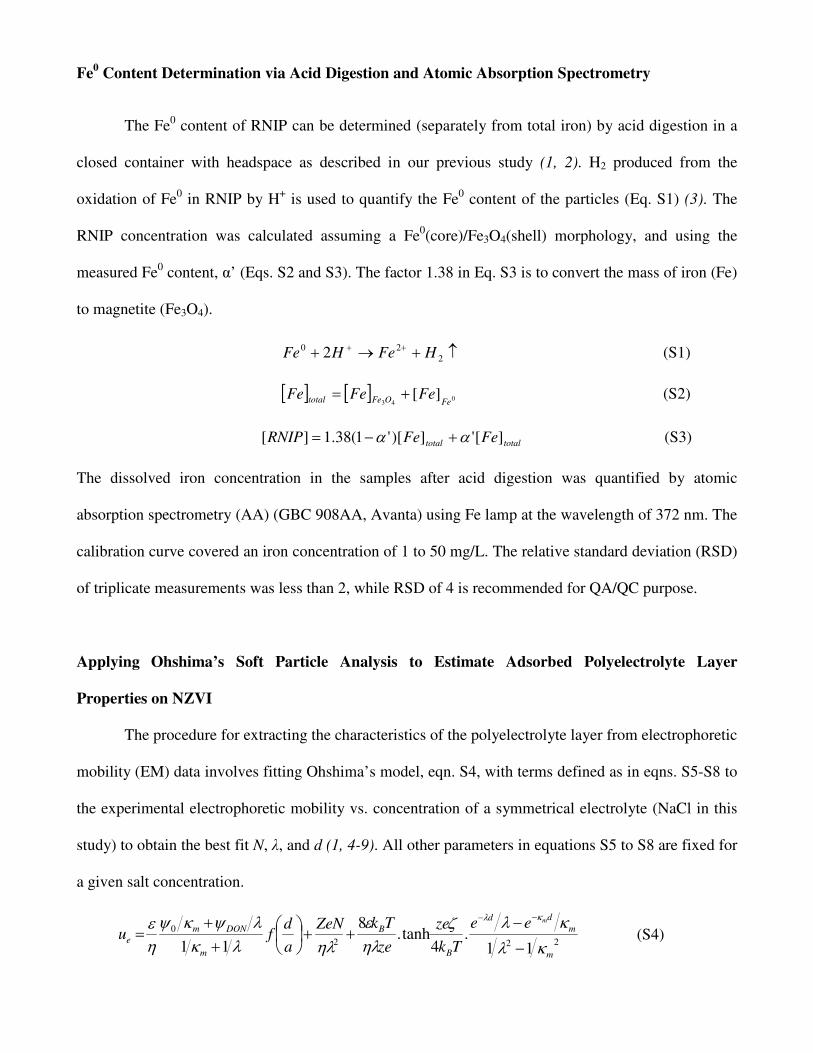
Fe0 Content Determination via Acid Digestion and Atomic Absorption Spectrometry
The Fe0 content of RNIP can be determined (separately from total iron) by acid digestion in a
closed container with headspace as described in our previous study (1, 2). H2 produced from the
oxidation of Fe0 in RNIP by H
+ is used to quantify the Fe
0 content of the particles (Eq. S1) (3). The
RNIP concentration was calculated assuming a Fe0(core)/Fe3O4(shell) morphology, and using the
measured Fe0 content, α’ (Eqs. S2 and S3). The factor 1.38 in Eq. S3 is to convert the mass of iron (Fe)
to magnetite (Fe3O4).
↑+→+ ++2
20 2 HFeHFe (S1)
[ ] [ ] 043
][FeOFetotal FeFeFe += (S2)
totaltotal FeFeRNIP ]['])['1(38.1][ αα +−= (S3)
The dissolved iron concentration in the samples after acid digestion was quantified by atomic
absorption spectrometry (AA) (GBC 908AA, Avanta) using Fe lamp at the wavelength of 372 nm. The
calibration curve covered an iron concentration of 1 to 50 mg/L. The relative standard deviation (RSD)
of triplicate measurements was less than 2, while RSD of 4 is recommended for QA/QC purpose.
Applying Ohshima’s Soft Particle Analysis to Estimate Adsorbed Polyelectrolyte Layer
Properties on NZVI
The procedure for extracting the characteristics of the polyelectrolyte layer from electrophoretic
mobility (EM) data involves fitting Ohshima’s model, eqn. S4, with terms defined as in eqns. S5-S8 to
the experimental electrophoretic mobility vs. concentration of a symmetrical electrolyte (NaCl in this
study) to obtain the best fit N, λ, and d (1, 4-9). All other parameters in equations S5 to S8 are fixed for
a given salt concentration.
222
0
11.
4tanh.
8
11m
m
dd
B
B
m
DONm
e
mee
Tk
ze
ze
TkZeN
a
dfu
κλ
κλζηλε
ηλλκλψκψ
ηε κλ
−
−++
+
+=
−−
(S4)

where ε is the electric permittivity of the liquid medium, η is its viscosity, λ is a frictional parameter
given by (γ/η)1/2
, and κm is the effective Debye-Hückel parameter of the surface hydrogel layer, which
includes the contribution of the fixed charge ZeN (5). ζ is the apparent zeta potential of the bare
particles calculated from EM measurements using Smoluchowski’s formula. The function f(d/a) varies
between 1 for a thin adsorbed layer relative to radius of the core particle (a), to 2/3 for a thick layer.
Eqn. S4 is valid when λd and κd > 1 (4). The corresponding expressions for ψDON, ψ0, f(d/a), and κm are
given in eqn S5 to S8 (4, 5, 10, 11),
= −
zn
ZN
ze
TkB
DON2
sinh 1ψ (S5)
Tk
zee
ze
Tk
Tk
ze
ze
Tk
B
dB
B
DONBDON
m
4tanh.
4
2tanh0
ζψψψ κ−+
−= (S6)
( )
++=
3
12
11
3
2
ada
df (S7)
21
cosh
=
Tk
ze
B
DON
m
ψκκ (S8)
where kB is Boltzmann’s constant, T is absolute temperature, and κ is the Debye-Hückel parameter of
the solution. Use of the Ohshima method requires data for the electrophoretic mobility for both the
bare particles and for the polyelectrolyte-coated particles as a function of the bulk solution ionic
strength.
A MATLAB (the Mathworks, Novi, MI) code employing iterative least squares minimization
was used for this fitting the EM data. Ohshima’s model was used to fit the mean ue, mean ue+σ, and
mean ue-σ as a function of ionic strength to obtain three best-fit values of each fitting parameter (1/λ, N,
and d). The average and standard deviation of the fitting parameters determined for the mean ue, mean
ue+σ, and mean ue-σ was calculated and reported in Table S1. It should be noted that this procedure is
not meant to convey the goodness of fit of the data, rather it is used to bound the range of the
magnitude of each parameter (12-14).

Using a Constricted Tube Model to Estimate Apparent Shear Rate Acting on Aggregates in
Porous Media
Assuming a constricted tube model (Figure S6) as representative of the void space between
collectors in the porous media, the apparent shear rate (γs) acting on aggregates in a pore of a specific
diameter is given by Eq.S9
poreeff
sNd
Q3
32
πγ = (S9)
where Q is the total volumetric flow rate in the porous media, and Npore (Eq.S10) is the number of
pores in the column cross section. deff (Eq.S11) is the effective pore diameter.
2)4/( eff
column
pored
AN
πε
= (S10)
470.0
c
eff
dd = (S11)
dc (Eq.S12) is the equivalent diameter of the constriction, and Acolumn is the cross-sectional area of the
column.
5658.2
g
c
dd = (S12)
dg is the average diameter of collectors, which is 300 µm in this study.
Using a Constricted Tube Model to Estimate the Shear Experienced by a Retained
Particle/Agglomerate at the Pore Wall
Assuming a constricted tube model as representative of the void space between collectors in the porous
media, the shear experienced by a retained particle/agglomerate at the pore wall, ∂v/∂r, can be
expressed as Eq. (S13)(15):
22 )2/(
)2/(4
)4/(
/
z
z
z
pore
d
ad
d
NQ
r
v −=
∂∂
π (S13)

dz is the diameter of pore in the constricted tube model used to calculate νcolloid, the fluid velocity at the
location of the attached colloid (15) . Figure S6 illustrates dz as a function of z from the center of a
collector used in this study.
−
−+=
2
maxmax 5.022
42
2h
zdddd c
z (S14)
−−=
2
2 )2/(
)2/(1
)4/(
/2
z
colloidz
z
pore
colloidd
ad
d
NQ
πν (S15)
dmax (Eq.S16) is the maximum pore diameter.
cdd 141.2max = (S16)
Deposition of Agglomerates formed in Porous media.
This section summarizes a modified model that semi-quantitatively supports the effect of
hydrodynamic shear in porous media on the deposition of particles/agglomerates. The original model
was recently reported by Torkzaban and coworkers (16). When a particle or agglomerate collides with
a collector in a flow field an adhesive force (FA) between the particle and the collector promotes
attachment while a drag force (FD) due to the fluid flow promotes detachment. For PSS-RNIP the
adhesive force (FA) is estimated from the absolute value of the secondary minimum (Θmin) predicted by
extended DLVO theory which takes into account the electrosteric repulsions and the van der Waals
attraction between PSS-RNIP and sand (Figure S5 and Table S2 in Supporting Information). Using
eqn S17, the adhesive force is approximated as
min
min
hFA
Θ= (S17)

where hmin is the separation distance at the secondary minimum between the colloid and the collector
surface (Figure S2). The drag force (FD) acting on attached particles or aggregates can be calculated
using eqn S18 (16),
2)(205.10 ar
vFD ∂
∂= πµ (S18)
where µ is the fluid viscosity, ∂v/∂r is the shear experienced by a retained particle at the pore wall, and
a is the radius of the retained particle or the radius of gyration of the retained agglomerate. ∂v/∂r is
calculated assuming that a constricted tube model represents the void space between collectors in the
porous media (Figure S6, Supporting information) such that (15):
22 )2/(
)2/(4
)4/(
/
z
z
z
pore
d
ad
d
NQ
r
v −=
∂∂
π (S19)
where dz is the diameter of pore in the constricted tube model used to calculate νcolloid, the fluid velocity
experienced by the attached colloid (15) . Figure S6 illustrates dz as a function of z from the center of a
collector used in this study. Npore is the number of pores in the column cross section. The calculation of
Npore and dz assuming a constricted tube model is discussed previously.
The drag force results in an applied torque (Tapplied, eqn S20) and the adhesive force results in
an adhesive torque (Tadhesive, eqn S21) (16).
Dapplied aFT 4.1= (S20)
3/1
4
==
K
aFFlFT A
AxAadhesive (S21)
lx represents the radius of the colloid-surface contact area and is estimated using the theory of Johnson,
Kendall, and Roberts (16). K is the composite Young’s modulus. For deposition of PSS-RNIP on silica

sand in this study we assume a value of K= 4.014 x 10⁹ N m
-2 reported for glass bead collectors and
polystyrene particles (17). Particle/aggregate deposition is only favorable and irreversible when
Tadhesive>Tapplied. The magnitude of Tadhesive and Tapplied as a function of particle/aggregate sizes for PSS-
modified nanoparticles with the measured adsorbed layer properties (Table 1) under the hydrodynamic
and geochemical conditions used in this study were calculated (Figure S7). For a fixed pore water
velocity and geochemistry, a greater particle (or aggregate) size increases the probability for
irreversible attachment (i.e. Tadhesive >> Tapplied). Tadhesive increases with increasing radius of the retained
particle/agglomerate to the 1.67th
power (see Supporting Information). In contrast, Tapplied decreases
with increasing size of the retained particle/agglomerate for the range of particle/aggregate sizes used
because ∂v/∂r is inversely proportional to a (Supporting Information Figure S7 and eqn S19).
Scaling Argument that Tadhesive increases with increasing radius of the retained
particle/agglomerate to the 1.67th
power
From Eq.S21
3/1
4
==
K
aFFlFT A
AxAadhesive (S22)
Therefore,
3/13/4
aFT Aadhesive ∝ (S23)
From Eq.S17
min
min
hFA
Θ= (S24)
Θmin is governed by the magnitude of van der Waals attraction between a particle and a
collector. Vvdw for sphere-wall interaction is
s
HaVvdW
6
−= (S25)
Where H is the Hamaker constant, and s is the separation distance between particle and wall.
Therefore,

aFA ∝ (S26)
For this reason, from Eqs. S23 and S26
3/5aTAdhesive ∝ (S27)
Arguments to Support the Effect of Particle Concentrations on Time to Attain a Steady
State Agglomerate Size and to Support the Assumption that the Steady State
Agglomerate Size is Reached Relatively Quickly Compared to the Retention Time in
Column Experiments
Particle concentration can affect the time lag (τSS) for attainment of the steady state based on
the study by Spicer et al (1996). τ is a dimensionless time which can be expressed as:
(S28)
Where G is a shear rate (s-1
); for porous media, G can be calculated from Eq. S9 (in Supporting
Information). φ is the volume fraction of particle in solution (i.e. a function of particle concentration),
and t is time in second. The steady state time lag (τSS) for the number (τnSS) and for the volume (τvSS)
distributions are a function of Coagulation-Fragmentation Group (CF) (when 0.003<CF<0.07 ):
(S29)
When CF is
(S30)
tGφτ =
69.20log35.22 −−= CFnSSτ
496.0log60.5 −−= CFvSSτ
0
00
φβVS
CF =

Where V0 is the volume of particles at time zero (before agglomeration). S0 is the fragmentation rate
for initial particles (V0) and β0 is the collision frequency for initial particles (V0).
(S31)
(S32)
According to S29 to S32, the higher the particle concentration, the smaller the time (t; in second)
required to reach the steady state. Based on the pore water velocity and the porous media used in this
study, G can be calculated from Eq. S9 (Supporting Information). CF values calculated based on
Eq.R3 for PSS-RNIP-F1 particles of 1 to 6 g/L range from 2.7x1036
to 4.7 x1035
, indicating that τSS
should be on the order of seconds once subjected to the flow conditions in the column. This is much
smaller than the retention time of particles in the column (~ 25 minutes). Therefore, the assumption
that agglomeration reaches the steady during the transport in the columns is reasonable.
3/1
0
6.1
0 0047.0 VGS =
33/1
00 )2(31.0 VG=β

Table S1 Characteristics of the adsorbed polyelectrolyte layers at pH 8.0±0.1 as
estimated by Ohshima’s soft particle analysis.
ZN/NA a d
a 1/λ
a |ψDON|
ab |ψ0|
ab
(mole/m3) (nm) (nm) (mV) (mV) Particle Fraction
F1
2.0±0.2
63±15
13±0.6
2.4±0.2
1.7±0.1
F2
2.9±0.3
75±24
11±0.6
3.3±0.3
1.7±0.2
PSS70K-
RNIP
F3
1.7±0.9
75±12
15±0.5
2.0±1.0
1.0±0.4
F1
1.0±0.0
41±2
18±0.0
1.2±0.0
0.6±0.0
PSS70K-
Hematite
F2
1.0±0.0
46±3
18±0.6
1.2±0.0
0.6±0.0
a Errors are ± 1 standard deviation as described in the experimental section.
b The sign of ψDON and ψ0 is negative, and the data is for 10 mM Na
+.

Table S2 Θmin and hmin between PSS-RNIP particles or agglomerates and a flat plate (i.e. a
representative of a collector in porous media) using extended DLVO calculation by taking into
account electrosteric repulsions and van der Waals attractions.
Particle/agglomerate
size (nm)
Θmin
(10-20
N.m)
hmin
(nm)
25 1.0x10⁻⁵
190
45 4.1x10⁻⁴
170
367 1.5x10⁻¹
170
1000 1.0 170
2000 2.9 170
5000 9.4 170

PSS-RNIP F1
F2
F3
PSS-hematite
F1
F2
(a) (b)
Figure S1 Volume-averaged particle size distributions of different fractions of (a) PSS-
modified RNIP and (b) PSS-modified hematite. Number averaged particles size
distribution of different fractions of (c) PSS-modified RNIP and (d) PSS-modified
hematite. The symbols for (c) and (d) are similar to (a) and (b), respectively
(c) (d)
PSS-RNIP PSS-hematite

(a)
(b)
Figure S2 Sedimentation curves of (a) PSS-RNIP-F2 and –F3 and (b) PSS-hematite-F1
and-F2 at the initial particle concentration of 30 mg/L and 1 g/L.

-5
-4
-3
-2
-1
0
1
2
3
4
5
0 50 100 150
S (nm)
V/(
kBT
)
-100
-80
-60
-40
-20
0
20
40
60
80
100
0 50 100 150 200 250
S (nm)
V(K
BT
)
(a)
(b)
VM
VvdW
Vosm
VT
Velas
VES
PSS-RNIP-F2
(a=25 nm)
PSS-hematite-F2
(a=66 nm)
VT and Vosm
Velas
VES
VvdW
Figure S3. Potential energy of particle-particle interaction calculated by extended DLVO
for (a) PSS-RNIP-F2 and (b) PSS-hematite-F2 using the physical properties according to
the 1st peak in Table 1.

(a) (b)
Figure S4 Normalized breakthrough curves for (a) PSS-modified RNIP and hematite
at particle concentration of 30 mg/L and (b) PSS-modified hematite at particle
concentrations from 1 to 6 g/L.

-5
-3
-1
1
3
5
0 100 200 300 400 500
S (nm)
V(K
T)
PSS-RNIP-F1
(Cluster of a=328)
VT
Velas
VES
VvdW
Vosm
Figure S5. A representative potential energy of particle-collector interaction calculated by
extended DLVO for a cluster with a =328 representing in PSS-RNIP-F1 dispersion.
Secondary minimum

z
dz
FD
Tapplied Tadhesive
vz Collector
Pore
Figure S6 Diameter of pore (dz) as a function of distance from the center
of a collector (z) used in this study assuming the constricted tube model as
a representation of the void space between collectors in the porous media.

RH= 25 nm
Tadhesive
RH= 45 nm
RH= 155 nm
RH= 367nm
RH= 1 µm
RH= 2 µm
RH= 5 µm
Tapplied
RH= 25 nm
RH= 45 nm
RH= 155 nm
RH= 367nm
RH= 1 µm
RH= 2 µm
RH= 5 µm
Figure S7 The calculated Tapplied and Tadhesive for different sizes of PSS-modified
RNIP (as individual particles and aggregates) for the transport conditions used in
this study assuming the constricted tube model (Figure S4) as a representation of the
void space between collectors in the porous media.

Literature Cited
1. Phenrat, T.; Saleh, N.; Sirk, K.; Kim, H.-J.; Tilton, R. D.; Lowry, G. V., Stabilization of aqueous
nanoscale zerovalent iron dispersions by anionic polyelectrolytes: adsorbed anionic
polyelectrolyte layer properties and their effect on aggregation and sedimentation. J. Nanopart.
Res. 2008, 10, 795-814.
2. Liu, Y.; Phenrat, T.; Lowry, G. V., Effect of TCE concentration and dissolved groundwater
solutes on NZVI-promoted TCE dechlorination and H2 evolution. Environ. Sci. Technol. 2007,
41, (22), 7881-7887.
3. Phenrat, T.; Saleh, N.; Sirk, K.; Tilton, R., D.; Lowry, G., V., Aggregation and sedimentation of
aqueous nanoscale zerovalent iron dispersions. Environ. Sci. Technol. 2007, 41, (1), 284-290.
4. Ohshima, H.; Nakamura, M.; Kondo, T., Electrophoretic mobility of colloidal particles coated
with a layer of adsorbed polymers. Colloid Polym. Sci. 1992, 270, 873-877.
5. Ohshima, H., Electrophoresis of soft particles. Adv. Colloid Interface Sci. 1995, 62, 189-235.
6. Ohshima, H., Electrophoretic mobility of soft particles. Colloids Surf. A 1995, 103, 249-255.
7. Viota, J., L.; de Vicente, J.; Duran, J., D., G.; Delgado, A., V., Stabilization of
magnetorheological suspensions by polyacrylic acid polymers. J. Colloid Interface Sci. 2005, 284,
527-541.
8. Viota, J. L.; de Vicente, J.; Ramos-Tejada, M. M.; Durán, J. D. G., Electrical double layer and
rheological properties of yttria-stabilized zirconia suspensions in solutions of high molecular
weight polyacrylic acid polymers Rheol. Acta 2004, 43, 645-656.
9. Ramos-Tejada, M., M.; Ontiveros, A.; Viota, J., L.; Durán, J. D. G., Interfacial and rheological
properties of humic acid/hematite suspensions. J. Colloid Interface Sci. 2003, 268, (1), 85-95.
10. Ohshima, H., Electrophoretic mobility of soft particles. J. Colloid Interface Sci. 1994, 163, 474-
483.
11. Nakamura, M.; Ohshima, H.; Kondo, T., Electrophoretic behavior of antigen- and antibody-
carrying latex particles. J. Colloid Interface Sci. 1992, 149, (1), 241-246.
12. Mays, D. C.; Hunt, J. R., Hydrodynamic aspects of particle clogging in porous media Environ.
Sci. Technol. 2005, 39, (2), 577-584.
13. Box, G. E. P.; Hunter, W. G.; Hunter, J. S., Statistics for Experimenters: An Introduction to
Design, Data Analysis, and Model Building 1st ed.; Wiley-Interscience: New York, 1978.
14. Phenrat, T.; Saleh, N.; Sirk, K.; Kim, H.-J.; Tilton, R., D.; Lowry, G. V., Stabilization of aqueous
nanoscale zerovalent iron dispersions by anionic polyelectrolytes. J. Nanopart. Res In press.
15. Bergendahl, J.; Grasso, D., Prediction of colloid detachment in a model porous media:
hydrodynamics. Chem. Eng. Sci. 2000, 55, 1523-1532.
16. Torkzaban, S.; Bradford, S. A.; Walker, S. L., Resolving the coupled effects of hydrodynamics
and DLVO forces on colloid attachment in porous media. Langmuir 2007, 23, 9652-9660.
17. Bergendahl, J.; Grasso, D., Prediction of colloid detachment in a model porous media:
hydrodynamics. Chem. Eng. Sci. 2000, 55, 1523-1532.


![A PProblems[1]Tilton](https://img.pdfslide.net/doc/110x75/577d35b01a28ab3a6b912292/a-pproblems1tilton.jpg)