Embed Size (px)
Citation preview
1
U.S. Department of Education
2011 - Blue Ribbon Schools Program
A Public School
School Type (Public Schools):
(Check all that apply, if any) Charter
Title 1
Magnet
Choice
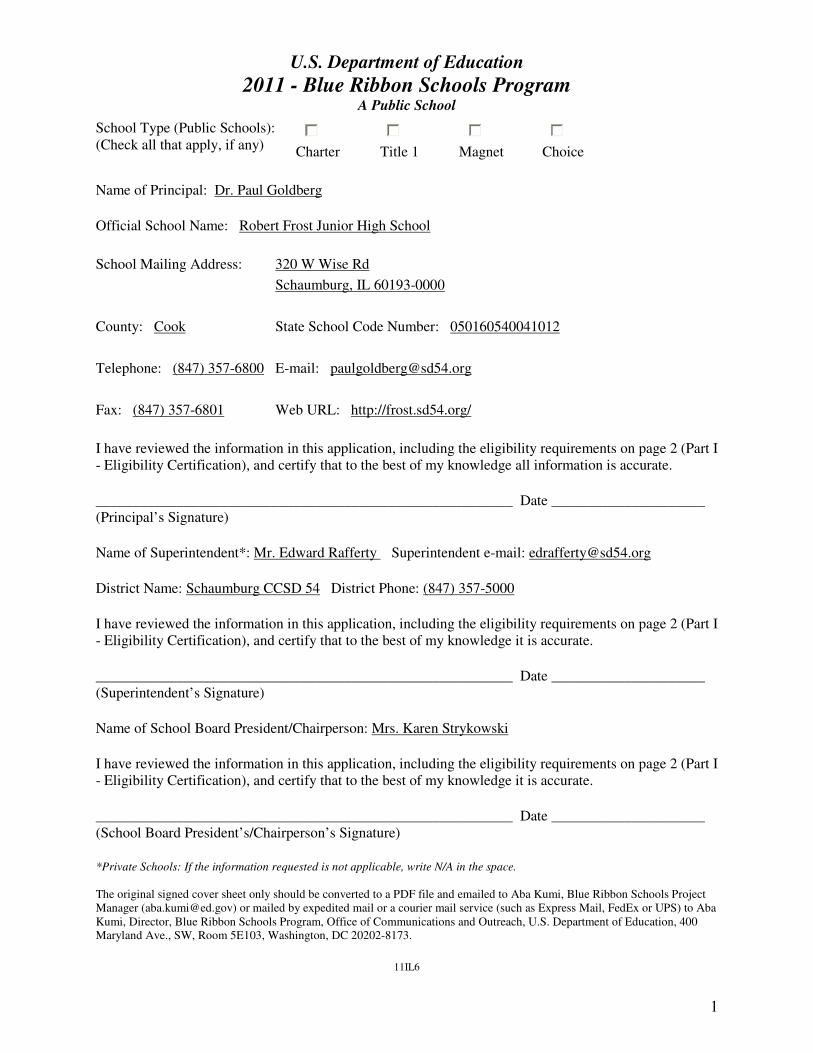
Name of Principal: Dr. Paul Goldberg
Official School Name: Robert Frost Junior High School
School Mailing Address: 320 W Wise Rd
Schaumburg, IL 60193-0000
County: Cook State School Code Number: 050160540041012
Telephone: (847) 357-6800 E-mail: [email protected]
Fax: (847) 357-6801 Web URL: http://frost.sd54.org/
I have reviewed the information in this application, including the eligibility requirements on page 2 (Part I
- Eligibility Certification), and certify that to the best of my knowledge all information is accurate.
_________________________________________________________ Date _____________________
(Principal’s Signature)
Name of Superintendent*: Mr. Edward Rafferty Superintendent e-mail: [email protected]
District Name: Schaumburg CCSD 54 District Phone: (847) 357-5000
I have reviewed the information in this application, including the eligibility requirements on page 2 (Part I
- Eligibility Certification), and certify that to the best of my knowledge it is accurate.
_________________________________________________________ Date _____________________
(Superintendent’s Signature)
Name of School Board President/Chairperson: Mrs. Karen Strykowski
I have reviewed the information in this application, including the eligibility requirements on page 2 (Part I
- Eligibility Certification), and certify that to the best of my knowledge it is accurate.
_________________________________________________________ Date _____________________
(School Board President’s/Chairperson’s Signature)
*Private Schools: If the information requested is not applicable, write N/A in the space.
The original signed cover sheet only should be converted to a PDF file and emailed to Aba Kumi, Blue Ribbon Schools Project
Manager ([email protected]) or mailed by expedited mail or a courier mail service (such as Express Mail, FedEx or UPS) to Aba
Kumi, Director, Blue Ribbon Schools Program, Office of Communications and Outreach, U.S. Department of Education, 400
Maryland Ave., SW, Room 5E103, Washington, DC 20202-8173.
11IL6
2
PART I - ELIGIBILITY CERTIFICATION 11IL6
The signatures on the first page of this application certify that each of the statements below concerning
the school’s eligibility and compliance with U.S. Department of Education, Office for Civil Rights (OCR)
requirements is true and correct.
1. The school has some configuration that includes one or more of grades K-12. (Schools on the
same campus with one principal, even K-12 schools, must apply as an entire school.)
2. The school has made adequate yearly progress each year for the past two years and has not been
identified by the state as "persistently dangerous" within the last two years.
3. To meet final eligibility, the school must meet the state's Adequate Yearly Progress (AYP)
requirement in the 2010-2011 school year. AYP must be certified by the state and all appeals
resolved at least two weeks before the awards ceremony for the school to receive the award.
4. If the school includes grades 7 or higher, the school must have foreign language as a part of its
curriculum and a significant number of students in grades 7 and higher must take the course.
5. The school has been in existence for five full years, that is, from at least September 2005.
6. The nominated school has not received the Blue Ribbon Schools award in the past five years:
2006, 2007, 2008, 2009 or 2010.
7. The nominated school or district is not refusing OCR access to information necessary to
investigate a civil rights complaint or to conduct a district-wide compliance review.
8. OCR has not issued a violation letter of findings to the school district concluding that the
nominated school or the district as a whole has violated one or more of the civil rights statutes. A
violation letter of findings will not be considered outstanding if OCR has accepted a corrective
action plan from the district to remedy the violation.
9. The U.S. Department of Justice does not have a pending suit alleging that the nominated school
or the school district as a whole has violated one or more of the civil rights statutes or the
Constitution’s equal protection clause.
10. There are no findings of violations of the Individuals with Disabilities Education Act in a U.S.
Department of Education monitoring report that apply to the school or school district in question;
or if there are such findings, the state or district has corrected, or agreed to correct, the findings.
3
PART II - DEMOGRAPHIC DATA 11IL6
All data are the most recent year available.
DISTRICT
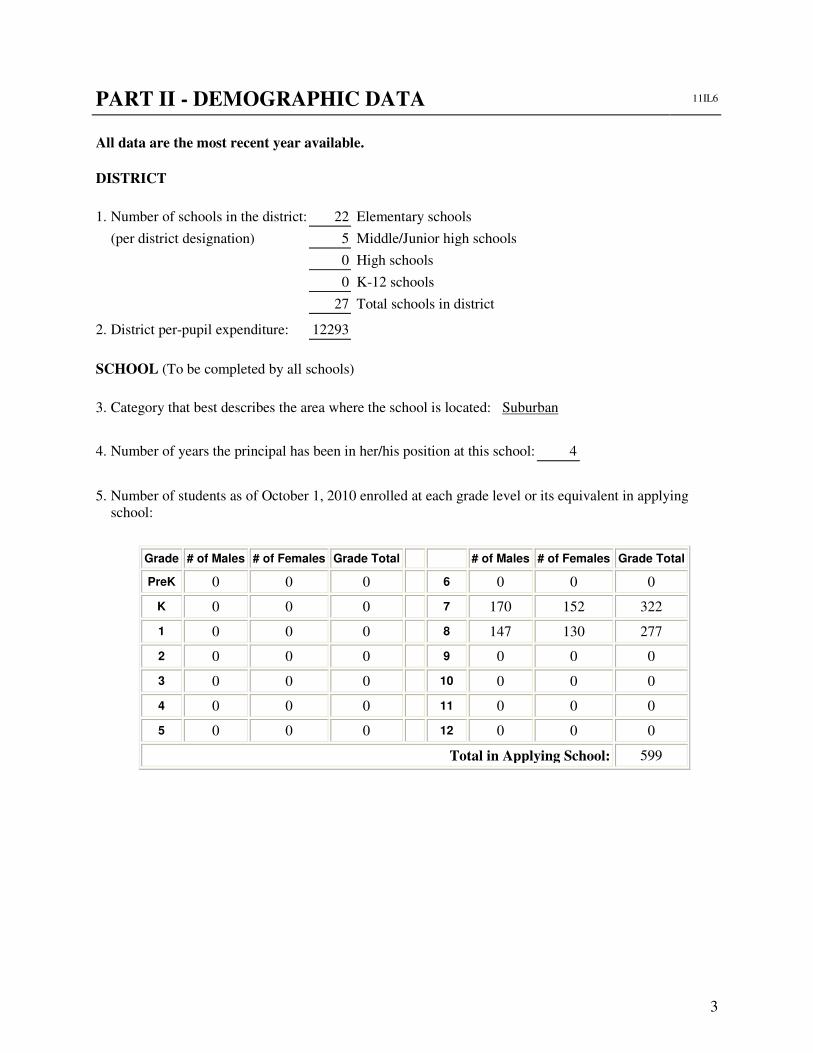
1. Number of schools in the district: 22 Elementary schools
(per district designation) 5 Middle/Junior high schools
0 High schools
0 K-12 schools
27 Total schools in district
2. District per-pupil expenditure: 12293
SCHOOL (To be completed by all schools)
3. Category that best describes the area where the school is located: Suburban
4. Number of years the principal has been in her/his position at this school: 4
5. Number of students as of October 1, 2010 enrolled at each grade level or its equivalent in applying
school:
Grade # of Males # of Females Grade Total
# of Males # of Females Grade Total
PreK 0 0 0 6 0 0 0
K 0 0 0 7 170 152 322
1 0 0 0 8 147 130 277
2 0 0 0 9 0 0 0
3 0 0 0 10 0 0 0
4 0 0 0 11 0 0 0
5 0 0 0 12 0 0 0
Total in Applying School: 599

4
11IL6
6. Racial/ethnic composition of the school: 1 % American Indian or Alaska Native
14 % Asian
7 % Black or African American
14 % Hispanic or Latino
3 % Native Hawaiian or Other Pacific Islander
58 % White
3 % Two or more races
100 % Total
Only the seven standard categories should be used in reporting the racial/ethnic composition of your
school. The final Guidance on Maintaining, Collecting, and Reporting Racial and Ethnic data to the U.S.
Department of Education published in the October 19, 2007 Federal Register provides definitions for
each of the seven categories.
7. Student turnover, or mobility rate, during the 2009-2010 school year: 6%
This rate is calculated using the grid below. The answer to (6) is the mobility rate.
(1) Number of students who transferred to
the school after October 1, 2009 until
the end of the school year.
12
(2) Number of students who transferred
from the school after October 1, 2009
until the end of the school year.
21
(3) Total of all transferred students [sum of
rows (1) and (2)]. 33
(4) Total number of students in the school
as of October 1, 2009 582
(5) Total transferred students in row (3)
divided by total students in row (4). 0.06
(6) Amount in row (5) multiplied by 100. 6
8. Percent limited English proficient students in the school: 8%
Total number of limited English proficient students in the school: 45
Number of languages represented, not including English: 30
Specify languages:
Spanish, Polish, Gujarati, Korean, Arabic, Bulgarian, Urdu, Pilipino (Tagalog), Hindi, Japanese,
Mandarin (Chinese), Panjabi (Punjabi), Bosnian, Farsi (Persian), Italian, Russian, Tamil, Telugu
(Telegu), Albanian, Gheg Assyrian (Syriac, Aramaic), Cambodian (Khmer), Ibo/Igbo, Lithuanian,
Malayalam, Nepali, Romanian, Turkish, Ukrainian, and Vietnamese.
5
11IL6
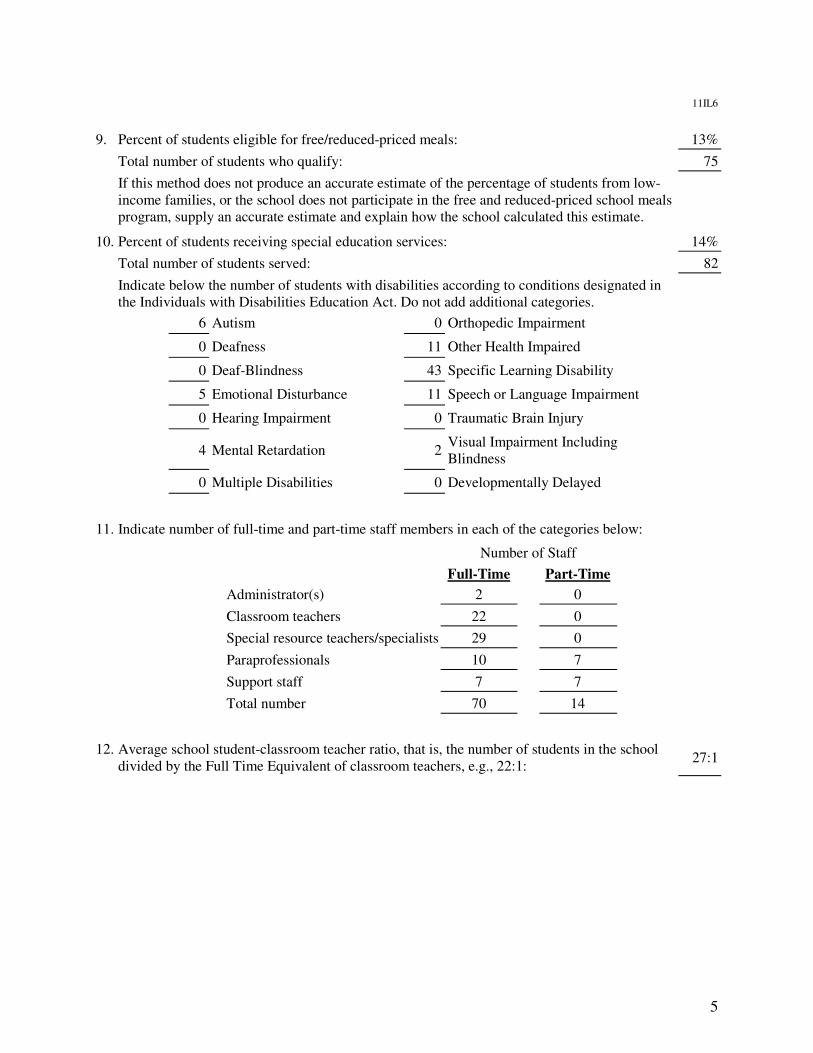
9. Percent of students eligible for free/reduced-priced meals: 13%
Total number of students who qualify: 75
If this method does not produce an accurate estimate of the percentage of students from low-
income families, or the school does not participate in the free and reduced-priced school meals
program, supply an accurate estimate and explain how the school calculated this estimate.
10. Percent of students receiving special education services: 14%
Total number of students served: 82
Indicate below the number of students with disabilities according to conditions designated in
the Individuals with Disabilities Education Act. Do not add additional categories.
6 Autism 0 Orthopedic Impairment
0 Deafness 11 Other Health Impaired
0 Deaf-Blindness 43 Specific Learning Disability
5 Emotional Disturbance 11 Speech or Language Impairment
0 Hearing Impairment 0 Traumatic Brain Injury
4 Mental Retardation 2
Visual Impairment Including
Blindness
0 Multiple Disabilities 0 Developmentally Delayed
11. Indicate number of full-time and part-time staff members in each of the categories below:
Number of Staff
Full-Time
Part-Time
Administrator(s) 2
0
Classroom teachers 22
0
Special resource teachers/specialists 29
0
Paraprofessionals 10
7
Support staff 7
7
Total number 70
14
12. Average school student-classroom teacher ratio, that is, the number of students in the school
divided by the Full Time Equivalent of classroom teachers, e.g., 22:1: 27:1

6
11IL6
13. Show the attendance patterns of teachers and students as a percentage. Only high schools need to
supply graduation rates. Briefly explain in the Notes section any student or teacher attendance rates
under 95% and teacher turnover rates over 12% and fluctuations in graduation rates.
2009-2010 2008-2009 2007-2008 2006-2007 2005-2006
Daily student attendance 95% 95% 96% 96% 96%
Daily teacher attendance 96% 95% 96% 96% 95%
Teacher turnover rate 9% 11% 17% 5% 6%
High school graduation rate 0% 0% 0% 0% 0%
If these data are not available, explain and provide reasonable estimates.
In 2007-2008, a total of six teachers did not return; two teachers retired and one teacher was a visiting
teacher from Spain who had a one-year commitment to teach in the United States. This caused the
teacher turnover rate to be more than 12 percent that year.
14. For schools ending in grade 12 (high schools): Show what the students who graduated in Spring 2010
are doing as of Fall 2010.
Graduating class size: 0
Enrolled in a 4-year college or university 0 %
Enrolled in a community college 0 %
Enrolled in vocational training 0 %
Found employment 0 %
Military service 0 %
Other 0 %
Total 0%
7
PART III - SUMMARY 11IL6
The mission of Frost Junior High School is “In order to prepare students for success beyond junior high
school, Frost works collaboratively to create a positive culture that supports and enriches student
achievement.” Our mission and vision provide us clear direction to achieve results. Our vision states:
• As an exemplary school, we recognize the importance of individual student learning and
achievement.
• As an exemplary school, we recognize that collaboration is vital to our success.
• As an exemplary school, we believe that a positive culture is important in order to facilitate
learning and promote the current and future success of our students.
• As an exemplary school, we establish positive relationships with families, corporations and
organizations.
Frost serves about 600 students in seventh and eighth grades in Schaumburg, Illinois, located 25 miles
west of Chicago. We have a diverse population with 58% White, 14% Hispanic, 14% Asian, 7% Black, 3
percent Native Hawaiian or Other Pacific Islander, 1% American Indian or Alaskan Native and 3%
multiracial students. The demographics have changed over the past 10 years (for example, the student
population was only 75% White in 2000).
Our school is diverse in many other ways. More than 30 different languages are spoken in the homes of
our families, 45 students are English Language Learners, 75 students qualify for free and reduced lunch,
and 82 students receive special education support. These numbers have changed as well. Our low income
population has risen from 2.8% in 2000 to 11.7% in 2010. Our percentage of English Language Learners
has risen from 2.4% in 2000 to 7.9% in 2010.
We celebrate our diversity and are a better school for it. Regardless of their backgrounds, we firmly
believe that all Frost students will learn at high levels. A consistent and viable curriculum exists in all
content areas and systems of support are layered across every element of the school to ensure this occurs.
Struggling readers are provided targeted literacy intervention beyond the core block. Students working
toward proficiency in math receive targeted support on a daily basis in guided math groups. Tiered layers
of support are provided to assist students in homework completion. A timely, targeted and systematic
intervention and enrichment plan is incorporated into the daily schedule to provide support on our
essential outcomes across many content areas. Social-emotional and behavior systems and interventions
are implemented consistently throughout the school to ensure universal behavior expectations are met and
to provide secondary and tertiary supports for students who need small group and one-on-one supports.
These layers of support have enabled us to increasingly work toward ensuring the success of every
student at Frost.
We have established a positive and collaborative culture where collaborative team members work
interdependently to achieve common goals. The goals are focused on high levels of learning for all
students. Frost is the only 95-95-95 school in our district, meaning 95 percent of our students met or
exceeded state standards on the Illinois reading, math and science assessments in 2010.
We believe strongly in recognizing our students, staff and community for their many accomplishments.
8
Frost has adopted Positive Behavioral Interventions & Supports (PBIS) – a proactive, schoolwide system
that teaches appropriate behavior throughout the school. Students receive tickets when they demonstrate
our “Spartan Standards” which are the universal expectations of behavior to “Be Safe, Be Respectful, and
Be Responsible.” Students are also acknowledged on a regular basis with Character Counts! Awards for
demonstrating the “Six Pillars of Character.”
Frost administrators recognize teachers for supporting students and helping implement our mission and
vision. Teachers also recognize each other, and school volunteers, for promoting our goals and supporting
student success.
Awards, Accomplishments and Recognition:
2010-11 School Year
• Named one of five Evidence of Effectiveness schools by http://allthingsplc.info
• Selected a Top 50 Middle School in Illinois – Chicago Sun-Times
• Recommended to U.S. Secretary of Education Arne Duncan as one of three schools to visit to
observe PBIS implementation
• Selected to present at the local, state and national PBIS conferences
• Illinois Academic Excellence Award (90%of students met or exceeded standards in reading and
math for the three most recent school years on state assessments)
2009-10 School Year
• 95-95-95 School Recognition (95% of students met or exceeded standards in reading, math and
science on state assessments)
• Illinois Academic Excellence Award (90% of students met or exceeded standards in reading and
math for the three most recent school years on state assessments)
• PBIS Implementing Award
2008-2009 School Year
• PBIS Emerging Award
• 90-90 School Recognition (90% of students met or exceeded standards in reading and math on
state assessments)
2007-08 School Year
• 2007 Academic Improvement Award (Awarded for making substantial gains)
9
PART IV - INDICATORS OF ACADEMIC SUCCESS 11IL6
1. Assessment Results:
Every student at Frost Junior High participates in national, state, local and school assessments. Frost
students achieve at high levels on all of these assessments. All students take the Illinois Standards
Achievement Test (ISAT) in reading and math. The tables included in this application show the
percentages of students meeting or exceeding state standards on this assessment. The ISAT measures
individual student achievement relative to the Illinois Learning Standards. The results offer one measure
of student learning and school performance. The student’s score is placed in one of the following four
categories:
• Exceeds Standards – Demonstrates advanced knowledge and skills in the subject;
• Meets Standards – Demonstrates proficient knowledge and skills in the subject;
• Below Standards – Demonstrates basic knowledge and skills in the subject; and
• Academic Warning – Demonstrates limited knowledge and skills in the subject.
Information about the ISAT and results can be found at www.isbe.net and http://iirc.niu.edu/.
The number of Frost students meeting or exceeding standards on ISAT has increased from 85 percent in
reading in 2005-06 to 96 percent in 2009-10. In math 92 percent met or exceeded in 2005-06 and now 97
percent meet or exceed standards. With these results, Frost meets the standards of No Child Left Behind.
Frost has made substantial gains with all of our subgroups that were once performing below the school
average. In 2005-06, 86 percent of our Hispanic students met or exceeded state standards in math and 80
percent met or exceeded state standards in reading. In 2009-10, 92 percent of our Hispanic students met
or exceeded state standards in math and 91 percent met or exceeded state standards in reading. We are
proud to state that no gaps exit among any subgroup with Frost in math.
While there was a 10 percentage point difference between our all-school reading results and the results of
our special education students and socio-economically disadvantaged students last year, we have closed
the gap significantly. The number of special education students meeting or exceeding standards in reading
rose to 86% in 2009-12 from 53% in 2008-09, an increase of 33%. Our socio-economically disadvantaged
students improved their reading scores by 11% in one year – from 75% meets and exceeds in 2008-09 to
86% in 2009-10.
Our African American subgroup shows a gap of 13%, however those students improved by 7% from
2008-09 to 2009-10. Our English Language Learners have a gap of 20%, however those students
improved by 17% from 2008-09 to 2009-10. While both groups made significant progress, we will
continue to provide resources and support to further close these gaps.
The substantial gains with students who are in the special education, socio-economically disadvantaged,
ELL or African American subgroups are a result of systems and interventions that support student
learning, such as:
• Students are mainstreamed for all classes. We discontinued self-contained special education and
remedial classes. All students now take classes enabling them to be on track for rigorous high
school courses in preparation for college.
10
• Every student reading below grade level is individually scheduled into appropriate core classes
and interventions to ensure proper supports are available. Students needing special education or
English language support are scheduled in specific co-taught classes.
• Students reading below grade level receive targeted support for 40 or 80 minutes beyond the core
curriculum in reading intervention classes.
• Timely, targeted and systematic intervention is available twice a week for students not
demonstrating proficiency in core classes.
• Students receive layered homework interventions. Students with missing assignments attend a
working lunch with teacher support. When this intervention is not enough, students receive a
guided study hall and after-school tutoring to complete assignments. We do not give students 0
grades for late assignments. We expect assignments to be completed. Assignments turned in late
are guaranteed to earn a passing grade.
• Positive behavior supports and systems support all students. These proactive practices have
resulted in a 100% reduction in suspensions and major increases in instructional time.
Every grade, subject and subgroup of students at Frost has made significant academic improvements since
2005-06. We have also achieved substantial growth gains on the Northwest Education Association
Measures of Academic Progress (MAP) test, which allows us to monitor both growth and proficiency
three times each year. Our growth scores in 2009-10 were above the 95th percentile nationwide in seventh
and eighth grade math and reading. Students at Frost are not only performing at high levels, but making
substantial growth. Information from MAP, ISAT and our common assessments guides instruction and
allows us to intervene and enrich lessons to meet the needs of all students.
2. Using Assessment Results:
Frost uses assessment data to drive our school improvement processes. Before school begins in August,
Frost teachers analyze the data from the Illinois Standards Achievement Test (ISAT). Data is
disaggregated to evaluate strengths and areas in need of improvement in teaching and learning.
In addition, staff uses results from an individualized achievement test – Measures of Academic Progress
(MAP) – which District 54 administers three times a year. MAP assists our staff in monitoring student
learning and growth. Students discuss their academic goals related to MAP regularly with their teachers.
Teachers also use this information to flexibly group students for guided reading and guided math
activities to most effectively intervene and enrich students.
Each grade-level team uses the ISAT and MAP results to set departmental SMART (Specific,
Measurable, Attainable, Realistic and Time specific) goals. The results also help drive our common
formative assessments.
Common assessments are the primary way Frost teachers monitor student learning. The process begins
within the Professional Learning Community (PLC) team in each subject area. The teachers from general,
bilingual and special education identify the most important standards to be tested. The 10 to 12 standards
typically identified per trimester are based on the Illinois State Learning Standards and the District 54
Essential Outcomes. Common assessments are developed from these essential outcomes. The goal for
Frost staff is to ensure student learning on all of our essential outcomes in each subject area as measured
by our common assessments.
The cycle begins with teachers creating the common assessment. Each common assessment typically tests
for one to three essential outcomes, with five to seven questions per skill. This ensures the students know
the essential outcome. Teachers implement lesson plans aligned with these standards. After these lessons
have been taught, students take the assessment and teachers analyze the results noting which students
11
were proficient and which fell below mastery for each standard. Re-teaching and enrichment days follow
each assessment to ensure students who fell below mastery level receive timely intervention. Teams
consider which skills need to be reinforced and plan how to re-teach the skills. They ask the following
questions: What teacher was most effective in teaching the skill? What teaching strategy was most
effective? How was it taught? What materials will be used to re-teach? How will students be re-assessed?
Following timely intervention, a re-assessment of the essential outcomes is given. This cycle repeats until
all students have reached mastery level.
3. Communicating Assessment Results:
At the beginning of each school year, Frost staff share student assessment data, our curriculum and
essential outcomes, and the goals of the School Improvement Plan with the community through a variety
of events at school.
A parent information night is held before the school year begins which allows our principal, department
chairs and other teacher leaders to share our assessment results and academic goals for the upcoming
school year. We also brief the parents on our curriculum and answer questions about student learning
expectations.
Curriculum Night is an opportunity for parents to tour the building; follow their child’s schedule; and
meet with all of their child’s teachers. The teachers discuss the essential outcomes all students are
expected to know and how the students will be assessed to monitor progress. Similar information is
presented in Spanish.
Student-led conferences typically occur in October and February and allow our students to lead a goal-
setting meeting with their parents and teachers. All involved work together to determine areas for growth
and establish a plan for improvement. The students are largely focused on their academic and MAP
growth when setting goals with their parents and teachers.
Parents also receive regular communication through frequent principal emails, newsletters, website
stories, Parent Teacher Association (PTA) meetings, student grade sheets, and student report cards. The
principal emails the community one to two times per month and frequently provides updates about
common summative assessments, MAP and ISAT results, and student behavior progress.
Our website (http://frost.sd54.org) contains links to the school newsletter, updates from the principal,
morning announcements and the state report card. The report card shares information about student
learning data, demographic, financial and instructional information about the school, district and state.
Our PTA meetings allow for similar information to be shared and explained. We have also focused as a
school on regularly updating our parents about their child’s progress. Our families receive three report
cards and updated grade sheets every month. This allows for regular communication about student
progress. Parents can also view daily blogs on our website that provide additional information about
learning.
Students take an active role in their own learning. At the conclusion of every standardized test and
common assessment, our students either conference with their teacher or participate in a reflective
feedback process. We know that it is essential that our students understand their areas of strength and
where they need to improve.
4. Sharing Lessons Learned:
Frost believes strongly in sharing our strategies and systems with schools everywhere. We work with schools in
our own district on a regular basis to share our strategies and we regularly host visitors from schools and
districts throughout Illinois and around the world from as far away as Taiwan. Our principal and teacher leaders
regularly present at conferences and workshops to help other schools improve. The Frost teachers and
12
administrators have been featured presenters at workshops in the areas of Positive Behavior Intervention &
Supports (PBIS), PLC, literacy, MAP implementation, guided math and co-teaching.
• Frost staff has hosted visitors to observe our PBIS systems and presented at state conferences
about the major improvements in student behavior and increases in students remaining in class
and learning. The presentations shared strategies to support student behavior at the Universal,
Secondary and Tertiary levels.
• Frost staff has presented at PLC conferences with Drs. Rick and Becky DuFour to share our
academic systems of intervention and our academic gains in every subgroup. Groups have visited
Frost to learn about our common assessment processes and to observe our PLC teams
collaborating around student learning topics. Frost’s PLC work will be featured in training videos
via Pearson publishing.
• Frost has utilized goal-setting practices to achieve academic growth on the MAP test at the 99th
percentile nationwide. Teacher leaders from Frost have taught our systems and strategies to
educators throughout our district.
• Guided math allows our teachers to utilize small group structures to scaffold instruction for all of
our math students. Frost teacher leaders will be presenting at the NCTM math conference in St.
Louis this year and regularly host guests to observe our guided math practices.
• Our co-teaching systems have enabled us to mainstream all students with special needs and all
students who are English Language Learners (ELL) to achieve unprecedented success. Schools
visit Frost to observe our co-teaching methods, and some of our co-teaching teams have recorded
their methods and strategies for Pearson publishing.
13
PART V - CURRICULUM AND INSTRUCTION 11IL6
1. Curriculum:
Dedication and commitment to student success are the driving principles of all staff at Frost. All students
are held to the highest standards and supported to reach their full potential. Best practices of instruction
are implemented in each content area to engage and meet the individual needs of each learner. The
essential outcomes of literacy are embedded throughout each curricular area to develop competent, life-
long readers and writers. Instruction is differentiated through guided groups and practice to support
individual student needs. Our special education and bilingual staff co-teach within classrooms to provide
assistance to all learners. Technology is an invaluable resource that provides assistance to all students.
Students are placed on one of four core teams. All students on a team usually have the same teachers for
math, science and social studies. They each have one of the team’s two language arts teachers. Each team
works together to meet the academic and social emotional needs of each student. Staff members on these
teams also draw upon the support of administration, special education and ELL teachers, reading
intervention teachers, a literacy coach, a psychologist, two social workers and a speech and language
therapist.
Frost ensures that no student is left behind by providing systematic blocks of time where students are
given additional interventions. Students who fall below the 40th percentile, based on the MAP assessment,
are given an additional 40 to 80 minutes of literacy instruction. These reading intervention classrooms
pre-teach essential literacy outcomes which help students build prior knowledge. In addition,
opportunities for support are provided twice a week in the master schedule to core content areas to enable
students to receive timely and systematic intervention and enrichment. Formative assessments help
teachers identify those students who may need additional time and practice on a particular skill. After-
school opportunities are also provided such as reading, math, and science clubs.
A balanced literacy approach to instruction provides the framework to help all students become effective
readers and writers. At Frost, at least 80 minutes a day is devoted to literacy instruction. The curriculum
taught as part of a comprehensive core curriculum was adopted by District 54 in 2006. The research-
based comprehensive literacy series, Language of Literature from McDougal Littell, is the core of the
balanced literacy program. This series supports instruction in the key literacy components: fluency,
vocabulary and comprehension. A balanced literacy approach provides students with daily reading and
writing activities to help them comprehend essential skills and communicate more effectively. Within the
balanced model, students participate in daily shared reading, guided reading, independent reading, read
alouds, word study and writing.
Math teachers guide students to solve problems and continue to develop critical thinking strategies
introduced and developed in elementary school. Students continue developing proficiency in the areas of
number sense, measurement, algebra, geometry and data analysis, as prescribed by both the National
Council of Teachers of Mathematics (NCTM) standards and Illinois Learning Standards. Exemplars and
problem-solving help students apply mathematics to a real-world context. Teachers use a concrete,
representational, abstract instructional approach to build a solid foundation in mathematics. Students are
asked to communicate and justify their mathematical thinking through written and spoken language. A
guided math approach to teaching is also incorporated within each classroom to enhance learning for all
students by providing intervention or enrichment opportunities.
Frost’s science curriculum is an inquiry-based, hands-on learning experience, with instruction provided
from Holt Science & Technology program. The goal is to engage students in the work of a scientist
through exploration, explanation, elaboration and evaluation. Frost’s teachers integrate trade books and
use interactive texts to develop background knowledge and enhance the understanding of scientific
concepts.
14
The social science curriculum American Journey by Glencoe/McGraw-Hill provides students with
opportunities to understand historical, economic and political components of the world. Text materials
and simulations provide highly engaging explorations that encourage the study of culture in the context of
real world social science.
Spanish World Language instruction at Frost is driven by the Illinois Foreign Language Standards and is
available to all students. Students are provided with daily opportunities to read, write, listen and speak
Spanish. Interactive classrooms blend language learning and cultural exploration to prepare students for
the global workforce. Avancemos, the Spanish textbook, is supplemented with a variety of technological
and cultural resources such as ProQuest and United Streaming. At Frost, 169 students are enrolled in
Spanish I and 167 students are enrolled in Spanish II.
Daily physical education and health instruction provide students with the knowledge and ability needed to
maintain active, healthy lifestyles. Instruction is differentiated to student needs, abilities and interests.
Fine arts instruction further develops the cultural knowledge and skills of Frost students. Elective course
offerings provide students with the opportunity to explore a variety of fine arts including art, music,
orchestra, choir, band and media production.
2. Reading/English:
Frost has a balanced literacy philosophy that meets the needs of all learners with high expectations for
success. Our focus includes shared, guided, independent reading, word study and writing. The ultimate
goal is for all readers and writers to become proficient and successful.
Shared reading and read alouds are instructional approaches where the teacher models strategies and
skills. Students are introduced to a variety of genres and texts to help strengthen their skills as readers. At
the junior high level, we follow a roadmap that includes selections that focus on our district essential
outcomes and Illinois Learning Standards. Teachers model reading strategies to increase reading
comprehension, vocabulary and fluency. Students react and reflect through meaningful conversations that
allow the teacher to assess their learning.
A critical component of balanced literacy is guided reading. Students work daily in small, flexible groups
facilitated by the teacher at the student’s instructional reading level. This gives students an opportunity to
apply the strategies they know to new text with the teacher providing support. As students begin to
analyze text, they increase their ability to improve their comprehension, vocabulary and word analysis
skills. At-risk students receive targeted instruction on a daily basis in guided reading.
Through independent reading, students continue to apply reading strategies and skills. The books and
materials chosen are at a reading level that students can comprehend while expanding vocabulary and
instilling an intrinsic enjoyment for reading as they gain meaning.
Writing is essential for good communication. The teacher models and demonstrates the process of putting
ideas into written language using a variety of mini-lessons that focus on the writing process. The learners
develop their ideas to write multiple paragraphs. Students are given opportunities to engage in purposeful
writing using narrative, expository and persuasive structures to communicate for a variety of purposes.
Frost provides a variety of ways for students to become proficient readers and writers. Students are
introduced daily to a variety of texts that promote comprehension. Whether they are working in a small
group or receiving direct instruction in a large group setting, students are challenged to become better
readers, writers and thinkers. As our students look to the future, they see the value in reading and writing
as lifelong skills that promote and encourage success. Frost’s balanced literacy approach ensures all
students’ needs are not only met, but that students are pushed to achieve high standards.
15
3. Mathematics:
Math instruction at Frost is based on the Holt McDougal-Littell Middle School and High School
Mathematics program. This curriculum allows all students to experience a full year of algebra.
Seventh-grade students are placed in a pre-algebra class, an accelerated pre-algebra class or an
accelerated algebra I class. Eighth-grade students are placed in an algebra class, an accelerated algebra I
class or an accelerated geometry class.
The geometry class is aligned with the freshman high school course. Teachers use the same book and
assessments. High school staff trained the junior high teachers to implement this class with the same rigor
as the high school. Students taking the high school level class at Frost have access to more AP classes in
mathematics during high school.
The mathematics department regularly articulates with the high schools that eighth-grade students will
attend to continually improve instruction.
Frost students receive 60 minutes of math daily. There are no remedial or lower level classes. However,
resource teachers co-teach pre-algebra and eighth grade algebra classes. All math classes follow a guided
math model ensuring that students receive individualized and differentiated instruction daily.
Pre-assessments are administered at the start of each unit. The results of these assessments coupled with
MAP data enables teachers to accurately group students based on need. Whole group instruction takes
place during the first half of each class. Guided math occurs during the second half. During guided math,
students work independently or in teacher-directed small groups. At-risk students receive explicit,
scaffolded instruction from the teacher during this time.
At the end of each unit, math PLCs analyze assessment results and determine which strategies were most
effective. Students who did not show mastery of the essential skills will be re-taught using the strategies
discussed by the PLC. Students who were proficient will participate in enrichment activities. Setting time
aside for intervention and enrichment ensures that students are not missing new instruction while being
re-taught. Constant evaluation of student data prevents students from being tracked throughout their
junior high experience
Math teachers meet with students several times a trimester to set individual goals for improvement and
discuss strategies for achieving these goals. During this time, teachers and students discuss MAP results
to see where progress has been made and which areas need improvement. Teachers and students look at
the number sense, geometry, data and probability, algebra, and measurement strands.
4. Additional Curriculum Area:
Holt Science & Technology is the core science program at Frost. Concepts are presented in an age-
appropriate, engaging way that builds on prior knowledge and develops background for students to
participate successfully in a scientific and technological society.
Teachers integrate other curricular areas, in a multidisciplinary approach, into the science classroom.
Teachers collaboratively plan and develop inquiry-based activities that align classroom instruction to
investigations completed during laboratory activities. While engaged in laboratory investigations, students
cooperatively create personal and real-world connections, and have opportunities to debate and research
before making hypotheses or drawing conclusions. Students use the scientific method of inquiry by
collecting data, identifying controlled and experimental variables, designing an experiment and
identifying trends in the data. The seventh-grade science curriculum focuses on inheritance and variation
of traits, molecules to organisms: structures and processes, and structure and properties of matter. In
eighth grade, students learn about human interactions with Earth, energy and transformations,
interactions, stability and change and the solar system, galaxy and universe.
16
Frost science teachers participate in the College Board’s Pre-AP: Strategies in Science – Creating a
Learner-Centered Classroom training. Teachers learned specific strategies to address inquiry-based
learning, improve inductive thinking, discern discrepant events and write dynamic problems. By
integrating these strategies into their daily science instruction, teachers provide the foundational skills
necessary for students to be successful in high school science AP courses.
Science teachers also promote an interest in science, technology, engineering and mathematics fields for
adolescent girls through the Girls in Engineering, Math and Science (GEMS) program. The program,
funded by a Motorola grant, applies content and skills learned in the classroom to the interests and
experiences of the participants. Girls investigate crime scenes, discuss forensic evidence, build simple
machines and roller coasters to model laws of physics, and analyze the ingredients of perfume and
develop their own version.
Frost also offers Project Lead the Way, a summer program with the high school district for students
entering eighth grade. This pre-engineering program explores robotics, electronics and drafting and
design software. Frost students also participate in the National Fluid Power Association’s Power Fluid
Challenge sponsored by our community college. Teams of boys and girls built a machine that moved an
objecting using hydraulics. Frost reaches out to community resources to enhance its science instruction
and expose students to science and technology careers.
5. Instructional Methods:
The PLC framework guides all instructional practice taking place at Frost. All teachers have been trained
directly by Drs. Rick and Becky DuFour on PLC and utilize collaborative processes to
• Clarify essential learning outcomes in each subject and grade level.
• Develop common assessments to measure student proficiency levels of essential learning
outcomes in each subject and grade level.
• Provide differentiated supports in the form of intervention or enrichment based on the results of
common assessments.
Students at Frost are encouraged to learn cooperatively, and independently, with assistance from a variety
of adults during large group, small group and independent instruction. The school day is structured with
the knowledge that students receive and process information differently and at varying rates.
Differentiation is imperative. Modifications and accommodations are made for students that are at-risk
and enrichment is provided for students who benefit from extending concepts.
A daily intervention and enrichment block is part of Frost’s master schedule. This provides additional
doses of time and support to students in need of Tier 2 and Tier 3 interventions. This time is also set aside
for enrichment and extension lessons for students demonstrating mastery of grade-level appropriate skills.
Tiered homework interventions are in place throughout the school day to maximize student work
completion.
Data from in-house, district and state assessments is collected and systematically reviewed by all grade-
level teams as teachers provide differentiated supports to meet the needs of each student. All teachers can
identify those students at risk academically by name and the specific area where they need to improve.
Students set specific academic goals in reading and math and reflect upon their progress toward these
goals at regular intervals throughout the year. Furthermore, students’ self-assessment and reflection of
their achievement on common assessments helps increase critical thinking and problem-solving skills,
which ultimately helps students see important connections between their academic careers and lives.
Frost teachers are aware that professional pedagogical toolboxes must include a depth and breadth of
strategies, such as flexible and cooperative grouping and conferring with students on an individual basis,
17
as well as small group and whole class direct instruction. The staff at Frost continues to investigate
effective ways to impact student learning and achievement. Teachers continuously improve their
instructional practices by observing their co-workers and other schools. PLCs work together to determine
interesting and valuable ways to model and facilitate students through the learning process.
6. Professional Development:
Frost’s professional staff development program is aligned with its School Improvement Plan. Frost’s
current improvement plan, which was developed by the entire staff, sets forth four goals:
• We will increase student performance in math with an emphasis on math achievement for
students with disabilities and students who receive free or reduced lunch.
• We will increase student performance in reading with an emphasis on reading achievement for
students with disabilities and students who receive free or reduced lunch.
• We will increase student performance in writing.
• Every student in every class will display a predetermined proficiency level on every essential
outcome aligned common assessment.
Frost has a School Leadership Team (SLT) that consists of administrators, staff members and a parent.
The SLT is responsible for supporting the continued education of staff members on the most current
research into the best instructional practices. The SLT also plans and delivers in-service training by
analyzing progress toward the goal of the School Improvement Plan.
The Frost staff has participated in training to become a PLC. A PLC framework consists of building a
solid foundation of collaboratively developed instructional goals and professional values to provide an
opportunity for all students to learn. The SLT utilizes staff development time to create effective and
efficient PLCs. Time is devoted to working together to analyze data and research, to discuss and to
improve instruction in order to make an impact on student achievement. One 90-minute staff development
session occurs each week. This time is used not only for PLCs, but also for the whole staff to come
together to focus on data analysis, differentiation, integrating technology and the understanding of Frost’s
curricular areas. The major staff development areas we have focused on to improve student achievement
are Quantum learning, World of Difference training, co-teaching, PLC, PBIS, guided reading and math,
supporting students who live in poverty, and writing across the curriculum.
Staff also benefits from District 54’s professional development program. This program begins with new
teacher mentoring. It also includes in-district training in terms of in-services and Salary Lane classes, as
well as opportunities to attend out-of-district workshops and conferences. Staff attending workshops
outside of the school building shares new knowledge gained with colleagues.
7. School Leadership:
The mission of Frost is “In order to prepare students for success beyond junior high school, Frost works
collaboratively to create a positive culture that supports and enriches student achievement.” Our mission
was developed collaboratively and drives everything we do at Frost. It mirrors our priorities and guides us
as leaders.
The Frost SLT is composed of our school administrators and teacher leaders representing a multitude of
departments and all grade levels. The primary focus of our SLT is to lead the process of accomplishing
the goals in our School Improvement Plan.
Our SLT led the collaborative process of developing our mission and vision. This was achieved through
collective inquiry into best practices, a thorough analysis of school data, building the capacity of our staff
18
to understand its purpose, and consensus building. Our SLT has also implemented interventions and an
enrichment program that is timely, targeted and systematic.
We recognized the need to ensure the success of all of our students. The SLT provides the support and
dedication staff needs to implement changes to accomplish our mission and achieve the goals in our
School Improvement Plan.
Our SLT also understands the importance of a positive school culture and has made staff recognition a
priority. This area was identified through a survey given to all staff. Through their leadership, teams
recognize teachers and students; staff members recognize each other; and administrators regularly
recognize individual staff members, teams, and the whole staff for our many accomplishments (2009 and
2010 Illinois Academic Excellence Award, 95 percent or more students meeting/exceeding standards on
the state assessment in reading and math, PBIS Implementing Award, Ranked in the Top 50 Illinois
Middle Schools, etc). This focus on those who help meet our mission and vision has led to improving
student achievement.
The Frost principal is responsible for supporting the staff, students and community in achieving our
mission and carrying out the goals in our School Improvement Plan. He is responsible for establishing an
environment that allows teachers to teach and students to learn. He commits our time and resources into
the systems and philosophies we believe (and research suggests) will result in improved student learning:
PBIS, PLCs, proactive student problem solving (Response to Intervention), and positive student and staff
morale through recognition. Our principal is responsible for supporting our staff and our community so
we can ensure every student is successful.
19
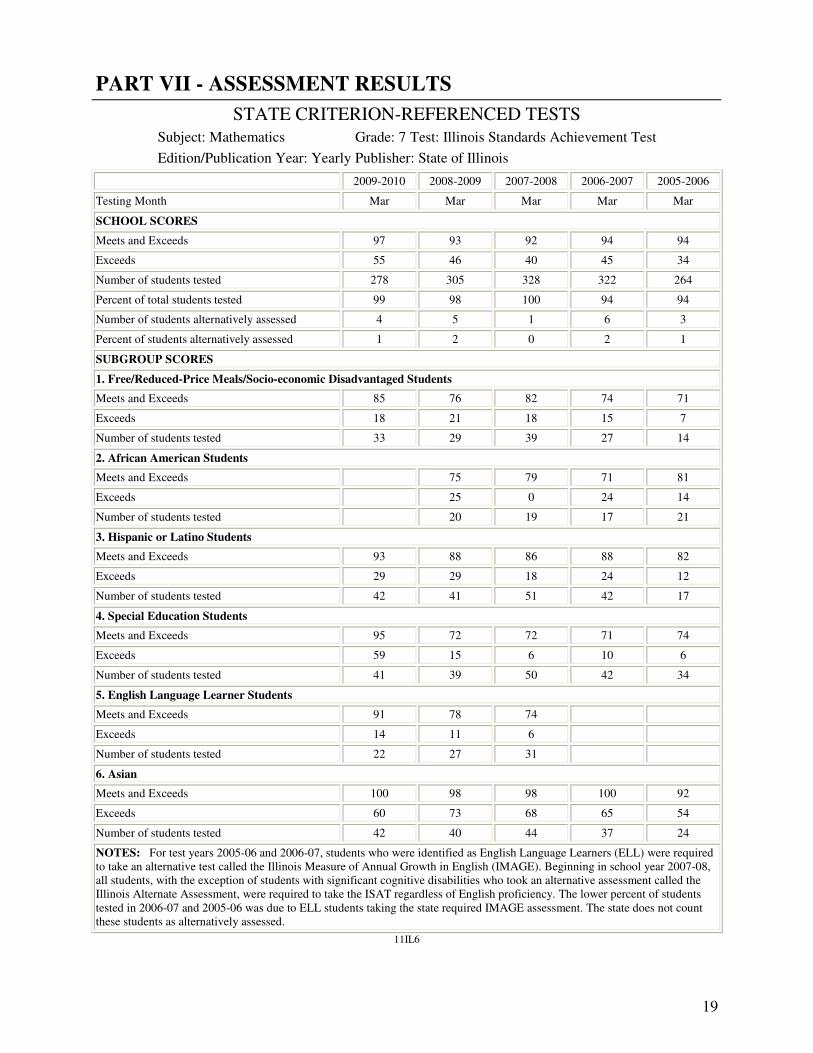
PART VII - ASSESSMENT RESULTS
STATE CRITERION-REFERENCED TESTS
Subject: Mathematics Grade: 7 Test: Illinois Standards Achievement Test
Edition/Publication Year: Yearly Publisher: State of Illinois
2009-2010 2008-2009 2007-2008 2006-2007 2005-2006
Testing Month Mar Mar Mar Mar Mar
SCHOOL SCORES
Meets and Exceeds 97 93 92 94 94
Exceeds 55 46 40 45 34
Number of students tested 278 305 328 322 264
Percent of total students tested 99 98 100 94 94
Number of students alternatively assessed 4 5 1 6 3
Percent of students alternatively assessed 1 2 0 2 1
SUBGROUP SCORES
1. Free/Reduced-Price Meals/Socio-economic Disadvantaged Students
Meets and Exceeds 85 76 82 74 71
Exceeds 18 21 18 15 7
Number of students tested 33 29 39 27 14
2. African American Students
Meets and Exceeds
75 79 71 81
Exceeds
25 0 24 14
Number of students tested
20 19 17 21
3. Hispanic or Latino Students
Meets and Exceeds 93 88 86 88 82
Exceeds 29 29 18 24 12
Number of students tested 42 41 51 42 17
4. Special Education Students
Meets and Exceeds 95 72 72 71 74
Exceeds 59 15 6 10 6
Number of students tested 41 39 50 42 34
5. English Language Learner Students
Meets and Exceeds 91 78 74
Exceeds 14 11 6
Number of students tested 22 27 31
6. Asian
Meets and Exceeds 100 98 98 100 92
Exceeds 60 73 68 65 54
Number of students tested 42 40 44 37 24
NOTES: For test years 2005-06 and 2006-07, students who were identified as English Language Learners (ELL) were required
to take an alternative test called the Illinois Measure of Annual Growth in English (IMAGE). Beginning in school year 2007-08,
all students, with the exception of students with significant cognitive disabilities who took an alternative assessment called the
Illinois Alternate Assessment, were required to take the ISAT regardless of English proficiency. The lower percent of students
tested in 2006-07 and 2005-06 was due to ELL students taking the state required IMAGE assessment. The state does not count
these students as alternatively assessed.
11IL6

20
STATE CRITERION-REFERENCED TESTS
Subject: Reading Grade: 7 Test: Illinois Standards Achievement Test
Edition/Publication Year: Yearly Publisher: State of Illinois
2009-2010 2008-2009 2007-2008 2006-2007 2005-2006
Testing Month Mar Mar Mar Mar Mar
SCHOOL SCORES
Meets and Exceeds 96 85 87 87 78
Exceeds 37 29 26 23 16
Number of students tested 276 301 330 321 264
Percent of total students tested 99 98 100 94 94
Number of students alternatively assessed 4 5 1 6 3
Percent of students alternatively assessed 1 2 0 2 1
SUBGROUP SCORES
1. Free/Reduced-Price Meals/Socio-economic Disadvantaged Students
Meets and Exceeds 82 64 72 59 50
Exceeds 9 7 10 0 0
Number of students tested 33 28 39 27 14
2. African American Students
Meets and Exceeds 80 65 75 65 52
Exceeds 10 15 5 18 14
Number of students tested 10 20 20 17 21
3. Hispanic or Latino Students
Meets and Exceeds 88 77 73 76 65
Exceeds 15 23 8 7 12
Number of students tested 41 39 52 42 17
4. Special Education Students
Meets and Exceeds 93 47 50 45 35
Exceeds 17 13 6 5 3
Number of students tested 42 38 50 42 34
5. English Language Learner Students
Meets and Exceeds 63 58 52
Exceeds 5 4 0
Number of students tested 19 24 31
6. Asian
Meets and Exceeds 95 87 93 95 75
Exceeds 40 36 41 38 8
Number of students tested 40 39 44 37 24
NOTES: For test years 2005-06 and 2006-07, students who were identified as English Language Learners (ELL) were required
to take an alternative test called the Illinois Measure of Annual Growth in English (IMAGE). Beginning in school year 2007-08,
all students, with the exception of students with significant cognitive disabilities who took an alternative assessment called the
Illinois Alternate Assessment, were required to take the ISAT regardless of English proficiency. The lower percent of students
tested in 2006-07 and 2005-06 was due to ELL students taking the state required IMAGE assessment. The state does not count
these students as alternatively assessed.
11IL6
21
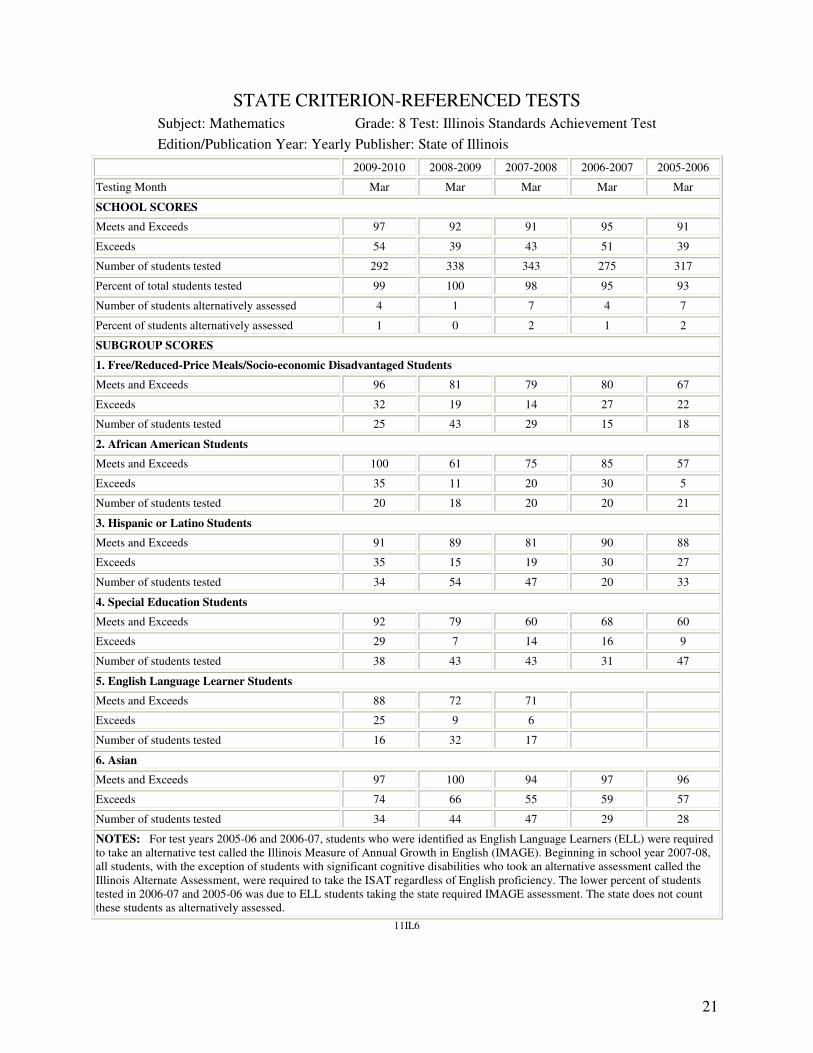
STATE CRITERION-REFERENCED TESTS
Subject: Mathematics Grade: 8 Test: Illinois Standards Achievement Test
Edition/Publication Year: Yearly Publisher: State of Illinois
2009-2010 2008-2009 2007-2008 2006-2007 2005-2006
Testing Month Mar Mar Mar Mar Mar
SCHOOL SCORES
Meets and Exceeds 97 92 91 95 91
Exceeds 54 39 43 51 39
Number of students tested 292 338 343 275 317
Percent of total students tested 99 100 98 95 93
Number of students alternatively assessed 4 1 7 4 7
Percent of students alternatively assessed 1 0 2 1 2
SUBGROUP SCORES
1. Free/Reduced-Price Meals/Socio-economic Disadvantaged Students
Meets and Exceeds 96 81 79 80 67
Exceeds 32 19 14 27 22
Number of students tested 25 43 29 15 18
2. African American Students
Meets and Exceeds 100 61 75 85 57
Exceeds 35 11 20 30 5
Number of students tested 20 18 20 20 21
3. Hispanic or Latino Students
Meets and Exceeds 91 89 81 90 88
Exceeds 35 15 19 30 27
Number of students tested 34 54 47 20 33
4. Special Education Students
Meets and Exceeds 92 79 60 68 60
Exceeds 29 7 14 16 9
Number of students tested 38 43 43 31 47
5. English Language Learner Students
Meets and Exceeds 88 72 71
Exceeds 25 9 6
Number of students tested 16 32 17
6. Asian
Meets and Exceeds 97 100 94 97 96
Exceeds 74 66 55 59 57
Number of students tested 34 44 47 29 28
NOTES: For test years 2005-06 and 2006-07, students who were identified as English Language Learners (ELL) were required
to take an alternative test called the Illinois Measure of Annual Growth in English (IMAGE). Beginning in school year 2007-08,
all students, with the exception of students with significant cognitive disabilities who took an alternative assessment called the
Illinois Alternate Assessment, were required to take the ISAT regardless of English proficiency. The lower percent of students
tested in 2006-07 and 2005-06 was due to ELL students taking the state required IMAGE assessment. The state does not count
these students as alternatively assessed.
11IL6
22
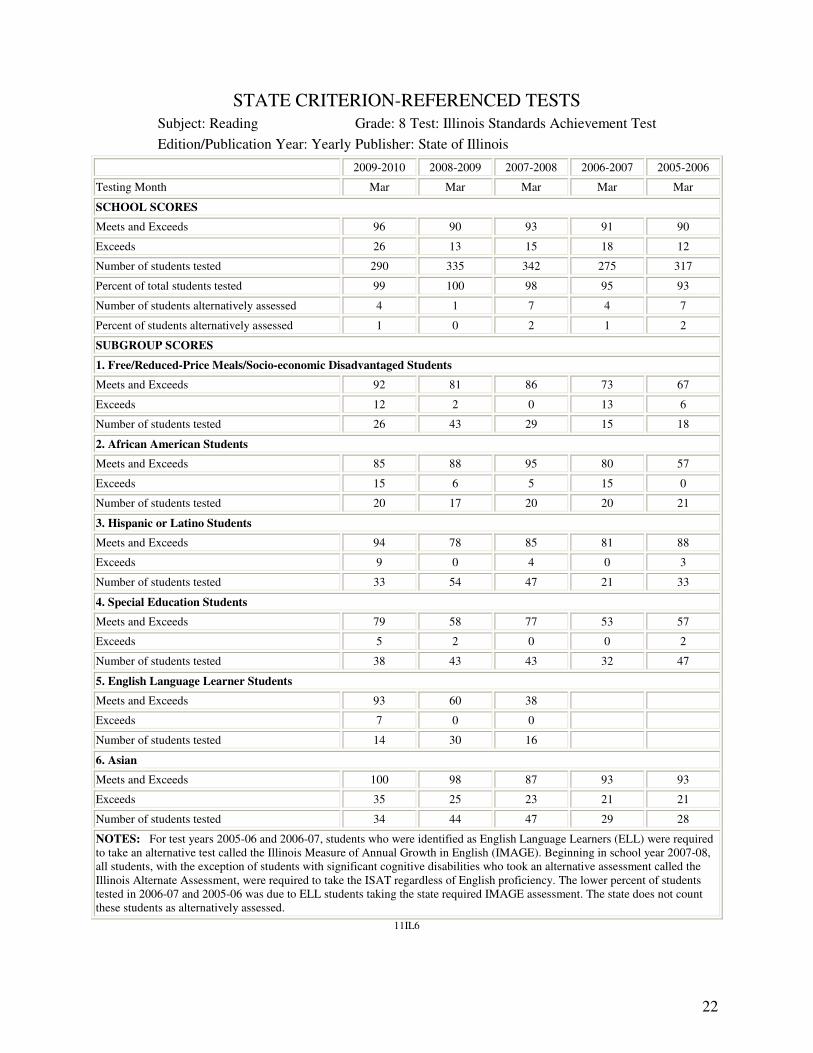
STATE CRITERION-REFERENCED TESTS
Subject: Reading Grade: 8 Test: Illinois Standards Achievement Test
Edition/Publication Year: Yearly Publisher: State of Illinois
2009-2010 2008-2009 2007-2008 2006-2007 2005-2006
Testing Month Mar Mar Mar Mar Mar
SCHOOL SCORES
Meets and Exceeds 96 90 93 91 90
Exceeds 26 13 15 18 12
Number of students tested 290 335 342 275 317
Percent of total students tested 99 100 98 95 93
Number of students alternatively assessed 4 1 7 4 7
Percent of students alternatively assessed 1 0 2 1 2
SUBGROUP SCORES
1. Free/Reduced-Price Meals/Socio-economic Disadvantaged Students
Meets and Exceeds 92 81 86 73 67
Exceeds 12 2 0 13 6
Number of students tested 26 43 29 15 18
2. African American Students
Meets and Exceeds 85 88 95 80 57
Exceeds 15 6 5 15 0
Number of students tested 20 17 20 20 21
3. Hispanic or Latino Students
Meets and Exceeds 94 78 85 81 88
Exceeds 9 0 4 0 3
Number of students tested 33 54 47 21 33
4. Special Education Students
Meets and Exceeds 79 58 77 53 57
Exceeds 5 2 0 0 2
Number of students tested 38 43 43 32 47
5. English Language Learner Students
Meets and Exceeds 93 60 38
Exceeds 7 0 0
Number of students tested 14 30 16
6. Asian
Meets and Exceeds 100 98 87 93 93
Exceeds 35 25 23 21 21
Number of students tested 34 44 47 29 28
NOTES: For test years 2005-06 and 2006-07, students who were identified as English Language Learners (ELL) were required
to take an alternative test called the Illinois Measure of Annual Growth in English (IMAGE). Beginning in school year 2007-08,
all students, with the exception of students with significant cognitive disabilities who took an alternative assessment called the
Illinois Alternate Assessment, were required to take the ISAT regardless of English proficiency. The lower percent of students
tested in 2006-07 and 2005-06 was due to ELL students taking the state required IMAGE assessment. The state does not count
these students as alternatively assessed.
11IL6
23
STATE CRITERION-REFERENCED TESTS
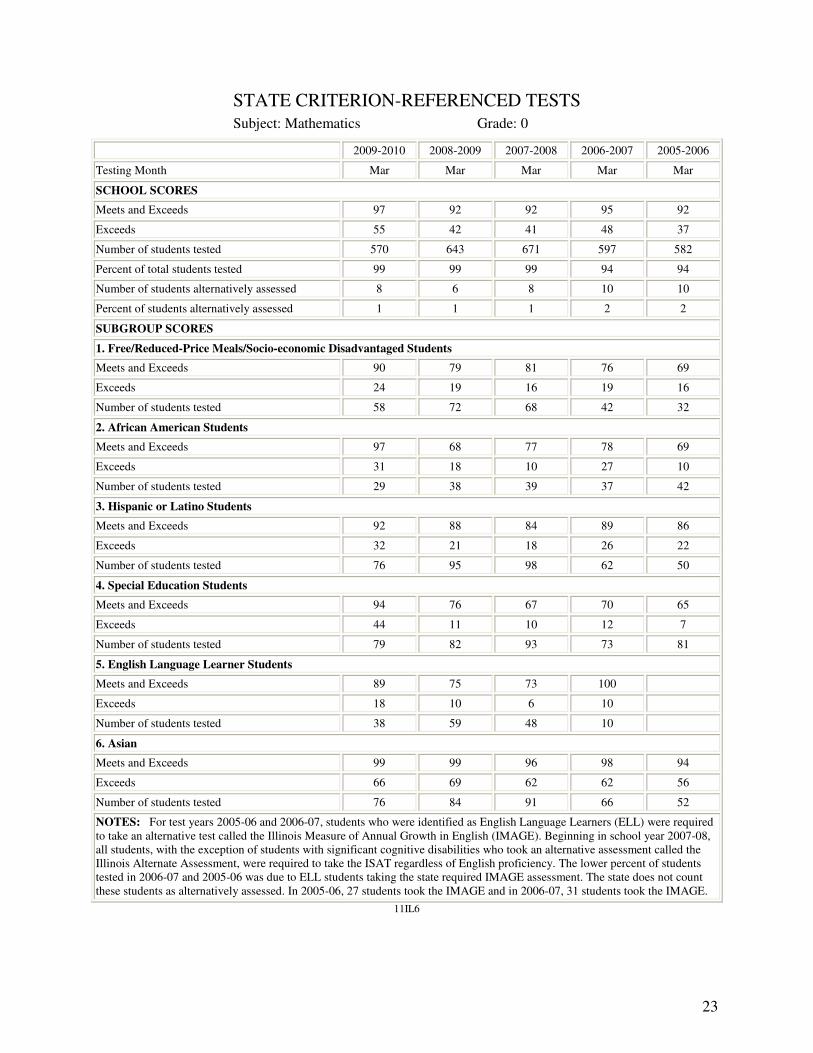
Subject: Mathematics Grade: 0
2009-2010 2008-2009 2007-2008 2006-2007 2005-2006
Testing Month Mar Mar Mar Mar Mar
SCHOOL SCORES
Meets and Exceeds 97 92 92 95 92
Exceeds 55 42 41 48 37
Number of students tested 570 643 671 597 582
Percent of total students tested 99 99 99 94 94
Number of students alternatively assessed 8 6 8 10 10
Percent of students alternatively assessed 1 1 1 2 2
SUBGROUP SCORES
1. Free/Reduced-Price Meals/Socio-economic Disadvantaged Students
Meets and Exceeds 90 79 81 76 69
Exceeds 24 19 16 19 16
Number of students tested 58 72 68 42 32
2. African American Students
Meets and Exceeds 97 68 77 78 69
Exceeds 31 18 10 27 10
Number of students tested 29 38 39 37 42
3. Hispanic or Latino Students
Meets and Exceeds 92 88 84 89 86
Exceeds 32 21 18 26 22
Number of students tested 76 95 98 62 50
4. Special Education Students
Meets and Exceeds 94 76 67 70 65
Exceeds 44 11 10 12 7
Number of students tested 79 82 93 73 81
5. English Language Learner Students
Meets and Exceeds 89 75 73 100
Exceeds 18 10 6 10
Number of students tested 38 59 48 10
6. Asian
Meets and Exceeds 99 99 96 98 94
Exceeds 66 69 62 62 56
Number of students tested 76 84 91 66 52
NOTES: For test years 2005-06 and 2006-07, students who were identified as English Language Learners (ELL) were required
to take an alternative test called the Illinois Measure of Annual Growth in English (IMAGE). Beginning in school year 2007-08,
all students, with the exception of students with significant cognitive disabilities who took an alternative assessment called the
Illinois Alternate Assessment, were required to take the ISAT regardless of English proficiency. The lower percent of students
tested in 2006-07 and 2005-06 was due to ELL students taking the state required IMAGE assessment. The state does not count
these students as alternatively assessed. In 2005-06, 27 students took the IMAGE and in 2006-07, 31 students took the IMAGE.
11IL6
24
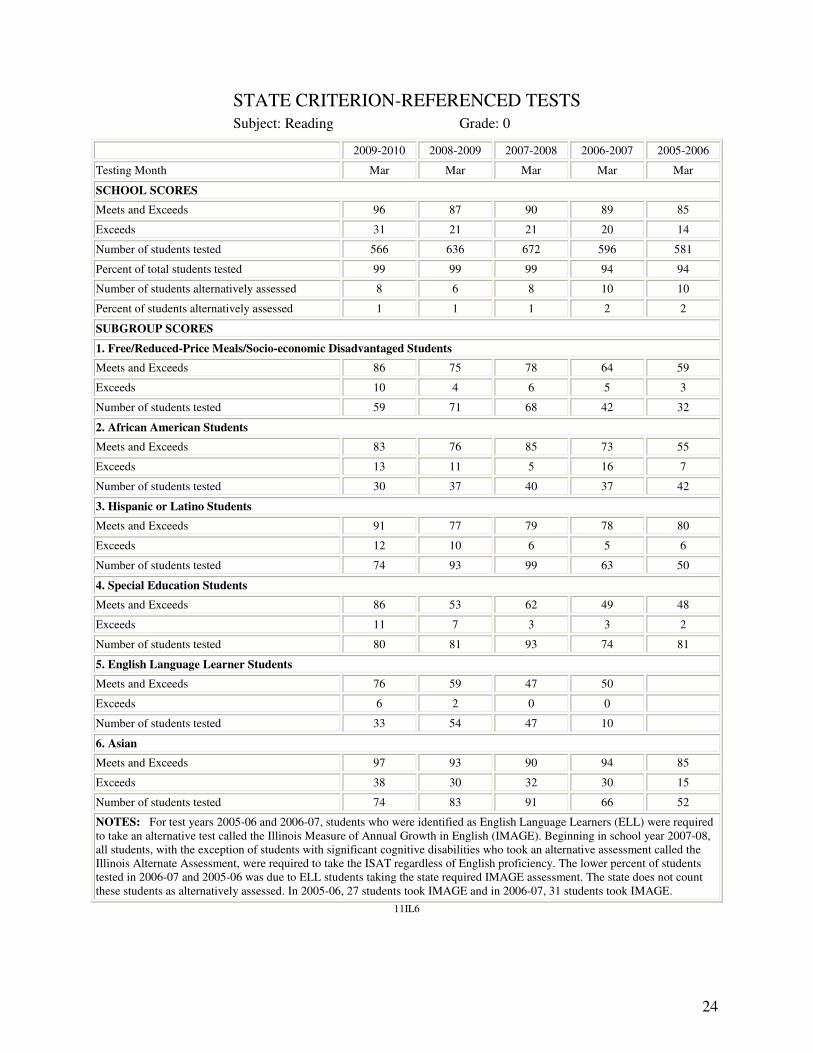
STATE CRITERION-REFERENCED TESTS
Subject: Reading Grade: 0
2009-2010 2008-2009 2007-2008 2006-2007 2005-2006
Testing Month Mar Mar Mar Mar Mar
SCHOOL SCORES
Meets and Exceeds 96 87 90 89 85
Exceeds 31 21 21 20 14
Number of students tested 566 636 672 596 581
Percent of total students tested 99 99 99 94 94
Number of students alternatively assessed 8 6 8 10 10
Percent of students alternatively assessed 1 1 1 2 2
SUBGROUP SCORES
1. Free/Reduced-Price Meals/Socio-economic Disadvantaged Students
Meets and Exceeds 86 75 78 64 59
Exceeds 10 4 6 5 3
Number of students tested 59 71 68 42 32
2. African American Students
Meets and Exceeds 83 76 85 73 55
Exceeds 13 11 5 16 7
Number of students tested 30 37 40 37 42
3. Hispanic or Latino Students
Meets and Exceeds 91 77 79 78 80
Exceeds 12 10 6 5 6
Number of students tested 74 93 99 63 50
4. Special Education Students
Meets and Exceeds 86 53 62 49 48
Exceeds 11 7 3 3 2
Number of students tested 80 81 93 74 81
5. English Language Learner Students
Meets and Exceeds 76 59 47 50
Exceeds 6 2 0 0
Number of students tested 33 54 47 10
6. Asian
Meets and Exceeds 97 93 90 94 85
Exceeds 38 30 32 30 15
Number of students tested 74 83 91 66 52
NOTES: For test years 2005-06 and 2006-07, students who were identified as English Language Learners (ELL) were required
to take an alternative test called the Illinois Measure of Annual Growth in English (IMAGE). Beginning in school year 2007-08,
all students, with the exception of students with significant cognitive disabilities who took an alternative assessment called the
Illinois Alternate Assessment, were required to take the ISAT regardless of English proficiency. The lower percent of students
tested in 2006-07 and 2005-06 was due to ELL students taking the state required IMAGE assessment. The state does not count
these students as alternatively assessed. In 2005-06, 27 students took IMAGE and in 2006-07, 31 students took IMAGE.
11IL6