Embed Size (px)
Citation preview
Robert H. Smith School of Business Entrepreneurship Incubator Program for the City of Baltimore Developed in partnership with the University of Maryland’s Center for Social Value Creation and Baltimore's Mayor's Office of Employment Development
Graham DeJong, Daniel Howard, Alex Maciulaitis, Liza Savranskaya6/11/2012

0
TABLE OF CONTENTS
ACKNOWLEDGEMENTS ............................................................................................................................................................ 1
EXECUTIVE SUMMARY............................................................................................................................................................. 2
PRISONER REENTRY AND THE COST OF INCARCERATION IN BALTIMORE ................................................................................. 3
BALTIMORE ...................................................................................................................................................................................... 3 INCARCERATION COST BREAKDOWN ...................................................................................................................................................... 3 BALTIMORE REENTRY EFFORTS ............................................................................................................................................................. 4
ENTREPRENEURSHIP INCUBATOR PROGRAM (EIP) .................................................................................................................. 5
OVERVIEW ....................................................................................................................................................................................... 5 WHY ENTREPRENEURSHIP? .................................................................................................................................................................. 5 WHY AN EIP? .................................................................................................................................................................................. 6
BENCHMARKING ..................................................................................................................................................................... 6
PEP OVERVIEW ................................................................................................................................................................................ 6 PEP ANNUAL DATA ‐ 2010, ................................................................................................................................................................ 7 PEP RESULTS ................................................................................................................................................................................... 7 HOMEBOY INDUSTRIES OVERVIEW ......................................................................................................................................................... 7 HOMEBOY'S STRATEGIC PARTNERSHIPS .................................................................................................................................................. 8 BENCHMARKING LESSONS LEARNED ....................................................................................................................................................... 8
ENTREPRENEURSHIP INCUBATOR PROGRAM ORGANIZATION, CURRICULUM, AND IMPLEMENTATION ................................... 9
EIP CURRICULUM DESIGN ................................................................................................................................................................... 9 EIP PILOT ...................................................................................................................................................................................... 10 EIP PHASE 1 .................................................................................................................................................................................. 10 EIP PHASE 2 .................................................................................................................................................................................. 11
THE BALANCED SCORECARD ...................................................................................................................................................11
SCORECARD BACKGROUND ................................................................................................................................................................ 11 OUR MODIFIED BALANCED SCORECARD................................................................................................................................................ 12 THE PRIME OBJECTIVE ...................................................................................................................................................................... 13 THE FOUR PERSPECTIVES ................................................................................................................................................................... 13 OBJECTIVES, MEASUREMENTS, TARGETS, AND INITIATIVES ........................................................................................................................ 14 DESIGNING THE SCORECARD .............................................................................................................................................................. 14
COST BENEFIT ANALYSIS (CBA) FOR PROJECTED PROGRAM RESULTS ......................................................................................14
PROGRAM COSTS ............................................................................................................................................................................ 15 RECIDIVISM DEFINITIONS ................................................................................................................................................................... 16 RECIDIVISM PROJECTIONS FOR FURTHER COST ANALYSIS .......................................................................................................................... 16 SELECTION BIAS .............................................................................................................................................................................. 17 COST OF CRIME—SOCIETAL BENEFIT FROM EIP FOR MOED IMPLEMENTATION ............................................................................................ 17 COST OF CRIME—SOCIETAL BENEFIT FROM EIP FOR NON‐PROFIT IMPLEMENTATION ..................................................................................... 18
FUNDING OPTIONS .................................................................................................................................................................19
SECOND CHANCE ACT ....................................................................................................................................................................... 19 ABELL FOUNDATION BACKGROUND ..................................................................................................................................................... 20 EXAMPLES OF ABELL'S INVESTMENTS ................................................................................................................................................... 21 FUNDING CRITERIA .......................................................................................................................................................................... 21
CONCLUSIONS ........................................................................................................................................................................23

1
Acknowledgements
This paper was written by students from the Robert H. Smith School of Business at the
University of Maryland, College Park, with research and consulting assistance provided by: the
University of Maryland’s Center for Social Value Creation (CSVC); the City of Baltimore
Mayor’s Office of Employment Development (MOED); and, the Maryland Department of Public
Safety and Correctional Services (DPSCS), especially the Division of Parole and Probation
(DPP).
The authors would like to thank the many individuals who provided inspiration and guidance
as our research progressed. John R. (Jack) Kammer of the DPP provided the original vision of an
entrepreneurship incubator as a means to serve his clients. Terri Ricks of the DPSCS provided
constant updates on legislation, new contacts, and advice to make our progress possible. Gerald
Grimes of the MOED gave our project a home, made it his own, and provided a tireless supply
of time and enthusiasm in answering questions and providing suggestions. Kiminori Nakamura
of the University of Maryland Department of Criminology and Criminal Justice offered
suggestions on extant and historic programs. Marci Hunn of the Harry and Jeanette Weinberg
Foundation helped us understand the initiatives that organization has sponsored in the past,
and how potential projects are chosen for grants. Bert Smith and Michael Humphrey of the
Prison Entrepreneurship Program (PEP) offered insight into the operation of their program, as
well as criticism and suggestions on how alternative models might work. Phi Tran of that same
organization provided financial and operating records, allowing us to understand how the PEP
is structured and funded.
We would also like to thank the friends, family, colleagues, and professors who helped us to
develop our research, and offered criticism and editing as we developed this report: Jennifer
Flack, Layla Flack, Laurel Hanscom Howard, Rebecca Ratner, and Meixin Wang.
Finally, we wish to thank our project advisor, Guillermo Olivos of the CSVC, for his support,
criticism, editing assistance, and direction on the long and complicated journey to completion.

2
Executive Summary
Over ten thousand ex-offenders return to Baltimore every year. While a number of work-placement, education, and counseling programs assist in the reentry process, feedback from state and city agencies indicates that there is potential for other creative employment opportunities.
We have explored the feasibility of providing holistic entrepreneurship instruction in the form of an Entrepreneurship Incubator Program (EIP). The following paper outlines the need for such a program and the predictive cost-benefit to society likely to result from the program’s success.
Successful implementation of this EIP will include instruction in both business skills and cooperation. We envision teaching and advising students who will transition from mentee to mentor upon graduation, thus forming a self-reinforcing network of support. We outline the major components of organizational design and phased implementation. We offer recommendations with some of the built-in options, and where possible, provide the logical foundation behind our more qualitative assertions.
In this paper, we discuss two organizational structures that could be used to implement an EIP, as well as provide a cost benefit analysis for each. Depending on the structure used, we estimate that Maryland stands to save between $5 million and $15 million dollars in measurable costs over five years by operating an EIP. On top of these measurable savings, we are also certain that the program would create wide, though more difficult to measure, societal and quality of life improvements for Baltimore communities.
3
Prisoner Reentry and the Cost of Incarceration in Baltimore
The number of inmates in state prisons grew by 708% nationally from 1972 to 2008.1 The State of Maryland and the City of Baltimore have also experienced significant growth in incarceration during this period. However, recent evidence has shown that high rates of incarceration provide only marginally higher safety to communities, while incurring substantial costs. In 2004, Senator Sam Brownback of Kansas stated, “we’ve got a broken corrections system… recidivism rates are too high and create too much of a financial burden on states without protecting safety.” With bi-partisan political support for prisoner reentry programs rising over the past ten years, opportunities for ex-offender employment and self-employment reentry programs continue to gain traction within communities open to new models. Calculating true total cost of incarceration is challenging due to the far-reaching impact on families and communities and the difficulty of measuring such impacts. Measuring incarceration costs is a significant challenge to developing reentry programs that successfully reduce recidivism while being cost-effective. The very notion of cost-effectiveness rests on the ability to benchmark a reentry program against existing cost data. As a result of these far reaching impacts on communities and families, it is nearly impossible to agree upon a consistent methodology for measuring the cost of incarceration. Ultimately, taxpayers pay for the incarcerated through either direct prison spending or indirect or collateral costs. Because Baltimore houses a significant proportion of Maryland's returning prisoners, it is a prime landscape for exploring new prisoner reentry solutions.
Baltimore
According to the 2010 Census, the population of Baltimore was 620,9612, or 10.8% of the total population for the State of Maryland (5,773,5523). However, in 2010 Baltimore City received 68% of the 25,000 prisoners returning from the State of Maryland prisons.4 In 2003, 30% of prisoners returning to Baltimore City returned to six of the city's fifty-five communities: Southwest Baltimore, Greater Rosemont, Sandtown-Winchester/Harlem Park, Greenmount East, Clifton-Berea, and Southern Park Heights.5 These six communities are "clustered according to socio-demographic factors, and are distinguished by substantial resource deprivation, social isolation, and limited community capacity.”6 Typically, crime and poverty rates in these neighborhoods exceed the mean for the city of Baltimore.7 These neighborhoods lack the resources and capacity for the kind of social engagement necessary to ensure successful reentry. Considering that Baltimore's daily average incarcerated population is 21,7868, it is understandable that all communities are enduring enormous costs.
Incarceration Cost Breakdown
Three major components contribute to the cost of incarceration: direct costs, indirect costs, and collateral costs. Of the three, direct costs are the easiest to identify, track, and measure. In 2010,

4
Maryland's average annual direct cost of one inmate was $38,383.9 Total Maryland Department of Corrections (DOC) direct expenditures for that year were $731.3 million.10 Maryland also had $104.9 million11 in prison costs outside of DOC, including administration and inmate services funded from other agencies. This accounted for 12.5% of the $836.212 million in prison expenses incurred by taxpayers. Indirect and collateral costs are more difficult to quantify, a major challenge facing reentry initiatives.
Indirect costs include social services, child welfare, education, etc. These costs are generally covered by government agencies other than the DOC, often without collaboration. This lack of communication and collaboration can sometimes lead to waste and misuse of already scarce resources. In addition to indirect costs, incarceration creates collateral costs. These costs include disruptions to families, strain on caregivers and children, and feelings of shame, stigma, anger, and guilt. Collateral costs are not borne by government or support agencies, but rather by individuals and communities. These costs certainly lead to financial consequences, but because they are so difficult for researchers and policy-makers to estimate, collateral costs are generally excluded from calculation.
Baltimore Reentry Efforts
A number of organizations currently provide housing services, substance abuse treatment, counseling, education, and other services to reentrants. Historically, Baltimore has recognized the need to coordinate reentry services. In 1999 Maryland introduced the Re-Entry Partnership Initiative (REP). REP was envisioned as a community justice partnership, where public agencies and community-based organizations collaborated to offer continuous case management during the reentry process. The program was designed to address prisoner reentry needs at the individual, community, and system levels.13 The program ran from 2001 to 2005 with the goal of enhancing public safety, increasing accountability of reentry population, and increasing capacity of communities to match needs of the reentry population.
In recent years, recidivism reduction has taken on increased importance as decreasing tax revenues from the recent economic downturn tighten state and local budgets. In the United States, approximately 40% of released prisoners recidivate within three years of release from prison.14 Incarceration, reentry, and recidivism are also closely tied to unemployment rates and costs. As of February 2012, the unemployment rate in the city of Baltimore was 7.5%, compared to 7.1% for Maryland overall.15 However, of the 218,700 people unemployed in Maryland, 107,700 were in the city of Baltimore.16 Because so many of the unemployed in Baltimore were formerly incarcerated, this population generates a higher cost of incarceration for Baltimore than the rest of the state.
In 2010, the Maryland Department of Labor for Workforce Development and Adult Learning spent $17.3 million on inmate education and training. Reentry program creation and funding policy discussions are at the heart of the recidivism challenge. There is momentum for reentry programs, conclusive evidence of cost savings to taxpayers, and clear quality of life benefits to

5
communities. An entrepreneurship incubator would help motivate those currently incarcerated, provide an avenue for skills-based learning, and engage communities that would stand to gain from new business development.
Entrepreneurship Incubator Program (EIP)
Overview
An important consequence of increased incarceration is the later increase in individuals who find themselves disadvantaged in reentering the workforce. Lack of employment options conclusively increases recidivism.17 “Without employment, ex-convicts are three to five times more likely to commit a crime than are those who gain employment after leaving prison.”18 Of the various approaches that have been implemented to address the gap between the newly released and the labor market, work placement programs have shown mixed results, while job training and technical education coupled with counseling have shown more success.19
Several creativity-based employment training programs have been developed since the late 1970s. Although still few and serving a relatively small portion of the reentry population, many of these programs have demonstrated success. Between 2000 and 2008, 20-30 new organizations were developed to provide entrepreneurial education and support for parole and probation populations.20 It is clear that educational opportunities provide a better foundation for future employment and the social and economic development of communities. This paper outlines how best to meet the needs of these communities with an Entrepreneurship Incubator Program.
Why Entrepreneurship?
In 2004, Elaine Edgcomb and Tamra Thetford of the Aspen Institute documented significant “entrepreneurial tendencies among those facing barriers to the traditional labor market.”21 Since then, further research has demonstrated connection between the traits of individuals reentering society and the abilities required of successful entrepreneurs. The 2007 report, “Venturing beyond the Gates” and the Association for Enterprise Opportunity, noted that “there appears to be some consensus that successful entrepreneurs share certain personality traits, including readiness to take risks, non-conformity, need for autonomy and creativity.”22 Research also shows that drug offenders demonstrate strengths in organization and leadership critical to entrepreneurship. Regardless of their risk-taking or creative tendencies, many are more productive and content in a state of autonomy. M. Lindhal and D. Mukamel from the John Jay College of Criminal Justice Prisoner Reentry Institute observed that “for those who lack the educational or language skills required for a professional position, starting a business is preferable to minimum wage employment.”23 The EIP we propose would harness those natural entrepreneurial tendencies and help bridge the gap to an otherwise unattainable labor market.

6
Why an EIP?
It is important to understand the barriers to entrepreneurial success in order to understand the gap that an EIP would fill. Such barriers include lack of capital assets, disconnected social networks, gaps in core business acumen, and lack of experience in starting legitimate ventures.24 An EIP would address each of these. Potentially the most valuable aspect of an EIP for reentry candidates is how the ventures could fill market demand from a localized and integrated perspective. Many entrepreneurial ventures are local and small, run by low-income, undereducated, immigrants, and minorities. An EIP serving the well-suited, partially qualified population of potential entrepreneurs reentering society every day is a worthwhile public or non-profit investment in Baltimore.
The EIP will instruct, counsel, mentor, and offer sustainable support in the form of network participation and in some cases, financial support. We recommend that the organizational format be implemented as either a non-profit, public agency, or public private partnership (PPP). We have designed a flexible and adaptable curriculum and program structure capable of adaptation to multiple formats while emphasizing partnerships with volunteers and other organizations. Similar programs should also show similar fiscal and socio-economic benefits.
Benchmarking
In the spirit of collaboration and best practices, it is important to benchmark our proposed EIP against comparable existing programs. We have chosen to highlight Houston's Prisoner Entrepreneur Program (PEP) and Los Angeles's Homeboy Industries as both organizations work with populations similar to that of Baltimore and have been successful in benefiting their communities through differing means. We hope to learn from both and incorporate some of their methodologies into Baltimore's own EIP.
PEP Overview
The Prisoner Entrepreneur Program is a 501(c) (3) non-profit based in Houston, Texas that works to encourage entrepreneurship and reduce recidivism among recently released men. Founded in 2004, PEP provides basic business education, consulting, mentoring, and business development assistance to participants who join the program voluntarily.
While still incarcerated, participants complete a five-month business and entrepreneurship course and create a formal plan for a business that they could start upon release. These plans are reviewed, edited, and developed with assistance from “Business Plan Advisors” (often MBA students or business executives). For their final project, participants deliver a 30-minute presentation of their plan at a formal business plan competition.
PEP also provides assistance to graduates after their release from prison. PEP case managers pick graduates up at their facility’s release gate and provide transport and ongoing assistance (medical, counseling, assistance in finding housing, emergency financial aid, and more). Graduates also have access to ongoing resume assistance, interview preparation, and practice.

7
Additionally, they also have the option to continue their business studies at special courses taught at two local universities. Following completion of twenty courses, participants become eligible for financing from partner angel investors, as well as ongoing business mentoring from executive volunteers.
PEP Annual Data - 201025,26
# of Employees 26 # of Volunteers 790 Total assets $1,126,788 Net assets $970,124 Annual expenses $1,388, 645 Participants 182 Salary, Management, payroll tax, benefits $808,965 Occupancy, travel, and office expenses $80,560 Business plan competition $150,284 Reentry programs $71,064 Education expenses $68,564 ** Note: employee and volunteer numbers are over the course of the year
PEP Results
Since its inception, PEP has had over 700 graduates, and helped form more than 100 operating businesses. While the number of new ventures is important, with public benefit as the main goal, two more metrics are even more so. 70% of PEP graduates are employed within 30 days of release, with 100% employed within 90 days, and while the Texas average recidivism rate over a 3-year period is 25%, PEP graduates recidivate at an average rate of 8-10%.27 Whether or not graduates become entrepreneurs, the majority succeed in becoming better and more productive members of society.
Homeboy Industries Overview
Homeboy Industries is a non-profit youth program founded by Father Greg Boyle in 1992. It is a gang intervention program aimed at filling gaps in government services. The program offers jobs, training in anger management, domestic violence, yoga, spiritual development, parenting, substance abuse, budgeting, art, and other areas of self-development. It also offers free mental health counseling, tattoo removal, legal services, job development, and case management.
One of the more unique aspects of this organization is that they own/operate their own small businesses (social enterprises). These businesses serve as training grounds for job placement, as well as community-building and potential sources of funding. These include: HB Bakery, HB Cafe, HB Embroidery/Silkscreen, HB Merchandise, HB Diner, and HB Farmers Markets. Clients complete job-readiness programs and are then placed into one of these businesses to learn communication, management, and various trade skills. Currently, Homeboy employs between 200-235 high-risk, recently incarcerated youth in those six social enterprises; its free services, such as tattoo removal and “Baby and Me” classes, are used by more than 10,000 members of

8
the LA community. In addition, Homeboy Industries also has a product line carried in LA grocery stores. This product line provides additional revenue, and more importantly, it helps develop brand recognition and community buy-in.
Homeboy's Strategic Partnerships
Homeboy Industries has been successful at forming partnerships within the LA community. For example, they work with East LA Skills Center to provide solar power installation training. They have identified this as an emerging field within their external market and the skills training gives program participants direct access into a growing industry. Graduates receive a nationally recognized certification and thus are given the opportunity to choose their future community, as they are employable on a much greater scale. Homeboy also works with Learning Works Charter High School to give their youth a chance to prepare for a GED. By involving external partners, Homeboy is able to extend their service offerings and engage more community stakeholders. This means that their own model is more sustainable because they can continue to pursue new partnerships as their needs evolve.
Benchmarking Lessons Learned
PEP could serve as a roadmap for funding and budgeting for Baltimore's EIP. They work with a similar target population and their progress over the last eight years can illustrate the funding benchmarks to expect for scalability. PEP's coursework for those still incarcerated could be a potential starting point for curriculum design. Incorporating a case competition incentivizes program participants and can also help draw potential investors and community leaders. PEP's drastic reduction in recidivism is an argument in itself and can help pave the way for an EIP in Baltimore.
Although Homeboy Industries works with at-risk youth in communities with the highest gang-related activity in the country, these communities are not unlike the six neighborhoods of Baltimore with the highest concentration of prisoner reentrants. Another point of intersection is Homeboy's experience in gaining buy-in from the community as well as potential private sector partners and donors, all of which would be of immense value to the long-term sustainability of the EIP.
Homeboy Industries is extremely effective at understanding the demands of its target population and forming partnerships with organizations that can help them meet such demand. By working with the Charter School, they are addressing the low literacy rates of their incoming program participants and enabling them to get their GEDs. By partnering with the solar panel company they are going beyond generic job training, and providing vocational training that meets the external market demands and guarantees candidates a job-specific skill set. The ability to form the right partnerships and to maintain them in the long run is essential to the success of the EIP. Both PEP and Homeboy Industries address a multitude of obstacles faced by their participants through family counseling, educational gaps, skills training, drug counseling, resume preparation, business acumen, etc. While the EIP cannot meet all these demands, it is clear that success will depend on addressing these needs through strategic alliances.
9
These two programs are far from exhaustive, but they highlight the numerous facets that must be considered in an undertaking such as the program design of the EIP. We designed the program organization and curriculum to fit Baltimore's target participants and their unmet needs. At the same time, we strove for a design that also addressed Baltimore City as the focal marketplace for our future entrepreneurs.
Entrepreneurship Incubator Program Organization, Curriculum, and Implementation
We have designed the Entrepreneurship Incubator Program (EIP) to be scalable and replicable. At the basic level, core personnel are needed to build and implement the EIP curriculum as well as identify and select program participants. Additionally, facilities are needed to effectively implement the EIP pilot curriculum and serve as the administrative office. EIP expenses could potentially include prize money for the business plan competition winner(s). For sake of scalability and flexible implementation for a variety of partners, we have envisioned the EIP in terms of a Pilot, Phase 1, and Phase 2.
EIP Curriculum Design
We have designed the EIP curriculum as three separate modules over the course of 26 weeks (See: Appendix A). The three basic curriculum components include: financial literacy, business plan development, and soft skills development (i.e. time management, negotiation, etc.). Planning, consideration, and limited counseling for participants' transition from prison to their respective communities should be integrated across all three modules where possible.
Each course will last three weeks and classroom sessions will be between three to four hours in length. Whether classes are weekly or bi-weekly depends on the participants' needs and staff availability. The 9-week soft skills module will consist of three separate courses; including goal setting, leadership development, and conflict resolution.
The 12-week business fundamentals module will consist of four separate courses: finance and accounting, marketing, project management, and entrepreneurship resources and strategy. This last class offers perhaps the most important lesson. Instead of teaching strict business strategy we focus on ways to be resourceful. The idea is encapsulated in the following phrase: One need not be the smartest person to be successful—only to have the confidence and wherewithal to know that problems can be solved. In short, this class will illustrate the many avenues available to a manager across varying situations.
Finally, the business plan development class will be a five-week capstone course, integrating components from financial literacy and soft skills development. Lessons will culminate in the business plan competition to award the winners with seed funding. The goal for each course is to provide a comprehensive baseline of core competencies.
10
EIP Pilot
The pilot is designed for a class size of 30 participants with curriculum instruction over the course of six months. We estimate first-year costs for a stand-alone, non-profit pilot to be approximately $173,000 (See: Appendix B). Primary cost drivers would be personnel and facilities.
Initially, we recommend full-time salary and benefits for an EIP Program Director and one Instructor/Counselor at an estimated annual cost of $144,000. This would constitute the largest component of the EIP Pilot budget. The rest of the pilot program is to be staffed with part-time volunteers to fulfill instructive and administrative duties. The hourly breakdown will depend on demand for specific courses, availability of volunteers, and facility capacity.
Quality facilities are a critical factor in the success of the EIP Pilot. The sponsor organization can improve overall program credibility by securing professional classroom space. We recommend a 2,000 square foot facility for the duration of the pilot at an estimated cost of $14,000. This space would consist of two roughly 750 square foot classrooms and approximately 500 square feet of administrative space. For a facility of this size, we expect $1,200 in additional facility-related expenses for the duration of the pilot.
Miscellaneous costs associated with the EIP Pilot include supplies and prize money for the business plan competition. We recommend budgeting $4,000 for classroom expenses such as furniture, educational materials, and consumables. We suggest a $10,000 budget for the pilot business plan competition prize money. This prize money could be awarded to one winning team (or person) or to any number of participants in the EIP Pilot. Due to the proposed prize budget, we recommend that no more than three separate prizes be awarded for the business plan competition.
EIP Phase 1
The EIP Phase 1 is designed for a class size of 100 participants with instruction conducted over the course of six months, as in the pilot. We estimate initial costs for a stand-alone non-profit to be $533,000 (See: Appendix C). As in the pilot, the three primary cost drivers would remain personnel, facilities, and miscellaneous expenses, with significant increases required in personnel.
In addition to a full-time Program Director and Instructor/Counselor, we recommend hiring an administrator, accountant, permanent fundraiser, and two additional instructors. Annual cost for seven full-time staff members will be approximately $488,000. Volunteers will fulfill additional instructive and administrative duties.
For facilities, we project that the program sponsor could successfully provide the same 2,000 square feet of facility space for the EIP Phase 1 as we recommended for the EIP Pilot. The facility cost would increase to $28,000 to account for the additional six months of use. We recommend the same space distribution as for the pilot: two classrooms and auxiliary space. As
11
the program grows, efficient use of facility space will become critical to minimizing program costs.
Miscellaneous costs associated with the EIP Phase 1 are limited to supplies and prize money for the EIP business plan competition. We suggest maintaining a $10,000 budget for business plan competition prize money. We recommend increasing the prize money in the long run to reflect an evolving quality and quantity of business plan competitors/participants.
EIP Phase 2
Phase 2 is designed for a class size of 250 participants with curriculum instruction still provided over the course of six months. Total costs for a stand-alone, non-profit should be $823,000 (See: Appendix D). The primary cost drivers for the increase are additional personnel, a larger facility space with a computer lab, and additional business case competition prize money. Full-time instructors increase from three to seven, bringing total full-time staff to eleven, at an annual cost of $732,000. Part-time volunteer staff will need to increase accordingly.
During Phase 2, the program sponsor would need to increase facility space from 2,000 square feet to 4,000 square feet. This would accommodate two additional classrooms as well as auxiliary space for a computer lab and administrative offices. Thus facility costs would increase to $66,000 annually, which would include the purchase of computers, printers, and other one-time costs required for computer lab set-up. Miscellaneous expenses would remain the same.
The Phase 2 business plan competition prize budget should increase to $15,000. Though still important, this money now becomes a seed, rather than the absolute focus of the competition. EIP management should focus using the competition to draw investor attention from the Baltimore business community and program graduates to amplify funding available to promising plans.
The Balanced Scorecard
In order to evaluate progress, determine a reasonable rate of growth, and ensure continuing support, performance measurement and reporting is critical. Because this program is meant to fill a niche among reentry initiatives, performance measurement has to account for all possible stakeholders. Critical factors will include completion rate among participants, their employability, the financial cost-benefit to Baltimore, and societal benefits. Given the number of criteria, we recommend using the Balanced Scorecard approach to continually measure, maintain, and improve the program.
Scorecard Background
Robert Kaplan and David Norton first introduced the Balanced Scorecard as a performance management tool in 1992. It was originally conceived as a means of tracking leading factors that eventually affect a company’s most critical trailing measure: the bottom line. The Scorecard

12
quickly emerged as a powerful tool for aligning objectives and leading strategy implementation. In the words of Kaplan and Norton, “What you measure is what you get.”28
The first version of the Balanced Scorecard expanded on the traditional financially centered perspective by adding three, more human-centric perspectives: the Customer, Internal Business Practices, and Innovation and Learning. The balance aspect of the scorecard refers to how each of the perspectives must align with and drive each of the others. Investment in each of the other perspectives is critical for continued financial success (Fig. 1).
Figure 1: Kaplan & Norton Model29
During the 1990’s, while Kaplan and Norton’s scorecard was gaining rapid acceptance in the business world, numerous alternative implementations were developed to fit non-commercial organizations such as government agencies and non-profits. The power of the Balanced Scorecard to distill broad strategic goals and values-based ideals into actionable objectives is even more critical when those values-based ideals are the main objective. Kaplan and many others, notably Paul Niven, have explored the application of a balanced scorecard approach in non-profit settings extensively. 30, 31
Our Modified Balanced Scorecard
Based upon Kaplan and Niven's work, we propose the following model:
Figure 2: Entrepreneurship Incubator Model

13
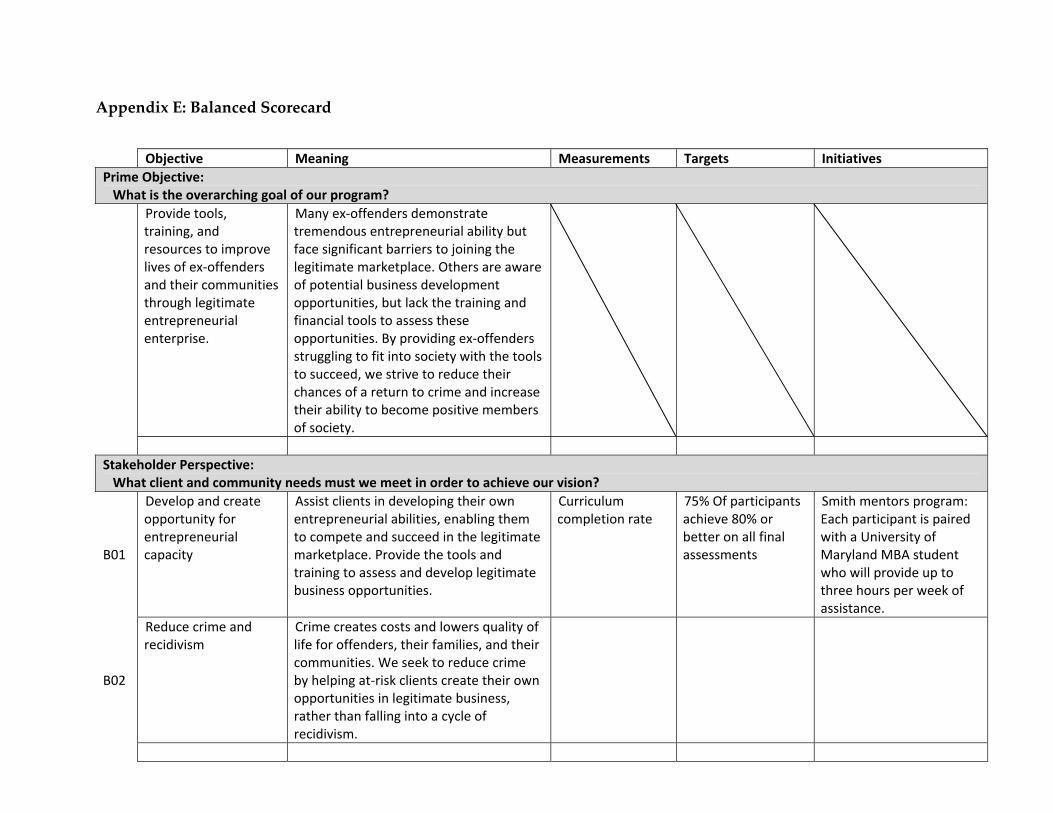
Although we provide an example scorecard (See: Appendix E), it is imperative that the organization implementing this model develop a scorecard reflecting its own values, objectives, measurements, and goals.
The Prime Objective
The Prime Objective articulates the main, overarching goal that the program seeks to achieve. The Prime Objective should be simple, brief, and straightforward. All other objectives and initiatives should drive towards this central theme. The organization implementing the EIP will need to define a Prime Objective themselves that addresses exactly what they hope to achieve and how. An example:
Provide tools, training, and resources to improve lives of ex-offenders and their communities through legitimate entrepreneurial enterprise.
The Four Perspectives
Stakeholder Perspective – Identifies the target client or population, their needs, and how the organization meets those needs. Measurements in this section may include recidivism rates, graduation rates, employment levels, new ventures launched, client satisfaction levels, growth of client base, repeat visits, etc. Critical stakeholders also include affected communities, the citizens of Baltimore, and depending on project funding, taxpayers or donors. Based on implementation, metrics will need to be included for these groups as well.
The Process Perspective – Identifies how the organization functions internally in order to deliver value to stakeholders. For this project, it should include metrics such as quality of instruction, ongoing graduate involvement, development/maintenance of community partnerships, and sharing successes with the community. Over time, internal improvements reduce costs, as well as increasing client and practitioner satisfaction.
The Development and Learning Perspective – Identifies how the organization recognizes and develops resources and personnel. Metrics may include new internal suggestions, new client suggestions, employee training, and employee satisfaction. Objectives and targets for this perspective must be chosen carefully to drive the Prime Objective; fuzzy objectives are likely to become self-serving.
The Budgetary Perspective – This is the most traditional portion of the balanced scorecard. It should illustrate key financial metrics such as cash flow, upcoming expenses, and operational effectiveness. Ignoring the financial perspective is a quick route to bankruptcy; ignoring other perspectives is a path to program obsolescence. In this section, it is critical to highlight metrics that sustain strategic objectives. Although civic benefit programs may not be motivated by financial gain, effective use of resources and the ability to demonstrate return on investment are critical to sustained funding.
14
Objectives, Measurements, Targets, and Initiatives
For each perspective, the scorecard identifies a series of Objectives serving the Prime Objective. Measurements are then specified for each objective. These may be concrete, such as instruction hours delivered or client reconvictions or they may be conceptual, such as a scaled satisfaction rating. A target is also specified for each objective, after which initiatives can be developed to achieve the target. While a measure and target must be provided for each objective, it is acceptable to have an objective without specified initiatives. Aligning the scorecard requires balancing objectives within and across perspectives, so some initiatives may not be feasible during a specific period. Without initiatives, failure to meet targets will draw attention to the objective over time.
Designing the Scorecard
In 1996, Kaplan and Norton released a new article to help organizations develop and implement Balanced Scorecards. They identify four stages of designing a scorecard: Translating the Vision, Communicating and Linking, Planning, and Feedback and Learning.32
Translating the Vision entails clearly articulating long-term goals. It solidifies focus and strategy by articulating and quantifying objectives. Choosing what to measure turns broad concepts into action-level targets, giving practitioners direction on where to focus effort. In the context of the EIP, it means turning broad goals such as “reducing recidivism” into actionable objectives such as “ensuring that each client leaves with a clear business plan.”
The Communicating and Linking step ensures that all members of an organization understand the long-term vision and short-term objectives. It means communicating not just the mission, organizational objectives, and priorities, but the means by which it seeks to achieve them. The more an individual understands the organization’s goals, the more effectively they can act upon them.
Planning aligns strategic and budgetary decisions. Focusing solely on financials encourages practitioners to prioritize cost-cutting and maximizing results for the period of measurement. Effective planning balances long-term objectives with short-term actions.
Feedback and Learning guides the adjustment of systems and strategies over time. By adding strategic metrics to financial data, the balanced scorecard allows users to get beyond the “what” to the “why.” Systems, and the scorecard itself, must evolve over time.
The Balanced Scorecard aligns goals and actions while remaining flexible as programs evolve. It allows for relative weighting of minor objectives, turns mission-based objectives into actionable goals, and ultimately balances the cost-benefit motivated by funding partners.
Cost Benefit Analysis (CBA) for Projected Program Results
In order to justify its use of scarce resources, an EIP must demonstrate positive net contribution on investment. Many of the expected benefits of this type of program, particularly those
15
affecting indirect and collateral costs, are difficult and costly to measure; because of this, we chose to exclude those benefits from our calculation. Instead, we focused our analysis on direct benefits, with the assumption that a program which breaks even on direct costs will, by definition, return a positive net contribution with any effect on indirect or collateral costs.
There are three ways the EIP can be implemented: 1) as a government sponsored program; 2) as a stand-alone non-profit organization, and; 3) as a hybrid public private partnership (PPP). We believe that a PPP of community stakeholders from the Baltimore business community and local government would prove most successful. We recommend that the EIP be instituted in pilot form, and then ramped up to serve 250 students each year by the third year of existence. An important potential funding source, the Second Chance Act (outlined later), makes grant disbursements to promote phased organizational growth with an emphasis on tracking outcomes. This leaves us to differentiate between the government agency model and the stand-alone non-profit model. Because there are advantages to both options, we include both prospects for cost benefit analysis. Aside from qualitative discussions regarding the merits of either format, we can quantitatively outline the differences between the two.
There are two ways to break down costs for Baltimore’s Mayor’s Office of Employment Development (MOED). In this case, we will design the public agency model under the possibility of sharing resources during the pilot stage. This will show a slight difference in the budget costs of each stage of the EIP. Secondly, if the public agency model is adopted using shared facilities with MOED, we will account for 50% at-risk personnel enrolled in classes. This prospect combines the joint charters of the MOED and an EIP by allowing open applications regardless of parole status. In other words, an MOED EIP class might have 15 ex-offenders and 15 with clean records whom the MOED thinks would still benefit from such a program. This, as shown below affects the CBA to some degree but nevertheless proves viable from an opportunity cost perspective.
However the EIP is implemented, these CBA valuations are not only useful for a firm understanding of an organizational mission, they clearly illustrate the probable value to society and those involved.
Program Costs
For the remainder of this section, “MOED” refers to development of an EIP as a publicly sponsored entity while “non-profit model” refers an EIP developed as a stand-alone non-profit. The cost of maintaining the MOED EIP, from start-up to its completion in year five, is $3.147 million. This comes out to an aggregated $3,576 per student with a fifth year scaled cost of $3,290. For the non-profit model, there would be an additional expense per student—to account for facilities' costs, of an additional $30, resulting in a $3,606 per student cost. By year five, cost per student would be identical regardless of model, as the size of the program would require the same facilities costs outside of the MOED. This occurs in year three, Phase 2 (See: Appendix F).

16
Recidivism Definitions
Recidivism is a focal measure for any project of this nature. In order to discuss EIP in this context, we must identify current state of Maryland's recidivism metrics. Recently, Maryland has had considerable trouble with recidivism data. The following is from a report by the Maryland Parole Commission, 2011:
At the present time, using the current data systems, MPC is unable to track the number of purely technical violators who are returned to DOC, or to conduct analysis of recidivism rates by risk levels or population subsets to help determine what type of offender is recidivating. As such, the number of reported returns often differs from the reported recidivism and the usefulness of the recidivism rate is limited. In past years, the budget committees have asked for information on the effectiveness of program participation on lessening the likelihood of recidivating. This data is apparently not available to provide an accurate assessment.33
In the same document, the authors emphasized that: “recidivism is a key measure that is commonly used to evaluate the progress of a state’s criminal justice system. Maryland’s reported three-year recidivism rate has been near 50% for years.”34 Likewise, when consulting other reports we find this 50% number is, if not exact, generally established as close. This percentage refers to the results of reentry persons being arrested, prosecuted, and incarcerated again, within a 36-month period of previous release. We also found the following 12 and 24-month break-downs from the Maryland Parole Commission. Combining the data yields the following as our estimated annual recidivism rates for the state of Maryland:
One Year Return Rate Two Year Return Rate Three Year Return Rate 24%35 14%36 12%
This sums to 50% recidivism over three years. Some reports show that there is some recidivism after 36 months but for our purposes we will restrict our costing analysis to this time frame. This is in compliance with federal grant guidelines for program funding options.
Recidivism Projections for Further Cost Analysis
Projected recidivism rates for EIP participants are based on existing programs. Since we are benchmarking much of the program design against Houston's Prisoner Reentry Program (PEP), we will also use their recidivism rates as part of our base-line projection. Depending on the year, PEP has managed between eight and ten percent recidivism over its program life. Acknowledging differences between the PEP model and the vision of the EIP, our research still demonstrated that education-based reentry programs had a great effect on recidivism rates. The 2011 Maryland Parole Commission report noted that such a sub-population of reentrants recidivated at a 10-13% annual rate from 2005 to 2007.37 Likewise, a handful of other similar reports show results in that same range. Therefore, we estimate the EIP would demonstrate results between the rates of these two programs. Although our research indicated that our post-

17
program recidivism rate should be closer to what was reported at PEP, we err on the side of conservatism and projecting the rate to be in between the two. Thus, for this CBA, we estimate recidivism at 9% for ex-offenders in their first year. We break apart yearly rates at the same proportions as Maryland’s overall rates, yielding the following breakdown: One year: 9%; Two year: 5.3%; Three year: 4.5%. This leaves us with a 19% expected recidivism rate for our three year sample to compare against the historical average of 50% for the state of Maryland. We anticipate that this number would decrease further after phase 2 implementation is complete. This is assumed as a result of the value of the developed network of program alumni, as well as the development of the program managers and instructors. This slight reduction in later years still falls within what we consider a conservative estimate range.
Selection Bias
Especially when calculating benefit to society, concerns arise about selection bias- the potential that EIP applicants may already have a lower likelihood of recidivism than the general release population. Two major points ease this concern.
First, earlier research on reentrant recidivism addressed this issue in 2003, as described in the article “Education Reduces Crime”. The authors of this study created a compound variable accounting for educational program participants’ strength of motivation, and found this variable had no significant effect in predicting recidivism. In contrast, participation in any education program had a strong and significant predictive effect vs. the non-participant group, even among those with weak motivation. The authors therefore concluded that motivation, at least in their population, “did not predict recidivism, and was not a biasing influence on the outcomes studied.” 38
Second, many entrepreneurs will operate within the best market they feel is available. For many potential program participants, this very activity resulted in their incarceration. The EIP opens new, legitimate markets those with the basic skills, motivation, and tendencies to succeed in business on their own. For our cost benefit model, therefore, we will not address selection bias further, but rather assume that the EIP is populated with a representative cross-section of the Baltimore reentry population.
Cost of Crime—Societal Benefit from EIP for MOED Implementation
We developed our overall cost of crime estimates based upon element costs from a 2005 report by Jon M. Shane entitled "Activity-Based Budgeting” (See: Appendices H and I).39 Although the data is not as recent as we would prefer, the sample size and report depth are probably the most complete available. In total, we found that the average cost to the state for arrest, prosecution, incarceration and parole services, weighted by percentage of crime type, is $63,803 per year. Moving forward from this number, we are able to begin tallying.
As shown in the figure 3, all costs were inserted into an annual cash flow model to illustrate recidivism cost differences the state would incur in future years. After five years of EIP operation, reaching an estimated 880 people, we estimate a total cost reduction of $8.8 million.

18
Subtracting EIP operating costs over that period ($3.147 million), we estimate total benefit from
EIP at $5.653 million.
Years 1 2 3 4 5Program Phases Pilot 1 2 2 2
Savings (Lower Recidivism) 50,598.00$ 714,910.63$ 2,492,304.69$ 2,635,861.44$ 2,906,226.65$
CBA from Prog. Costs (107,428.00)$ 193,974.63$ 1,669,790.69$ 1,813,346.44$ 2,083,710.65$
CBA Ratio 0.32 1.37 3.03 3.20 3.53
5 Year CBA 5,653,394.40$
Figure 3: Cost‐Benefit Analysis
This is represents a $2.80 return on every invested dollar. Return on investment (ROI, or (gain
from investment – cost) divided by cost of investment) is the projected at 3 to 3.5 for the years of
full operational capacity after achieving Phase 2.
Cost of Crime—Societal Benefit from EIP for Non‐Profit Implementation
For non‐profit implementation, we increased the percentage of reentrants from the 50% used in
the previous model to 100%; only ex‐offenders who fit a risk profile for recidivism according to
definitions in this report would be eligible. While we expect that EIP leadership would
customize their selection criteria according to their own mission, we assume a 100% reentrant
population to demonstrate maximum realizable benefit. Under this assumption, we project a
total of $17.6 million. Subtracting program costs yields total benefit $14.5 million, equating to a
5.55 ROI, or $5.55 in earnings for every dollar invested. At year five, ROI reaches 7.1.

19
One of the remaining questions is that of funding opportunities. Given the above cost benefit
analysis, EIP appears very well suited for Second Chance Act grant funding; our phased
implementation also fits the Second Chance staged funding. We also believe there are
opportunities to receive funding for the nonprofit model through either the Abell Foundation or
the Open Society Institute of Baltimore. All of these funding sources will demand that the EIP
work in cohesion with other reentry initiatives, and that funding will be allocated towards the
alliances that offer the best fulfillment of services to its participants.
Funding Options
There are two ways to think about funding. The EIP itself requires funding, which could take
the form of seed or grant money for each of the three phases, and participants of the business
plan competition should also be motivated at least in part by the opportunity of startup seed
money. Depending on the organizational design and program leadership, funding
opportunities may vary; however, we believe that the EIP curriculum, the inclusiveness of the
target population (both ex‐offenders and non‐offenders), and the stress on organizational
partnerships make a very likely formula for success.
This program is designed to foster networking effects among its participants, including the
potential for collaborative ventures and mutual investment. In order to foster this development
we recommend forming an advisory council including successful local businesses, and growing
to include program graduates. However, since program success is largely defined by
completion rates and a reduction in recidivism, the financial standing of potential startups is not
our primary focus or a reliable source of revenue.
The EIP model is designed to be flexible enough that any interested partner organization can
modify its design to match its own mission. Part of the EIPʹs curriculum includes emphasis on
financial literacy. Among the lessons we intend EIP participants to take away include: how to
identify potential investment partners, how to qualify for microfinance lending, and how to
select/pursue the best funding option based on their own background and business plan. For
the EIP itself, we believe the Second Chance Act and the Abell Foundation are best possibilities
for seed grants.
Second Chance Act
The U.S. Department of Justice Office of Justice Programsʹ, Bureau of Justice Assistance (BJA)
announced funding for ʺSecond Chance Act Adult Offender Reentry Program for Planning and
Demonstration Projectsʺ in spring 2012. Applicants were limited to state and local government
agencies. An addendum to the Actʹs funding model was the reimbursement style ʺPay for
Successʺ option.
BJA offered priority consideration for applicants who incorporate a Pay for Success model into
their offender reentry proposal. Second Chance grants could be used ʺto fund operations if a
state, local, or other organization would pay for outcomes after they are achieved or for
outcomes achieved within the grant period.ʺ
20
The Second Chance Act aims to fund development and implementation of ʺcomprehensive and
collaborative strategies that address the challenges posed by reentry to increase public safety
and reduce recidivism.” The Act proposes two categories of proposals: planning projects and
implementation projects. Applicants may apply for both forms of funding successively (See:
Appendix G for Mandatory Requirements).
It is no coincidence that our organizational design mirrors the Second Chance Act requirements.
The holistic approach and emphasis on partnerships closely aligns with our vision for the EIP.
Also, a stand‐alone, non‐profit model would also benefit by following these federal guidelines
to increase its chances of forming sustainable partnerships and qualifying for a wider range of
funding options. However, the MOED already has the facilities and the expertise in personal
development management, as well as a strong relationship with the MDPP and funding
partners in the Baltimore community.
Ultimately, we recommend that the EIP consist of partnerships that can utilize their individual
core competencies to provide a greater overall product. The MOED and MDPP is a natural start,
especially for the pilot phase of the EIP, and can pave the way for future collaborations
involving more stakeholders. Although the Second Chance Act mandates that a reentry
proposal account for housing, counseling, etc., we believe these factors demand attention
regardless of the funding source. Thus, partnerships are ever important in developing
complementary offerings and maximizing community resources. The Abell Foundation is a
natural partner for a collaborative EIP, especially given that it provided seed money to the
MOED itself.
Abell Foundation Background
If the EIP were to apply and receive funding from Abell it would have to operate either under
the stand‐alone, non‐profit model (with 501(c) (3) tax‐exempt status) or as a government agency
partnership, similar to the MOED itself. The Abell Foundation gives priority to solutions that
are ʺinnovative and will ensure accountabilityʺ‐ the EIP is the very essence of innovation both in
the gap it fills and in promoting entrepreneurship as an employment option. The Balanced
Scorecard approach demands accountability so that actionable items are meeting the demands
of the overarching vision. Also, Abell prioritizes giving ʺopportunities to the disenfranchised, to
those on the margins of societyʺ—the reentry population of Baltimore certainly meets and
exceeds this objective.
Overall, the ʺfoundation supports programs, and initiatives that increase public safety and
reduce recidivism with a special focus on initiatives that address the barriers facing returning
ex‐offenders. A particular emphasis is placed on initiatives that provide transitional housing
and the necessary wraparound services to support a successful return to the communityʺ. Based
on our cost‐benefit analysis and benchmarking of Houstonʹs PEP, the EIP will decrease
victimization of residents in Baltimore communities by reducing recidivism and incidences of
violent crimes. One of the greatest barriers ex‐offenders face upon reentry is access to
employment. The EIP ensures that even those participants who do not win the case competition
will still emerge from the program with a differentiating skillset and knowledge that will

21
improve their ʺemployabilityʺ. Aside from teaching business management courses, which
would be valuable for anyone seeking employment, continued education has been shown to
increase hourly wages and employment opportunities40. As for the wraparound services and
transitional housing, the EIP has to partner with other organizations to meet Abellʹs
requirements as well as the needs of its own target population. We have identified some of
Abellʹs prior funding recipients as potential joint‐ventures for the EIP.
Examples of Abellʹs Investments
Abell has allocated funding for the Jericho Reentry Program run by the Episcopal Community
Services. This initiative works to provide case management job placement, training, and life
skills to a target population of 300 ex‐offenders. Abell has specifically funded stipends for
transitional housing for participants engaged in the Jericho Reentry Program. Although this
particular program works with a narrower population (non‐violent, male offenders) than we
have identified for the EIP, it could still be a valuable partner because of their experience in
working with Abell and their understanding of the Baltimore reentry landscape. We
recommend that the program sponsor for the EIP inquire about the transitional housing Abellʹs
stipends paid for to see if the same option would be available to EIP participants.
The Foundation also funds the Womenʹs Housing Coalition and the Druid Heights Community
Development Corporation. Both work to guarantee housing for their target populations. Abell
gave the DHCDC $100,000 in 2010 toward the purchase of a six‐unit apartment building to
provide housing to clients in the Maryland Reentry Program. This program was meant as a next
stop for those participants graduating from transitional housing, who have stable employment,
and are moving towards independent living. Abell believes that ʺby providing stable housing
for up to one year, clients benefit from case management, job training, life‐skills training, and
job placementʺ. While the EIP will ensure job training, life‐skills, and job placement it must form
partnerships with organizations that can help identify stable housing options.
Funding Criteria
The Abell Foundation gives priority to, among other things:
1. ʺCommunity service organizations seeking to reach underserved, disadvantaged, and
ʺat‐riskʺ populations, in order to help them more fully participate as contributing
members of the community.ʺ
2. ʺPrograms that increase the availability and effectiveness of substance abuse treatment
and initiatives focusing on criminal justice, crime reduction, and transitional services for
returning ex‐offenders.ʺ
3. ʺCommunity development projects stabilizing and revitalizing neighborhoods.ʺ
4. ʺWorkforce development activities designed to strengthen skill training opportunities
for low income, underemployment, and unemployed workers and seek job replacements
providing family‐sustaining wagesʺ.

22
The EIP targets the right population and providing this population the kind of opportunities
that Abell values. However, just as with the Second Chance Act grant money, it has to form
strategic partnerships with organizations that can provide counseling and housing assistance.
Aside from ensuring a better success rate with investment opportunities for the program, those
partnerships can help increase the sustainability of the EIP efforts and increase the chances of
participants not recidivating. The partnerships are symbolic of the collaborative nature of these
enterprises, efficient in terms of funding allocation, and can help generate greater community
buy‐in.
23
Conclusions
We began with a vision harnessing entrepreneurship to empower new leaders in Baltimore
communities, and realized the ultimate potential for the EIP to become a network championing
the next generation of reentry initiatives. Thus, in the spirit of PEP, we advocate the creation of
a Fellowship of Baltimore Entrepreneurs. We also discovered the likelihood for overall
community involvement through a series of strategic partnerships. The proposed EIP design is
flexible in order to capitalize on the strengths of multiple host organizations and funding
opportunities. It is intended as an addition to the current employment and reentry initiatives;
thus, resource maximization is achieved as partners share best practices.
We are confident that our curriculum, strategic focus on partnerships, and enrollment flexibility
(open to both ex and non‐offenders), will ensure that the EIP is a valuable and sustainable
complement to current Baltimore reentry initiatives. We found that an Entrepreneurship
Incubator Program would be cost‐effective and create significant social value for the City of
Baltimore. We estimate net benefit from an MOED‐implemented EIP to be $5.653 million after
five years operation, directly reaching 880 clients. We predict 19% three‐year recidivism rate for
our sample‐ a major improvement on Maryland’s 50% historical average.

24
ENDNOTES
1 Pew Center on the States, Prison Count 2010: State Population Declines for the First Time in 38 Years. Washington, DC: The Pew Charitable Trusts, April 2010. p 1. 2 US Census Bureau, 2010 Decennial Census. 2010. 3 Ibid. 4 Morello, Carol. “Maryland changes how prisoners are counted in Census.” Washington Post, April 15, 2010. Metro, http://www.washingtonpost.com/wp dyn/content/article/2010/04/14/AR2010041404600.html 5 La Vigne, N., V. Kachnowski, J. Travis, R. Naser and C. Visher. A Portrait of Prisoner Reentry in Maryland. 2003. Washington, DC: The Urban Institute, Justice Policy Center. 6 John Roman, L. Brooks, E. Lagerson, A. Chalfin and B. Tereshchenko. Impact and Cost-Benefit Analysis of the Maryland Reentry Partnership Initiative. 2007. Washington, DC: The Urban Institute, Justice Policy Center, p 1. 7 La Vigne, N., V. Kachnowski, J. Travis, R. Naser and C. Visher. A Portrait of Prisoner Reentry in Maryland. 2003. Washington, DC: The Urban Institute, Justice Policy Center p 12. 8 Ibid, p 10. 9 Henrichson, Christian, and Delaney, Ruth. The Price of Prisons: What Incarceration Costs Taxpayers. New York: Vera Institute of Justice, 2012, p 10. 10 Ibid, p 8. 11 Ibid. 12 Ibid. 13 Roman, J., Brooks, L. E. Lagerson, L., Chalfin, A., and Tereshchenko, B. Impact and Cost-Benefit Analysis of the Maryland Reentry Partnership Ininiative. 2007. Washington, DC: The Urban Institute, p 13. 14 Pew Center on the States, State of Recidivism: The Revolving Door of America’s Prisons (Washington, DC: The Pew Charitable Trusts, 2011), p 2. 15 US Bureau of Labor Statistics. Metropolitan Employment and Unemployment Report. March 2012. 16 Ibid. 17 Heinrich, S. Reducing Recidivism Through Work. 2000. Chicago, Illinois: University of Chicago, Great Cities Institute. 18 Jackson, S. When theft is worse than murder. June 1990. June, pp 88 – 91. 19 FY 2011 Maryland Executive Budget, 2010. Maryland Parole Commission (Q00C01). 20 Sonfield, M. Entrepreneurship and Prisoner Re-Entry: The Development of a Concept. 2008 Small Business Institute® Research Review, Volume 35, 2008. 21 Thetford, T., & E. Edgcomb. Microenterprises in the U.S. Informal Economy: A Summary of Research Findings. 2004. FIELD Forum 15.

25
22 Lindhal, M. & Mukamal, D. Venturing Beyond the Gates: Facilitating Successful Reentry with Entrepreneurship. Summer 2007. Prisoner Reentry Institute, John Jay College of Criminal Justice, p 16. 23 Ibid. 24 Lindhal, M. & Mukamal, D. Venturing Beyond the Gates: Facilitating Successful Reentry with Entrepreneurship. Summer 2007. Prisoner Reentry Institute, John Jay College of Criminal Justice. 25 Prison Entrepreneurship Program. Prison Entrepreneurship Program Annual Report 2011. April 2012. 26 Prison Entrepreneurship Program. 2010 IRS Form 990 and Audited Financial Statement. December 2010. 27 Prison Entrepreneurship Program. Prison Entrepreneurship Program Annual Report 2011. April 2012, p 4. 28 Kaplan, Robert S., and David P. Norton. "The Balanced Scorecard: Measures That Drive Performance." Harvard Business Review 70, no. 1 (1992): 71. 29 Ibid, p 72. 30 Kaplan, Robert S. "Strategic Performance Measurement and Management in Nonprofit Organizations." Nonprofit Management & Leadership 11, no. 3 (2001): 353–370. 31 Niven, P. R. Balanced Scorecard Step-by-Step for government and nonprofit agencies (2nd ed.). 2008. Hoboken, N.J.: Wiley. 32 Kaplan, Robert S., and David P. Norton. Using the Balanced Scorecard as a Strategic Management System. 1996. Harvard Business Review 74, no. 1: 75–85. 33 Maryland Parole Commission, Department of Public Safety and Correctional Services, Q00C01. 2011. p 10. 34 Ibid. 35 Maryland Parole Commission, Department of Public Safety and Correctional Services, Q00C01. 2012. p 14. 36 Ibid. 37 Maryland Parole Commission, Department of Public Safety and Correctional Services, Q00C01. 2011. p 10. 38 Education Reduces Crime, Three-State Recidivism Study - Executive Summary is published through a partnership between Correctional Education Association (CEA) and Management & Training Corporation Institute (MTCI), February 2003. 39 Shane, Jon M. Activity-Based Budgeting: Creating a Nexus between Workload and Costs. 2005. FBI Law Enforcement Bulletin, 74(6):11-23. 40 Education Pays. Bureau of Labor Statistics, United States Department of Labor. 2011. http://www.bls.gov/emp/ep_chart_001.htm
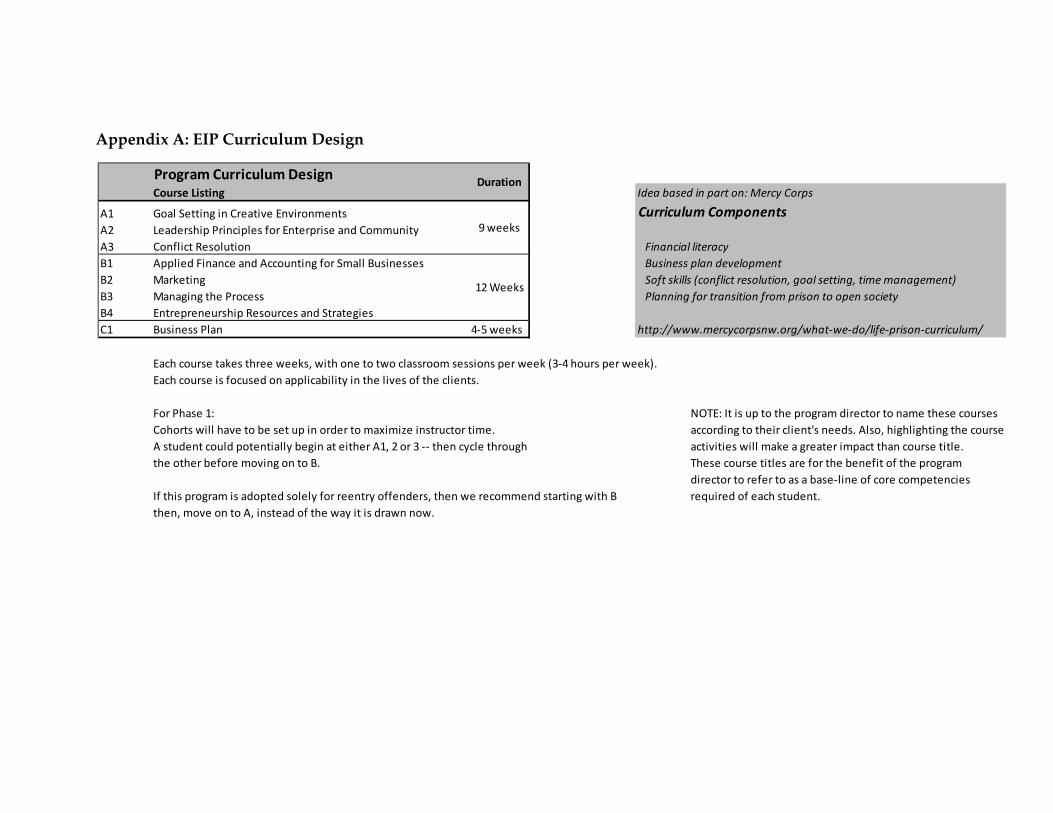
Appendix A: EIP Curriculum Design
Program Curriculum DesignCourse Listing Idea based in part on: Mercy Corps
A1 Goal Setting in Creative Environments Curriculum ComponentsA2 Leadership Principles for Enterprise and CommunityA3 Conflict Resolution Financial literacyB1 Applied Finance and Accounting for Small Businesses Business plan developmentB2 Marketing Soft skills (conflict resolution, goal setting, time management)B3 Managing the Process Planning for transition from prison to open societyB4 Entrepreneurship Resources and StrategiesC1 Business Plan 4‐5 weeks http://www.mercycorpsnw.org/what‐we‐do/life‐prison‐curriculum/
Each course takes three weeks, with one to two classroom sessions per week (3‐4 hours per week).Each course is focused on applicability in the lives of the clients.
For Phase 1: NOTE: It is up to the program director to name these coursesCohorts will have to be set up in order to maximize instructor time. according to their client's needs. Also, highlighting the courseA student could potentially begin at either A1, 2 or 3 ‐‐ then cycle through activities will make a greater impact than course title.the other before moving on to B. These course titles are for the benefit of the program
director to refer to as a base‐line of core competenciesIf this program is adopted solely for reentry offenders, then we recommend starting with B required of each student. then, move on to A, instead of the way it is drawn now.
9 weeks
12 Weeks
Duration

Appendix B: EIP Pilot Budget
Pilot (~30 Students)Personnel Number FT/PT Salary (annual) Multiplier* Total CommentsProgram Director 1 FT 70,000.00$ 1.2524 87,668.00$ Bureau of Labor Statistics ‐‐ see Employee Costs Breakdown tabInstructor/Counselor 1 FT 45,000.00$ 1.2524 56,358.00$ Volunteer Instructors 2 to 3 PT ‐$ 1.2524 ‐$ Volunteer Admin 2 PT ‐$ 1.2524 ‐$
Facilities Cost (6 months) Facilities only needed for six months during pilot stage.MOED 0 ‐$ For Pilot Program, Assume Facilities are absorbed by sponsoring organizationStand‐Alone Non‐Profit 14,000.00$ Classroom size = 750 sqft x 2, plus 500 sqft aux space = 2000 sqft total.**
Rental prices estimated at $14 per sqft per yr after conducting survey of prices.Utilities Cost 1,200.00$
Misc.Supplies 4,000.00$ Classroom materials including tables, chairs, blackboard, stationary, etc.Case Competition Prizes 10,000.00$
Total Costs MOED 158,026.00$ Total Costs Stand‐Alone NP 173,226.00$
*http://www.bls.gov/news.release/ecec.nr0.htm** ‐ http://www.asu.edu/fm/documents/Classroom_Design_Guide.pdf
Org Design Budget Pro Forma

Appendix C: EIP Phase I Budget
Phase 1 (~100 Students)Personnel Number FT/PT Salary (annual) Multiplier* Total CommentsProgram Director 1 FT 85,000.00$ 1.2524 106,454.00$ Multiplier: Bureau of Labor Statistics ‐‐ see Employee Costs Breakdown tabInstructor/Counselor 1 FT 60,000.00$ 1.2524 75,144.00$ Instructor 2 FT 45,000.00$ 1.2524 112,716.00$ Administrator 1 FT 45,000.00$ 1.2524 56,358.00$ Accountant 1 FT 55,000.00$ 1.2524 68,882.00$ Fundraiser 1 FT 55,000.00$ 1.2524 68,882.00$ Volunteer Instructors 2 to 3 PT ‐$ 1.2524 ‐$ Volunteer Admin 2 PT ‐$ 1.2524 ‐$
Facilities Cost (12 months) Facilities only needed for six months during pilot stage.MOED 16,800.00$ For stage one, auxiliary space may be neededStand‐Alone Non‐Profit 28,000.00$ Classroom size = 750 sqft x 2, plus 500 sqft aux space = 2000 sqft total.**
Rental prices estimated at $14 per sqft per yr after conducting survey of prices.Utilities Cost 1,200.00$
Misc.Supplies (Stand‐Alone) 3,000.00$ Ongoing materials needed less startup costs (desks, chairs, etc.)Supplies (MOED) 4,000.00$ Maintenance of Space (Stand‐Alone) 2,000.00$ Maintenance of Space (MOED) 500.00$ Case Competition Prizes 10,000.00$
Total Annual Costs MOED 520,936.00$ Total Annual Costs Stand‐Alone NP 532,636.00$
*http://www.bls.gov/news.release/ecec.nr0.htm** ‐ http://www.asu.edu/fm/documents/Classroom_Design_Guide.pdf
Org Design Budget Pro Forma

Appendix D: EIP Phase II Budget
Phase 2 (~250 Students)Personnel Number FT/PT Salary (annual) Multiplier* Total CommentsProgram Director 1 FT 85,000.00$ 1.2524 106,454.00$ Multiplier: Bureau of Labor Statistics ‐‐ see Employee Costs Breakdown tabInstructor/Counselor 2 FT 60,000.00$ 1.2524 150,288.00$ Instructor 5 FT 45,000.00$ 1.2524 281,790.00$ Administrator 1 FT 45,000.00$ 1.2524 56,358.00$ Accountant 1 FT 55,000.00$ 1.2524 68,882.00$ Fundraiser 1 FT 55,000.00$ 1.2524 68,882.00$ Volunteer Instructors 4 PT ‐$ 1.2524 ‐$ Volunteer Admin 6 PT ‐$ 1.2524 ‐$
Facilities Cost (12 months) Facilities only needed for six months during pilot stage.Facilities 56,000.00$ For Stage Two, more space will be needed: estimated 4000 sqft (4 classrooms)
Classroom size = 750 sqft x 4, plus 1000 sqft aux space = 4000 sqft total.**Rental prices estimated at $14 per sqft per yr after conducting survey of prices.
Utilities Cost 2,400.00$
Computer Lab Computers (x10) 5,000.00$ Desks/Chairs 500.00$ Printers (x2) 1,000.00$ Internet Costs (80 per month) 960.00$
Misc.Supplies 7,000.00$ Ongoing materials needed less startup costs (desks, chairs, etc.)Maintenance of Space 2,000.00$ Case Competition Prizes 15,000.00$
Total Annual Costs 822,514.00$
*http://www.bls.gov/news.release/ecec.nr0.htm** ‐ http://www.asu.edu/fm/documents/Classroom_Design_Guide.pdf
Org Design Budget Pro Forma
Appendix E: Balanced Scorecard
Objective Meaning Measurements Targets Initiatives Prime Objective: What is the overarching goal of our program? Provide tools,
training, and resources to improve lives of ex‐offenders and their communities through legitimate entrepreneurial enterprise.
Many ex‐offenders demonstrate tremendous entrepreneurial ability but face significant barriers to joining the legitimate marketplace. Others are aware of potential business development opportunities, but lack the training and financial tools to assess these opportunities. By providing ex‐offenders struggling to fit into society with the tools to succeed, we strive to reduce their chances of a return to crime and increase their ability to become positive members of society.
Stakeholder Perspective: What client and community needs must we meet in order to achieve our vision?
B01
Develop and create opportunity for entrepreneurial capacity
Assist clients in developing their own entrepreneurial abilities, enabling them to compete and succeed in the legitimate marketplace. Provide the tools and training to assess and develop legitimate business opportunities.
Curriculum completion rate
75% Of participants achieve 80% or better on all final assessments
Smith mentors program: Each participant is paired with a University of Maryland MBA student who will provide up to three hours per week of assistance.
B02
Reduce crime and recidivism
Crime creates costs and lowers quality of life for offenders, their families, and their communities. We seek to reduce crime by helping at‐risk clients create their own opportunities in legitimate business, rather than falling into a cycle of recidivism.
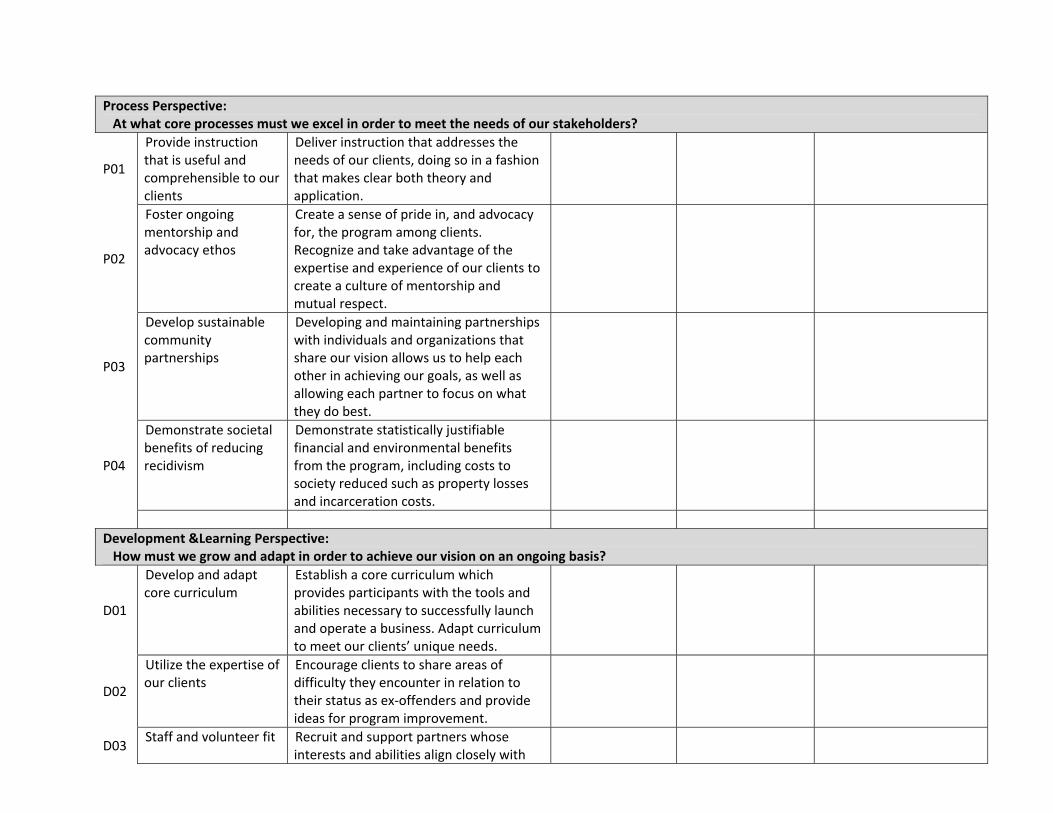
Process Perspective: At what core processes must we excel in order to meet the needs of our stakeholders?
P01
Provide instruction that is useful and comprehensible to our clients
Deliver instruction that addresses the needs of our clients, doing so in a fashion that makes clear both theory and application.
P02
Foster ongoing mentorship and advocacy ethos
Create a sense of pride in, and advocacy for, the program among clients. Recognize and take advantage of the expertise and experience of our clients to create a culture of mentorship and mutual respect.
P03
Develop sustainable community partnerships
Developing and maintaining partnerships with individuals and organizations that share our vision allows us to help each other in achieving our goals, as well as allowing each partner to focus on what they do best.
P04
Demonstrate societal benefits of reducing recidivism
Demonstrate statistically justifiable financial and environmental benefits from the program, including costs to society reduced such as property losses and incarceration costs.
Development &Learning Perspective: How must we grow and adapt in order to achieve our vision on an ongoing basis?
D01
Develop and adapt core curriculum
Establish a core curriculum which provides participants with the tools and abilities necessary to successfully launch and operate a business. Adapt curriculum to meet our clients’ unique needs.
D02
Utilize the expertise of our clients
Encourage clients to share areas of difficulty they encounter in relation to their status as ex‐offenders and provide ideas for program improvement.
D03 Staff and volunteer fit Recruit and support partners whose interests and abilities align closely with

the vision of the program.
D04 Staff and volunteer satisfaction
In order to retain the best partners and volunteers, we must ensure that they find their efforts fulfilling.
Budgetary Perspective: How must we manage financial resources in order to ensure the sustainability of our program?
B01 Maintain breakeven budget
In order to ensure program sustainability, we must operate at or below our breakeven budget.
B02
Clearly demonstrate program costs and drivers
In order to obtain trust and support from stakeholders, our program must ensure fiscal transparency and demonstrate responsible use of funds.

Appendix F: Cost Benefit Analysis
Years 1 2 3 4 5Program Phases Pilot 1 2 2 2Program Size 30 100 250 250 250% At risk 50% 50% 50% 50% 50%Program Cost 158,026.00$ 520,936.00$ 822,514.00$ 822,515.00$ 822,516.00$ Cost per participant 5,267.53$ 5,209.36$ 3,290.06$ 3,290.06$ 3,290.06$
At Risk Pop. 15 50 125 125 125
Recidivism % yr 1 24% 24% 24% 24% 24%Recidivism % yr 2 14% 14% 14% 14%Recidivism % yr3 12% 12% 12%
MD Recidivism % 24% 38% 50% 50% 50%
At Risk Recidivates 3.6 19 62.5 62.5 62.5
Target Recidivism % yr 1 9% 9% 9% 7% 6%Target Recidivism % yr 2 5.3% 5.3% 5.3% 4.2%Target Recidivism % yr 3 4.5% 4.5% 3.6%
Program Target Recidivism % 9% 14% 19% 17% 14%
Difference in persons 2.3 11.9 39.1 41.3 45.6
Cost to Incarcerate 37,715$ 37,715$ 37,715$ 37,715$ Cost to P&P services 3,600$ 3,600$ 3,600$ Cost per Arrest 650$ 650$ 650$ 650$ 650$ Cost to Process 74$ 74$ 74$ 74$ 74$ Court Appearance 977$ 977$ 977$ 977$ 977$ Monetized Cost to Victims 20,787$ 20,787$ 20,787$ 20,787$ 20,787$
Total Costs per 22,488.00$ 60,203.00$ 63,803.00$ 63,803.00$ 63,803.00$
Savings (Lower Recidivism) 50,598.00$ 714,910.63$ 2,492,304.69$ 2,635,861.44$ 2,906,226.65$
CBA from Prog. Costs (107,428.00)$ 193,974.63$ 1,669,790.69$ 1,813,346.44$ 2,083,710.65$
CBA Ratio 0.32 1.37 3.03 3.20 3.53

Appendix G: Second Chance Act Mandatory Requirements
1. An applicant must have a long‐term strategy, including ʺmeasurable annual and 5‐year
performance outcomesʺ all with the goal of reducing recidivism and increasing safety within
the community. Specifically, the proposal should guarantee a 50% reduction in the
recidivism rate.
2. The implementation schedule must be detailed and account for proposed programʹs
sustainability.
3. The program must establish a Reentry Task Force representative of the majority of affected
stakeholders. This requirement seeks to encourage the pooling of resources and funding
streams, as well as utilizing best practices across organizations. The BJA also notes that this
Task Force is an opportunity for local policymakers to work collaboratively and to identify
barriers to reentry that may be policy‐related or procedural in nature.
4. As the proposal must consist of partnerships, it must also identify specific roles assumed by
all stakeholders. The proposal must include certification of any agency or organization
involvement.
5. The reentry proposal should account for a variety of reentry needs‐ such as health, mental
health, housing, child welfare, substance abuse, victim services, employment services, etc.
6. Corrections departments (state, community, and local) must have a voice in the form of
letters of support.
7. The proposal must provide an evidence‐based methodology and measure to evaluate
program performance.
8. Program must be replicable.

Appendix H: Activity Based Budgeting for Cost of Crime Analysis
* From Shane, Jon M. Activity‐Based Budgeting: Creating a Nexus between Workload and Costs. 2005, p. 7.

Appendix I: Activity Based Budgeting for Cost of Crime Analysis
* From Shane, Jon M. Activity‐Based Budgeting: Creating a Nexus between Workload and Costs. 2005, p. 16.


![Innovation & Entrepreneurship - Global · Innovation & Entrepreneurship [ I&E ] Yogesh Joshi Robert H. Smith School of Business, U. Maryland IITB - BTech Mech Engg 1998 IITB FAN &](https://img.pdfslide.net/doc/110x75/5e1ca45dabbb0942f94cf33f/innovation-entrepreneurship-global-innovation-entrepreneurship-ie.jpg)