Embed Size (px)
DESCRIPTION
The Regional Pertinence of University-Generated Knowledge. Robert Huggins Cardiff School of Management, University of Wales Institute, Cardiff Andrew Johnston Faculty of Organisation and Management, Sheffield Hallam University - PowerPoint PPT Presentation
Citation preview

Robert Huggins
Cardiff School of Management,
University of Wales Institute, Cardiff
Andrew JohnstonFaculty of Organisation and Management,
Sheffield Hallam University
Presentation at the ‘48th Congress of the European Regional Science Association’
Liverpool, 30th August, 2008
The Regional Pertinence of University-Generated Knowledge

University-Generated Knowledge and Regional University-Generated Knowledge and Regional DevelopmentDevelopment
As knowledge becomes an increasingly important part As knowledge becomes an increasingly important part of regional innovation and development processes, the of regional innovation and development processes, the role of universities has come to the fore of regional role of universities has come to the fore of regional innovation and economic development policyinnovation and economic development policy..
Universities and other higher education institutions Universities and other higher education institutions (HEIs) have come to be regarded as key sources of (HEIs) have come to be regarded as key sources of knowledge utilisable in the pursuit of economic knowledge utilisable in the pursuit of economic growth, with knowledge and technology transfer growth, with knowledge and technology transfer attaining a more important role within universities.attaining a more important role within universities.
However, it is often difficult to ascribe improved However, it is often difficult to ascribe improved regional competitiveness to developments in regional competitiveness to developments in knowledge-based infrastructure.knowledge-based infrastructure.
The Transfer and Commercialisation of University-The Transfer and Commercialisation of University-Generated KnowledgeGenerated Knowledge
The transfer and commercialisation of university-generated knowledge is The transfer and commercialisation of university-generated knowledge is also taking a stronger role within government policies at a number of levels also taking a stronger role within government policies at a number of levels (e.g. Lambert Review).(e.g. Lambert Review).
Many governments and their agencies are turning their attention to the Many governments and their agencies are turning their attention to the role of HEI knowledge commercialisation in developing innovative, role of HEI knowledge commercialisation in developing innovative, sustainable and prosperous regional (and national economies).sustainable and prosperous regional (and national economies).
However, regional contexts, and the universities located in them differ, However, regional contexts, and the universities located in them differ, suggesting that the relevance of these processes in both economic and suggesting that the relevance of these processes in both economic and policy terms will differ across regions and institutions.policy terms will differ across regions and institutions.
In economic terms, regions may differ in their ‘dependence’ on the higher In economic terms, regions may differ in their ‘dependence’ on the higher education sector as a generator of both income and innovation.education sector as a generator of both income and innovation.
In policy terms, there is an underlying assumption that the knowledge In policy terms, there is an underlying assumption that the knowledge generated by universities can be best made use of by networking it generated by universities can be best made use of by networking it regionally (or locally), when increasing evidence suggests that the best use regionally (or locally), when increasing evidence suggests that the best use of knowledge is made by linking it globally (or least non-regionally/locally).of knowledge is made by linking it globally (or least non-regionally/locally).

This PresentationThis Presentation
The objective of this presentation is The objective of this presentation is to provide an initial (quantitative) to provide an initial (quantitative) exploration of some of these issues exploration of some of these issues in the context of the 12 UK regions, in the context of the 12 UK regions, covering regional differences in the:covering regional differences in the:
Wealth-generating capacity of the Wealth-generating capacity of the higher education sector.higher education sector.
Knowledge-generating capacity of Knowledge-generating capacity of the higher education sector.the higher education sector.

Value Added and ProductivityValue Added and Productivity In a corporate context, Value Added is the wealth created by a In a corporate context, Value Added is the wealth created by a
company.company.
Value Added = Sales less Costs of bought-in goods and services.Value Added = Sales less Costs of bought-in goods and services.
Company Value Added can be calculated from a company’s Company Value Added can be calculated from a company’s
accounts by adding together operating profit, employee costs, accounts by adding together operating profit, employee costs,
depreciation and amortisation/impairment charges.depreciation and amortisation/impairment charges.
Calculating Value Added for the Higher Education: adding together Calculating Value Added for the Higher Education: adding together
surplus, employee costs, and depreciation.surplus, employee costs, and depreciation.
The combined Value Added of firms and other organisations can The combined Value Added of firms and other organisations can
be aggregated as the Gross Value Added of a region or nation be aggregated as the Gross Value Added of a region or nation
(similar to Gross Domestic Product).(similar to Gross Domestic Product).
Productivity, or more correctly in this case ‘labour productivity’, Productivity, or more correctly in this case ‘labour productivity’,
refers to the Value Added generated per employee.refers to the Value Added generated per employee.
RankRank Higher Education InstitutionHigher Education Institution
Value Added Value Added per FTE per FTE (£)(£)
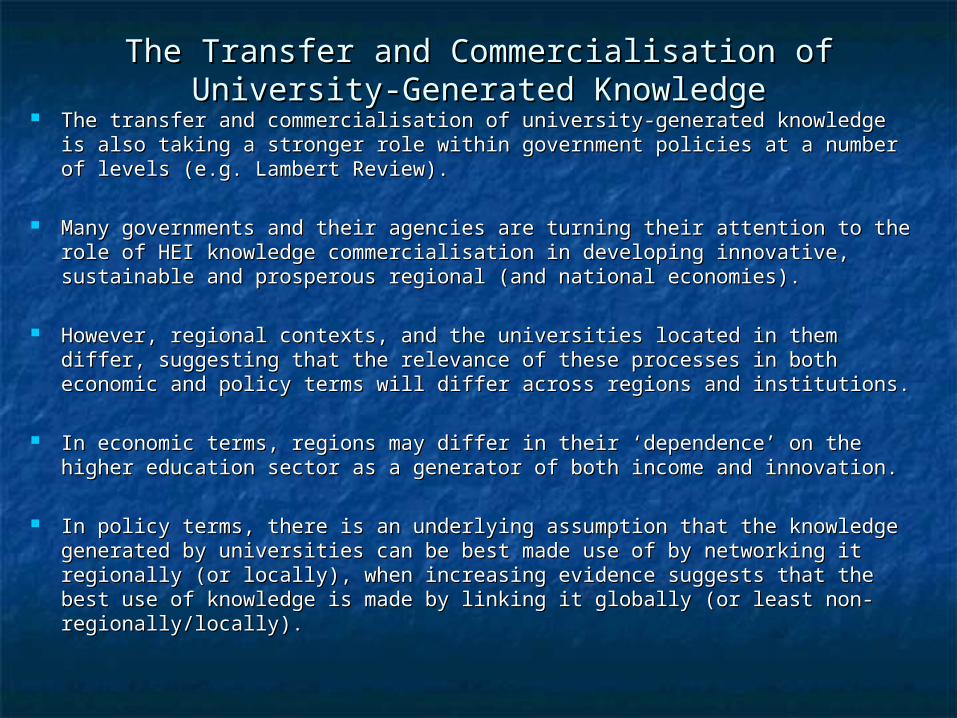
11 London Business School London Business School 70,33270,332
22 St George's Hospital Medical School St George's Hospital Medical School 60,35260,352
33 University of Cambridge University of Cambridge 60,12560,125
44 King's College London King's College London 57,31257,312
55 University College London University College London 54,44354,443
66 Imperial College London Imperial College London 54,23054,230
77 Royal College of Music Royal College of Music 54,05754,057
88 City University, London City University, London 51,58751,587
99 London School of Economics and Political Science London School of Economics and Political Science 51,51251,512
1010 Royal Veterinary College Royal Veterinary College 50,39950,399
1111 Kingston University Kingston University 49,73549,735
1212 University of London University of London 49,45649,456
1313 Birmingham College of Food, Tourism and Creative Studies Birmingham College of Food, Tourism and Creative Studies 48,94948,949
1414 School of Pharmacy School of Pharmacy 48,88348,883
1515 Royal Academy of Music Royal Academy of Music 48,71848,718
1616 University of Surrey University of Surrey 48,34448,344
1717 London School of Hygiene & Tropical Medicine London School of Hygiene & Tropical Medicine 48,30948,309
1818 London South Bank University London South Bank University 47,18747,187
1919 Institute of Cancer Research Institute of Cancer Research 46,94346,943
2020 Royal Holloway, University of London Royal Holloway, University of London 45,96745,967
University Productivity – Value Added per Full-Time Equivalent Employee

RankRank Higher Education InstitutionHigher Education InstitutionValue Added Value Added
per FTE (£)per FTE (£)
139139 Lancaster University Lancaster University 34,72734,727
140140 University of Abertay Dundee University of Abertay Dundee 33,89533,895
141141 Glasgow School of Art Glasgow School of Art 33,77833,778
142142 Liverpool Hope University Liverpool Hope University 33,61533,615
143143 Sheffield Hallam University Sheffield Hallam University 33,52233,522
144144 College of St Mark & St John College of St Mark & St John 33,31633,316
145145 Bath Spa University Bath Spa University 33,31033,310
146146 Buckinghamshire Chilterns University College Buckinghamshire Chilterns University College 33,15533,155
147147 University of Winchester University of Winchester 32,58032,580
148148 Writtle College Writtle College 32,53832,538
149149 University of Plymouth University of Plymouth 32,03632,036
150150 University of Sunderland University of Sunderland 31,72331,723
151151 Cumbria Institute of the Arts Cumbria Institute of the Arts 30,69330,693
152152 Leeds College of Music Leeds College of Music 30,09230,092
153153 University of Wales, Aberystwyth University of Wales, Aberystwyth 29,84929,849
154154 Royal Agricultural College Royal Agricultural College 29,59129,591
155155 Trinity College Carmarthen Trinity College Carmarthen 29,37629,376
156156 Central School of Speech and Drama Central School of Speech and Drama 28,16628,166
157157 University of Chester University of Chester 28,03428,034
158158 Conservatoire for Dance and Drama Conservatoire for Dance and Drama 770770
University Productivity – Value Added per Full-Time Equivalent Employee

RankRank Higher Education InstitutionHigher Education Institution
Value Added Value Added per FTE per FTE
(£)(£)
2929 Cardiff University Cardiff University 43,40343,403
4848 North East Wales Institute of Higher Education North East Wales Institute of Higher Education 40,87040,870
6868 University of Wales Swansea University of Wales Swansea 39,27439,274
8585 University of Wales, Lampeter University of Wales, Lampeter 38,22538,225
8686 University of Wales, Bangor University of Wales, Bangor 38,09838,098
8888 Swansea Institute of Higher Education Swansea Institute of Higher Education 38,05838,058
100100 Royal Welsh College of Music and Drama Royal Welsh College of Music and Drama 37,37837,378
115115 University of Wales Institute, Cardiff University of Wales Institute, Cardiff 36,39036,390
118118 University of Glamorgan University of Glamorgan 36,16036,160
119119 University of Wales, Newport University of Wales, Newport 36,06536,065
153153 University of Wales, Aberystwyth University of Wales, Aberystwyth 29,84929,849
155155 Trinity College Carmarthen Trinity College Carmarthen 29,37629,376
University Productivity in Wales – Value Added per Full-Time Equivalent Employee

University Value Added and ProductivityUniversity Value Added and Productivity
University value added and University value added and productivity appears to be related to productivity appears to be related to geography – place seems to play a geography – place seems to play a role.role.
The ‘performance’ of universities is The ‘performance’ of universities is related to both internal capabilities related to both internal capabilities and external forces.and external forces.
Are these differences relevant at the Are these differences relevant at the regional level?regional level?
RegionRegion
Number of Number of HEIs HEIs per per
RegioRegionn
Population Population per per HEI HEI
(000s)(000s)
Value Value Added Added
per per FTE(£)FTE(£)
Total HE Total HE Value Value Added Added (£000s(£000s
))
Contribution Contribution to to
RegionaRegional GVA l GVA (%)(%)
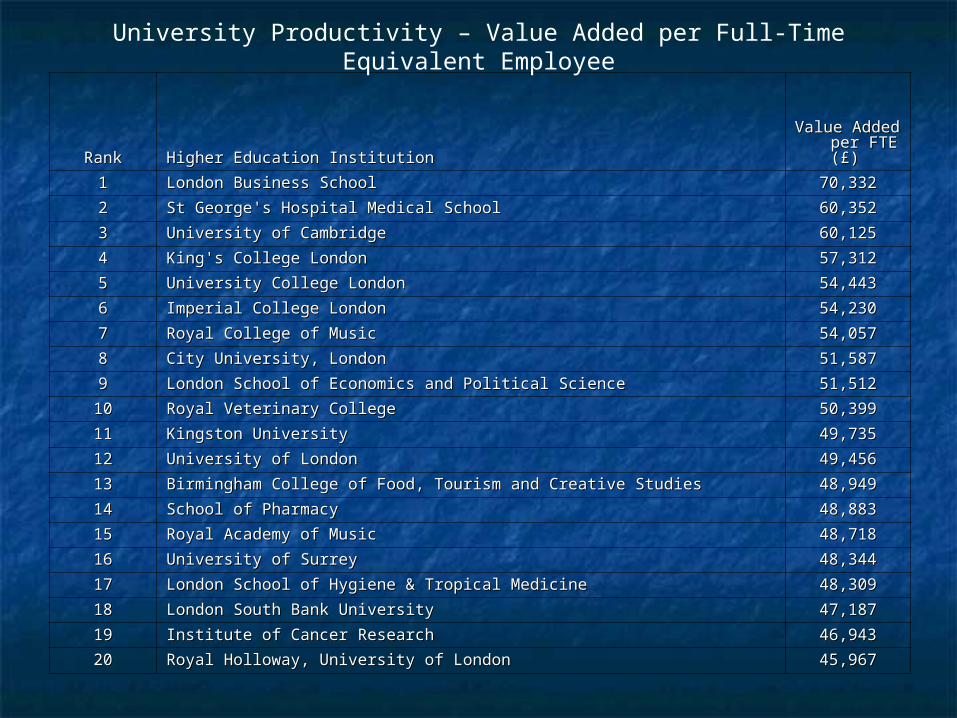
North East North East 55 511.7511.7 38,62438,624 511,966511,966 1.321.32
North West North West 1414 489.0489.0 37,18137,181 1,174,9951,174,995 1.061.06
Yorkshire and the Humber Yorkshire and the Humber 1010 506.4506.4 36,99136,991 1,004,5091,004,509 1.221.22
East Midlands East Midlands 99 478.5478.5 37,40937,409 736,900736,900 0.990.99
West Midlands West Midlands 1212 447.1447.1 40,18340,183 899,526899,526 1.011.01
Eastern England Eastern England 99 615.7615.7 48,01648,016 913,116913,116 0.830.83
London London 3939 192.8192.8 47,37147,371 2,558,4392,558,439 1.301.30
South East South East 1717 480.2480.2 39,98239,982 1,595,9761,595,976 0.900.90
South West South West 1313 389.8389.8 37,05637,056 712,005712,005 0.800.80
Scotland Scotland 1919 268.1268.1 39,53939,539 969,618969,618 1.071.07
Wales Wales 1111 269.0269.0 38,57738,577 578,773578,773 1.361.36
Northern Ireland Northern Ireland 22 862.2862.2 42,48842,488 269,142269,142 1.021.02
UK UK 160160 40,75940,759 1.031.03
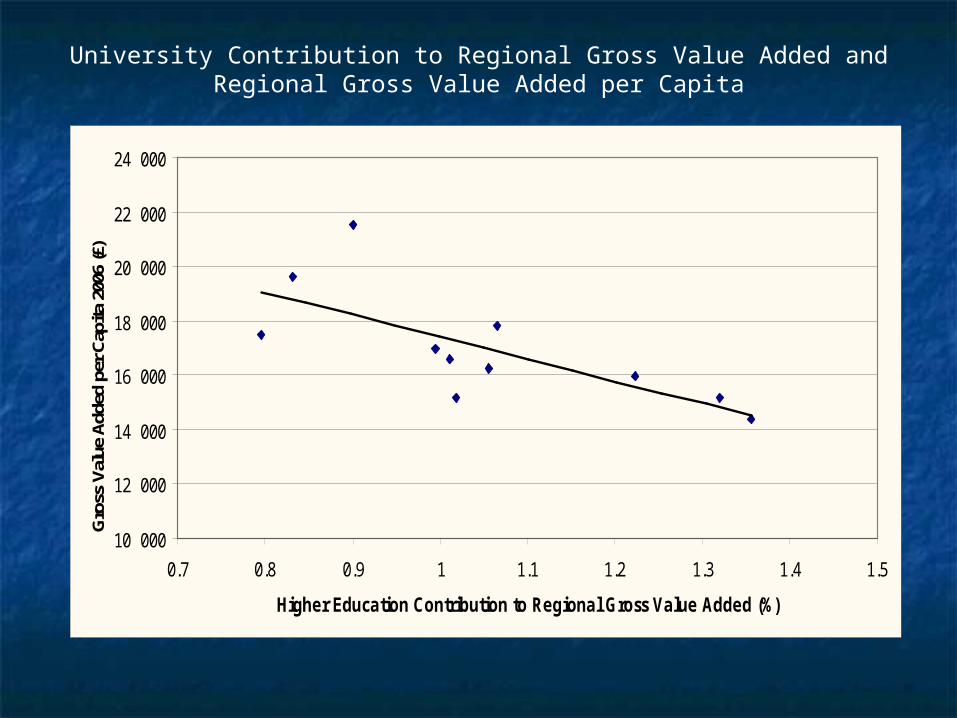
University Contribution to Regional Gross Value Added
10 000
12 000
14 000
16 000
18 000
20 000
22 000
24 000
0.7 0.8 0.9 1 1.1 1.2 1.3 1.4 1.5
Higher Education Contribution to Regional Gross Value Added (%)
Gro
ss V
alue
Add
ed p
er C
apita
200
6 (£
)
University Contribution to Regional Gross Value Added and Regional Gross Value Added per Capita
10 000
12 000
14 000
16 000
18 000
20 000
22 000
24 000
0.10 0.20 0.30 0.40 0.50 0.60 0.70 0.80 0.90
Higher Education R&D Expenditure (HERD) a Proportion of Total Regional R&D Expenditure (GERD)
Gro
ss V
alue
Add
ed p
er C
apita
200
6 (£
)
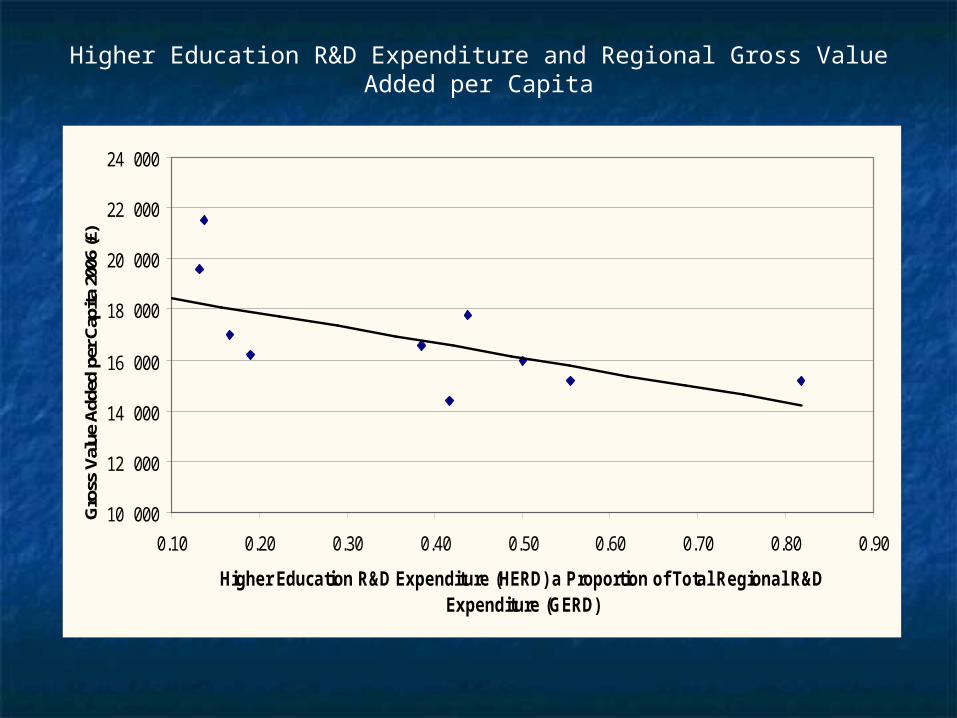
Higher Education R&D Expenditure and Regional Gross Value Added per Capita

RegionRegion
Cumulative Cumulative portfolio of HE portfolio of HE active patents active patents as a proportion as a proportion
of regional of regional patent patent
applicationsapplications
HE Spin-offs per HE Spin-offs per New VAT New VAT
registered registered company 2006 company 2006
(000s)(000s)
North East North East 0.480.48 43.043.0
North West North West 0.200.20 23.923.9
Yorkshire and the Humber Yorkshire and the Humber 0.430.43 29.629.6
East Midlands East Midlands 0.390.39 21.121.1
West Midlands West Midlands 0.310.31 13.213.2
Eastern England Eastern England 0.220.22 8.28.2
London London 1.071.07 20.720.7
South East South East 0.310.31 34.734.7
South West South West 0.170.17 8.08.0
Scotland Scotland 1.281.28 25.625.6
Wales Wales 0.950.95 62.662.6
Northern Ireland Northern Ireland 1.181.18 10.510.5
UK AverageUK Average 0.520.52 23.123.1
Higher Education Contributions to Regional Patenting and New Firm Formation Activities (2005/06)
Universities and RegionsUniversities and Regions Regional economic and innovation Regional economic and innovation
performance is inversely related to performance is inversely related to university dependence.university dependence.
Universities in less competitive regions Universities in less competitive regions also produce less wealth.also produce less wealth.
This implies a potential problem – weaker This implies a potential problem – weaker universities with a responsibility for universities with a responsibility for developing weaker regions.developing weaker regions.
But do they commercialise less But do they commercialise less knowledge?knowledge?
Are problems related to knowledge supply Are problems related to knowledge supply or demand?or demand?

RegionRegion
Contract Contract Research Research per FTE per FTE
Employee Employee 2005-062005-06
Consultancy Consultancy Contracts Contracts per FTE per FTE
Employee Employee 2005-062005-06
IP Income per FTE IP Income per FTE Employee Employee 2005-062005-06
North East North East 2,0802,080 1,6361,636 3737
North West North West 1,2261,226 577577 287287
Yorkshire and the Humber Yorkshire and the Humber 2,2712,271 381381 3333
East Midlands East Midlands 1,1521,152 339339 8787
West Midlands West Midlands 2,6342,634 586586 378378
Eastern England Eastern England 2,3312,331 757757 209209
London London 3,5493,549 930930 129129
South East South East 1,8651,865 977977 207207
South West South West 1,8011,801 1,1451,145 290290
Scotland Scotland 2,6172,617 1,0541,054 444444
Wales Wales 1,5721,572 845845 9999
Northern Ireland Northern Ireland 1,3511,351 242242 1818
UK AverageUK Average 2,1532,153 780780 191191
Higher Education Knowledge Commercialisation Activity (2005/06)

RegionRegion
Internationally Co-authored Internationally Co-authored articles per FTE Employee articles per FTE Employee (annual average 1999-(annual average 1999-2003)2003)
Collaborative research Collaborative research involving both public involving both public funding and funding funding and funding from business per FTE from business per FTE employee2005-06employee2005-06
% of % of CommercialisatiCommercialisation Income on Income Generated from Generated from each HEI's each HEI's RegionRegion
North East North East 0.130.13 3,8443,844 21.9%21.9%
North West North West 0.180.18 2,3522,352 35.1%35.1%
Yorkshire and the Humber Yorkshire and the Humber 0.130.13 1,0401,040 29.8%29.8%
East Midlands East Midlands 0.120.12 2,3582,358 25.5%25.5%
West Midlands West Midlands 0.130.13 1,1481,148 24.4%24.4%
Eastern England Eastern England 0.330.33 2,6052,605 23.3%23.3%
London London 0.250.25 1,3481,348 23.6%23.6%
South East South East 0.260.26 1,8801,880 23.0%23.0%
South West South West 0.150.15 902902 18.2%18.2%
Scotland Scotland 0.270.27 3,1963,196 22.6%22.6%
Wales Wales 0.120.12 4,3484,348 8.4%8.4%
Northern Ireland Northern Ireland 0.140.14 1,7371,737 59.9%59.9%
Higher Education Research Activity and Commercialisation Income(2005/06)
20000
30000
40000
50000
60000
70000
80000
0 5000 10000 15000 20000 25000 30000 35000 40000 45000 50000
Collaborative Research & Commercialisation Income per FTE Employee
Valu
e Ad
ded
per F
TE E
mpl
oyee
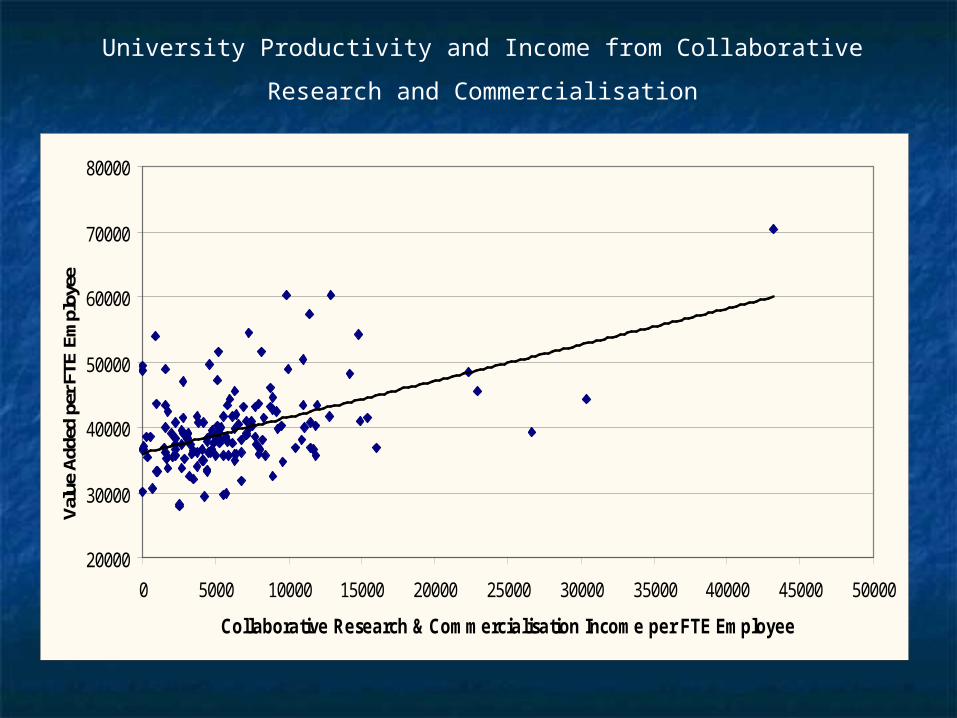
University Productivity and Income from Collaborative
Research and Commercialisation
20000
30000
40000
50000
60000
70000
80000
0 20 40 60 80 100 120
% of Knowledge Commercialisation Activity in Region
Valu
e Ad
ded
per F
TE E
mpl
oyee
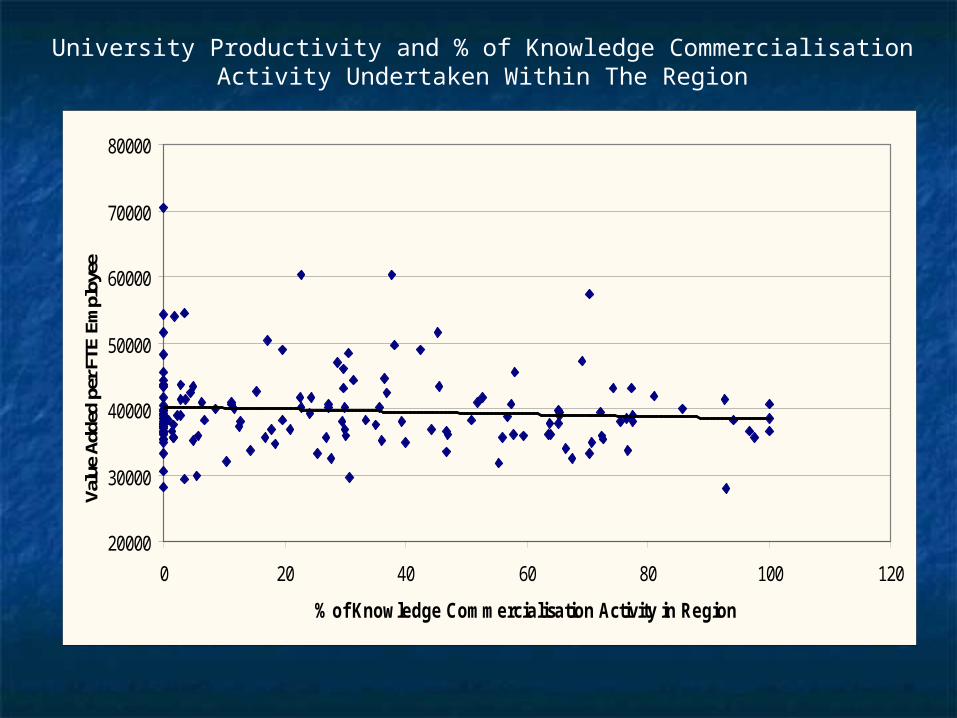
University Productivity and % of Knowledge Commercialisation Activity Undertaken Within The Region
20000
30000
40000
50000
60000
70000
80000
0 1000 2000 3000 4000 5000 6000 7000 8000 9000 10000
Number of FTE Employees
Valu
e Ad
ded
per F
TE E
mpl
oyee
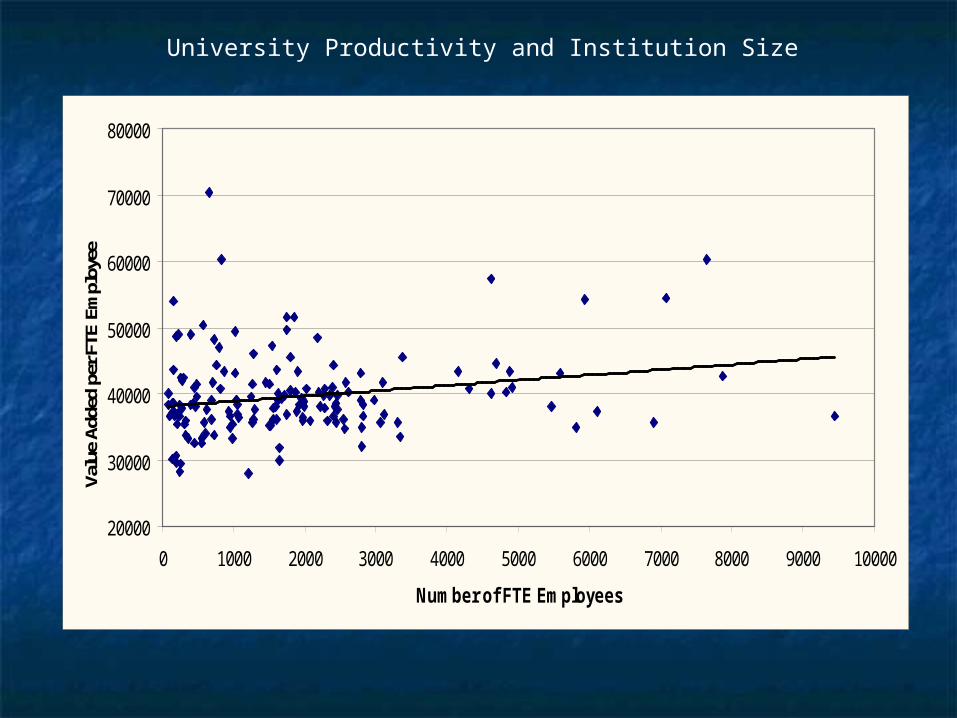
University Productivity and Institution Size

University Productivity and University Productivity and CommercialisationCommercialisation
University productivity is positively related to University productivity is positively related to knowledge commercialisation capabilities.knowledge commercialisation capabilities.
University productivity is University productivity is notnot related to related to knowledge commercialisation undertaken within knowledge commercialisation undertaken within a respective university’s region.a respective university’s region.
Larger universities tend to have higher Larger universities tend to have higher productivity rates.productivity rates.
Demand for university knowledge is Demand for university knowledge is predominantly non-regional (suggesting demand predominantly non-regional (suggesting demand side limitations in some cases).side limitations in some cases).
Who are the key partners and clients within Who are the key partners and clients within university knowledge networks?university knowledge networks?
Final Remarks (1)Final Remarks (1)
There is significant variation in the wealth and knowledge There is significant variation in the wealth and knowledge
generation capabilities of universities across UK regions.generation capabilities of universities across UK regions.
Weaker regions are more dependent on their universities for Weaker regions are more dependent on their universities for
income and innovation, but often these universities under-perform income and innovation, but often these universities under-perform
in comparison to counterpart institutions in more competitive in comparison to counterpart institutions in more competitive
regions.regions.
Knowledge commercialisation activity is a source of productivity Knowledge commercialisation activity is a source of productivity
advantages for universities, but many of these advantages are advantages for universities, but many of these advantages are
accrued via networks beyond the region of location.accrued via networks beyond the region of location.
Markets (or networks) for knowledge in under-competitive regions Markets (or networks) for knowledge in under-competitive regions
appear to possess demand-side weaknesses.appear to possess demand-side weaknesses.
Final Remarks (2)Final Remarks (2) The capability of universities to stimulate regional demand for The capability of universities to stimulate regional demand for
knowledge is probably limited.knowledge is probably limited.
Universities have their own bottom-lines to consider.Universities have their own bottom-lines to consider.
Universities alone cannot shoulder the burden for transforming Universities alone cannot shoulder the burden for transforming the innovation capabilities and knowledge economies of their the innovation capabilities and knowledge economies of their regions.regions.
If universities are to continue to play a regional economic If universities are to continue to play a regional economic development role it is vital that knowledge transfer and development role it is vital that knowledge transfer and networks initiatives are fully supported to ensure sustainability.networks initiatives are fully supported to ensure sustainability.
The onus being placed on universities to become the bases of The onus being placed on universities to become the bases of commercialisable knowledge in many regions is probably too commercialisable knowledge in many regions is probably too heavy.heavy.