Embed Size (px)
Citation preview

Robert J. GordonRobert J. GordonNorthwestern University and NBERNorthwestern University and NBER
EPS Session on Inequality: EPS Session on Inequality: Economic, Fiscal, Financial, and Economic, Fiscal, Financial, and
Societal DimensionsSocietal DimensionsASSA Meetings,ASSA Meetings,
San Francisco, January 3, 2009San Francisco, January 3, 2009
Rising American Rising American Inequality:Inequality:
New Facts and New Facts and InterpretationsInterpretations
““Of Course” Inequality Of Course” Inequality Has Increased, but. . . Has Increased, but. . .
Has the increase been steady and inexorable?Has the increase been steady and inexorable? Are there signs that the rise of inequality has Are there signs that the rise of inequality has
ceased? Could it reverse on its own? Could a ceased? Could it reverse on its own? Could a new set of policies turn it around?new set of policies turn it around?
Does the rise of inequality at all levels of the Does the rise of inequality at all levels of the income distribution have the same time income distribution have the same time pattern?pattern?– No, the bottom 95% behaves differently No, the bottom 95% behaves differently
than the top 5%than the top 5%– Different timing and different hypotheses Different timing and different hypotheses
for the top and the bottomfor the top and the bottom

The Paper is Divided The Paper is Divided into Two Partsinto Two Parts
The first part examines the latest data and The first part examines the latest data and assesses hypotheses that are data-relatedassesses hypotheses that are data-related
The second part summarizes some of the The second part summarizes some of the most interesting recent research that has most interesting recent research that has emerged in the past year or two emerged in the past year or two – In part this is a sequel to my two survey In part this is a sequel to my two survey
papers with Ian Dew-Becker papers with Ian Dew-Becker – Short version (2007 in Brookings)Short version (2007 in Brookings)– Long version (2008 NBER WP)Long version (2008 NBER WP)
The Overall ConclusionThe Overall ConclusionAbout TimingAbout Timing
There is a political chronology of the There is a political chronology of the increase of inequalityincrease of inequality
At 90At 90thth percentile and below the big percentile and below the big increase was in the era of Reagan and increase was in the era of Reagan and Bush IBush I– No increase in the Clinton eraNo increase in the Clinton era– What happened in the era of Bush II?What happened in the era of Bush II?
Above the 95Above the 95thth percentile the increase percentile the increase was continuous from 1975 to 2000 but was continuous from 1975 to 2000 but not afternot after– The top 1% share will be much lower in The top 1% share will be much lower in
2009 than in 2006-072009 than in 2006-07
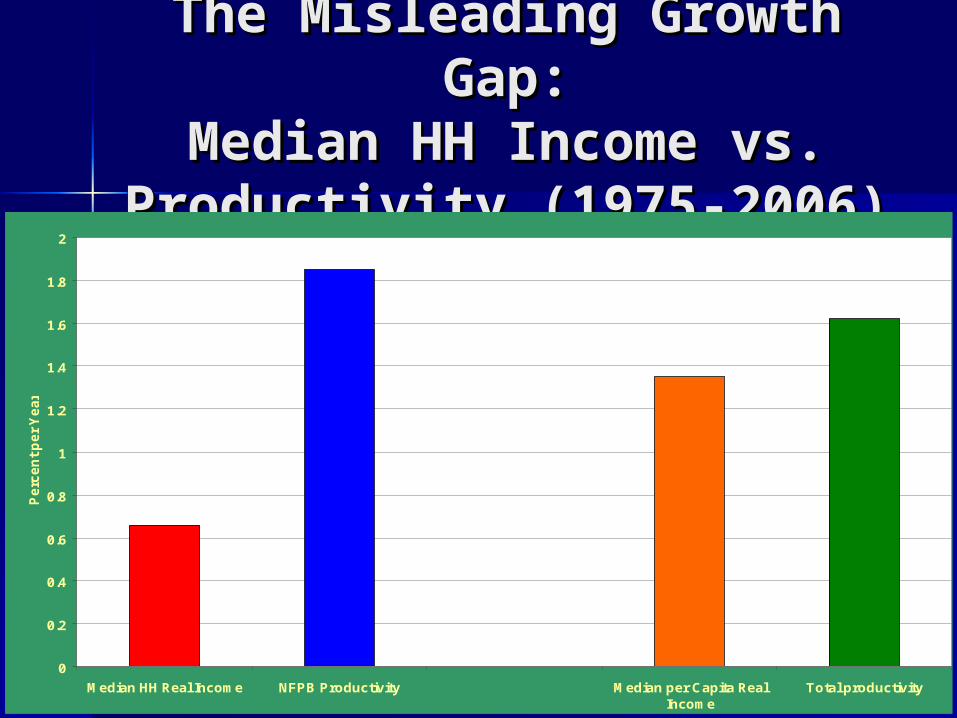
The Misleading Growth The Misleading Growth Gap:Gap:
Median HH Income vs. Median HH Income vs. Productivity (1975-2006)Productivity (1975-2006)
0
0.2
0.4
0.6
0.8
1
1.2
1.4
1.6
1.8
2
Median HH Real Income NFPB Productivity Median per Capita RealIncome
Total productivity
Pe
rce
nt
pe
r Y
ea
r
Why Is the StandardWhy Is the StandardComparison Comparison Misleading?Misleading?
Average Persons per Household has Average Persons per Household has declined at 0.41 percent per yeardeclined at 0.41 percent per year
PCE Deflator has increased 0.14 PCE Deflator has increased 0.14 percent per year slower than CPI-RSpercent per year slower than CPI-RS
GDP Deflator has increased 0.12 GDP Deflator has increased 0.12 percent per year slower than PCE defpercent per year slower than PCE def
What matters is productivity in the What matters is productivity in the total economy total economy not in the NFPB sectornot in the NFPB sector
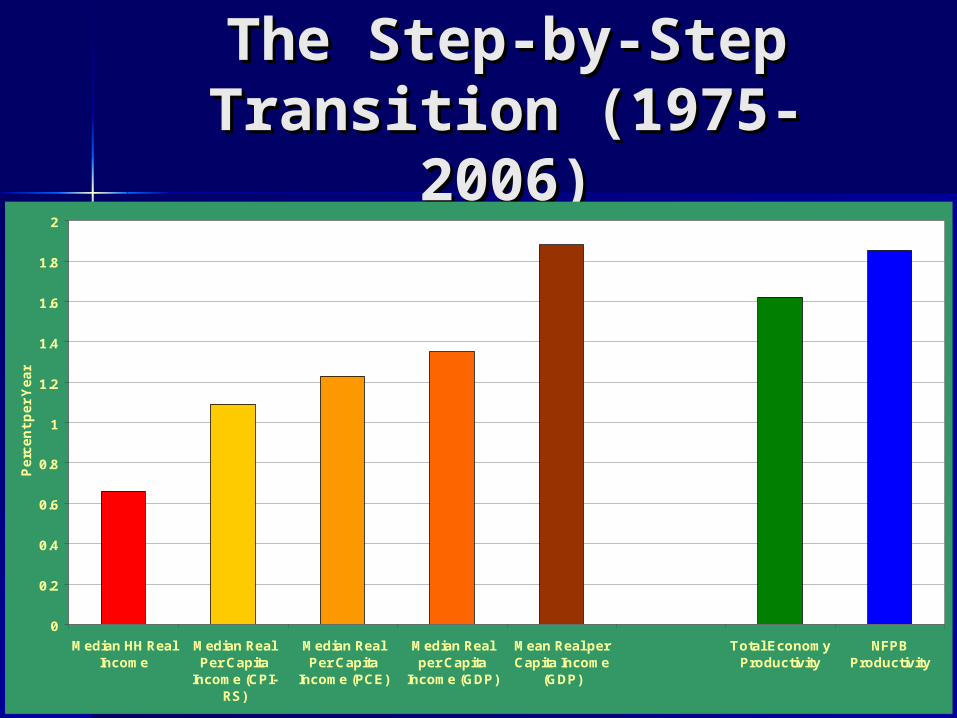
The Step-by-StepThe Step-by-StepTransition (1975-2006)Transition (1975-2006)
0
0.2
0.4
0.6
0.8
1
1.2
1.4
1.6
1.8
2
Median HH RealIncome
Median RealPer Capita
Income (CPI-RS)
Median RealPer Capita
Income (PCE)
Median Realper Capita
Income (GDP)
Mean Real perCapita Income
(GDP)
Total EconomyProductivity
NFPBProductivity
Pe
rce
nt
pe
r Y
ea
r
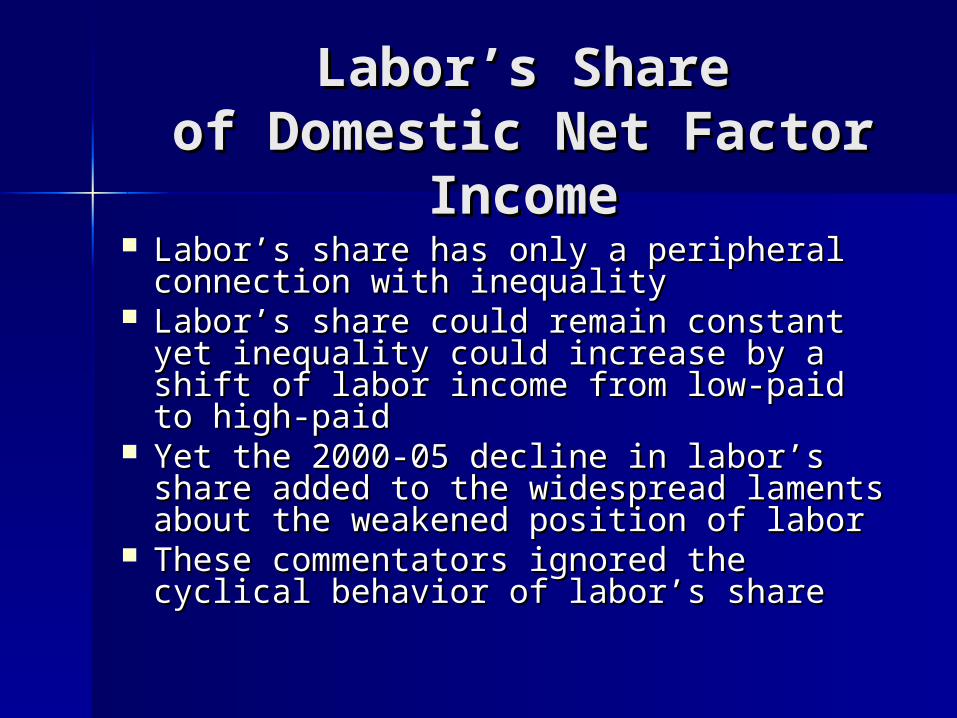
Labor’s ShareLabor’s Shareof Domestic Net Factor of Domestic Net Factor
IncomeIncome Labor’s share has only a peripheral Labor’s share has only a peripheral
connection with inequalityconnection with inequality Labor’s share could remain constant Labor’s share could remain constant
yet inequality could increase by a shift yet inequality could increase by a shift of labor income from low-paid to high-of labor income from low-paid to high-paidpaid
Yet the 2000-05 decline in labor’s share Yet the 2000-05 decline in labor’s share added to the widespread laments about added to the widespread laments about the weakened position of laborthe weakened position of labor
These commentators ignored the These commentators ignored the cyclical behavior of labor’s sharecyclical behavior of labor’s share
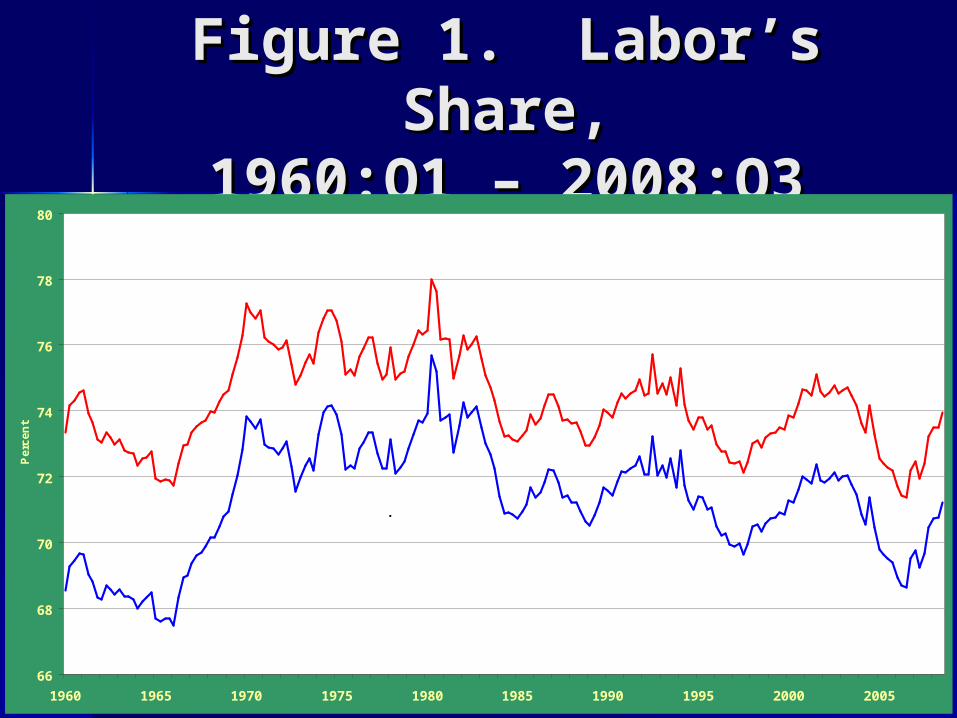
Figure 1. Labor’s Figure 1. Labor’s Share,Share,
1960:Q1 – 2008:Q31960:Q1 – 2008:Q3
66
68
70
72
74
76
78
80
1960 1965 1970 1975 1980 1985 1990 1995 2000 2005
Pe
rce
nt
Employee Compensation with Labor Portion of Proprietors' Income
Employee Compensation
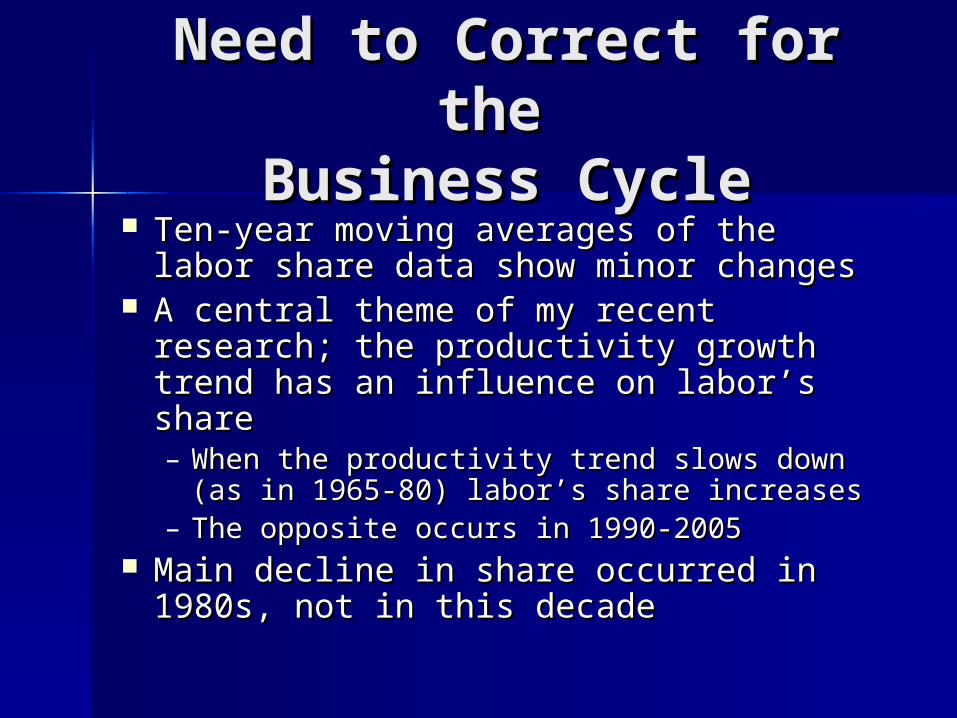
Need to Correct for the Need to Correct for the
Business CycleBusiness Cycle Ten-year moving averages of the labor Ten-year moving averages of the labor
share data show minor changesshare data show minor changes A central theme of my recent research; A central theme of my recent research;
the productivity growth trend has an the productivity growth trend has an influence on labor’s shareinfluence on labor’s share– When the productivity trend slows down When the productivity trend slows down
(as in 1965-80) labor’s share increases(as in 1965-80) labor’s share increases– The opposite occurs in 1990-2005The opposite occurs in 1990-2005
Main decline in share occurred in Main decline in share occurred in 1980s, not in this decade1980s, not in this decade
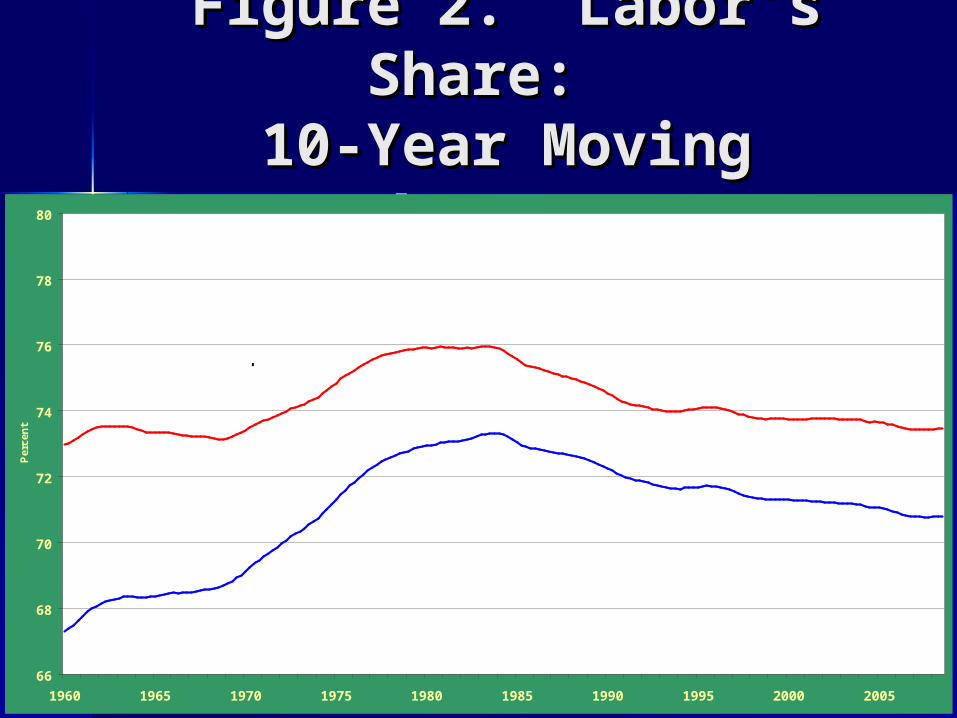
Figure 2. Labor’s Figure 2. Labor’s Share: Share:
10-Year Moving 10-Year Moving AverageAverage
66
68
70
72
74
76
78
80
1960 1965 1970 1975 1980 1985 1990 1995 2000 2005
Per
cen
t
Employee Compensation with Labor Portion of Proprietors' Income
Employee Compensation
Rising Inequality in the Rising Inequality in the Bottom 90 PercentBottom 90 Percent
We look at the timing of changes We look at the timing of changes in two ratios, 90-50 and 50-10. in two ratios, 90-50 and 50-10. – Multiplied together they give 90-10Multiplied together they give 90-10
HypothesesHypotheses– Decline of unionsDecline of unions– Rise of importsRise of imports– Rise of immigrationRise of immigration– Decline of real minimum wageDecline of real minimum wage
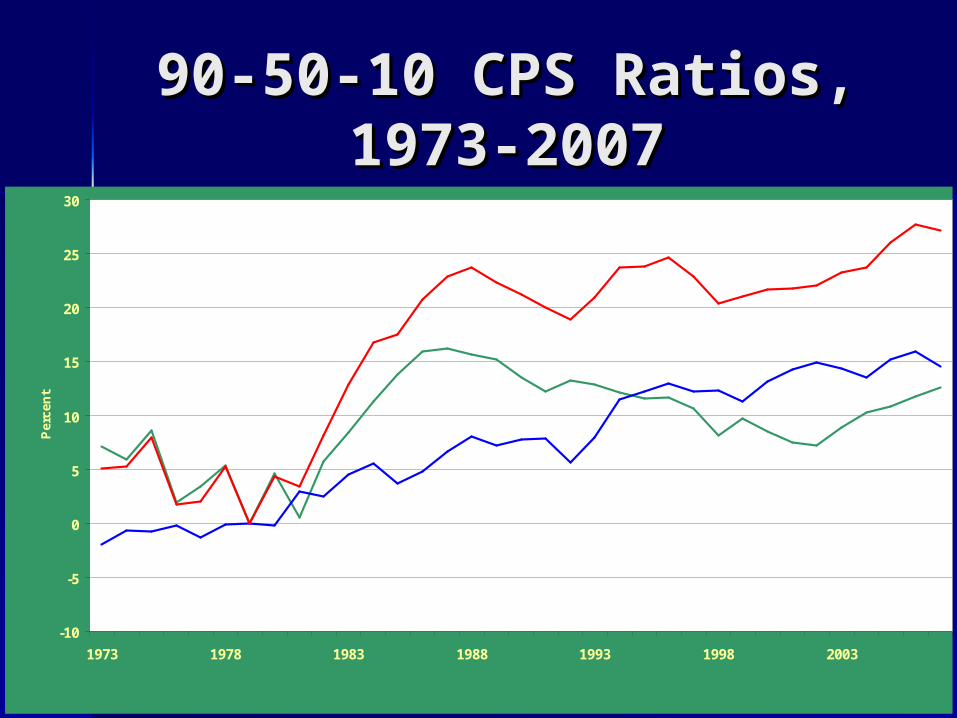
90-50-10 CPS Ratios,90-50-10 CPS Ratios,1973-20071973-2007
-10
-5
0
5
10
15
20
25
30
1973 1978 1983 1988 1993 1998 2003
Per
cen
t
90-10
50-10
90-50
Timing and Timing and HypothesesHypotheses
Sharp increase 50-10 ratio 1979-86Sharp increase 50-10 ratio 1979-86– Consistent with unionization for malesConsistent with unionization for males– Consistent with minimum wage for femalesConsistent with minimum wage for females
Steady rise in 90-50 ratio 1979-2007Steady rise in 90-50 ratio 1979-2007– Consistent with skill-biased technical changeConsistent with skill-biased technical change– Demand for college graduates declined after Demand for college graduates declined after
19901990 Autor-Katz-Kearney polarization Autor-Katz-Kearney polarization
hypothesishypothesis Both ratios increased 2004-07, ending Both ratios increased 2004-07, ending
previous plateauprevious plateau
Rising Inequality at Rising Inequality at the Top: Three Groupsthe Top: Three Groups #1 Superstars (entertainment and #1 Superstars (entertainment and
sports), market-driven by audience sports), market-driven by audience magnificationmagnification
#2 Lawyers, investment bankers, #2 Lawyers, investment bankers, other market-driven professionalsother market-driven professionals
#3 CEOs. Active debate: market vs. #3 CEOs. Active debate: market vs. managerial powermanagerial power– Notice clear correlation with stock market Notice clear correlation with stock market
after 1982, especially 2000-2006after 1982, especially 2000-2006
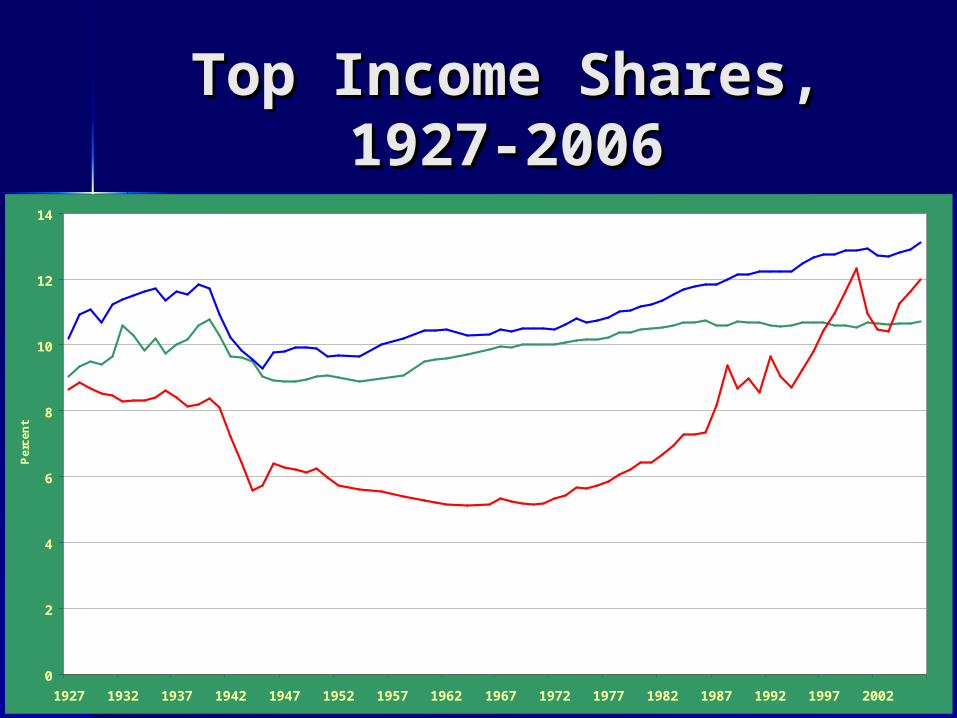
Top Income Shares,Top Income Shares,1927-20061927-2006
0
2
4
6
8
10
12
14
1927 1932 1937 1942 1947 1952 1957 1962 1967 1972 1977 1982 1987 1992 1997 2002
Pe
rce
nt
Top 1 Percent
Percentiles 96-99
Percentiles 91-95
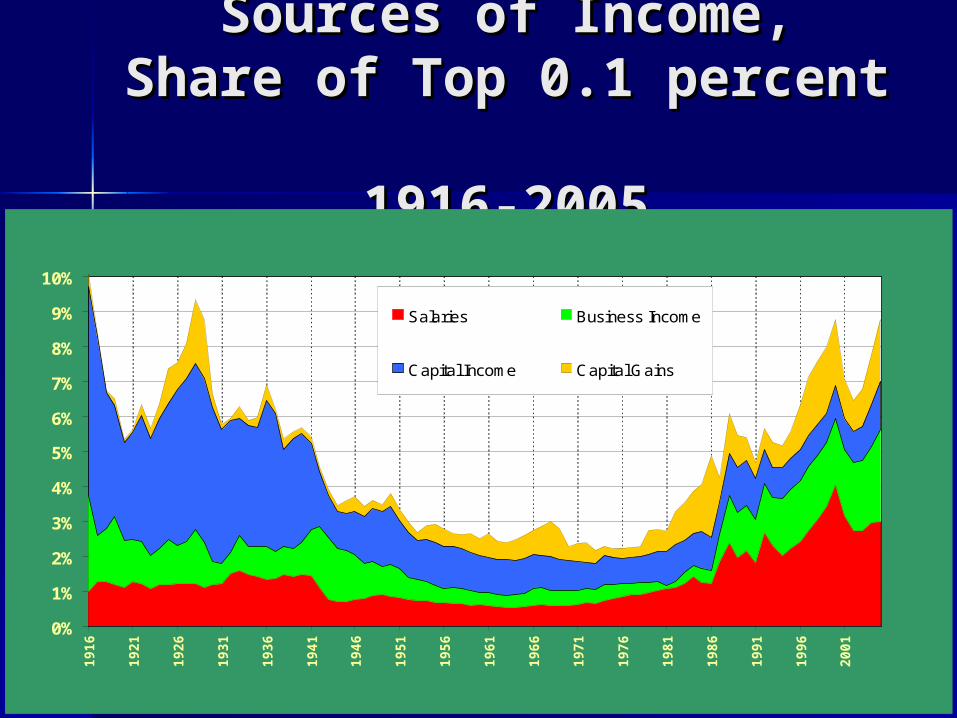
Sources of Income,Sources of Income,Share of Top 0.1 percent Share of Top 0.1 percent
1916-20051916-2005
0%
1%
2%
3%
4%
5%
6%
7%
8%
9%
10%
19
16
19
21
19
26
19
31
19
36
19
41
19
46
19
51
19
56
19
61
19
66
19
71
19
76
19
81
19
86
19
91
19
96
20
01
Salaries Business Income
Capital Income Capital Gains
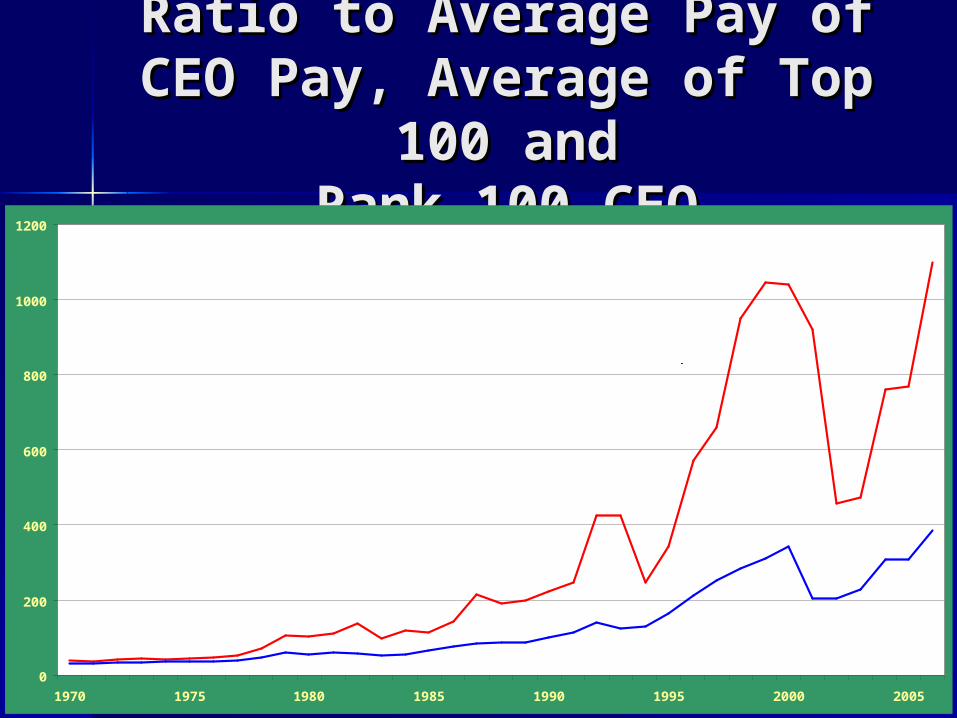
Ratio to Average Pay of Ratio to Average Pay of CEO Pay, Average of Top CEO Pay, Average of Top
100 and100 andRank 100 CEORank 100 CEO
0
200
400
600
800
1000
1200
1970 1975 1980 1985 1990 1995 2000 2005
Top 100
Rank 100
Conclusion about Pay Conclusion about Pay at the Topat the Top
CEO share strongly correlated with CEO share strongly correlated with stock market, supports Gabaix-stock market, supports Gabaix-LandierLandier
But still a role for managerial powerBut still a role for managerial power– Why are stock options so generous?Why are stock options so generous?– Why are stock options less important Why are stock options less important
in other countries (illegal in Japan until in other countries (illegal in Japan until 1997)1997)
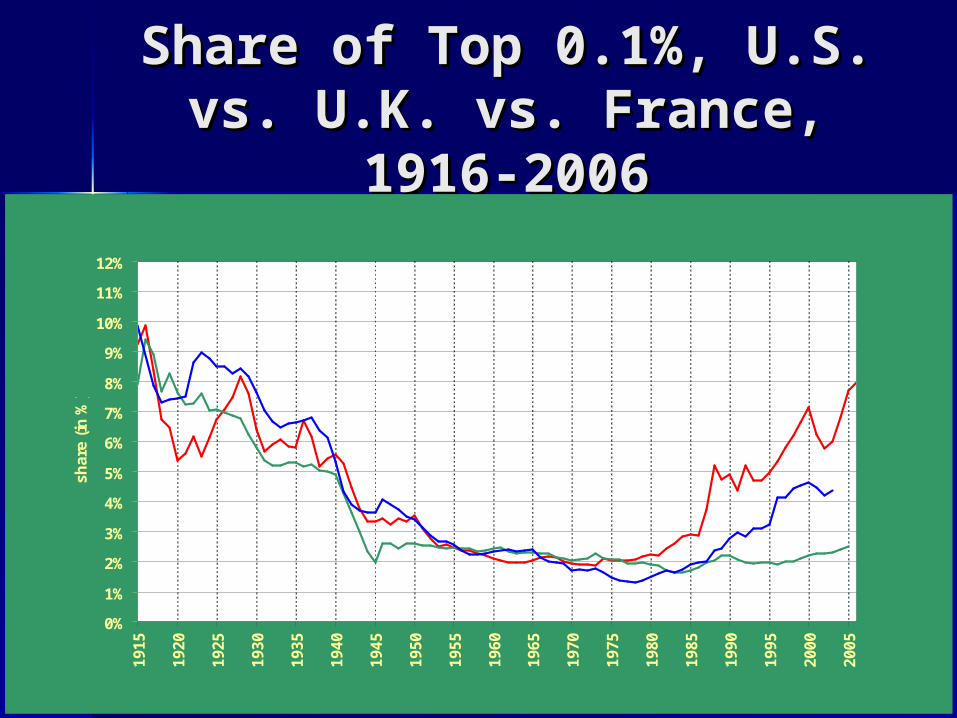
Share of Top 0.1%, U.S. Share of Top 0.1%, U.S. vs. U.K. vs. France, 1916-vs. U.K. vs. France, 1916-
20062006
0%
1%
2%
3%
4%
5%
6%
7%
8%
9%
10%
11%
12%
1915
1920
1925
1930
1935
1940
1945
1950
1955
1960
1965
1970
1975
1980
1985
1990
1995
2000
2005
shar
e (i
n %
)
France
U.K.
U. S.
Other Themes in ourOther Themes in ourPrevious SurveysPrevious Surveys
Consumption inequalityConsumption inequality– Data problems prevent clear conclusionsData problems prevent clear conclusions
Two opposite effects, rich vs. poorTwo opposite effects, rich vs. poor– Price indexes rise less for poor, the Wal-Price indexes rise less for poor, the Wal-
Mart effect vs. top-end servicesMart effect vs. top-end services– Life expectancy is rising much faster for Life expectancy is rising much faster for
the well-educated. Education spills over the well-educated. Education spills over not just to income but to healthnot just to income but to health
Geographical inequality, the super-star Geographical inequality, the super-star bicoastal citiesbicoastal cities

New Papers SurveyedNew Papers SurveyedHere: Bottom 90 Here: Bottom 90
PercentPercent Burkhauser Burkhauser et al. et al. (2008). Previously (2008). Previously
unavailable CPS top-coded data suggest unavailable CPS top-coded data suggest inequality has increased much more inequality has increased much more slowly since 1993 than between 1979 and slowly since 1993 than between 1979 and 19931993
Ottaviano and Peri (2008) on immigration. Ottaviano and Peri (2008) on immigration. No impact on native workers, substantial No impact on native workers, substantial effect on previous immigrantseffect on previous immigrants– So immigration matters, but not in the way So immigration matters, but not in the way
usually portrayedusually portrayed Autor-Dorn (2008) on unskilled service Autor-Dorn (2008) on unskilled service
workersworkers
Top IncomesTop Incomes
Frydman and Saks, executive Frydman and Saks, executive compensation since 1936compensation since 1936
Complete change in behavior since Complete change in behavior since mid-1970smid-1970s– Previously no response to macro Previously no response to macro
fluctuations or stock marketfluctuations or stock market– Strong correlation since mid-1970s with Strong correlation since mid-1970s with
market capitalizationmarket capitalization Why? Changes in social norms? Why? Changes in social norms?
Contrast with corporatism and union Contrast with corporatism and union power in Germany and elsewherepower in Germany and elsewhere
The Health Aspect: The Health Aspect: Differential Growth of Differential Growth of
Life ExpectancyLife Expectancy Mera, Richards, and Cutler (2008)Mera, Richards, and Cutler (2008)
– Channel from low education to life Channel from low education to life expectancy comes from smoking and expectancy comes from smoking and obesityobesity
Cutler Cutler et al. et al. (2008). (2008). – Causation flows from education to both Causation flows from education to both
income and healthincome and health– Poor health contributes to income inequalityPoor health contributes to income inequality
Insufficient emphasis on disparities of Insufficient emphasis on disparities of access to health careaccess to health care
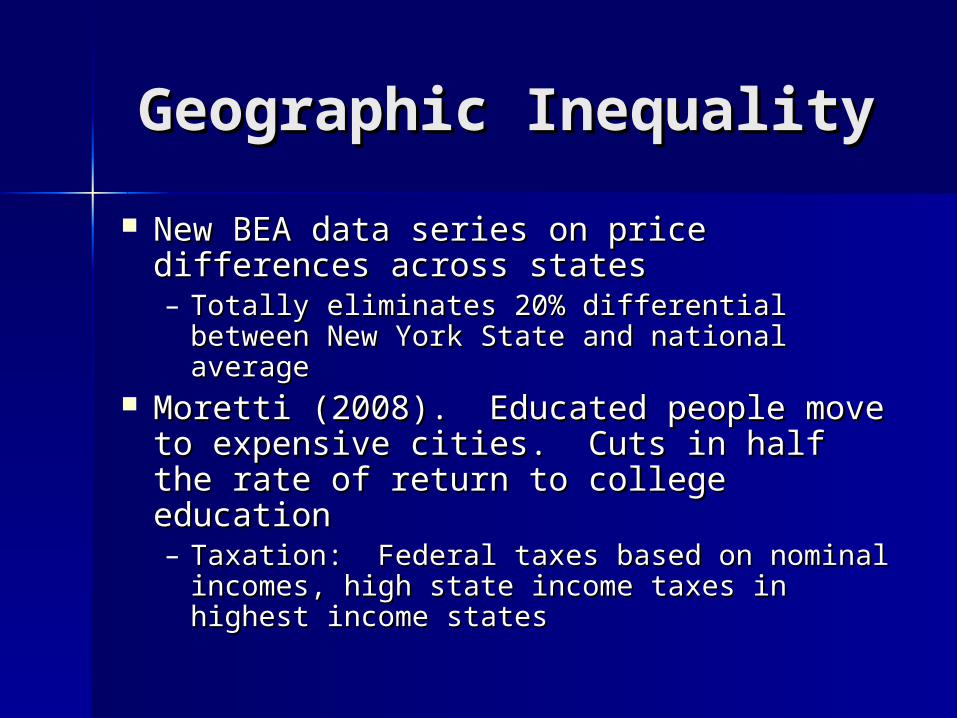
Geographic InequalityGeographic Inequality
New BEA data series on price New BEA data series on price differences across statesdifferences across states– Totally eliminates 20% differential Totally eliminates 20% differential
between New York State and national between New York State and national averageaverage
Moretti (2008). Educated people move Moretti (2008). Educated people move to expensive cities. Cuts in half the to expensive cities. Cuts in half the rate of return to college educationrate of return to college education– Taxation: Federal taxes based on nominal Taxation: Federal taxes based on nominal
incomes, high state income taxes in incomes, high state income taxes in highest income stateshighest income states
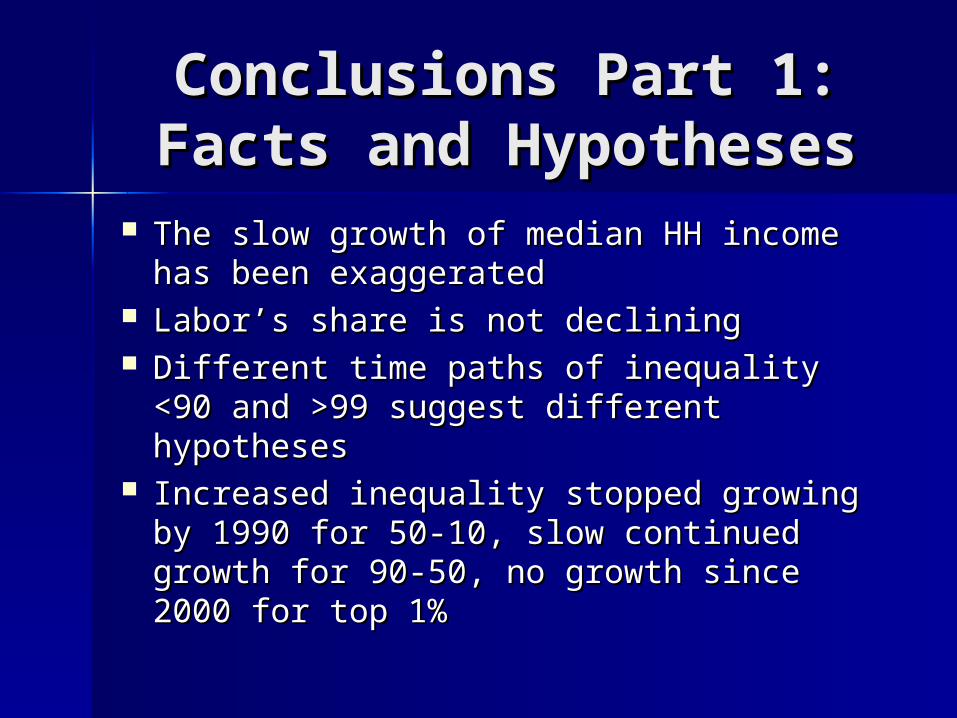
Conclusions Part 1:Conclusions Part 1:Facts and HypothesesFacts and Hypotheses
The slow growth of median HH income The slow growth of median HH income has been exaggeratedhas been exaggerated
Labor’s share is not decliningLabor’s share is not declining Different time paths of inequality <90 Different time paths of inequality <90
and >99 suggest different hypothesesand >99 suggest different hypotheses Increased inequality stopped growing Increased inequality stopped growing
by 1990 for 50-10, slow continued by 1990 for 50-10, slow continued growth for 90-50, no growth since growth for 90-50, no growth since 2000 for top 1%2000 for top 1%
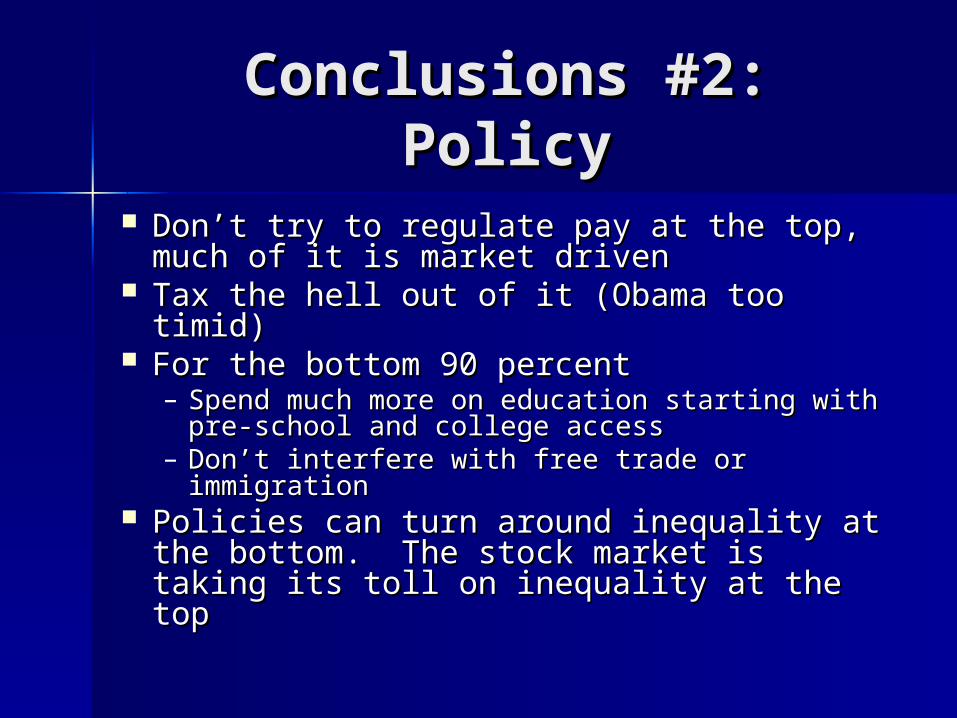
Conclusions #2:Conclusions #2:PolicyPolicy
Don’t try to regulate pay at the top, Don’t try to regulate pay at the top, much of it is market drivenmuch of it is market driven
Tax the hell out of it (Obama too timid)Tax the hell out of it (Obama too timid) For the bottom 90 percentFor the bottom 90 percent
– Spend much more on education starting Spend much more on education starting with pre-school and college accesswith pre-school and college access
– Don’t interfere with free trade or Don’t interfere with free trade or immigrationimmigration
Policies can turn around inequality at Policies can turn around inequality at the bottom. The stock market is the bottom. The stock market is taking its toll on inequality at the toptaking its toll on inequality at the top