Embed Size (px)
Citation preview
Robèrt, M. (2009). International Journal of Sustainable Transportation Vol. 3, No. 1
What is CERO?• Developed for an energy sector with large complexity:
a) travel behaviour needs to be modelled explicitly to get a bottom-up perspective of key players
b) need for tailor-made cost-benefit assessments of alternative travel policies
c) Applicable for benchmarking to spread good examples
• Engages a broad range of experts and researchers:– Statisticians– Economists– Behaviourists– Travel managers– Technical implementers
• Developed in a doctoral thesis at KTH: ”Mobility Management and Climate Change Policies”
Developed with empirical support from large organizations
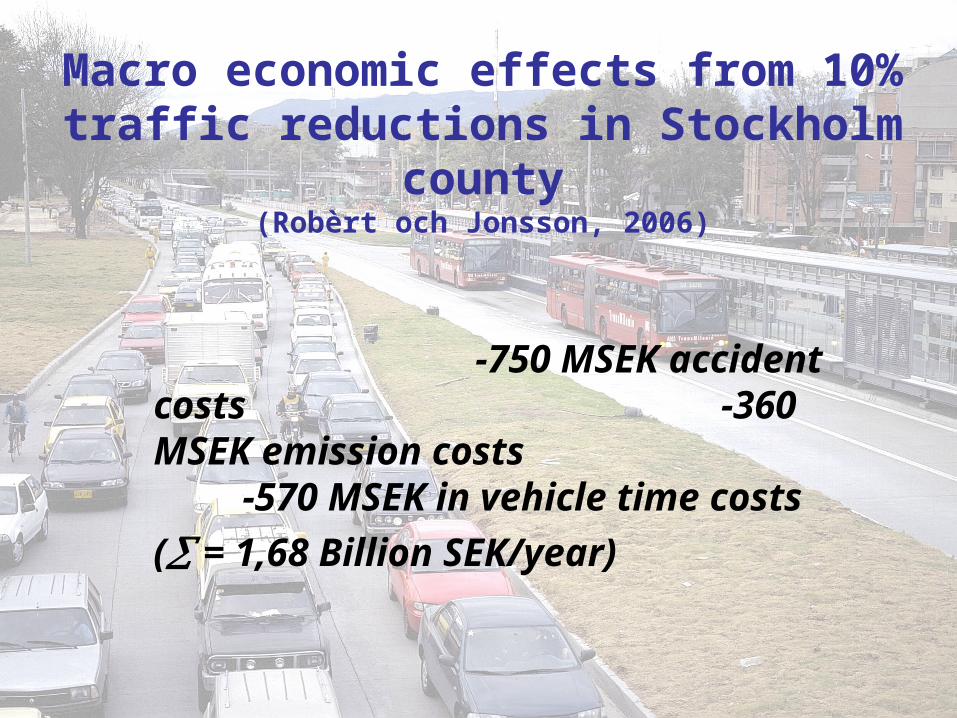
Macro economic effects from 10% traffic reductions in Stockholm county
(Robèrt och Jonsson, 2006)
-750 MSEK accident costs -360 MSEK emission costs -570 MSEK in vehicle time costs
( = 1,68 Billion SEK/year)
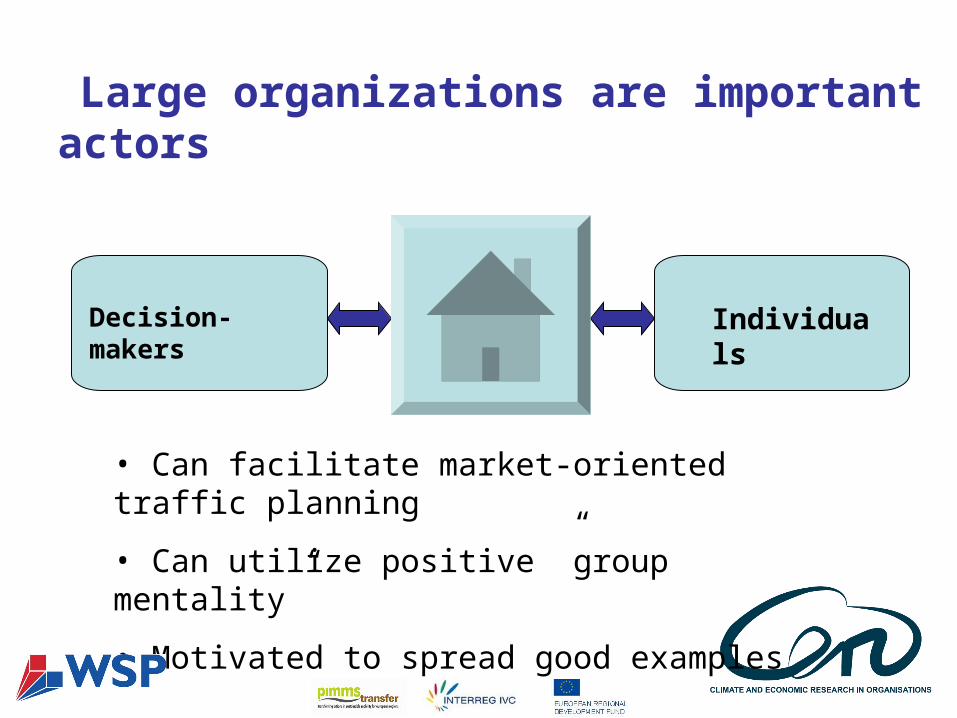
Large organizations are important actors
Decision-makers Individuals
• Can facilitate market-oriented traffic planning
• Can utilize positive ”group mentality”
• Motivated to spread good examples
Why climate targets and travel strategies?
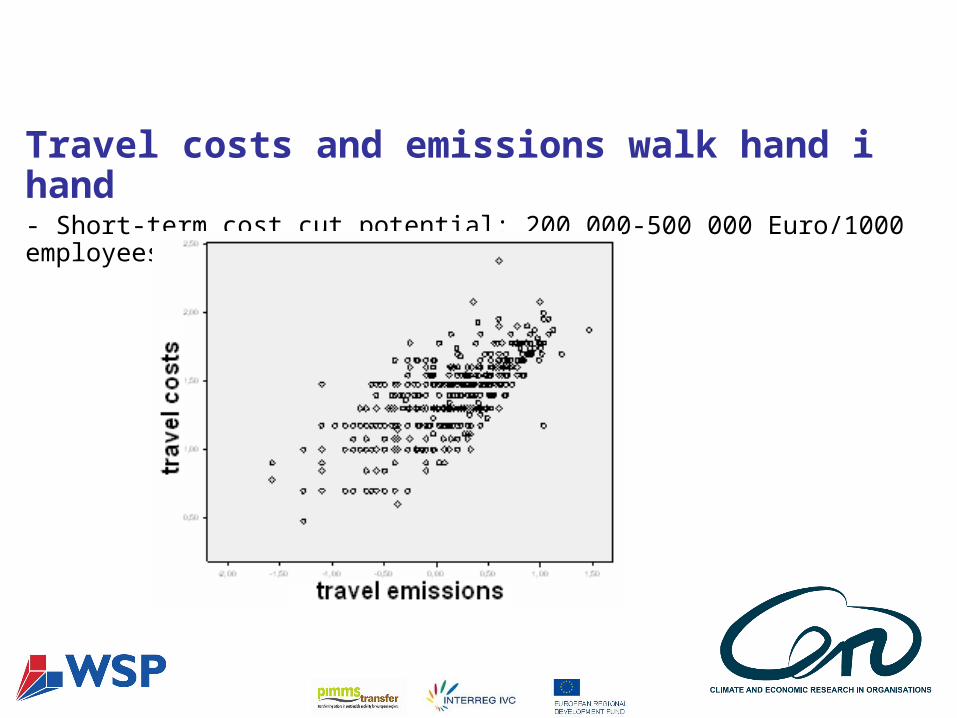
Travel costs and emissions walk hand i hand- Short-term cost cut potential: 200 000-500 000 Euro/1000 employees and year
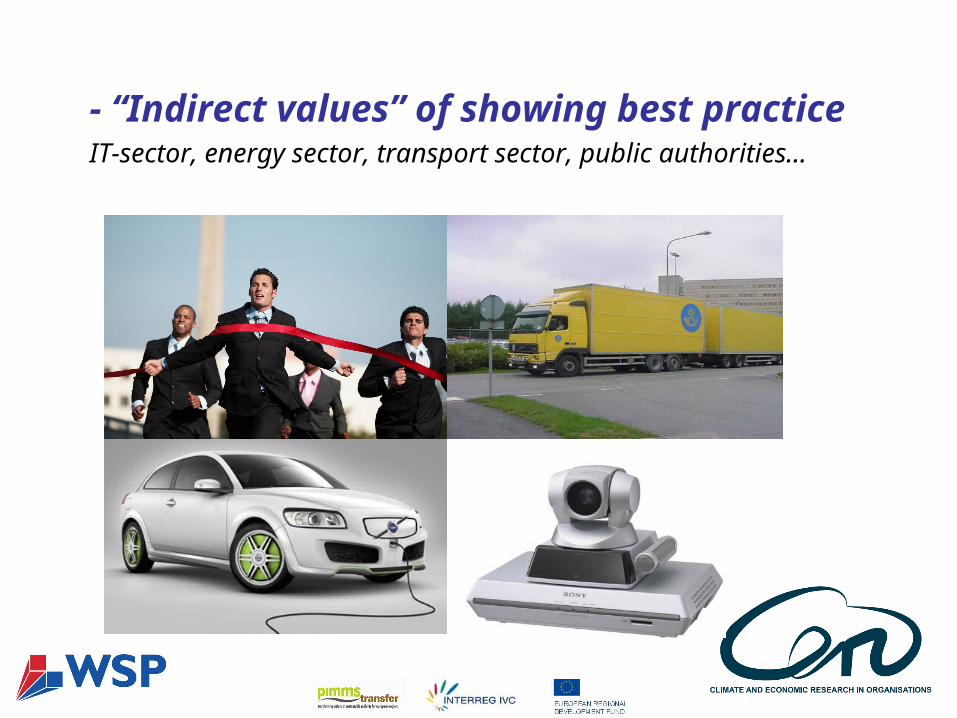
- “Indirect values” of showing best practiceIT-sector, energy sector, transport sector, public authorities…
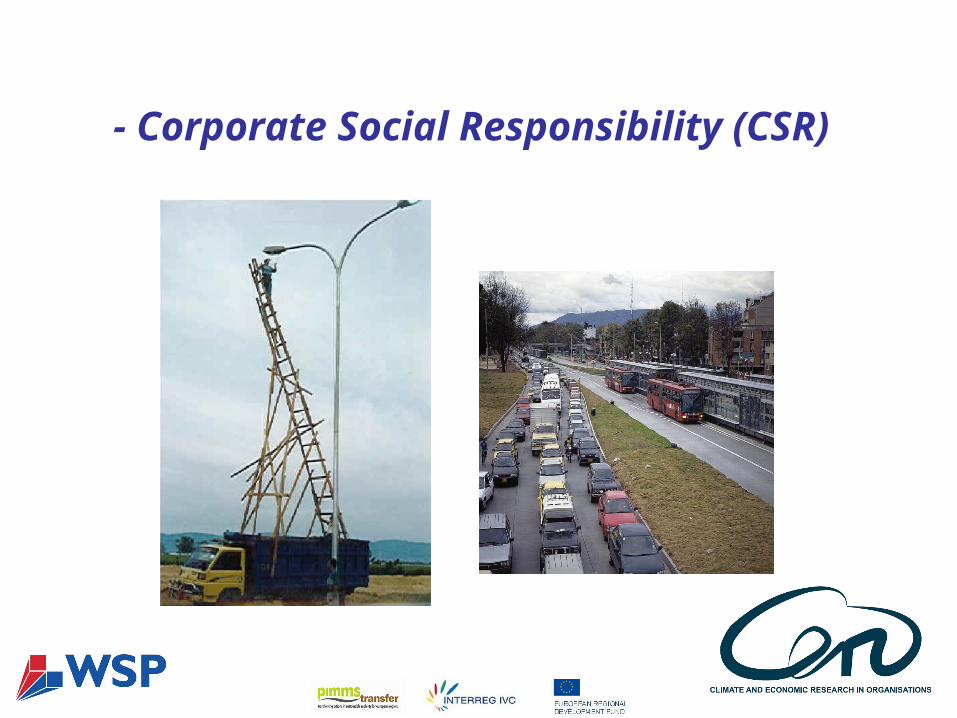
- Corporate Social Responsibility (CSR)
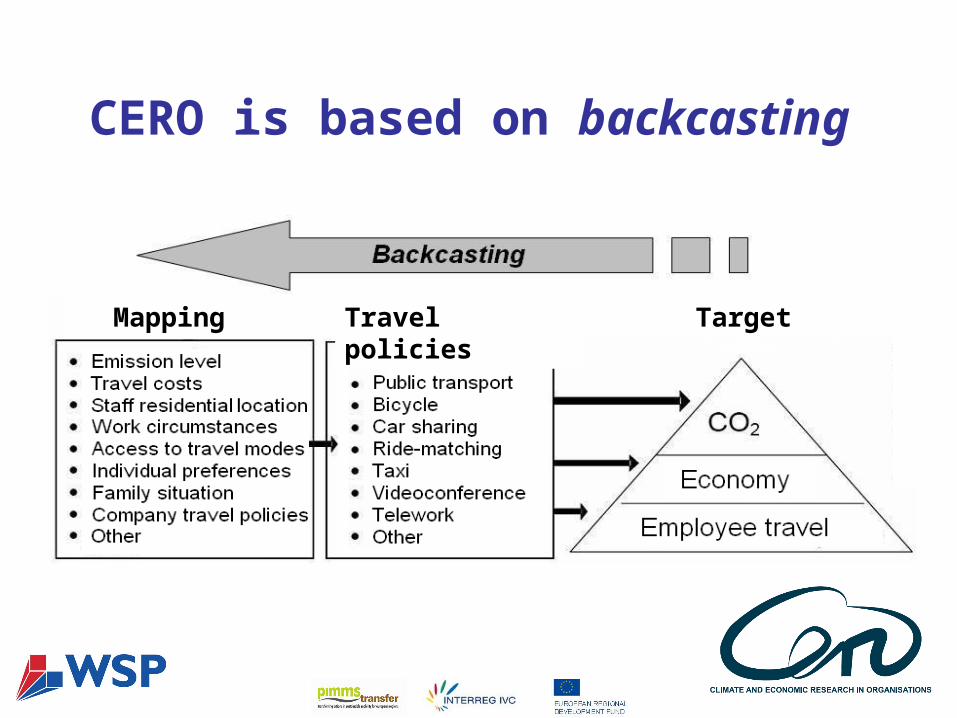
CERO is based on backcasting
Travel policiesMapping Target
Why backcasting?
• If we know the target, why not use it?
• Avoid “path-dependency”, focusing on current obstacles and constraints
• We might well approach a paradigmatic shift where traditional forecasting is insufficient
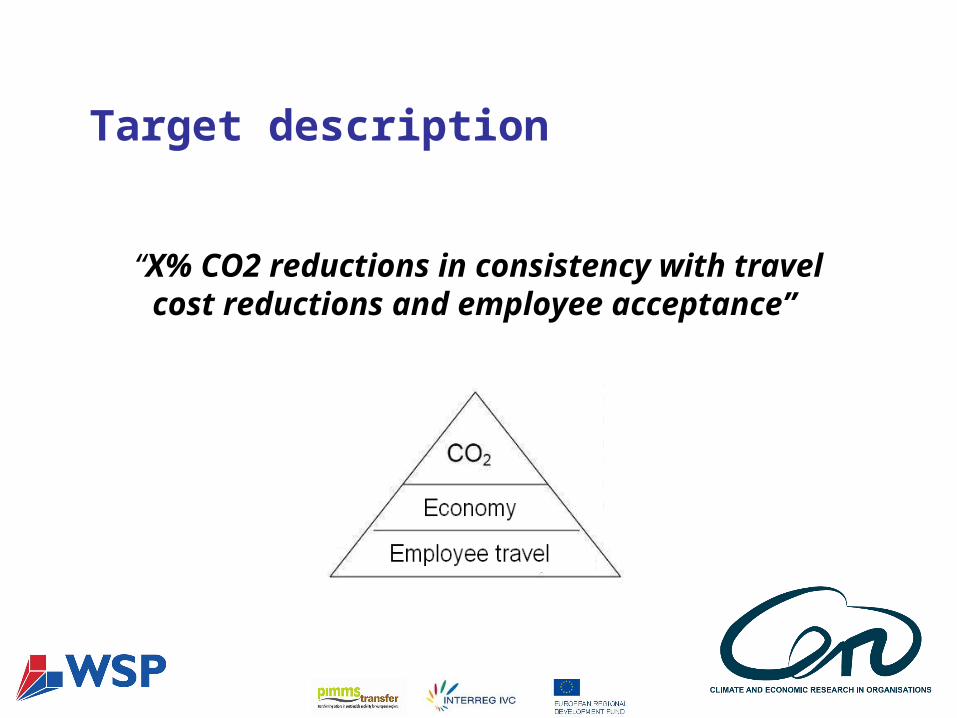
Target description
“X% CO2 reductions in consistency with travel cost reductions and employee acceptance”

Mapping
CO2-emissions/year (tons)
3600
3000 A. Work commute car
2700 B. Work commute public transport
2400 C. Park-and-ride (car+public transport)
2100 D. Business trips car
1800 E. Business trips aviation
1500 A F. Business trips train
1200 E Sum of all travel activities A-F, at the company
900
600 D
300 B
C F
5 10 15 20 25 30 35 40 45 50 Travel costs (million SEK)
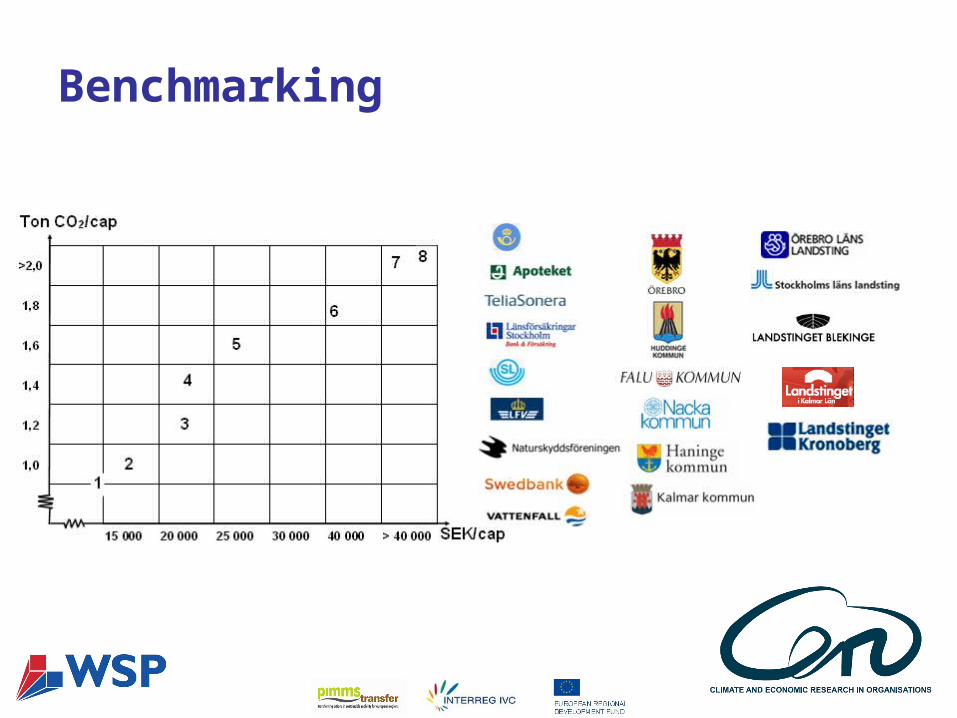
Benchmarking
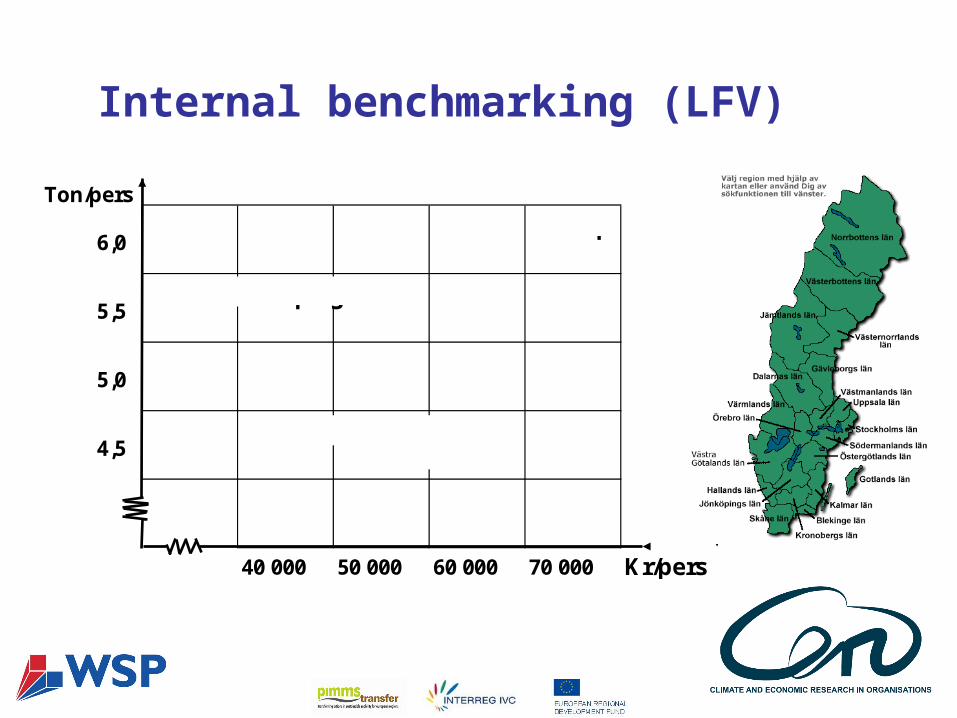
Internal benchmarking (LFV)
Ton/pers
6,0
5,5
5,0
4,5
40 000 50 000 60 000 70 000 Kr/pers
ArlandaLandvetter
Sturup
Norrköping
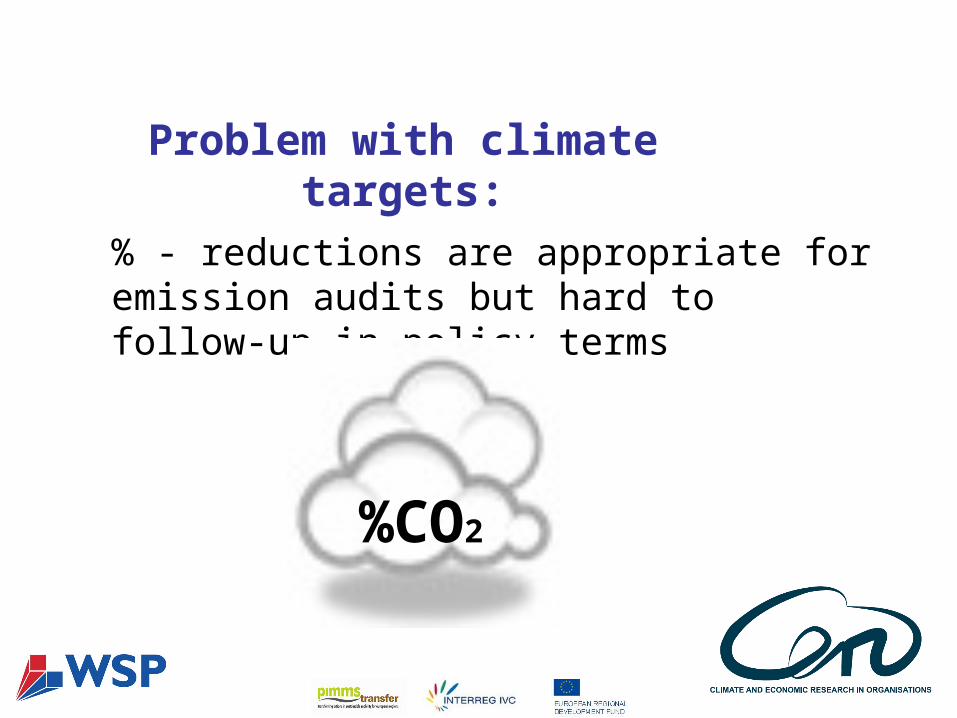
Problem with climate targets:
% - reductions are appropriate for emission audits but hard to follow-up in policy terms
%CO2
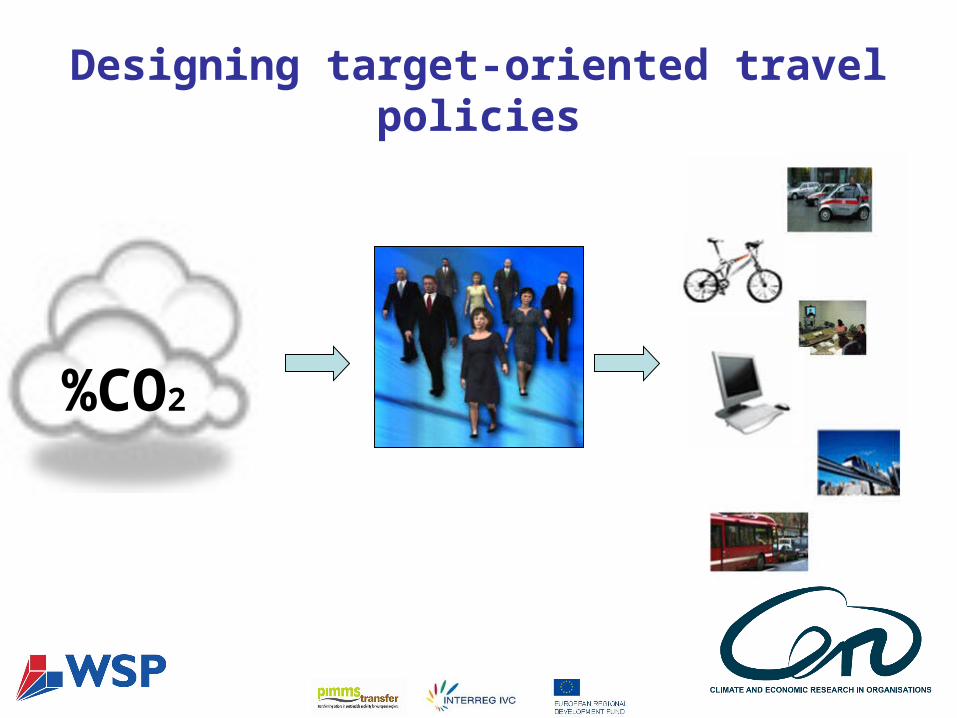
Designing target-oriented travel policies
%CO2
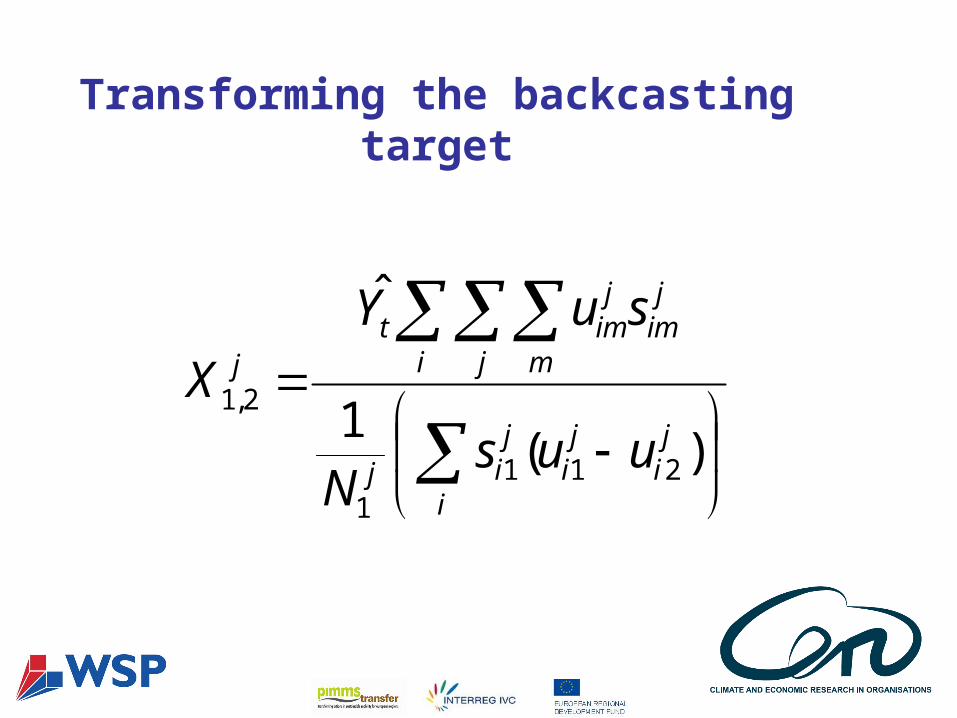
)(1
ˆ
2111
2,1ji
ji
i
jij
i j m
jim
jimt
j
uusN
suY
X
Transforming the backcasting target
Why transforming the emission target?
• Facilitates efficiency rankings, cost-benefit analyses and follow-ups between alternative policies
• Reduces the level of “fuzziness” regarding potential emission impacts
• Helps strategic planning by keeping track on factors that might change over time (u1, u2, N, s, Y…)
Modules of tailor made 1% CO2-reductions (commute trips)
• 31 car commuters switch to public transport
• Train tickets to 4 commuters with longest commute distance
• Encourage 38 car commuters to renewable fuel cars
• Allow telecommuting at least once a month
• Offer eco-driving to at least ¼ of staff
• Encourage at least 191 car commuters with commute distance 0,5-6km to cycle
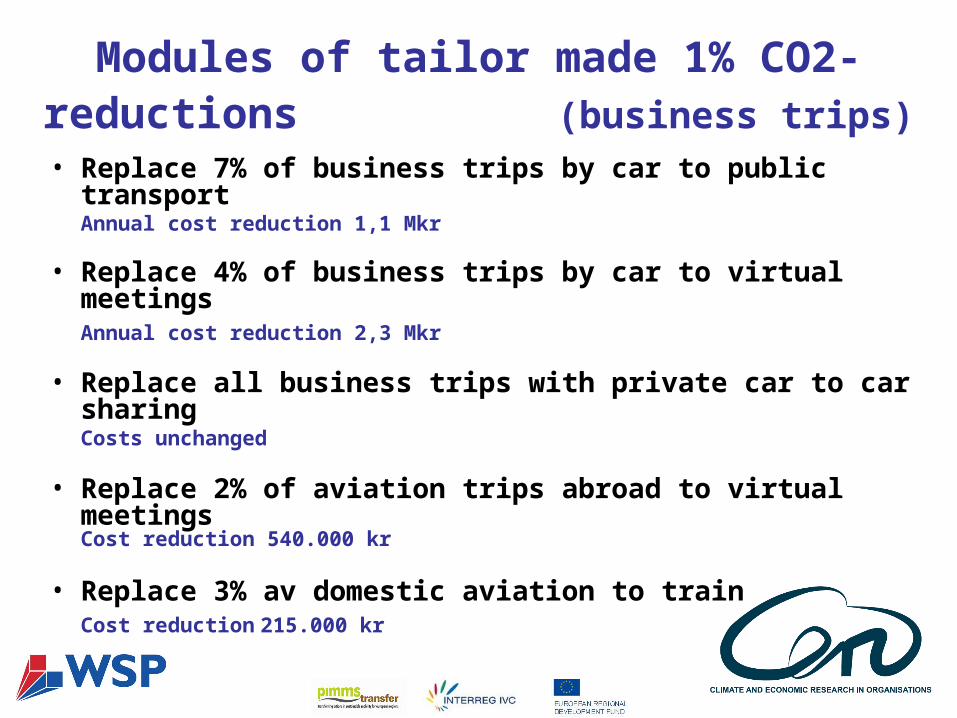
• Replace 7% of business trips by car to public transport Annual cost reduction 1,1 Mkr
• Replace 4% of business trips by car to virtual meetings Annual cost reduction 2,3 Mkr
• Replace all business trips with private car to car sharingCosts unchanged
• Replace 2% of aviation trips abroad to virtual meetings Cost reduction 540.000 kr
• Replace 3% av domestic aviation to trainCost reduction 215.000 kr
Modules of tailor made 1% CO2-reductions (business trips)
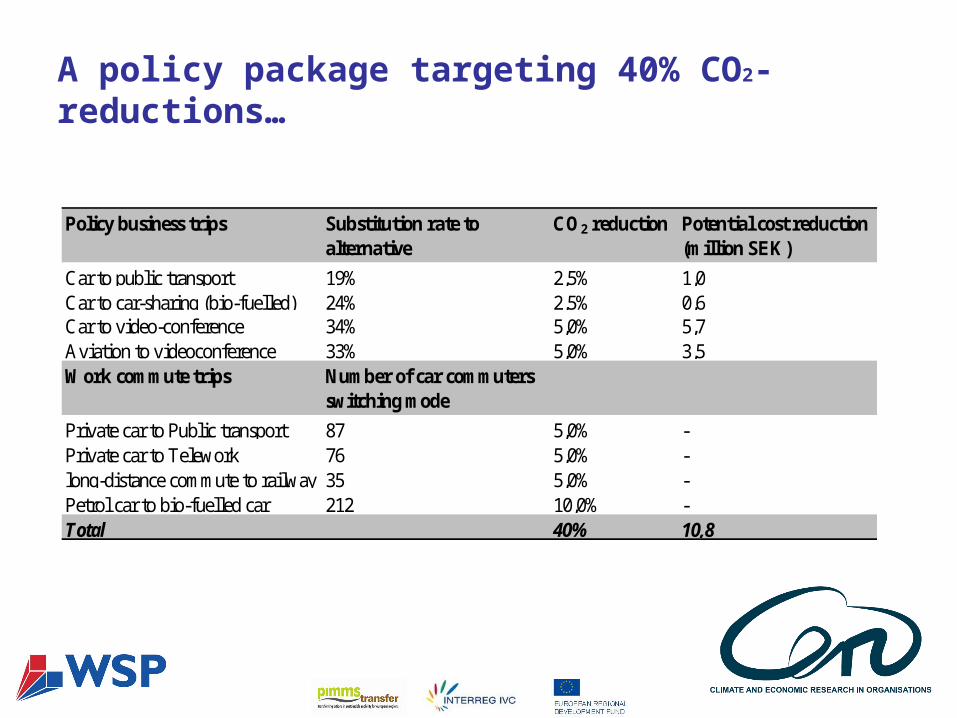
A policy package targeting 40% CO2-reductions…
Policy business trips Substitution rate to alternative
CO2 reduction Potential cost reduction (million SEK)
Car to public transport 19% 2,5% 1,0Car to car-sharing (bio-fuelled) 24% 2,5% 0,6
Car to video-conference 34% 5,0% 5,7Aviation to videoconference 33% 5,0% 3,5Work commute trips Number of car commuters
switching mode
Private car to Public transport 87 5,0% -Private car to Telework 76 5,0% -long-distance commute to railway 35 5,0% -Petrol car to bio-fuelled car 212 10,0% -Total 40% 10,8
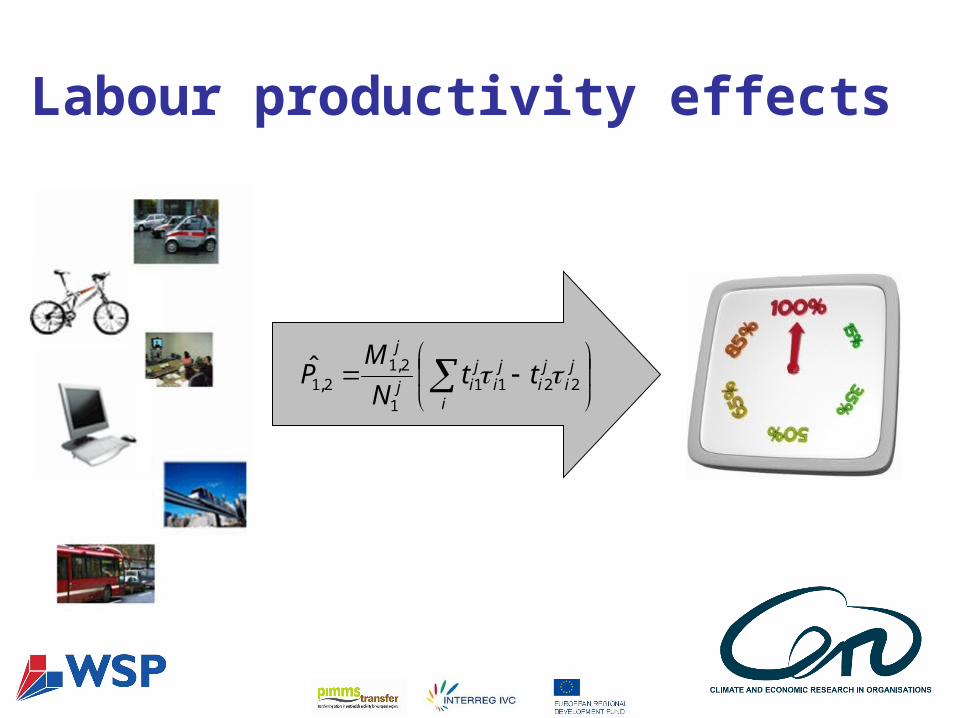
Labour productivity effects
j
iji
ji
i
jij
j
ttN
MP 2211
1
2,12,1̂
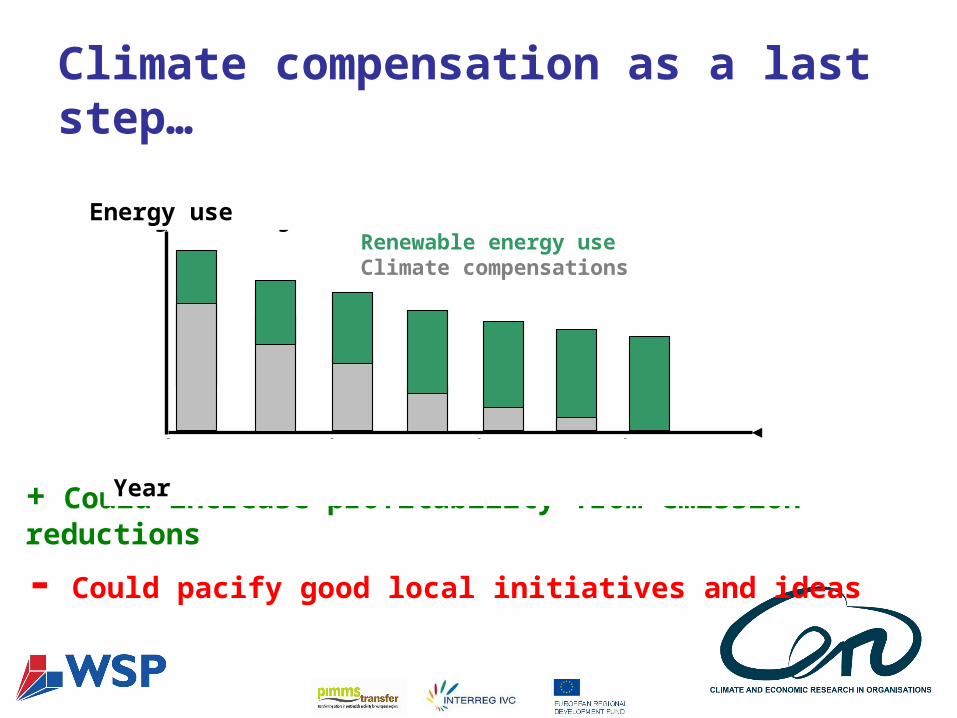
Climate compensation as a last step…
+ Could increase profitability from emission reductions
- Could pacify good local initiatives and ideas
Energianvändning
År 2008 År 2010 År 2015 År 2020 Resbeteende
Renewable energy useClimate compensations
Energy use
Year
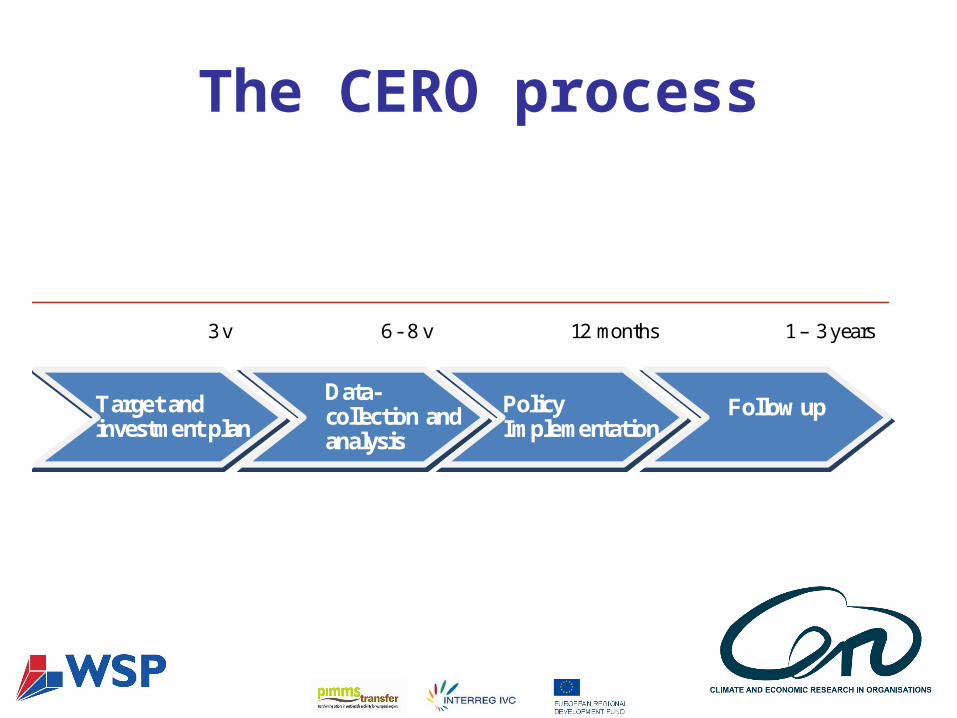
The CERO process
Target and investment plan
Data-collection and analysis
Policy Implementation
Follow up
3 v 6 - 8 v 12 months 1 – 3 years
To sum up:
- Make climate travel targets tangible - Identify economically optimized strategies
- Emphasize employee benefits
- Apply benchmarking to spread ”best practice”