Embed Size (px)
Citation preview


Robert M. Stanton ‘61Real Estate Teaching
Award
Presented to, Stewart ‘Skip’ Sacks

Emcee
Larry Colorito
Senior Managing Director,
Valbridge Property Advisors
Welcome to the
2019 Hampton Roads
Real Estate Market Review & Forecast
E.V. WILLIAMS CENTER FOR REAL ESTATE

Presenting Sponsor

Exclusive Reception Sponsor

Monarch Sponsor

Lion Sponsor

Media Sponsor

Blue & Silver Sponsors

Booth Sponsors

Municipal Sponsors

Program Sponsors

Table Sponsors

Staging Sponsor


Economic Trends
INSERT HEADSHOT HERE
Vinod Agarwal
Professor, Economics
Old Dominion University

2018 Hampton Roads Economic Forecast
Stagnant Growth,Improving Future?
Professor Vinod AgarwalJanuary 31, 2018
2018 Hampton Roads Economic Forecast
Stagnant Growth,
2019 Hampton Roads Economy
Improving Prospects

$61,481
$104,357
$71,944 $85,620
$40,000
$50,000
$60,000
$70,000
$80,000
$90,000
$100,000
$110,000
2002
2003
2004
2005
2006
2007
2008
2009
2010
2011
2012
2013
2014
2015
2016
2017
2018
2019
Mill
ions
of D
olla
rsNominal and Real Gross Domestic Product (GDP)
Hampton Roads, 2003 – 2019*
Nominal GDP Real GDP
Sources: Bureau of Economic Analysis and Dragas Center for Economic Analysis and Policy. Data on GDP incorporate latest BEA revisions in September 2018. Data for 2017 for Hampton Roads are advance estimates. *Data for 2018 and 2019 represent our forecast. Real GDP in 2009 Chained Dollars.

-3%-2%-1%0%1%2%3%4%5%6%
2003 2004 2005 2006 2007 2008 2009 2010 2011 2012 2013 2014 2015 2016 2017 2018 2019
Annu
al R
eal G
DP
Gro
wth
Growth in Real Gross Domestic Product Hampton Roads, 2003 - 2019*
Sources: Bureau of Economic Analysis and Dragas Center for Economic Analysis and Policy. Data on GDP incorporate latest BEA revisions in September 2018. Data for 2017 for Hampton Roads are the advance estimates. *Data for 2018 and 2019 represent our forecast. CAGR GDP growth in horizontal bars.
4.55%
-0.15%
1.86%

$10.0
$19.8$19.9 $20.8
$22.1
$5
$7
$9
$11
$13
$15
$17
$19
$21
$2320
00
2001
2002
2003
2004
2005
2006
2007
2008
2009
2010
2011
2012
2013
2014
2015
2016
2017
2018
e
2019
f
Bill
ions
of D
olla
rsEstimated Direct Department of Defense Spending
Hampton Roads, 2000 - 2019*
Sources: U.S. Department of Defense and Dragas Center for Economic Analysis and Policy. Includes Federal Civilian and Military Personnel and Procurement. *Data for 2018 are estimates while 2019 represents our forecast.

154 158 159 159 155 155 153 152 147 146 144 140 137 139 142 142 139
020406080
100120140160180
2001 2002 2003 2004 2005 2006 2007 2008 2009 2010 2011 2012 2013 2014 2015 2016 2017
Empl
oyee
s in
Tho
usan
dsMilitary and Federal Civilian Employment
Hampton Roads, 2001 - 2017
Military Federal Civilian
Sources: U.S. Bureau of Economic Analysis and Dragas Center for Economic Analysis and Policy. Last updated by BEA on November 15, 2018

Estimated Average CompensationHampton Roads, Selected Categories
2016 2017
Change in
Compensation
Military $92,112 $94,067 2.12%
Federal Civilian Govt. Employees
$110,092 $113,961 3.51%
State and Local Govt. Employees
$62,224 $64,558 3.75%
Private Nonfarm $41,628 $42,647 2.45%
Sources: Bureau of Economic Analysis and Old Dominion University Economic Forecasting Project. Compensation includes wages, salaries, and benefits. Last updated November 15, 2018.

775.5
737.1
758.4
779.9785.9
792.2
680
700
720
740
760
780
800
2000 2002 2004 2006 2008 2010 2012 2014 2016 2018
Thou
sand
s of
Job
sAverage Civilian Nonfarm Employment (Jobs):
Hampton Roads, 2000 – 2019*
Sources: U.S. Department of Labor CES data and the Old Dominion University Economic Forecasting Project. Annual averages based on non-seasonally adjusted data. *Data for 2019 represent our forecast. Data will be revised in March 2019
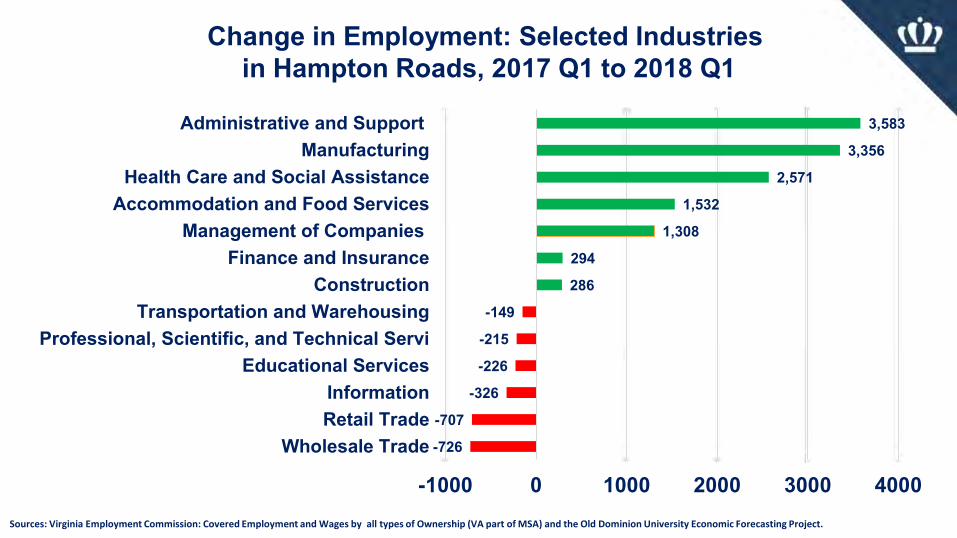
Change in Employment: Selected Industriesin Hampton Roads, 2017 Q1 to 2018 Q1
-726
-707
-326
-226
-215
-149
286
294
1,308
1,532
2,571
3,356
3,583
-1000 0 1000 2000 3000 4000
Wholesale TradeRetail TradeInformation
Educational ServicesProfessional, Scientific, and Technical Servi
Transportation and WarehousingConstruction
Finance and InsuranceManagement of Companies
Accommodation and Food ServicesHealth Care and Social Assistance
ManufacturingAdministrative and Support
Sources: Virginia Employment Commission: Covered Employment and Wages by all types of Ownership (VA part of MSA) and the Old Dominion University Economic Forecasting Project.

Unemployment Rate: Hampton Roads, 2006-2019*
3.4%
7.6%
4.7%4.2%
3.3% 3.1%
0%
1%
2%
3%
4%
5%
6%
7%
8%
2006 2007 2008 2009 2010 2011 2012 2013 2014 2015 2016 2017 2018 2019
Sources: Bureau of Labor Statistics and Old Dominion University Economic Forecasting Project. *Data for 2019 represent our forecast. Data will be revised in April 2019.


Krista CostaSenior Vice PresidentDivaris Real Estate
OFFICE


ABSORPTION AND VACANCY

US Air Force300 Exploration Way, Hampton
97,488 Square Feet

Optima Health824 N Military Highway, Norfolk
44,428 Square Feet

2018 TOP OFFICE SALES
Building SF Sales Price Sales Price / SF
Dominion Tower999 Waterside Dr, Norfolk
403,276 $79,000,000 $195.90
NetCenter5200 Mercury Blvd, Hampton
557,753 $19,750,000 $35.41
Main Street Tower300 E Main St, Norfolk
199,621 $18,550,000 $92.93
Town Point Center300 E Boush St, Norfolk
131,259 $16,600,000 $126.47
Lakeview Technology Center 27511 Burbage Dr, Suffolk
86,400 $16,349,966 $189.24

$79 MillionDominion Tower
999 Waterside Drive, Norfolk
403,276 Square Feet

$16.3 MillionLakeview Technology Center 2
7511 Burbage Drive, Suffolk
86,400 Square Feet

2 BayportWay
2 Bayport Way, Newport News
54,000 Square Feet

500 VolvoParkway
150,000 Square Feet


2019 OFFICEVACANCY
RENT


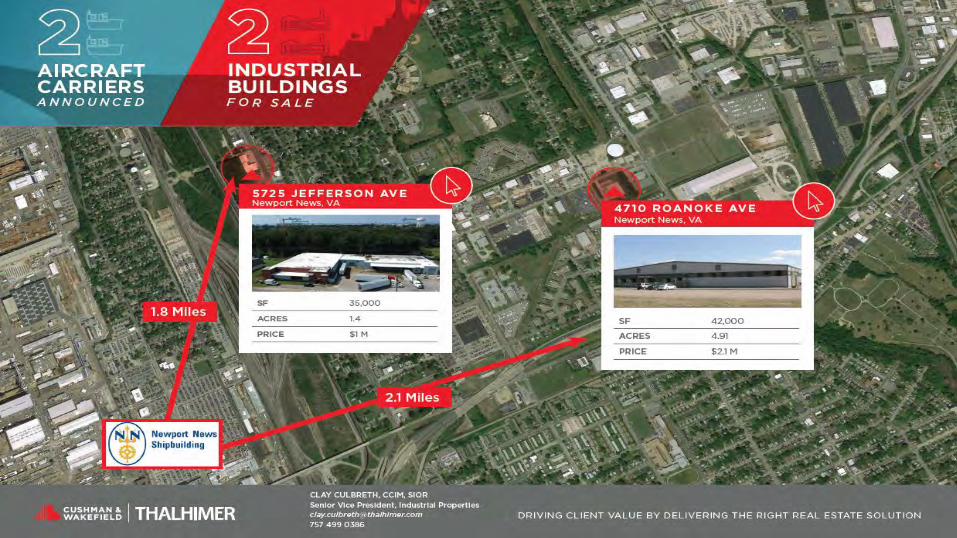
INDUSTRIAL
Bill Throne, SIOR, CCIMFirst Vice PresidentCo-leadPorts and Intermodal GroupCushman & Wakefield

I. CHURN! NO BURN…

VACANCY RATE: As a percentage of Total Inventory
1. Raleigh 2.90%2. Savannah 3.60%3. Richmond 3.90%4. Hampton Roads 4.10%5. Columbus 4.90%6. Charleston 7.00%

GROSS ABSORPTION: As a percentage of Total Inventory
1. Charleston 9.71%2. Savannah 8.45%3. Columbus 5.30%4. Richmond 4.44%5. Raleigh 3.20%6. Hampton Roads 2.72%
2,678,623 square feet

NET ABSORPTION: As a percentage of Total Inventory
1. Charleston 9.00%2. Savannah 4.37%3. Richmond 1.87%4. Columbus 1.78%5. Raleigh 0.73%6. Hampton Roads 0.20%
16,935 square feet

VACANCY RATE: As a percentage of Total Inventory
1. Raleigh 2.90%2. Savannah 3.60%3. Richmond 3.90%4. Hampton Roads 4.10%5. Columbus 4.90%6. Charleston 7.00%

I. CHURN! NO BURN…
II. BEST OF CLASS!


I. CHURN! NO BURN…
II. BEST OF CLASS!
III. MORE BEERS AT THE PIERS!


Here’s to a great 2019!
Thank you


RETAIL
MICHAEL P. ZARPASVICE PRESIDENTS.L. NUSBAUM REALTY CO.

MIXED-USE DEVELOPMENTINCREASING MARKET SHARE
Summit Pointe, ChesapeakeWells Fargo Center, Norfolk

MIXED-USE DEVELOPMENTINCREASING MARKET SHARE
Bridgeport, Suffolk Tech Center, Newport News

MIXED-USE DEVELOPMENTINCREASING MARKET SHARE
Towne Place at Greenbrier, ChesapeakeCity Center at Oyster Point, Newport News

MIXED-USE DEVELOPMENTINCREASING MARKET SHARE
Virginia Beach Town Center, Virginia BeachPeninsula Town Center, Hampton

OFF
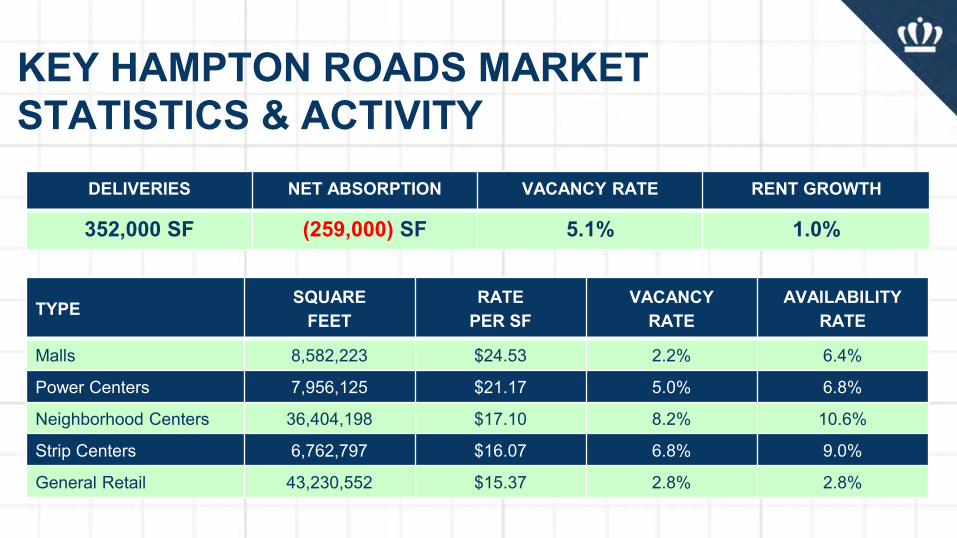
KEY HAMPTON ROADS MARKET STATISTICS & ACTIVITY
TYPE SQUAREFEET
RATEPER SF
VACANCYRATE
AVAILABILITY RATE
Malls 8,582,223 $24.53 2.2% 6.4%
Power Centers 7,956,125 $21.17 5.0% 6.8%
Neighborhood Centers 36,404,198 $17.10 8.2% 10.6%
Strip Centers 6,762,797 $16.07 6.8% 9.0%
General Retail 43,230,552 $15.37 2.8% 2.8%
DELIVERIES NET ABSORPTION VACANCY RATE RENT GROWTH
352,000 SF (259,000) SF 5.1% 1.0%

TOP 5 RETAIL LEASES
114,000 SF Floor & Décor, Virginia Beach
58,000 SF New Realm Brewing Company, Virginia Beach
44,827 SF Conn’s Home Plus, Portsmouth
37,500 SF Conn’s Home Plus, Virginia Beach
26,051 SF Harbor Freight Tools, Hampton


TOP 5 RETAIL SALES
$85,650,000 J.A.N.A.F. Shopping Yard, Norfolk
$19,900,000 Crossways Center II, Chesapeake
$12,900,000 Chesapeake Square Mall, Chesapeake
$ 8,969,007 Oyster Point Square, Newport News
$ 8,700,000 Hampton Plaza, Hampton

J.A.N.A.F. Shopping Yard
Oyster Point Square Chesapeake Square Mall
Crossways Center II
Hampton Plaza

TOP 5 RETAIL DEVELOPMENTS
331,000 SF IKEA, Norfolk
130,000 SF Wegmans, Virginia Beach
92,158 SF Hickman Place Phases I and II, Virginia Beach
70,000 SF Bridgeport Phase I, Suffolk
44,685 SF Rooms To Go, Newport News


LODGING
Edward DentonPresidentDenton Realty Company


66.20% 64.40% 72.10% 67.70% 66.70% 63.20% 49.50%
$129.83
$110.70
$78.99 $73.60
$96.51
$130.51 $121.36
$-
$20.00
$40.00
$60.00
$80.00
$100.00
$120.00
$140.00
0.00%
10.00%
20.00%
30.00%
40.00%
50.00%
60.00%
70.00%
80.00%
Average Rate & Occupancy Comparison
Occupancy ADR
Source: VRLTA / STR

More heads in beds.

0.00%
1.00%
2.00%
3.00%
4.00%
5.00%
6.00%
7.00%
8.00%
2018 RevPAR % Change
Source: VRLTA / STR

Source: VRLTA / STR
2014 20184 Year
$ Change4 Year
% Change
Williamsburg, VA $ 43.70 $ 60.03 $ 16.32 37%
Virginia Beach, VA $ 67.71 $ 82.44 $ 14.72 22%
Newport News / Hampton, VA $ 37.47 $ 49.85 $ 12.37 33%
Norfolk / Portsmouth, VA $ 47.43 $ 64.34 $ 16.91 36%
Chesapeake / Suffolk, VA $ 43.65 $ 56.95 $ 13.30 30%
RevPAR Comparison
✅ Recovery

Active TransactionEnvironment

Deal-of-the-YearOceanfront Hiltonand Hilton Garden Inn$126.5 Million
20 Hotels Sold in 2018
Photo Courtesy of Shamin Hotels

$19 Million Purchase … $25 Million Renovation / Rebranding
Renovations
Source: Lingerfelt Commonwealth Partners
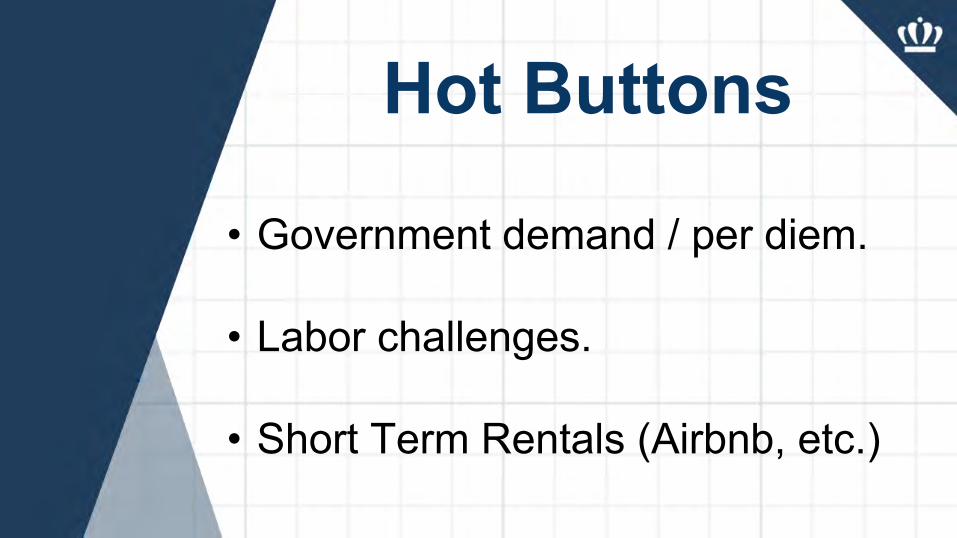
• Government demand / per diem.
• Labor challenges.
• Short Term Rentals (Airbnb, etc.)
Hot Buttons

0.4%
1.8%
4.7%
5.9%
0%
1%
2%
3%
4%
5%
6%
7%
Perc
ent o
f Hot
el R
even
ueAirbnb Revenue as Percentage of Total Hotel Revenue
Hampton Roads, October 2014 to July 2018
Sources: Dr. Vinod Agarwal; STR Trend Reports and AirDNA data received in September 2018 excluding shared rooms. Selected data points are July of each year. July 2018 = $7.3mil.

Robust Development
Pipeline


• Budgeting 2-5% growth in 2019
• Actively Buying and Selectively Building
• Modest cap rate growth
• Investment sales demand is strong
• Enthusiasm about Virginia Beach Sports Center
Outlook

The Virginia Beach Sports Center is the single biggest new demand
generator on the horizon.


MULTIFAMILY
RICHARD COUNSELMAN
VICE PRESIDENT, PARTNER
S.L. NUSBAUM REALTY CO.

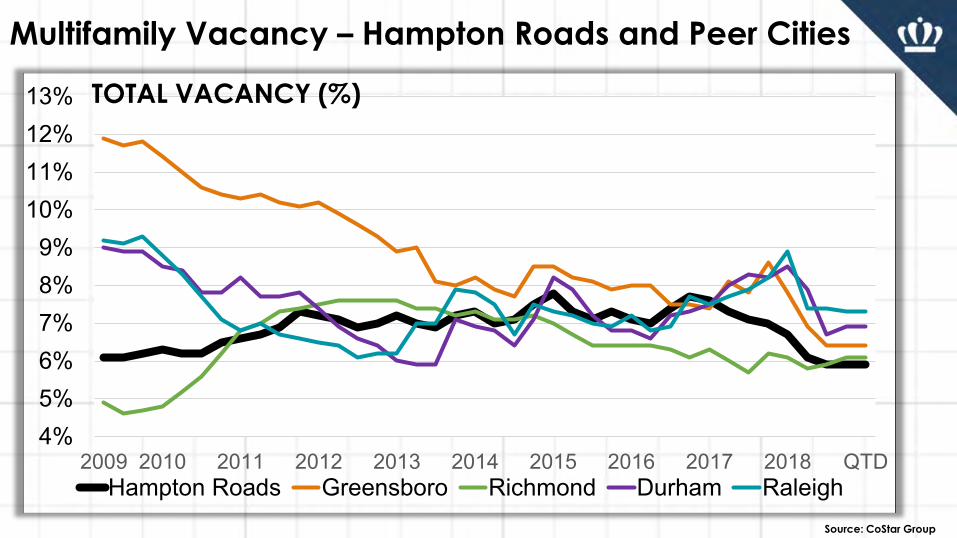
Multifamily Vacancy – Hampton Roads and Peer Cities
4%5%6%7%8%9%
10%11%12%13%
2009 2010 2011 2012 2013 2014 2015 2016 2017 2018 QTDHampton Roads Greensboro Richmond Durham Raleigh
TOTAL VACANCY (%)
Source: CoStar Group

Multifamily Rents – Hampton Roads and Peer Cities
$600$650$700$750$800$850$900$950
$1,000$1,050$1,100
2009 2010 2011 2012 2013 2014 2015 2016 2017 2018 QTDHampton Roads Greensboro Richmond Durham Raleigh
MULTIFAMILY EFFECTIVE RENT PER UNIT
Source: CoStar Group
Amenities
Source: CoStar Group
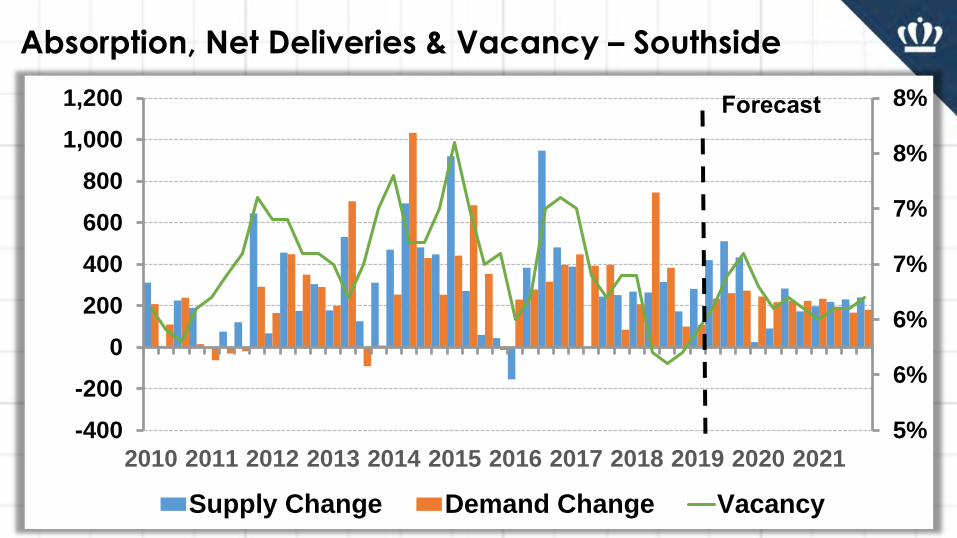
Absorption, Net Deliveries & Vacancy – Southside
5%
6%
6%
7%
7%
8%
8%
-400
-200
0
200
400
600
800
1,000
1,200
2010 2011 2012 2013 2014 2015 2016 2017 2018 2019 2020 2021
Supply Change Demand Change Vacancy
Forecast

Source: CoStar Group
Market Rent Per Unit & Rent Growth - SouthsideR
EN
T P
ER
UN
IT
$1,300
$1,250
$1,200
$1,150
$1,050
$1,100
$950
$1,000
RENT GROWTH Y/Y EFFECTIVE RENT PER UNITASKING RENT PER UNIT
3.0%
2.5%
2.0%
1.5%
0.0%
0.5%
-0.5%
1.0%
10 11 12 14 15 16 17 18 19 20 21 22 2313
FORECAST
09

Source: CoStar Group
Absorption, Net Deliveries & Vacancy – Peninsula
5%
6%
7%
8%
9%
10%
11%
-400
-200
0
200
400
600
800
2010 2011 2012 2013 2014 2015 2016 2017 2018 2019 2020 2021
Supply Change Demand Change Vacancy
Forecast

Source: CoStar Group
Market Rent Per Unit & Rent Growth - PeninsulaR
EN
T P
ER
UN
IT
RENT GROWTH Y/Y EFFECTIVE RENT PER UNITASKING RENT PER UNIT
$1,080$1,060$1,040$1,020
$980
$1,000
$940$960
$920
$900
$880$860 A
NN
UA
L R
EN
T G
RO
WT
H7%6%5%4%
2%
3%
0%1%
-1%
-2%
-3%-4%
FORECAST
10 11 12 14 15 16 17 18 19 20 21 22 23139
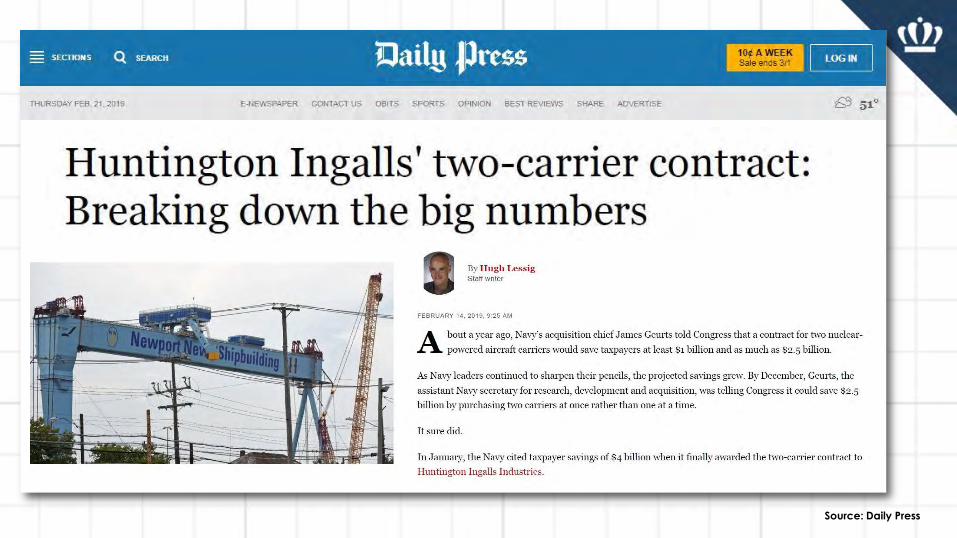
Source: Daily Press
Source: CoStar Group
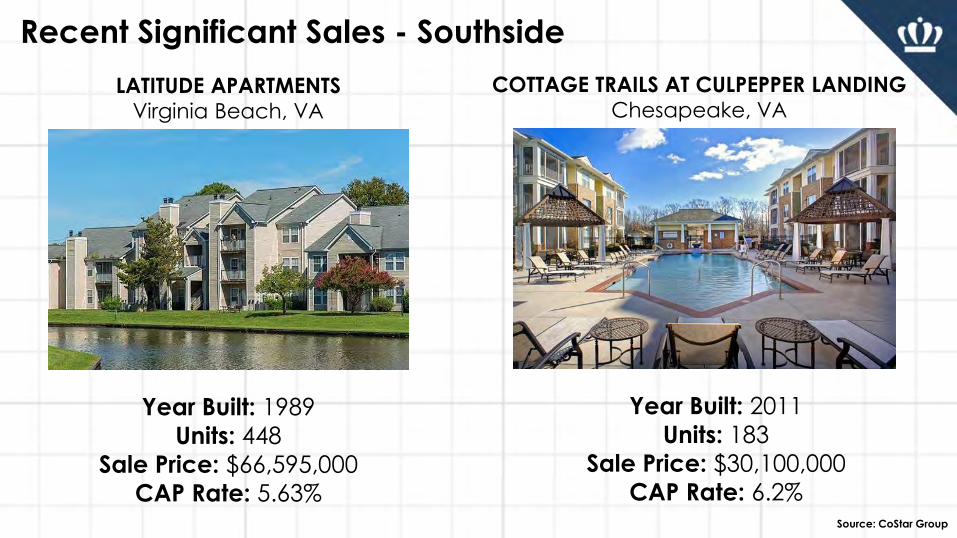
Recent Significant Sales - Southside
LATITUDE APARTMENTS Virginia Beach, VA
COTTAGE TRAILS AT CULPEPPER LANDING Chesapeake, VA
Year Built: 1989
Units: 448
Sale Price: $66,595,000
CAP Rate: 5.63%
Year Built: 2011
Units: 183
Sale Price: $30,100,000
CAP Rate: 6.2%
Source: CoStar Group
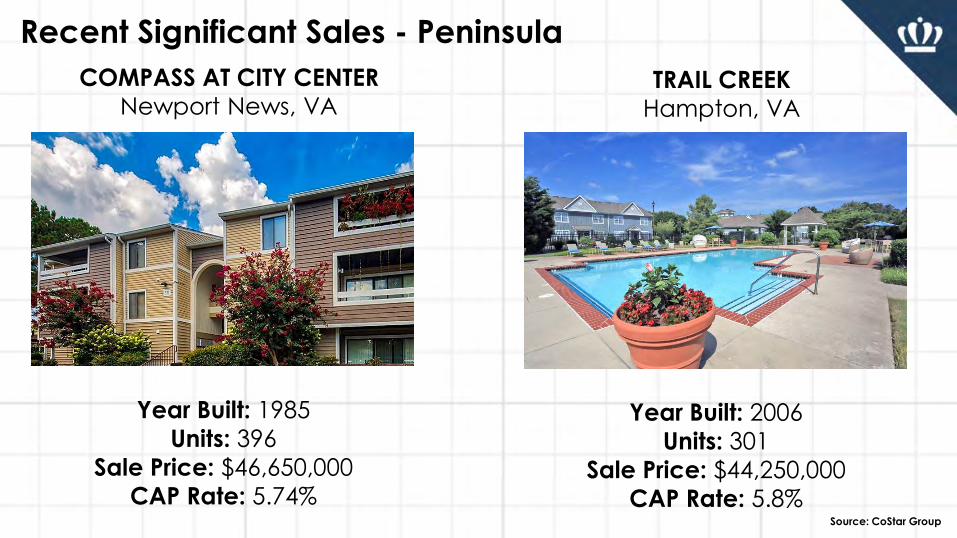
Recent Significant Sales - Peninsula
COMPASS AT CITY CENTER
Newport News, VATRAIL CREEK
Hampton, VA
Year Built: 1985
Units: 396
Sale Price: $46,650,000
CAP Rate: 5.74%
Year Built: 2006
Units: 301
Sale Price: $44,250,000
CAP Rate: 5.8%
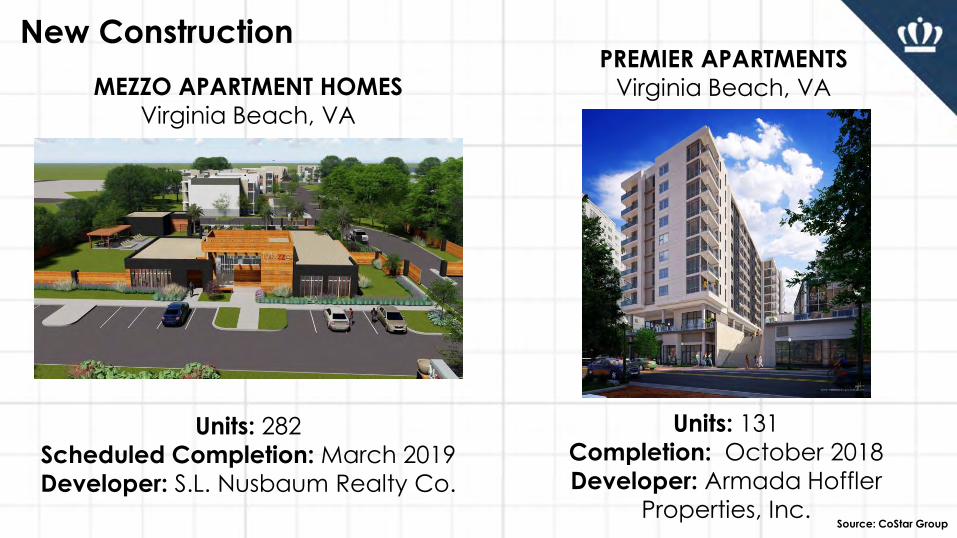
MEZZO APARTMENT HOMES
Virginia Beach, VA
PREMIER APARTMENTS
Virginia Beach, VA
Units: 282
Scheduled Completion: March 2019
Developer: S.L. Nusbaum Realty Co.
Units: 131
Completion: October 2018
Developer: Armada Hoffler
Properties, Inc.
New Construction
Source: CoStar Group

New ConstructionTHE CHOICES
Virginia Beach, VA
Units: 252
Completion: July 2018
Developer: Jaffe Caplan Fleder
THE MARQ
Virginia Beach, VA
Units: 264
Completion: June 2018
Developer: The Breeden CompanySource: CoStar Group

Construction Interest Rates
2.60%
1.37%
2.05%
3.23%
2.72%
4.76%4.12%
3.38%
3.75%
4.62%
1.00%1.50%2.00%2.50%3.00%3.50%4.00%4.50%5.00%
1/2/2014
3/17/2014
5/28/2014
8/7/2014
10/20/2014
1/2/2015
3/17/2015
5/27/2015
8/6/2015
10/19/2015
1/4/2016
3/16/2016
5/26/2016
8/8/2016
2016-10-19
1/3/2017
2017-03-16
2017-05-26
2017-08-08
2017-10-19
1/2/2018
3/15/2018
5/25/2018
8/7/2018
10/18/2018
15 16 17 1814
10 YEAR UST FHA
MARKET YEILD ON U.S. TREASURY SECURITIES AT 10-YEAR CONSTANT MATURITY AND FHA CONSTRUCTION INTEREST RATES
Source: AGM Financial

Source: ConstructConnect Inc.
Construction Costs
U.S. TOTAL RESIDENTIAL CONSTRUCTION STARTS$500
$400
$300
$200
$0
$100
$ B
ILL
ION
S U
SD
Source of actuals: ConstructConnect “Insight” / Forecasts: Oxford Economics and ConstructConnect.
2005
2007
2006
2008
2009
2010
2011
2016
2012
2013
2014
2015
2017
2018
2019
2020
2021
2022
2023
FORECAST

Source: Colliers International
Source: Colliers International

In conclusion….

THANKS!
Thanks to
all those
who made
this report possible


ResidentialINSERT HEADSHOT
HERE
J. VAN ROSE, JR.
CHIEF OPERATIONS OFFICER
ROSE & WOMBLE REALTY

So how did we do with our 2018 predictions from last
year’s Market Review?

We speculated that inventory would continue
to be a problem.

2019
7688 Listings
And inventory remains critically low
Source For All Graphs and Charts: REIN MLS

We pondered…were the experts right? Was a Housing Bubble coming?

Median Prices Rose Through 2018

The Peninsula New Construction Market – The Shift!!

We predicted rates would rise…but only incrementally.

Rates spiked briefly above 5%, but then retreated.
Source: Freddie Mac

2018 for the residential for-sale sector performance
(Hint: it was a pretty good year!)
2018 Resale Closings


2018 New Construction Closings


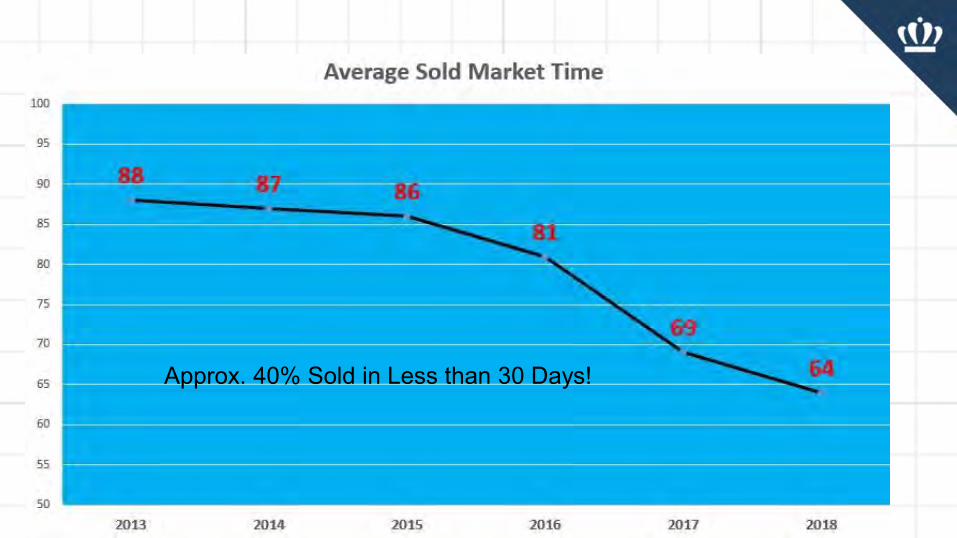
Approx. 40% Sold in Less than 30 Days!

Top 10 Builders by Closings
Hampton Roads

Top 10 Subdivisions by Closings - Hampton Roads

So what do we see for 2019?

✓ Residential Demand Excellent
✓ Low Inventory, Price Appreciation
✓ Abundance of Demographic Diversity-
Millennials & Baby Boomers in Record Numbers
✓ Improving Local Economy
Especially DOD & Medical
✓ Low/Stable Interest Rates
✓ Emerging Affordable Growth Corridor

Blue Skies & A Few Clouds


Presenting Sponsor

Exclusive Reception Sponsor

2019 Hampton Roads Real Estate Market Review & Forecast
E.V. WILLIAMS CENTER FOR REAL ESTATE
E.V. WILLIAMS CENTER FOR REAL ESTATE
2159 Constant HallNorfolk, VA 23529
odu.edu/creed