Embed Size (px)
Citation preview

Robert McFarlaneEVP & Chief Financial Officer
December 14, 2010
TELUS 2011 Targetsinvestor conference call

2TELUS forward looking statementsTELUS forward looking statements
Today's presentation and answers to questions contain statements about expected future events and financial and operating performance of TELUS that are forward-looking. By their nature, forward-looking statements require the Company to make assumptions and predictions and are subject to inherent risks and uncertainties. There is significant risk that the forward-looking statements will not prove to be accurate. Readers are cautioned not to place undue reliance on forward-looking statements as a number of factors could cause actual future performance and events to differ materially from that expressed in the forward-looking statements. Accordingly our comments are subject to the disclaimer and qualified by the assumptions (including assumptions for 2010 guidance and 2011 targets), qualifications and risk factors referred to in the Management’s discussion and analysis in the 2009 annual report and in the 2010 first, second and third quarter reports, in this presentation and in the 2011 Targets news release dated December 14, 2010. Except as required by law, TELUS disclaims any intention or obligation to update or revise forward-looking statements, and reserves the right to change, at any time at its sole discretion, its current practice of updating annual targets and guidance.
See Key Assumptions and Forward Looking Statements in TELUS’ 2011 Targets news release dated December 14, 2010.
3AgendaAgenda 3
2010 guidance
Voluntary pension contribution
2011 targets and assumptions
Summary
Questions and answers
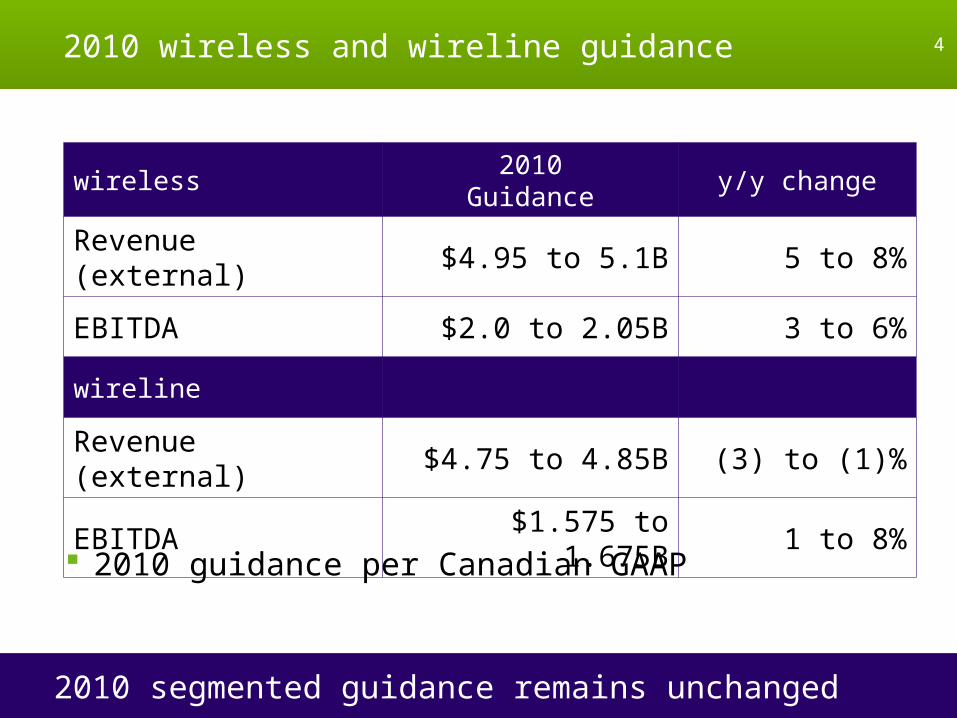
2010 wireless and wireline guidance2010 wireless and wireline guidance
2010 segmented guidance remains unchanged
4
2010 guidance per Canadian GAAP
wireless2010
Guidancey/y change
Revenue (external) $4.95 to 5.1B 5 to 8%
EBITDA $2.0 to 2.05B 3 to 6%
wireline
Revenue (external) $4.75 to 4.85B (3) to (1)%
EBITDA $1.575 to 1.675B 1 to 8%

2010Guidance
y/y change
Revenue (external) $9.7 to 9.95B 1 to 4%
EBITDA $3.6 to 3.7B 3 to 6%
EPS (basic) $3.10 to 3.30 (1) to 5%
Capex Approx. $1.7B (19)%
2010 consolidated guidance2010 consolidated guidance
2010 consolidated guidance remains unchanged
5
Pro-forma EPS per IFRS higher by 5 cents as of Q3-10 YTD
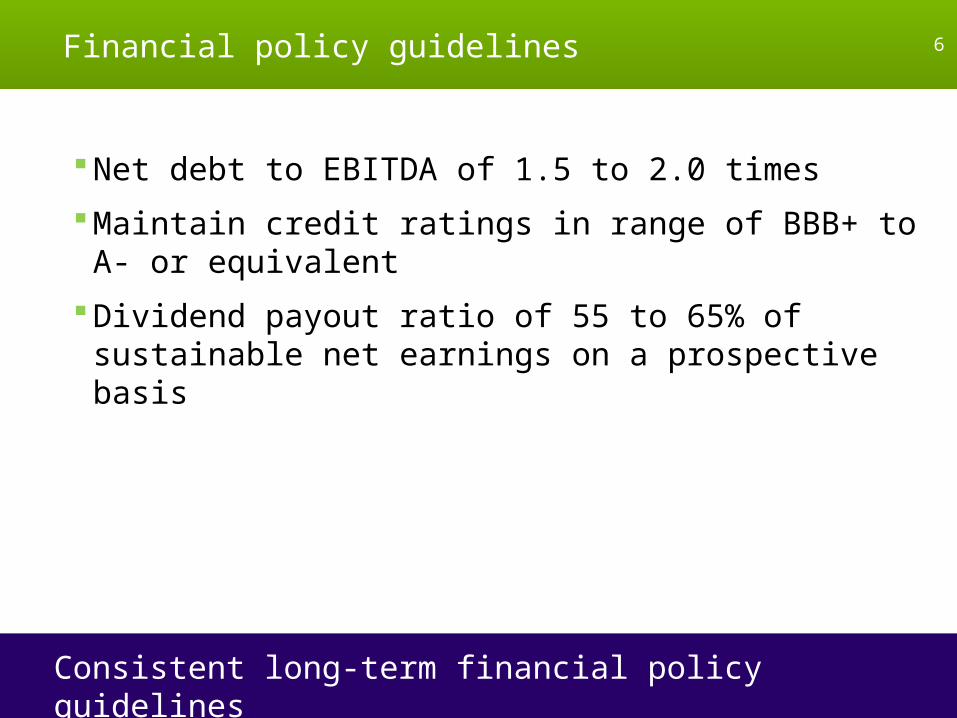
Financial policy guidelines Financial policy guidelines 6
Consistent long-term financial policy guidelines
Net debt to EBITDA of 1.5 to 2.0 times
Maintain credit ratings in range of BBB+ to A- or equivalent
Dividend payout ratio of 55 to 65% of sustainable net earnings on a prospective basis
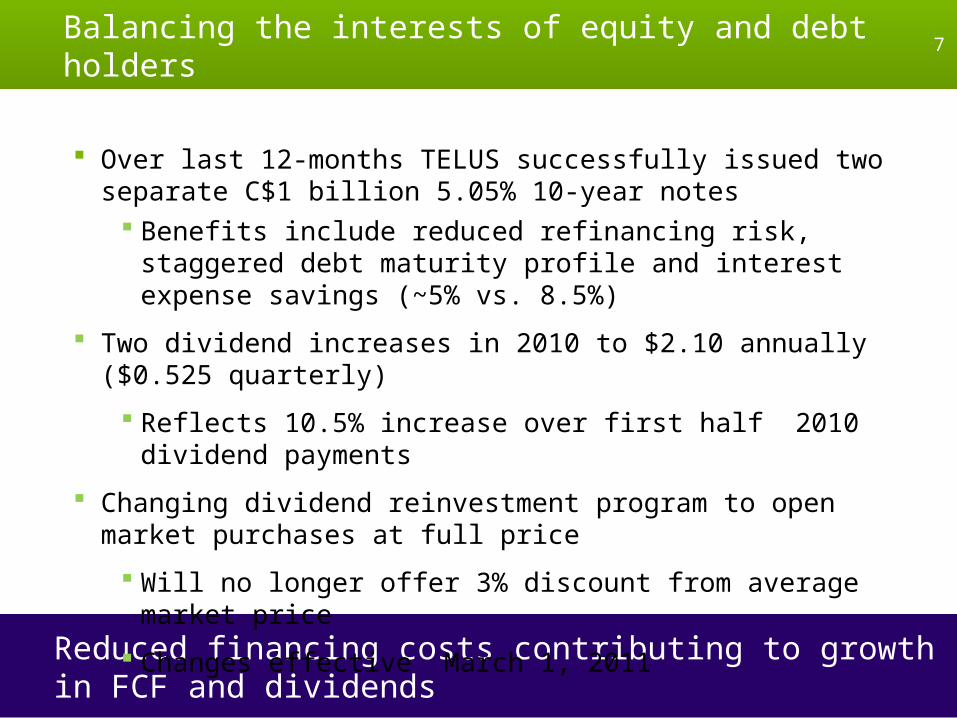
Balancing the interests of equity and debt holders Balancing the interests of equity and debt holders 7
Reduced financing costs contributing to growth in FCF and dividends
Over last 12-months TELUS successfully issued two separate C$1 billion 5.05% 10-year notes
Benefits include reduced refinancing risk, staggered debt maturity profile and interest expense savings (~5% vs. 8.5%)
Two dividend increases in 2010 to $2.10 annually ($0.525 quarterly)
Reflects 10.5% increase over first half 2010 dividend payments
Changing dividend reinvestment program to open market purchases at full price
Will no longer offer 3% discount from average market price
Changes effective March 1, 2011
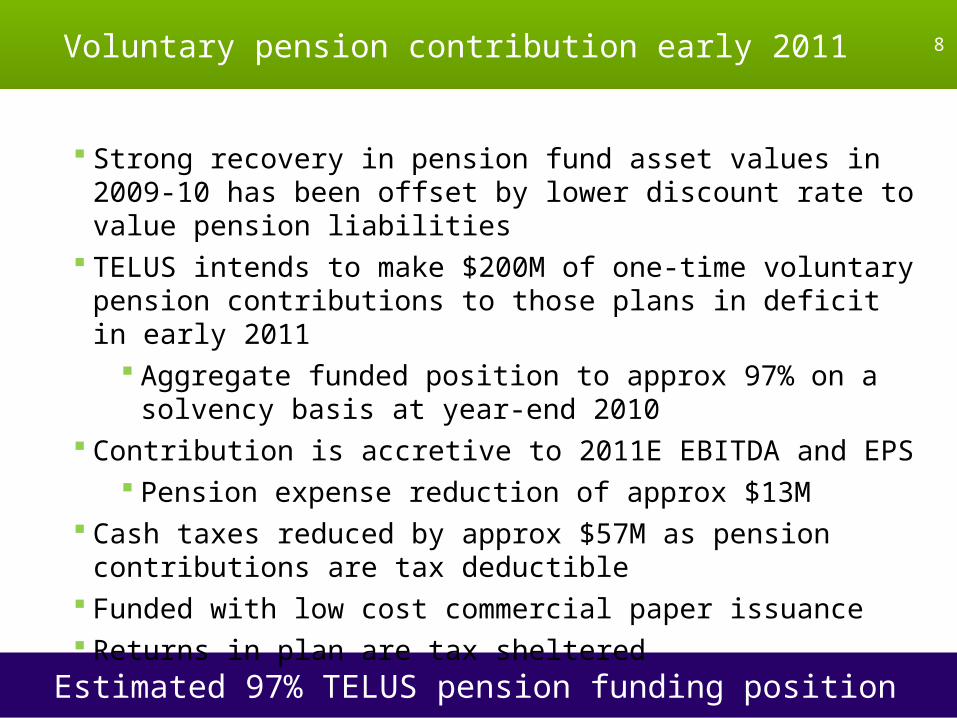
Voluntary pension contribution early 2011Voluntary pension contribution early 2011 8
Estimated 97% TELUS pension funding position
Strong recovery in pension fund asset values in 2009-10 has been offset by lower discount rate to value pension liabilities
TELUS intends to make $200M of one-time voluntary pension contributions to those plans in deficit in early 2011
Aggregate funded position to approx 97% on a solvency basis at year-end 2010
Contribution is accretive to 2011E EBITDA and EPS Pension expense reduction of approx $13M
Cash taxes reduced by approx $57M as pension contributions are tax deductible
Funded with low cost commercial paper issuance Returns in plan are tax sheltered

2011 targetsand assumptions

Defined benefit pension assumptionsDefined benefit pension assumptions
2010 (GAAP)
2011E (IFRS)*
Discount rate 5.85% 5.35%
Long-term expected return 7.25% 7.25%
Pension expense/(recovery) $28M $(35M)
Pension funding $143M $305M
Expected pension funding increase in 2011 includes voluntary contribution of $200M
10
* Final 2011E pension assumptions to be set in 2011

2010E 2011E
4,950 to 5,100
5,200 to 5,350
2011 wireless revenue target ($M)2011 wireless revenue target ($M)
Increase of 3.5 to 6.5% from subscriber and data revenue growth
11
Wireless industry penetration of Cdn population to increase by 4.5 - 5.0%
Wireless industry subscriber growth to be stimulated by increased competition and emergence of tablet devices
Continued TELUS domestic voice ARPU erosion offset by data and roaming ARPU growth
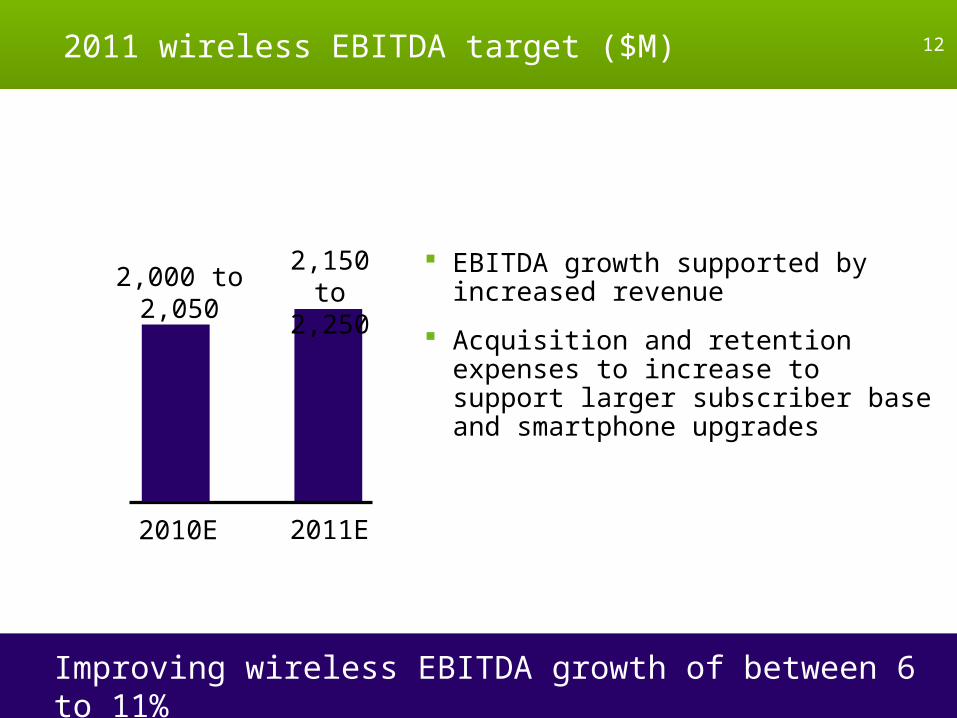
2011 wireless EBITDA target ($M)2011 wireless EBITDA target ($M)
Improving wireless EBITDA growth of between 6 to 11%
12
2010E 2011E
2,000 to 2,050
2,150 to 2,250
EBITDA growth supported by increased revenue
Acquisition and retention expenses to increase to support larger subscriber base and smartphone upgrades
2010E 2011E
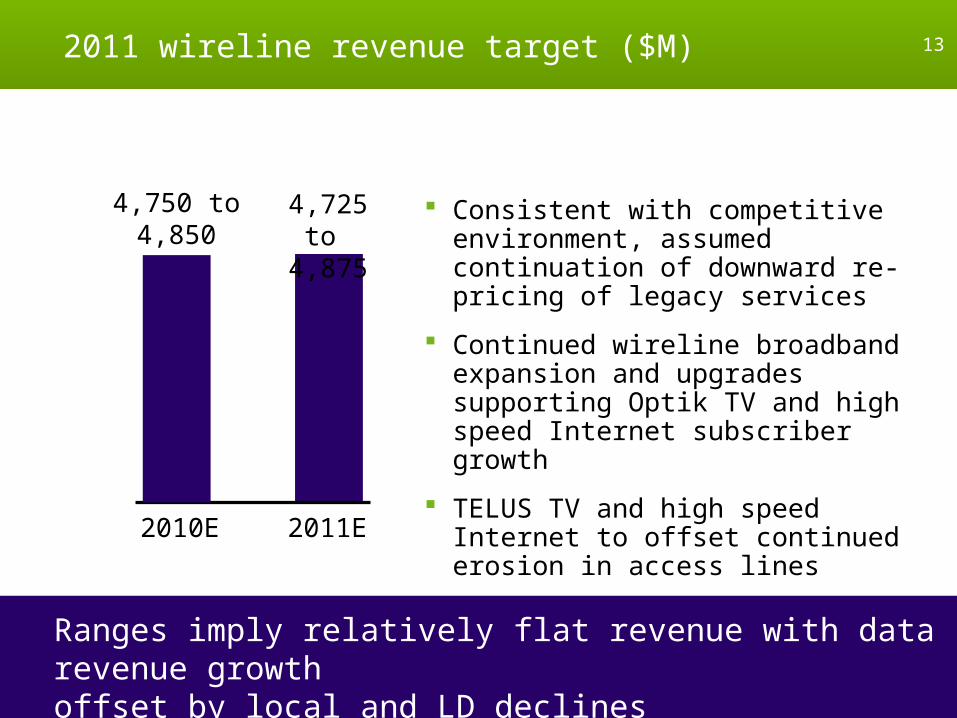
4,750 to 4,850
4,725 to 4,875
2011 wireline revenue target ($M)2011 wireline revenue target ($M) 13
Ranges imply relatively flat revenue with data revenue growth offset by local and LD declines
Consistent with competitive environment, assumed continuation of downward re-pricing of legacy services
Continued wireline broadband expansion and upgrades supporting Optik TV and high speed Internet subscriber growth
TELUS TV and high speed Internet to offset continued erosion in access lines
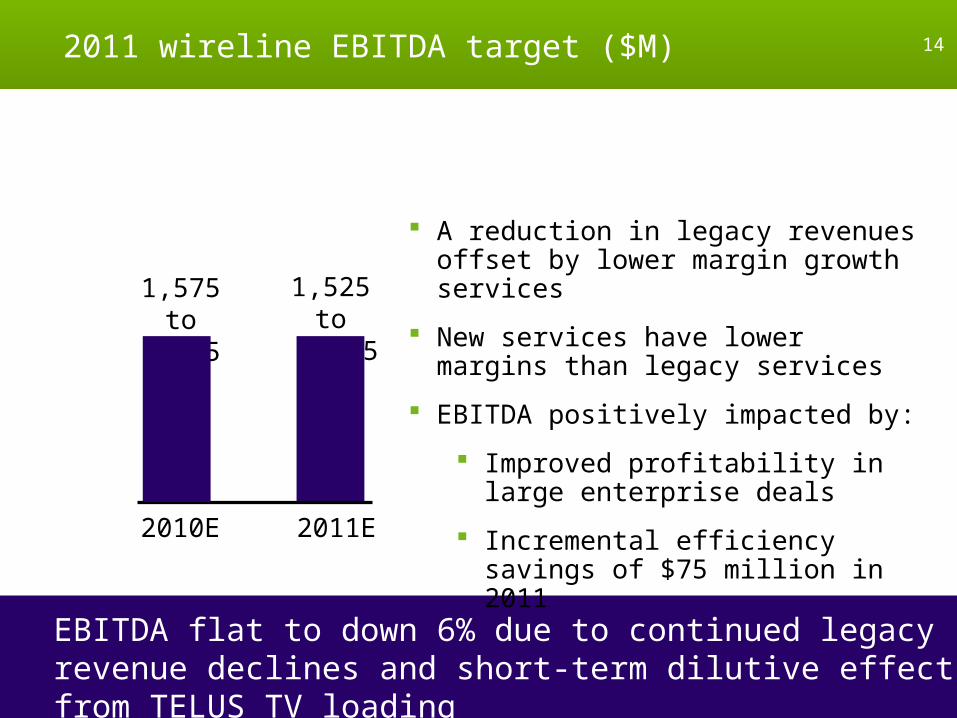
1,575 to 1,675
1,525 to 1,625
2011 wireline EBITDA target ($M)2011 wireline EBITDA target ($M)
EBITDA flat to down 6% due to continued legacy revenue declines and short-term dilutive effect from TELUS TV loading
2010E 2011E
14
A reduction in legacy revenues offset by lower margin growth services
New services have lower margins than legacy services
EBITDA positively impacted by:
Improved profitability in large enterprise deals
Incremental efficiency savings of $75 million in 2011

2011 consolidated targets ($M)2011 consolidated targets ($M)
2010E
9,700 to 9,950
15
Revenue growth of 1 to 4% and EBITDA growth of 1 to 6% driven by wireless
2011E
9,925 to 10,225
2010E 2011E
3,600 to 3,700
3,675 to 3,875
Revenue EBITDA

2010E
3.10 to 3.30
2011 EPS basic ($)2011 EPS basic ($)
2011E
3.50 to 3.90
16
EPS growth of 9 to 22% driven by EBITDA growth and lower financing costs
EPS benefits from a decrease in financing costs
Statutory tax rate assumption down 2 pts to 26.5 - 27.5%

2009 2010E
2011 consolidated capex target ($M)2011 consolidated capex target ($M)
2,103approx 1,700
200812007
1,8591,770
1 Excludes $882M in AWS spectrum
17
approx 1,700
2011E
2011 capex expected to be flat compared to 2010
2009 2010E
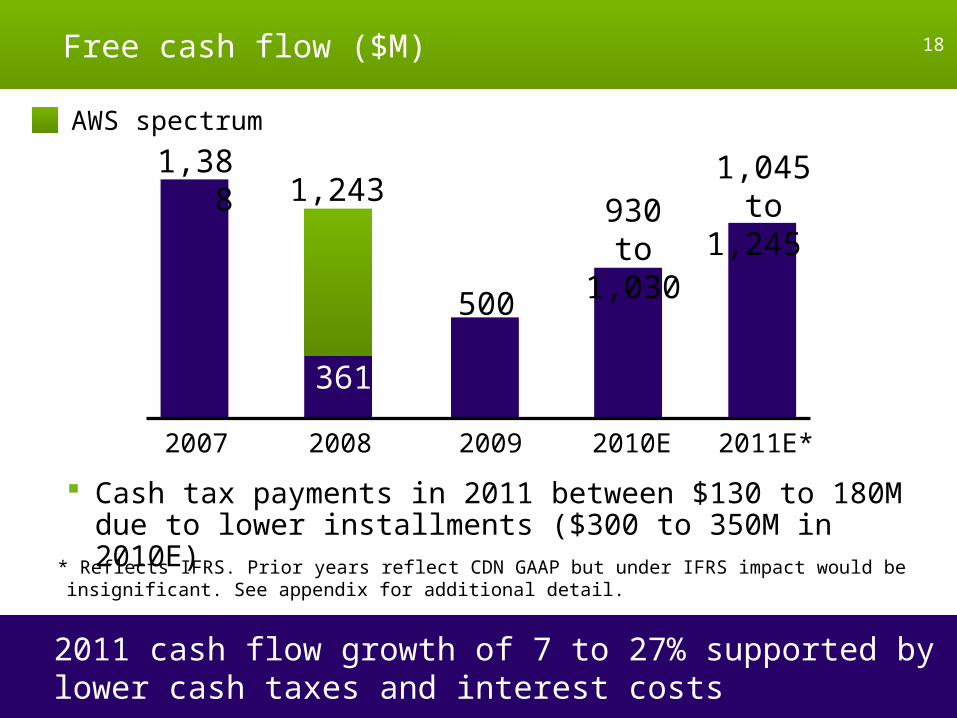
Free cash flow ($M)Free cash flow ($M)
20082007
1,388
361
500
930 to 1,030
1,243
AWS spectrum
18
2011E*
1,045 to 1,245
2011 cash flow growth of 7 to 27% supported by lower cash taxes and interest costs
Cash tax payments in 2011 between $130 to 180M due to lower installments ($300 to 350M in 2010E)
* Reflects IFRS. Prior years reflect CDN GAAP but under IFRS impact would be insignificant. See appendix for additional detail.
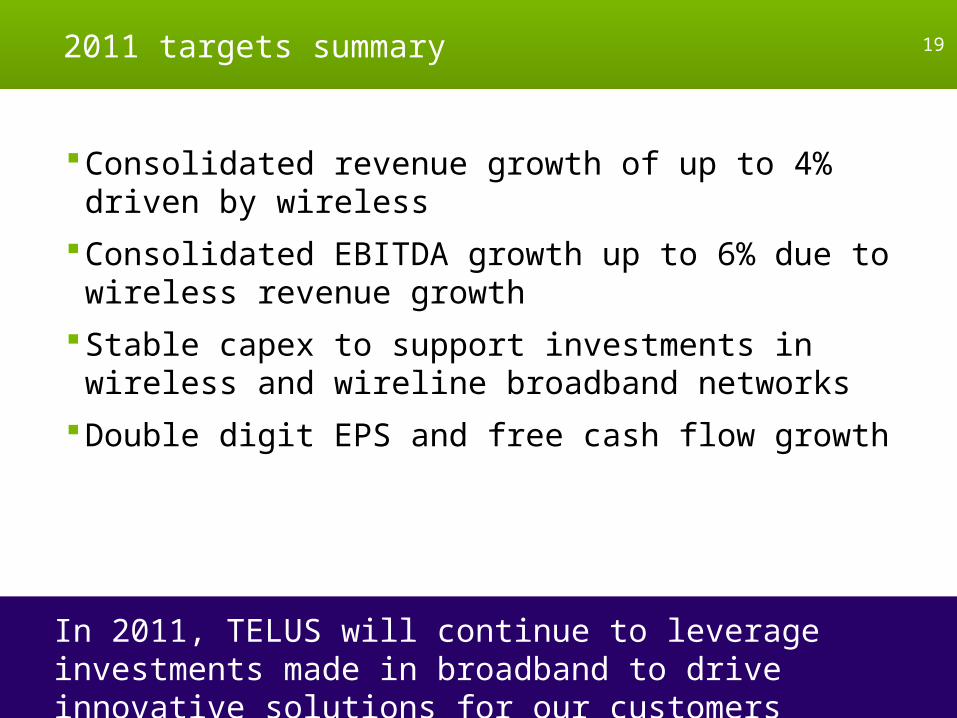
Consolidated revenue growth of up to 4% driven by wireless
Consolidated EBITDA growth up to 6% due to wireless revenue growth
Stable capex to support investments in wireless and wireline broadband networks
Double digit EPS and free cash flow growth
2011 targets summary 2011 targets summary 19
In 2011, TELUS will continue to leverage investments made in broadband to drive innovative solutions for our customers

Percentage increases calculated from 2011 ranges to mid-point of 2010 ranges
EBITDA: earnings, after restructuring costs, before interest, taxes, depreciation and amortization (2010 & prior years)
Capital intensity: capex divided by total revenue Cash flow: EBITDA less capex Free cash flow: EBITDA, adding Restructuring and workforce reduction
costs, net employee defined benefit plans expense, cash interest received and excess of share compensation expense over share compensation payments, subtracting cash interest paid, cash taxes, capital expenditures, cash restructuring payments, employer contributions to employee defined benefit plans, and cash related to Other expenses such as charitable donations and securitization fees
Cost of retention (COR): total costs to retain existing subscribers, often presented as a percentage of network revenue
Appendix – definitionsAppendix – definitions 21
TELUS definitions for non-GAAP measures
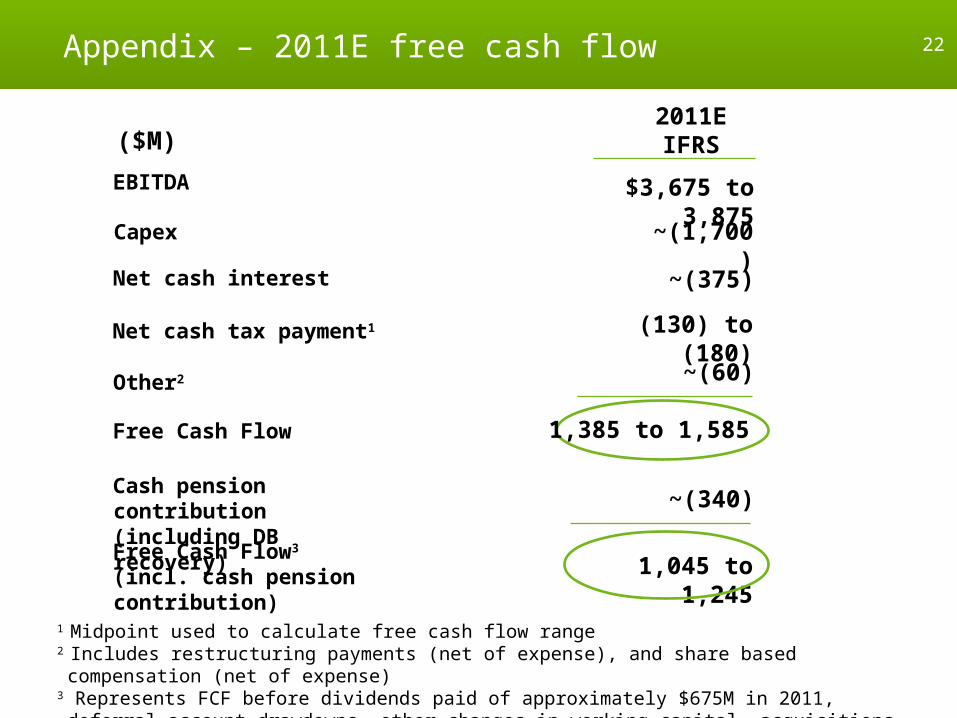
Net cash interest
EBITDA
($M)
Other2
Free Cash Flow
Capex
Net cash tax payment1
Cash pension contribution (including DB recovery)
Free Cash Flow3
(incl. cash pension contribution)
Appendix – 2011E free cash flowAppendix – 2011E free cash flow 22
1 Midpoint used to calculate free cash flow range2 Includes restructuring payments (net of expense), and share based compensation (net of expense)3 Represents FCF before dividends paid of approximately $675M in 2011, deferral account drawdowns, other changes in working capital, acquisitions, etc.
~(375)
2011EIFRS
$3,675 to 3,875
~(60)
~(1,700)
1,385 to 1,585
(130) to (180)
~(340)
1,045 to 1,245