Embed Size (px)
Citation preview
Universita degli Studi di Napoli Federico II
Dottorato di Ricerca in Fisica Fondamentale ed ApplicataXV III ciclo
Roberto Santorelli
WARP:
a direct search for Dark Matter
Il Coordinatore:Prof. Arturo Tagliacozzo
Novembre 2005

2

Dedicato a Diego(nonostante tutte le notti insonni)
3

4
Contents
Introduction
1 The Dark Matter Problem 111.1 INTRODUCTION . . . . . . . . . . . . . . . . . . . . . . . . 111.2 ASTROPHYSICAL EVIDENCE OF DARK MATTER . . . 111.3 BARYONIC DARK MATTER . . . . . . . . . . . . . . . . . 151.4 COSMIC MICROWAVE BACKGROUND ANISOTROPIES 151.5 COMPOSITION OF THE UNIVERSE . . . . . . . . . . . . 201.6 COLD AND HOT DARK MATTER AND RELIC DENSITY 221.7 SUPERSYMMETRIC EXTENSION OF THE STANDARD
MODEL . . . . . . . . . . . . . . . . . . . . . . . . . . . . . 271.7.1 GUT . . . . . . . . . . . . . . . . . . . . . . . . . . . . 291.7.2 SUPERPARTICLES . . . . . . . . . . . . . . . . . . . 321.7.3 R-PARITY . . . . . . . . . . . . . . . . . . . . . . . . 33
1.8 THE GALACTIC DARK HALO . . . . . . . . . . . . . . . . 35
2 WIMP direct detection 382.1 INTRODUCTION . . . . . . . . . . . . . . . . . . . . . . . . 382.2 EXPECTED RECOIL SPECTRUM AND INTERACTION
RATE . . . . . . . . . . . . . . . . . . . . . . . . . . . . . . . 382.3 LOW BACKGROUND TECHNIQUES . . . . . . . . . . . . 452.4 REVIEW OF PRESENT EXPERIMENTS . . . . . . . . . . 482.5 NOBLE LIQUIDS EXPERIMENTS . . . . . . . . . . . . . . 532.6 INDIRECT WIMP SEARCHES . . . . . . . . . . . . . . . . 55
3 WARP 2.3 liters 573.1 INTRODUCTION . . . . . . . . . . . . . . . . . . . . . . . . 573.2 LIQUID ARGON AS WIMP TARGET . . . . . . . . . . . . 573.3 SCINTILLATION LIGHT EMISSIONS IN LAr . . . . . . . . 593.4 PROPOSED TECHNIQUE . . . . . . . . . . . . . . . . . . . 643.5 SETUP OF THE 2.3l TEST CHAMBER . . . . . . . . . . . 663.6 DATA ACQUISITION . . . . . . . . . . . . . . . . . . . . . . 723.7 RESULTS OF THE PRELIMINARY TESTS . . . . . . . . . 74
5
3.8 WARP 2.3L CHAMBER AT LNGS . . . . . . . . . . . . . . 793.8.1 SETUP . . . . . . . . . . . . . . . . . . . . . . . . . . 793.8.2 DATA ACQUISITION . . . . . . . . . . . . . . . . . . 81
3.9 RESULTS AT LNGS . . . . . . . . . . . . . . . . . . . . . . . 823.9.1 OBSERVATION OF THE INTERNAL 222Rn AND
39Ar SIGNALS . . . . . . . . . . . . . . . . . . . . . . 833.10 ARGON RECOIL EVENTS SELECTION . . . . . . . . . . 87
3.10.1 PULSE SHAPE DISCRIMINATION . . . . . . . . . . 893.11 PRELIMINARY RESULTS ABOUT NUCLEAR RECOILS
IDENTIFICATION . . . . . . . . . . . . . . . . . . . . . . . 91
4 WARP 100L 944.1 INTRODUCTION . . . . . . . . . . . . . . . . . . . . . . . . 944.2 GENERAL LAYOUT . . . . . . . . . . . . . . . . . . . . . . 944.3 INNER DETECTOR . . . . . . . . . . . . . . . . . . . . . . . 964.4 ACTIVE VETO . . . . . . . . . . . . . . . . . . . . . . . . . 984.5 PASSIVE SHIELDING . . . . . . . . . . . . . . . . . . . . . 1004.6 READOUT ELECTRONICS AND TRIGGER SYSTEM . . 1024.7 BACKGROUND ESTIMATION . . . . . . . . . . . . . . . . 103
4.7.1 NEUTRONS INDUCED BACKGROUND . . . . . . . 1034.7.2 β − γ INDUCED BACKGROUND . . . . . . . . . . . 1124.7.3 OTHER BACKGROUND SOURCES . . . . . . . . . 114
4.8 EXPECTED EXPERIMENTAL SENSITIVITY . . . . . . . 116
5 Characterization of photomultiplier tubes for the WARPexperiment 1185.1 INTRODUCTION . . . . . . . . . . . . . . . . . . . . . . . . 1185.2 CRYOGENIC PHOTOMULTIPLERS . . . . . . . . . . . . . 1195.3 AIM OF THE TESTS . . . . . . . . . . . . . . . . . . . . . . 1215.4 PMT TEST FACILITY . . . . . . . . . . . . . . . . . . . . . 125
5.4.1 MECHANICAL SET-UP . . . . . . . . . . . . . . . . 1255.4.2 DATA ACQUISITION AND ANALYSIS SOFTWARE 128
5.5 RESULTS . . . . . . . . . . . . . . . . . . . . . . . . . . . . . 1315.5.1 DARK COUNTS AND SINGLE PHOTOELECTRON
RESPONSE . . . . . . . . . . . . . . . . . . . . . . . . 1315.5.2 MULTIPHOTONS RESPONSE . . . . . . . . . . . . 137
5.6 POSSIBLE IMPROVEMENTS TO THE SET-UP . . . . . . 141
Conclusions 145
Bibliography 148
6
”L’Anticristo puo nascere dalla stessa pieta, dall’eccessivo amordi Dio o della verita, come l’eretico nasce dal santo e
l’indemoniato dal veggente.Temi, Adso, i profeti e coloro disposti a morire per la verita.
... l’unica verita e imparare a liberarci dalla passione insana perla verita...”
(”Il nome della Rosa”)
7

8
Introduction
The main aim of this work is to present the results of my activity duringthe period as PhD student. During the last three years I was involved inthe WARP experiment (WIMP ARgon Programme), whose aim is toobtain an evidence of the WIMPs existence through direct detections oftheir elastic scattering over the Argon nuclei. The first half of my PhDwas spent between Napoli and Pavia Universities developing a double phaseArgon chamber. I was involved in the improvement of the hardware set-upof a test chamber and in data analysis carried out during the last part of theR&D period in Pavia. In addition I developed some MonteCarlo studies inNaples, regarding mainly the light collection and field simulation. Duringthe second half of my doctorate, I gave a contribute to the data taking atGran Sasso national laboratory. Moreover, a large part of the activity wasfocused on the study of a new detector with 100l of sensitive volume. Themain subject of this activity was the development of a MontCarlo simulationof background and the setting-up of a facility in Naples for the test andthe characterization of the cryogenic photomultipliers, used to detect thescintillation light produced in Argon.
The guide idea of this work is to merge the intention of reporting themain aspects of the research and the necessity of underlining my personalcontribution to the activity. Anyway, I had the pleasure, like other membersof the collaboration, to take part to a lot of activities regarding the exper-iment, so my contribute is spread in different aspects of the research. Thefinal result is a good compromise, thus the main aspects of the research arepresented in an exhaustive manner and my personal contribution stands outby pointing time by time on some specific aspects.
In this thesis the first two chapters are dedicated to the presentation ofthe Dark Matter problem. In chapter 1 the main evidences of the existenceof more matter in the Universe than the baryonic component is presented,and a possible explanation of the Dark Matter problem in the ParticlePhysic field is given. In chapter 2 is dedicated to the description of thedirect search of Dark Matter; theoretical prediction are discussed with themain experimental techniques. In chapter 3, after a brief description of theliquid Argon properties, the proposed technology, based on the contempo-rary detection of scintillation light and ionization charge through a doublephase detector, is presented. Results of the R&D activity on a test chamberwith 2.3l of sensitive volume and the preliminary results of the data takingat Gran Sasso laboratory are then presented.
In chapters 4 and 5 the activity concerning a new detector with 100lof sensitive volume, actually under construction, is presented. In chapter 4the experimental set-up is presented with a MonteCarlo study of the back-ground and an estimation of the experimental sensitivity. Finally, in the lastchapter, a detailed description of the experimental set-up of the test facility
9

made in Naples is given. Preliminary results regarding the characterizationof photomultiplier tubes used for the detection of the scintillation light inthe detector are also presented.
10
Chapter 1
The Dark Matter Problem
1.1 INTRODUCTION
Recent astronomical evidences indicate that only a little fraction of thematter of the Universe is composed by ”ordinary” baryonic matter, whileabout the 90% has an unknown nature. This is the so-called ”Dark Matter”.During last years, the proofs of the possible presence of Dark Matter havebeen found coming from several (and independent) investigations in differentfields of research. Theoretical predictions suggest that this unknown mat-ter could be made of a generic class of particles called Weakly InteractingMassive Particles (WIMPs), relics of the Big Bang, that still exist today.Moreover,in a completely independent way, the supersymmetric extensionof the Standard Model provides a possible WIMP candidate in the lightestsupersymmetric particle, that should be stable, enough massive and weaklyinteracting.
The main aim of this chapter is to present the most interesting evidencesthat could give proofs of Dark Matter, describing the scenario of the thepossible composition of the Universe, in which Dark Matter has an importantrole. The motivations of the so-called SuperSymmetry and its candidateas WIMP are then presented, evidencing how this theory, starting from acompletely different point of view, requires the existence of a particle withthe same characteristic of the WIMPs . Finally, assuming a relic abundanceof WIMPs produced after the Bing Bang, a possible presence of a galacticdark halo is considered and its possible theoretical model is presented.
1.2 ASTROPHYSICAL EVIDENCE OF DARKMATTER
Although the evidence for the existence of Dark Matter and Dark Energyis indirect, given by observation of their gravitational effects, it is possibleto get indication of this evidence on scales ranging from galaxies to the
11
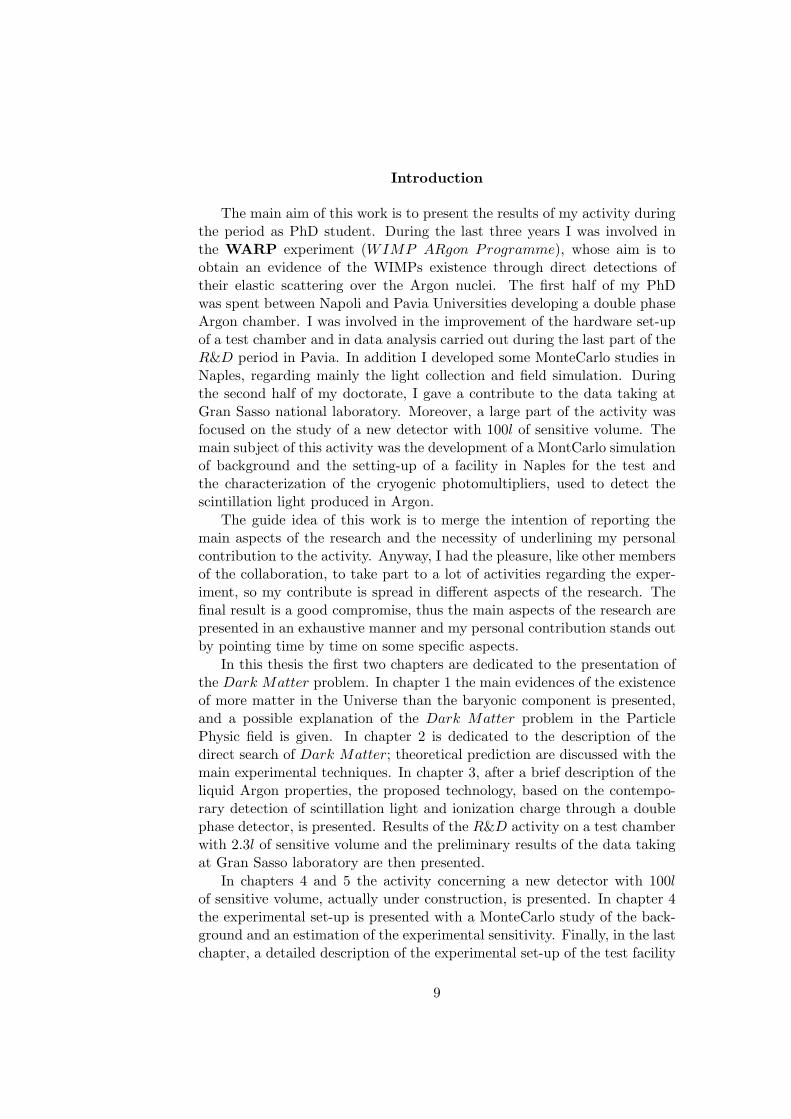
Figure 1.1: Rotation curve of the spiral galaxy M33, superimposed on itsoptical image. The points are the measured circular rotation velocities asfunction of the distance from the center of the galaxy. The expected behav-ior of the rotation curve based on the contribute of luminous disk alone isreported.
whole universe. Dark matter seems to be required from quite independentastrophysical observations. The most important evidence for Dark Matteron galactic scales comes from the observations of the rotation curves ofgalaxies, i.e. the circular velocities of the objects moving around a galaxyas a function of their distance from the galactic centre (fig. 1.1). Duringthe 30’s F. Zwicky made the first proposal for the existence of a ”dark”matter component in the universe observing that velocity distributions inthe Coma galactic cluster were incompatible with the gravitational effect ofvisible light-emitted matter by two orders of magnitude. During the 70’s,using the observations of the Doppler shift of the 21cm emission by thecold atomic hydrogen clouds moving around the galaxies, it was possible toextend the measurement of the circular velocity far away from the opticaldisk 1 (the dimension of the gaseous disk is typically two times or morebigger than the optical disk). It’s clear that such type of measure is strictly
1The optical disk is typically defined as the radius of the region containing the 83% ofthe total amount of light of a galaxy (Rott ∼10kpc)
12
related to the mass of the galaxy. According to the Newtonian dynamics,the circular velocity is expected to be
v(r) =
√GM(r)
r(1.1)
where M(r) = 4π∫
ρ(r)r2dr is the mass included in a sphere of radius rand ρ(r) is the density function. In this way the circular velocity shoulddecrease like 1
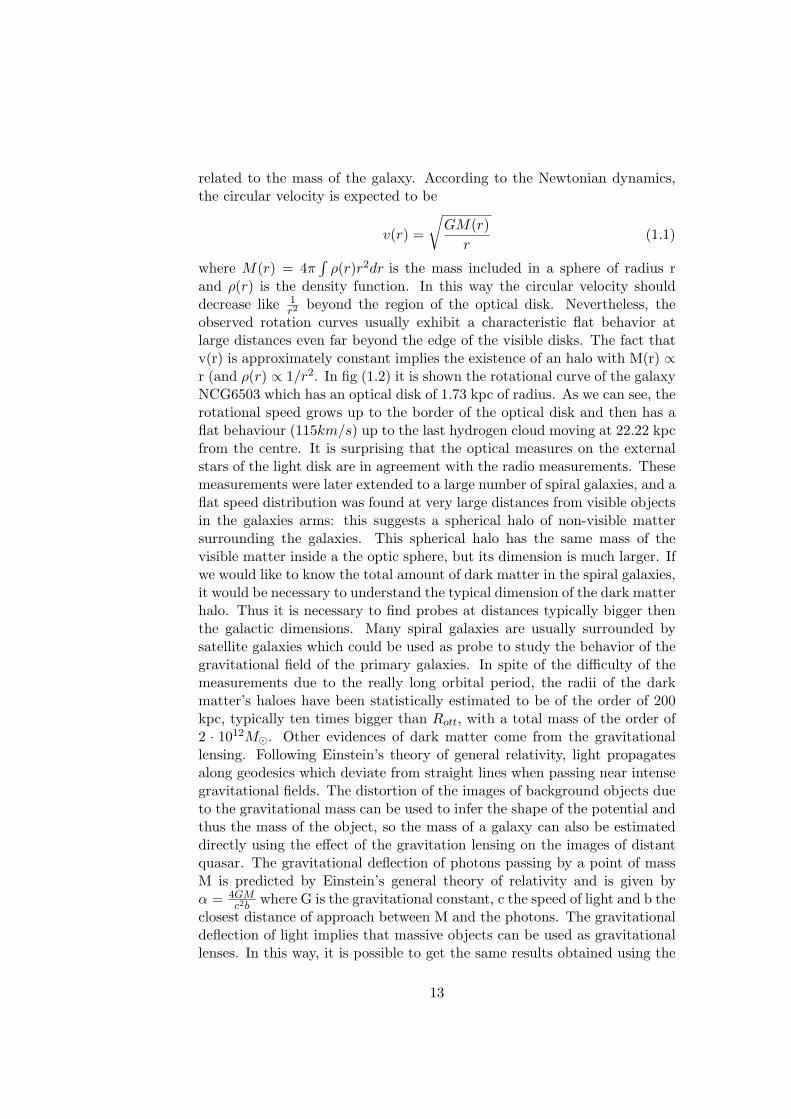
r2 beyond the region of the optical disk. Nevertheless, theobserved rotation curves usually exhibit a characteristic flat behavior atlarge distances even far beyond the edge of the visible disks. The fact thatv(r) is approximately constant implies the existence of an halo with M(r) ∝r (and ρ(r) ∝ 1/r2. In fig (1.2) it is shown the rotational curve of the galaxyNCG6503 which has an optical disk of 1.73 kpc of radius. As we can see, therotational speed grows up to the border of the optical disk and then has aflat behaviour (115km/s) up to the last hydrogen cloud moving at 22.22 kpcfrom the centre. It is surprising that the optical measures on the externalstars of the light disk are in agreement with the radio measurements. Thesemeasurements were later extended to a large number of spiral galaxies, and aflat speed distribution was found at very large distances from visible objectsin the galaxies arms: this suggests a spherical halo of non-visible mattersurrounding the galaxies. This spherical halo has the same mass of thevisible matter inside a the optic sphere, but its dimension is much larger. Ifwe would like to know the total amount of dark matter in the spiral galaxies,it would be necessary to understand the typical dimension of the dark matterhalo. Thus it is necessary to find probes at distances typically bigger thenthe galactic dimensions. Many spiral galaxies are usually surrounded bysatellite galaxies which could be used as probe to study the behavior of thegravitational field of the primary galaxies. In spite of the difficulty of themeasurements due to the really long orbital period, the radii of the darkmatter’s haloes have been statistically estimated to be of the order of 200kpc, typically ten times bigger than Rott, with a total mass of the order of2 · 1012M¯. Other evidences of dark matter come from the gravitationallensing. Following Einstein’s theory of general relativity, light propagatesalong geodesics which deviate from straight lines when passing near intensegravitational fields. The distortion of the images of background objects dueto the gravitational mass can be used to infer the shape of the potential andthus the mass of the object, so the mass of a galaxy can also be estimateddirectly using the effect of the gravitation lensing on the images of distantquasar. The gravitational deflection of photons passing by a point of massM is predicted by Einstein’s general theory of relativity and is given byα = 4GM
c2bwhere G is the gravitational constant, c the speed of light and b the
closest distance of approach between M and the photons. The gravitationaldeflection of light implies that massive objects can be used as gravitationallenses. In this way, it is possible to get the same results obtained using the
13
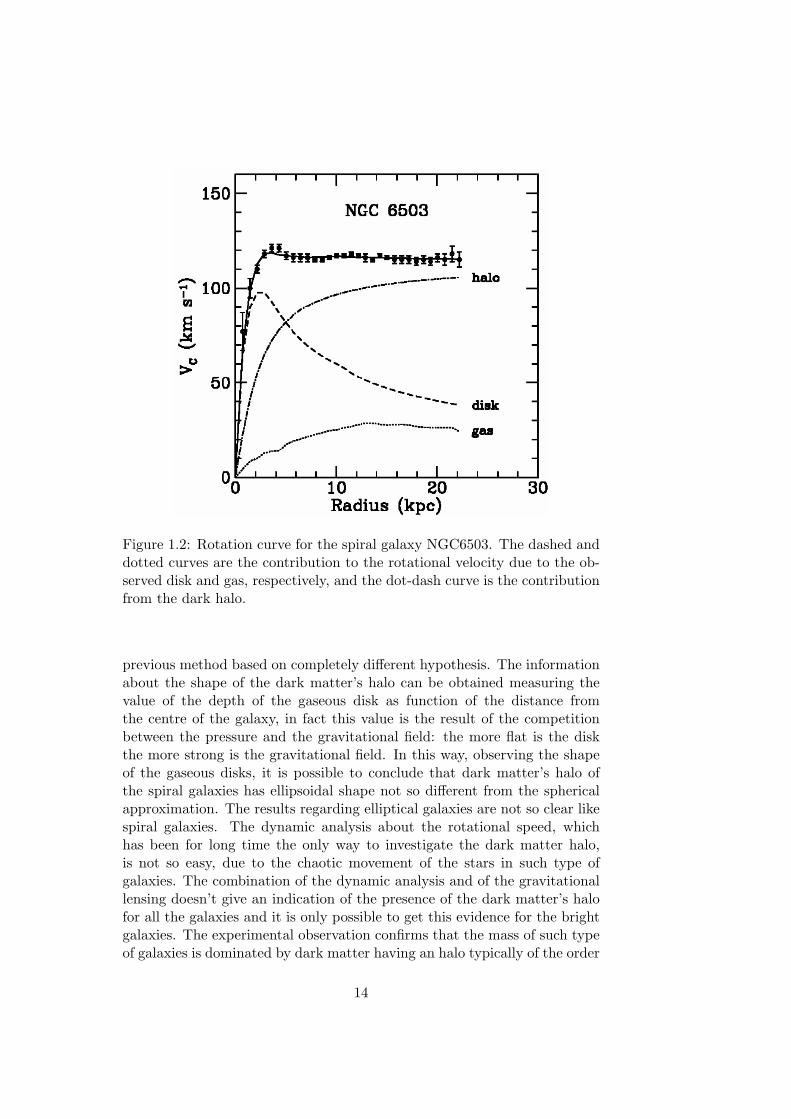
Figure 1.2: Rotation curve for the spiral galaxy NGC6503. The dashed anddotted curves are the contribution to the rotational velocity due to the ob-served disk and gas, respectively, and the dot-dash curve is the contributionfrom the dark halo.
previous method based on completely different hypothesis. The informationabout the shape of the dark matter’s halo can be obtained measuring thevalue of the depth of the gaseous disk as function of the distance fromthe centre of the galaxy, in fact this value is the result of the competitionbetween the pressure and the gravitational field: the more flat is the diskthe more strong is the gravitational field. In this way, observing the shapeof the gaseous disks, it is possible to conclude that dark matter’s halo ofthe spiral galaxies has ellipsoidal shape not so different from the sphericalapproximation. The results regarding elliptical galaxies are not so clear likespiral galaxies. The dynamic analysis about the rotational speed, whichhas been for long time the only way to investigate the dark matter halo,is not so easy, due to the chaotic movement of the stars in such type ofgalaxies. The combination of the dynamic analysis and of the gravitationallensing doesn’t give an indication of the presence of the dark matter’s halofor all the galaxies and it is only possible to get this evidence for the brightgalaxies. The experimental observation confirms that the mass of such typeof galaxies is dominated by dark matter having an halo typically of the order
14
of 100 kpc. Another evidence of dark matter comes, on a bigger scale, fromthe galaxy cluster. If the single galaxies are dominated by dark matter, itis clear that the major part of a cluster’s mass comes from the dark mattercomponent. These experimental observations are not so obvious, in factthe study of the dark matter component in the clusters has been developedindependently by the study of the dark matter component in the galaxies.The clusters have much of the visible mass in the form of hot X-ray emittinggas. The gas temperature (typically 107 − 108 K) is clearly far in excess ofthe escape velocities as deduced from the visible mass. The fact that the gasis bound by gravitational forces confirms that the largest part (at least 80%)of the total mass must be dark matter concentrated in the cluster centres.Although both the quantities of dark matter’s component in galaxies andcluster are not sufficiently known, there is no evidence of inconsistency.References: [1],[2],[3],[4],[8]
1.3 BARYONIC DARK MATTER
Many candidates have been proposed to solve the dark matter problem. Itis natural to expect the existence of ordinary baryonic dark matter as as-tronomical objects with a reduced luminosity, (i.e. difficult to be detected).Possible examples are given by cold H2 clouds, that do not present char-acteristic 21 cm line of the atomic hydrogen and that could not emit anyradiation (according to their temperature), and by MACHOs (Massive As-trophysical Compact Halo Objects). Many astrophysical objects belong tothis category, like neutron stars, brown-white-red-beige dwarf, black holes.Several hundred MACHOs have been observed because of their gravitationallensing of light from some stars in the Large Magellanic Clouds. AlthoughMACHOs seem to have a significant weight as part of the total matter, thefollowing observations seem to exclude a scenario in which the dark matterproblem can be explained by baryonic matter.References :[2],[3]
1.4 COSMIC MICROWAVE BACKGROUND ANI-SOTROPIES
For several hundred thousand years after the Big Bang, the universe washot enough for matter (predominantly hydrogen) to remain ionized. Duringthis period, matter and light were in thermal equilibrium and the radia-tion is therefore expected to obey the classic blackbody laws (Planck, Wien,Stefan). At some point about 400,000 years after the Bing Bang (and at atemperature of about 3000K) , the universe had cooled to the point wherethe matter became neutral, at which point the universe’s matter also becametransparent to the radiation. The Cosmic Microwave Background (CMB) is
15
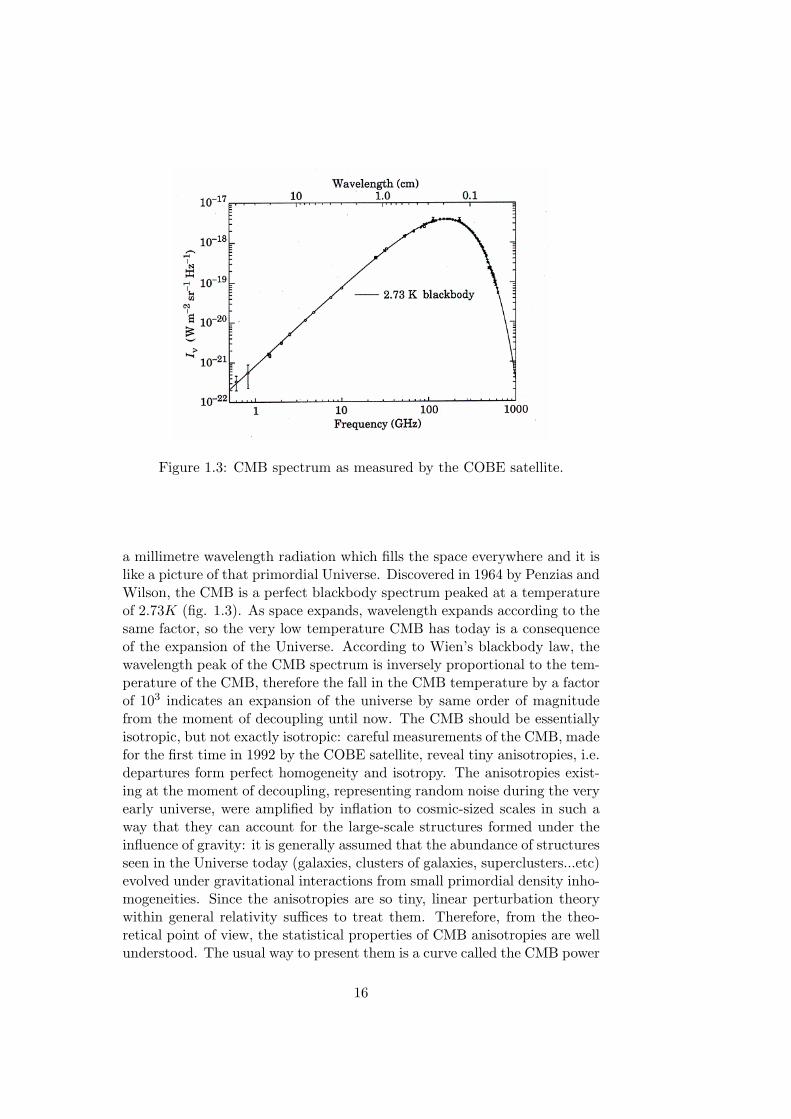
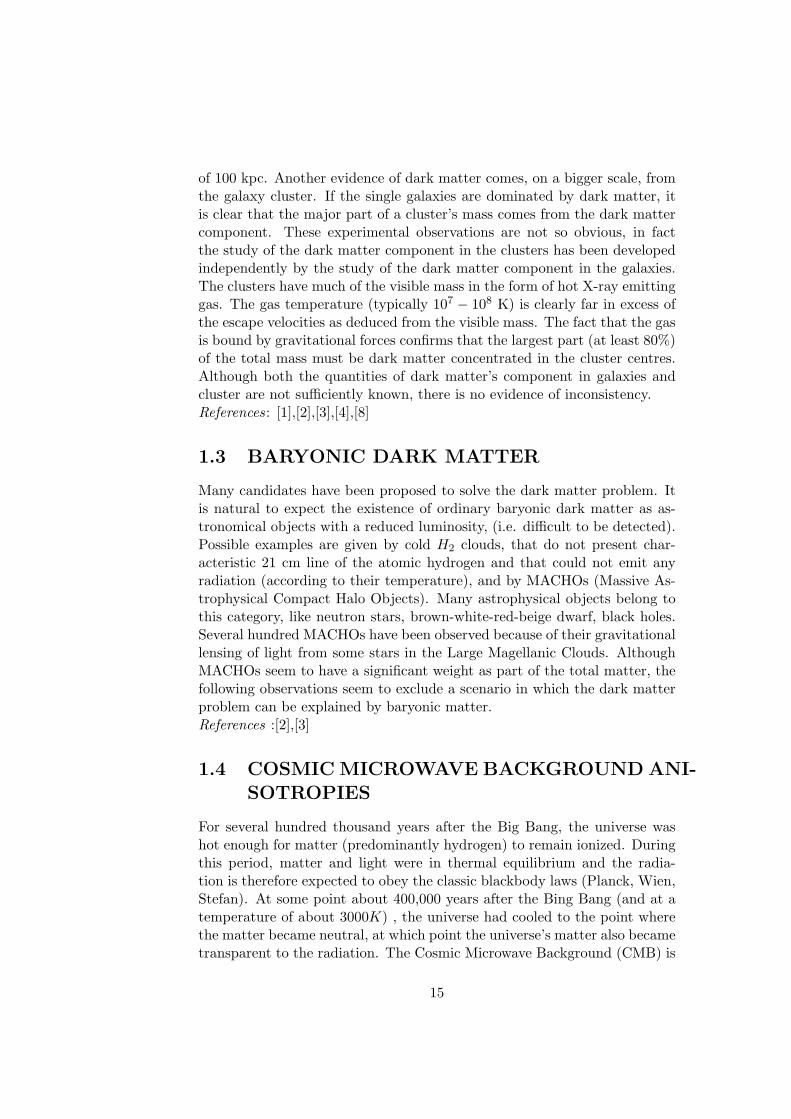
Figure 1.3: CMB spectrum as measured by the COBE satellite.
a millimetre wavelength radiation which fills the space everywhere and it islike a picture of that primordial Universe. Discovered in 1964 by Penzias andWilson, the CMB is a perfect blackbody spectrum peaked at a temperatureof 2.73K (fig. 1.3). As space expands, wavelength expands according to thesame factor, so the very low temperature CMB has today is a consequenceof the expansion of the Universe. According to Wien’s blackbody law, thewavelength peak of the CMB spectrum is inversely proportional to the tem-perature of the CMB, therefore the fall in the CMB temperature by a factorof 103 indicates an expansion of the universe by same order of magnitudefrom the moment of decoupling until now. The CMB should be essentiallyisotropic, but not exactly isotropic: careful measurements of the CMB, madefor the first time in 1992 by the COBE satellite, reveal tiny anisotropies, i.e.departures form perfect homogeneity and isotropy. The anisotropies exist-ing at the moment of decoupling, representing random noise during the veryearly universe, were amplified by inflation to cosmic-sized scales in such away that they can account for the large-scale structures formed under theinfluence of gravity: it is generally assumed that the abundance of structuresseen in the Universe today (galaxies, clusters of galaxies, superclusters...etc)evolved under gravitational interactions from small primordial density inho-mogeneities. Since the anisotropies are so tiny, linear perturbation theorywithin general relativity suffices to treat them. Therefore, from the theo-retical point of view, the statistical properties of CMB anisotropies are wellunderstood. The usual way to present them is a curve called the CMB power
16
Figure 1.4: In these fig the entire sky is represented by a Mercator projec-tion (the same technique often employed to portray the entire Earth). Thegalactic equator or plane (latitude 0) is a line running through the middleof the sky pictures. Only reaching a resolution ∆T
T ∼ 10−5 it is possible todiscover the true anisotropies pattern (See text for details).
spectrum by spherical-harmonic multipole moments (fig. 1.5),
∆T (θ, φ)T
=∑
l,m
al,mYl,m(θ, φ) (1.2)
The multipole moments have zero mean ( < alm >= 0), and if the under-lying density fluctuations are described by a gaussian random process, asinflation predicts, the angular power spectrum, Cl =< |al,m|2 >, containsall possible information (the angled brackets indicate the average over allobservers in the Universe; the absence of a preferred direction in the Uni-verse implies that C is independent of m). Temperature differences betweenpoints on the sky separated by angle θ are related to those multipoles withspherical-harmonic indices around l ∼= 1000
θ . The rms fractional temperaturefluctuation for a given angular separation is then
(∆T
T
)
θ
≈√
l(l + 1)Cl
2π(1.3)
Temperature fluctuations in the CMB arise due to the variations in thematter density. After last-scattering CMB photons stream freely to usand the temperature fluctuations are seen as CMB temperature differences(anisotropy) across the sky. The power spectrum depends on the value of
17
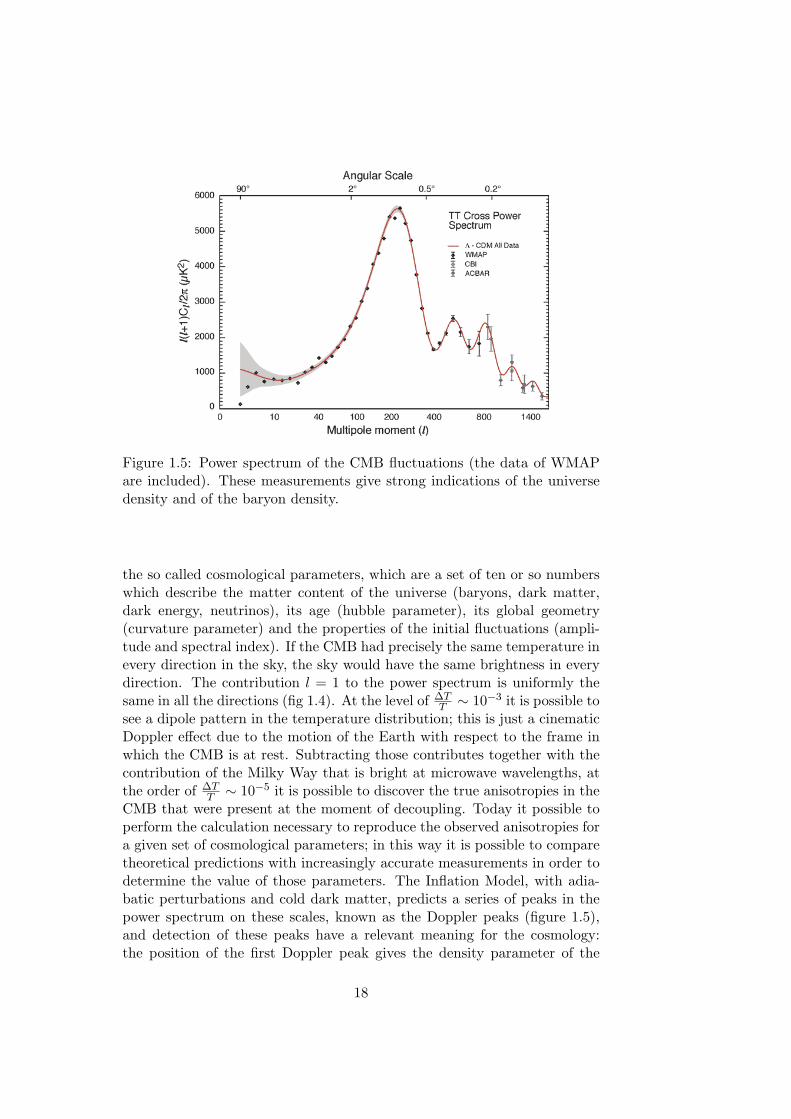
Figure 1.5: Power spectrum of the CMB fluctuations (the data of WMAPare included). These measurements give strong indications of the universedensity and of the baryon density.
the so called cosmological parameters, which are a set of ten or so numberswhich describe the matter content of the universe (baryons, dark matter,dark energy, neutrinos), its age (hubble parameter), its global geometry(curvature parameter) and the properties of the initial fluctuations (ampli-tude and spectral index). If the CMB had precisely the same temperature inevery direction in the sky, the sky would have the same brightness in everydirection. The contribution l = 1 to the power spectrum is uniformly thesame in all the directions (fig 1.4). At the level of ∆T
T ∼ 10−3 it is possible tosee a dipole pattern in the temperature distribution; this is just a cinematicDoppler effect due to the motion of the Earth with respect to the frame inwhich the CMB is at rest. Subtracting those contributes together with thecontribution of the Milky Way that is bright at microwave wavelengths, atthe order of ∆T
T ∼ 10−5 it is possible to discover the true anisotropies in theCMB that were present at the moment of decoupling. Today it possible toperform the calculation necessary to reproduce the observed anisotropies fora given set of cosmological parameters; in this way it is possible to comparetheoretical predictions with increasingly accurate measurements in order todetermine the value of those parameters. The Inflation Model, with adia-batic perturbations and cold dark matter, predicts a series of peaks in thepower spectrum on these scales, known as the Doppler peaks (figure 1.5),and detection of these peaks have a relevant meaning for the cosmology:the position of the first Doppler peak gives the density parameter of the
18
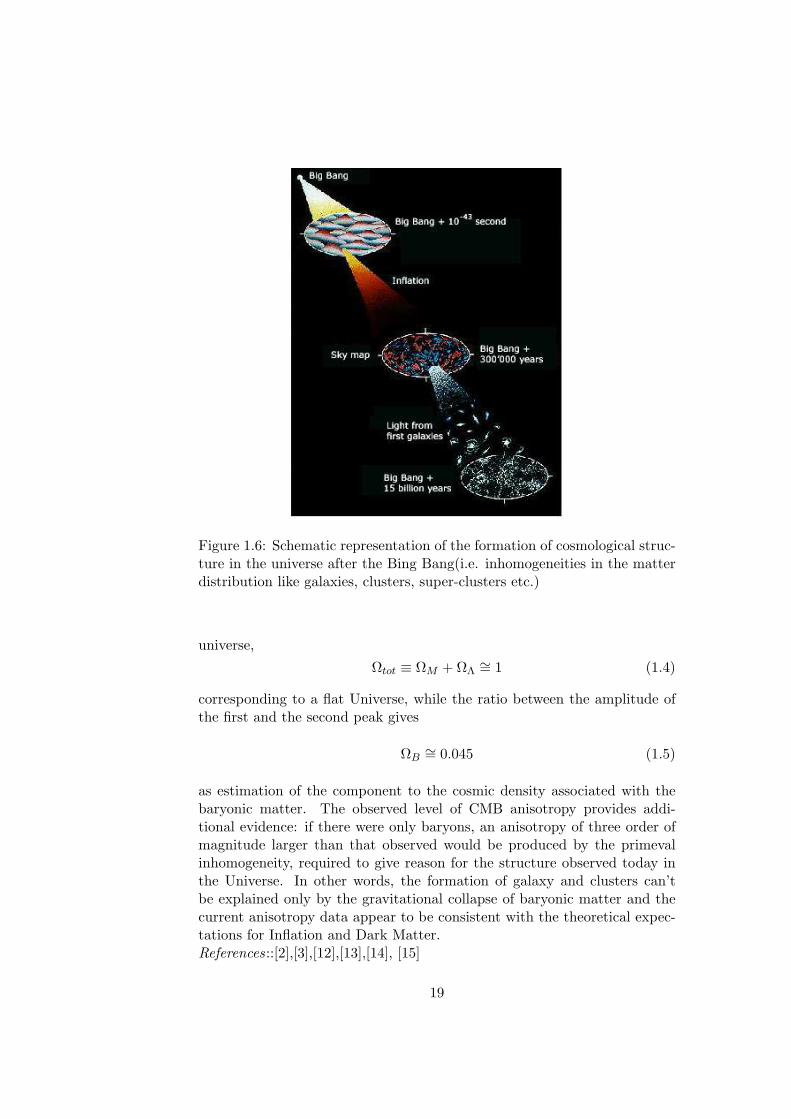
Figure 1.6: Schematic representation of the formation of cosmological struc-ture in the universe after the Bing Bang(i.e. inhomogeneities in the matterdistribution like galaxies, clusters, super-clusters etc.)
universe,
Ωtot ≡ ΩM + ΩΛ∼= 1 (1.4)
corresponding to a flat Universe, while the ratio between the amplitude ofthe first and the second peak gives
ΩB∼= 0.045 (1.5)
as estimation of the component to the cosmic density associated with thebaryonic matter. The observed level of CMB anisotropy provides addi-tional evidence: if there were only baryons, an anisotropy of three order ofmagnitude larger than that observed would be produced by the primevalinhomogeneity, required to give reason for the structure observed today inthe Universe. In other words, the formation of galaxy and clusters can’tbe explained only by the gravitational collapse of baryonic matter and thecurrent anisotropy data appear to be consistent with the theoretical expec-tations for Inflation and Dark Matter.References::[2],[3],[12],[13],[14], [15]
19
1.5 COMPOSITION OF THE UNIVERSE
As said before, from the measurement of the CMB’s anisotropies it is pos-sible to understand the composition of universe at the moment of decou-pling. From the measurement of the position of first acoustic peak manyexperiments (BOOMERANG, WMAP, MAXIMA) obtained a result consis-tent with tot Ωtot = 1 corresponding to a flat universe and from the ratiobetween the amplitude of the first and second peak it has been possibleto estimate the component to the cosmic density associated with baryonicmatter. Primordial nucleosynthesis is one of the three pillars supporting theBig-Bang model for the origin of the Universe. According to the theory,the extremely high temperatures that existed during the earliest momentsof the Universe was too hot for nuclei to exist. At very high temperatures,(above a few MeV) nuclei do not exist because the average particle energyis above the nuclear binding energy. At around 1 s the temperature of theUniverse cooled to 1010K, and it was possible to have the synthesis of thelight elements D, 3He, 4He, and 7Li. In the scenario of standard Big-Bangnucleosynthesis BBN, the primordial abundances of four light isotopes (D,3He, 4He, and 7Li) depend only on the baryon-to-photon ratio. Over thepast 25 years the big-bang origin of D, He and Li has been established,not only testing models, but also enabling an accurate determination of theaverage density of baryons in the Universe. First, it was shown that thereis no plausible astrophysical way for the production of deuterium due to itsfragility, post big-bang processes only destroy it (nevertheless it is difficultto observe, because, in addition to its low abundance, its emission lines arevery close to those of H, separated only by a small isotopic shift due tothe different reduced mass of the atom). Thus, the presently observed deu-terium abundance serves as a lower limit to the big-bang production. Thisargument, together with the strong dependence of big-bang deuterium pro-duction on the baryon density, led to the realization that D is an excellent”baryometer”, and early measurements of the deuterium abundance, a fewparts in 105 relative to hydrogen, established that baryons could not con-tribute more than about 20% of closure density. The baryonic componentfound ΩB
∼= 0.04− 0.05 is in good agreement with CMB measurement andwith the local measurement concerning the ratio between dark matter andbaryonic matter in the galaxy and in the cluster. Using the astrophysicalobservations it is possible to estimate both the quantities of bright and darkmatter in the Universe. Using the models on the stars’ evolution in thegalaxies with the known distribution of the light in many types of galaxies,it is possible to evaluate the contribution Ωl of brightening matter and ΩDM
of dark matter to the cosmic density parameter. The most recent value are
Ωl∼= 0.005 ΩDM
∼= 0.20− 0.30
20
From the previous cosmological considerations about the nucleosynthesis ofthe light elements in the universe and in the analysis on the anisotropy ofCMB it is possible to evaluate the contribution ΩB of the baryon to thecosmic density parameter. The resulting value in both the cases is
ΩB∼= 0.045
From these results (and from the previous result about a flat universe withΩtot
∼= 1 )it is possible to get many important conclusions:
• most of the baryonic matter (about 90%) is non-luminous
• the baryons account only for a small fraction of the total matter
• the matter is not the main contribution to the cosmic density
Moreover, the contribution ΩCMB due to CMB radiation is well known(≈ 5× 10⁻⁵), and it is negligible if compared with the other contributions.Anyway it is possible to suppose the existence of non-baryonic dark matterspread in the cosmic space that would produce another contribution ΩDM ′
to the total galaxies matter ΩDM , in such way to have a total density con-tribution ΩDM + ΩDM ′ . It is possible to rule out this scenario studyingthe expansion of the Universe through the use of so-called standard candles,i.e. astronomical objects with uniform peak luminosities (the supernovae Iabelong to this category), so that it is possible to see them at cosmic dis-tances and to determine their distance well. Measurement of the cosmicparameters ΩΛ and ΩM through the redshift-distance relation depends oncomparing the apparent magnitudes of low-redshift SN Ia with those of theirhigh-redshift cousins. It appears that the expansion rate is accelerating, in-dicating the existence of Dark Energy with negative pressure, and givinganother density factor ΩΛ. The best-fit results can be approximated by thelinear combination
ΩΛ = 1.33ΩM + 0.33 (1.6)
These values are in excellent agreement with the results discussed aboveand it is possible to suppose a consistent scenario in which
ΩΛ∼= 0.71 ΩM
∼= 0.29
In particular, all flat model with ΩM = 1 models are ruled out at the 8σlevel, so it is no more necessary to suppose the existence of matter spreadin the intergalactic space, and we can assume that all the matter (baryonicand non-baryionic) is related to the galaxies. Although the scenario aboutthe composition of the universe seems to be consistent and well-proved byseveral independent observations, many questions have no answer yet. Inparticular the constraint that we have on the baryon density is importantbecause it is very model-independent, and the large discrepancy between
21
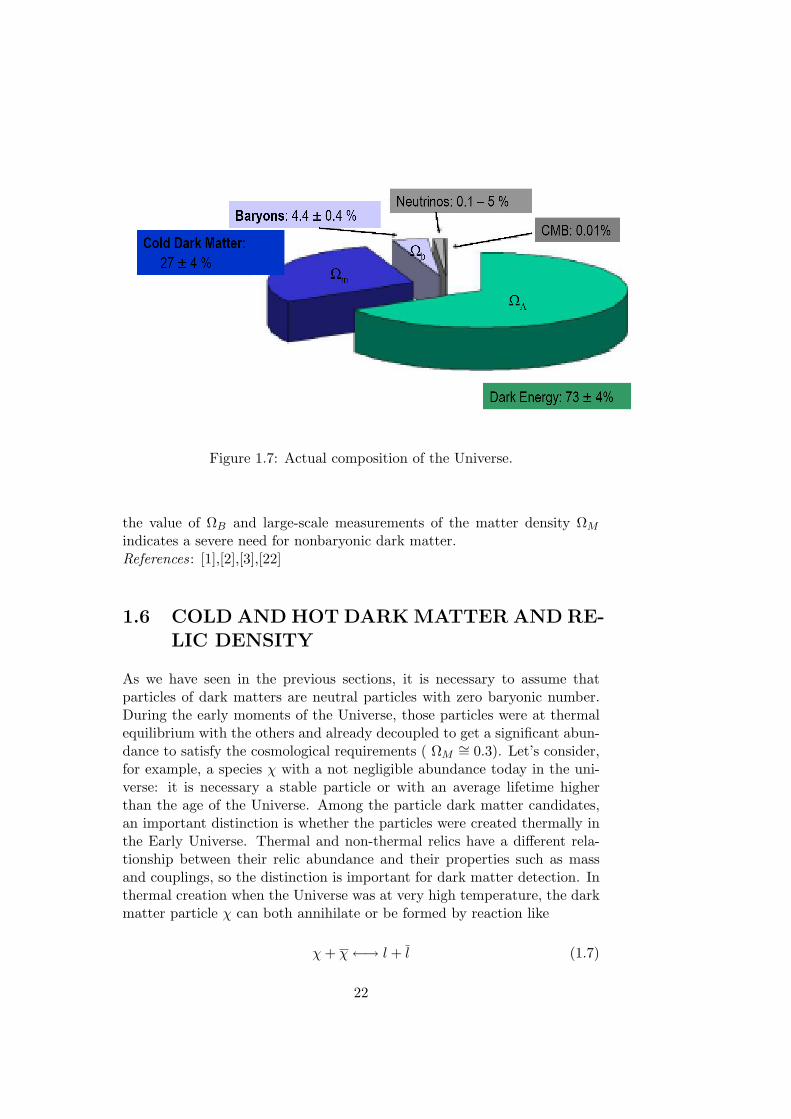
Figure 1.7: Actual composition of the Universe.
the value of ΩB and large-scale measurements of the matter density ΩM
indicates a severe need for nonbaryonic dark matter.References: [1],[2],[3],[22]
1.6 COLD AND HOT DARK MATTER AND RE-LIC DENSITY
As we have seen in the previous sections, it is necessary to assume thatparticles of dark matters are neutral particles with zero baryonic number.During the early moments of the Universe, those particles were at thermalequilibrium with the others and already decoupled to get a significant abun-dance to satisfy the cosmological requirements ( ΩM
∼= 0.3). Let’s consider,for example, a species χ with a not negligible abundance today in the uni-verse: it is necessary a stable particle or with an average lifetime higherthan the age of the Universe. Among the particle dark matter candidates,an important distinction is whether the particles were created thermally inthe Early Universe. Thermal and non-thermal relics have a different rela-tionship between their relic abundance and their properties such as massand couplings, so the distinction is important for dark matter detection. Inthermal creation when the Universe was at very high temperature, the darkmatter particle χ can both annihilate or be formed by reaction like
χ + χ ←→ l + l (1.7)
22
where l is a generic particle. At the equilibrium the number of particle is
n(t) =g
(2π)3
∫f(p, t)d3p (1.8)
where g is the number of the internal degrees of freedom of χ and
f(p, t) = 1
e(E−µ)
T±1
are the function of Fermi-Dirca (+) and Bose-Einstein(-), and µ is the chem-ical potential. At high temperature ( T >> mχ ) the particle χ acts as arelativistic particle E2 = m2 + p2 and assuming that T >> µ it is possibleto rewrite (E − µ)/T ∼= P/T , obtaining
n =g
(2π)3
∫ ∞
0
p2
ep/T± 1 ∝ g
(2π)3T 3 (1.9)
that gives the decreasing like T 3 of the number of particles, thus, as theUniverse cooled, the number of particles would decrease together as long asthe temperature remained higher than the mass of χ . At low temperatures(T << mχ )
n ∼= g(mχT2π )3/2exp(−mχ/T )
so that their density is Boltzmann suppressed. When the temperature finallydropped below the mχ mass, the number density of χ drop exponentiallytogether with the probability of a particle to find another to annihilate.The Wimp number density would “freeze-out” at this point and we wouldbe left with a substantial number of particles today. The evolution of thenumber density of the particles over time is given in detail by the Boltzmannequation
dnχ
dt+ 3Hnχ = − < σAv > (n2
χ − (neqχ )2) (1.10)
where χ denotes the particle, H is the Hubble constant, nχis the number-density and neq
χ is the number-density in thermal equilibrium, so the term3Hnχ gives the expansion of the Universe. It is possible to rewrite theBoltzmann equation in a more suitable form using the variables
t → x ≡ mT
and the co-moving number-density instead of number-density
nχ → Y ≡ nχ
s
where s is the entropy density. The parameter s scales inversely with thevolume of the Universe when the entropy is conserved. Defining the totalannihilation rate ΓA ≡ neq
χ < σA|v > hence the Botlzmann equation becomes
x
Y eqχ
dY χ
dx= −ΓA
H
[(Yχ
Y eqχ
)2
− 1
](1.11)
23
from which it is evident that the process is dominated by the relationshipΓAH , which compares the annihilation rate with the expansion rate. Beforefreeze out, when the annihilation rate is large compared to the expansionrate, Y follows its equilibrium value. After freeze-out, Y became constantdepending on the annihilation cross section. The larger the cross section, thelonger Y follows its exponentially falling value at equilibrium so that the relicdensity assumes lower values. The relic density is inversely proportional to< σAv > This is illustrated in fig. (1.8) which shows the variation of the relicdensity with the annihilation cross section. The annihilation cross sectionthus informs us about the number density of the particle at freeze out. It ispossible now to introduce a distinction between relativistic species and thenon relativistic ones. Starting from
nχ =g
2π2
∫ ∞
mχ
(E2 −m2χ)1/2
eE/T ± 1EdE (1.12)
which describes the numerical density at a temperature T of a speciesof particles with mass mχ , g internal freedom degrees and zero chemicalpotential can be approximated in different ways, following or not the rel-ativistic condition Tc >> mχ . Dark matter candidates may be classifiedas ’hot’ or ’cold’ based on their energy at the time they de-coupled fromthe rest of the Universe. If they had been moving at relativistic speeds atthat time, they are known as hot. The observations on the present Uni-verse suggest a dark matter being predominantly cold. This is necessarybecause tiny fluctuations in the matter-density of the very early Universehave evolved into the large scale structure we see today. Anisotropies in thecosmic microwave background radiation, created by the fluctuations in thebaryonic matter density, are not enough to create the distribution of matterof the present Universe. Hot dark matter would not be able to assemble intothe large scale structure we see today, unless it would have been cold andnon relativistic. Only this solution allows the present day structure of theuniverse without affecting the amplitude of the anisotropies seen in the tem-perature of the CMB radiation. This suggests that dark matter is mainlycold. It is not possible to solve exactly Boltzmann equation but it possibleonly to get numerical solutions. The main aspect we want to evidence isthat if ΓA and H have a dependence from the temperature, called Tf thedecoupling temperature, the decoupling condition is given by
Γ(Tf ) = H(Tf ) (1.13)
(or Hnχ =< σv > nχ2) which implies that the expansion and the anni-hilation rates are equal. As the temperature at freeze-out is less than therest-mass energy of the particle, this implies that χ fell out of equilibriumafter becoming non-relativistic. For such cold relics, the relic abundance
24
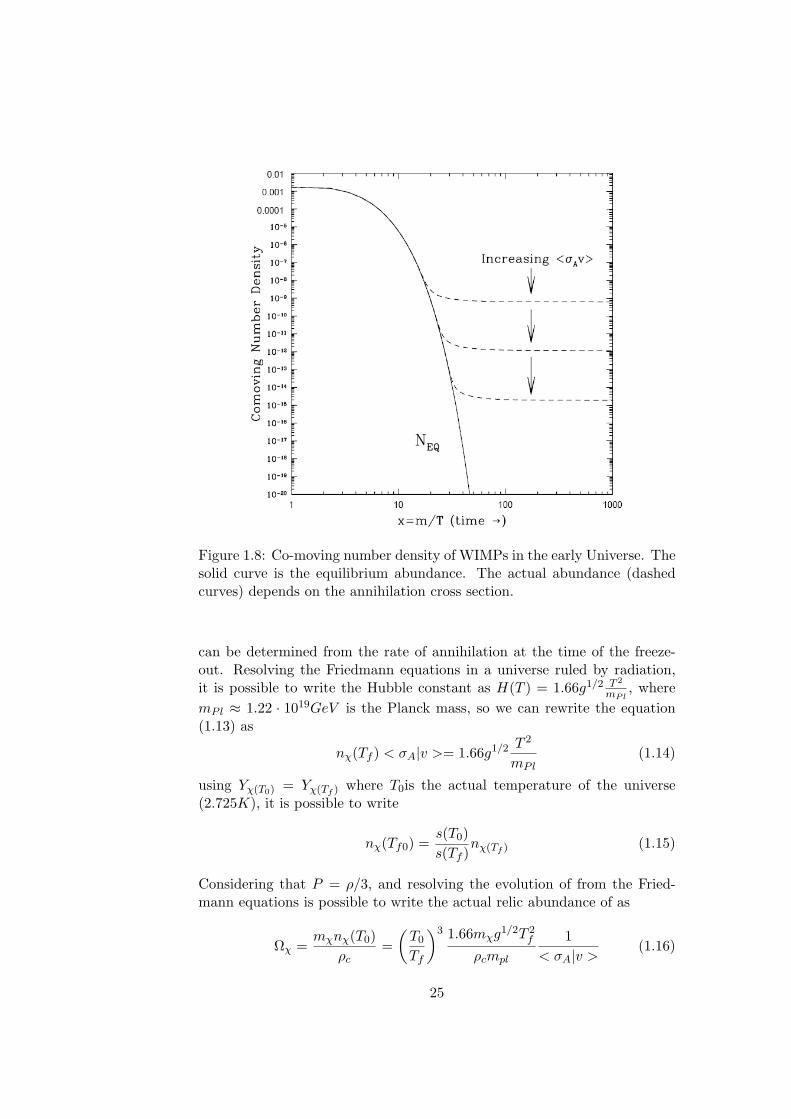
Figure 1.8: Co-moving number density of WIMPs in the early Universe. Thesolid curve is the equilibrium abundance. The actual abundance (dashedcurves) depends on the annihilation cross section.
can be determined from the rate of annihilation at the time of the freeze-out. Resolving the Friedmann equations in a universe ruled by radiation,it is possible to write the Hubble constant as H(T ) = 1.66g1/2 T 2
mPl, where
mPl ≈ 1.22 · 1019GeV is the Planck mass, so we can rewrite the equation(1.13) as
nχ(Tf ) < σA|v >= 1.66g1/2 T 2
mPl(1.14)
using Yχ(T0) = Yχ(Tf ) where T0is the actual temperature of the universe(2.725K), it is possible to write
nχ(Tf0) =s(T0)s(Tf )
nχ(Tf ) (1.15)
Considering that P = ρ/3, and resolving the evolution of from the Fried-mann equations is possible to write the actual relic abundance of as
Ωχ =mχnχ(T0)
ρc=
(T0
Tf
)3 1.66mχg1/2T 2f
ρcmpl
1< σA|v >
(1.16)
25
in which the density ρχ just the product of the mass mχ m and the densitynumber. We are now interested in a cold particle such as a massive particlethat was non relativistic at the equilibrium. In this way assuming thatthe decoupling temperature is one order of magnitude less then the massTf ∼ 10−1mχ it is possible to rewrite the equation (1.16) as
Ωχ = 1.66g1/2 T 30
ρcmPl < σA|v >(1.17)
Thus assuming
T0 = 2.35 · 10−4eVρc = 1.05 · 104h2eV · cm−3
mPl = 1.22 · 1028eVg1/2 ∼ 1
it is possible to write
Ωχh2 =mχnχ
ρc' 3 · 10−27cm3s−1
< σav >(1.18)
If the cold dark matter in the Universe were made by a stable massiveparticle,then by Equation (1.18), its annihilation cross section is
< σav >∼ 10−27cm2s−1 (1.19)
when a typical weak interaction cross section is of the order of < σav >∼10−25cm2s−1 This suggests that a particle showing interaction strengthscharacteristic of the weak force may be a viable dark matter candidate.It must be stressed that no solution to the dark matter problem can befound in the framework of the Standard Model, although a neutrino specieswith a mass of at least 30 eV could provide the right dark-matter density.In fact the experimental limits on the neutrino mass don’t support suchvalues and the measurement done at LEP can exclude any other neutrino’sfamily with mν < 45GeV . Moreover,them from the N-body simulationsof structure formation it can be seen that a neutrino-dominated Universegives poor results in reproducing the observed structure of the Universe.It appears that some non-baryonic, non-relativistic matter is required inthe Universe, and particle physics can provide candidates: any massive andstable particle which annihilates with an electroweak scale cross section isbound to contribute to the dark matter of the Universe. It is interestingthat theories such as supersymmetry, invented for entirely different reasons,typically predict just such a particle.References::[1],[4],[11]
26
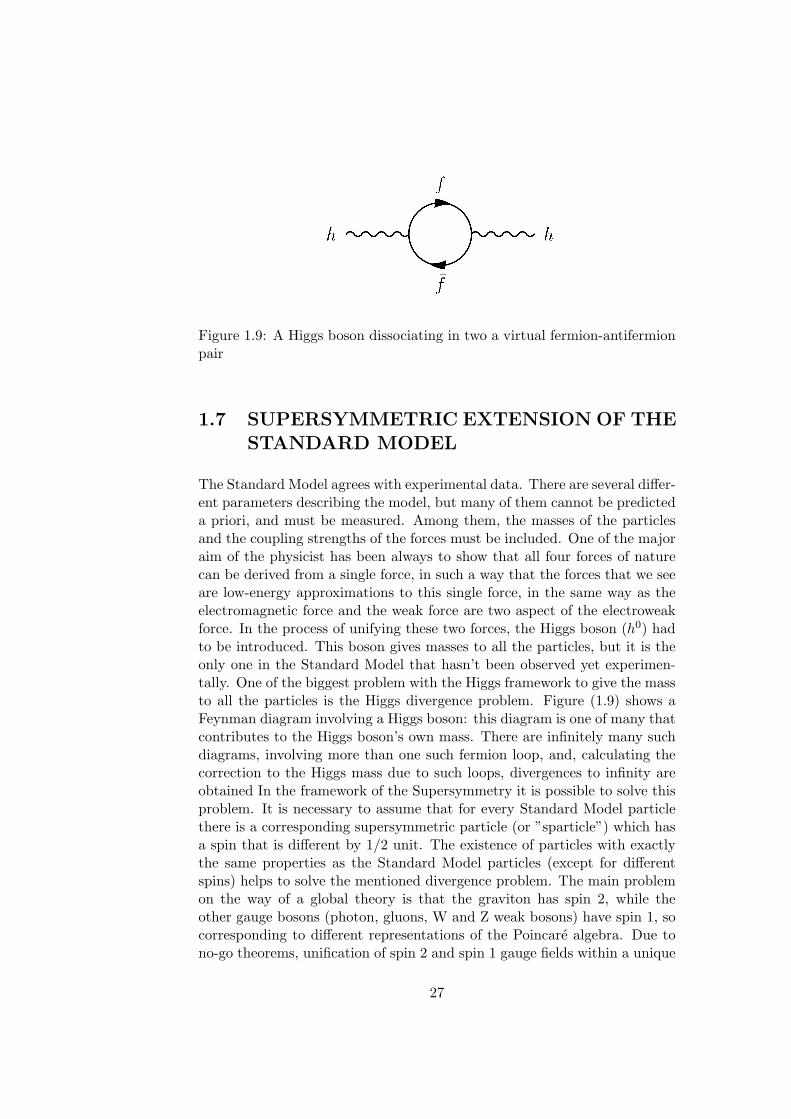
Figure 1.9: A Higgs boson dissociating in two a virtual fermion-antifermionpair
1.7 SUPERSYMMETRIC EXTENSION OF THESTANDARD MODEL
The Standard Model agrees with experimental data. There are several differ-ent parameters describing the model, but many of them cannot be predicteda priori, and must be measured. Among them, the masses of the particlesand the coupling strengths of the forces must be included. One of the majoraim of the physicist has been always to show that all four forces of naturecan be derived from a single force, in such a way that the forces that we seeare low-energy approximations to this single force, in the same way as theelectromagnetic force and the weak force are two aspect of the electroweakforce. In the process of unifying these two forces, the Higgs boson (h0) hadto be introduced. This boson gives masses to all the particles, but it is theonly one in the Standard Model that hasn’t been observed yet experimen-tally. One of the biggest problem with the Higgs framework to give the massto all the particles is the Higgs divergence problem. Figure (1.9) shows aFeynman diagram involving a Higgs boson: this diagram is one of many thatcontributes to the Higgs boson’s own mass. There are infinitely many suchdiagrams, involving more than one such fermion loop, and, calculating thecorrection to the Higgs mass due to such loops, divergences to infinity areobtained In the framework of the Supersymmetry it is possible to solve thisproblem. It is necessary to assume that for every Standard Model particlethere is a corresponding supersymmetric particle (or ”sparticle”) which hasa spin that is different by 1/2 unit. The existence of particles with exactlythe same properties as the Standard Model particles (except for differentspins) helps to solve the mentioned divergence problem. The main problemon the way of a global theory is that the graviton has spin 2, while theother gauge bosons (photon, gluons, W and Z weak bosons) have spin 1, socorresponding to different representations of the Poincare algebra. Due tono-go theorems, unification of spin 2 and spin 1 gauge fields within a unique
27
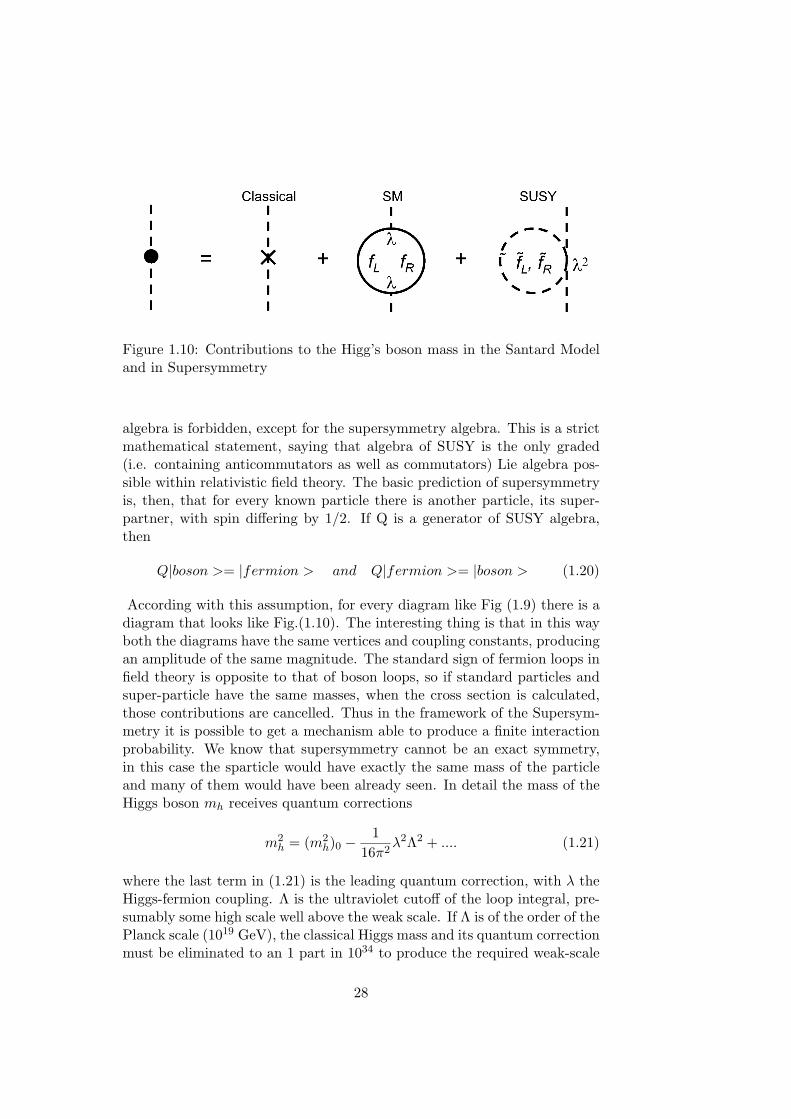
Figure 1.10: Contributions to the Higg’s boson mass in the Santard Modeland in Supersymmetry
algebra is forbidden, except for the supersymmetry algebra. This is a strictmathematical statement, saying that algebra of SUSY is the only graded(i.e. containing anticommutators as well as commutators) Lie algebra pos-sible within relativistic field theory. The basic prediction of supersymmetryis, then, that for every known particle there is another particle, its super-partner, with spin differing by 1/2. If Q is a generator of SUSY algebra,then
Q|boson >= |fermion > and Q|fermion >= |boson > (1.20)
According with this assumption, for every diagram like Fig (1.9) there is adiagram that looks like Fig.(1.10). The interesting thing is that in this wayboth the diagrams have the same vertices and coupling constants, producingan amplitude of the same magnitude. The standard sign of fermion loops infield theory is opposite to that of boson loops, so if standard particles andsuper-particle have the same masses, when the cross section is calculated,those contributions are cancelled. Thus in the framework of the Supersym-metry it is possible to get a mechanism able to produce a finite interactionprobability. We know that supersymmetry cannot be an exact symmetry,in this case the sparticle would have exactly the same mass of the particleand many of them would have been already seen. In detail the mass of theHiggs boson mh receives quantum corrections
m2h = (m2
h)0 − 116π2
λ2Λ2 + .... (1.21)
where the last term in (1.21) is the leading quantum correction, with λ theHiggs-fermion coupling. Λ is the ultraviolet cutoff of the loop integral, pre-sumably some high scale well above the weak scale. If Λ is of the order of thePlanck scale (1019 GeV), the classical Higgs mass and its quantum correctionmust be eliminated to an 1 part in 1034 to produce the required weak-scale
28
mh. This unnatural fine-tuning is the gauge hierarchy problem. In the su-persymmetric standard model, however, for every quantum correction withstandard model fermions fL and fR in the loop, there are correspondingquantum corrections with superpartners fl and fr. The physical Higgs massthen becomes
m2h = (m2
h)0− 116π2
λ2Λ2+1
16π2λ2Λ2+.... ∼= (m2
h)0+1
16π2(m2ef−m2
f )ln(Λ
m ef ))
(1.22)where the terms quadratic in Λ cancel, leaving a term logarithmic in Λ asthe leading contribution. In this case, for a large range of Λ, it is possibleto get quantum correction and it not requested an unnatural fine-tuning.In the case of exact supersymmetry, where mf = m ef , even the logarith-mically divergent term vanishes. Nevertheless, to solve the gauge hierarchyproblem, it is not needed an exact mass degeneracy, but it is necessary theidentity of the dimensionless couplings Λ of standard model particles andtheir superpartners. Moreover, not to make the logarithmically term diver-gent, superpartner masses are required to be not too different from the weakscale. It is possible to get this conditions by adding supersymmetry-breakingweak-scale masses for superpartners: if supersymmetry is broken, the spar-ticles may have much greater masses than ordinary particles. Moreover, iftheir mass is not very large, such mentioned corrections can eliminate thehierarchy problem (masses less than about 1 TeV in order to work the can-cellation of Fig. 1.10)References::[1],[16],[17],[18],[19]
1.7.1 GUT
Although it was not proposed to this aim, Supersymmetriy plays a crucialrole in the effort of the physicist to find a general theory of the interactions.The main idea of Grand Unification is that all known interactions are differ-ent branches of a unique interaction associated with a simple gauge group.So the basic assumption is that gauge symmetry increases with energy. Theunification occurs at high energy, because at low energy it is impossible,due to a big difference in the values of the couplings of strong, weak andelectromagnetic interactions. The crucial point here is the running couplingconstants, i.e. the dependence of the couplings by a distance or an energyscale
αi = αi
(Q2
Λ2
)= αi(distance), αi ≡ g2
i
4π(1.23)
This dependence, confirmed experimentally, is described by the renormal-ization group equations. In the SM the strong and weak couplings areassociated with non-Abelian gauge groups, while the electromagnetic oneis associated with the Abelian group. In this way we have the increasing
29
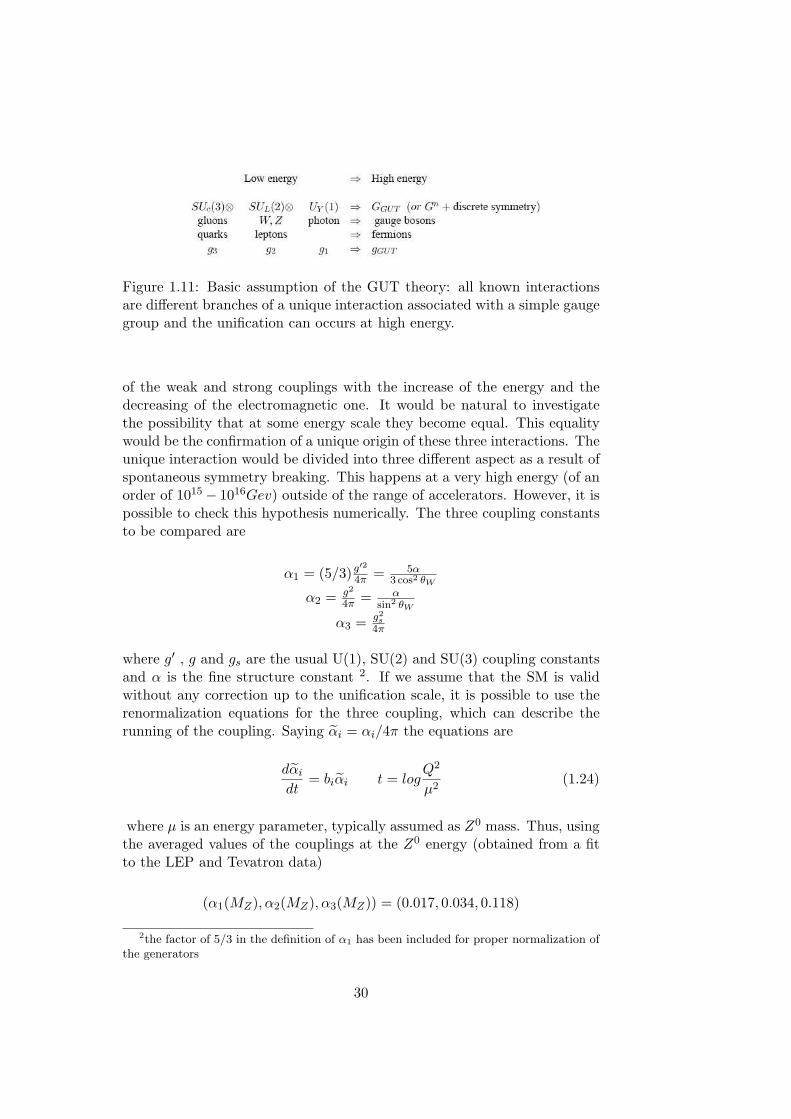
Figure 1.11: Basic assumption of the GUT theory: all known interactionsare different branches of a unique interaction associated with a simple gaugegroup and the unification can occurs at high energy.
of the weak and strong couplings with the increase of the energy and thedecreasing of the electromagnetic one. It would be natural to investigatethe possibility that at some energy scale they become equal. This equalitywould be the confirmation of a unique origin of these three interactions. Theunique interaction would be divided into three different aspect as a result ofspontaneous symmetry breaking. This happens at a very high energy (of anorder of 1015 − 1016Gev) outside of the range of accelerators. However, it ispossible to check this hypothesis numerically. The three coupling constantsto be compared are
α1 = (5/3)g′24π = 5α
3 cos2 θW
α2 = g2
4π = αsin2 θW
α3 = g2s
4π
where g′ , g and gs are the usual U(1), SU(2) and SU(3) coupling constantsand α is the fine structure constant 2. If we assume that the SM is validwithout any correction up to the unification scale, it is possible to use therenormalization equations for the three coupling, which can describe therunning of the coupling. Saying αi = αi/4π the equations are
dαi
dt= biαi t = log
Q2
µ2(1.24)
where µ is an energy parameter, typically assumed as Z0 mass. Thus, usingthe averaged values of the couplings at the Z0 energy (obtained from a fitto the LEP and Tevatron data)
(α1(MZ), α2(MZ), α3(MZ)) = (0.017, 0.034, 0.118)
2the factor of 5/3 in the definition of α1 has been included for proper normalization ofthe generators
30
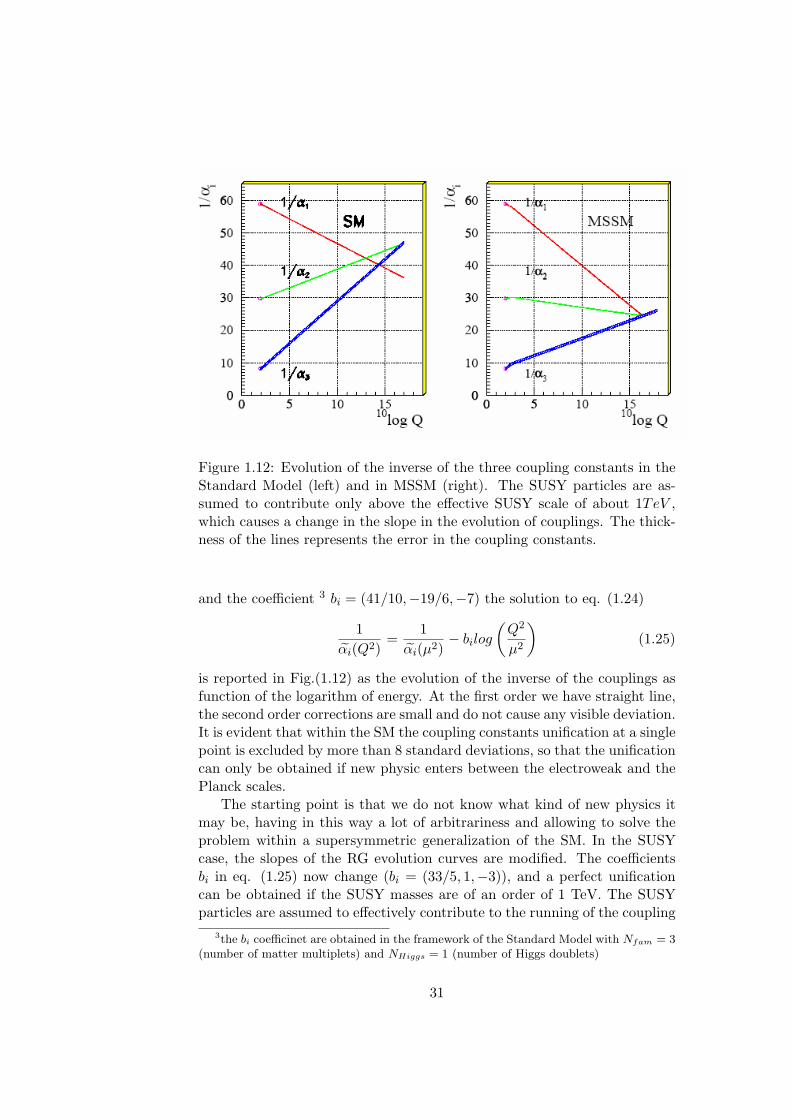
Figure 1.12: Evolution of the inverse of the three coupling constants in theStandard Model (left) and in MSSM (right). The SUSY particles are as-sumed to contribute only above the effective SUSY scale of about 1TeV ,which causes a change in the slope in the evolution of couplings. The thick-ness of the lines represents the error in the coupling constants.
and the coefficient 3 bi = (41/10,−19/6,−7) the solution to eq. (1.24)
1αi(Q2)
=1
αi(µ2)− bilog
(Q2
µ2
)(1.25)
is reported in Fig.(1.12) as the evolution of the inverse of the couplings asfunction of the logarithm of energy. At the first order we have straight line,the second order corrections are small and do not cause any visible deviation.It is evident that within the SM the coupling constants unification at a singlepoint is excluded by more than 8 standard deviations, so that the unificationcan only be obtained if new physic enters between the electroweak and thePlanck scales.
The starting point is that we do not know what kind of new physics itmay be, having in this way a lot of arbitrariness and allowing to solve theproblem within a supersymmetric generalization of the SM. In the SUSYcase, the slopes of the RG evolution curves are modified. The coefficientsbi in eq. (1.25) now change (bi = (33/5, 1,−3)), and a perfect unificationcan be obtained if the SUSY masses are of an order of 1 TeV. The SUSYparticles are assumed to effectively contribute to the running of the coupling
3the bi coefficinet are obtained in the framework of the Standard Model with Nfam = 3(number of matter multiplets) and NHiggs = 1 (number of Higgs doublets)
31
constants only for energies above the typical SUSY mass scale. At energiesabove 1TeV we have a change in the slope of the lines. Requiring unificationit is possible to find the break point MSUSY and the unification point MGUT
MSUSY = 103.4±0.9±0.4GeVMGUT = 1015.8±0.3±0.1GeVα−1
SUSY = 26.3± 1.9± 1.0
where the first error originates from the uncertainty in the coupling con-stants, while the second one is due to the uncertainty in the mass splittingsbetween the SUSY particles. The importance of this observation lies in thefact that MSUSY should be in the range preferred by the fine-tuning ar-guments. It should be noted that introducing new particles and three freeparameters (MSUSY, MGUT and GUT) all three curves are simultaneouslyinfluenced, due to the strong correlations between the slopes and the factthat it is possible to get the unification of the three curves at a single pointis an important evidence.References:[17],[18],[19],[20],[21]
1.7.2 SUPERPARTICLES
It could be shown that no particle of the standard model is the superpartnerof another. Once supersymmetry is broken, the theory predicts new parti-cles not discovered yet, with a different range of mass. The gauge hierarchyproblem gives a strong motivation for this scale to be the weak scale. In thestandard model there are already 18 experimentally accessible parameters(6 quark masses, 3 lepton masses, 4 parameters in the Cabibbo-Kobayashi-Maskawa matrix, 3 gauge couplings, the W-boson mass, and Higgsbosonmass). In supersymmetry, there is a fermionic degree of freedom for everybosonic degree of freedom and vice versa, so the particle spectrum is greatlyextended and there are many new parameters. Even in the minimal super-symmetryc exstension of the standard model MSSM, the minimum numberof parameters is 63. It is easy to understand that for each ”normal” degreeof freedom, there is a supersymmetric degree of freedom. For example stan-dard quarks have spin 1/2, while squarks are scalars, therefore, there are twosquarks (left and right) for each quark. Supersymmetric particles that areelectrically neutral, and so promising as dark matter candidates, are shownwith their standard model partners in fig.(1.13). The superpartener spec-trum of the standard spectrum is easy to represent. The only remarkabledetail is that in supersymmetric models, two Higgs doublets are requiredto give mass to all fermions. The spectrum consists of spin 0 sneutrinos,one for each neutrino, the spin 3/2 gravitino, and the spin 1/2 Bino, neu-tral Wino, and down- and up-type Higgsinos. In the top row of fig.(1.13)the mass parameters (M1,M2, µ,mν and m3/2) that determine the massesof the gauge eigenstates are reported. These parameters are of the order
32
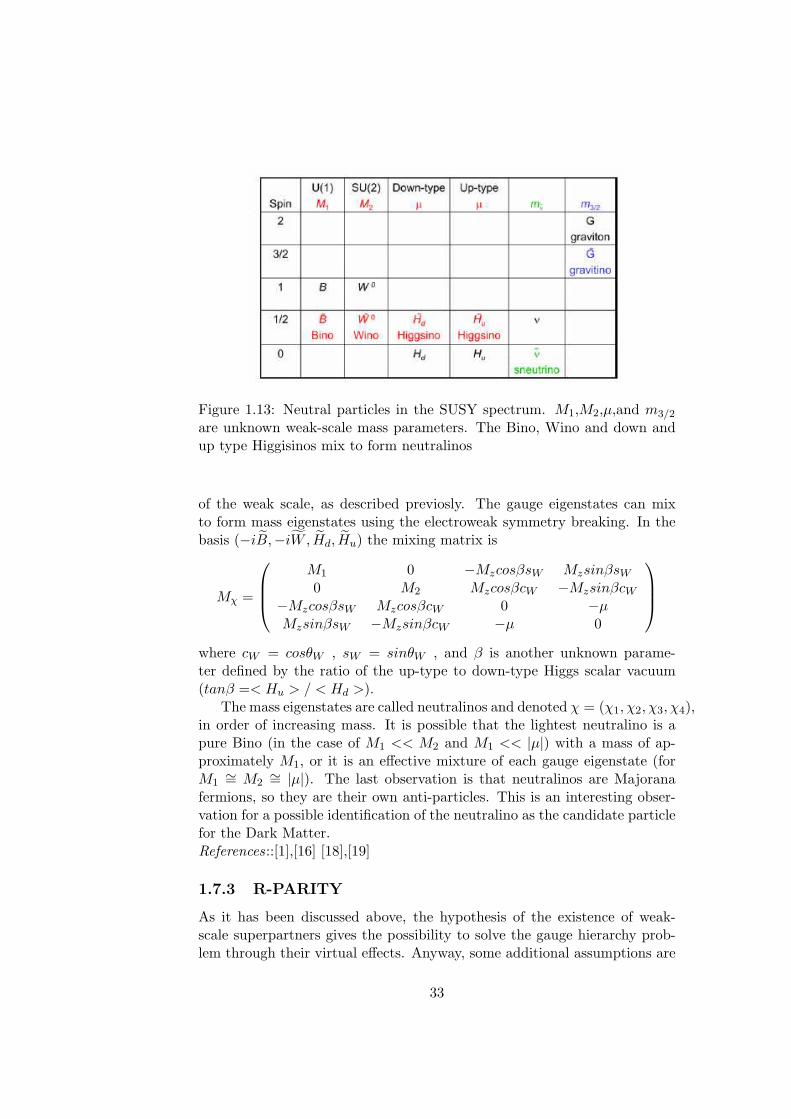
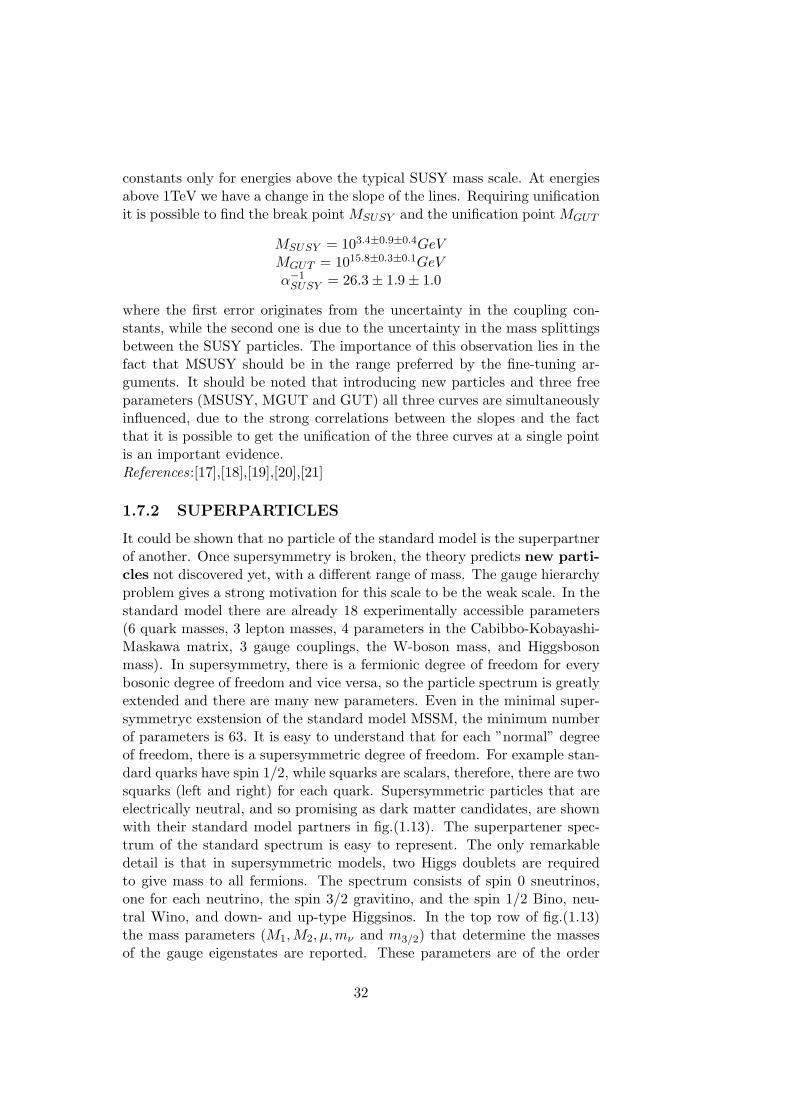
Figure 1.13: Neutral particles in the SUSY spectrum. M1,M2,µ,and m3/2
are unknown weak-scale mass parameters. The Bino, Wino and down andup type Higgisinos mix to form neutralinos
of the weak scale, as described previosly. The gauge eigenstates can mixto form mass eigenstates using the electroweak symmetry breaking. In thebasis (−iB,−iW , Hd, Hu) the mixing matrix is
Mχ =
M1 0 −MzcosβsW MzsinβsW
0 M2 MzcosβcW −MzsinβcW
−MzcosβsW MzcosβcW 0 −µMzsinβsW −MzsinβcW −µ 0
where cW = cosθW , sW = sinθW , and β is another unknown parame-ter defined by the ratio of the up-type to down-type Higgs scalar vacuum(tanβ =< Hu > / < Hd >).
The mass eigenstates are called neutralinos and denoted χ = (χ1, χ2, χ3, χ4),in order of increasing mass. It is possible that the lightest neutralino is apure Bino (in the case of M1 << M2 and M1 << |µ|) with a mass of ap-proximately M1, or it is an effective mixture of each gauge eigenstate (forM1
∼= M2∼= |µ|). The last observation is that neutralinos are Majorana
fermions, so they are their own anti-particles. This is an interesting obser-vation for a possible identification of the neutralino as the candidate particlefor the Dark Matter.References::[1],[16] [18],[19]
1.7.3 R-PARITY
As it has been discussed above, the hypothesis of the existence of weak-scale superpartners gives the possibility to solve the gauge hierarchy prob-lem through their virtual effects. Anyway, some additional assumptions are
33
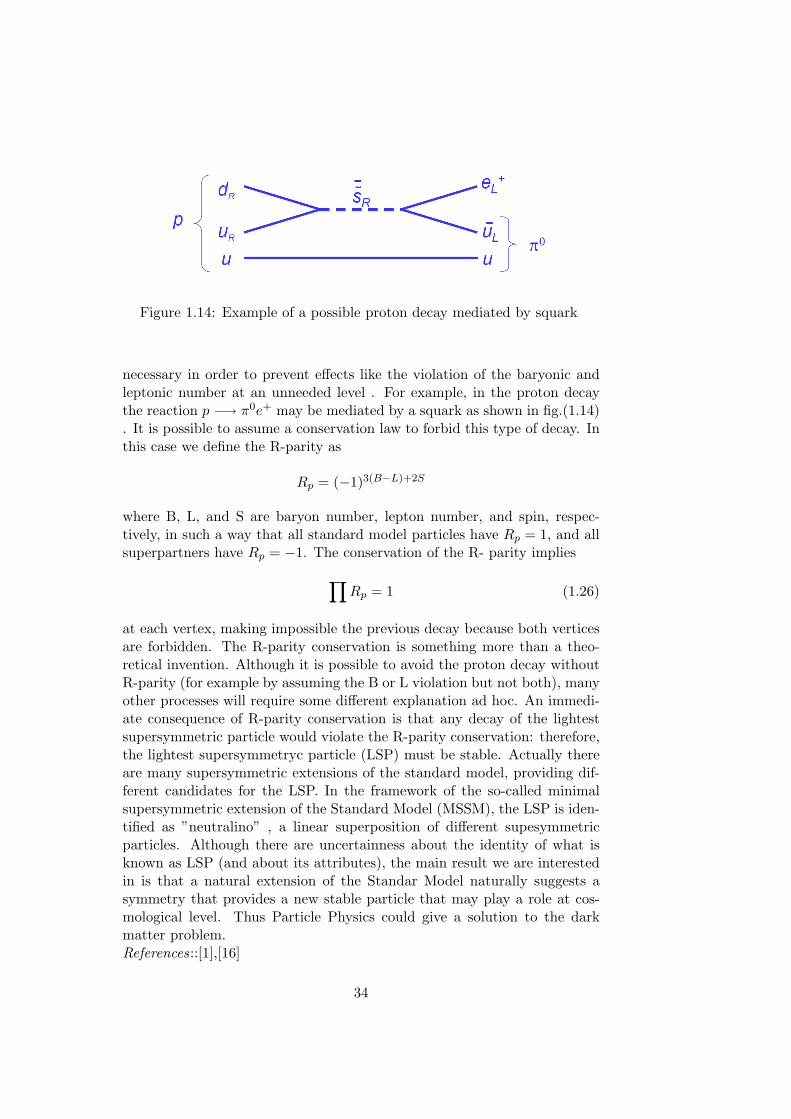
Figure 1.14: Example of a possible proton decay mediated by squark
necessary in order to prevent effects like the violation of the baryonic andleptonic number at an unneeded level . For example, in the proton decaythe reaction p −→ π0e+ may be mediated by a squark as shown in fig.(1.14). It is possible to assume a conservation law to forbid this type of decay. Inthis case we define the R-parity as
Rp = (−1)3(B−L)+2S
where B, L, and S are baryon number, lepton number, and spin, respec-tively, in such a way that all standard model particles have Rp = 1, and allsuperpartners have Rp = −1. The conservation of the R- parity implies
∏Rp = 1 (1.26)
at each vertex, making impossible the previous decay because both verticesare forbidden. The R-parity conservation is something more than a theo-retical invention. Although it is possible to avoid the proton decay withoutR-parity (for example by assuming the B or L violation but not both), manyother processes will require some different explanation ad hoc. An immedi-ate consequence of R-parity conservation is that any decay of the lightestsupersymmetric particle would violate the R-parity conservation: therefore,the lightest supersymmetryc particle (LSP) must be stable. Actually thereare many supersymmetric extensions of the standard model, providing dif-ferent candidates for the LSP. In the framework of the so-called minimalsupersymmetric extension of the Standard Model (MSSM), the LSP is iden-tified as ”neutralino” , a linear superposition of different supesymmetricparticles. Although there are uncertainness about the identity of what isknown as LSP (and about its attributes), the main result we are interestedin is that a natural extension of the Standar Model naturally suggests asymmetry that provides a new stable particle that may play a role at cos-mological level. Thus Particle Physics could give a solution to the darkmatter problem.References::[1],[16]
34
1.8 THE GALACTIC DARK HALO
Due to the fact that the Earth is moving in the Milky Way with the Sun, at adistance of r0
∼= 8.5kpc from the Sun to the Galactic centre, the knowledge ofthe Milky Way’s dark halo has great importance for Dark Matter searches.The halo model, the local dark-matter density ρ0 = ρ(r0) and the meandispersion speed v =< v2 >1/2 play a crucial role in both direct and indirectDark Matter detection methods. The most important information aboutthe local halo density can be given by the rotation curve that is related tothe total gravitational potential and so includes contributions from all thematter. The visible structure of spiral galaxies is dominated by a luminousdisk of stars exponential in radius ( I(r) = I0exp(−r/rd)), where the diskradius rd defines the scale of the disk (rd ≈ rott/3). Spiral galaxies can alsohave a bulge-like component at the center (size of order 1kpc or less), but itscontribution to the gravitational potential is typically negligible beyond theluminous regions. The experimental observations suggest that dark matterdominates at large radii, but possesses flat core profiles so that dark andluminous matter give similar contributions inside the luminous regions. Forexample, considering the contribution of the stellar disk and dark halo (themost important mass components of the Galaxy), the total rotation speedis,
vtot = [v2d(r) + v2
h(r)]1/2
where vd is the disk contribution, vh is the halo contribution, and r is thedistance to the centre of the Galaxy in the plane of the disk. Assuminga phenomenological form of halo’s mass density distribution and using freeparameters (α, β, γ), it is possible to write a general density behavior like
ρ(r) ∝ ρ0
(r/a)γ [1+(r/a)α][β−α]/α
where a is a parameter related to the core radius of the halo. As a functionof (α, β, γ) this family of curves can define many possible shapes able toreproduce the observed rotation curves of most galaxies over a large rangeof radii (with quite different behaviors at very small or very large radii). Ageneral and commonly used model for the halo is the cored spherical isother-mal halo (α, β, γ) = (2, 2, 0) given assuming a system of particles of mass minteracting gravitationally at thermal equilibrium with a temperature T. Itis possible to write the cored spherical isothermal halo for the Milky Wayas
ρ(r) = ρ0a2+r2
0a2+r2
where a is the core radius of the halo, producing flat rotation curves atlarge radii. The density and velocity distributions are related since the
35
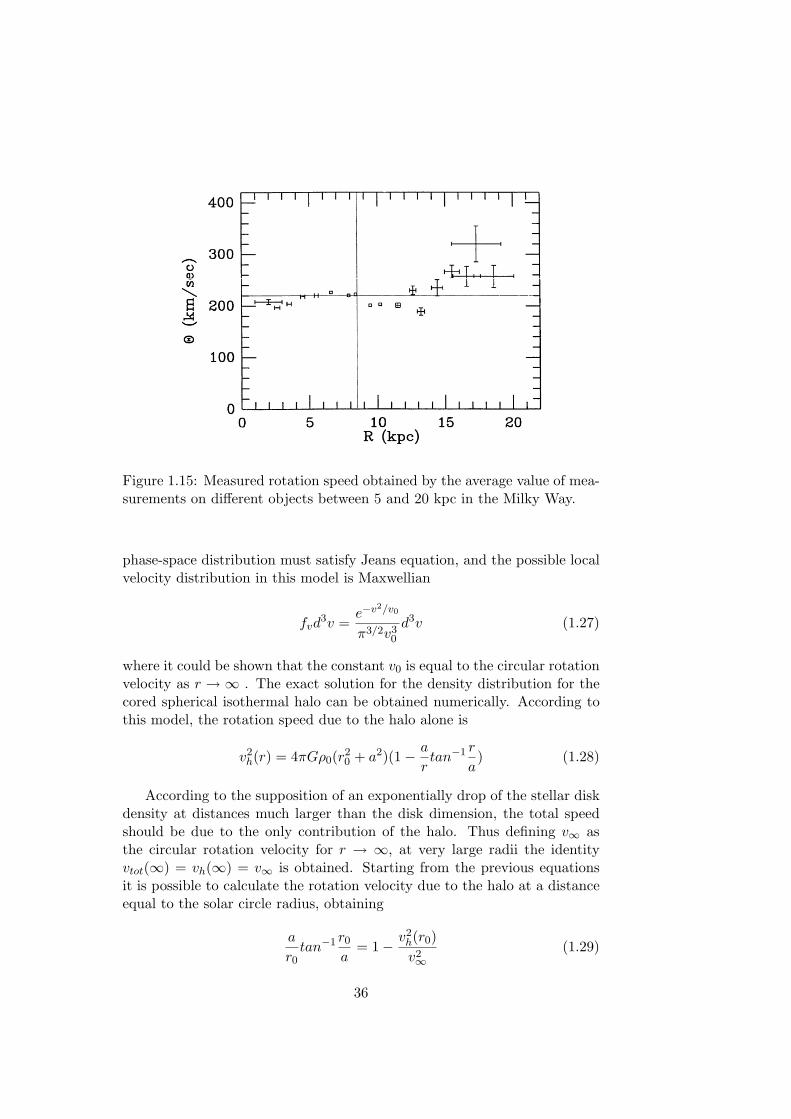
Figure 1.15: Measured rotation speed obtained by the average value of mea-surements on different objects between 5 and 20 kpc in the Milky Way.
phase-space distribution must satisfy Jeans equation, and the possible localvelocity distribution in this model is Maxwellian
fvd3v =
e−v2/v0
π3/2v30
d3v (1.27)
where it could be shown that the constant v0 is equal to the circular rotationvelocity as r → ∞ . The exact solution for the density distribution for thecored spherical isothermal halo can be obtained numerically. According tothis model, the rotation speed due to the halo alone is
v2h(r) = 4πGρ0(r2
0 + a2)(1− a
rtan−1 r
a) (1.28)
According to the supposition of an exponentially drop of the stellar diskdensity at distances much larger than the disk dimension, the total speedshould be due to the only contribution of the halo. Thus defining v∞ asthe circular rotation velocity for r → ∞, at very large radii the identityvtot(∞) = vh(∞) = v∞ is obtained. Starting from the previous equationsit is possible to calculate the rotation velocity due to the halo at a distanceequal to the solar circle radius, obtaining
a
r0tan−1 r0
a= 1− v2
h(r0)v2∞
(1.29)
36
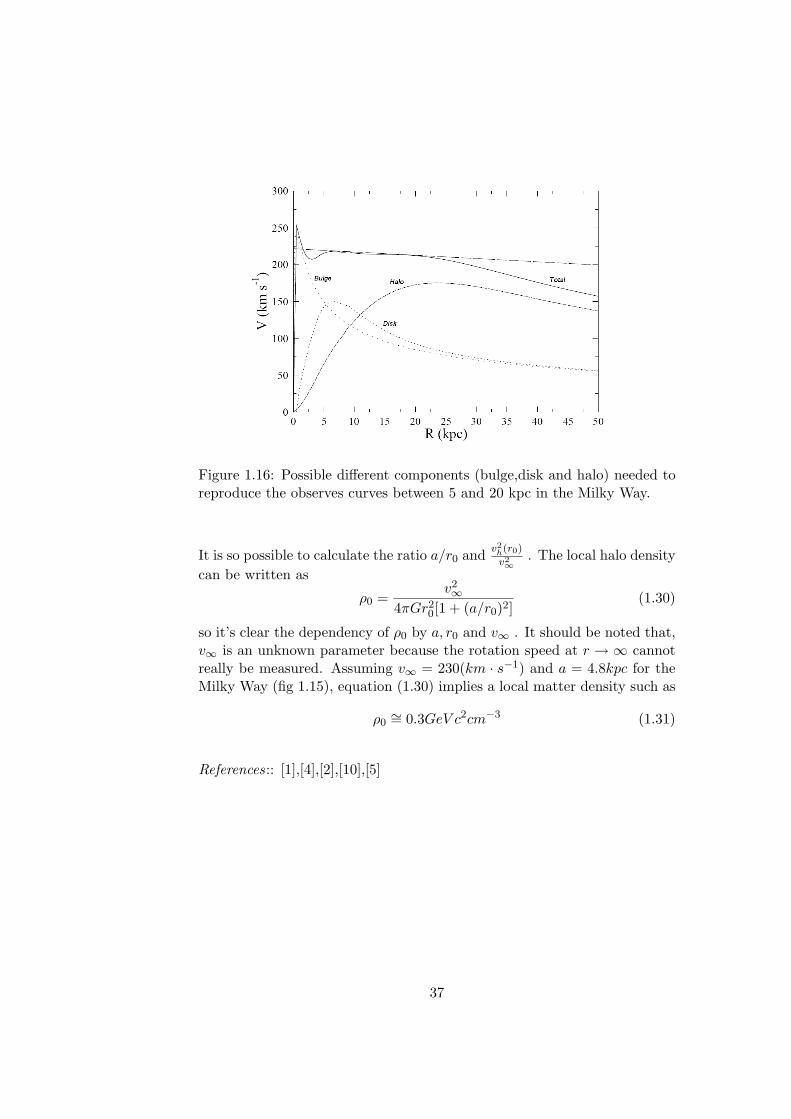
Figure 1.16: Possible different components (bulge,disk and halo) needed toreproduce the observes curves between 5 and 20 kpc in the Milky Way.
It is so possible to calculate the ratio a/r0 and v2h(r0)
v2∞. The local halo density
can be written as
ρ0 =v2∞
4πGr20[1 + (a/r0)2]
(1.30)
so it’s clear the dependency of ρ0 by a, r0 and v∞ . It should be noted that,v∞ is an unknown parameter because the rotation speed at r → ∞ cannotreally be measured. Assuming v∞ = 230(km · s−1) and a = 4.8kpc for theMilky Way (fig 1.15), equation (1.30) implies a local matter density such as
ρ0∼= 0.3GeV c2cm−3 (1.31)
References:: [1],[4],[2],[10],[5]
37
Chapter 2
WIMP direct detection
2.1 INTRODUCTION
As is has been stated in the last chapter, there are many experimental ob-servations suggesting that the largest part of the matter of the Universeshould consist in weakly interacting, non-barionic, massive and stable parti-cle called WIMP. WIMPs should be gravitationally trapped inside the galaxyand could have the adequate density profile to account for the observed rota-tional curves. Their mean velocity inside our galaxy is expected to be of theorder of 102km/s, similar to the speed of the sun around the center of theMilky Way, and it should be possible to detect WIMPs by elastic scatteringoff the nucleus of ordinary matter (”direct detection”). At those veloci-ties, WIMPs should produce a typical nuclear recoil energies in the range1÷ 100keV (supposing a WIMP mass in the range 10GeV ÷ 1Tev). Theseconstraints determine the main features of the direct experimental detectionof WIMPs. Moreover, the shape of the recoil spectrum and the expectedinteraction rate have a fundamental meaning for this type of research.
In this chapter those theoretical prediction are discussed, together withthe main experimental techniques used in the direct search and a reviewof some fundamental experiments. Finally a really brief discussion aboutindirect detection method and its results is reported.
2.2 EXPECTED RECOIL SPECTRUM AND IN-TERACTION RATE
As stressed before, it is possible to detect WIMPs in a direct or indirect way.In the first case, the estimation of the expected spectrum has a crucial roletogether the interaction of WIMPs with ordinary matter. The rate of suchcollisions depends on the local WIMP density ρχ and their kinetic energydistribution. Due to the infinite range of the gravitational force, the numberof particles to be considered is large and it is not so easy to calculate the
38
kinetic energy distribution. Anyway , as we have seen in the last chapter,the most common assumption is a spherical halo in which the WIMPs aretrapped in the gravitation filed at thermal equilibrium with a Maxwellianvelocity distribution f(−→r ,−→v ,−→vE , vesc) like:
f(−→r ,−→v ,−→vE , vesc) ∼ e−(−→v +−→v E)2
v20 (2.1)
where −→v is the WIMP velocity respect to the earth and −→vE is the totalvelocity of the Earth with respect to the centre of the galaxy (taking inaccount the Sun’s speed), v0 ≈ 230km s−1 and vesc is the escape velocityfrom the Milky Way. The above distribution is clearly true for each value of−→v such that |−→v +−→vE | < vesc. According to this assumption, if Mχ and T arethe WIMP mass and the equivalent temperature, it is possible to assume anabundance f(−→r ,−→v ,−→vE) that follows a Boltzmann distribution:
f(−→r ,−→v ,−→vE) ∼ e−Mχ(−→v E+−→v )2+MχΦ(−→r )
kBT (2.2)
where kBT = Mχv20 and Φ is the local gravitational potential. We are
now interested in the estimation of the recoil energy spectrum that can givefundamental information about both the cross section neutralino-nucleusσχ−N and the mass Mχ. If n is the number density of WIMPs, the rate ofinteraction on a target of atomic mass A per unit of mass is dependent onthe cross section, thus
R =No
A
∫σχ−Nvdn (2.3)
where N0 is the Avogadro number, v is the velocity’s module of the im-pinging particles and dn is the density of particle with module of veloc-ity within [−→v − d−→v ; v + d−→v ] that can be written in terms of the velocitydistributionf(−→r ,−→v ,−→vE , vesc)
dn = n0k f(−→r ,−→v ,−→vE , vesc)d3v
with n0 = ρχ
Mχ(ρχ
∼= 0.3GeV cm−3) and k a normalization constant suchas
∫ vesc
o dn = n0. Thus, assuming a constant cross section σ0 in the zeromoment transfer approximation, we obtain
R =N0
Aσ0
∫vdn =
N0
Aσ0n0 < v > (2.4)
anddR =
N0
Aσ0vdn (2.5)
It is useful to define the total event rate R0 per unit of mass assuming vE = 0and vesc = ∞.
R0 =2
π1/2
N0
An0v0σ0 (2.6)
39
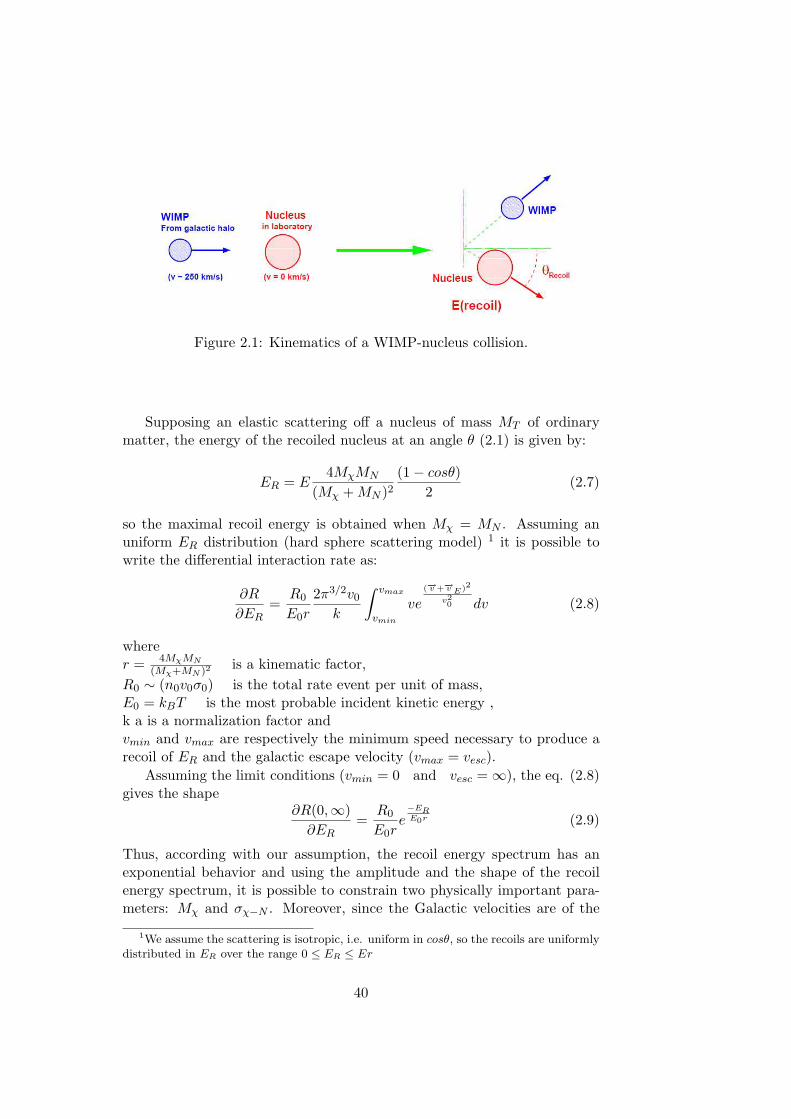
Figure 2.1: Kinematics of a WIMP-nucleus collision.
Supposing an elastic scattering off a nucleus of mass MT of ordinarymatter, the energy of the recoiled nucleus at an angle θ (2.1) is given by:
ER = E4MχMN
(Mχ + MN )2(1− cosθ)
2(2.7)
so the maximal recoil energy is obtained when Mχ = MN . Assuming anuniform ER distribution (hard sphere scattering model) 1 it is possible towrite the differential interaction rate as:
∂R
∂ER=
R0
E0r
2π3/2v0
k
∫ vmax
vmin
ve(−→v +−→v E)2
v20 dv (2.8)
wherer = 4MχMN
(Mχ+MN )2is a kinematic factor,
R0 ∼ (n0v0σ0) is the total rate event per unit of mass,E0 = kBT is the most probable incident kinetic energy ,k a is a normalization factor andvmin and vmax are respectively the minimum speed necessary to produce arecoil of ER and the galactic escape velocity (vmax = vesc).
Assuming the limit conditions (vmin = 0 and vesc = ∞), the eq. (2.8)gives the shape
∂R(0,∞)∂ER
=R0
E0re−ERE0r (2.9)
Thus, according with our assumption, the recoil energy spectrum has anexponential behavior and using the amplitude and the shape of the recoilenergy spectrum, it is possible to constrain two physically important para-meters: Mχ and σχ−N . Moreover, since the Galactic velocities are of the
1We assume the scattering is isotropic, i.e. uniform in cosθ, so the recoils are uniformlydistributed in ER over the range 0 ≤ ER ≤ Er
40
order of 102km/s, values of Mχ in the range 10÷1000GeV/c2 would producerecoil energies in the range 10÷ 100keV .
For practical purpose, assuming v0 = 230km s−1 and vesc = 600km s−1
the cut off for vesc has a negligible effect, while the minimum speed vmin hasthe Earth speed (i.e. the speed of the target) as lower limit. Assuming inthis way vmin = vE and vmax = ∞, the previous formula can be generalizedas
∂R(vE ,∞)∂ER
= c1R0
E0re−c2ER
E0r (2.10)
where the constant ci depend on the time of the year 2. The differentialinteraction rate is conventionally expressed in units of (keV −1kg−1day−1)or ”differential rate unit” (dru). It could be useful for some experimentsto evaluate a limit on the total number of events in a finite energy range.Integrating the eq. (2.10) between two different values (E1, E2) of ER weobtain
R(E1, E2) = R0c1
c2
[ec2E1/E0r − ec2E2/E0r
](2.11)
The total rate obtained by the integration over the energy is so expressed as(events ·kg−1 ·day−1) or ”total rate unit” (tru), while the partial integral ofthe differential spectrum between two different values is defined in terms of”integrated rate unit” (iru) (reserving ”tru” specifically for the total integralE1 = 0 and E2 = ∞). As stated before, the total rate R0 is defined as thetime independent rate corresponding to zero Galactic speed (vE = 0).
The time dependence is due to the different values assumed during theyear by −→v E . If −→v E is the speed of the Earth in the galactic frame, its valueis just the sum of the three different components due to the rotational speedof the galaxy disk−→v d , the Sun motion respect to the disk (i.e. its meanmotion relative to nearby stars) −→v s and finally the rotational speed of theEarth around the Sun −→v e. Thus
−→v E = −→v d +−→v s +−→v e. (2.12)
The tangential velocity of the sun around the galactic center (in the directionof Sagittarius) is 230km/s and is the dominant contribution. The earthvelocity is an order of magnitude smaller (30km/s) and can generally beneglected, except for an interesting modulation effect in the flux. As theearth orbits around the sun with a 60o angle relative to the galactic plane,a ve × cos(60o) = 15km/s velocity component is alternatively added andsubtracted to the sun’s velocity relative to the WIMP flux. According tothe experimental results it is possible to write
−→v E =[244 + 15cos
(2π
t− 152.3365.25
)]km/s (2.13)
2c1, c2 are not independent, by integration we obtain c1c2
= RR0
. For most purpose itcould be useful to take fixed average values c1 = 0.751 and c1 = 0.561
41
where t is the number (real) of days since 00:00 of January,1st of each year.In this way the net effect is to enhance the average kinetic energy of theWIMP flux on earth at 1st of June and to decrease at 1st of December.This may result in a 7% annual modulation of the collision rate that cangive an interesting experimental signature of the detected signal (althoughthe exact size of the effect may depend on the details of the halo models).
This scheme of the elastic scattering has to be modified to consider thecase of a large momentum transfer q = (2MT ER)1/2 : in this case thewavelength could be comparable with the nuclear’s typical dimension. Thewavelength associated to the momentum transfer of 20 keV of kinetic en-ergy is approximately 3 fm (about the size of the entire nucleus). It is notpossible to assume a priori that the scattering cross-section on a nucleus hasa scaling so that the contribution of various nucleons will be added coher-ently. In the first case only the unpaired nucleon will have a considerablecontribution to the interaction, while in the last case all nucleon contribu-tions add coherently giving a cross-section scaling. Thus, some assumptionsabout a spin-dependent or scalar (spin independent) interaction have to bemade and a multiplicative form factor F(q) which depends on the type ofWIMP-nucleon interaction (spin-dependent or spin-independent) has to beincluded. In general the differential cross-section of the scattering can bewritten as function of the momentum transfer −→q as σ(q2) = σ0F
2(q2) or
dσχ−N
d|−→q 2| = G2F
C
v2F 2(|−→q |) =
σ0
4µ2v2F 2(|−→q |) (2.14)
where
σ0 =∫ 4µ2v2
0dσχ−N (q=0)
d|−→q |2 = 4G2F µ2C
is the cross section at zero-momentum transfer, F is the form factor (F0 = 1),µ = mNmχ
mN+mχis the reduced mass, and C is a dimensionless constant includ-
ing all the particle-physics information and assuming different values as afunction of the type of interaction. Saying J as the total angular momen-tum of the nucleus and Λ2 as a function of the spin content of neutronsand protons inside the nucleus, in the case of spin-independent coupling weobtain
Cspin = 8
πΛ2J(J + 1)σ0,spin = 32
π G2F µ2Λ2J(J + 1)
(2.15)
while in the case of spin-independent
Cscalar = 1πG2
F[Zfp + (A− Z)fn]2
σ0,scalar = 4µ2
π [Zfp + (A− Z)fn]2(2.16)
where fn and fp are the neutralino couplings to neutrons and protons. As-suming fn
∼= fp, a value Cscalar ∝ A2 is obtained. In the case of independent
42
20 KeV thr.
30 KeV thr.
20 KeV thr.
30 KeV thr.
1.0
0.9
0.3
0.4
0.5
0.6
0.7
0.8
0.0
0.1
0.2
0 8070605040302010 10090
Recoil energy (keV)
F2 (
q2)
Xe
Si
Ar
Ge
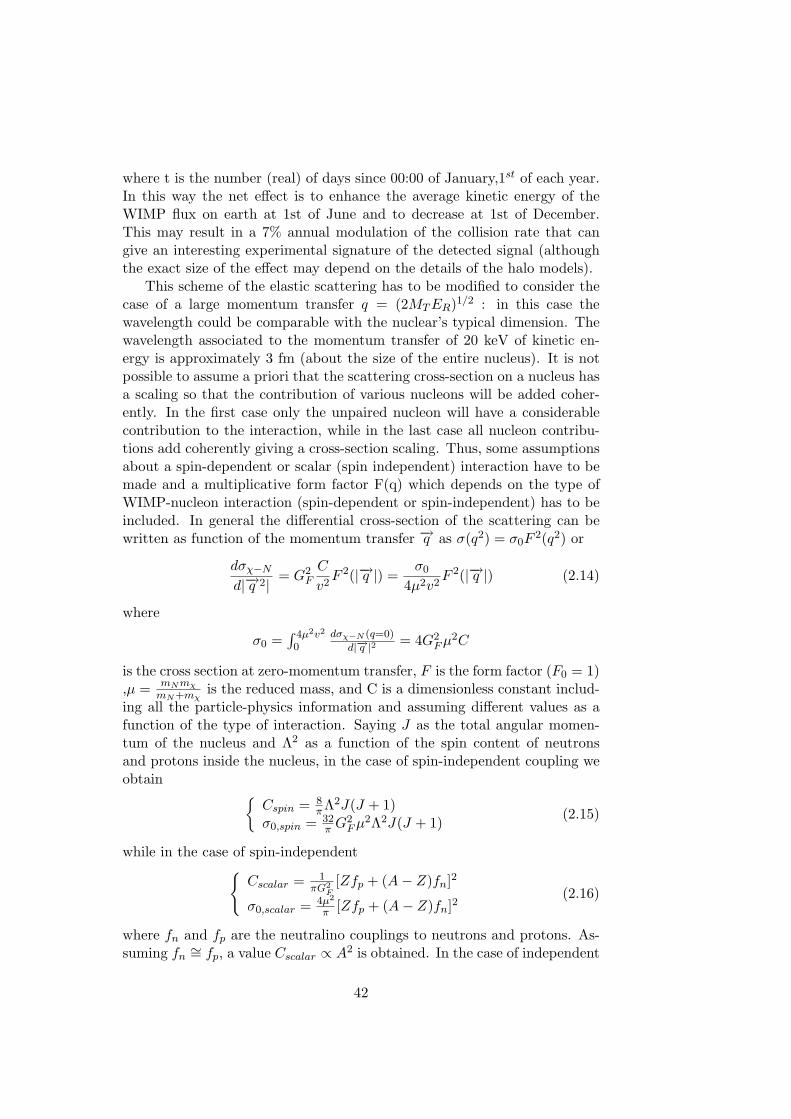
Figure 2.2: Spin independent nuclear form factors for the commontypical target used in the direct search experiments. It is clear thedecreasing of the factor with the increasing of the atomic number[Si(A=28),Ar(A=40),Ge(A=73) and Xe(A=131)]
coupling, only the unpaired nucleon will contribute significantly to the in-teraction as the spins of the A nucleons in a nucleus are systematicallyanti-aligned. In the second case, all nucleon contributions add coherently:the total amplitude scales as A and the total scattering probability as A2.Direct searches can profit of this scaling using targets with a large A, due tothe fact that in any model including at least a spin-independent componentfor the interaction, this term dominates the cross-section due to the factorA2. We can now summarize the description of the recoil differential energyspectrum in a single equation:
dR
dER= R0S(ER)F 2(ER)I (2.17)
where S(ER) is the behavior of the expected recoil spectrum, accounting thecorrection due to detector energy resolution and its moving in the galacticframe, R0 is the total recoil rate for unit of mass (supposing a motionlessdetector), F 2(ER) is the nuclear form factor previously introduced and I isa function needed to take into account the type of interaction (spin inde-pendent or spin dependent). According to the previous corrections, the rateof interaction on a target of atomic mass A is
R(E1, E2) =∫ E2
E1
c1R0
E0re−c2ER
E0r F 2A(ER)dER (2.18)
43
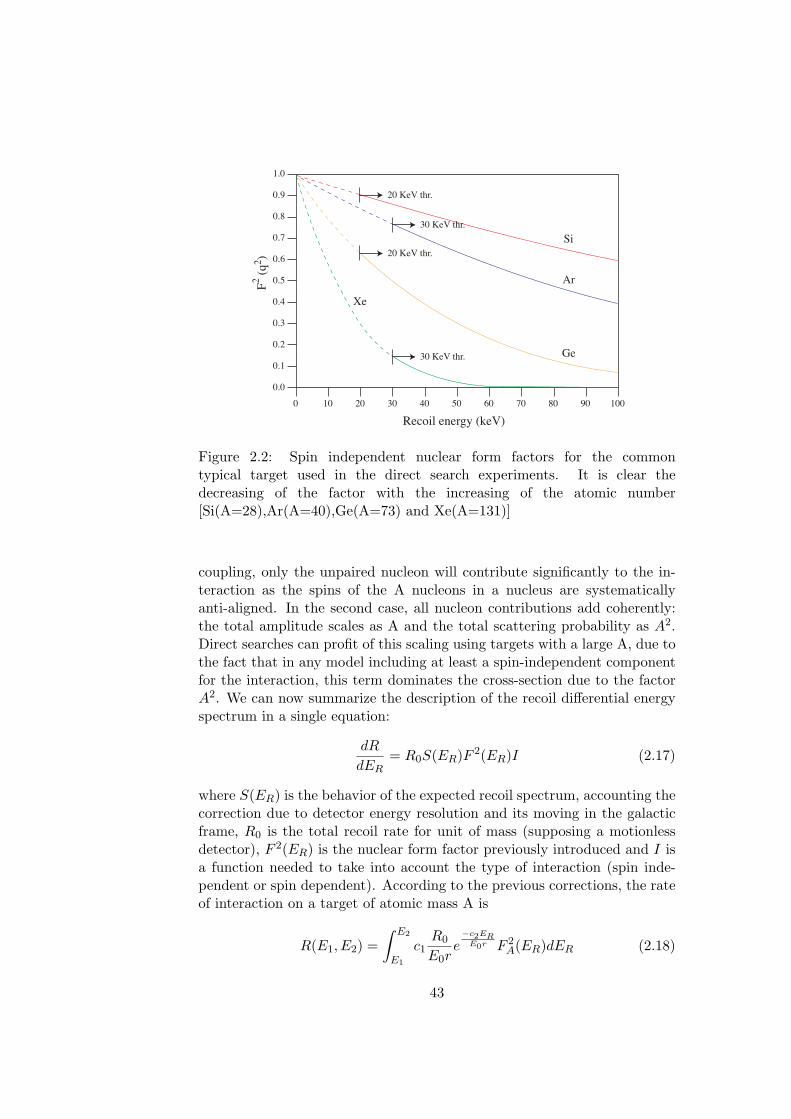
Figure 2.3: Allowed region of (mχ,σχ−n) parameters, obtained consideringcollider bounds and the requests of a not negligible neutralino cosmologicalabundance. See text for other possible constrains.
The nuclear form factor is defined as the Fourier transformation of the den-sity distribution of the scattering centre within the nucleus 3, so that F 2(ER)is included in the range [0, 1] and its value decreases with the increasing ofthe momentum transfer. Thus at high energy the differential recoils energyspectrum is partially suppressed. Moreover, the decreasing of the factorF 2(q) is faster as the higher is the value of A. In this way for high A nu-clei the high energy recoils, those easier to detect, are strongly depleted.This effect reduces the possible enhancement of the cross section with theatomic mass. As stressed before, the recoil energy spectrum gives somefundamental information to constrain two physically important parameters:Mχ and σχ−N . In order to compare different experiments using typicallydifferent targets within this formalism, the WIMP-nucleon cross section isusually used instead of the total cross section WIMP-nucleus. Assuming thesame coupling between neutralino and proton and neutron, the cross section
3Defining g = (qrN ), where q is the module of the momentum transfer rN is the effectivenuclear radius, it is possible to write the form factor as
F (g) = 3 j1(g)g
e−(qs)2
2
where j1 is the spherical Bessel function and s is a constant s = 0.9fm
44
neutralino-nucleon is not dependent on the momentum transfer since in ourenergy range of interest the nucleon can be considered as point-like. Usingthe spin independent formalism, the cross section in the zero momentumtransfer approximation is related to the total cross section σχ−n evaluatedusing A=1 through
σ0 = σχ−nµ2
N
µ2n
A2 (2.19)
where clearly µN (µn) is the invariant mass of the WIMP-nucleus (WIMP-nucleon) system. Thus, using the quantity σχ−n it is possible to com-pare different experiments with different targets. Usually the allowed spaceof parameters (Mχ, σχ−N ) of the MSSM model is considered using spin-independent interaction. The whole region of parameters is clearly wide dueto the poor prediction of the theoretical model. For example, the mass ofthe neutralino cannot be much greater than 1TeV/c2 and cannot be lessthan 50GeV/c2, except in versions of the model that are specially tuned forthis purpose. Poor constraints can be obtained considering the results ofthe direct neutralino’s production at colliders, the request of a not negli-gible cosmological abundance (0.1 < Ωχ < h2). In fig (2.3) the ranges ofspin independent neutralino-nucleon cross section and of neutralino massare reported. Larger limits are provided by the theoretical requests aboutthe Higgs/higgsino mass parameter µ (0 < µ < 1TeV ). Other constrainscan be indirectly obtained measuring rare physical process and estimatingthe allowed SUSY contributions. This is the case of BR(b → sγ) and espe-cially of the anomalous magnetic moment of the muon. Recent results for(g−2) indicates a deviation from the Standard Model prediction that couldbe explained in terms of SUSY. The required extra contribution to (g − 2)implies a stringent upper bound mχ < 350GeV (1 σ CL) and mχ < 512GeV(2 σ s) to the mass range, but it does not affect much the allowed rangesof the spin independent scattering cross section. Anyway the value of theanomalous magnetic moment of the muon is still a subject of discussion.References::[1], [23],[24],[27],
2.3 LOW BACKGROUND TECHNIQUES
It is clear that extremely low background levels are necessary to explore therange of the MSSM predictions. As comparison a value of 0.1 decays perkgd should be necessary to achieve a 106 pb sensitivity in the WIMP’s directsearch, while it is possible to estimate the radioactivity of a human bodyas 107 decays per kgd (typically depositing more than 100 keV of energy).The background from natural radioactivity has two sources: external andinternal radioactivity. First of all, to reduce the background due to externalsources, the detector must be located in a deep-underground site, in orderto reduce the cosmic muon flux to factor 10−5 to 10−7 of the flux at ground
45
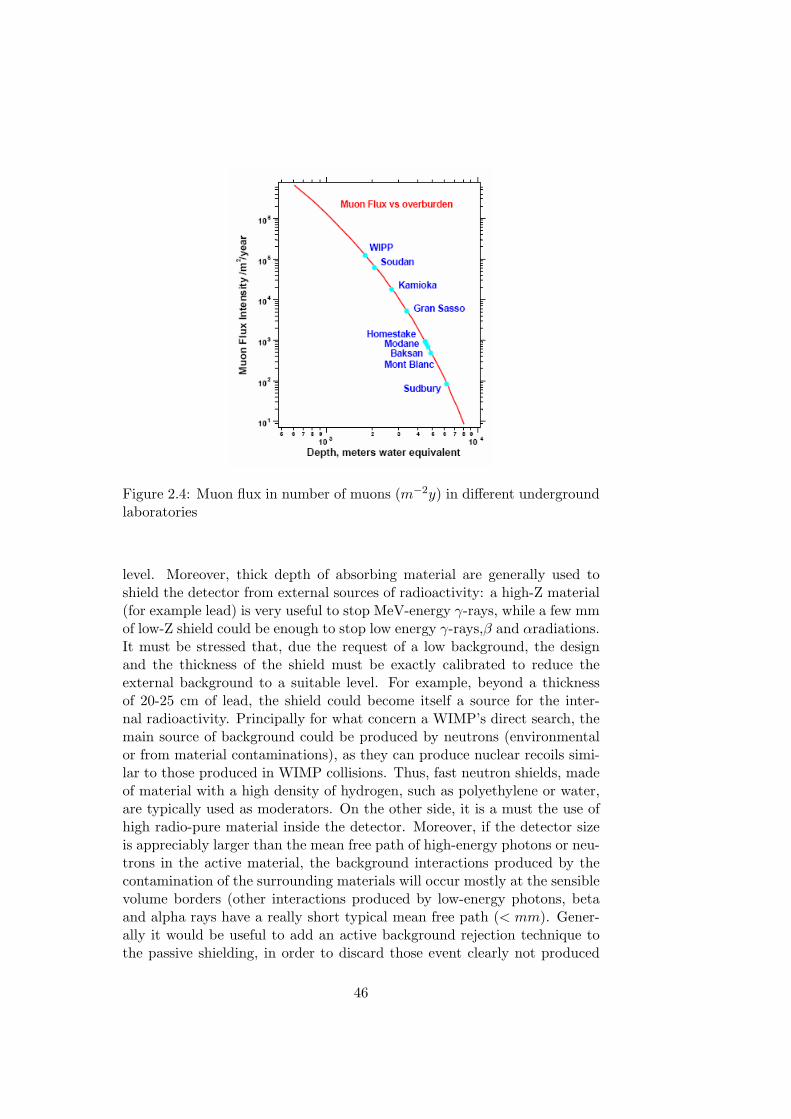
Figure 2.4: Muon flux in number of muons (m−2y) in different undergroundlaboratories
level. Moreover, thick depth of absorbing material are generally used toshield the detector from external sources of radioactivity: a high-Z material(for example lead) is very useful to stop MeV-energy γ-rays, while a few mmof low-Z shield could be enough to stop low energy γ-rays,β and αradiations.It must be stressed that, due the request of a low background, the designand the thickness of the shield must be exactly calibrated to reduce theexternal background to a suitable level. For example, beyond a thicknessof 20-25 cm of lead, the shield could become itself a source for the inter-nal radioactivity. Principally for what concern a WIMP’s direct search, themain source of background could be produced by neutrons (environmentalor from material contaminations), as they can produce nuclear recoils simi-lar to those produced in WIMP collisions. Thus, fast neutron shields, madeof material with a high density of hydrogen, such as polyethylene or water,are typically used as moderators. On the other side, it is a must the use ofhigh radio-pure material inside the detector. Moreover, if the detector sizeis appreciably larger than the mean free path of high-energy photons or neu-trons in the active material, the background interactions produced by thecontamination of the surrounding materials will occur mostly at the sensiblevolume borders (other interactions produced by low-energy photons, betaand alpha rays have a really short typical mean free path (< mm). Gener-ally it would be useful to add an active background rejection technique tothe passive shielding, in order to discard those event clearly not produced
46
by WIMP interactions. A possible rejection method could be based on theidentification of multiple interactions. While the mean free path of a highenergy γ-ray or a neutron in matter is of the order of the cm, the meanfree path of a WIMP in matter is of the order of a light-year, due to theextremely low cross section of WIMP interaction. Thus the probability oftwo consecutive interactions in a single detector (or two adjacent detectors)is completely negligible. In this way, it possible to reject those events thathave more than one interaction in the detector defining a minimal time win-dow between two following events or packing the sensible volume within aveto active volume. Furthermore an efficient identification method of theevents (generally based on the different event’s signature in the detector)is necessary in order to achieve a good rejection against energy depositsdue to non-WIMP interactions. This background can be discarded using anevent-by-event analysis, based on a direct identification of each single event,or using a statistical rejection, where a fraction of the total event samplecould be identified as coming from a well-defined type of background. In anycase the confidence of the identification method must be valuated. In thefirst case the probability of failing (i.e. the identification of a backgroundevent as a WIMP event) must be estimated, in the second case the measure-ment of the WIMP rate is limited by the statistical fluctuation on the datasample. It would be possible to get indication of the existence of WIMPsin many different ways, thus many methods could be used in principle toget evidences of WIMP signatures. In order to obtain a convincing WIMPevidence, an experiment should combine more than one of these signatures.In the following scheme some of them are reported, with the main remarksabout their motivations.Nuclear recoils direct detection: This signature is based on the discrim-ination of nuclear and electron recoils. While most radioactive backgroundstypically interact via the electromagnetic force and produce electron recoils,WIMPs can only produce nuclear recoils. The discrimination is generallybased on the fact that the former have a larger energy loss per unit length(dE/dx) and a smaller recoil range. This also leads to the previously dis-cussed quenching effects, as well as difference in scintillation time of thesensible material of the detector.Shape of the recoil energy spectrum: The observed Erecoil spectrumcan be compared with the expectation spectrum (that can be calculated asfunction of the WIMP’s mass). In principle, the knowledge of the back-ground spectrum could be used to apply a background subtraction, to makethe observed energy spectrum consistent with the expectation. Anyway, thismethod is not so useful due to the few number of expected events and tothe exponential shape typical of many background sources. The theoreticalpredictions are commonly used to define the optimal Erecoil search range.Coherence: the observed interaction rate in a detector must be influencedby the scattering cross-section that should be proportional to µ2A2, for spin-
47
independent interactions, while the scattering cross-section of fast neutronsis approximately equal to the geometrical cross section of the target nucleus(corresponds to a A2/3 dependence).Time modulation in energy and direction spectra: As discussed be-fore, the composition of the earth and sun’s velocity respect to the galaxyduring the year makes a modulation in the WIMP’s flux and their averagekinetic energy. This modulation may be used as WIMP signature, althoughits magnitude is strictly depending on the halo model and this effect wouldrequire large sample of data. Moreover, the apparent direction of the WIMPsflux should be also correlated to the motion of the earth in the galaxy andto its the rotational motion during the day. Thus the annual modulationand a diurnal modulation in the direction of the WIMPs flux could be ev-idenced in addition to the energy spectra. However, due to short range ofthe nuclear recoils ( up to ∼ 20nm in a solid and ∼ 30µm in gas for a 20keV recoil), most of the experiments are not sensitive to the recoil directionand cannot estimate the angle θR.
As stressed before, the differential event rate is conventionally expressedas dru (events · keV −1 · kg−1 · day−1). The total rate R0 integrated overthe energy is so expressed as events · kg−1 · day−1 or ”total rate unit” (tru).In some experiments it is necessary to utilize the partial integral of thedifferential spectrum between two different values of ER. In this case thedenomination ”integrated rate unit” (iru) is commonly used.References:: [1],[27],[28],[30],[25]
2.4 REVIEW OF PRESENT EXPERIMENTS
The requirement of low threshold, reasonably high target mass and ultra-low background for WIMP direct detection experiments seem to constrainthe detector technology. Nevertheless, today there are many different ex-periments searching WIMPs, based on a large variety of technology; severalothers with increasing mass have been proposed. However it can be nowstressed that the counting time is strictly related to the detector mass inorder to provide enough statistic for the detection of such rare events (theproduct of the mass and the counting time (M × T ) defined as total ex-posure is typically used as indicative parameter). It is possible to classifydirect WIMPs search experiments into two different categories. The firstone historically developed had as aim the realization of a detector with amass as large as possible, reducing passively the background shielding thedetector active region. The ambition is to get a WIMP signal above back-ground after long exposures. However, the sensitivity of this method onlyincreases with (M × T )1/2 due to the statistical nature of the discrimina-tion. A more recent category of direct search experiments focuses mainly onthe event-by event discrimination of signal against background, in order to
48
discriminate nuclear-recoils over the radioactive electromagnetic backgroundgiving mainly electron-recoils. Compared to the first category the sensitivityis enhanced in direct proportion to the exposure, obtaining in this way thebest WIMP sensitivities. The discrimination technique is based on differentresponses of the detectors to different interacting particle of the same energy.For example such discrimination could be associated to the fact that elec-tron recoils have an energy loss per unit length (dE/dx) different from thatrelated to nuclear recoil: thus the response to the ionization signal detectionwould be different for different particles at the same energy. Generally it ispossible to get an efficient discrimination of the nuclear recoil signal againstthe electron recoil if the ratio recoil signal over γ signal (rc/γ), typicallyused as discriminating parameter, is quite different from the unity in a widerange of energy. Since the detectors are usually calibrated using γ-sources(i.e. the energy scale is given in as keV e.e. (electron equivalent), a goodunderstanding of the ratio (rc/γ) is also necessary to set the right energynuclear scale. From the point of view of detection techniques for nuclearrecoil energy, it is possible to distinguish three different techniques based onionization, scintillation and phonon detection. The ionization signal can beproduced inside a detector sensible volume by the free electron-ion couples(liquid or gaseous target) or alternatively by electron-hole pairs (crystals),collected using a drift field and detected by charge sensitive devices. An-other detection principle is based on the collection of the light producedduring the de-excitation of the atoms of a scintillation target like NaI(Tl)[rc/γ ∼= 0.3 (Na) - (rc/γ) ∼= 0.09(I)] or Xe (rc/γ ∼= 0.2). The last typicallyused detection principle is based on the collection of the phonons producedin cryogenic detectors (cooled at temperature of few mK). This techniquecan provide the lowest energy threshold in nuclear recoil detection (down tofew mk), due to possibility of detection of a really tiny energy deposition.However, this kind of detection provide a ratio rc/γ ∼= 1, not providing inthis way an intrinsic discrimination method for background rejection. Atpresent, the most interesting direct searches have reached sensitivities closeto 106pb. This allow to explore the domain of optimistic Supersymmetricmodels, but more orders of magnitude are necessary in order to cover mostof the SUSY predictions. Anyway some experiments aim to improve thisresult during the next years.
CDMS-EDELWEISS
To detect WIMPs interactions, CDMS uses ZIP (Z-dependent IonizationPhonon) detector technology, consisting in disc-shaped germanium (250 g)or silicon (100 g) crystals as absorber. The technique allows the simulta-neous detection of ionization and phonons signals. One face of the discis covered by a thin layer of aluminium and 1024 tungsten transition-edgesensors (TES) which are evenly distributed over the surface. The Al layer
49
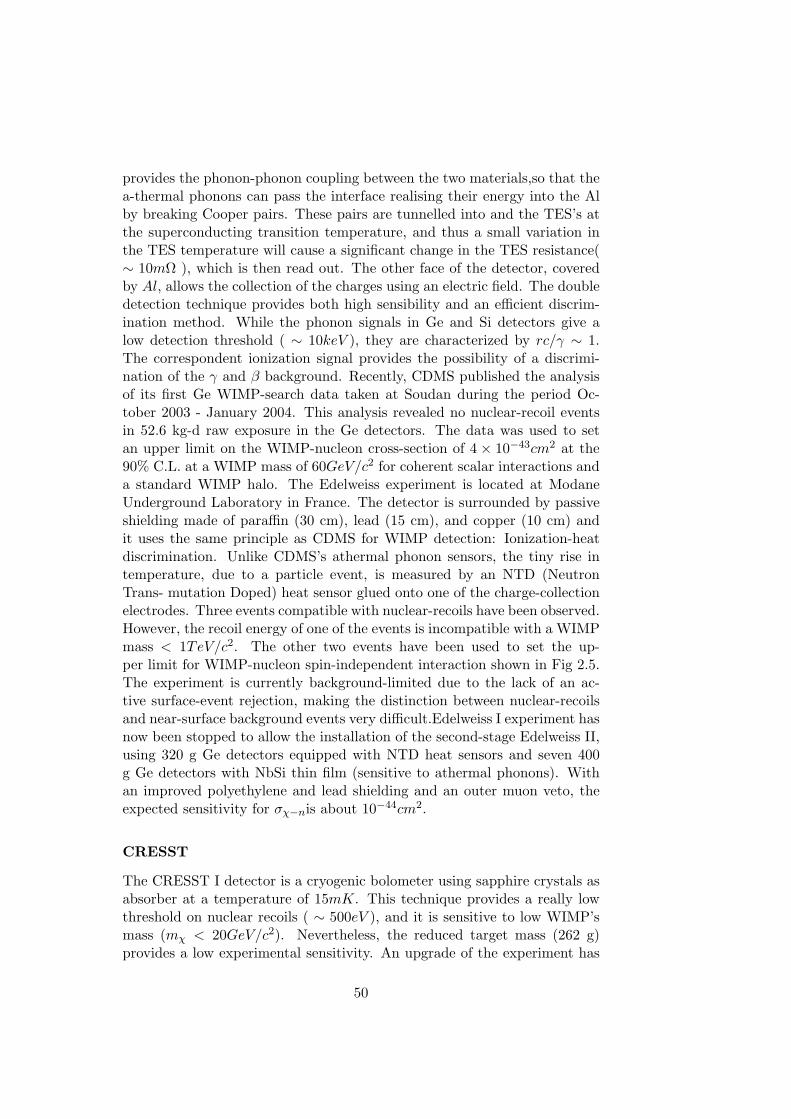
provides the phonon-phonon coupling between the two materials,so that thea-thermal phonons can pass the interface realising their energy into the Alby breaking Cooper pairs. These pairs are tunnelled into and the TES’s atthe superconducting transition temperature, and thus a small variation inthe TES temperature will cause a significant change in the TES resistance(∼ 10mΩ ), which is then read out. The other face of the detector, coveredby Al, allows the collection of the charges using an electric field. The doubledetection technique provides both high sensibility and an efficient discrim-ination method. While the phonon signals in Ge and Si detectors give alow detection threshold ( ∼ 10keV ), they are characterized by rc/γ ∼ 1.The correspondent ionization signal provides the possibility of a discrimi-nation of the γ and β background. Recently, CDMS published the analysisof its first Ge WIMP-search data taken at Soudan during the period Oc-tober 2003 - January 2004. This analysis revealed no nuclear-recoil eventsin 52.6 kg-d raw exposure in the Ge detectors. The data was used to setan upper limit on the WIMP-nucleon cross-section of 4 × 10−43cm2 at the90% C.L. at a WIMP mass of 60GeV/c2 for coherent scalar interactions anda standard WIMP halo. The Edelweiss experiment is located at ModaneUnderground Laboratory in France. The detector is surrounded by passiveshielding made of paraffin (30 cm), lead (15 cm), and copper (10 cm) andit uses the same principle as CDMS for WIMP detection: Ionization-heatdiscrimination. Unlike CDMS’s athermal phonon sensors, the tiny rise intemperature, due to a particle event, is measured by an NTD (NeutronTrans- mutation Doped) heat sensor glued onto one of the charge-collectionelectrodes. Three events compatible with nuclear-recoils have been observed.However, the recoil energy of one of the events is incompatible with a WIMPmass < 1TeV/c2. The other two events have been used to set the up-per limit for WIMP-nucleon spin-independent interaction shown in Fig 2.5.The experiment is currently background-limited due to the lack of an ac-tive surface-event rejection, making the distinction between nuclear-recoilsand near-surface background events very difficult.Edelweiss I experiment hasnow been stopped to allow the installation of the second-stage Edelweiss II,using 320 g Ge detectors equipped with NTD heat sensors and seven 400g Ge detectors with NbSi thin film (sensitive to athermal phonons). Withan improved polyethylene and lead shielding and an outer muon veto, theexpected sensitivity for σχ−nis about 10−44cm2.
CRESST
The CRESST I detector is a cryogenic bolometer using sapphire crystals asabsorber at a temperature of 15mK. This technique provides a really lowthreshold on nuclear recoils ( ∼ 500eV ), and it is sensitive to low WIMP’smass (mχ < 20GeV/c2). Nevertheless, the reduced target mass (262 g)provides a low experimental sensitivity. An upgrade of the experiment has
50
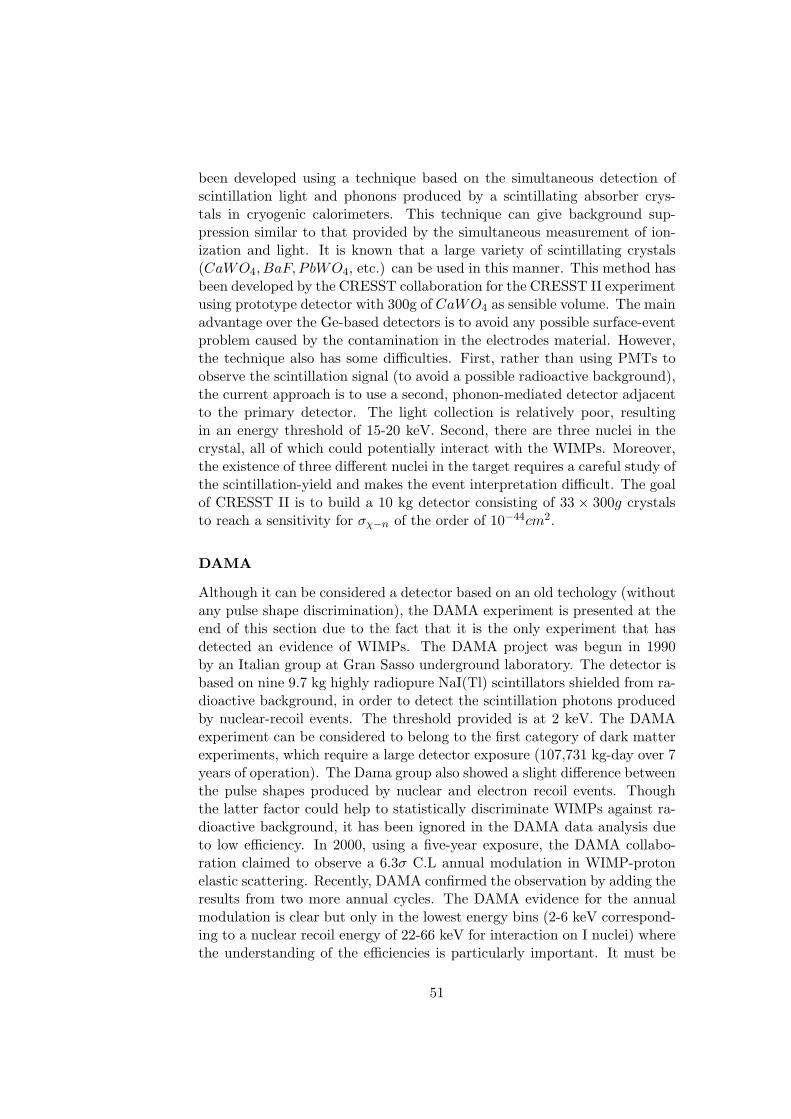
been developed using a technique based on the simultaneous detection ofscintillation light and phonons produced by a scintillating absorber crys-tals in cryogenic calorimeters. This technique can give background sup-pression similar to that provided by the simultaneous measurement of ion-ization and light. It is known that a large variety of scintillating crystals(CaWO4, BaF, PbWO4, etc.) can be used in this manner. This method hasbeen developed by the CRESST collaboration for the CRESST II experimentusing prototype detector with 300g of CaWO4 as sensible volume. The mainadvantage over the Ge-based detectors is to avoid any possible surface-eventproblem caused by the contamination in the electrodes material. However,the technique also has some difficulties. First, rather than using PMTs toobserve the scintillation signal (to avoid a possible radioactive background),the current approach is to use a second, phonon-mediated detector adjacentto the primary detector. The light collection is relatively poor, resultingin an energy threshold of 15-20 keV. Second, there are three nuclei in thecrystal, all of which could potentially interact with the WIMPs. Moreover,the existence of three different nuclei in the target requires a careful study ofthe scintillation-yield and makes the event interpretation difficult. The goalof CRESST II is to build a 10 kg detector consisting of 33 × 300g crystalsto reach a sensitivity for σχ−n of the order of 10−44cm2.
DAMA
Although it can be considered a detector based on an old techology (withoutany pulse shape discrimination), the DAMA experiment is presented at theend of this section due to the fact that it is the only experiment that hasdetected an evidence of WIMPs. The DAMA project was begun in 1990by an Italian group at Gran Sasso underground laboratory. The detector isbased on nine 9.7 kg highly radiopure NaI(Tl) scintillators shielded from ra-dioactive background, in order to detect the scintillation photons producedby nuclear-recoil events. The threshold provided is at 2 keV. The DAMAexperiment can be considered to belong to the first category of dark matterexperiments, which require a large detector exposure (107,731 kg-day over 7years of operation). The Dama group also showed a slight difference betweenthe pulse shapes produced by nuclear and electron recoil events. Thoughthe latter factor could help to statistically discriminate WIMPs against ra-dioactive background, it has been ignored in the DAMA data analysis dueto low efficiency. In 2000, using a five-year exposure, the DAMA collabo-ration claimed to observe a 6.3σ C.L annual modulation in WIMP-protonelastic scattering. Recently, DAMA confirmed the observation by adding theresults from two more annual cycles. The DAMA evidence for the annualmodulation is clear but only in the lowest energy bins (2-6 keV correspond-ing to a nuclear recoil energy of 22-66 keV for interaction on I nuclei) wherethe understanding of the efficiencies is particularly important. It must be
51
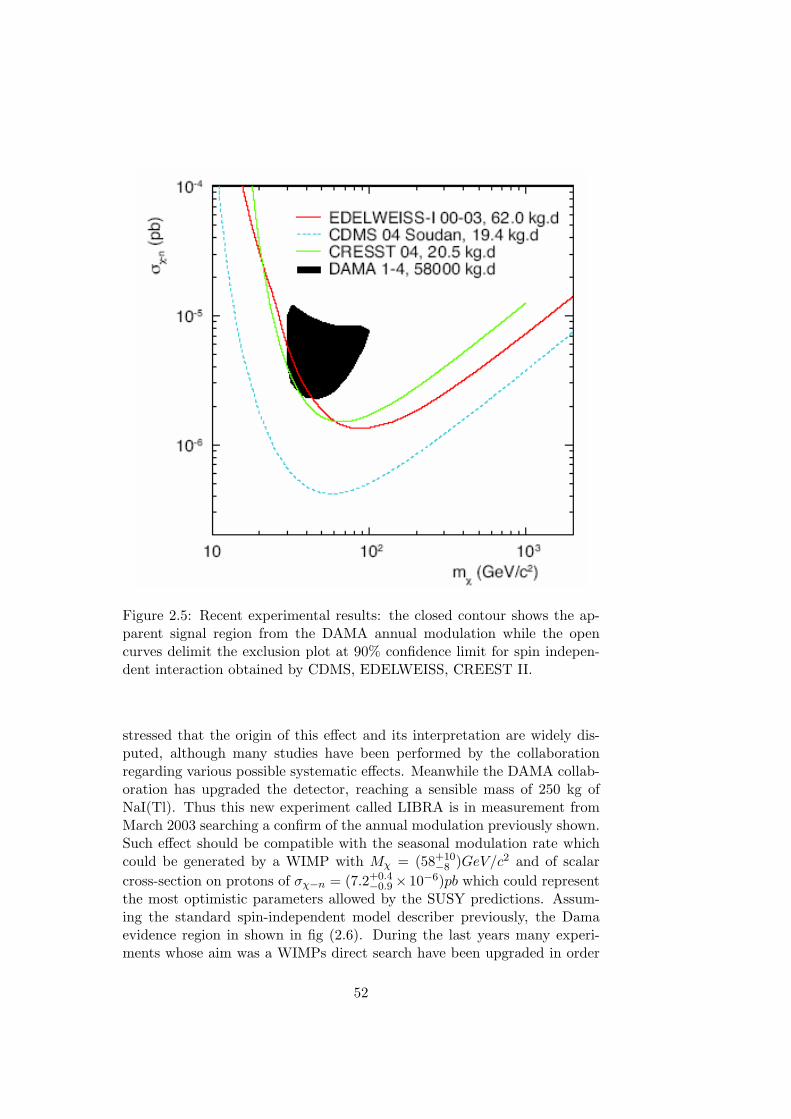
Figure 2.5: Recent experimental results: the closed contour shows the ap-parent signal region from the DAMA annual modulation while the opencurves delimit the exclusion plot at 90% confidence limit for spin indepen-dent interaction obtained by CDMS, EDELWEISS, CREEST II.
stressed that the origin of this effect and its interpretation are widely dis-puted, although many studies have been performed by the collaborationregarding various possible systematic effects. Meanwhile the DAMA collab-oration has upgraded the detector, reaching a sensible mass of 250 kg ofNaI(Tl). Thus this new experiment called LIBRA is in measurement fromMarch 2003 searching a confirm of the annual modulation previously shown.Such effect should be compatible with the seasonal modulation rate whichcould be generated by a WIMP with Mχ = (58+10
−8 )GeV/c2 and of scalarcross-section on protons of σχ−n = (7.2+0.4
−0.9× 10⁻⁶)pb which could representthe most optimistic parameters allowed by the SUSY predictions. Assum-ing the standard spin-independent model describer previously, the Damaevidence region in shown in fig (2.6). During the last years many experi-ments whose aim was a WIMPs direct search have been upgraded in order
52
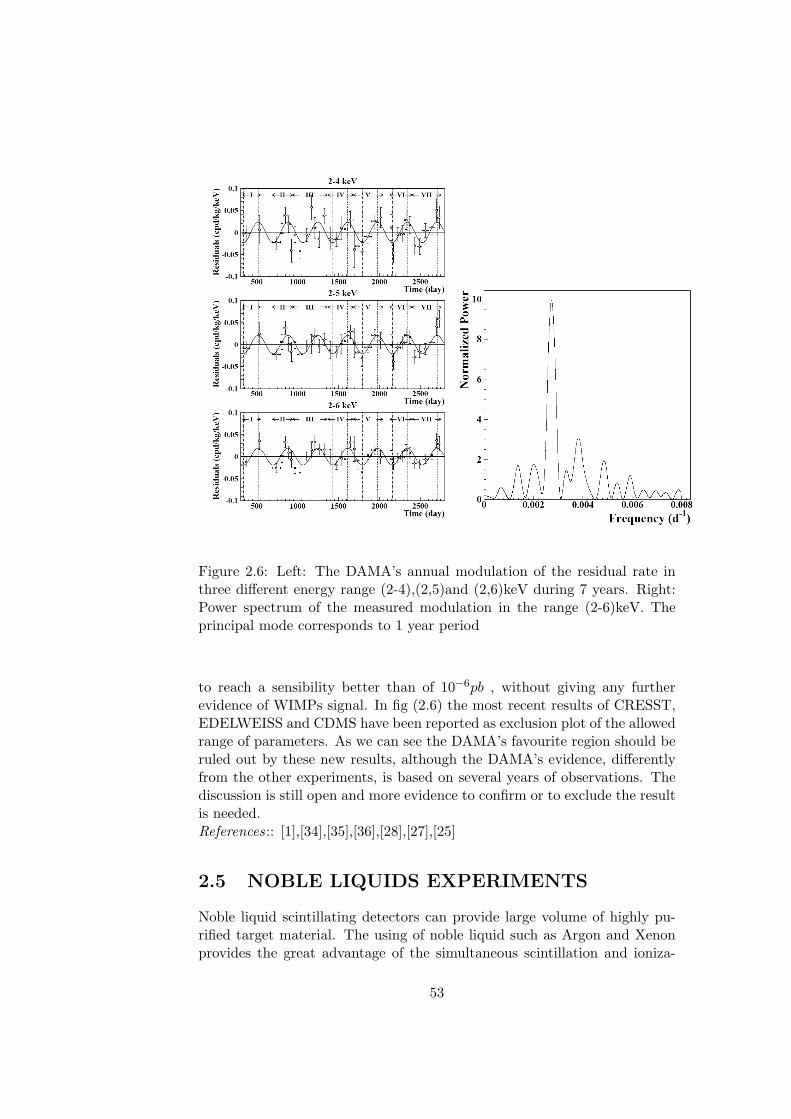
Figure 2.6: Left: The DAMA’s annual modulation of the residual rate inthree different energy range (2-4),(2,5)and (2,6)keV during 7 years. Right:Power spectrum of the measured modulation in the range (2-6)keV. Theprincipal mode corresponds to 1 year period
to reach a sensibility better than of 10−6pb , without giving any furtherevidence of WIMPs signal. In fig (2.6) the most recent results of CRESST,EDELWEISS and CDMS have been reported as exclusion plot of the allowedrange of parameters. As we can see the DAMA’s favourite region should beruled out by these new results, although the DAMA’s evidence, differentlyfrom the other experiments, is based on several years of observations. Thediscussion is still open and more evidence to confirm or to exclude the resultis needed.References:: [1],[34],[35],[36],[28],[27],[25]
2.5 NOBLE LIQUIDS EXPERIMENTS
Noble liquid scintillating detectors can provide large volume of highly pu-rified target material. The using of noble liquid such as Argon and Xenonprovides the great advantage of the simultaneous scintillation and ioniza-
53
tion yields due to their low ionization potentials, thus both the signal canbe collected. Moreover the development of very efficient purification tech-niques developed for noble gases can provide targets with a low level ofradioactive isotopes and other contaminations so that the targets would bevirtually background free. The use of noble liquids has been demonstratedto provide an efficient event by event identification of nuclear and electronrecoils, based on different scintillating time constants or different amounts inthe ionization and scintillation yields. The ZEPLIN collaboration (Boulbymine, UK) uses liquid Xenon as a scintillating material. The target con-sists of a 5 kg cell of purified liquid Xenon surrounded by a 1-ton Comptonveto, while 3 PMTs are used in order to detect the scintillation light. Theacquired light signals show different time constants for nuclear and electronrecoil events, and both rise-times are also functions of the deposited energy.Today some experiments using a double phase detector (liquid+gas) havebeen proposed. According to this technology the ionization charge producedin the liquid phase is extracted into the gaseous phase (using a strong elec-tric field), where a secondary proportional luminescence is produced anddetected. The simultaneous detection of both ionization and scintillationcan provide an additional method for the recoil discrimination. One of theexperiments based on this technology is the XENON project, a dual phaseXenon experiment using a time projection chamber. In spite of ZEPLINor XMASS which only use a liquid phase and can therefore only achievea limited discrimination between electronic and nuclear recoils, the doubledetection of ionization and scintillation signals can efficiently improve thenuclear recoil discrimination over the background.
Concluding, it must be stressed the main property of Ar or Xe as aWIMP detector concern their possible future development as large massdetectors, and the unique outstanding possibility of background discrimina-tion. First of all the possibility of considerably long drift (due to the highmean life of the electrons in the noble liquid) allows the creation of largesensible volume (a detector using LAr of many hundreds of tons has beenbuilt by the ICARUS collaboration). Detectors with target mass up to 1 tonhave been proposed during these years by several collaborations. Moreoverit has been shown during last years the possibility of such type of detectorsto provide a good position resolution in order to reject events due to borderscontamination and multiple scattering inside the detector. This characteris-tic, together the low level of radioactive contaminations of the noble liquidsreached using efficient purification devices, gives the chance to reach a lowbackground level and an efficient background rejection. All the mentionedfeatures make the use of nobles liquid very interesting for the Dark Mattersearch.References:: [36],[28],[27]
54
2.6 INDIRECT WIMP SEARCHES
It should be possible to have indirect evidence of on the WIMPs by searchingfor products of WIMP annihilation in regions that are expected to haverelatively large WIMP concentration, such as galactic centers, the centreof the Sun, or the center of the Earth, where the WIMPs are expected tobe gravitationally captured. As predicted by SUSY models, this search isbased on the assumption that the WIMP is its own antiparticle and thatequal numbers of WIMPs and anti-WIMPs are present. Thus a signal of theχ−χ annihilation could be found as flux of γ-rays, neutrinos, or antimatter(positrons or anti-protons) coming from an area where a large concentrationof WIMPs is expected. Many experiments have been proposed to observeindirect signatures of WIMPs, and this research is quite complementary todirect observation in the laboratory. One of the possibile way to observethe WIMP’s annihilations is the observation of high energy γ-rays. It ispossible to suppose that the production of γ-rays would occur in differentways. Both a continuous and a mono-energetic spectrum are expected. Thefirst one can be produced from the hadronization and decay of π0 producedin the cascading of the annihilation products, while a direct production ofγ such as
χχ → γγχχ → γZ
can produce mono-energetic γ-rays of energy Mχ and Mχ(1 − M2Z/M2
χ).Photons of such energy, coming from sites where an high density is ex-pected, would be a clear indication of WIMP annihilation. Anyway thesize of this signal depends very strongly on the halo model. The searchingof such WIMP’s evidence is based on different techniques. Ground-basedexperiments rely on Atmospheric Cherenkov Telescopes (ACTs), such asCELESTE (France) and STACEE (New Mexico). The main feature of suchexperiments consist in distinguish (usually at > 99% efficiency) between theshowers caused by γ-rays and those caused by cosmic rays that is the domi-nant background. Many of them have a dedicated mirror in order to observethe rays coming from the most promising points (CANGAROO (Australia),VERITAS (Arizona), CAT (France),HESS (Namibia)). The typically sensi-tivity is of the order of 1 TeV γ-rays, thus such types of experiments havethe possibility to investigate a wide range of WIMP mass. Moreover, somesatellite-based experiments have completed their research (EGRET, 20 MeV- 30 GeV range) or have been planned to be lunched soon (GLAST, 10 MeV- 100 GeV). Recently VERITAS and CANGAROO have observed an excessin the flux of γ-rays coming from the galactic centre. These observations,however, are not compatible between themselves and can be also explainedby astrophysical sources, like a black hole at the galactic centre. In additionto the γ-search just described, neutrinos produced in WIMP-annihilations
55
inside the Earth and the Sun would be produced. A direct production ofneutrinos is expected both directly
χχ → νν
and indirectly
χχ → ff
(where the fermion f can decay and emit a neutrino) . The energy spec-trum is thus expected to be continuous and extended up to Mχ . Muonneutrinos can be evidenced if they interact with the rock sufficiently close tothe Earth’s surface, producing an high energy muon (with a direction quitecollimated with the original neutrino and with about the same energy). Theinvestigation of the neutrinos produced in the Earth, for example, is focal-ized on the search of the up going muons with a direction pointing to centreof the Earth. The only possible background could be made by atmosphericneutrinos produced in the cosmic rays interactions with the atmosphere atthe opposite side of the Earth. Many experiment, designed mainly to studysolar or atmospheric neutrinos (SuperKamiokande, MACRO, AMANDA) orproperly proposed (ANTARES, AMANDA II, ICE CUBE), have been usedto search the signal of WIMP’s annihilation. At the moment, none of theexperiments has observed an excess of neutrinos from the Earth or the Sun.References:: [1],[4][27]
56
Chapter 3
WARP 2.3 liters
3.1 INTRODUCTION
As stressed in the previous chapter, the small cross section of WIMP-nucleusscattering requires a large mass detector. Moreover, an efficient backgroundrejection needs an event by event identification, in order to discriminate fewnuclear recoils from a large number of interactions induced by electrons.
The liquid Argon technology can provide both this features: it is possibleto build large mass detectors at low cost and the energy releasing mechanismin LAr has different aspects that could be influenced by the nature of theimpinging particle and by its energy. For example ionizing particles movingin liquid Argon can produce excitons and electron-ion pair along the track,and the measurement of their relative amounts leads to a clear identificationfor the reacting particle.
In this chapter, the effectiveness of LAr detector for Dark Matter searchis shown. After a brief presentation of the light emission mechanism in LAr,a description of the test chamber built by the WARP collaboration is given,with a presentation of the results of the tests in Pavia. The last part ofthe chapter is devoted to report the preliminary results of the data takingat Gran Sasso laboratory, which shows the effectiveness of the proposedtechnique.
3.2 LIQUID ARGON AS WIMP TARGET
Liquid Argon represents a good sensitive material to detect WIMPs. Asshown by the ICARUS collaboration, liquid Argon technology is matureenough and well supported at industrial level to realize large mass detectorswith the radio-purity required in rare event search. Moreover, the Argonnuclei have zero nuclear spin, thus avoiding any dependence on the spin-interaction models, and the form factor depression of the largest energyrecoils is relatively moderate for Argon (respect to Xe, for example). The
57
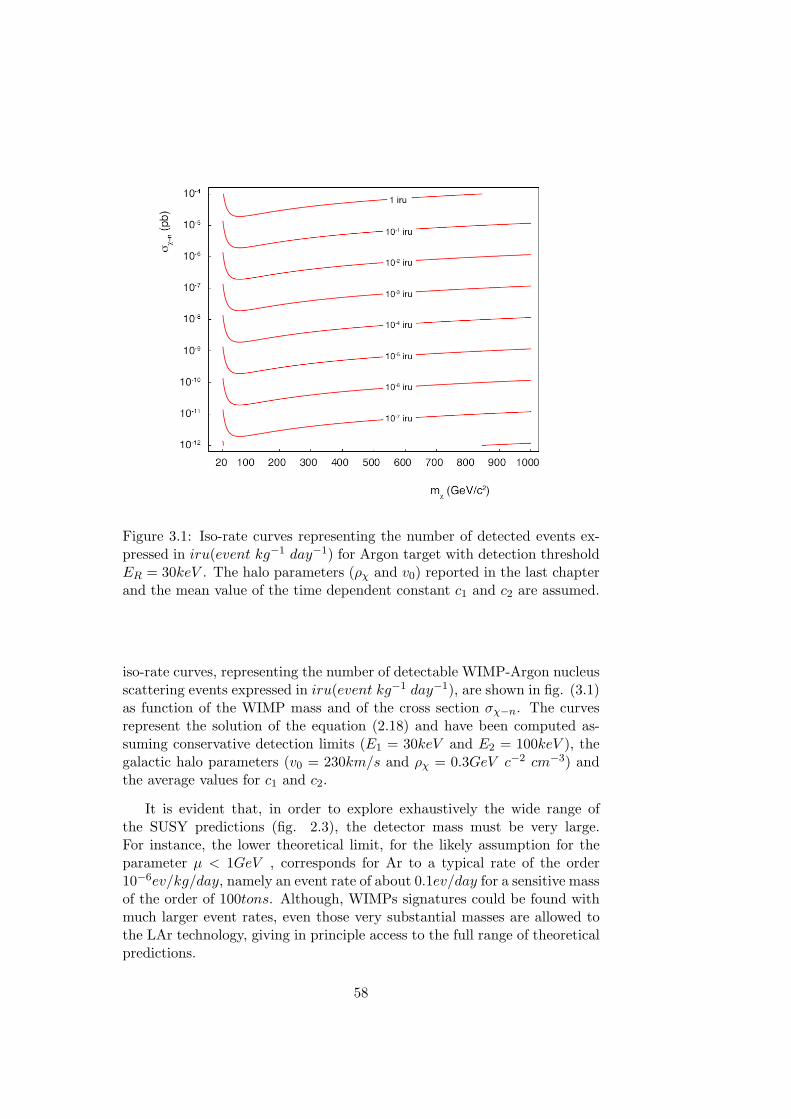
Figure 3.1: Iso-rate curves representing the number of detected events ex-pressed in iru(event kg−1 day−1) for Argon target with detection thresholdER = 30keV . The halo parameters (ρχ and v0) reported in the last chapterand the mean value of the time dependent constant c1 and c2 are assumed.
iso-rate curves, representing the number of detectable WIMP-Argon nucleusscattering events expressed in iru(event kg−1 day−1), are shown in fig. (3.1)as function of the WIMP mass and of the cross section σχ−n. The curvesrepresent the solution of the equation (2.18) and have been computed as-suming conservative detection limits (E1 = 30keV and E2 = 100keV ), thegalactic halo parameters (v0 = 230km/s and ρχ = 0.3GeV c−2 cm−3) andthe average values for c1 and c2.
It is evident that, in order to explore exhaustively the wide range ofthe SUSY predictions (fig. 2.3), the detector mass must be very large.For instance, the lower theoretical limit, for the likely assumption for theparameter µ < 1GeV , corresponds for Ar to a typical rate of the order10−6ev/kg/day, namely an event rate of about 0.1ev/day for a sensitive massof the order of 100tons. Although, WIMPs signatures could be found withmuch larger event rates, even those very substantial masses are allowed tothe LAr technology, giving in principle access to the full range of theoreticalpredictions.
58
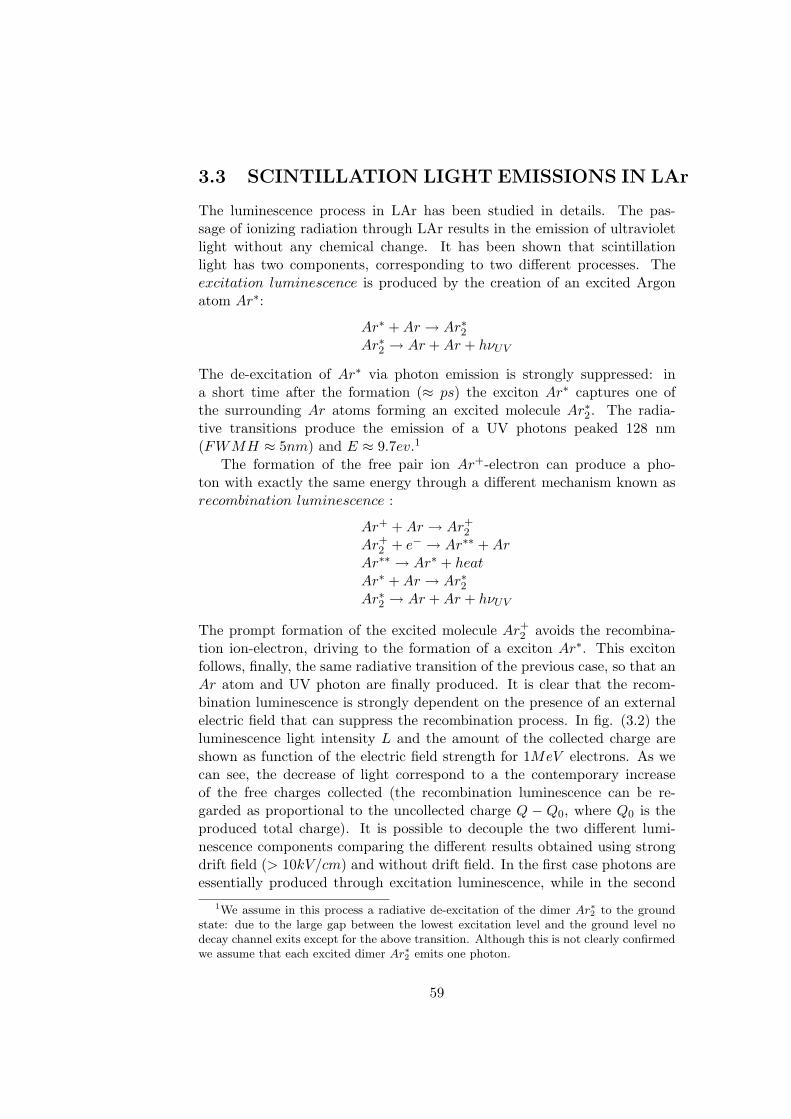
3.3 SCINTILLATION LIGHT EMISSIONS IN LAr
The luminescence process in LAr has been studied in details. The pas-sage of ionizing radiation through LAr results in the emission of ultravioletlight without any chemical change. It has been shown that scintillationlight has two components, corresponding to two different processes. Theexcitation luminescence is produced by the creation of an excited Argonatom Ar∗:
Ar∗ + Ar → Ar∗2Ar∗2 → Ar + Ar + hνUV
The de-excitation of Ar∗ via photon emission is strongly suppressed: ina short time after the formation (≈ ps) the exciton Ar∗ captures one ofthe surrounding Ar atoms forming an excited molecule Ar∗2. The radia-tive transitions produce the emission of a UV photons peaked 128 nm(FWMH ≈ 5nm) and E ≈ 9.7ev.1
The formation of the free pair ion Ar+-electron can produce a pho-ton with exactly the same energy through a different mechanism known asrecombination luminescence :
Ar+ + Ar → Ar+2
Ar+2 + e− → Ar∗∗ + Ar
Ar∗∗ → Ar∗ + heatAr∗ + Ar → Ar∗2Ar∗2 → Ar + Ar + hνUV
The prompt formation of the excited molecule Ar+2 avoids the recombina-
tion ion-electron, driving to the formation of a exciton Ar∗. This excitonfollows, finally, the same radiative transition of the previous case, so that anAr atom and UV photon are finally produced. It is clear that the recom-bination luminescence is strongly dependent on the presence of an externalelectric field that can suppress the recombination process. In fig. (3.2) theluminescence light intensity L and the amount of the collected charge areshown as function of the electric field strength for 1MeV electrons. As wecan see, the decrease of light correspond to a the contemporary increaseof the free charges collected (the recombination luminescence can be re-garded as proportional to the uncollected charge Q − Q0, where Q0 is theproduced total charge). It is possible to decouple the two different lumi-nescence components comparing the different results obtained using strongdrift field (> 10kV/cm) and without drift field. In the first case photons areessentially produced through excitation luminescence, while in the second
1We assume in this process a radiative de-excitation of the dimer Ar∗2 to the groundstate: due to the large gap between the lowest excitation level and the ground level nodecay channel exits except for the above transition. Although this is not clearly confirmedwe assume that each excited dimer Ar∗2 emits one photon.
59
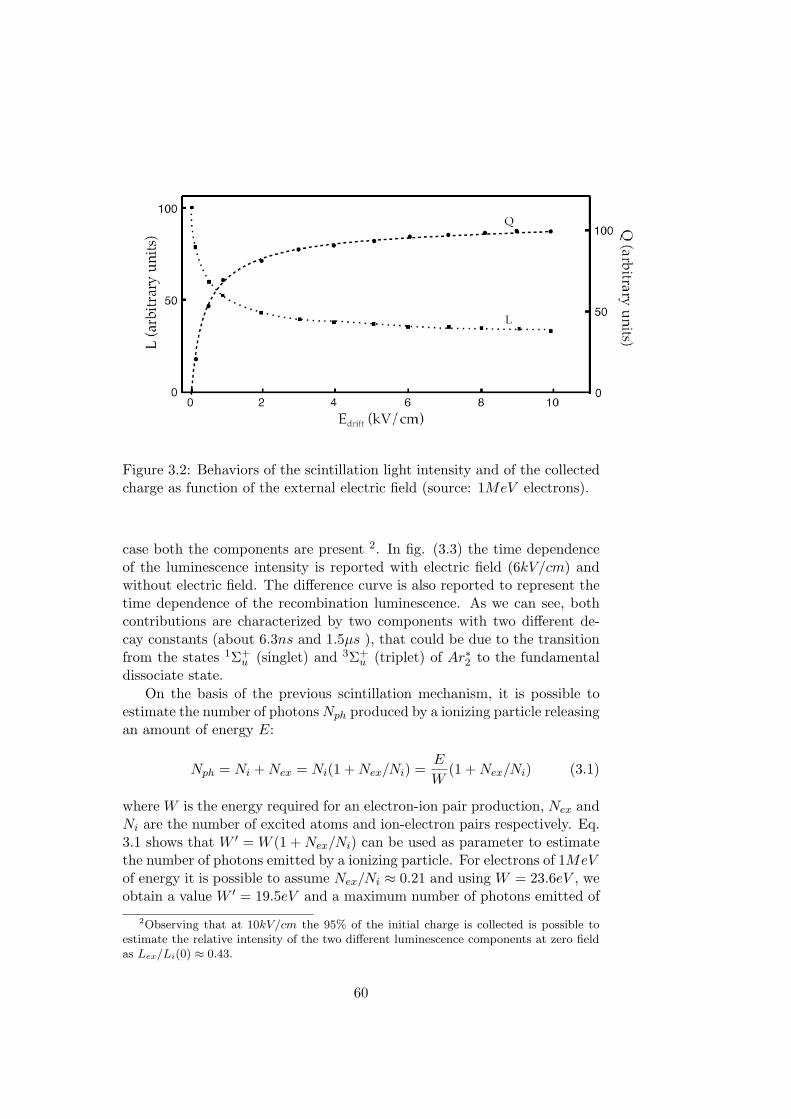
Figure 3.2: Behaviors of the scintillation light intensity and of the collectedcharge as function of the external electric field (source: 1MeV electrons).
case both the components are present 2. In fig. (3.3) the time dependenceof the luminescence intensity is reported with electric field (6kV/cm) andwithout electric field. The difference curve is also reported to represent thetime dependence of the recombination luminescence. As we can see, bothcontributions are characterized by two components with two different de-cay constants (about 6.3ns and 1.5µs ), that could be due to the transitionfrom the states 1Σ+
u (singlet) and 3Σ+u (triplet) of Ar∗2 to the fundamental
dissociate state.On the basis of the previous scintillation mechanism, it is possible to
estimate the number of photons Nph produced by a ionizing particle releasingan amount of energy E:
Nph = Ni + Nex = Ni(1 + Nex/Ni) =E
W(1 + Nex/Ni) (3.1)
where W is the energy required for an electron-ion pair production, Nex andNi are the number of excited atoms and ion-electron pairs respectively. Eq.3.1 shows that W ′ = W (1 + Nex/Ni) can be used as parameter to estimatethe number of photons emitted by a ionizing particle. For electrons of 1MeVof energy it is possible to assume Nex/Ni ≈ 0.21 and using W = 23.6eV , weobtain a value W ′ = 19.5eV and a maximum number of photons emitted of
2Observing that at 10kV/cm the 95% of the initial charge is collected is possible toestimate the relative intensity of the two different luminescence components at zero fieldas Lex/Li(0) ≈ 0.43.
60
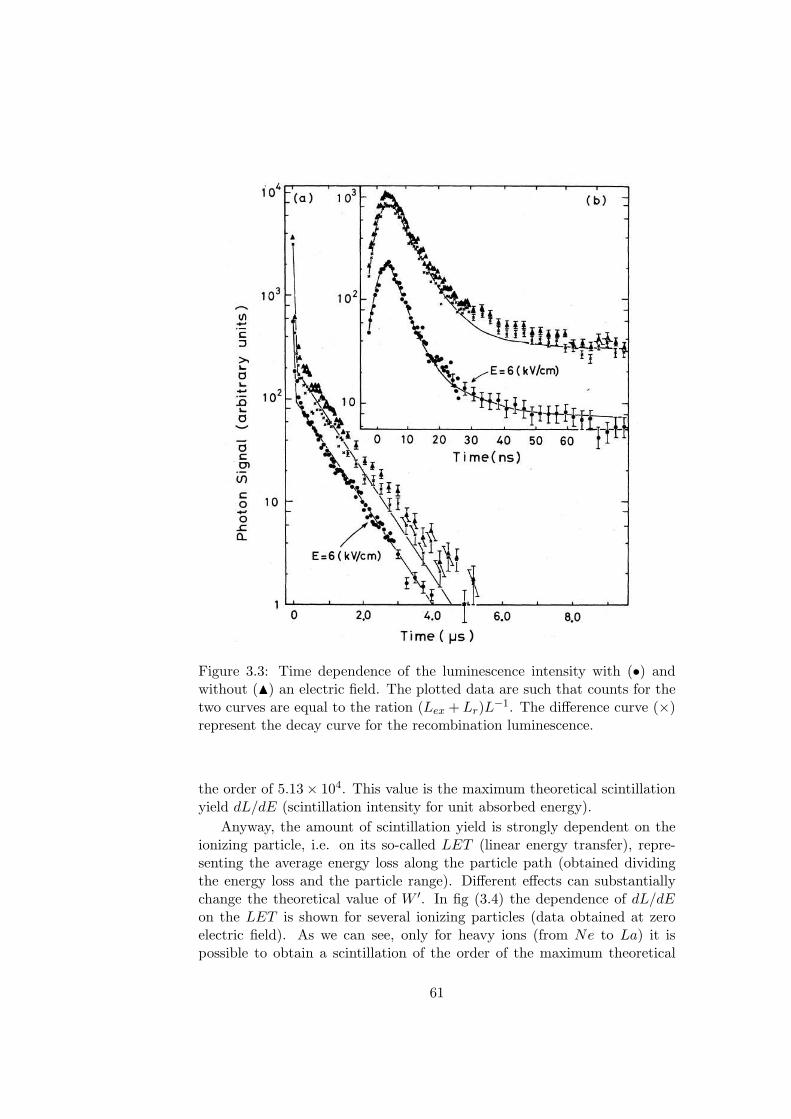
Figure 3.3: Time dependence of the luminescence intensity with (•) andwithout (N) an electric field. The plotted data are such that counts for thetwo curves are equal to the ration (Lex + Lr)L−1. The difference curve (×)represent the decay curve for the recombination luminescence.
the order of 5.13× 10⁴. This value is the maximum theoretical scintillationyield dL/dE (scintillation intensity for unit absorbed energy).
Anyway, the amount of scintillation yield is strongly dependent on theionizing particle, i.e. on its so-called LET (linear energy transfer), repre-senting the average energy loss along the particle path (obtained dividingthe energy loss and the particle range). Different effects can substantiallychange the theoretical value of W ′. In fig (3.4) the dependence of dL/dEon the LET is shown for several ionizing particles (data obtained at zeroelectric field). As we can see, only for heavy ions (from Ne to La) it ispossible to obtain a scintillation of the order of the maximum theoretical
61
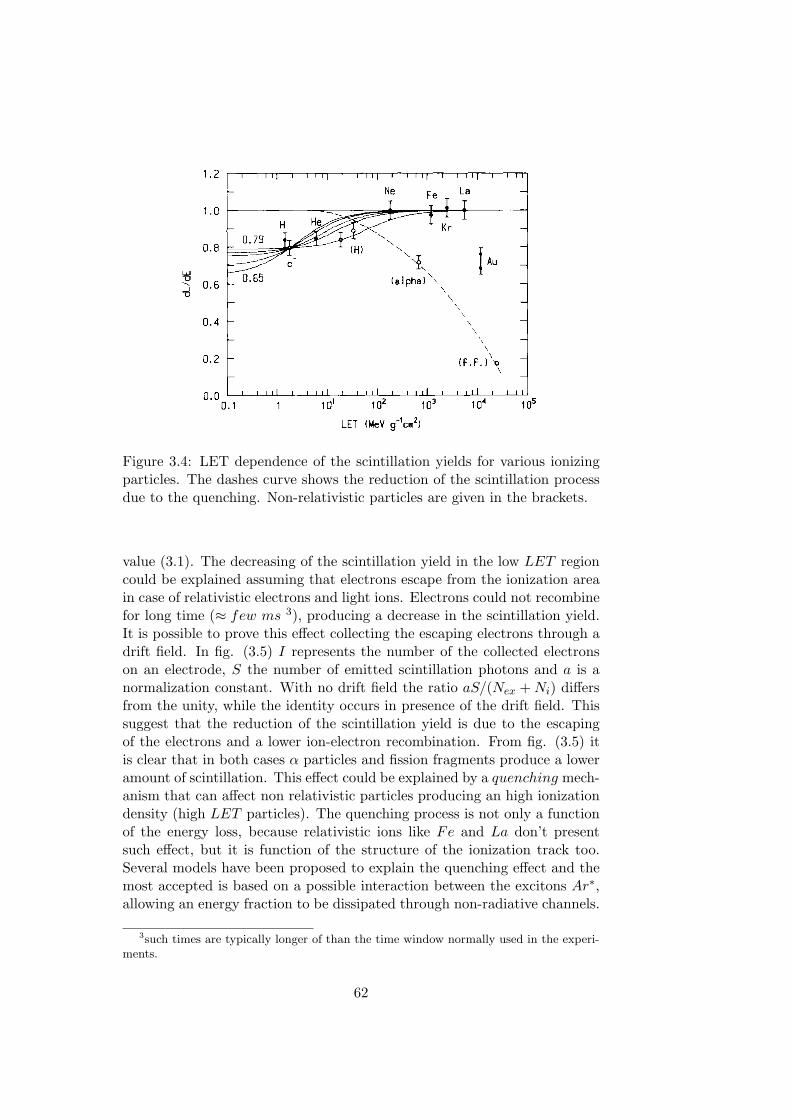
Figure 3.4: LET dependence of the scintillation yields for various ionizingparticles. The dashes curve shows the reduction of the scintillation processdue to the quenching. Non-relativistic particles are given in the brackets.
value (3.1). The decreasing of the scintillation yield in the low LET regioncould be explained assuming that electrons escape from the ionization areain case of relativistic electrons and light ions. Electrons could not recombinefor long time (≈ few ms 3), producing a decrease in the scintillation yield.It is possible to prove this effect collecting the escaping electrons through adrift field. In fig. (3.5) I represents the number of the collected electronson an electrode, S the number of emitted scintillation photons and a is anormalization constant. With no drift field the ratio aS/(Nex + Ni) differsfrom the unity, while the identity occurs in presence of the drift field. Thissuggest that the reduction of the scintillation yield is due to the escapingof the electrons and a lower ion-electron recombination. From fig. (3.5) itis clear that in both cases α particles and fission fragments produce a loweramount of scintillation. This effect could be explained by a quenching mech-anism that can affect non relativistic particles producing an high ionizationdensity (high LET particles). The quenching process is not only a functionof the energy loss, because relativistic ions like Fe and La don’t presentsuch effect, but it is function of the structure of the ionization track too.Several models have been proposed to explain the quenching effect and themost accepted is based on a possible interaction between the excitons Ar∗,allowing an energy fraction to be dissipated through non-radiative channels.
3such times are typically longer of than the time window normally used in the experi-ments.
62
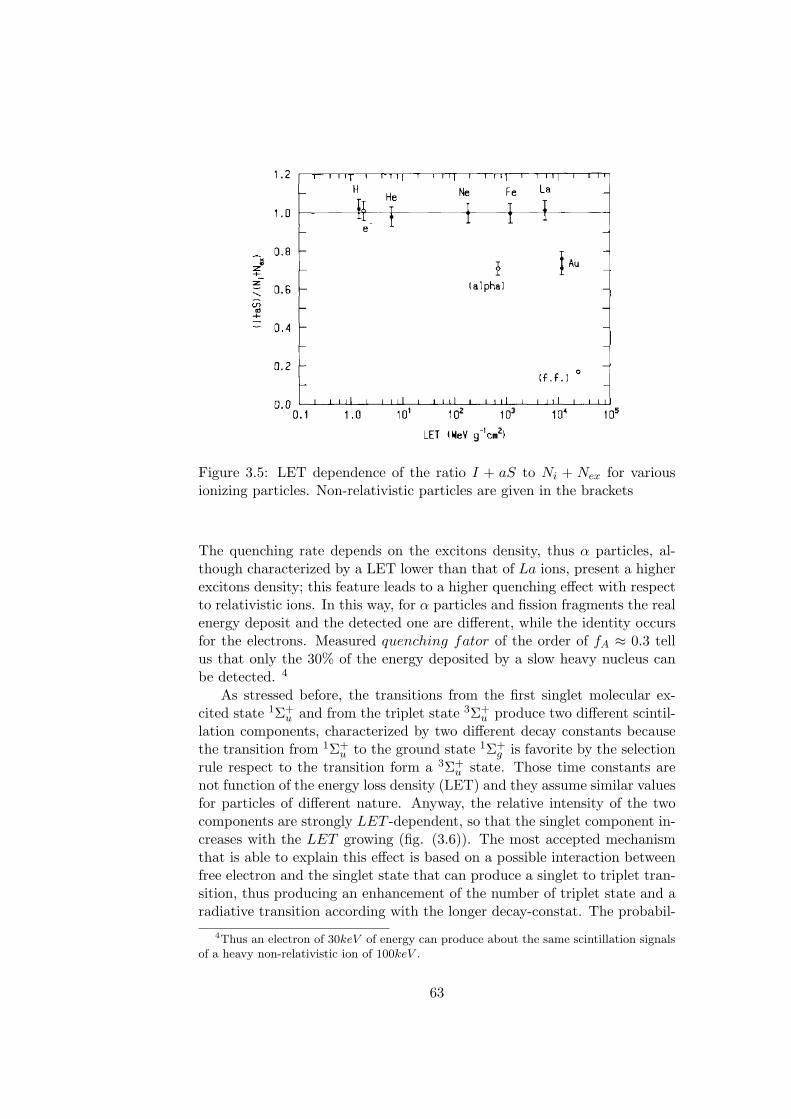
Figure 3.5: LET dependence of the ratio I + aS to Ni + Nex for variousionizing particles. Non-relativistic particles are given in the brackets
The quenching rate depends on the excitons density, thus α particles, al-though characterized by a LET lower than that of La ions, present a higherexcitons density; this feature leads to a higher quenching effect with respectto relativistic ions. In this way, for α particles and fission fragments the realenergy deposit and the detected one are different, while the identity occursfor the electrons. Measured quenching fator of the order of fA ≈ 0.3 tellus that only the 30% of the energy deposited by a slow heavy nucleus canbe detected. 4
As stressed before, the transitions from the first singlet molecular ex-cited state 1Σ+
u and from the triplet state 3Σ+u produce two different scintil-
lation components, characterized by two different decay constants becausethe transition from 1Σ+
u to the ground state 1Σ+g is favorite by the selection
rule respect to the transition form a 3Σ+u state. Those time constants are
not function of the energy loss density (LET) and they assume similar valuesfor particles of different nature. Anyway, the relative intensity of the twocomponents are strongly LET -dependent, so that the singlet component in-creases with the LET growing (fig. (3.6)). The most accepted mechanismthat is able to explain this effect is based on a possible interaction betweenfree electron and the singlet state that can produce a singlet to triplet tran-sition, thus producing an enhancement of the number of triplet state and aradiative transition according with the longer decay-constat. The probabil-
4Thus an electron of 30keV of energy can produce about the same scintillation signalsof a heavy non-relativistic ion of 100keV .
63
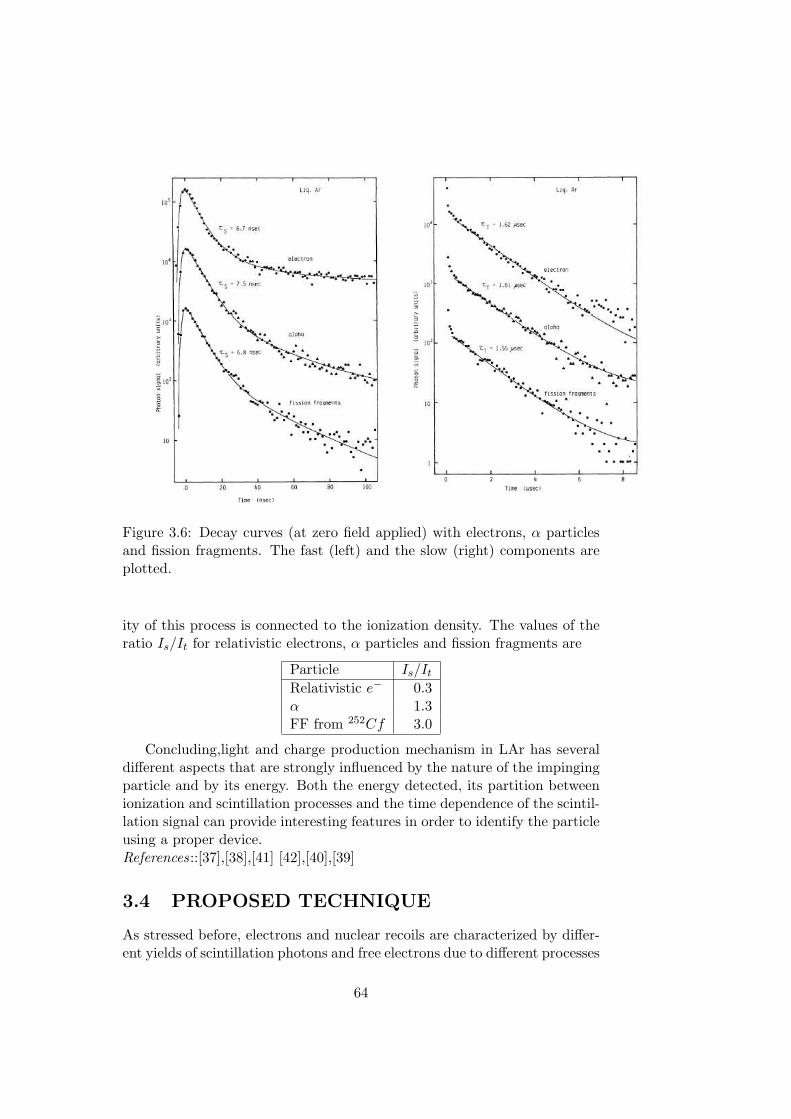
Figure 3.6: Decay curves (at zero field applied) with electrons, α particlesand fission fragments. The fast (left) and the slow (right) components areplotted.
ity of this process is connected to the ionization density. The values of theratio Is/It for relativistic electrons, α particles and fission fragments are
Particle Is/It
Relativistic e− 0.3α 1.3FF from 252Cf 3.0
Concluding,light and charge production mechanism in LAr has severaldifferent aspects that are strongly influenced by the nature of the impingingparticle and by its energy. Both the energy detected, its partition betweenionization and scintillation processes and the time dependence of the scintil-lation signal can provide interesting features in order to identify the particleusing a proper device.References::[37],[38],[41] [42],[40],[39]
3.4 PROPOSED TECHNIQUE
As stressed before, electrons and nuclear recoils are characterized by differ-ent yields of scintillation photons and free electrons due to different processes
64
of energy release in LAr, giving in this way the possibility to determine thenature of the particle reacting in the chamber. Thus the proposed techniqueis based on the discrimination of the impinging particle through the mea-suring of the ratio between scintillation light and ionization charge, evenif, in case of nuclear recoils, only few hundreds of ionization electrons areproduced and only a small fraction (typically of the order of few units) cansurvive to the recombination process.
The WARP prototype is an Argon double-phase drift chamber, in whicha set of photomultipliers allows the collection of scintillation photons pro-duced in both phases. The liquid volume is the sensitive element of thechamber, where the interactions in LAr produce scintillation photons (at128nm of wavelength) and ionization electrons. The chamber set-up hasbeen realized suitably to allow the simultaneous measure of both photonsand electrons. The main experimental difficulty is the small number of elec-trons produced in nuclear recoil interactions (at 1kV/cm only few units offree electrons can survive to the strong recombination and can be collected).To detect the ionization signal, electrons are extracted toward the interfaceliquid-gas using a drift field and then accelerated in a high field region, thusproducing a luminescence signal in gas. In this way the scintillation photonsproduced in the liquid phase (primary scintillation) could be followed by an-other light signal (secondary scintillation) produced in the gaseous phase,proportional to the initial ionization charge. Both signals are detected by thesame photomultipliers, and the delay of the secondary emission respect tothe primary emission can be used to estimate the distance of the interactionfrom the interface.
This technique has been evaluated during preliminary tests at PaviaUniversity. A chamber of 2.3l of the sensitive volume has been realizedinitially in order to verify the possibility of the simultaneous detection ofscintillation photons and ionization electrons produced in the liquid phase,through the detection of the double light signals. During preliminary testsin Pavia, the chamber has been exposed to both γ and neutrons sources, inorder to study the responses to different interactions in the sensitive volume(such as electrons recoils induced by Compton scattering and nuclear recoilsproduced by the elastic scattering of neutrons over nuclei) . Without driftfield it has been possible to measure the photon yield (average number ofphotoelectrons produced per energy unit) for different sources, to get anenergy calibration of the chamber, and, using the drift field, the proposeddiscrimination technique between nuclear recoil and electronic events hasbeen tested.
At the end of the R&D period the prototype has been installed in anunderground hall of the National Laboratory of Gran Sasso (LNGS) to studyits performances in a low background environment.
65
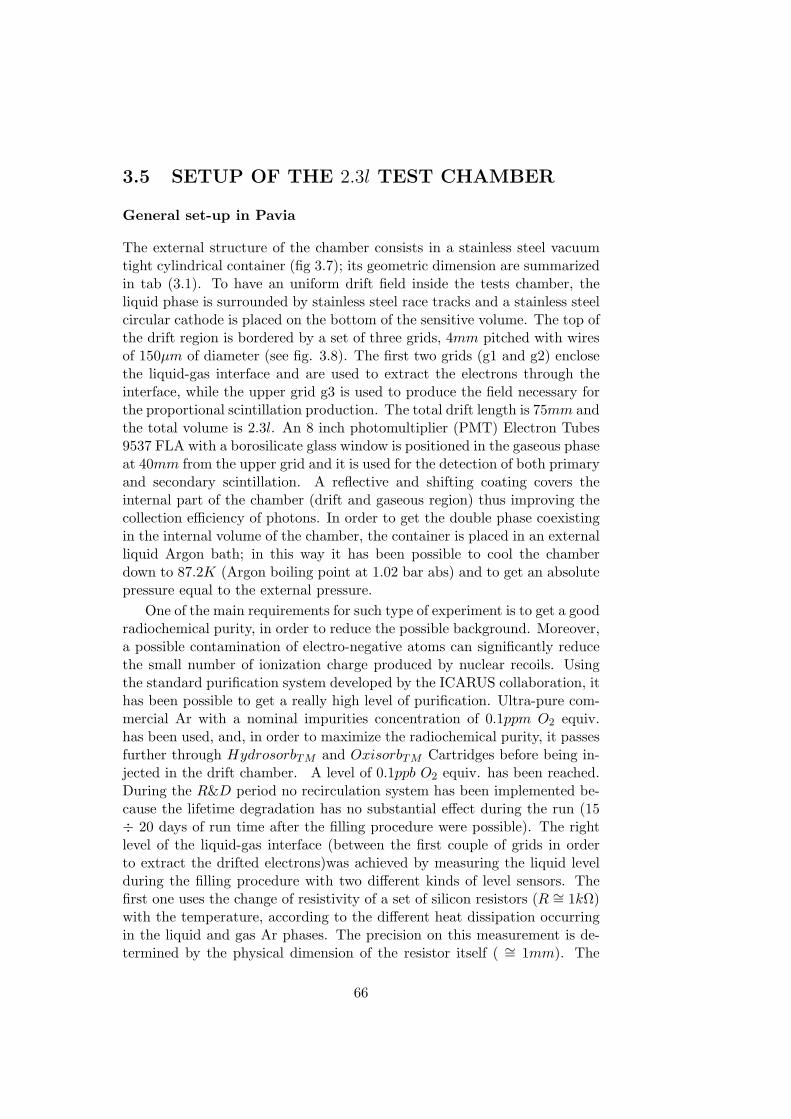
3.5 SETUP OF THE 2.3l TEST CHAMBER
General set-up in Pavia
The external structure of the chamber consists in a stainless steel vacuumtight cylindrical container (fig 3.7); its geometric dimension are summarizedin tab (3.1). To have an uniform drift field inside the tests chamber, theliquid phase is surrounded by stainless steel race tracks and a stainless steelcircular cathode is placed on the bottom of the sensitive volume. The top ofthe drift region is bordered by a set of three grids, 4mm pitched with wiresof 150µm of diameter (see fig. 3.8). The first two grids (g1 and g2) enclosethe liquid-gas interface and are used to extract the electrons through theinterface, while the upper grid g3 is used to produce the field necessary forthe proportional scintillation production. The total drift length is 75mm andthe total volume is 2.3l. An 8 inch photomultiplier (PMT) Electron Tubes9537 FLA with a borosilicate glass window is positioned in the gaseous phaseat 40mm from the upper grid and it is used for the detection of both primaryand secondary scintillation. A reflective and shifting coating covers theinternal part of the chamber (drift and gaseous region) thus improving thecollection efficiency of photons. In order to get the double phase coexistingin the internal volume of the chamber, the container is placed in an externalliquid Argon bath; in this way it has been possible to cool the chamberdown to 87.2K (Argon boiling point at 1.02 bar abs) and to get an absolutepressure equal to the external pressure.
One of the main requirements for such type of experiment is to get a goodradiochemical purity, in order to reduce the possible background. Moreover,a possible contamination of electro-negative atoms can significantly reducethe small number of ionization charge produced by nuclear recoils. Usingthe standard purification system developed by the ICARUS collaboration, ithas been possible to get a really high level of purification. Ultra-pure com-mercial Ar with a nominal impurities concentration of 0.1ppm O2 equiv.has been used, and, in order to maximize the radiochemical purity, it passesfurther through HydrosorbTM and OxisorbTM Cartridges before being in-jected in the drift chamber. A level of 0.1ppb O2 equiv. has been reached.During the R&D period no recirculation system has been implemented be-cause the lifetime degradation has no substantial effect during the run (15÷ 20 days of run time after the filling procedure were possible). The rightlevel of the liquid-gas interface (between the first couple of grids in orderto extract the drifted electrons)was achieved by measuring the liquid levelduring the filling procedure with two different kinds of level sensors. Thefirst one uses the change of resistivity of a set of silicon resistors (R ∼= 1kΩ)with the temperature, according to the different heat dissipation occurringin the liquid and gas Ar phases. The precision on this measurement is de-termined by the physical dimension of the resistor itself ( ∼= 1mm). The
66
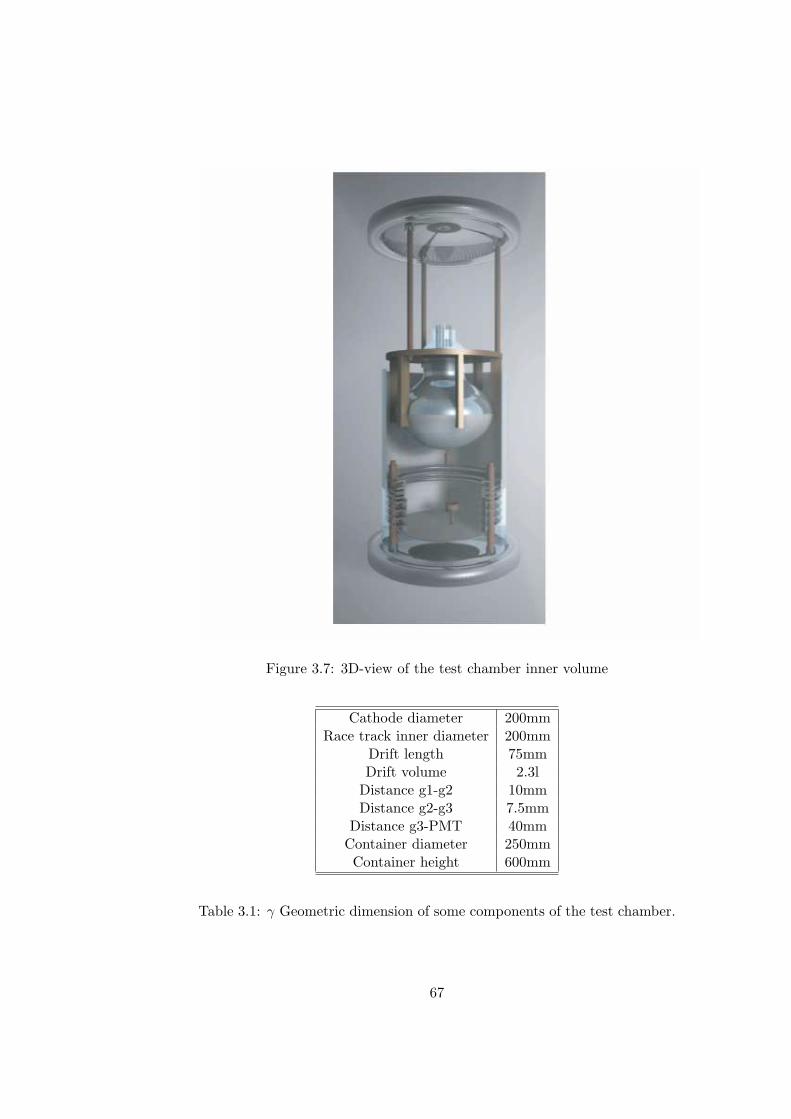
Figure 3.7: 3D-view of the test chamber inner volume
Cathode diameter 200mmRace track inner diameter 200mm
Drift length 75mmDrift volume 2.3l
Distance g1-g2 10mmDistance g2-g3 7.5mm
Distance g3-PMT 40mmContainer diameter 250mmContainer height 600mm
Table 3.1: γ Geometric dimension of some components of the test chamber.
67
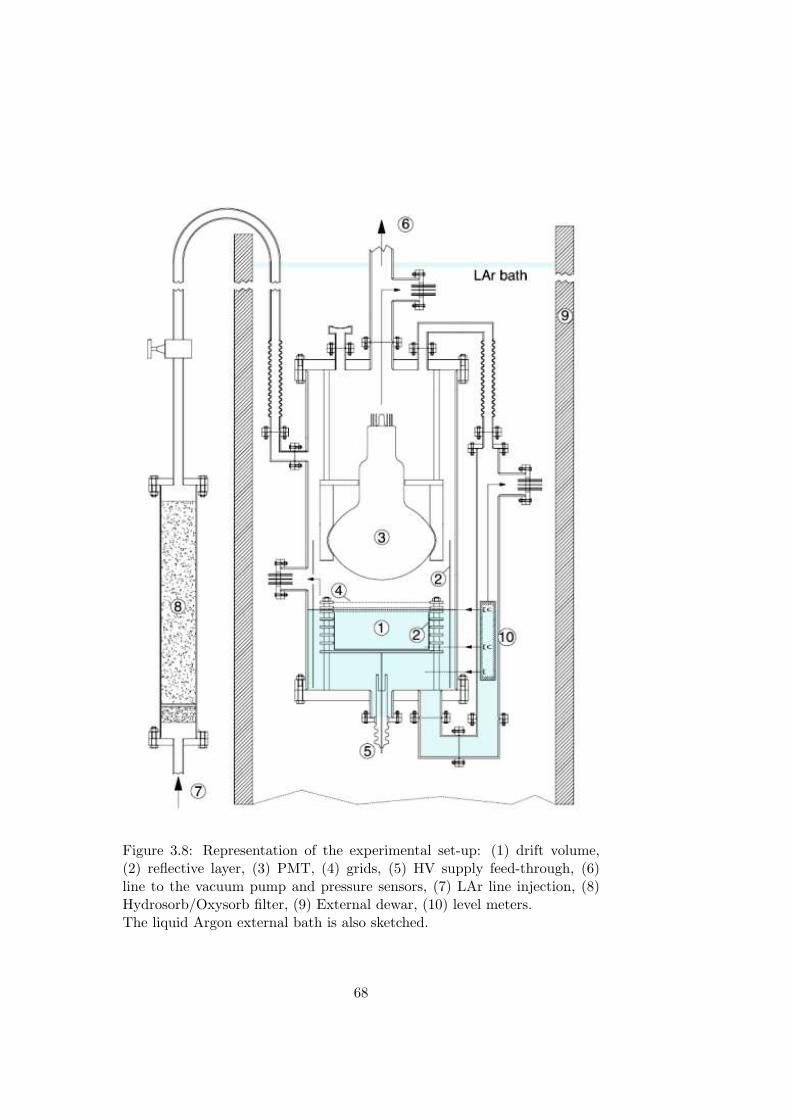
Figure 3.8: Representation of the experimental set-up: (1) drift volume,(2) reflective layer, (3) PMT, (4) grids, (5) HV supply feed-through, (6)line to the vacuum pump and pressure sensors, (7) LAr line injection, (8)Hydrosorb/Oxysorb filter, (9) External dewar, (10) level meters.The liquid Argon external bath is also sketched.
68
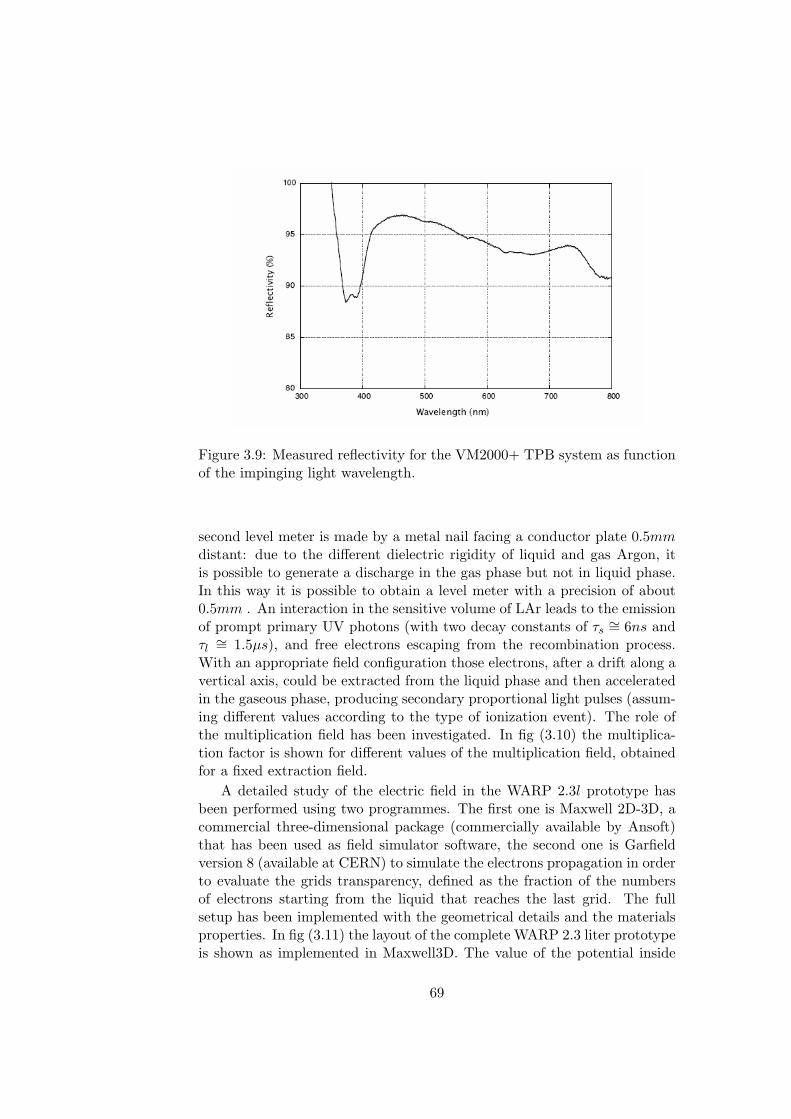
Figure 3.9: Measured reflectivity for the VM2000+ TPB system as functionof the impinging light wavelength.
second level meter is made by a metal nail facing a conductor plate 0.5mmdistant: due to the different dielectric rigidity of liquid and gas Argon, itis possible to generate a discharge in the gas phase but not in liquid phase.In this way it is possible to obtain a level meter with a precision of about0.5mm . An interaction in the sensitive volume of LAr leads to the emissionof prompt primary UV photons (with two decay constants of τs
∼= 6ns andτl∼= 1.5µs), and free electrons escaping from the recombination process.
With an appropriate field configuration those electrons, after a drift along avertical axis, could be extracted from the liquid phase and then acceleratedin the gaseous phase, producing secondary proportional light pulses (assum-ing different values according to the type of ionization event). The role ofthe multiplication field has been investigated. In fig (3.10) the multiplica-tion factor is shown for different values of the multiplication field, obtainedfor a fixed extraction field.
A detailed study of the electric field in the WARP 2.3l prototype hasbeen performed using two programmes. The first one is Maxwell 2D-3D, acommercial three-dimensional package (commercially available by Ansoft)that has been used as field simulator software, the second one is Garfieldversion 8 (available at CERN) to simulate the electrons propagation in orderto evaluate the grids transparency, defined as the fraction of the numbersof electrons starting from the liquid that reaches the last grid. The fullsetup has been implemented with the geometrical details and the materialsproperties. In fig (3.11) the layout of the complete WARP 2.3 liter prototypeis shown as implemented in Maxwell3D. The value of the potential inside
69
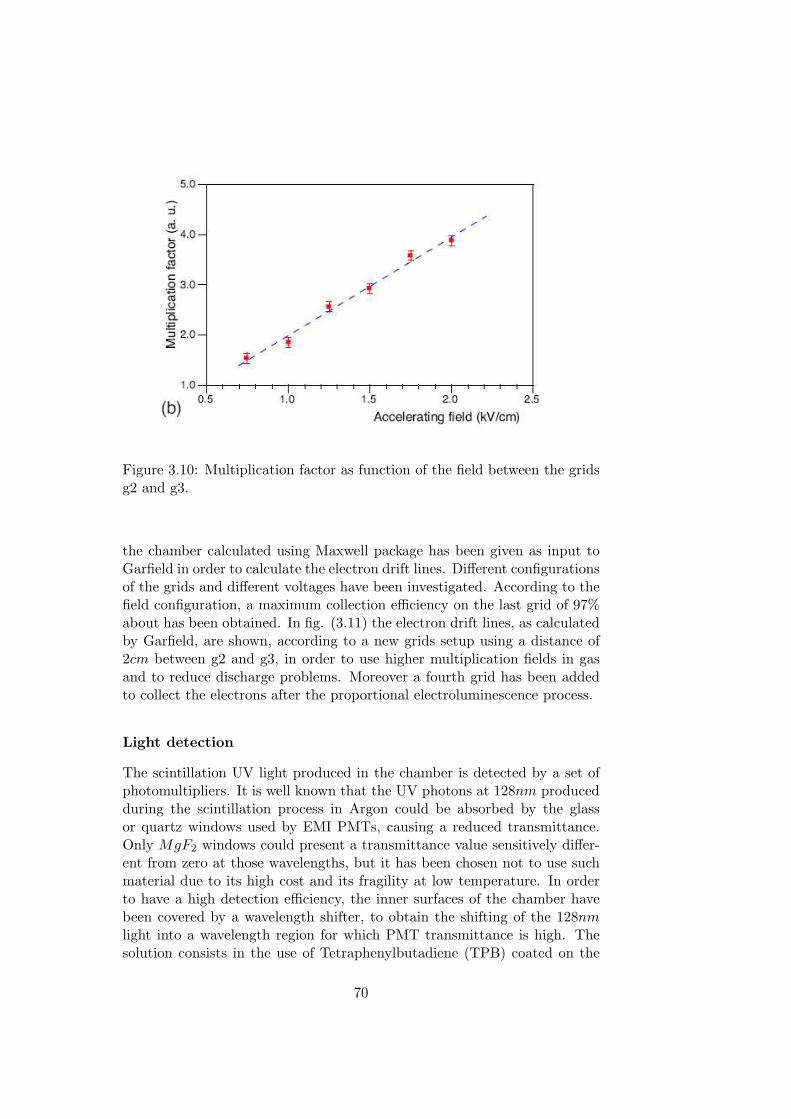
Figure 3.10: Multiplication factor as function of the field between the gridsg2 and g3.
the chamber calculated using Maxwell package has been given as input toGarfield in order to calculate the electron drift lines. Different configurationsof the grids and different voltages have been investigated. According to thefield configuration, a maximum collection efficiency on the last grid of 97%about has been obtained. In fig. (3.11) the electron drift lines, as calculatedby Garfield, are shown, according to a new grids setup using a distance of2cm between g2 and g3, in order to use higher multiplication fields in gasand to reduce discharge problems. Moreover a fourth grid has been addedto collect the electrons after the proportional electroluminescence process.
Light detection
The scintillation UV light produced in the chamber is detected by a set ofphotomultipliers. It is well known that the UV photons at 128nm producedduring the scintillation process in Argon could be absorbed by the glassor quartz windows used by EMI PMTs, causing a reduced transmittance.Only MgF2 windows could present a transmittance value sensitively differ-ent from zero at those wavelengths, but it has been chosen not to use suchmaterial due to its high cost and its fragility at low temperature. In orderto have a high detection efficiency, the inner surfaces of the chamber havebeen covered by a wavelength shifter, to obtain the shifting of the 128nmlight into a wavelength region for which PMT transmittance is high. Thesolution consists in the use of Tetraphenylbutadiene (TPB) coated on the
70
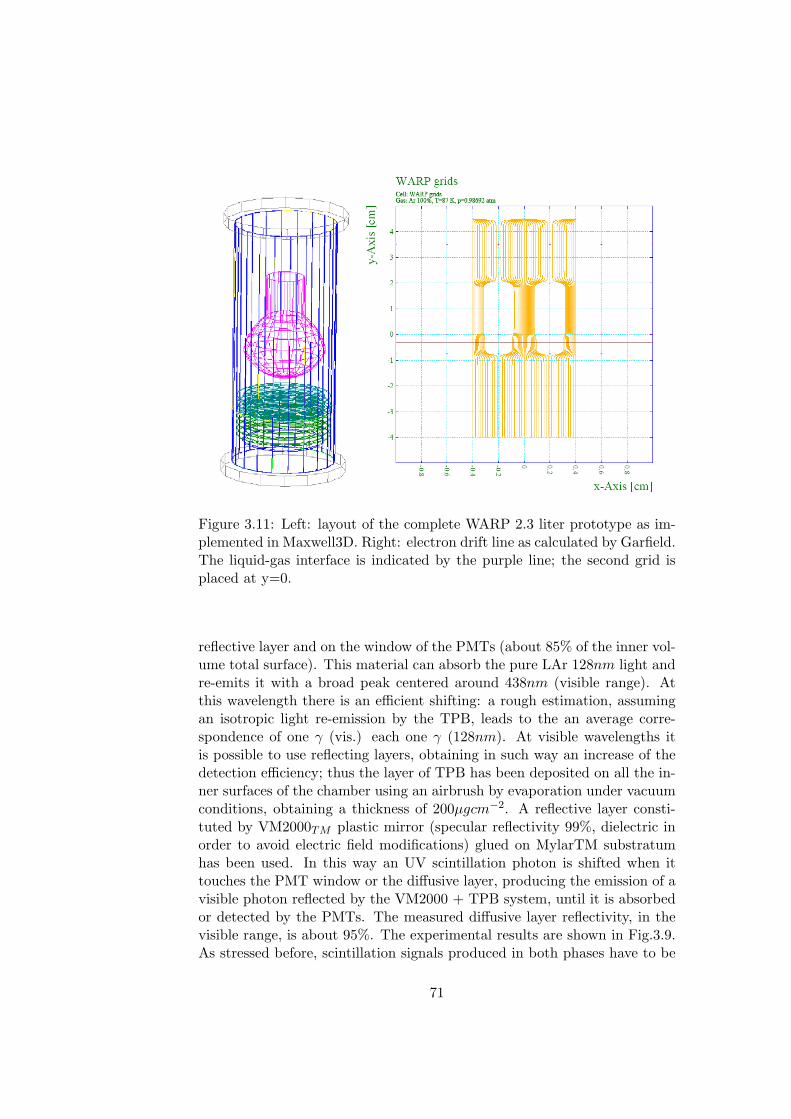
Figure 3.11: Left: layout of the complete WARP 2.3 liter prototype as im-plemented in Maxwell3D. Right: electron drift line as calculated by Garfield.The liquid-gas interface is indicated by the purple line; the second grid isplaced at y=0.
reflective layer and on the window of the PMTs (about 85% of the inner vol-ume total surface). This material can absorb the pure LAr 128nm light andre-emits it with a broad peak centered around 438nm (visible range). Atthis wavelength there is an efficient shifting: a rough estimation, assumingan isotropic light re-emission by the TPB, leads to the an average corre-spondence of one γ (vis.) each one γ (128nm). At visible wavelengths itis possible to use reflecting layers, obtaining in such way an increase of thedetection efficiency; thus the layer of TPB has been deposited on all the in-ner surfaces of the chamber using an airbrush by evaporation under vacuumconditions, obtaining a thickness of 200µgcm−2. A reflective layer consti-tuted by VM2000TM plastic mirror (specular reflectivity 99%, dielectric inorder to avoid electric field modifications) glued on MylarTM substratumhas been used. In this way an UV scintillation photon is shifted when ittouches the PMT window or the diffusive layer, producing the emission of avisible photon reflected by the VM2000 + TPB system, until it is absorbedor detected by the PMTs. The measured diffusive layer reflectivity, in thevisible range, is about 95%. The experimental results are shown in Fig.3.9.As stressed before, scintillation signals produced in both phases have to be
71
detected. A photomultiplier, facing the multiplication region, detects bothdirect and reflected light (by the diffusive layer surrounding the sensitivevolume) produced as primary and secondary scintillation. An 8 inch photo-multiplier (PMT) Electron Tubes 9537 FLA with a borosilicate glass windowpositioned in the gaseous phase has been used. Details about the ElectronTubes photomultipliers are reported in chapter 5. The contemporary de-tection of primary and secondary scintillation provides interesting features,allowing the investigation of some characteristic of the interaction events.The separation in time between primary signal and secondary scintillationis proportional to the time required to the electrons to drift from the inter-action point to the surface. Thus such measurement allows the localizationalong the drift direction of the event. Moreover, the amount of the scintilla-tion emissions are strictly dependent on the the kind of event (beyond to thefield magnitudes). For example, for muons crossing the sensitive volume, theprimary light is followed by a long train of secondary photons that lasts forthe total drift time. The ratio between the number of photon emitted dur-ing both secondary and primary scintillation processes N2/N1 can be usedto determine the type of reacting particle. Different amounts of excitationand ionization produced by different particles generate a diverse numbersN1 and N2 of photons, allowing, in this way, the identification of the parti-cle. According to the discrimination of the particle, the absolute number ofprimary electrons can be used to measure the energy of the particle reactingin the chamber.
3.6 DATA ACQUISITION
To acquire the signals of the primary scintillation, the charge coming fromthe output of the PMTs is integrated and converted to a voltage signal us-ing a inverting preamplifier Canberra mod. 2005. The preamplifier has twodifferent conversion values (4.5mV/pC or 22.7mV/pC) with a rise time ofabout 15ns and a fall time of about 50µs. The integrated signal coming fromthe preamplifier is shown in fig 3.12. As we can see, two peaks correspond-ing to primary and secondary scintillation are clearly visible. The voltageoutput is proportional, for fast signals, to the number of photoelectrons. Toget a secondary signal proportional to the input charge, the amplitude of thesecond peak must be subtracted by the contribution of the first peak andcorrected for lifetime degradation depending on the position along the ver-tical axis. We can define S1 and S2 the amplitude of the primary signal andthe corrected secondary signal. The output of the Canberra preamplifier issent to an ORTEC 570 amplifier. The signal is shaped at 6µs sufficiently tocontain all the primary photons (primary light has a slow component witha decay constant of 1.5µs). A multichannel analyzer is used to acquire theamplifier’s output, providing in this way the number of counts for each chan-
72
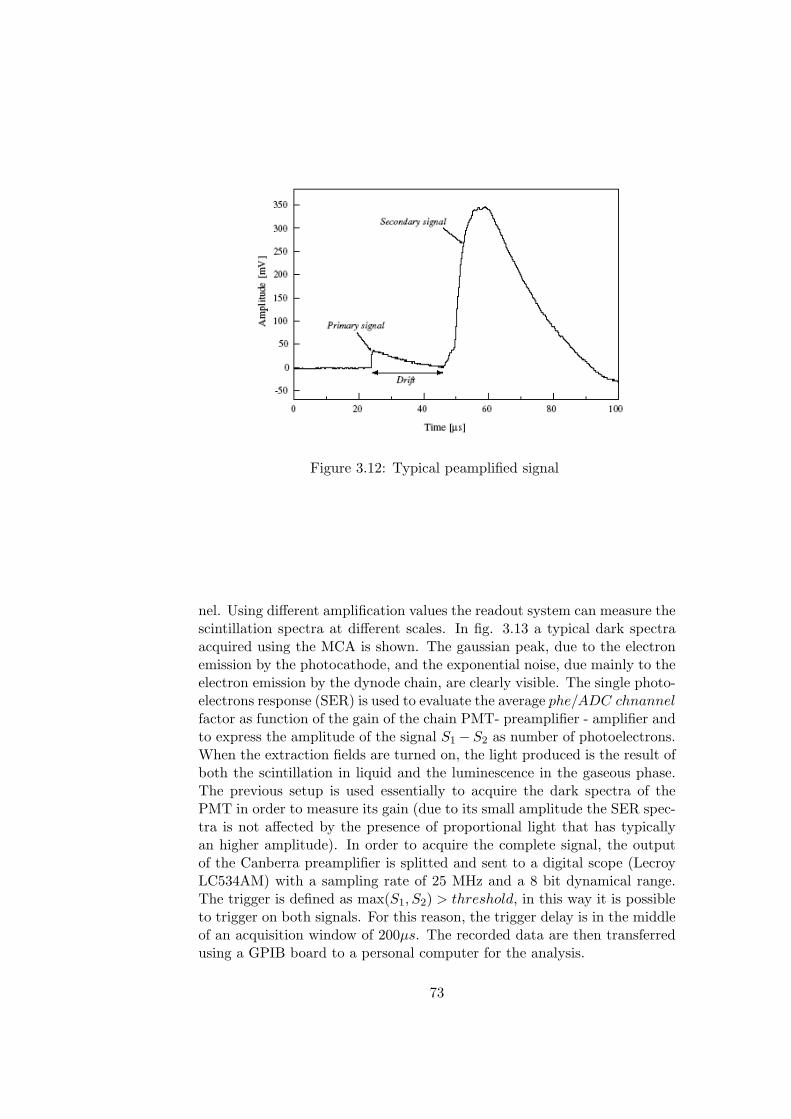
Figure 3.12: Typical peamplified signal
nel. Using different amplification values the readout system can measure thescintillation spectra at different scales. In fig. 3.13 a typical dark spectraacquired using the MCA is shown. The gaussian peak, due to the electronemission by the photocathode, and the exponential noise, due mainly to theelectron emission by the dynode chain, are clearly visible. The single photo-electrons response (SER) is used to evaluate the average phe/ADC chnannelfactor as function of the gain of the chain PMT- preamplifier - amplifier andto express the amplitude of the signal S1− S2 as number of photoelectrons.When the extraction fields are turned on, the light produced is the result ofboth the scintillation in liquid and the luminescence in the gaseous phase.The previous setup is used essentially to acquire the dark spectra of thePMT in order to measure its gain (due to its small amplitude the SER spec-tra is not affected by the presence of proportional light that has typicallyan higher amplitude). In order to acquire the complete signal, the outputof the Canberra preamplifier is splitted and sent to a digital scope (LecroyLC534AM) with a sampling rate of 25 MHz and a 8 bit dynamical range.The trigger is defined as max(S1, S2) > threshold, in this way it is possibleto trigger on both signals. For this reason, the trigger delay is in the middleof an acquisition window of 200µs. The recorded data are then transferredusing a GPIB board to a personal computer for the analysis.
73
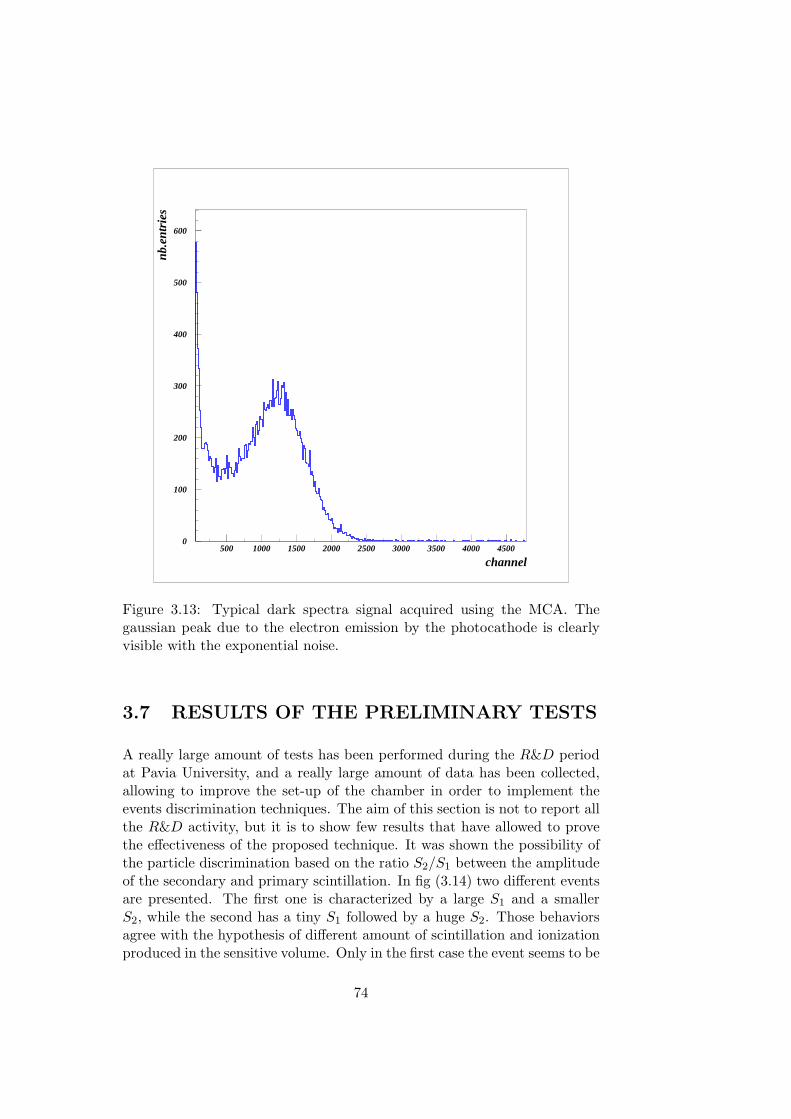
channel
nb.e
ntri
es
0
100
200
300
400
500
600
500 1000 1500 2000 2500 3000 3500 4000 4500
Figure 3.13: Typical dark spectra signal acquired using the MCA. Thegaussian peak due to the electron emission by the photocathode is clearlyvisible with the exponential noise.
3.7 RESULTS OF THE PRELIMINARY TESTS
A really large amount of tests has been performed during the R&D periodat Pavia University, and a really large amount of data has been collected,allowing to improve the set-up of the chamber in order to implement theevents discrimination techniques. The aim of this section is not to report allthe R&D activity, but it is to show few results that have allowed to provethe effectiveness of the proposed technique. It was shown the possibility ofthe particle discrimination based on the ratio S2/S1 between the amplitudeof the secondary and primary scintillation. In fig (3.14) two different eventsare presented. The first one is characterized by a large S1 and a smallerS2, while the second has a tiny S1 followed by a huge S2. Those behaviorsagree with the hypothesis of different amount of scintillation and ionizationproduced in the sensitive volume. Only in the first case the event seems to be
74
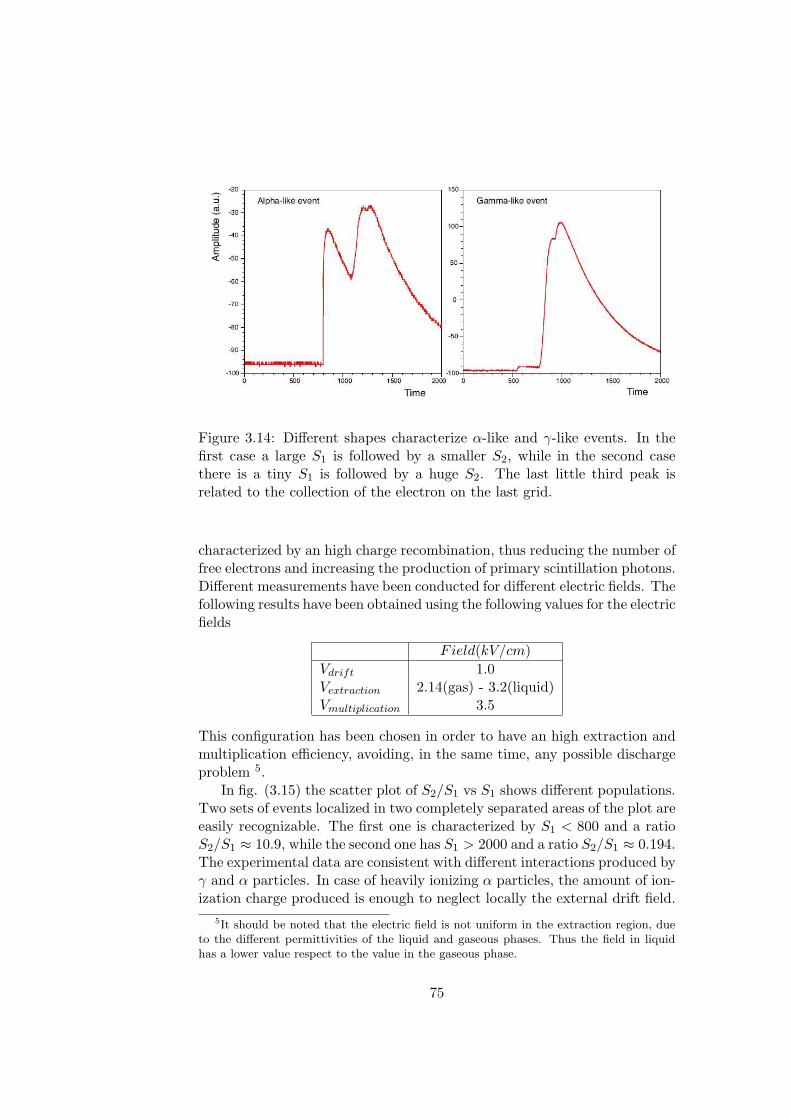
Figure 3.14: Different shapes characterize α-like and γ-like events. In thefirst case a large S1 is followed by a smaller S2, while in the second casethere is a tiny S1 is followed by a huge S2. The last little third peak isrelated to the collection of the electron on the last grid.
characterized by an high charge recombination, thus reducing the number offree electrons and increasing the production of primary scintillation photons.Different measurements have been conducted for different electric fields. Thefollowing results have been obtained using the following values for the electricfields
Field(kV/cm)Vdrift 1.0Vextraction 2.14(gas) - 3.2(liquid)Vmultiplication 3.5
This configuration has been chosen in order to have an high extraction andmultiplication efficiency, avoiding, in the same time, any possible dischargeproblem 5.
In fig. (3.15) the scatter plot of S2/S1 vs S1 shows different populations.Two sets of events localized in two completely separated areas of the plot areeasily recognizable. The first one is characterized by S1 < 800 and a ratioS2/S1 ≈ 10.9, while the second one has S1 > 2000 and a ratio S2/S1 ≈ 0.194.The experimental data are consistent with different interactions produced byγ and α particles. In case of heavily ionizing α particles, the amount of ion-ization charge produced is enough to neglect locally the external drift field.
5It should be noted that the electric field is not uniform in the extraction region, dueto the different permittivities of the liquid and gaseous phases. Thus the field in liquidhas a lower value respect to the value in the gaseous phase.
75
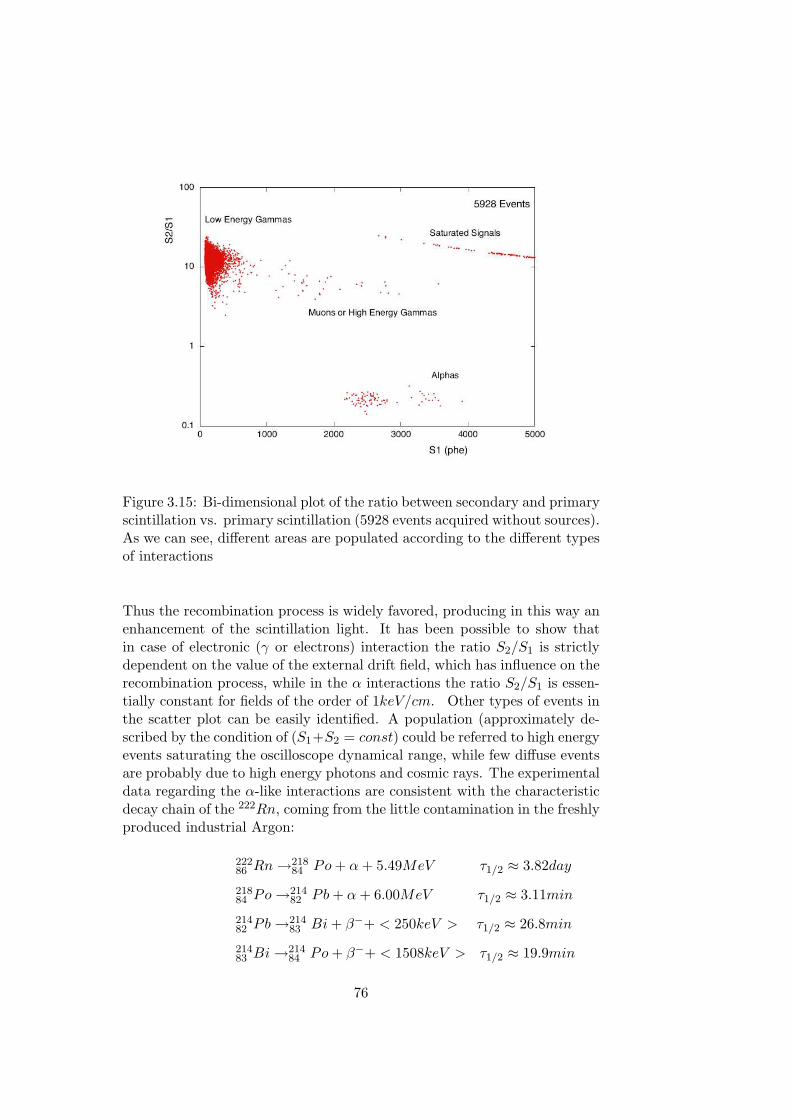
Figure 3.15: Bi-dimensional plot of the ratio between secondary and primaryscintillation vs. primary scintillation (5928 events acquired without sources).As we can see, different areas are populated according to the different typesof interactions
Thus the recombination process is widely favored, producing in this way anenhancement of the scintillation light. It has been possible to show thatin case of electronic (γ or electrons) interaction the ratio S2/S1 is strictlydependent on the value of the external drift field, which has influence on therecombination process, while in the α interactions the ratio S2/S1 is essen-tially constant for fields of the order of 1keV/cm. Other types of events inthe scatter plot can be easily identified. A population (approximately de-scribed by the condition of (S1+S2 = const) could be referred to high energyevents saturating the oscilloscope dynamical range, while few diffuse eventsare probably due to high energy photons and cosmic rays. The experimentaldata regarding the α-like interactions are consistent with the characteristicdecay chain of the 222Rn, coming from the little contamination in the freshlyproduced industrial Argon:
22286 Rn →218
84 Po + α + 5.49MeV τ1/2 ≈ 3.82day
21884 Po →214
82 Pb + α + 6.00MeV τ1/2 ≈ 3.11min
21482 Pb →214
83 Bi + β−+ < 250keV > τ1/2 ≈ 26.8min
21483 Bi →214
84 Po + β−+ < 1508keV > τ1/2 ≈ 19.9min
76
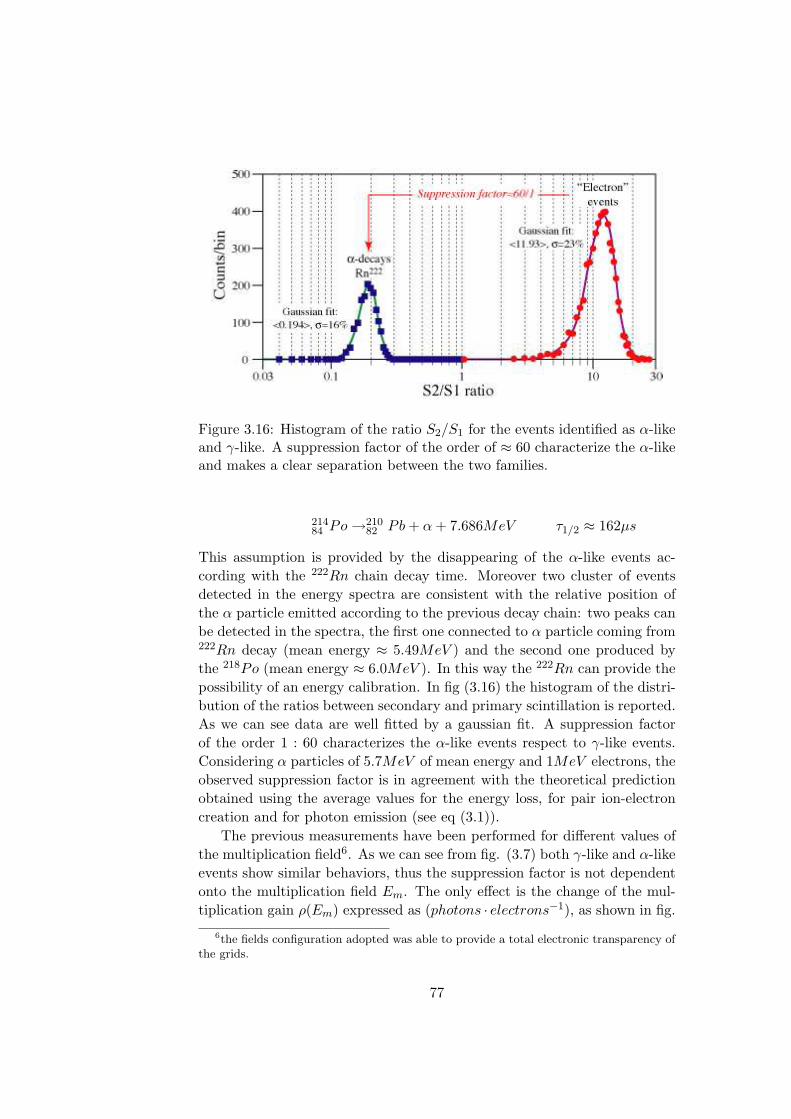
Figure 3.16: Histogram of the ratio S2/S1 for the events identified as α-likeand γ-like. A suppression factor of the order of ≈ 60 characterize the α-likeand makes a clear separation between the two families.
21484 Po →210
82 Pb + α + 7.686MeV τ1/2 ≈ 162µs
This assumption is provided by the disappearing of the α-like events ac-cording with the 222Rn chain decay time. Moreover two cluster of eventsdetected in the energy spectra are consistent with the relative position ofthe α particle emitted according to the previous decay chain: two peaks canbe detected in the spectra, the first one connected to α particle coming from222Rn decay (mean energy ≈ 5.49MeV ) and the second one produced bythe 218Po (mean energy ≈ 6.0MeV ). In this way the 222Rn can provide thepossibility of an energy calibration. In fig (3.16) the histogram of the distri-bution of the ratios between secondary and primary scintillation is reported.As we can see data are well fitted by a gaussian fit. A suppression factorof the order 1 : 60 characterizes the α-like events respect to γ-like events.Considering α particles of 5.7MeV of mean energy and 1MeV electrons, theobserved suppression factor is in agreement with the theoretical predictionobtained using the average values for the energy loss, for pair ion-electroncreation and for photon emission (see eq (3.1)).
The previous measurements have been performed for different values ofthe multiplication field6. As we can see from fig. (3.7) both γ-like and α-likeevents show similar behaviors, thus the suppression factor is not dependentonto the multiplication field Em. The only effect is the change of the mul-tiplication gain ρ(Em) expressed as (photons · electrons−1), as shown in fig.
6the fields configuration adopted was able to provide a total electronic transparency ofthe grids.
77
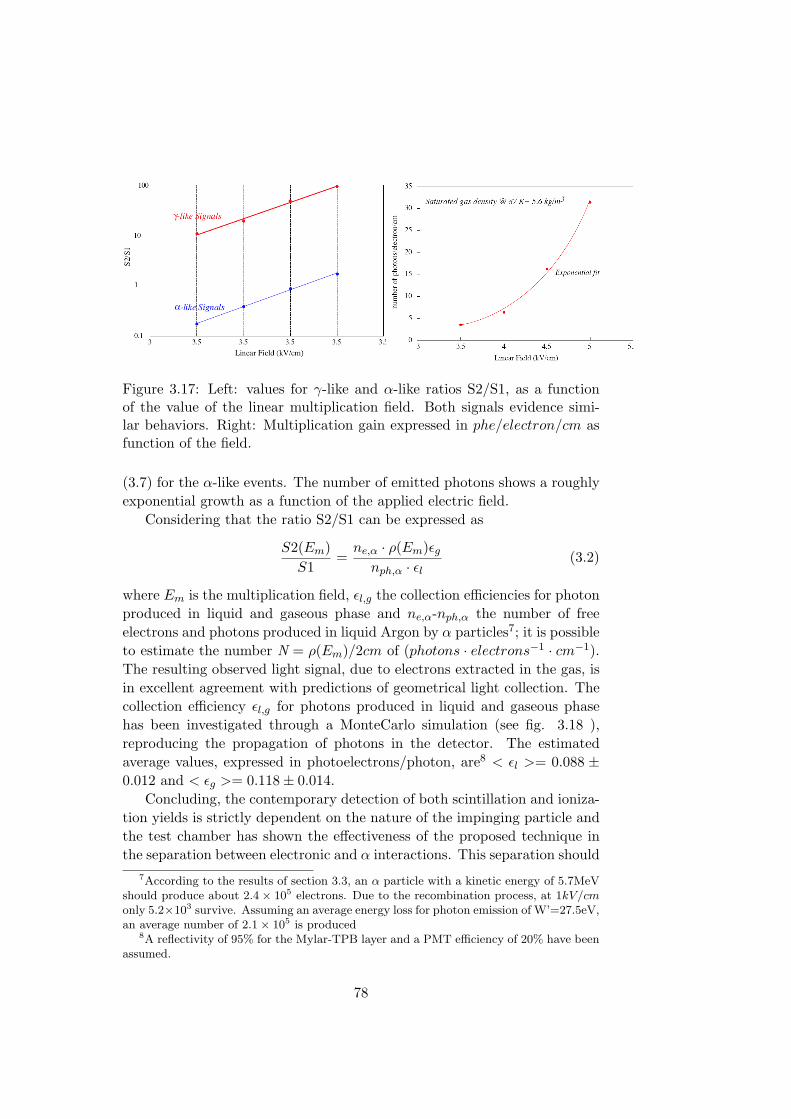
Figure 3.17: Left: values for γ-like and α-like ratios S2/S1, as a functionof the value of the linear multiplication field. Both signals evidence simi-lar behaviors. Right: Multiplication gain expressed in phe/electron/cm asfunction of the field.
(3.7) for the α-like events. The number of emitted photons shows a roughlyexponential growth as a function of the applied electric field.
Considering that the ratio S2/S1 can be expressed as
S2(Em)S1
=ne,α · ρ(Em)εg
nph,α · εl(3.2)
where Em is the multiplication field, εl,g the collection efficiencies for photonproduced in liquid and gaseous phase and ne,α-nph,α the number of freeelectrons and photons produced in liquid Argon by α particles7; it is possibleto estimate the number N = ρ(Em)/2cm of (photons · electrons−1 · cm−1).The resulting observed light signal, due to electrons extracted in the gas, isin excellent agreement with predictions of geometrical light collection. Thecollection efficiency εl,g for photons produced in liquid and gaseous phasehas been investigated through a MonteCarlo simulation (see fig. 3.18 ),reproducing the propagation of photons in the detector. The estimatedaverage values, expressed in photoelectrons/photon, are8 < εl >= 0.088 ±0.012 and < εg >= 0.118± 0.014.
Concluding, the contemporary detection of both scintillation and ioniza-tion yields is strictly dependent on the nature of the impinging particle andthe test chamber has shown the effectiveness of the proposed technique inthe separation between electronic and α interactions. This separation should
7According to the results of section 3.3, an α particle with a kinetic energy of 5.7MeVshould produce about 2.4× 10⁵ electrons. Due to the recombination process, at 1kV/cmonly 5.2×10³ survive. Assuming an average energy loss for photon emission of W’=27.5eV,an average number of 2.1× 10⁵ is produced
8A reflectivity of 95% for the Mylar-TPB layer and a PMT efficiency of 20% have beenassumed.
78
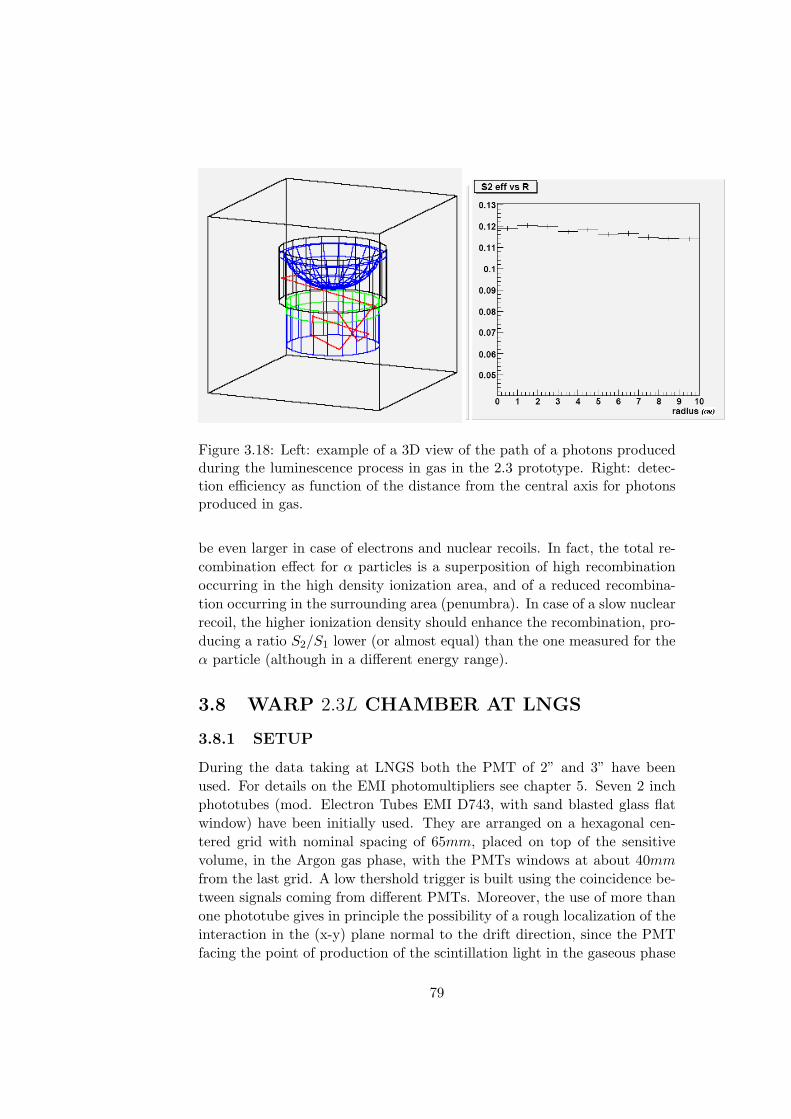
Figure 3.18: Left: example of a 3D view of the path of a photons producedduring the luminescence process in gas in the 2.3 prototype. Right: detec-tion efficiency as function of the distance from the central axis for photonsproduced in gas.
be even larger in case of electrons and nuclear recoils. In fact, the total re-combination effect for α particles is a superposition of high recombinationoccurring in the high density ionization area, and of a reduced recombina-tion occurring in the surrounding area (penumbra). In case of a slow nuclearrecoil, the higher ionization density should enhance the recombination, pro-ducing a ratio S2/S1 lower (or almost equal) than the one measured for theα particle (although in a different energy range).
3.8 WARP 2.3L CHAMBER AT LNGS
3.8.1 SETUP
During the data taking at LNGS both the PMT of 2” and 3” have beenused. For details on the EMI photomultipliers see chapter 5. Seven 2 inchphototubes (mod. Electron Tubes EMI D743, with sand blasted glass flatwindow) have been initially used. They are arranged on a hexagonal cen-tered grid with nominal spacing of 65mm, placed on top of the sensitivevolume, in the Argon gas phase, with the PMTs windows at about 40mm
from the last grid. A low thershold trigger is built using the coincidence be-tween signals coming from different PMTs. Moreover, the use of more thanone phototube gives in principle the possibility of a rough localization of theinteraction in the (x-y) plane normal to the drift direction, since the PMTfacing the point of production of the scintillation light in the gaseous phase
79
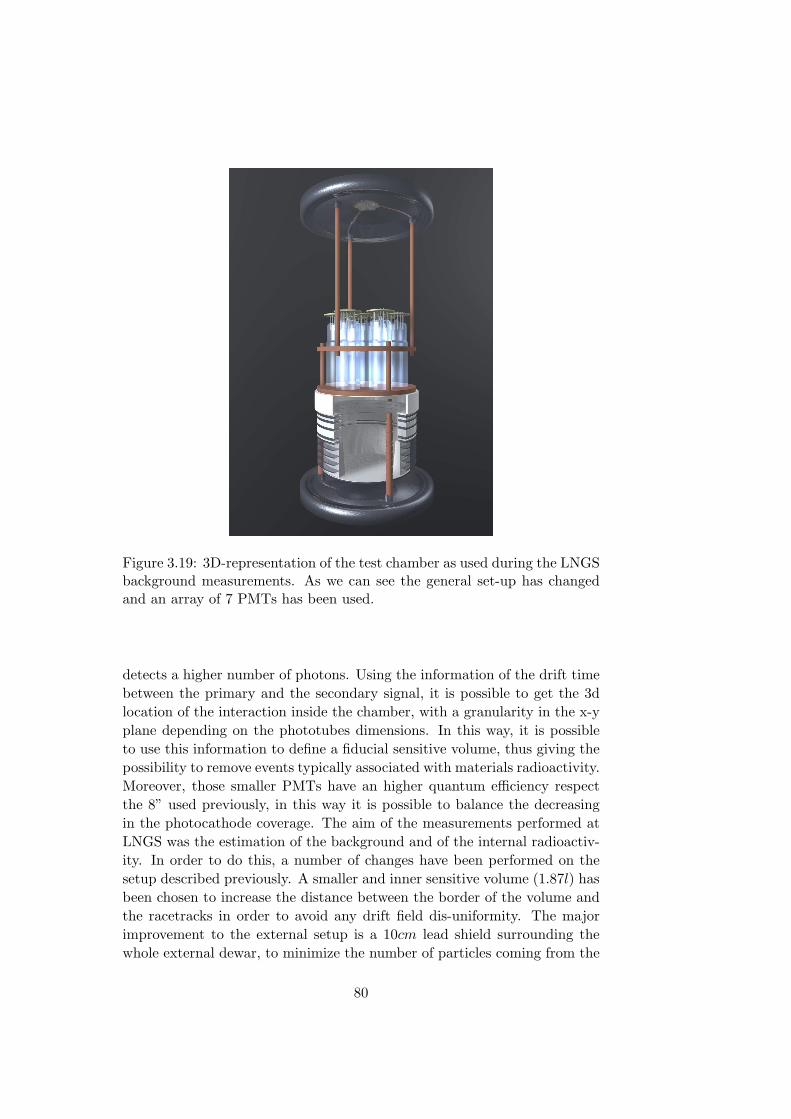
Figure 3.19: 3D-representation of the test chamber as used during the LNGSbackground measurements. As we can see the general set-up has changedand an array of 7 PMTs has been used.
detects a higher number of photons. Using the information of the drift timebetween the primary and the secondary signal, it is possible to get the 3dlocation of the interaction inside the chamber, with a granularity in the x-yplane depending on the phototubes dimensions. In this way, it is possibleto use this information to define a fiducial sensitive volume, thus giving thepossibility to remove events typically associated with materials radioactivity.Moreover, those smaller PMTs have an higher quantum efficiency respectthe 8” used previously, in this way it is possible to balance the decreasingin the photocathode coverage. The aim of the measurements performed atLNGS was the estimation of the background and of the internal radioactiv-ity. In order to do this, a number of changes have been performed on thesetup described previously. A smaller and inner sensitive volume (1.87l) hasbeen chosen to increase the distance between the border of the volume andthe racetracks in order to avoid any drift field dis-uniformity. The majorimprovement to the external setup is a 10cm lead shield surrounding thewhole external dewar, to minimize the number of particles coming from the
80
external room and to estimate the internal radioactivity. To maximize theradiochemical purification an Hopkalit cartridge has been used instead ofstandard Oxisorb. This new filter offers performances similar to the previ-ous one regarding the oxigen purification, allowing a long electron lifetime,but it decreases the traces of heavy metals and other contaminants, thusreducing the internal γ and β emissions. Starting from August 2005 a recir-culation system has been implemented at LNGS in order to allow a longerperiod of data taking. A little evaporation of the liquid is obtained throughthe heat dissipation of resistance placed in the chamber, and the overpres-sure is used to drive the gas Argon in a purification cartridge placed outsidethe chamber. The system has been able to avoid the necessity of the LArreplacement, allowing a continuous data taking.
To improve the wave length shifting during the measurements, the liquidArgon has been doped with Xenon at a concentrations < 1% in order toshift from 128nm to 175nm. In this case, instead of standard VME + TPBsystem, a PTFE diffusive layer has been adopted (estimated reflectivity 88%at 175nm).
3.8.2 DATA ACQUISITION
The readout system has been changed to take in account the presence ofseven PMTs. The system described in the previous section was preservedto get the possibility of the SER measurement (needed to calculate the gainof each photomultiplier) and to detect the primary scintillation spectra ofone or more PMTs. A new system has been added in order to managethe coincidence of the signals of many PMTs and to implement an efficienttrigger logic necessary to identify a few number of nuclear recoils beyond alarge number of γ-like events. The general layout of the trigger is shown infig 3.20. Two levels of trigger logic have been implemented. The first levelis based on a majority condition: the trigger requests at least 4 PMTs overthe threshold in order to allow the acquisition of the signals. To implementthis trigger logic, the signals coming from the last dynode of each PMTare preamplified by a fast inverting preamplifier with a gain set at abouta value of 100, and then the signal is discriminated using a threshold of1.5 photoelectrons. To have uniform conditions all the PMTs have beenequalized to the same gain. The NIM output of each discriminator is sent toa coincidence module and the request of at least four PMTs over threshold isapplied. The NIM output of the coincidence board is the trigger signal sentto a trigger board CAEN V793. At the same time the anodic output of eachPMTs is acquired and shaped using the Camberra 2005 charge preamplifierdescribed in previous section. A board CAEN V789 is used in order todigitalize the signal (the board has been modified excluding the preamplifiedsection that has been replaced by fast amplifiers). The signal is splitted
81
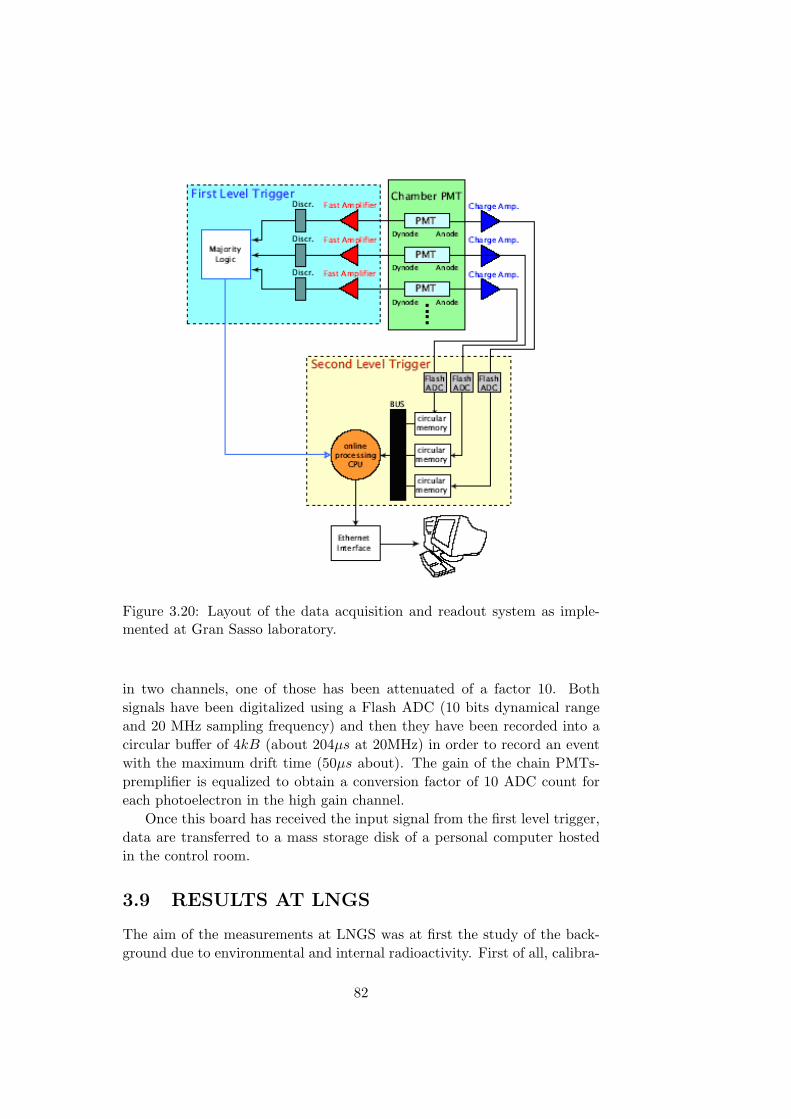
Figure 3.20: Layout of the data acquisition and readout system as imple-mented at Gran Sasso laboratory.
in two channels, one of those has been attenuated of a factor 10. Bothsignals have been digitalized using a Flash ADC (10 bits dynamical rangeand 20 MHz sampling frequency) and then they have been recorded into acircular buffer of 4kB (about 204µs at 20MHz) in order to record an eventwith the maximum drift time (50µs about). The gain of the chain PMTs-premplifier is equalized to obtain a conversion factor of 10 ADC count foreach photoelectron in the high gain channel.
Once this board has received the input signal from the first level trigger,data are transferred to a mass storage disk of a personal computer hostedin the control room.
3.9 RESULTS AT LNGS
The aim of the measurements at LNGS was at first the study of the back-ground due to environmental and internal radioactivity. First of all, calibra-
82
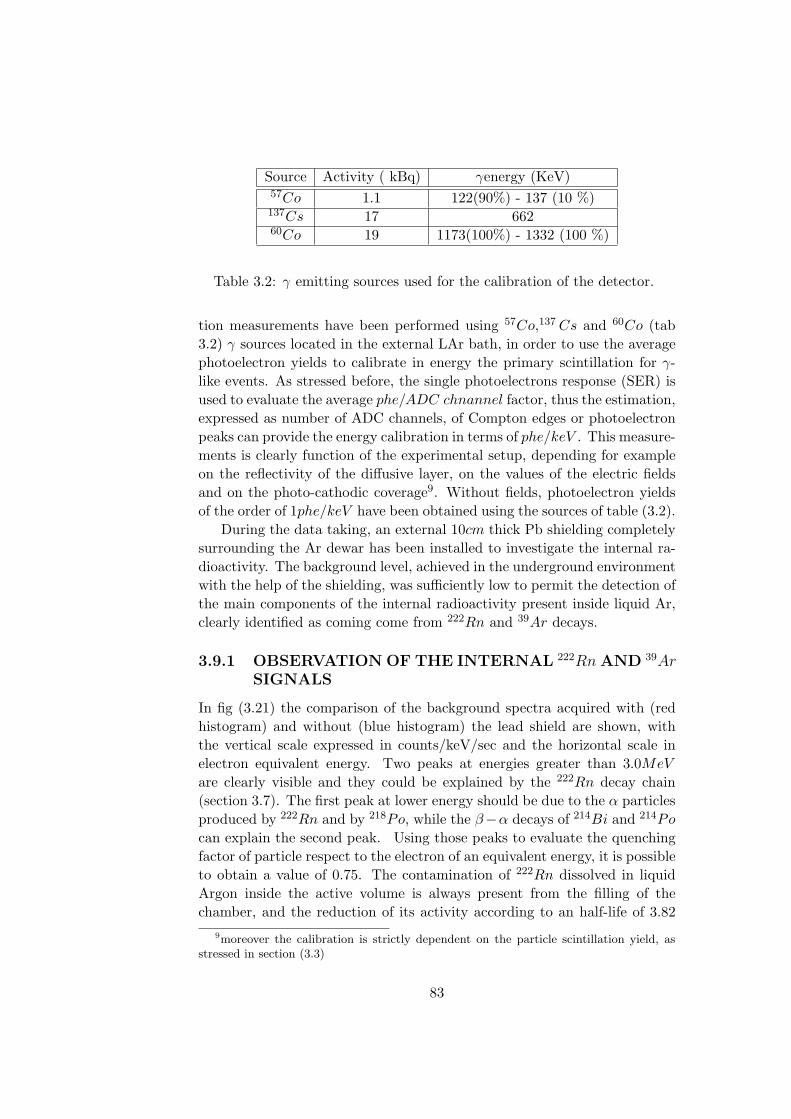
Source Activity ( kBq) γenergy (KeV)57Co 1.1 122(90%) - 137 (10 %)137Cs 17 66260Co 19 1173(100%) - 1332 (100 %)
Table 3.2: γ emitting sources used for the calibration of the detector.
tion measurements have been performed using 57Co,137 Cs and 60Co (tab3.2) γ sources located in the external LAr bath, in order to use the averagephotoelectron yields to calibrate in energy the primary scintillation for γ-like events. As stressed before, the single photoelectrons response (SER) isused to evaluate the average phe/ADC chnannel factor, thus the estimation,expressed as number of ADC channels, of Compton edges or photoelectronpeaks can provide the energy calibration in terms of phe/keV . This measure-ments is clearly function of the experimental setup, depending for exampleon the reflectivity of the diffusive layer, on the values of the electric fieldsand on the photo-cathodic coverage9. Without fields, photoelectron yieldsof the order of 1phe/keV have been obtained using the sources of table (3.2).
During the data taking, an external 10cm thick Pb shielding completelysurrounding the Ar dewar has been installed to investigate the internal ra-dioactivity. The background level, achieved in the underground environmentwith the help of the shielding, was sufficiently low to permit the detection ofthe main components of the internal radioactivity present inside liquid Ar,clearly identified as coming come from 222Rn and 39Ar decays.
3.9.1 OBSERVATION OF THE INTERNAL 222Rn AND 39ArSIGNALS
In fig (3.21) the comparison of the background spectra acquired with (redhistogram) and without (blue histogram) the lead shield are shown, withthe vertical scale expressed in counts/keV/sec and the horizontal scale inelectron equivalent energy. Two peaks at energies greater than 3.0MeV
are clearly visible and they could be explained by the 222Rn decay chain(section 3.7). The first peak at lower energy should be due to the α particlesproduced by 222Rn and by 218Po, while the β−α decays of 214Bi and 214Po
can explain the second peak. Using those peaks to evaluate the quenchingfactor of particle respect to the electron of an equivalent energy, it is possibleto obtain a value of 0.75. The contamination of 222Rn dissolved in liquidArgon inside the active volume is always present from the filling of thechamber, and the reduction of its activity according to an half-life of 3.82
9moreover the calibration is strictly dependent on the particle scintillation yield, asstressed in section (3.3)
83
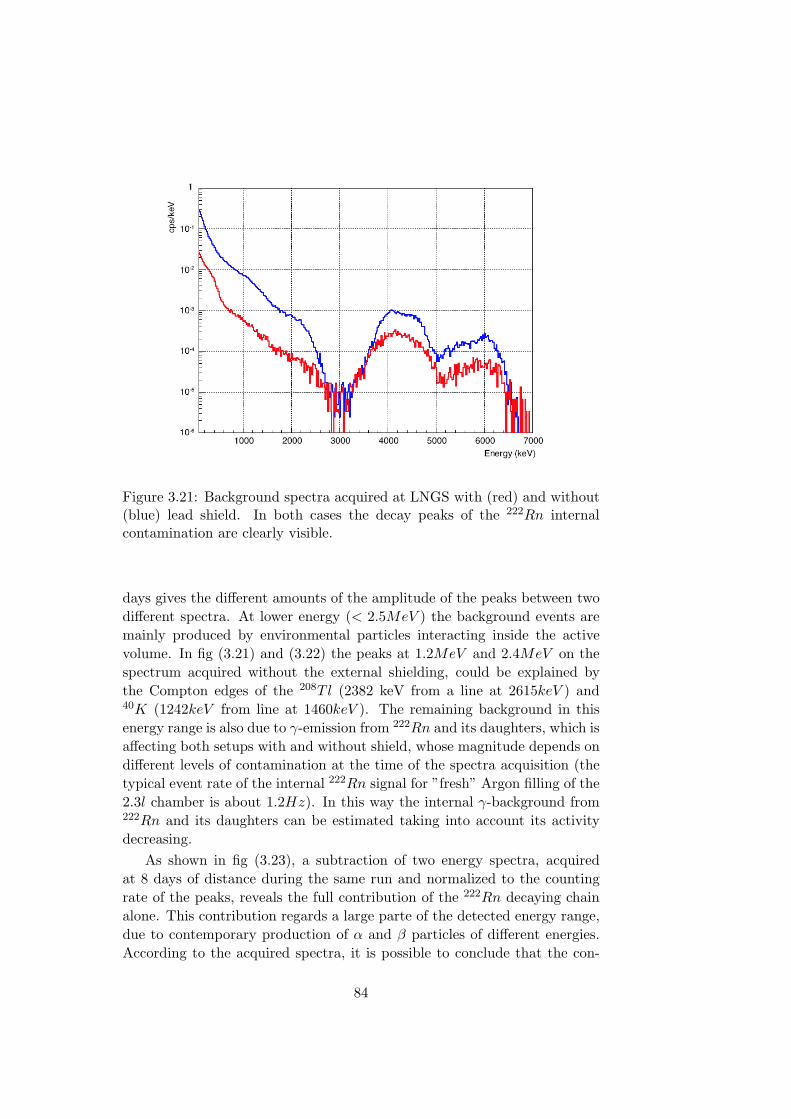
Figure 3.21: Background spectra acquired at LNGS with (red) and without(blue) lead shield. In both cases the decay peaks of the 222Rn internalcontamination are clearly visible.
days gives the different amounts of the amplitude of the peaks between twodifferent spectra. At lower energy (< 2.5MeV ) the background events aremainly produced by environmental particles interacting inside the activevolume. In fig (3.21) and (3.22) the peaks at 1.2MeV and 2.4MeV on thespectrum acquired without the external shielding, could be explained bythe Compton edges of the 208T l (2382 keV from a line at 2615keV ) and40K (1242keV from line at 1460keV ). The remaining background in thisenergy range is also due to γ-emission from 222Rn and its daughters, which isaffecting both setups with and without shield, whose magnitude depends ondifferent levels of contamination at the time of the spectra acquisition (thetypical event rate of the internal 222Rn signal for ”fresh” Argon filling of the2.3l chamber is about 1.2Hz). In this way the internal γ-background from222Rn and its daughters can be estimated taking into account its activitydecreasing.
As shown in fig (3.23), a subtraction of two energy spectra, acquiredat 8 days of distance during the same run and normalized to the countingrate of the peaks, reveals the full contribution of the 222Rn decaying chainalone. This contribution regards a large parte of the detected energy range,due to contemporary production of α and β particles of different energies.According to the acquired spectra, it is possible to conclude that the con-
84
Figure 3.22: Energy spectra in the range 80keV −3MeV acquired with (red)and without (blue) lead shield. Compton edges due the γ emission (208T land 40K) are clearly visible in the spectra without shielding.
Energy(keV ) Rates(Hz) (No shield) Rates(Hz)(Shield) Supp. factor
100-500 35.4 4.15 0.12500-1000 6.5 0.56 0.091000-1500 2.22 0.17 0.081500-2500 0.78 0.081 0.1
Table 3.3: Total counting rates observed with and without shield in differentenergy ranges.
tribution of the 222Rn induced background is not negligible, however, dueto the 222Rn lifetime, it can be strongly reduced during the data taking bywaiting for a sufficiently long time after the filling.
From the comparison of the background spectrum acquired with thelead shielding with the 222Rn induced background spectrum (fig. 3.24), it ispossible to conclude that the 222Rn induced is the main background sourceabove 3MeV of energy, while its contribution is less significant at lowerenergies.
Below 3MeV the energy spectra should be caused mainly by environ-mental γ-rays from U , Th, and K, coming from materials surrounding thesensitive volume of the detector (air, rock and concrete of the lab). As we
85
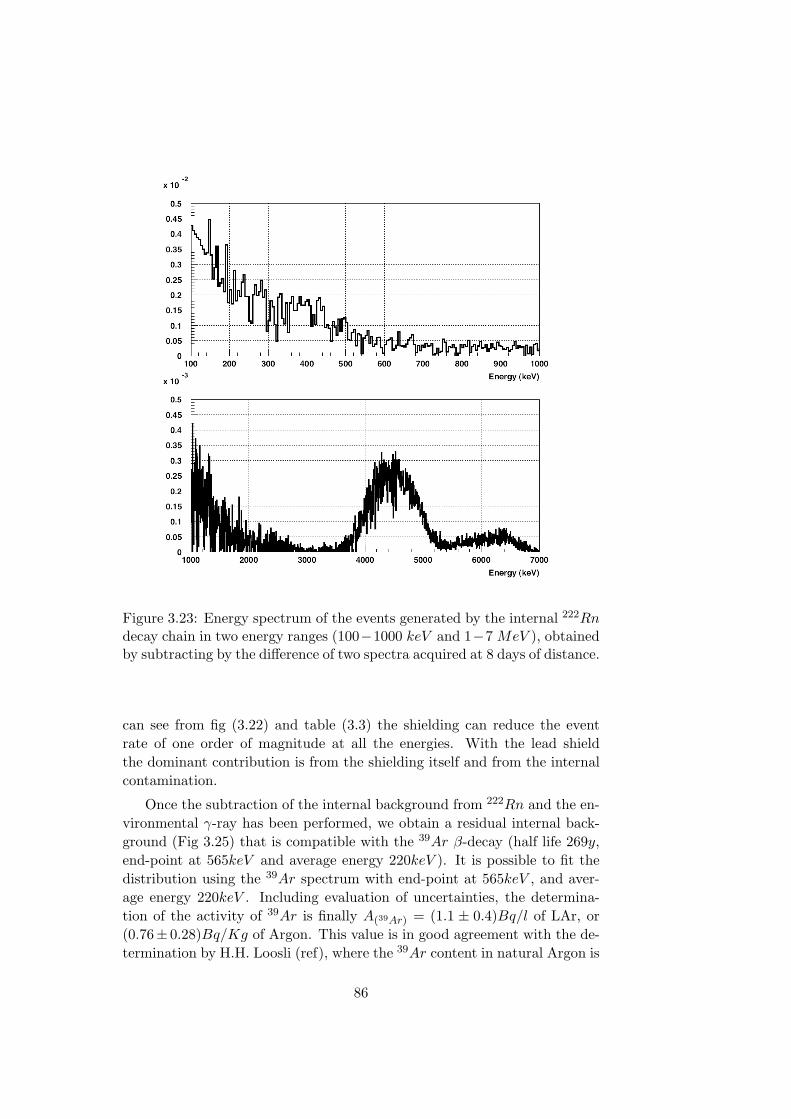
Figure 3.23: Energy spectrum of the events generated by the internal 222Rndecay chain in two energy ranges (100−1000 keV and 1−7 MeV ), obtainedby subtracting by the difference of two spectra acquired at 8 days of distance.
can see from fig (3.22) and table (3.3) the shielding can reduce the eventrate of one order of magnitude at all the energies. With the lead shieldthe dominant contribution is from the shielding itself and from the internalcontamination.
Once the subtraction of the internal background from 222Rn and the en-vironmental γ-ray has been performed, we obtain a residual internal back-ground (Fig 3.25) that is compatible with the 39Ar β-decay (half life 269y,end-point at 565keV and average energy 220keV ). It is possible to fit thedistribution using the 39Ar spectrum with end-point at 565keV , and aver-age energy 220keV . Including evaluation of uncertainties, the determina-tion of the activity of 39Ar is finally A(39Ar) = (1.1 ± 0.4)Bq/l of LAr, or(0.76± 0.28)Bq/Kg of Argon. This value is in good agreement with the de-termination by H.H. Loosli (ref), where the 39Ar content in natural Argon is
86
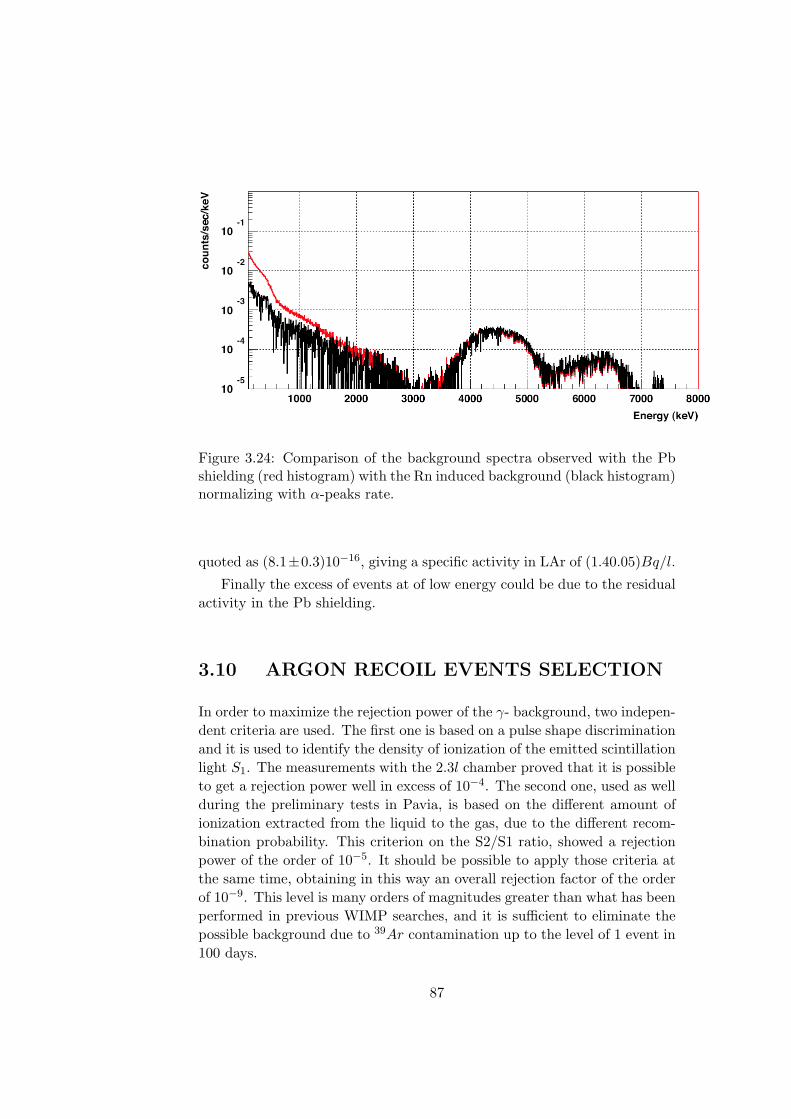
Figure 3.24: Comparison of the background spectra observed with the Pbshielding (red histogram) with the Rn induced background (black histogram)normalizing with α-peaks rate.
quoted as (8.1±0.3)10−16, giving a specific activity in LAr of (1.40.05)Bq/l.
Finally the excess of events at of low energy could be due to the residualactivity in the Pb shielding.
3.10 ARGON RECOIL EVENTS SELECTION
In order to maximize the rejection power of the γ- background, two indepen-dent criteria are used. The first one is based on a pulse shape discriminationand it is used to identify the density of ionization of the emitted scintillationlight S1. The measurements with the 2.3l chamber proved that it is possibleto get a rejection power well in excess of 10−4. The second one, used as wellduring the preliminary tests in Pavia, is based on the different amount ofionization extracted from the liquid to the gas, due to the different recom-bination probability. This criterion on the S2/S1 ratio, showed a rejectionpower of the order of 10−5. It should be possible to apply those criteria atthe same time, obtaining in this way an overall rejection factor of the orderof 10−9. This level is many orders of magnitudes greater than what has beenperformed in previous WIMP searches, and it is sufficient to eliminate thepossible background due to 39Ar contamination up to the level of 1 event in100 days.
87
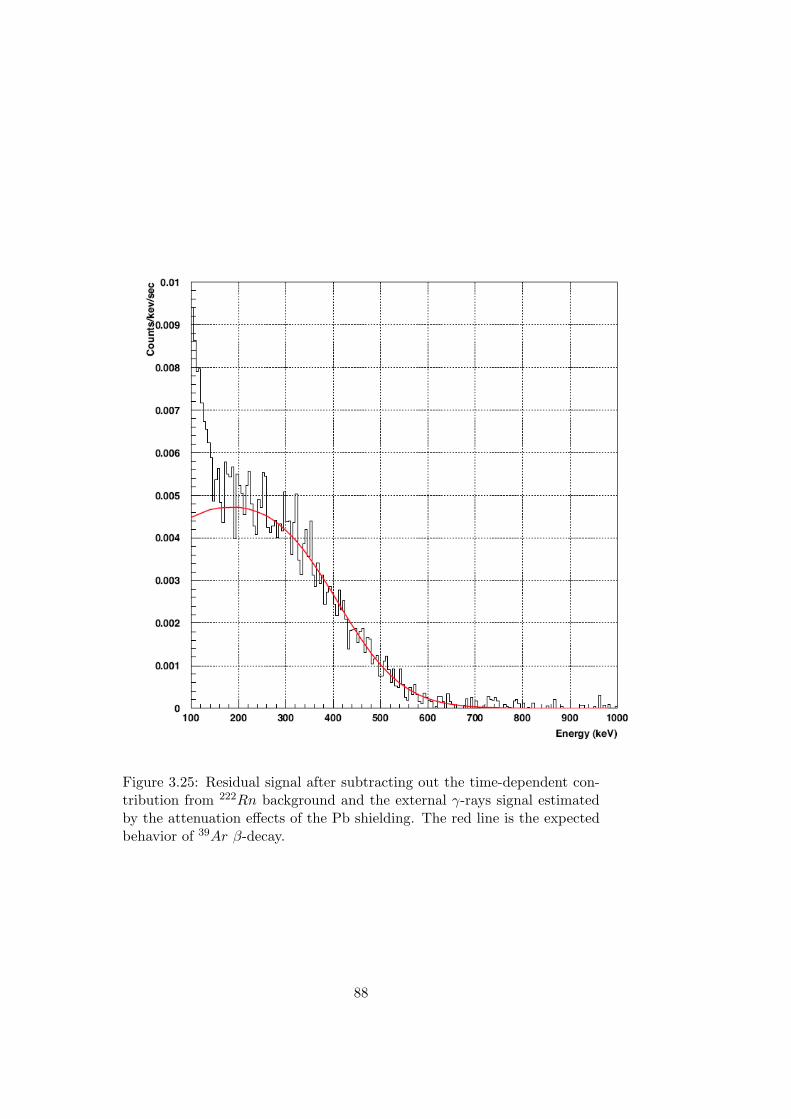
Figure 3.25: Residual signal after subtracting out the time-dependent con-tribution from 222Rn background and the external γ-rays signal estimatedby the attenuation effects of the Pb shielding. The red line is the expectedbehavior of 39Ar β-decay.
88
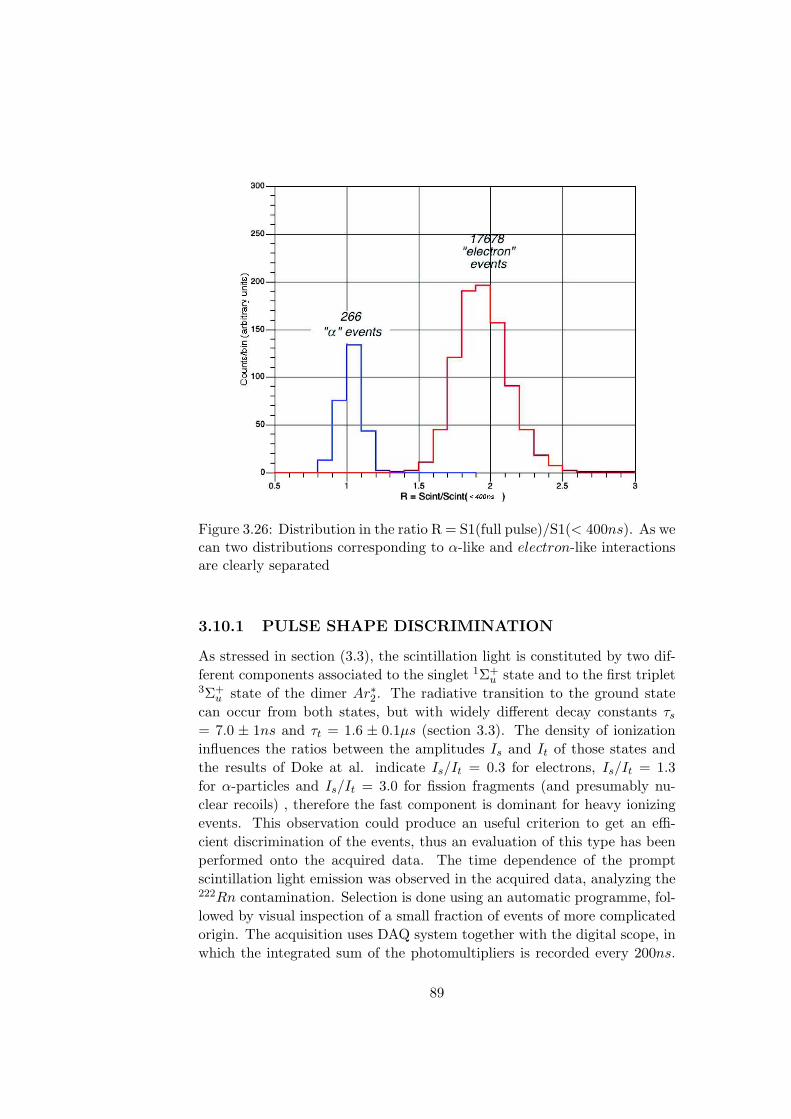
Figure 3.26: Distribution in the ratio R = S1(full pulse)/S1(< 400ns). As wecan two distributions corresponding to α-like and electron-like interactionsare clearly separated
3.10.1 PULSE SHAPE DISCRIMINATION
As stressed in section (3.3), the scintillation light is constituted by two dif-ferent components associated to the singlet 1Σ+
u state and to the first triplet3Σ+
u state of the dimer Ar∗2. The radiative transition to the ground statecan occur from both states, but with widely different decay constants τs
= 7.0 ± 1ns and τt = 1.6 ± 0.1µs (section 3.3). The density of ionizationinfluences the ratios between the amplitudes Is and It of those states andthe results of Doke at al. indicate Is/It = 0.3 for electrons, Is/It = 1.3for α-particles and Is/It = 3.0 for fission fragments (and presumably nu-clear recoils) , therefore the fast component is dominant for heavy ionizingevents. This observation could produce an useful criterion to get an effi-cient discrimination of the events, thus an evaluation of this type has beenperformed onto the acquired data. The time dependence of the promptscintillation light emission was observed in the acquired data, analyzing the222Rn contamination. Selection is done using an automatic programme, fol-lowed by visual inspection of a small fraction of events of more complicatedorigin. The acquisition uses DAQ system together with the digital scope, inwhich the integrated sum of the photomultipliers is recorded every 200ns.
89
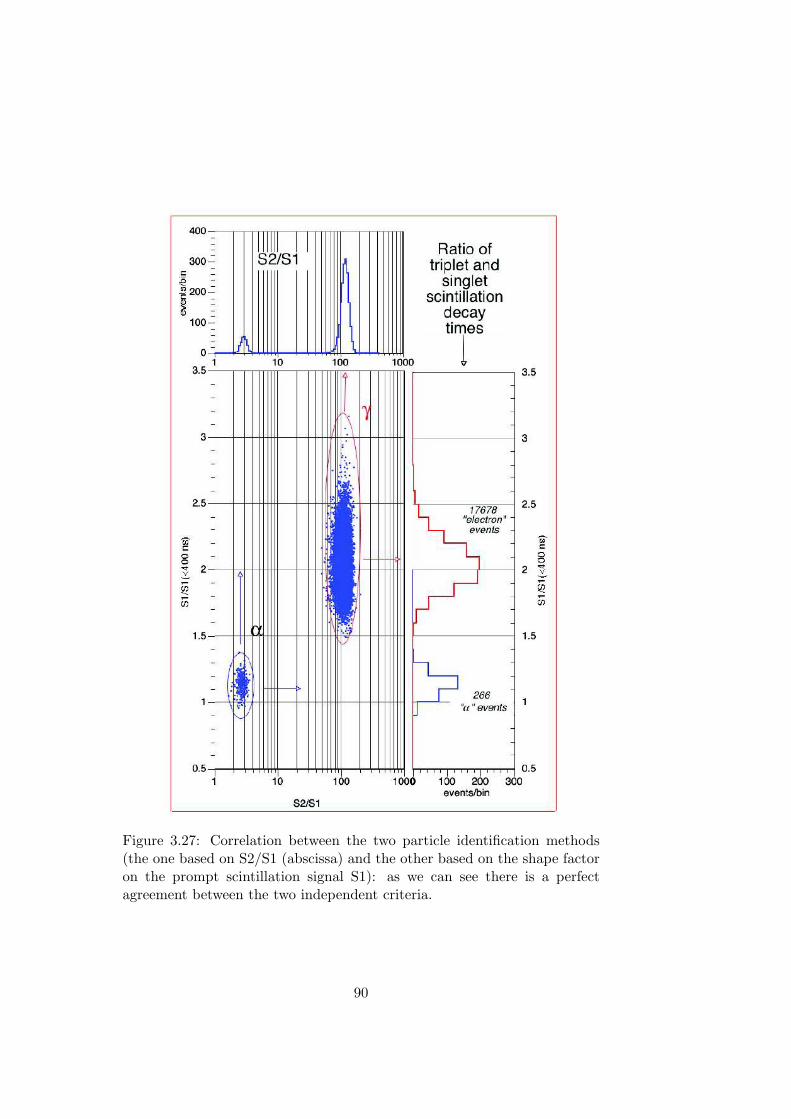
Figure 3.27: Correlation between the two particle identification methods(the one based on S2/S1 (abscissa) and the other based on the shape factoron the prompt scintillation signal S1): as we can see there is a perfectagreement between the two independent criteria.
90
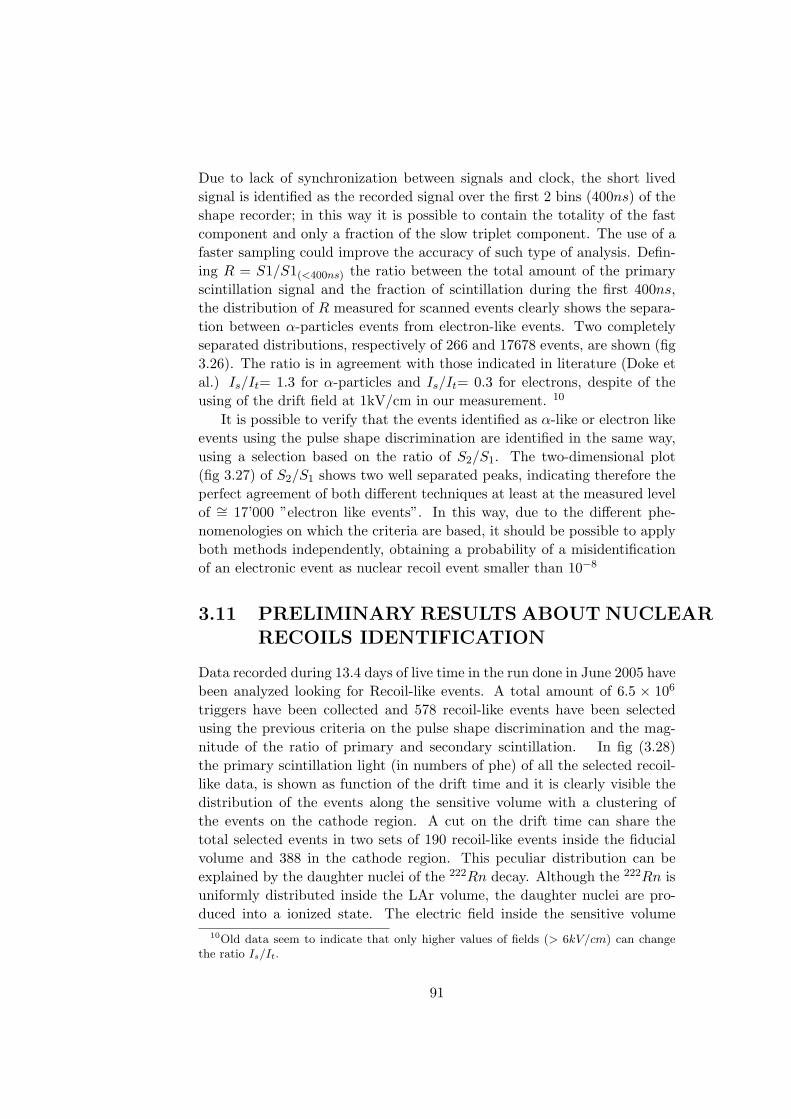
Due to lack of synchronization between signals and clock, the short livedsignal is identified as the recorded signal over the first 2 bins (400ns) of theshape recorder; in this way it is possible to contain the totality of the fastcomponent and only a fraction of the slow triplet component. The use of afaster sampling could improve the accuracy of such type of analysis. Defin-ing R = S1/S1(<400ns) the ratio between the total amount of the primaryscintillation signal and the fraction of scintillation during the first 400ns,the distribution of R measured for scanned events clearly shows the separa-tion between α-particles events from electron-like events. Two completelyseparated distributions, respectively of 266 and 17678 events, are shown (fig3.26). The ratio is in agreement with those indicated in literature (Doke etal.) Is/It= 1.3 for α-particles and Is/It= 0.3 for electrons, despite of theusing of the drift field at 1kV/cm in our measurement. 10
It is possible to verify that the events identified as α-like or electron likeevents using the pulse shape discrimination are identified in the same way,using a selection based on the ratio of S2/S1. The two-dimensional plot(fig 3.27) of S2/S1 shows two well separated peaks, indicating therefore theperfect agreement of both different techniques at least at the measured levelof ∼= 17’000 ”electron like events”. In this way, due to the different phe-nomenologies on which the criteria are based, it should be possible to applyboth methods independently, obtaining a probability of a misidentificationof an electronic event as nuclear recoil event smaller than 10−8
3.11 PRELIMINARY RESULTS ABOUT NUCLEARRECOILS IDENTIFICATION
Data recorded during 13.4 days of live time in the run done in June 2005 havebeen analyzed looking for Recoil-like events. A total amount of 6.5 × 10⁶
triggers have been collected and 578 recoil-like events have been selectedusing the previous criteria on the pulse shape discrimination and the mag-nitude of the ratio of primary and secondary scintillation. In fig (3.28)the primary scintillation light (in numbers of phe) of all the selected recoil-like data, is shown as function of the drift time and it is clearly visible thedistribution of the events along the sensitive volume with a clustering ofthe events on the cathode region. A cut on the drift time can share thetotal selected events in two sets of 190 recoil-like events inside the fiducialvolume and 388 in the cathode region. This peculiar distribution can beexplained by the daughter nuclei of the 222Rn decay. Although the 222Rn isuniformly distributed inside the LAr volume, the daughter nuclei are pro-duced into a ionized state. The electric field inside the sensitive volume
10Old data seem to indicate that only higher values of fields (> 6kV/cm) can changethe ratio Is/It.
91
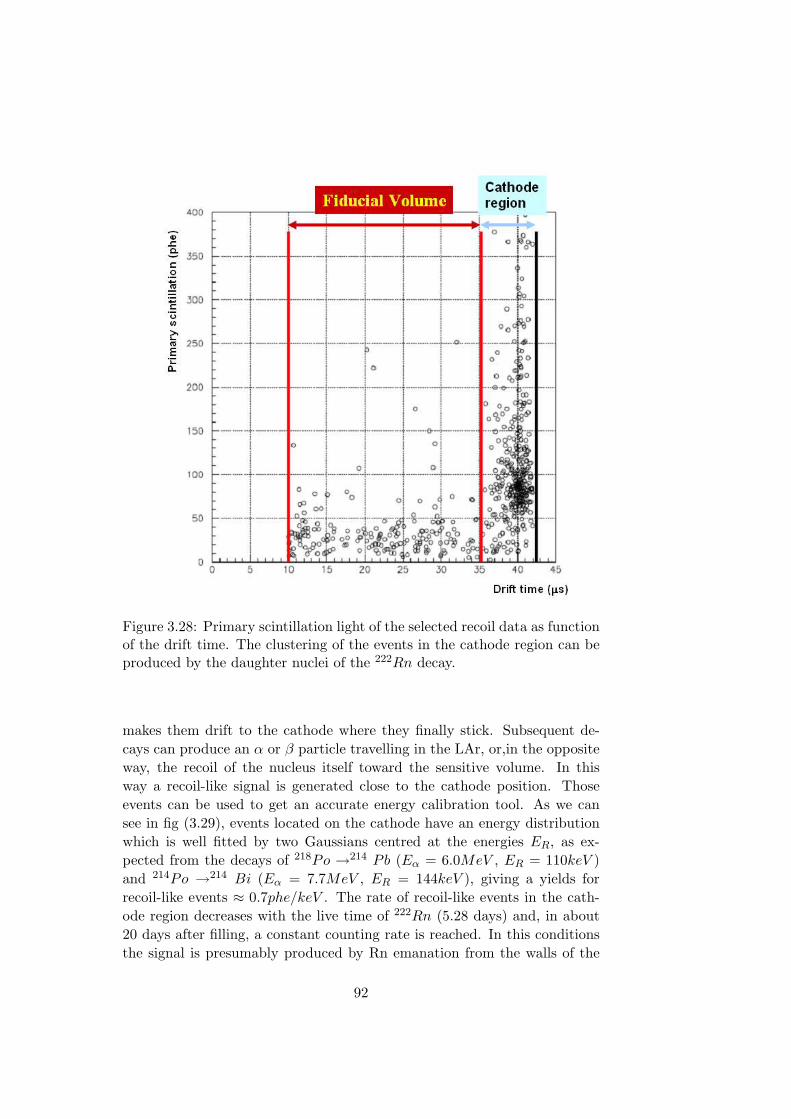
Figure 3.28: Primary scintillation light of the selected recoil data as functionof the drift time. The clustering of the events in the cathode region can beproduced by the daughter nuclei of the 222Rn decay.
makes them drift to the cathode where they finally stick. Subsequent de-cays can produce an α or β particle travelling in the LAr, or,in the oppositeway, the recoil of the nucleus itself toward the sensitive volume. In thisway a recoil-like signal is generated close to the cathode position. Thoseevents can be used to get an accurate energy calibration tool. As we cansee in fig (3.29), events located on the cathode have an energy distributionwhich is well fitted by two Gaussians centred at the energies ER, as ex-pected from the decays of 218Po →214 Pb (Eα = 6.0MeV , ER = 110keV )and 214Po →214 Bi (Eα = 7.7MeV , ER = 144keV ), giving a yields forrecoil-like events ≈ 0.7phe/keV . The rate of recoil-like events in the cath-ode region decreases with the live time of 222Rn (5.28 days) and, in about20 days after filling, a constant counting rate is reached. In this conditionsthe signal is presumably produced by Rn emanation from the walls of the
92
Figure 3.29: Energy distribution of the events located in the cathode re-gion. The histogram is well fitted by two Gaussians centred at the energiesexpected from the decays of 218Po and 214Po.
chamber and from recirculation system.A preliminary analysis of the event rate and of the shape of the energy
spectrum of all recoil-like events inside the fiducial volume gives resultscompatible with the expected events induced by environmental neutronsinside the laboratory. This work is still in progress.
93
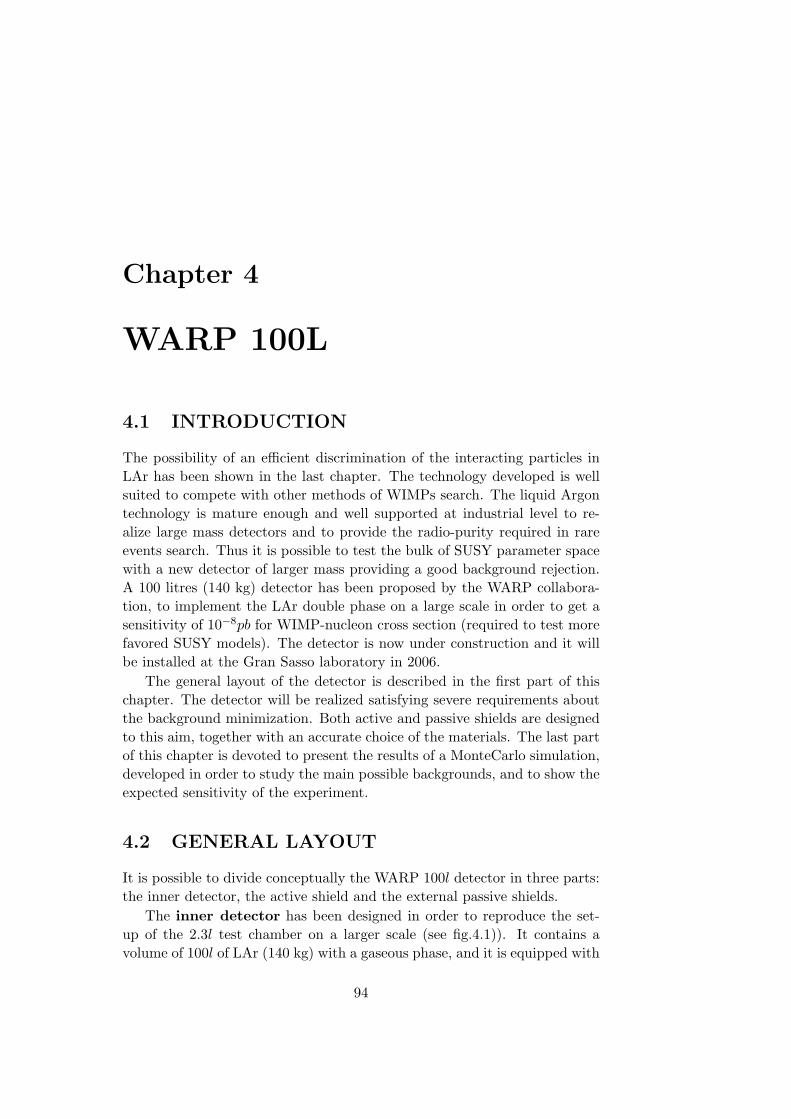
Chapter 4
WARP 100L
4.1 INTRODUCTION
The possibility of an efficient discrimination of the interacting particles inLAr has been shown in the last chapter. The technology developed is wellsuited to compete with other methods of WIMPs search. The liquid Argontechnology is mature enough and well supported at industrial level to re-alize large mass detectors and to provide the radio-purity required in rareevents search. Thus it is possible to test the bulk of SUSY parameter spacewith a new detector of larger mass providing a good background rejection.A 100 litres (140 kg) detector has been proposed by the WARP collabora-tion, to implement the LAr double phase on a large scale in order to get asensitivity of 10−8pb for WIMP-nucleon cross section (required to test morefavored SUSY models). The detector is now under construction and it willbe installed at the Gran Sasso laboratory in 2006.
The general layout of the detector is described in the first part of thischapter. The detector will be realized satisfying severe requirements aboutthe background minimization. Both active and passive shields are designedto this aim, together with an accurate choice of the materials. The last partof this chapter is devoted to present the results of a MonteCarlo simulation,developed in order to study the main possible backgrounds, and to show theexpected sensitivity of the experiment.
4.2 GENERAL LAYOUT
It is possible to divide conceptually the WARP 100l detector in three parts:the inner detector, the active shield and the external passive shields.
The inner detector has been designed in order to reproduce the set-up of the 2.3l test chamber on a larger scale (see fig.4.1)). It contains avolume of 100l of LAr (140 kg) with a gaseous phase, and it is equipped with
94
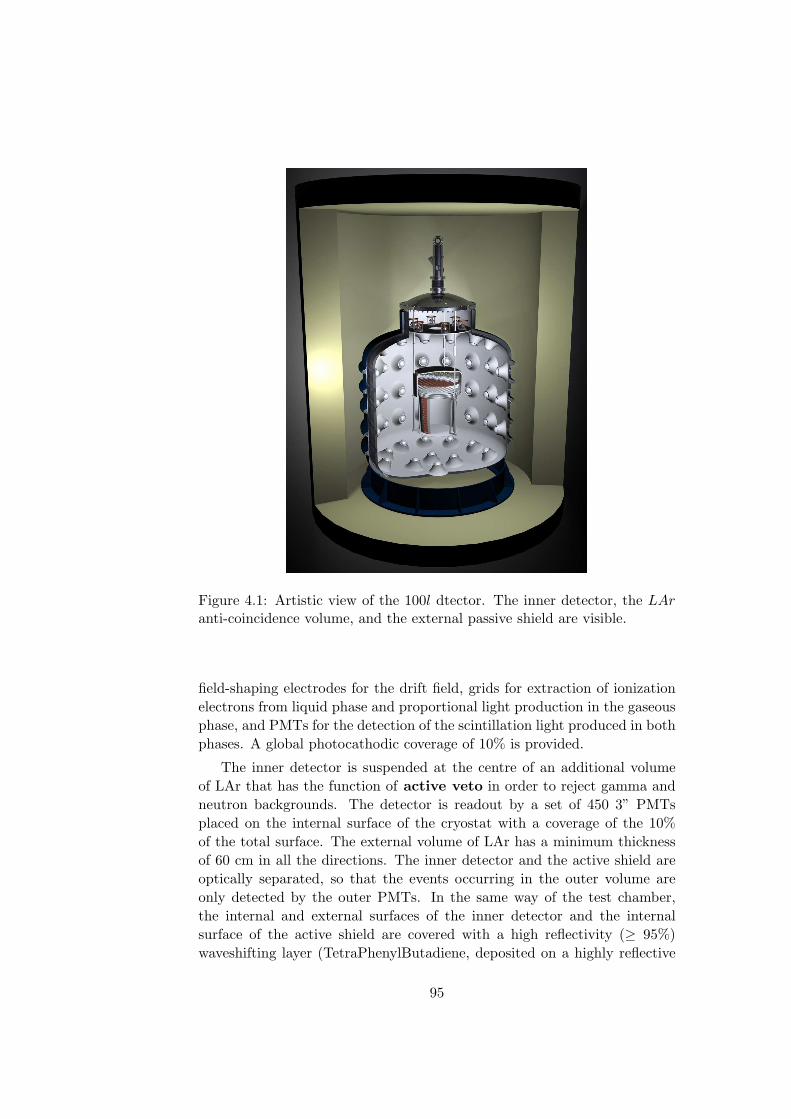
Figure 4.1: Artistic view of the 100l dtector. The inner detector, the LAranti-coincidence volume, and the external passive shield are visible.
field-shaping electrodes for the drift field, grids for extraction of ionizationelectrons from liquid phase and proportional light production in the gaseousphase, and PMTs for the detection of the scintillation light produced in bothphases. A global photocathodic coverage of 10% is provided.
The inner detector is suspended at the centre of an additional volumeof LAr that has the function of active veto in order to reject gamma andneutron backgrounds. The detector is readout by a set of 450 3” PMTsplaced on the internal surface of the cryostat with a coverage of the 10%of the total surface. The external volume of LAr has a minimum thicknessof 60 cm in all the directions. The inner detector and the active shield areoptically separated, so that the events occurring in the outer volume areonly detected by the outer PMTs. In the same way of the test chamber,the internal and external surfaces of the inner detector and the internalsurface of the active shield are covered with a high reflectivity (≥ 95%)waveshifting layer (TetraPhenylButadiene, deposited on a highly reflective
95
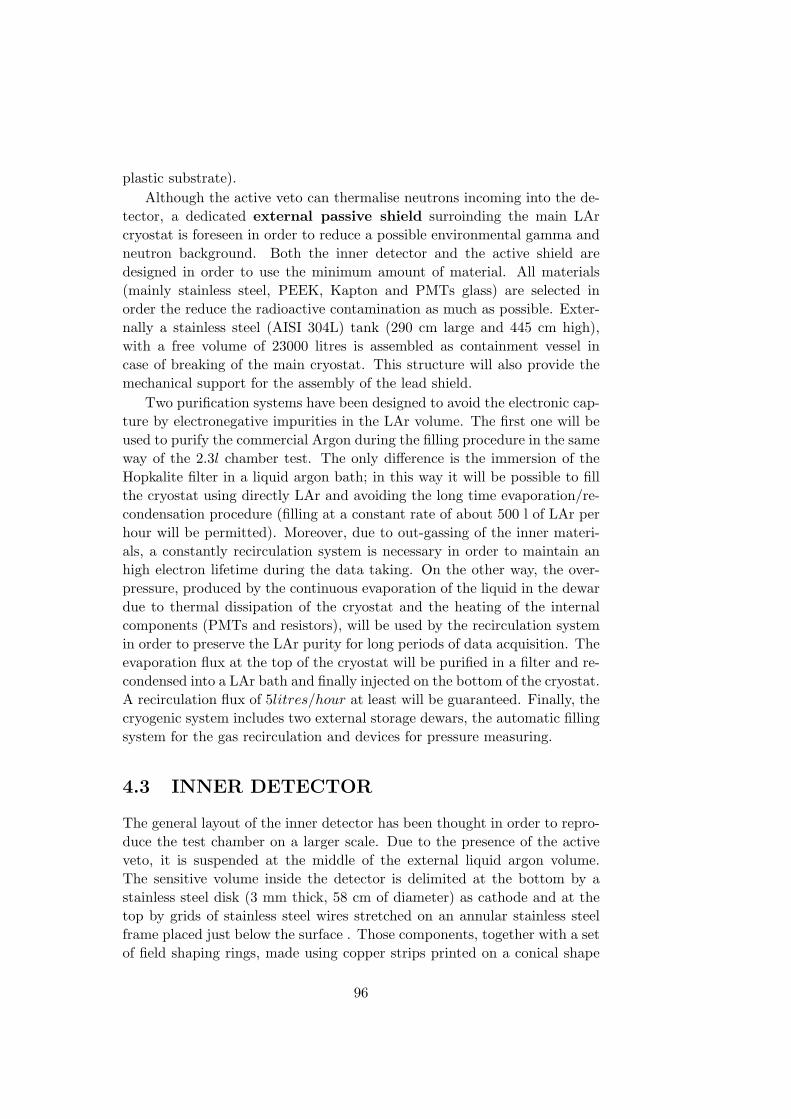
plastic substrate).Although the active veto can thermalise neutrons incoming into the de-
tector, a dedicated external passive shield surroinding the main LArcryostat is foreseen in order to reduce a possible environmental gamma andneutron background. Both the inner detector and the active shield aredesigned in order to use the minimum amount of material. All materials(mainly stainless steel, PEEK, Kapton and PMTs glass) are selected inorder the reduce the radioactive contamination as much as possible. Exter-nally a stainless steel (AISI 304L) tank (290 cm large and 445 cm high),with a free volume of 23000 litres is assembled as containment vessel incase of breaking of the main cryostat. This structure will also provide themechanical support for the assembly of the lead shield.
Two purification systems have been designed to avoid the electronic cap-ture by electronegative impurities in the LAr volume. The first one will beused to purify the commercial Argon during the filling procedure in the sameway of the 2.3l chamber test. The only difference is the immersion of theHopkalite filter in a liquid argon bath; in this way it will be possible to fillthe cryostat using directly LAr and avoiding the long time evaporation/re-condensation procedure (filling at a constant rate of about 500 l of LAr perhour will be permitted). Moreover, due to out-gassing of the inner materi-als, a constantly recirculation system is necessary in order to maintain anhigh electron lifetime during the data taking. On the other way, the over-pressure, produced by the continuous evaporation of the liquid in the dewardue to thermal dissipation of the cryostat and the heating of the internalcomponents (PMTs and resistors), will be used by the recirculation systemin order to preserve the LAr purity for long periods of data acquisition. Theevaporation flux at the top of the cryostat will be purified in a filter and re-condensed into a LAr bath and finally injected on the bottom of the cryostat.A recirculation flux of 5litres/hour at least will be guaranteed. Finally, thecryogenic system includes two external storage dewars, the automatic fillingsystem for the gas recirculation and devices for pressure measuring.
4.3 INNER DETECTOR
The general layout of the inner detector has been thought in order to repro-duce the test chamber on a larger scale. Due to the presence of the activeveto, it is suspended at the middle of the external liquid argon volume.The sensitive volume inside the detector is delimited at the bottom by astainless steel disk (3 mm thick, 58 cm of diameter) as cathode and at thetop by grids of stainless steel wires stretched on an annular stainless steelframe placed just below the surface . Those components, together with a setof field shaping rings, made using copper strips printed on a conical shape
96
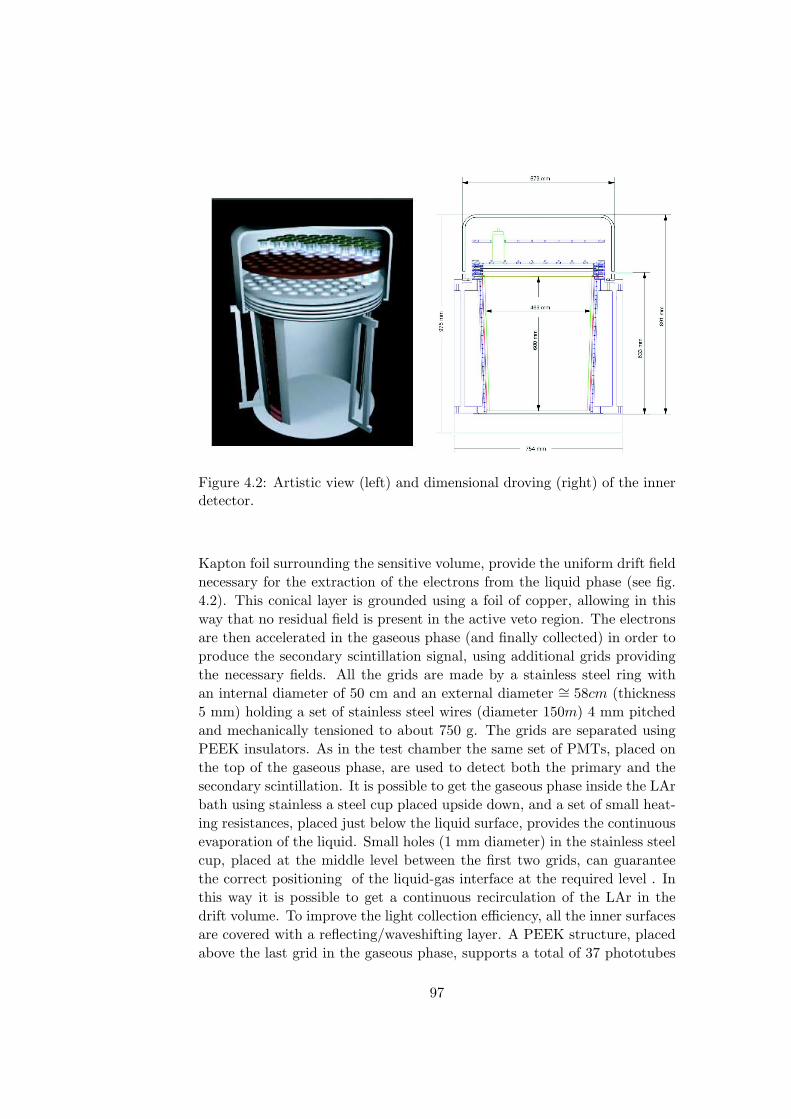
Figure 4.2: Artistic view (left) and dimensional droving (right) of the innerdetector.
Kapton foil surrounding the sensitive volume, provide the uniform drift fieldnecessary for the extraction of the electrons from the liquid phase (see fig.4.2). This conical layer is grounded using a foil of copper, allowing in thisway that no residual field is present in the active veto region. The electronsare then accelerated in the gaseous phase (and finally collected) in order toproduce the secondary scintillation signal, using additional grids providingthe necessary fields. All the grids are made by a stainless steel ring withan internal diameter of 50 cm and an external diameter ∼= 58cm (thickness5 mm) holding a set of stainless steel wires (diameter 150m) 4 mm pitchedand mechanically tensioned to about 750 g. The grids are separated usingPEEK insulators. As in the test chamber the same set of PMTs, placed onthe top of the gaseous phase, are used to detect both the primary and thesecondary scintillation. It is possible to get the gaseous phase inside the LArbath using stainless a steel cup placed upside down, and a set of small heat-ing resistances, placed just below the liquid surface, provides the continuousevaporation of the liquid. Small holes (1 mm diameter) in the stainless steelcup, placed at the middle level between the first two grids, can guaranteethe correct positioning of the liquid-gas interface at the required level . Inthis way it is possible to get a continuous recirculation of the LAr in thedrift volume. To improve the light collection efficiency, all the inner surfacesare covered with a reflecting/waveshifting layer. A PEEK structure, placedabove the last grid in the gaseous phase, supports a total of 37 phototubes
97
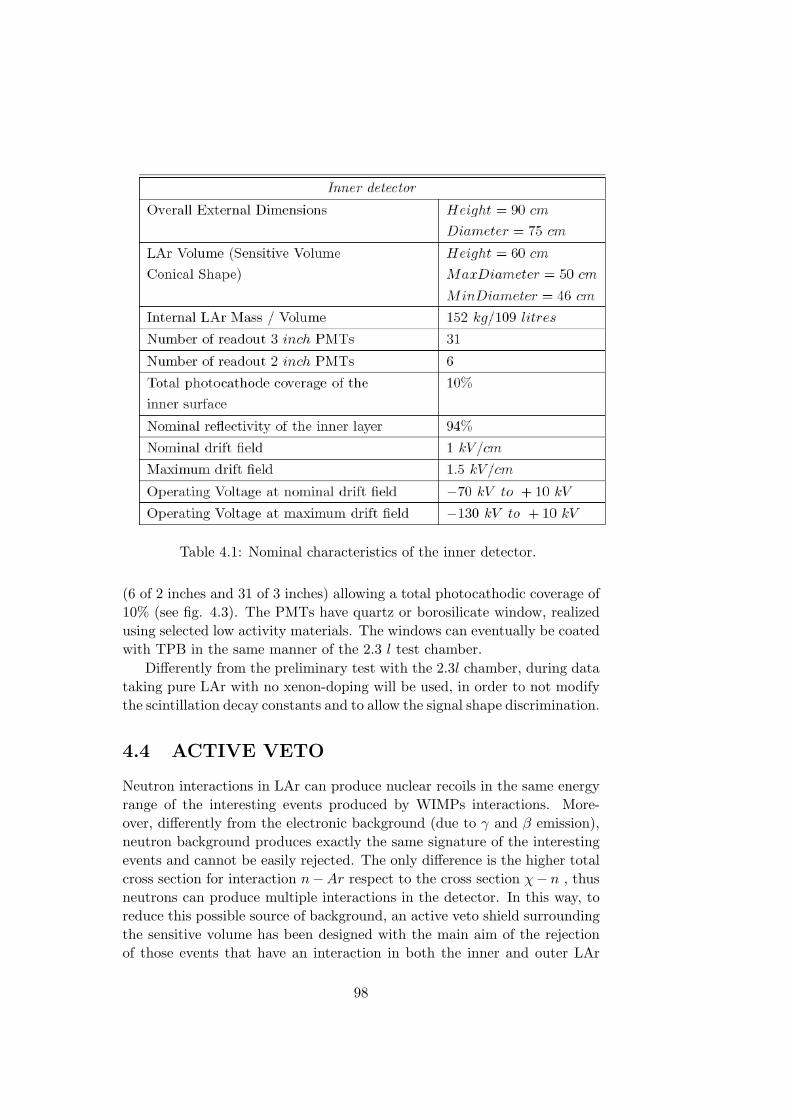
Table 4.1: Nominal characteristics of the inner detector.
(6 of 2 inches and 31 of 3 inches) allowing a total photocathodic coverage of10% (see fig. 4.3). The PMTs have quartz or borosilicate window, realizedusing selected low activity materials. The windows can eventually be coatedwith TPB in the same manner of the 2.3 l test chamber.
Differently from the preliminary test with the 2.3l chamber, during datataking pure LAr with no xenon-doping will be used, in order to not modifythe scintillation decay constants and to allow the signal shape discrimination.
4.4 ACTIVE VETO
Neutron interactions in LAr can produce nuclear recoils in the same energyrange of the interesting events produced by WIMPs interactions. More-over, differently from the electronic background (due to γ and β emission),neutron background produces exactly the same signature of the interestingevents and cannot be easily rejected. The only difference is the higher totalcross section for interaction n−Ar respect to the cross section χ− n , thusneutrons can produce multiple interactions in the detector. In this way, toreduce this possible source of background, an active veto shield surroundingthe sensitive volume has been designed with the main aim of the rejectionof those events that have an interaction in both the inner and outer LAr
98
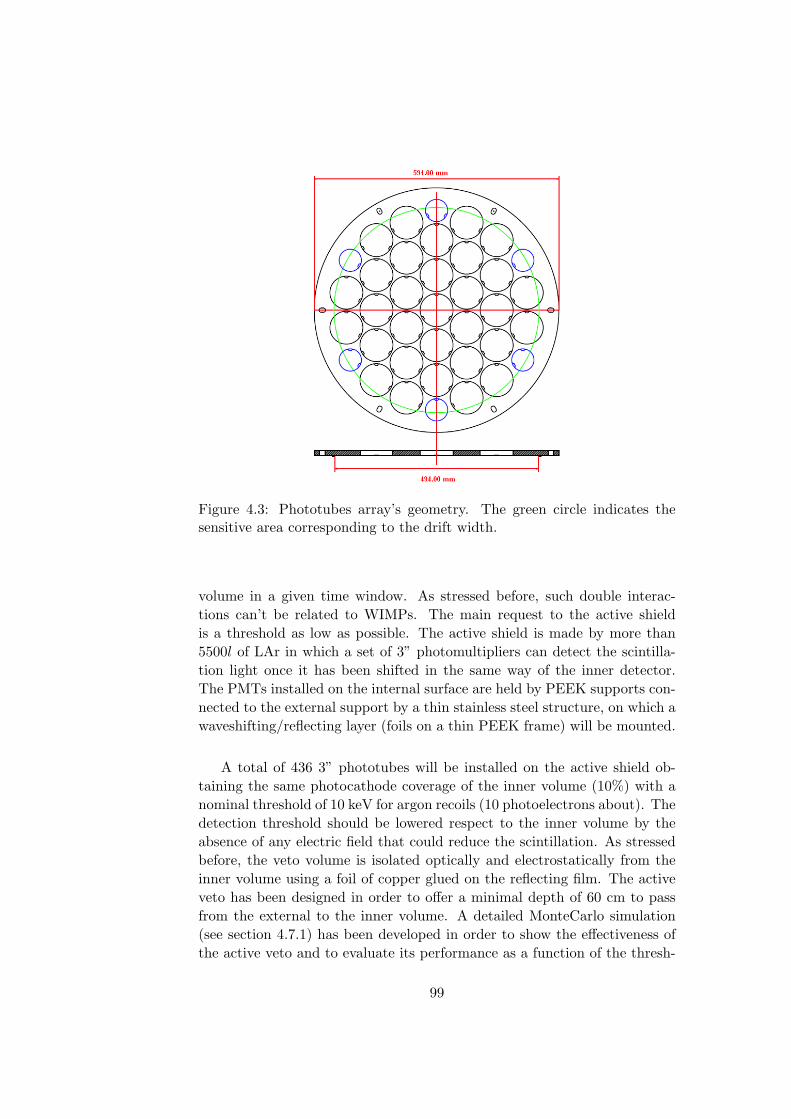
Figure 4.3: Phototubes array’s geometry. The green circle indicates thesensitive area corresponding to the drift width.
volume in a given time window. As stressed before, such double interac-tions can’t be related to WIMPs. The main request to the active shieldis a threshold as low as possible. The active shield is made by more than5500l of LAr in which a set of 3” photomultipliers can detect the scintilla-tion light once it has been shifted in the same way of the inner detector.The PMTs installed on the internal surface are held by PEEK supports con-nected to the external support by a thin stainless steel structure, on which awaveshifting/reflecting layer (foils on a thin PEEK frame) will be mounted.
A total of 436 3” phototubes will be installed on the active shield ob-taining the same photocathode coverage of the inner volume (10%) with anominal threshold of 10 keV for argon recoils (10 photoelectrons about). Thedetection threshold should be lowered respect to the inner volume by theabsence of any electric field that could reduce the scintillation. As stressedbefore, the veto volume is isolated optically and electrostatically from theinner volume using a foil of copper glued on the reflecting film. The activeveto has been designed in order to offer a minimal depth of 60 cm to passfrom the external to the inner volume. A detailed MonteCarlo simulation(see section 4.7.1) has been developed in order to show the effectiveness ofthe active veto and to evaluate its performance as a function of the thresh-
99
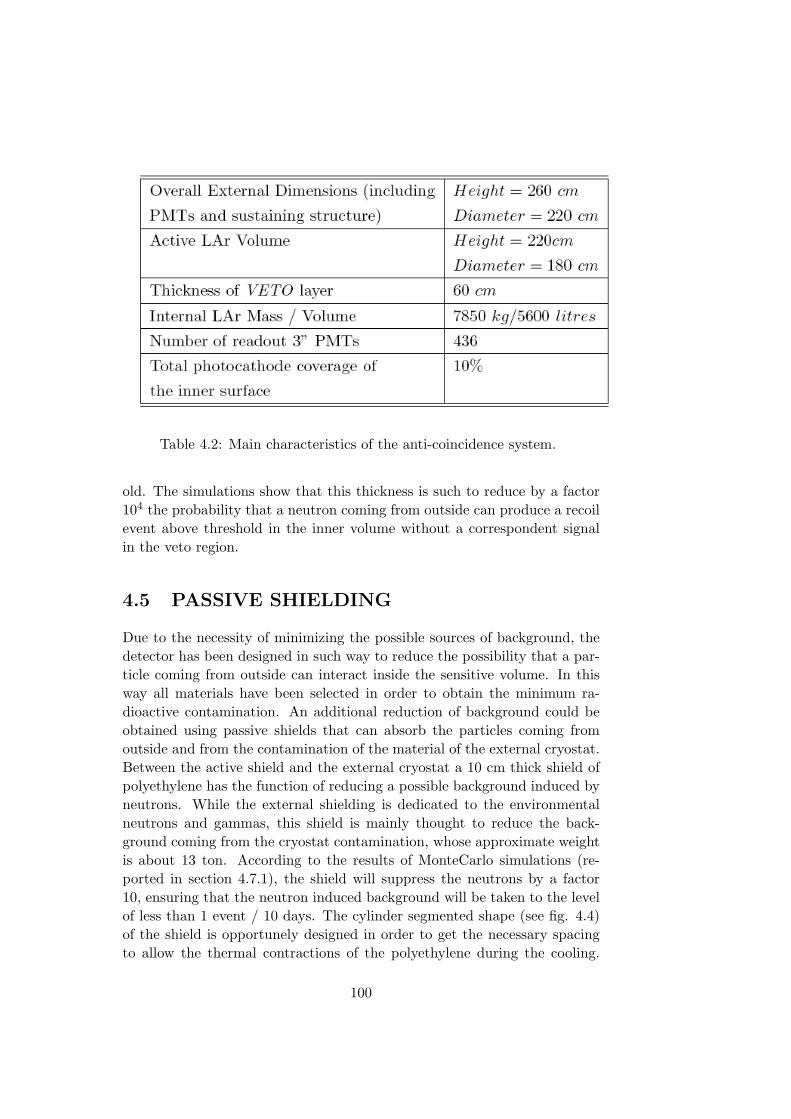
Table 4.2: Main characteristics of the anti-coincidence system.
old. The simulations show that this thickness is such to reduce by a factor104 the probability that a neutron coming from outside can produce a recoilevent above threshold in the inner volume without a correspondent signalin the veto region.
4.5 PASSIVE SHIELDING
Due to the necessity of minimizing the possible sources of background, thedetector has been designed in such way to reduce the possibility that a par-ticle coming from outside can interact inside the sensitive volume. In thisway all materials have been selected in order to obtain the minimum ra-dioactive contamination. An additional reduction of background could beobtained using passive shields that can absorb the particles coming fromoutside and from the contamination of the material of the external cryostat.Between the active shield and the external cryostat a 10 cm thick shield ofpolyethylene has the function of reducing a possible background induced byneutrons. While the external shielding is dedicated to the environmentalneutrons and gammas, this shield is mainly thought to reduce the back-ground coming from the cryostat contamination, whose approximate weightis about 13 ton. According to the results of MonteCarlo simulations (re-ported in section 4.7.1), the shield will suppress the neutrons by a factor10, ensuring that the neutron induced background will be taken to the levelof less than 1 event / 10 days. The cylinder segmented shape (see fig. 4.4)of the shield is opportunely designed in order to get the necessary spacingto allow the thermal contractions of the polyethylene during the cooling.
100
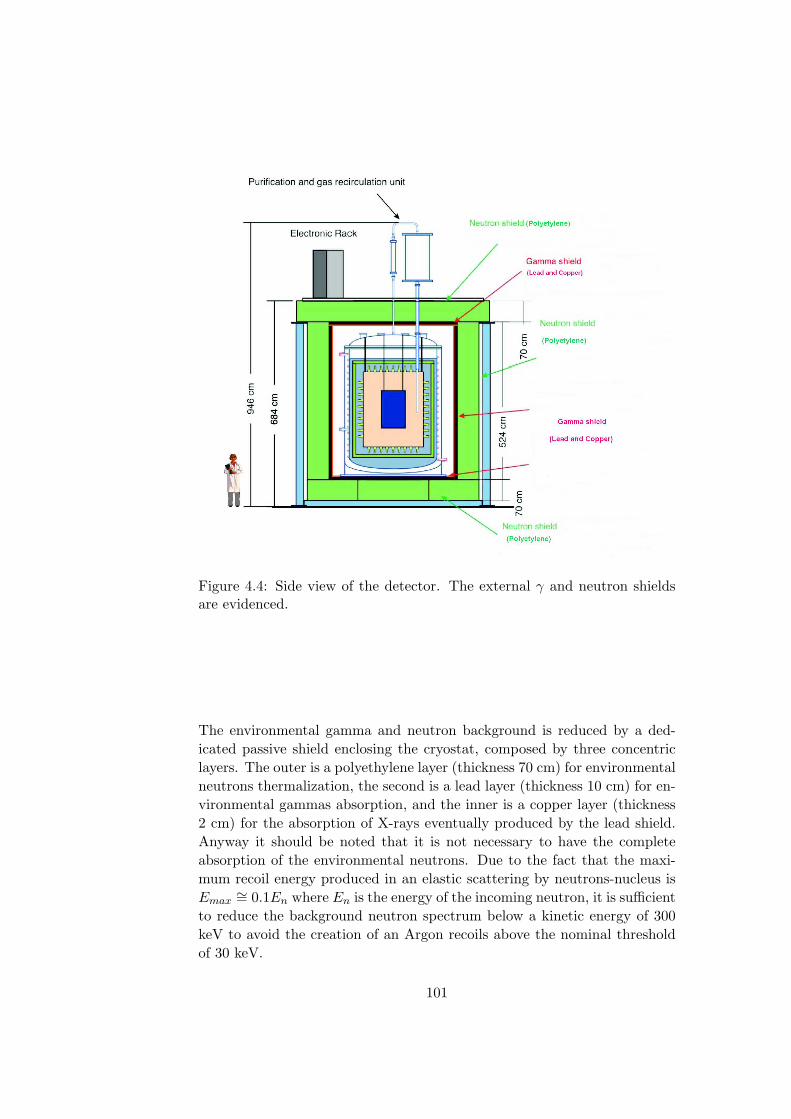
Figure 4.4: Side view of the detector. The external γ and neutron shieldsare evidenced.
The environmental gamma and neutron background is reduced by a ded-icated passive shield enclosing the cryostat, composed by three concentriclayers. The outer is a polyethylene layer (thickness 70 cm) for environmentalneutrons thermalization, the second is a lead layer (thickness 10 cm) for en-vironmental gammas absorption, and the inner is a copper layer (thickness2 cm) for the absorption of X-rays eventually produced by the lead shield.Anyway it should be noted that it is not necessary to have the completeabsorption of the environmental neutrons. Due to the fact that the maxi-mum recoil energy produced in an elastic scattering by neutrons-nucleus isEmax
∼= 0.1En where En is the energy of the incoming neutron, it is sufficientto reduce the background neutron spectrum below a kinetic energy of 300keV to avoid the creation of an Argon recoils above the nominal thresholdof 30 keV.
101
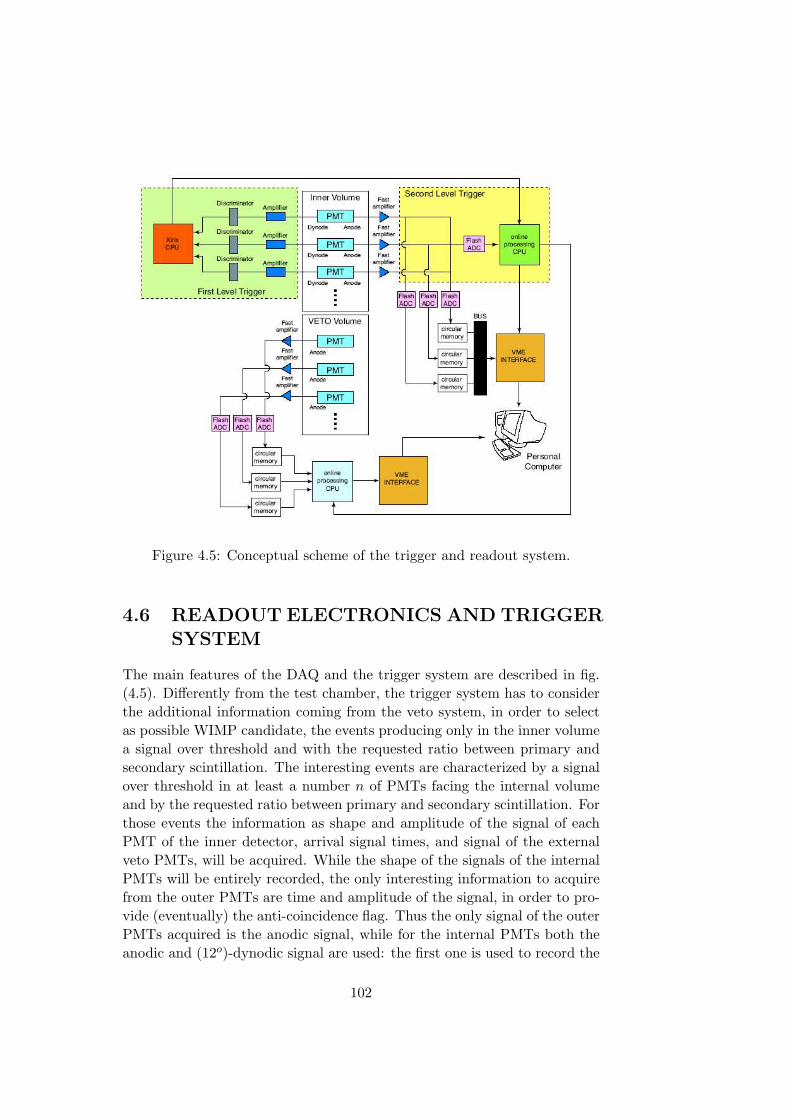
Figure 4.5: Conceptual scheme of the trigger and readout system.
4.6 READOUT ELECTRONICS AND TRIGGERSYSTEM
The main features of the DAQ and the trigger system are described in fig.(4.5). Differently from the test chamber, the trigger system has to considerthe additional information coming from the veto system, in order to selectas possible WIMP candidate, the events producing only in the inner volumea signal over threshold and with the requested ratio between primary andsecondary scintillation. The interesting events are characterized by a signalover threshold in at least a number n of PMTs facing the internal volumeand by the requested ratio between primary and secondary scintillation. Forthose events the information as shape and amplitude of the signal of eachPMT of the inner detector, arrival signal times, and signal of the externalveto PMTs, will be acquired. While the shape of the signals of the internalPMTs will be entirely recorded, the only interesting information to acquirefrom the outer PMTs are time and amplitude of the signal, in order to pro-vide (eventually) the anti-coincidence flag. Thus the only signal of the outerPMTs acquired is the anodic signal, while for the internal PMTs both theanodic and (12o)-dynodic signal are used: the first one is used to record the
102
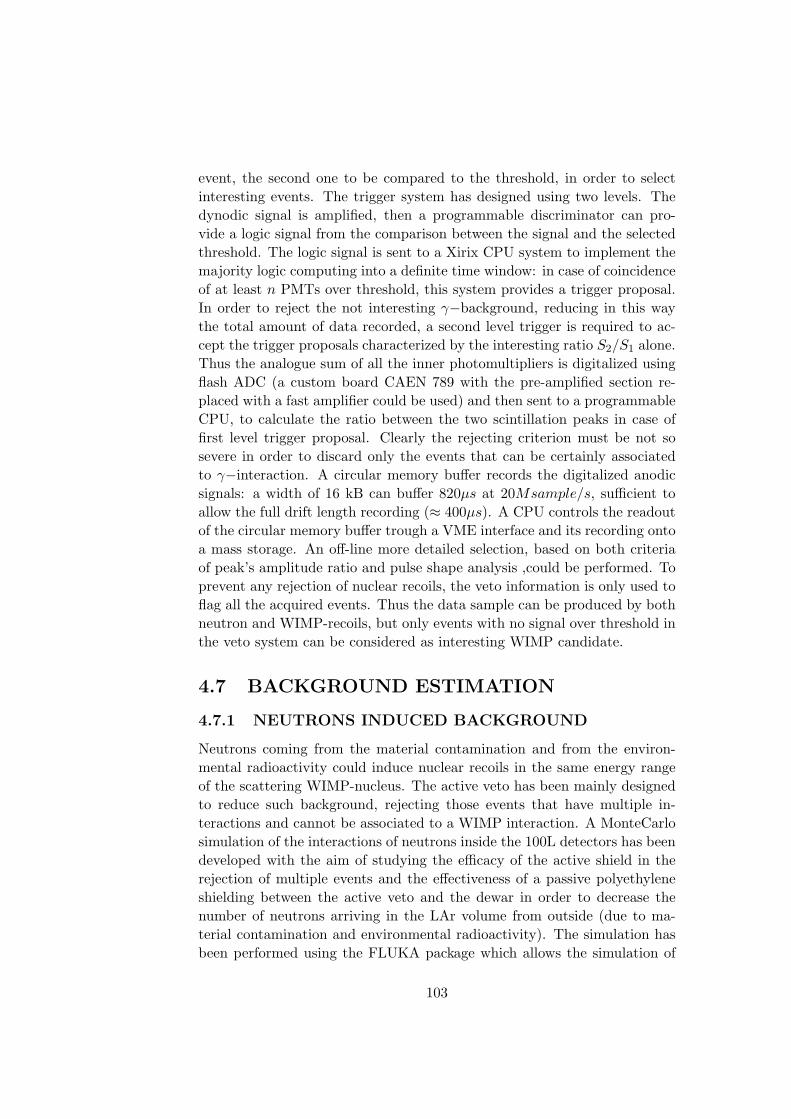
event, the second one to be compared to the threshold, in order to selectinteresting events. The trigger system has designed using two levels. Thedynodic signal is amplified, then a programmable discriminator can pro-vide a logic signal from the comparison between the signal and the selectedthreshold. The logic signal is sent to a Xirix CPU system to implement themajority logic computing into a definite time window: in case of coincidenceof at least n PMTs over threshold, this system provides a trigger proposal.In order to reject the not interesting γ−background, reducing in this waythe total amount of data recorded, a second level trigger is required to ac-cept the trigger proposals characterized by the interesting ratio S2/S1 alone.Thus the analogue sum of all the inner photomultipliers is digitalized usingflash ADC (a custom board CAEN 789 with the pre-amplified section re-placed with a fast amplifier could be used) and then sent to a programmableCPU, to calculate the ratio between the two scintillation peaks in case offirst level trigger proposal. Clearly the rejecting criterion must be not sosevere in order to discard only the events that can be certainly associatedto γ−interaction. A circular memory buffer records the digitalized anodicsignals: a width of 16 kB can buffer 820µs at 20Msample/s, sufficient toallow the full drift length recording (≈ 400µs). A CPU controls the readoutof the circular memory buffer trough a VME interface and its recording ontoa mass storage. An off-line more detailed selection, based on both criteriaof peak’s amplitude ratio and pulse shape analysis ,could be performed. Toprevent any rejection of nuclear recoils, the veto information is only used toflag all the acquired events. Thus the data sample can be produced by bothneutron and WIMP-recoils, but only events with no signal over threshold inthe veto system can be considered as interesting WIMP candidate.
4.7 BACKGROUND ESTIMATION
4.7.1 NEUTRONS INDUCED BACKGROUND
Neutrons coming from the material contamination and from the environ-mental radioactivity could induce nuclear recoils in the same energy rangeof the scattering WIMP-nucleus. The active veto has been mainly designedto reduce such background, rejecting those events that have multiple in-teractions and cannot be associated to a WIMP interaction. A MonteCarlosimulation of the interactions of neutrons inside the 100L detectors has beendeveloped with the aim of studying the efficacy of the active shield in therejection of multiple events and the effectiveness of a passive polyethyleneshielding between the active veto and the dewar in order to decrease thenumber of neutrons arriving in the LAr volume from outside (due to ma-terial contamination and environmental radioactivity). The simulation hasbeen performed using the FLUKA package which allows the simulation of
103
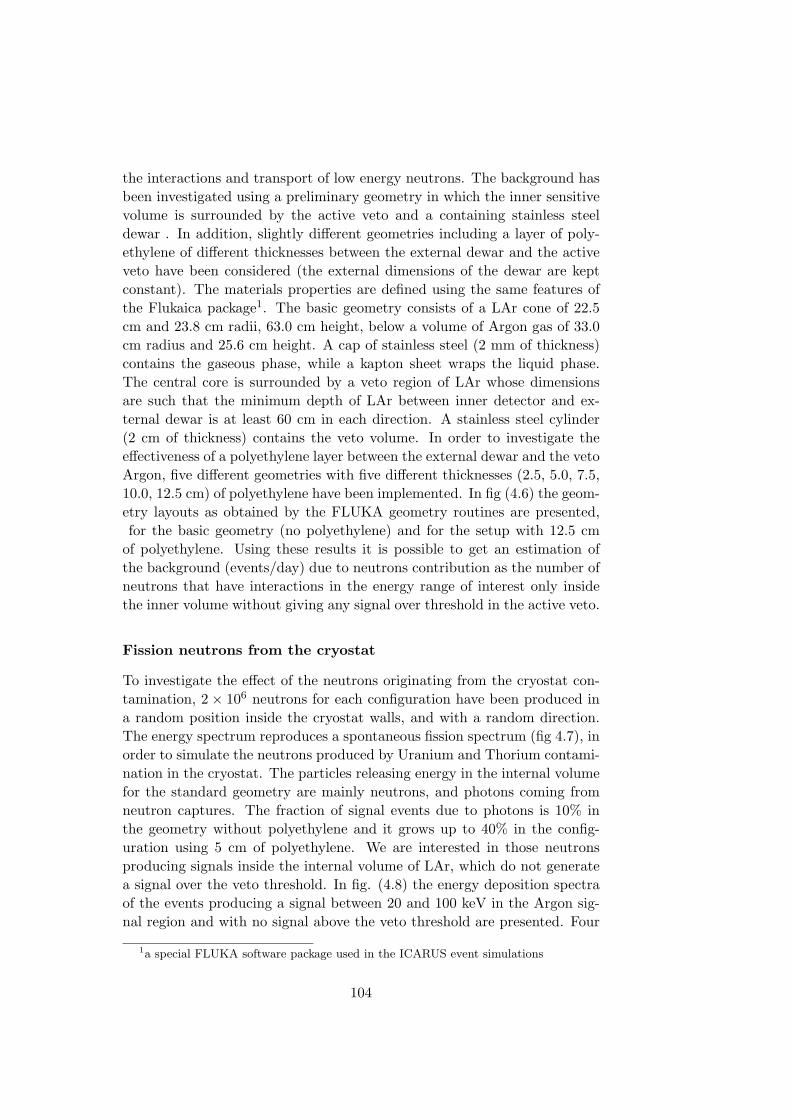
the interactions and transport of low energy neutrons. The background hasbeen investigated using a preliminary geometry in which the inner sensitivevolume is surrounded by the active veto and a containing stainless steeldewar . In addition, slightly different geometries including a layer of poly-ethylene of different thicknesses between the external dewar and the activeveto have been considered (the external dimensions of the dewar are keptconstant). The materials properties are defined using the same features ofthe Flukaica package1. The basic geometry consists of a LAr cone of 22.5cm and 23.8 cm radii, 63.0 cm height, below a volume of Argon gas of 33.0cm radius and 25.6 cm height. A cap of stainless steel (2 mm of thickness)contains the gaseous phase, while a kapton sheet wraps the liquid phase.The central core is surrounded by a veto region of LAr whose dimensionsare such that the minimum depth of LAr between inner detector and ex-ternal dewar is at least 60 cm in each direction. A stainless steel cylinder(2 cm of thickness) contains the veto volume. In order to investigate theeffectiveness of a polyethylene layer between the external dewar and the vetoArgon, five different geometries with five different thicknesses (2.5, 5.0, 7.5,10.0, 12.5 cm) of polyethylene have been implemented. In fig (4.6) the geom-etry layouts as obtained by the FLUKA geometry routines are presented,for the basic geometry (no polyethylene) and for the setup with 12.5 cm
of polyethylene. Using these results it is possible to get an estimation ofthe background (events/day) due to neutrons contribution as the number ofneutrons that have interactions in the energy range of interest only insidethe inner volume without giving any signal over threshold in the active veto.
Fission neutrons from the cryostat
To investigate the effect of the neutrons originating from the cryostat con-tamination, 2× 10⁶ neutrons for each configuration have been produced ina random position inside the cryostat walls, and with a random direction.The energy spectrum reproduces a spontaneous fission spectrum (fig 4.7), inorder to simulate the neutrons produced by Uranium and Thorium contami-nation in the cryostat. The particles releasing energy in the internal volumefor the standard geometry are mainly neutrons, and photons coming fromneutron captures. The fraction of signal events due to photons is 10% inthe geometry without polyethylene and it grows up to 40% in the config-uration using 5 cm of polyethylene. We are interested in those neutronsproducing signals inside the internal volume of LAr, which do not generatea signal over the veto threshold. In fig. (4.8) the energy deposition spectraof the events producing a signal between 20 and 100 keV in the Argon sig-nal region and with no signal above the veto threshold are presented. Four
1a special FLUKA software package used in the ICARUS event simulations
104
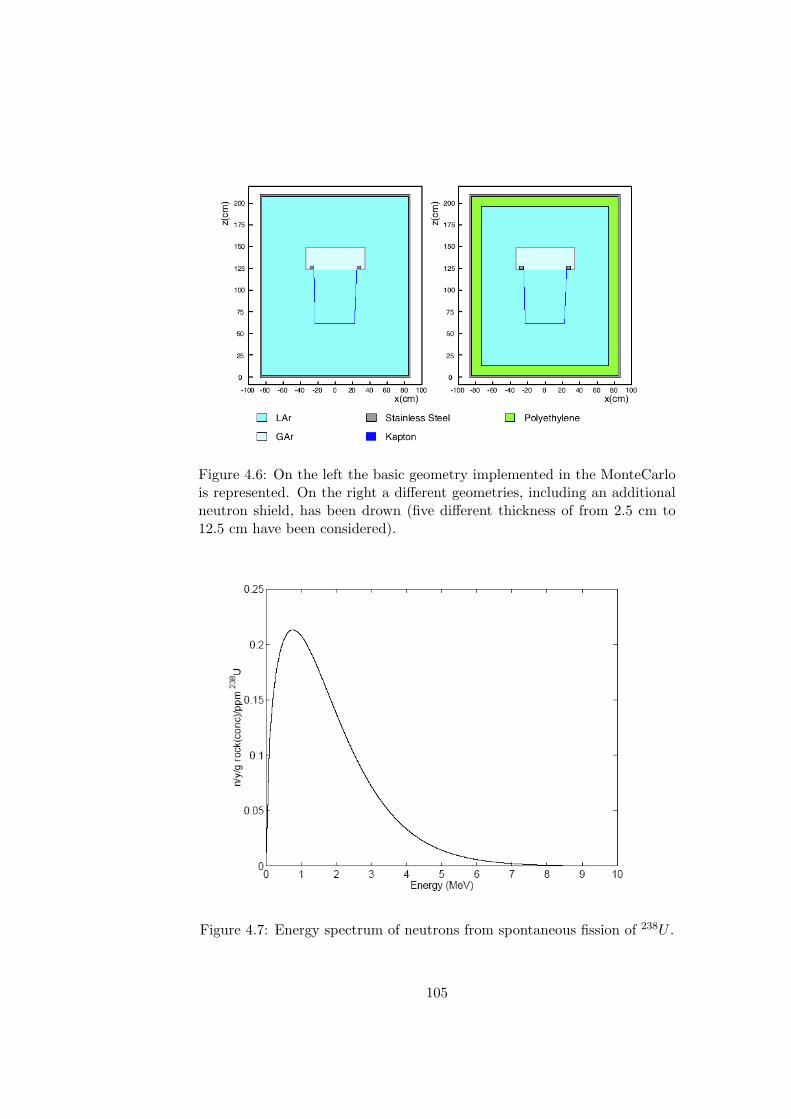
Figure 4.6: On the left the basic geometry implemented in the MonteCarlois represented. On the right a different geometries, including an additionalneutron shield, has been drown (five different thickness of from 2.5 cm to12.5 cm have been considered).
Figure 4.7: Energy spectrum of neutrons from spontaneous fission of 238U .
105
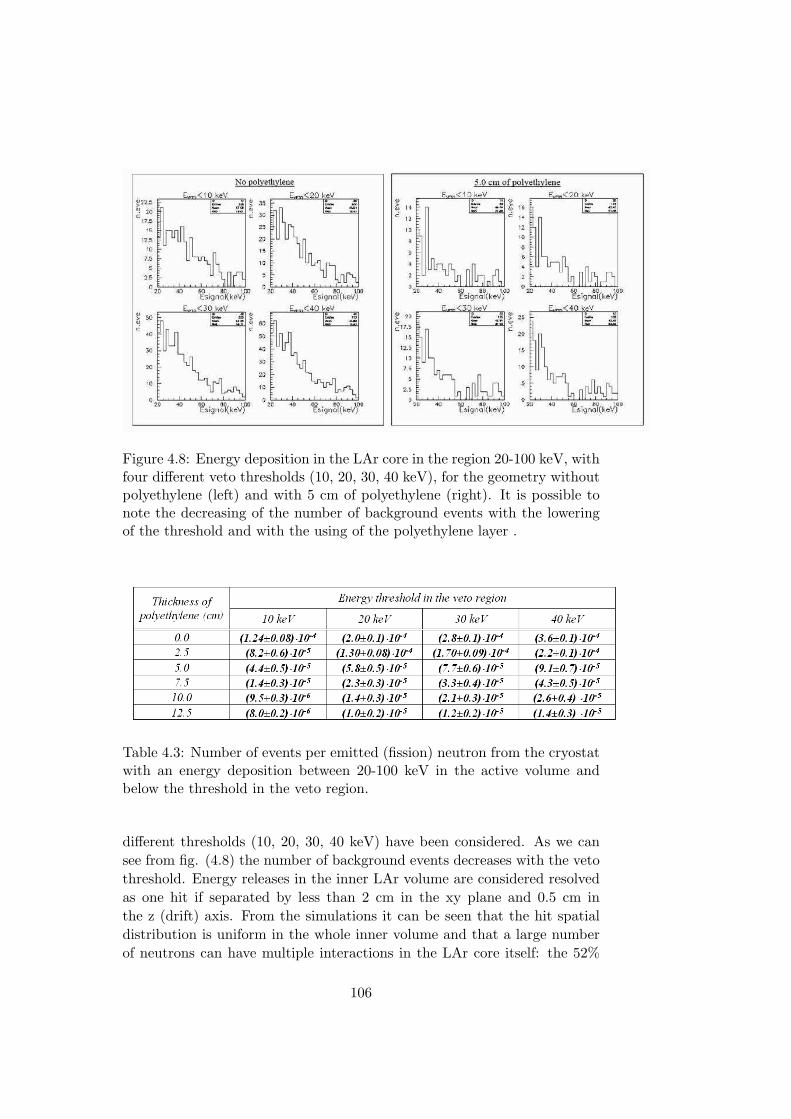
Figure 4.8: Energy deposition in the LAr core in the region 20-100 keV, withfour different veto thresholds (10, 20, 30, 40 keV), for the geometry withoutpolyethylene (left) and with 5 cm of polyethylene (right). It is possible tonote the decreasing of the number of background events with the loweringof the threshold and with the using of the polyethylene layer .
Table 4.3: Number of events per emitted (fission) neutron from the cryostatwith an energy deposition between 20-100 keV in the active volume andbelow the threshold in the veto region.
different thresholds (10, 20, 30, 40 keV) have been considered. As we cansee from fig. (4.8) the number of background events decreases with the vetothreshold. Energy releases in the inner LAr volume are considered resolvedas one hit if separated by less than 2 cm in the xy plane and 0.5 cm inthe z (drift) axis. From the simulations it can be seen that the hit spatialdistribution is uniform in the whole inner volume and that a large numberof neutrons can have multiple interactions in the LAr core itself: the 52%
106
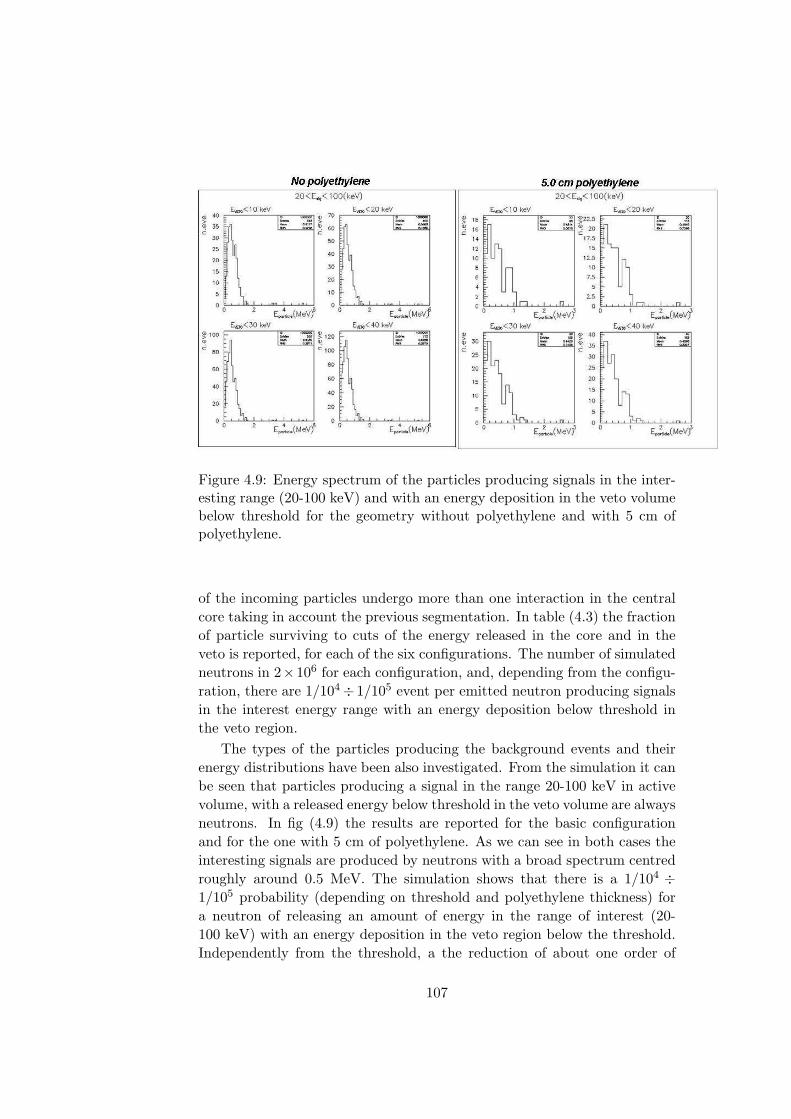
Figure 4.9: Energy spectrum of the particles producing signals in the inter-esting range (20-100 keV) and with an energy deposition in the veto volumebelow threshold for the geometry without polyethylene and with 5 cm ofpolyethylene.
of the incoming particles undergo more than one interaction in the centralcore taking in account the previous segmentation. In table (4.3) the fractionof particle surviving to cuts of the energy released in the core and in theveto is reported, for each of the six configurations. The number of simulatedneutrons in 2×10⁶ for each configuration, and, depending from the configu-ration, there are 1/104÷ 1/105 event per emitted neutron producing signalsin the interest energy range with an energy deposition below threshold inthe veto region.
The types of the particles producing the background events and theirenergy distributions have been also investigated. From the simulation it canbe seen that particles producing a signal in the range 20-100 keV in activevolume, with a released energy below threshold in the veto volume are alwaysneutrons. In fig (4.9) the results are reported for the basic configurationand for the one with 5 cm of polyethylene. As we can see in both cases theinteresting signals are produced by neutrons with a broad spectrum centredroughly around 0.5 MeV. The simulation shows that there is a 1/104 ÷1/105 probability (depending on threshold and polyethylene thickness) fora neutron of releasing an amount of energy in the range of interest (20-100 keV) with an energy deposition in the veto region below the threshold.Independently from the threshold, a the reduction of about one order of
107
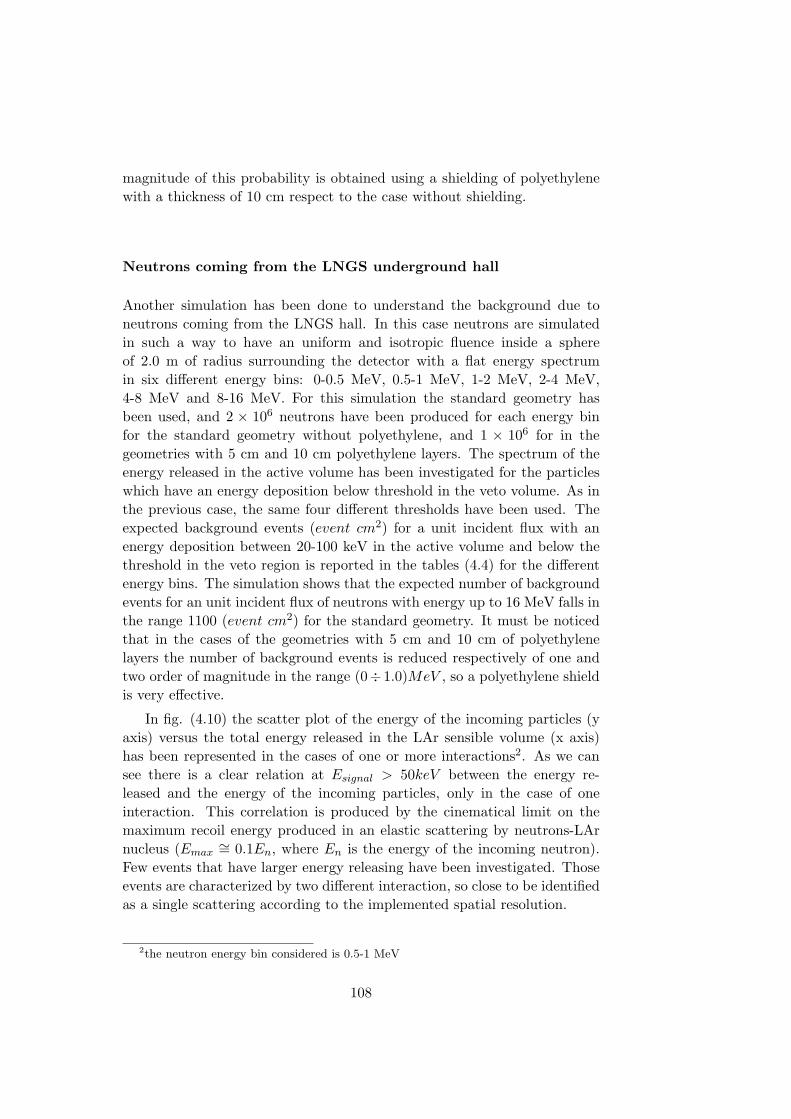
magnitude of this probability is obtained using a shielding of polyethylenewith a thickness of 10 cm respect to the case without shielding.
Neutrons coming from the LNGS underground hall
Another simulation has been done to understand the background due toneutrons coming from the LNGS hall. In this case neutrons are simulatedin such a way to have an uniform and isotropic fluence inside a sphereof 2.0 m of radius surrounding the detector with a flat energy spectrumin six different energy bins: 0-0.5 MeV, 0.5-1 MeV, 1-2 MeV, 2-4 MeV,4-8 MeV and 8-16 MeV. For this simulation the standard geometry hasbeen used, and 2 × 10⁶ neutrons have been produced for each energy binfor the standard geometry without polyethylene, and 1 × 10⁶ for in thegeometries with 5 cm and 10 cm polyethylene layers. The spectrum of theenergy released in the active volume has been investigated for the particleswhich have an energy deposition below threshold in the veto volume. As inthe previous case, the same four different thresholds have been used. Theexpected background events (event cm2) for a unit incident flux with anenergy deposition between 20-100 keV in the active volume and below thethreshold in the veto region is reported in the tables (4.4) for the differentenergy bins. The simulation shows that the expected number of backgroundevents for an unit incident flux of neutrons with energy up to 16 MeV falls inthe range 1100 (event cm2) for the standard geometry. It must be noticedthat in the cases of the geometries with 5 cm and 10 cm of polyethylenelayers the number of background events is reduced respectively of one andtwo order of magnitude in the range (0÷ 1.0)MeV , so a polyethylene shieldis very effective.
In fig. (4.10) the scatter plot of the energy of the incoming particles (yaxis) versus the total energy released in the LAr sensible volume (x axis)has been represented in the cases of one or more interactions2. As we cansee there is a clear relation at Esignal > 50keV between the energy re-leased and the energy of the incoming particles, only in the case of oneinteraction. This correlation is produced by the cinematical limit on themaximum recoil energy produced in an elastic scattering by neutrons-LArnucleus (Emax
∼= 0.1En, where En is the energy of the incoming neutron).Few events that have larger energy releasing have been investigated. Thoseevents are characterized by two different interaction, so close to be identifiedas a single scattering according to the implemented spatial resolution.
2the neutron energy bin considered is 0.5-1 MeV
108
Table 4.4: Expected background events (evt cm2) for a unit incident fluxwith an energy deposition between 20-100 keV in the active volume andbelow the threshold in the veto region, for the different energy ranges andgeometries (no shield, 5.0 cm and 10.0 cm of shielding).
Fission neutrons from the internal material contamination
The last neutron simulation dealt with neutrons coming from the conta-mination of the inner materials. The internal geometry has been dividedin two parts: the stainless steel cathode and the stainless steel cap. Eachpart has been considered as a neutron source, with random direction andenergy spectrum reproducing a (uncorrelated) spontaneous fission spectrumas in the case of the neutrons coming from the external dewar. A total of(2 × 10⁵) neutrons from the cathode and (3.31 × 10⁵) from the cap havebeen simulated using the standard geometry. It should be noticed that, duethe lower mass of the internal components, a little number of neutrons is
109
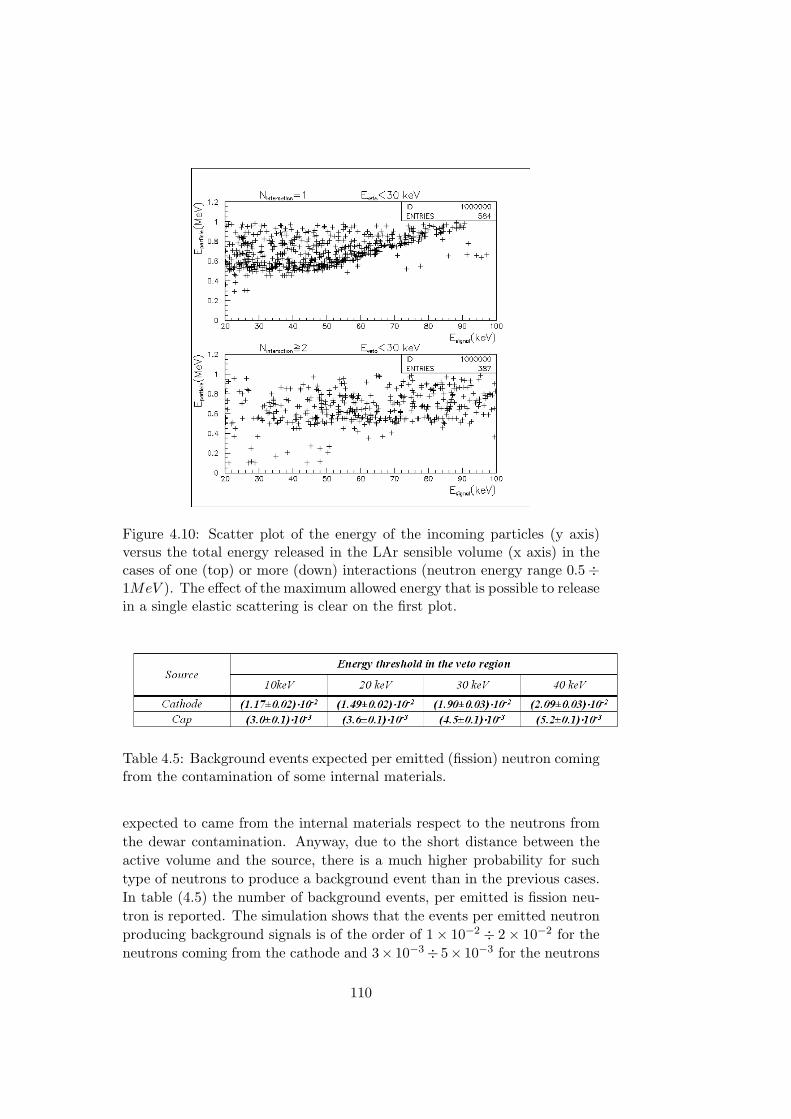
Figure 4.10: Scatter plot of the energy of the incoming particles (y axis)versus the total energy released in the LAr sensible volume (x axis) in thecases of one (top) or more (down) interactions (neutron energy range 0.5÷1MeV ). The effect of the maximum allowed energy that is possible to releasein a single elastic scattering is clear on the first plot.
Table 4.5: Background events expected per emitted (fission) neutron comingfrom the contamination of some internal materials.
expected to came from the internal materials respect to the neutrons fromthe dewar contamination. Anyway, due to the short distance between theactive volume and the source, there is a much higher probability for suchtype of neutrons to produce a background event than in the previous cases.In table (4.5) the number of background events, per emitted is fission neu-tron is reported. The simulation shows that the events per emitted neutronproducing background signals is of the order of 1× 10⁻² ÷ 2× 10⁻² for theneutrons coming from the cathode and 3× 10⁻³÷ 5× 10⁻³ for the neutrons
110
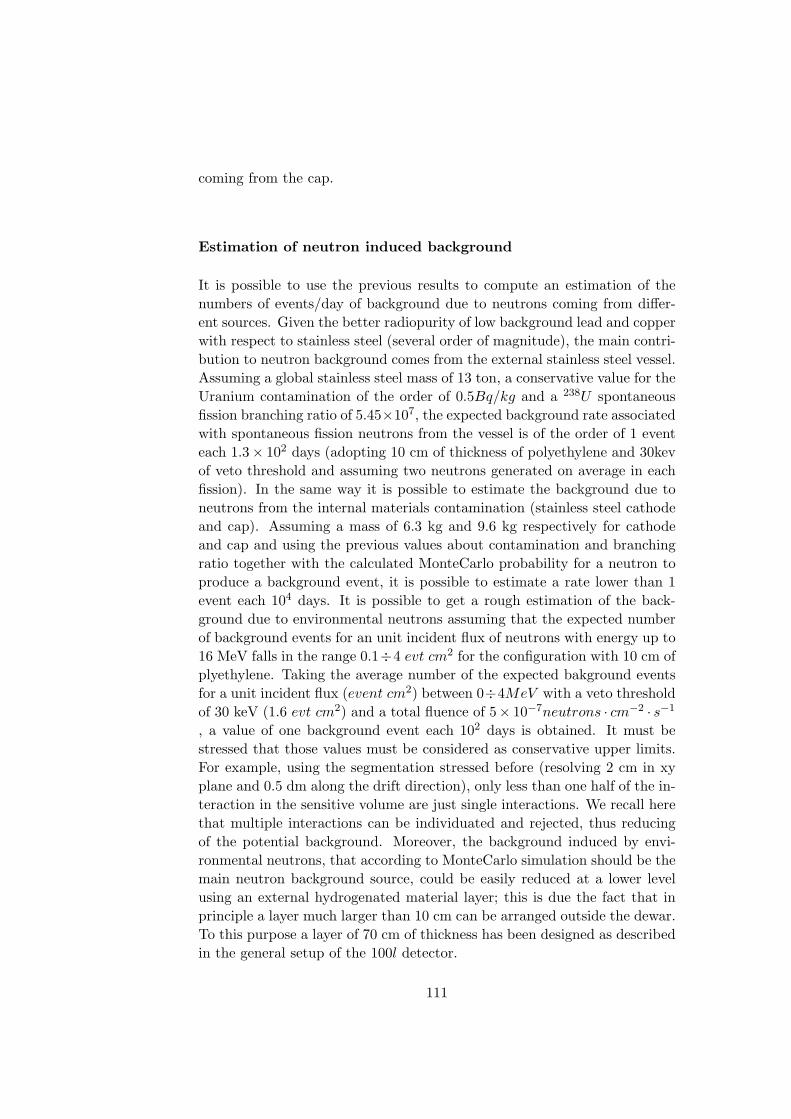
coming from the cap.
Estimation of neutron induced background
It is possible to use the previous results to compute an estimation of thenumbers of events/day of background due to neutrons coming from differ-ent sources. Given the better radiopurity of low background lead and copperwith respect to stainless steel (several order of magnitude), the main contri-bution to neutron background comes from the external stainless steel vessel.Assuming a global stainless steel mass of 13 ton, a conservative value for theUranium contamination of the order of 0.5Bq/kg and a 238U spontaneousfission branching ratio of 5.45×10⁷, the expected background rate associatedwith spontaneous fission neutrons from the vessel is of the order of 1 eventeach 1.3× 10² days (adopting 10 cm of thickness of polyethylene and 30kevof veto threshold and assuming two neutrons generated on average in eachfission). In the same way it is possible to estimate the background due toneutrons from the internal materials contamination (stainless steel cathodeand cap). Assuming a mass of 6.3 kg and 9.6 kg respectively for cathodeand cap and using the previous values about contamination and branchingratio together with the calculated MonteCarlo probability for a neutron toproduce a background event, it is possible to estimate a rate lower than 1event each 104 days. It is possible to get a rough estimation of the back-ground due to environmental neutrons assuming that the expected numberof background events for an unit incident flux of neutrons with energy up to16 MeV falls in the range 0.1÷4 evt cm2 for the configuration with 10 cm ofplyethylene. Taking the average number of the expected bakground eventsfor a unit incident flux (event cm2) between 0÷4MeV with a veto thresholdof 30 keV (1.6 evt cm2) and a total fluence of 5× 10⁻⁷neutrons · cm−2 · s−1
, a value of one background event each 102 days is obtained. It must bestressed that those values must be considered as conservative upper limits.For example, using the segmentation stressed before (resolving 2 cm in xyplane and 0.5 dm along the drift direction), only less than one half of the in-teraction in the sensitive volume are just single interactions. We recall herethat multiple interactions can be individuated and rejected, thus reducingof the potential background. Moreover, the background induced by envi-ronmental neutrons, that according to MonteCarlo simulation should be themain neutron background source, could be easily reduced at a lower levelusing an external hydrogenated material layer; this is due the fact that inprinciple a layer much larger than 10 cm can be arranged outside the dewar.To this purpose a layer of 70 cm of thickness has been designed as describedin the general setup of the 100l detector.
111
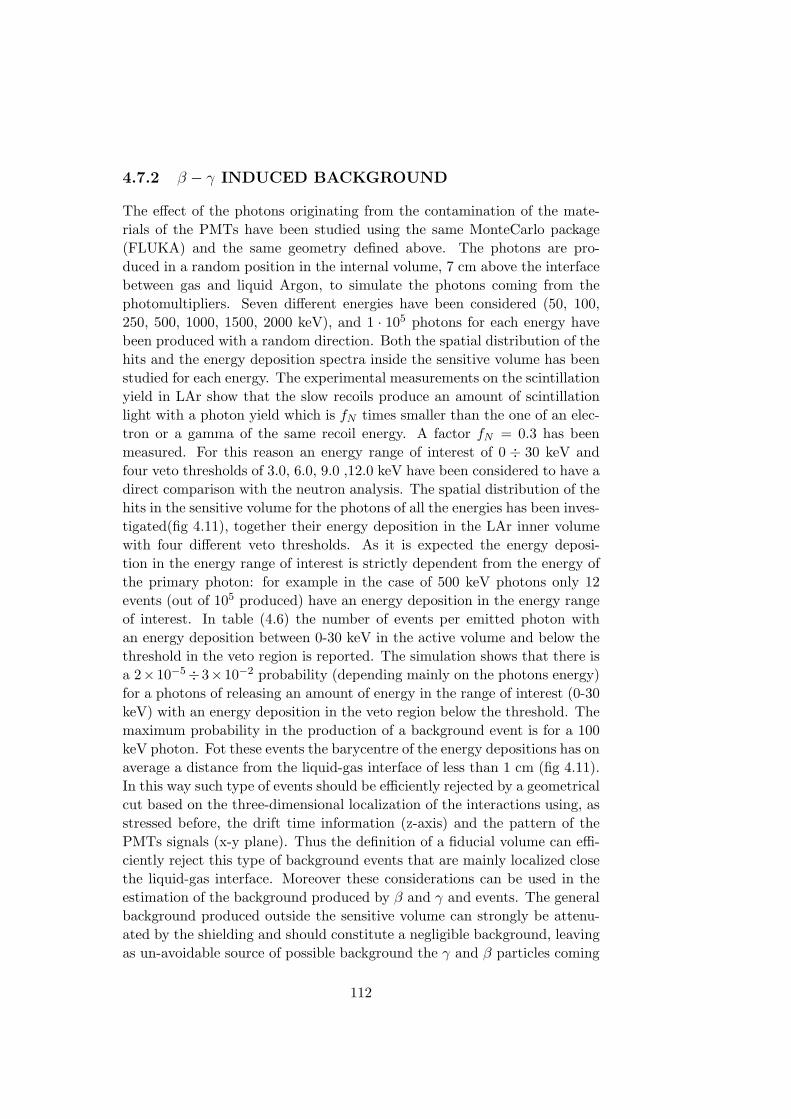
4.7.2 β − γ INDUCED BACKGROUND
The effect of the photons originating from the contamination of the mate-rials of the PMTs have been studied using the same MonteCarlo package(FLUKA) and the same geometry defined above. The photons are pro-duced in a random position in the internal volume, 7 cm above the interfacebetween gas and liquid Argon, to simulate the photons coming from thephotomultipliers. Seven different energies have been considered (50, 100,250, 500, 1000, 1500, 2000 keV), and 1 · 105 photons for each energy havebeen produced with a random direction. Both the spatial distribution of thehits and the energy deposition spectra inside the sensitive volume has beenstudied for each energy. The experimental measurements on the scintillationyield in LAr show that the slow recoils produce an amount of scintillationlight with a photon yield which is fN times smaller than the one of an elec-tron or a gamma of the same recoil energy. A factor fN = 0.3 has beenmeasured. For this reason an energy range of interest of 0 ÷ 30 keV andfour veto thresholds of 3.0, 6.0, 9.0 ,12.0 keV have been considered to have adirect comparison with the neutron analysis. The spatial distribution of thehits in the sensitive volume for the photons of all the energies has been inves-tigated(fig 4.11), together their energy deposition in the LAr inner volumewith four different veto thresholds. As it is expected the energy deposi-tion in the energy range of interest is strictly dependent from the energy ofthe primary photon: for example in the case of 500 keV photons only 12events (out of 105 produced) have an energy deposition in the energy rangeof interest. In table (4.6) the number of events per emitted photon withan energy deposition between 0-30 keV in the active volume and below thethreshold in the veto region is reported. The simulation shows that there isa 2×10⁻⁵÷3×10⁻² probability (depending mainly on the photons energy)for a photons of releasing an amount of energy in the range of interest (0-30keV) with an energy deposition in the veto region below the threshold. Themaximum probability in the production of a background event is for a 100keV photon. Fot these events the barycentre of the energy depositions has onaverage a distance from the liquid-gas interface of less than 1 cm (fig 4.11).In this way such type of events should be efficiently rejected by a geometricalcut based on the three-dimensional localization of the interactions using, asstressed before, the drift time information (z-axis) and the pattern of thePMTs signals (x-y plane). Thus the definition of a fiducial volume can effi-ciently reject this type of background events that are mainly localized closethe liquid-gas interface. Moreover these considerations can be used in theestimation of the background produced by β and γ and events. The generalbackground produced outside the sensitive volume can strongly be attenu-ated by the shielding and should constitute a negligible background, leavingas un-avoidable source of possible background the γ and β particles coming
112
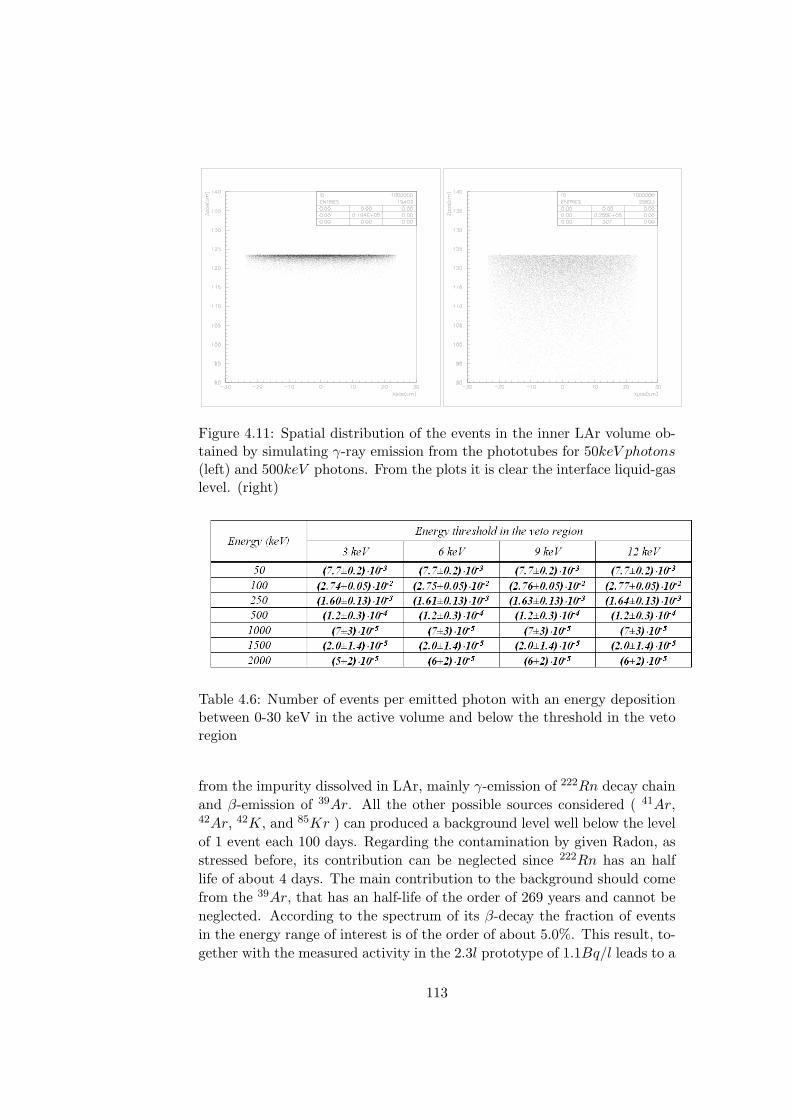
Figure 4.11: Spatial distribution of the events in the inner LAr volume ob-tained by simulating γ-ray emission from the phototubes for 50keV photons(left) and 500keV photons. From the plots it is clear the interface liquid-gaslevel. (right)
Table 4.6: Number of events per emitted photon with an energy depositionbetween 0-30 keV in the active volume and below the threshold in the vetoregion
from the impurity dissolved in LAr, mainly γ-emission of 222Rn decay chainand β-emission of 39Ar. All the other possible sources considered ( 41Ar,42Ar, 42K, and 85Kr ) can produced a background level well below the levelof 1 event each 100 days. Regarding the contamination by given Radon, asstressed before, its contribution can be neglected since 222Rn has an halflife of about 4 days. The main contribution to the background should comefrom the 39Ar, that has an half-life of the order of 269 years and cannot beneglected. According to the spectrum of its β-decay the fraction of eventsin the energy range of interest is of the order of about 5.0%. This result, to-gether with the measured activity in the 2.3l prototype of 1.1Bq/l leads to a
113
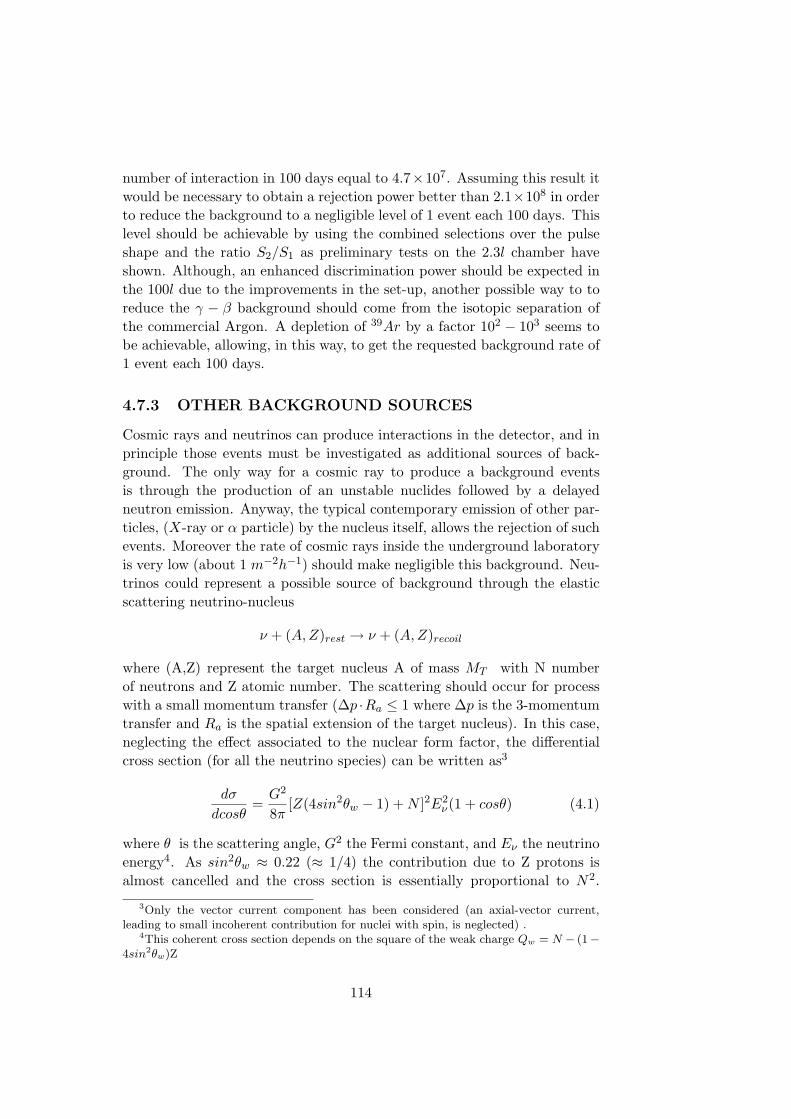
number of interaction in 100 days equal to 4.7×10⁷. Assuming this result itwould be necessary to obtain a rejection power better than 2.1×10⁸ in orderto reduce the background to a negligible level of 1 event each 100 days. Thislevel should be achievable by using the combined selections over the pulseshape and the ratio S2/S1 as preliminary tests on the 2.3l chamber haveshown. Although, an enhanced discrimination power should be expected inthe 100l due to the improvements in the set-up, another possible way to toreduce the γ − β background should come from the isotopic separation ofthe commercial Argon. A depletion of 39Ar by a factor 102 − 103 seems tobe achievable, allowing, in this way, to get the requested background rate of1 event each 100 days.
4.7.3 OTHER BACKGROUND SOURCES
Cosmic rays and neutrinos can produce interactions in the detector, and inprinciple those events must be investigated as additional sources of back-ground. The only way for a cosmic ray to produce a background eventsis through the production of an unstable nuclides followed by a delayedneutron emission. Anyway, the typical contemporary emission of other par-ticles, (X-ray or α particle) by the nucleus itself, allows the rejection of suchevents. Moreover the rate of cosmic rays inside the underground laboratoryis very low (about 1 m−2h−1) should make negligible this background. Neu-trinos could represent a possible source of background through the elasticscattering neutrino-nucleus
ν + (A,Z)rest → ν + (A, Z)recoil
where (A,Z) represent the target nucleus A of mass MT with N numberof neutrons and Z atomic number. The scattering should occur for processwith a small momentum transfer (∆p ·Ra ≤ 1 where ∆p is the 3-momentumtransfer and Ra is the spatial extension of the target nucleus). In this case,neglecting the effect associated to the nuclear form factor, the differentialcross section (for all the neutrino species) can be written as3
dσ
dcosθ=
G2
8π[Z(4sin2θw − 1) + N ]2E2
ν(1 + cosθ) (4.1)
where θ is the scattering angle, G2 the Fermi constant, and Eν the neutrinoenergy4. As sin2θw ≈ 0.22 (≈ 1/4) the contribution due to Z protons isalmost cancelled and the cross section is essentially proportional to N2.
3Only the vector current component has been considered (an axial-vector current,leading to small incoherent contribution for nuclei with spin, is neglected) .
4This coherent cross section depends on the square of the weak charge Qw = N − (1−4sin2θw)Z
114
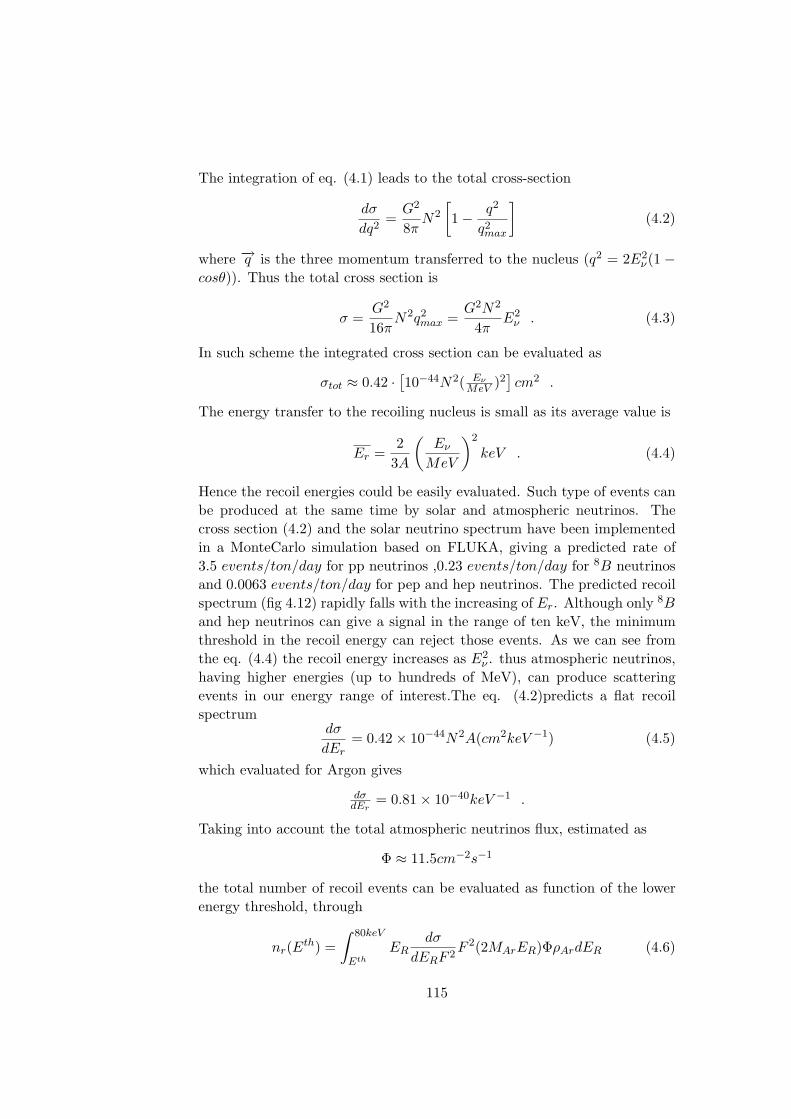
The integration of eq. (4.1) leads to the total cross-section
dσ
dq2=
G2
8πN2
[1− q2
q2max
](4.2)
where −→q is the three momentum transferred to the nucleus (q2 = 2E2ν(1 −
cosθ)). Thus the total cross section is
σ =G2
16πN2q2
max =G2N2
4πE2
ν . (4.3)
In such scheme the integrated cross section can be evaluated as
σtot ≈ 0.42 · [10−44N2( EνMeV )2
]cm2 .
The energy transfer to the recoiling nucleus is small as its average value is
Er =2
3A
(Eν
MeV
)2
keV . (4.4)
Hence the recoil energies could be easily evaluated. Such type of events canbe produced at the same time by solar and atmospheric neutrinos. Thecross section (4.2) and the solar neutrino spectrum have been implementedin a MonteCarlo simulation based on FLUKA, giving a predicted rate of3.5 events/ton/day for pp neutrinos ,0.23 events/ton/day for 8B neutrinosand 0.0063 events/ton/day for pep and hep neutrinos. The predicted recoilspectrum (fig 4.12) rapidly falls with the increasing of Er. Although only 8B
and hep neutrinos can give a signal in the range of ten keV, the minimumthreshold in the recoil energy can reject those events. As we can see fromthe eq. (4.4) the recoil energy increases as E2
ν . thus atmospheric neutrinos,having higher energies (up to hundreds of MeV), can produce scatteringevents in our energy range of interest.The eq. (4.2)predicts a flat recoilspectrum
dσ
dEr= 0.42× 10−44N2A(cm2keV −1) (4.5)
which evaluated for Argon gives
dσdEr
= 0.81× 10−40keV −1 .
Taking into account the total atmospheric neutrinos flux, estimated as
Φ ≈ 11.5cm−2s−1
the total number of recoil events can be evaluated as function of the lowerenergy threshold, through
nr(Eth) =∫ 80keV
Eth
ERdσ
dERF 2F 2(2MArER)ΦρArdER (4.6)
115
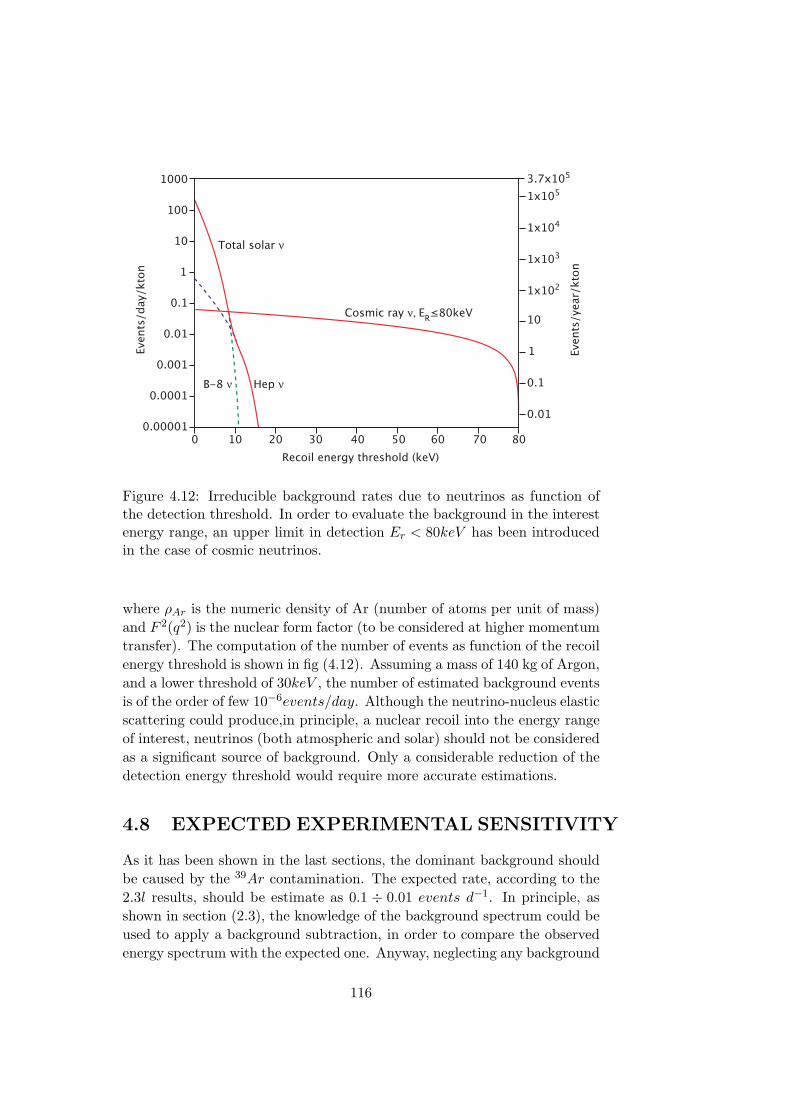
1000
0.000010 80
1x10⁵
0.01
1
10
100
0.0001
0.001
0.01
0.1
0.1
1
10
1x10⁴
1x10³
1x10²
3.7x10⁵
10 706050403020
Total solar ν
Hep νB-8 ν
Cosmic ray ν, ER≤80keV
Recoil energy threshold (keV)
Events/day/kton
Events/year/kton
Figure 4.12: Irreducible background rates due to neutrinos as function ofthe detection threshold. In order to evaluate the background in the interestenergy range, an upper limit in detection Er < 80keV has been introducedin the case of cosmic neutrinos.
where ρAr is the numeric density of Ar (number of atoms per unit of mass)and F 2(q2) is the nuclear form factor (to be considered at higher momentumtransfer). The computation of the number of events as function of the recoilenergy threshold is shown in fig (4.12). Assuming a mass of 140 kg of Argon,and a lower threshold of 30keV , the number of estimated background eventsis of the order of few 10−6events/day. Although the neutrino-nucleus elasticscattering could produce,in principle, a nuclear recoil into the energy rangeof interest, neutrinos (both atmospheric and solar) should not be consideredas a significant source of background. Only a considerable reduction of thedetection energy threshold would require more accurate estimations.
4.8 EXPECTED EXPERIMENTAL SENSITIVITY
As it has been shown in the last sections, the dominant background shouldbe caused by the 39Ar contamination. The expected rate, according to the2.3l results, should be estimate as 0.1 ÷ 0.01 events d−1. In principle, asshown in section (2.3), the knowledge of the background spectrum could beused to apply a background subtraction, in order to compare the observedenergy spectrum with the expected one. Anyway, neglecting any background
116
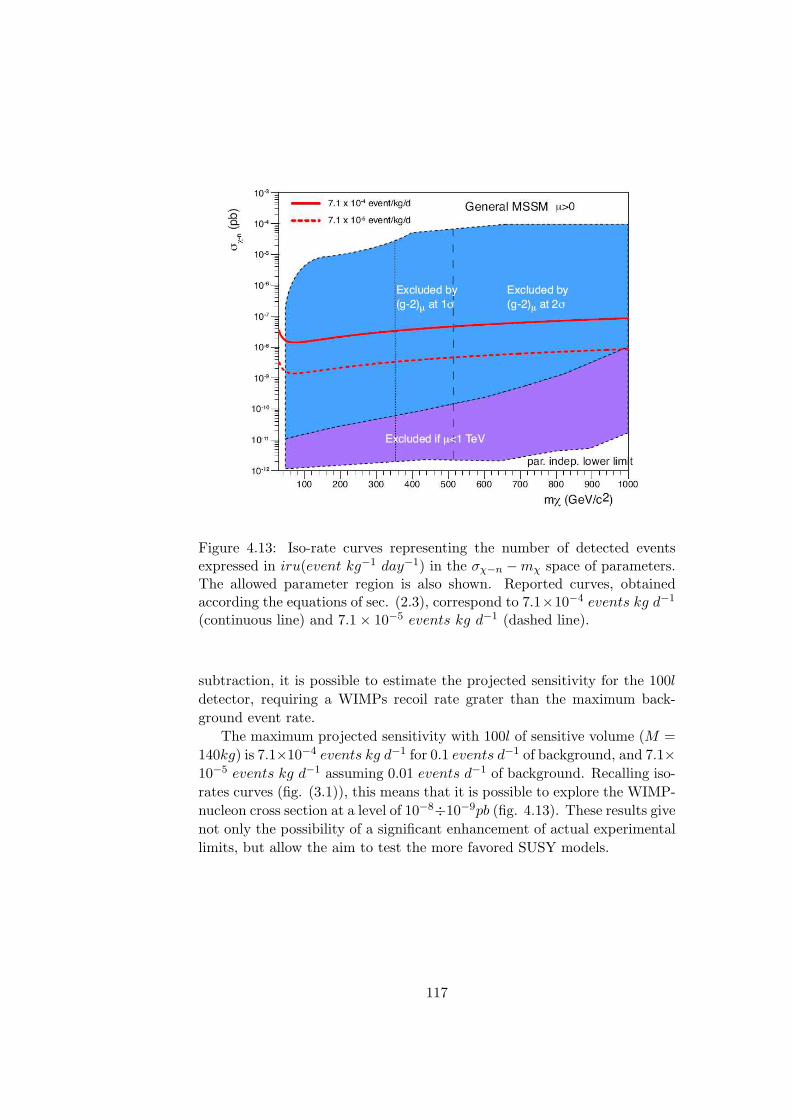
Figure 4.13: Iso-rate curves representing the number of detected eventsexpressed in iru(event kg−1 day−1) in the σχ−n −mχ space of parameters.The allowed parameter region is also shown. Reported curves, obtainedaccording the equations of sec. (2.3), correspond to 7.1×10⁻⁴ events kg d−1
(continuous line) and 7.1× 10⁻⁵ events kg d−1 (dashed line).
subtraction, it is possible to estimate the projected sensitivity for the 100ldetector, requiring a WIMPs recoil rate grater than the maximum back-ground event rate.
The maximum projected sensitivity with 100l of sensitive volume (M =140kg) is 7.1×10⁻⁴ events kg d−1 for 0.1 events d−1 of background, and 7.1×10⁻⁵ events kg d−1 assuming 0.01 events d−1 of background. Recalling iso-rates curves (fig. (3.1)), this means that it is possible to explore the WIMP-nucleon cross section at a level of 10−8÷10−9pb (fig. 4.13). These results givenot only the possibility of a significant enhancement of actual experimentallimits, but allow the aim to test the more favored SUSY models.
117
Chapter 5
Characterization ofphotomultiplier tubes for theWARP experiment
5.1 INTRODUCTION
The WARP detector will be equipped with photomultiplier tubes (PMT) forthe detection of the scintillation light produced in liquid Argon by nuclearrecoils and ionizing particles. As stressed in the previous chapter, the innerdetector contains 37 PMTs (6 of 2” and 31 of 3”) placed in the gas pocketon the top of the central detecting region. The active veto system is seenby 430 3” PMTs immersed in the liquid. Electron Tubes Ltd., London, hasdeveloped special cryogenic PMTs for this application. We have tested thefirst prototypes of the ETL D749QFLAPt tube, which has a 2” flat quartzwindow, two types of 3” PMTs, the ETL D750QFLAPt (quartz window)and ETL D750UFLAPt (low activity glass window), and finally the 2” ETLD757FLAPt recently produced. The first sets of photomultipliers specif-ically manufactured for the WARP detector by the Electron Tubes havebeen tested in Naples. Our measurements were focused to characterize theoperating performances of the PMTs at room and cryogenic temperature.In order to minimize the costs of the test activity, all cryogenic measure-ments were carried out in liquid nitrogen, which temperature (77K) is closeto that of the liquid argon (87K). We intended to measure the dark countrate and spectrum, the single electron response (SER), and the gain andlinearity of response. In addition a light source has been used to measurethe linearity of the response, with two orders of magnitude in lightening,corresponding to few photoelectrons and many tens of photoelectrons. Allthe measurements have been performed both at room and cryogenic temper-ature. In this chapter, after a brief introduction regarding the functioning of
118
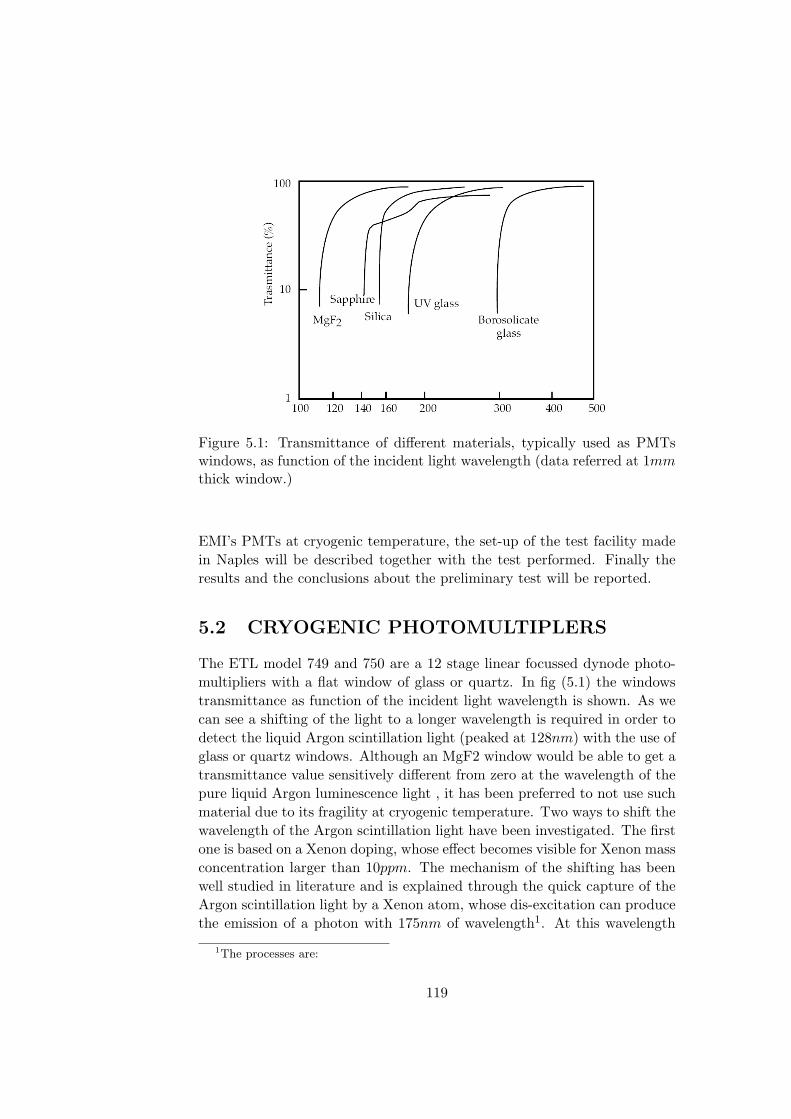
Figure 5.1: Transmittance of different materials, typically used as PMTswindows, as function of the incident light wavelength (data referred at 1mmthick window.)
EMI’s PMTs at cryogenic temperature, the set-up of the test facility madein Naples will be described together with the test performed. Finally theresults and the conclusions about the preliminary test will be reported.
5.2 CRYOGENIC PHOTOMULTIPLERS
The ETL model 749 and 750 are a 12 stage linear focussed dynode photo-multipliers with a flat window of glass or quartz. In fig (5.1) the windowstransmittance as function of the incident light wavelength is shown. As wecan see a shifting of the light to a longer wavelength is required in order todetect the liquid Argon scintillation light (peaked at 128nm) with the use ofglass or quartz windows. Although an MgF2 window would be able to get atransmittance value sensitively different from zero at the wavelength of thepure liquid Argon luminescence light , it has been preferred to not use suchmaterial due to its fragility at cryogenic temperature. Two ways to shift thewavelength of the Argon scintillation light have been investigated. The firstone is based on a Xenon doping, whose effect becomes visible for Xenon massconcentration larger than 10ppm. The mechanism of the shifting has beenwell studied in literature and is explained through the quick capture of theArgon scintillation light by a Xenon atom, whose dis-excitation can producethe emission of a photon with 175nm of wavelength1. At this wavelength
1The processes are:
119
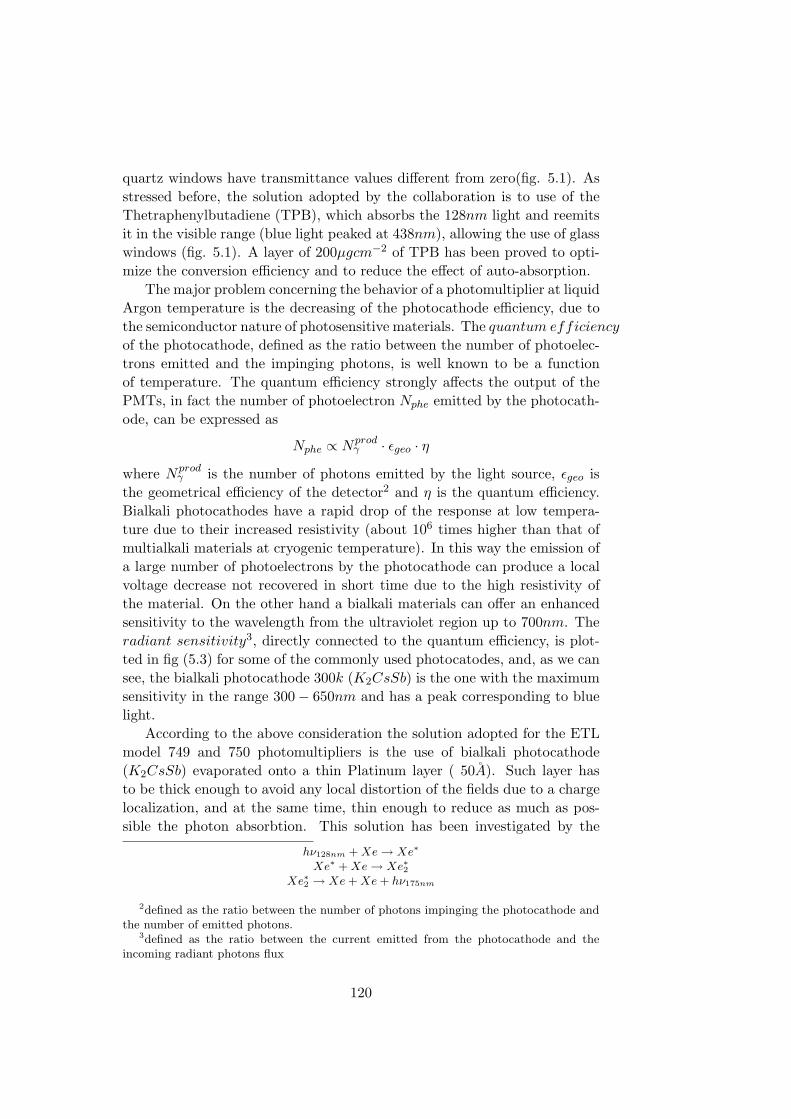
quartz windows have transmittance values different from zero(fig. 5.1). Asstressed before, the solution adopted by the collaboration is to use of theThetraphenylbutadiene (TPB), which absorbs the 128nm light and reemitsit in the visible range (blue light peaked at 438nm), allowing the use of glasswindows (fig. 5.1). A layer of 200µgcm−2 of TPB has been proved to opti-mize the conversion efficiency and to reduce the effect of auto-absorption.
The major problem concerning the behavior of a photomultiplier at liquidArgon temperature is the decreasing of the photocathode efficiency, due tothe semiconductor nature of photosensitive materials. The quantum efficiency
of the photocathode, defined as the ratio between the number of photoelec-trons emitted and the impinging photons, is well known to be a functionof temperature. The quantum efficiency strongly affects the output of thePMTs, in fact the number of photoelectron Nphe emitted by the photocath-ode, can be expressed as
Nphe ∝ Nprodγ · εgeo · η
where Nprodγ is the number of photons emitted by the light source, εgeo is
the geometrical efficiency of the detector2 and η is the quantum efficiency.Bialkali photocathodes have a rapid drop of the response at low tempera-ture due to their increased resistivity (about 106 times higher than that ofmultialkali materials at cryogenic temperature). In this way the emission ofa large number of photoelectrons by the photocathode can produce a localvoltage decrease not recovered in short time due to the high resistivity ofthe material. On the other hand a bialkali materials can offer an enhancedsensitivity to the wavelength from the ultraviolet region up to 700nm. Theradiant sensitivity3, directly connected to the quantum efficiency, is plot-ted in fig (5.3) for some of the commonly used photocatodes, and, as we cansee, the bialkali photocathode 300k (K2CsSb) is the one with the maximumsensitivity in the range 300− 650nm and has a peak corresponding to bluelight.
According to the above consideration the solution adopted for the ETLmodel 749 and 750 photomultipliers is the use of bialkali photocathode(K2CsSb) evaporated onto a thin Platinum layer ( 50A). Such layer hasto be thick enough to avoid any local distortion of the fields due to a chargelocalization, and at the same time, thin enough to reduce as much as pos-sible the photon absorbtion. This solution has been investigated by the
hν128nm + Xe → Xe∗
Xe∗ + Xe → Xe∗2Xe∗2 → Xe + Xe + hν175nm
2defined as the ratio between the number of photons impinging the photocathode andthe number of emitted photons.
3defined as the ratio between the current emitted from the photocathode and theincoming radiant photons flux
120
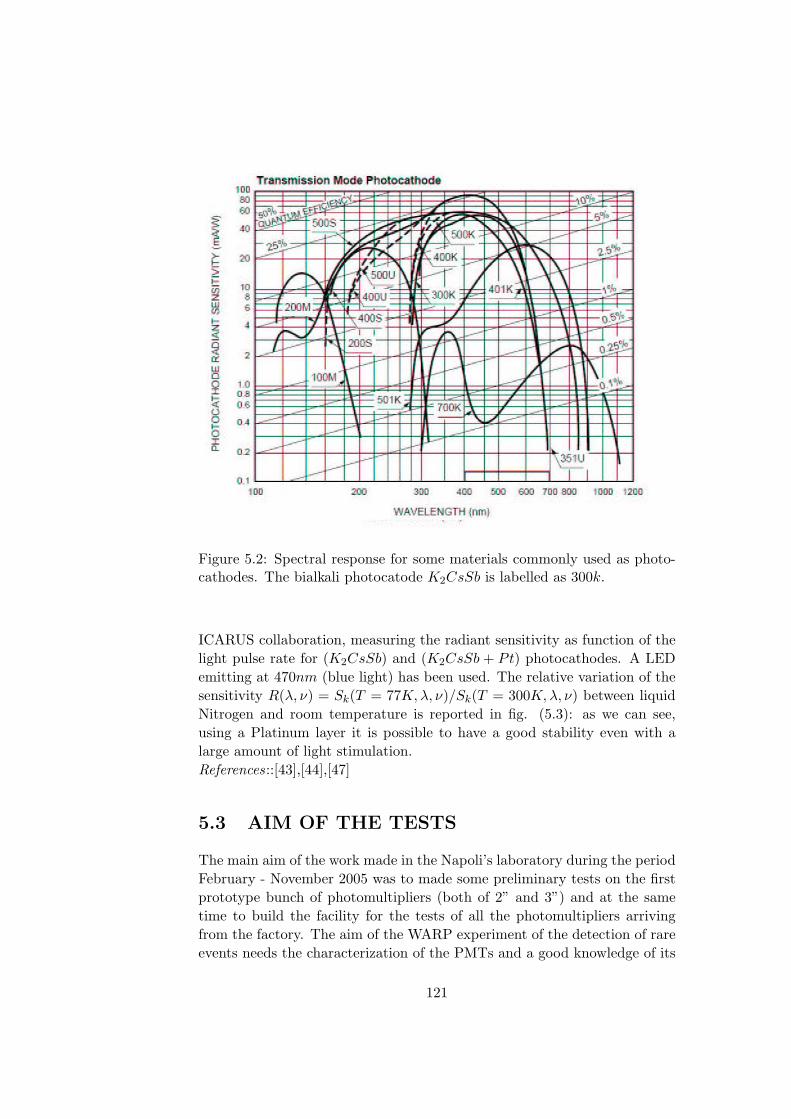
Figure 5.2: Spectral response for some materials commonly used as photo-cathodes. The bialkali photocatode K2CsSb is labelled as 300k.
ICARUS collaboration, measuring the radiant sensitivity as function of thelight pulse rate for (K2CsSb) and (K2CsSb + Pt) photocathodes. A LEDemitting at 470nm (blue light) has been used. The relative variation of thesensitivity R(λ, ν) = Sk(T = 77K,λ, ν)/Sk(T = 300K, λ, ν) between liquidNitrogen and room temperature is reported in fig. (5.3): as we can see,using a Platinum layer it is possible to have a good stability even with alarge amount of light stimulation.References::[43],[44],[47]
5.3 AIM OF THE TESTS
The main aim of the work made in the Napoli’s laboratory during the periodFebruary - November 2005 was to made some preliminary tests on the firstprototype bunch of photomultipliers (both of 2” and 3”) and at the sametime to build the facility for the tests of all the photomultipliers arrivingfrom the factory. The aim of the WARP experiment of the detection of rareevents needs the characterization of the PMTs and a good knowledge of its
121
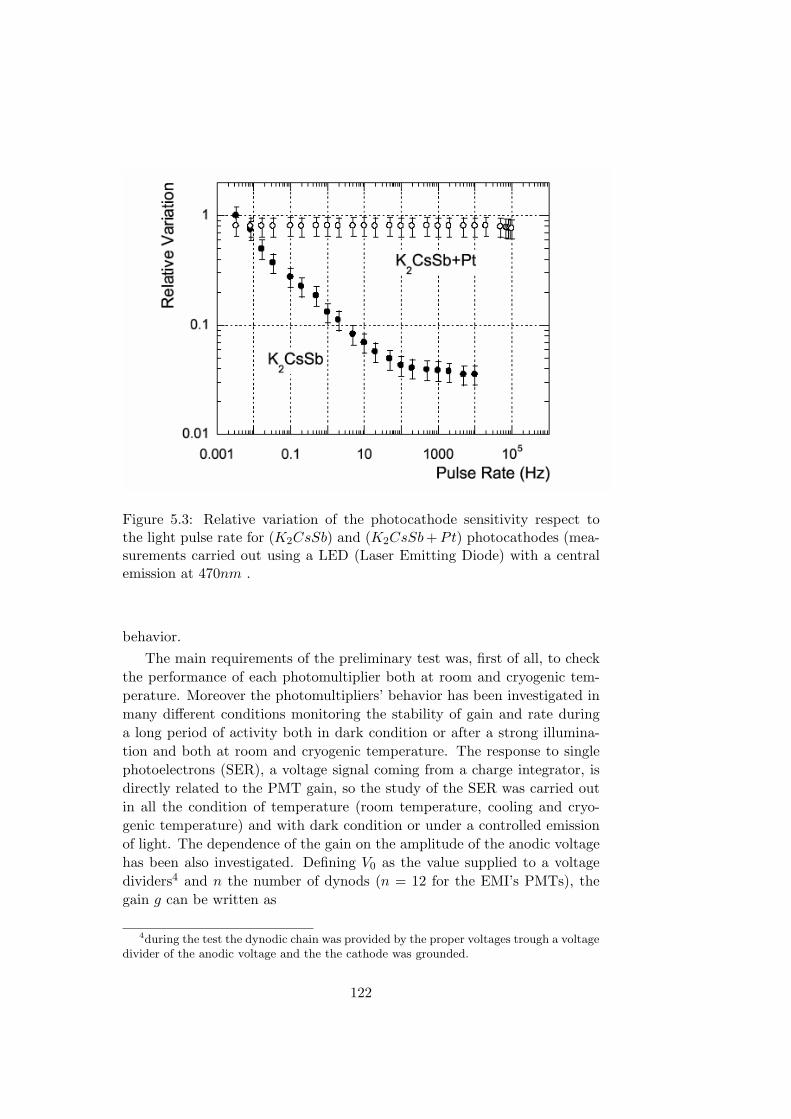
Figure 5.3: Relative variation of the photocathode sensitivity respect tothe light pulse rate for (K2CsSb) and (K2CsSb + Pt) photocathodes (mea-surements carried out using a LED (Laser Emitting Diode) with a centralemission at 470nm .
behavior.The main requirements of the preliminary test was, first of all, to check
the performance of each photomultiplier both at room and cryogenic tem-perature. Moreover the photomultipliers’ behavior has been investigated inmany different conditions monitoring the stability of gain and rate duringa long period of activity both in dark condition or after a strong illumina-tion and both at room and cryogenic temperature. The response to singlephotoelectrons (SER), a voltage signal coming from a charge integrator, isdirectly related to the PMT gain, so the study of the SER was carried outin all the condition of temperature (room temperature, cooling and cryo-genic temperature) and with dark condition or under a controlled emissionof light. The dependence of the gain on the amplitude of the anodic voltagehas been also investigated. Defining V0 as the value supplied to a voltagedividers4 and n the number of dynods (n = 12 for the EMI’s PMTs), thegain g can be written as
4during the test the dynodic chain was provided by the proper voltages trough a voltagedivider of the anodic voltage and the the cathode was grounded.
122
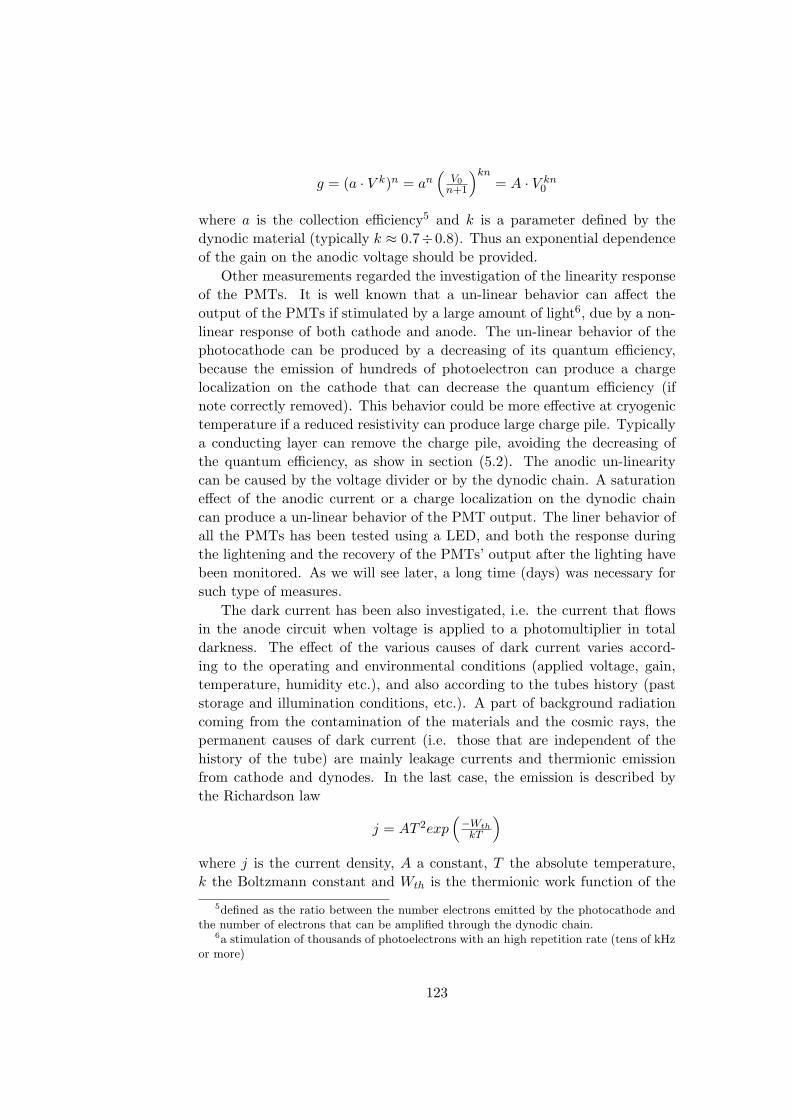
g = (a · V k)n = an(
V0n+1
)kn= A · V kn
0
where a is the collection efficiency5 and k is a parameter defined by thedynodic material (typically k ≈ 0.7÷0.8). Thus an exponential dependenceof the gain on the anodic voltage should be provided.
Other measurements regarded the investigation of the linearity responseof the PMTs. It is well known that a un-linear behavior can affect theoutput of the PMTs if stimulated by a large amount of light6, due by a non-linear response of both cathode and anode. The un-linear behavior of thephotocathode can be produced by a decreasing of its quantum efficiency,because the emission of hundreds of photoelectron can produce a chargelocalization on the cathode that can decrease the quantum efficiency (ifnote correctly removed). This behavior could be more effective at cryogenictemperature if a reduced resistivity can produce large charge pile. Typicallya conducting layer can remove the charge pile, avoiding the decreasing ofthe quantum efficiency, as show in section (5.2). The anodic un-linearitycan be caused by the voltage divider or by the dynodic chain. A saturationeffect of the anodic current or a charge localization on the dynodic chaincan produce a un-linear behavior of the PMT output. The liner behavior ofall the PMTs has been tested using a LED, and both the response duringthe lightening and the recovery of the PMTs’ output after the lighting havebeen monitored. As we will see later, a long time (days) was necessary forsuch type of measures.
The dark current has been also investigated, i.e. the current that flowsin the anode circuit when voltage is applied to a photomultiplier in totaldarkness. The effect of the various causes of dark current varies accord-ing to the operating and environmental conditions (applied voltage, gain,temperature, humidity etc.), and also according to the tubes history (paststorage and illumination conditions, etc.). A part of background radiationcoming from the contamination of the materials and the cosmic rays, thepermanent causes of dark current (i.e. those that are independent of thehistory of the tube) are mainly leakage currents and thermionic emissionfrom cathode and dynodes. In the last case, the emission is described bythe Richardson law
j = AT 2exp(−Wth
kT
)
where j is the current density, A a constant, T the absolute temperature,k the Boltzmann constant and Wth is the thermionic work function of the
5defined as the ratio between the number electrons emitted by the photocathode andthe number of electrons that can be amplified through the dynodic chain.
6a stimulation of thousands of photoelectrons with an high repetition rate (tens of kHzor more)
123
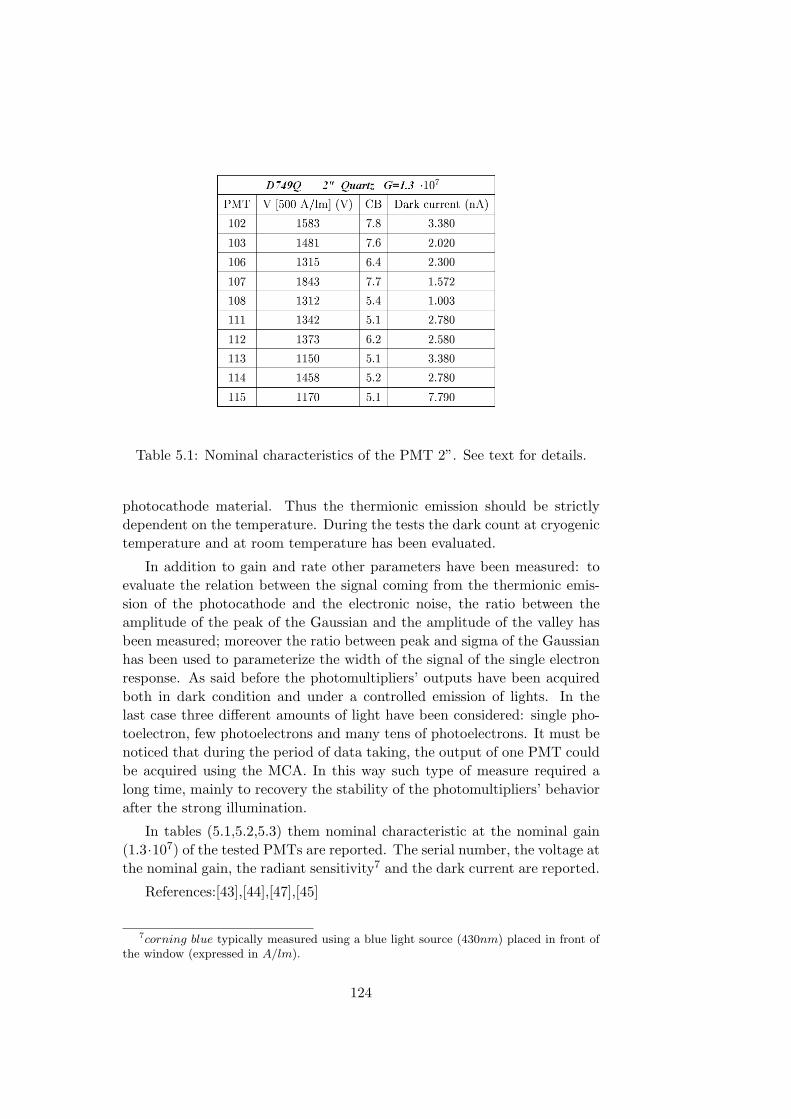
Table 5.1: Nominal characteristics of the PMT 2”. See text for details.
photocathode material. Thus the thermionic emission should be strictlydependent on the temperature. During the tests the dark count at cryogenictemperature and at room temperature has been evaluated.
In addition to gain and rate other parameters have been measured: toevaluate the relation between the signal coming from the thermionic emis-sion of the photocathode and the electronic noise, the ratio between theamplitude of the peak of the Gaussian and the amplitude of the valley hasbeen measured; moreover the ratio between peak and sigma of the Gaussianhas been used to parameterize the width of the signal of the single electronresponse. As said before the photomultipliers’ outputs have been acquiredboth in dark condition and under a controlled emission of lights. In thelast case three different amounts of light have been considered: single pho-toelectron, few photoelectrons and many tens of photoelectrons. It must benoticed that during the period of data taking, the output of one PMT couldbe acquired using the MCA. In this way such type of measure required along time, mainly to recovery the stability of the photomultipliers’ behaviorafter the strong illumination.
In tables (5.1,5.2,5.3) them nominal characteristic at the nominal gain(1.3·107) of the tested PMTs are reported. The serial number, the voltage atthe nominal gain, the radiant sensitivity7 and the dark current are reported.
References:[43],[44],[47],[45]
7corning blue typically measured using a blue light source (430nm) placed in front ofthe window (expressed in A/lm).
124
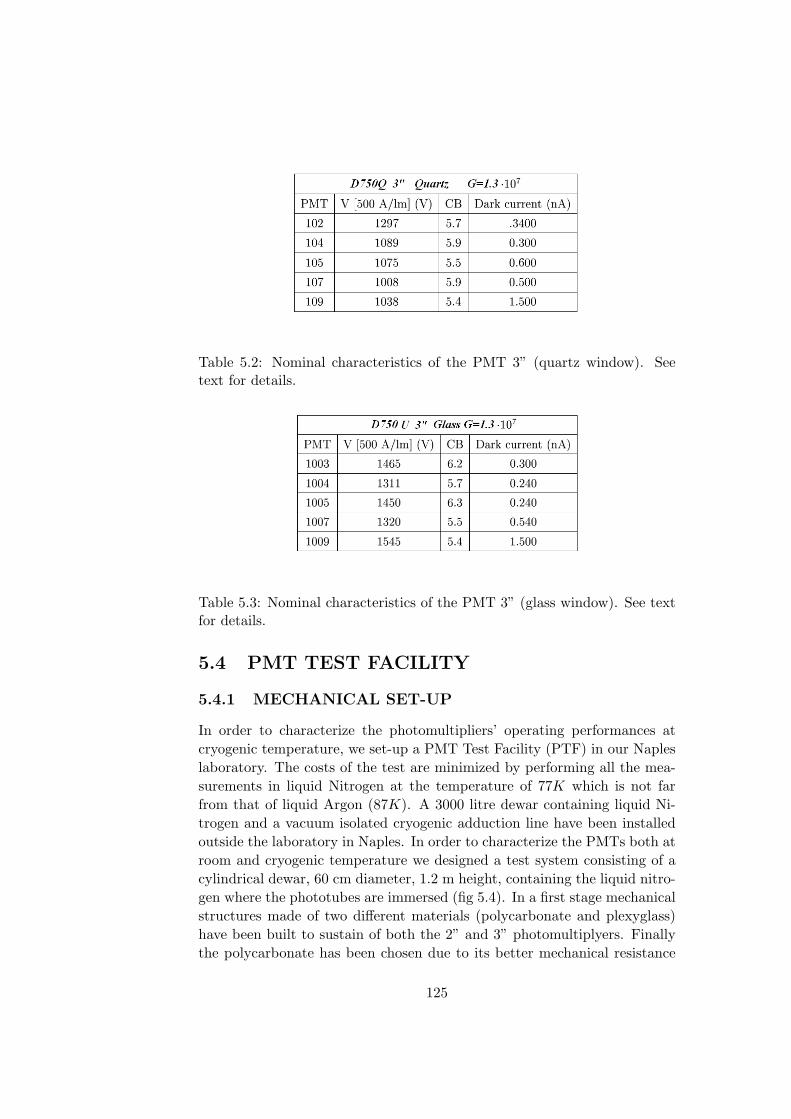
Table 5.2: Nominal characteristics of the PMT 3” (quartz window). Seetext for details.
Table 5.3: Nominal characteristics of the PMT 3” (glass window). See textfor details.
5.4 PMT TEST FACILITY
5.4.1 MECHANICAL SET-UP
In order to characterize the photomultipliers’ operating performances atcryogenic temperature, we set-up a PMT Test Facility (PTF) in our Napleslaboratory. The costs of the test are minimized by performing all the mea-surements in liquid Nitrogen at the temperature of 77K which is not farfrom that of liquid Argon (87K). A 3000 litre dewar containing liquid Ni-trogen and a vacuum isolated cryogenic adduction line have been installedoutside the laboratory in Naples. In order to characterize the PMTs both atroom and cryogenic temperature we designed a test system consisting of acylindrical dewar, 60 cm diameter, 1.2 m height, containing the liquid nitro-gen where the phototubes are immersed (fig 5.4). In a first stage mechanicalstructures made of two different materials (polycarbonate and plexyglass)have been built to sustain of both the 2” and 3” photomultiplyers. Finallythe polycarbonate has been chosen due to its better mechanical resistance
125
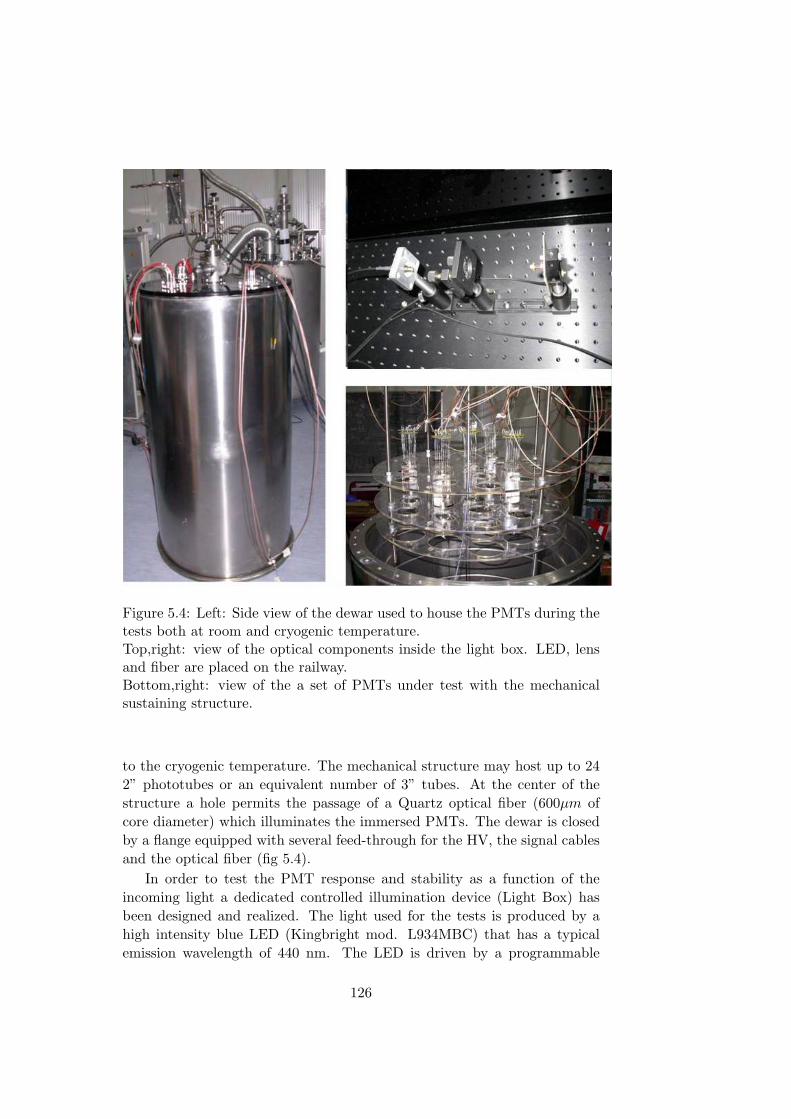
Figure 5.4: Left: Side view of the dewar used to house the PMTs during thetests both at room and cryogenic temperature.Top,right: view of the optical components inside the light box. LED, lensand fiber are placed on the railway.Bottom,right: view of the a set of PMTs under test with the mechanicalsustaining structure.
to the cryogenic temperature. The mechanical structure may host up to 242” phototubes or an equivalent number of 3” tubes. At the center of thestructure a hole permits the passage of a Quartz optical fiber (600µm ofcore diameter) which illuminates the immersed PMTs. The dewar is closedby a flange equipped with several feed-through for the HV, the signal cablesand the optical fiber (fig 5.4).
In order to test the PMT response and stability as a function of theincoming light a dedicated controlled illumination device (Light Box) hasbeen designed and realized. The light used for the tests is produced by ahigh intensity blue LED (Kingbright mod. L934MBC) that has a typicalemission wavelength of 440 nm. The LED is driven by a programmable
126
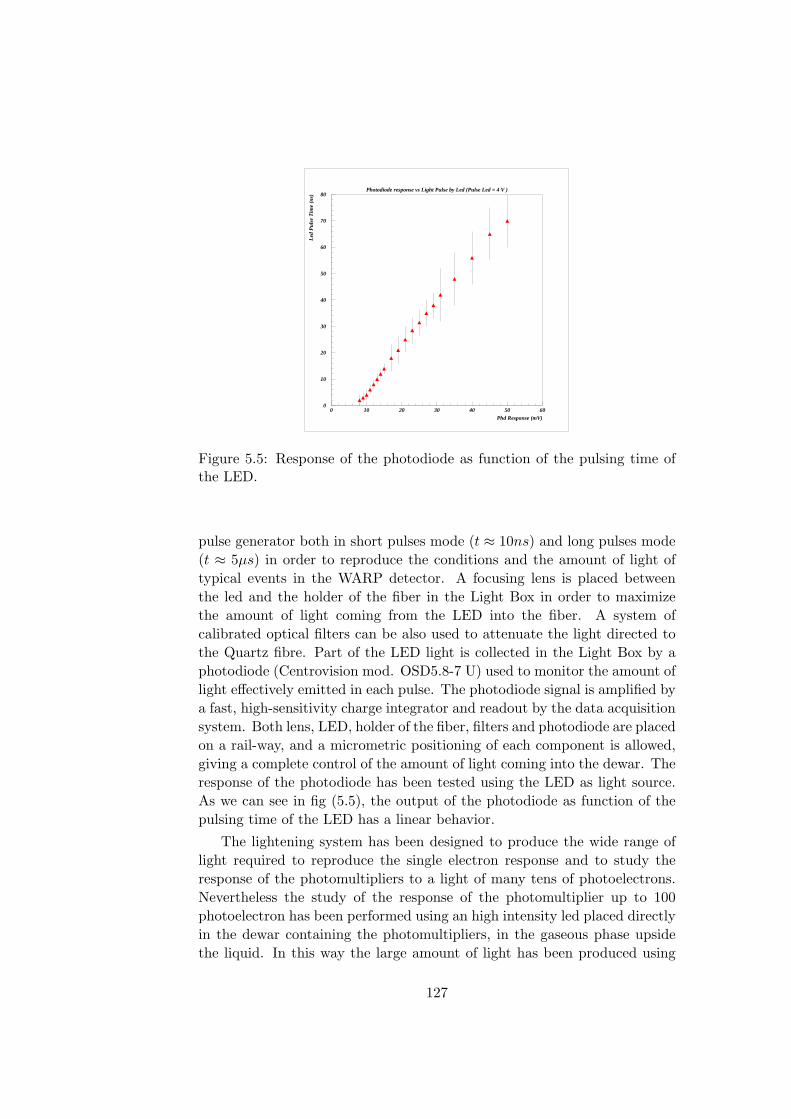
Photodiode response vs Light Pulse by Led (Pulse Led = 4 V )
Phd Response (mV)
Led
Pul
se T
ime
(ns)
0
10
20
30
40
50
60
70
80
0 10 20 30 40 50 60
Figure 5.5: Response of the photodiode as function of the pulsing time ofthe LED.
pulse generator both in short pulses mode (t ≈ 10ns) and long pulses mode(t ≈ 5µs) in order to reproduce the conditions and the amount of light oftypical events in the WARP detector. A focusing lens is placed betweenthe led and the holder of the fiber in the Light Box in order to maximizethe amount of light coming from the LED into the fiber. A system ofcalibrated optical filters can be also used to attenuate the light directed tothe Quartz fibre. Part of the LED light is collected in the Light Box by aphotodiode (Centrovision mod. OSD5.8-7 U) used to monitor the amount oflight effectively emitted in each pulse. The photodiode signal is amplified bya fast, high-sensitivity charge integrator and readout by the data acquisitionsystem. Both lens, LED, holder of the fiber, filters and photodiode are placedon a rail-way, and a micrometric positioning of each component is allowed,giving a complete control of the amount of light coming into the dewar. Theresponse of the photodiode has been tested using the LED as light source.As we can see in fig (5.5), the output of the photodiode as function of thepulsing time of the LED has a linear behavior.
The lightening system has been designed to produce the wide range oflight required to reproduce the single electron response and to study theresponse of the photomultipliers to a light of many tens of photoelectrons.Nevertheless the study of the response of the photomultiplier up to 100photoelectron has been performed using an high intensity led placed directlyin the dewar containing the photomultipliers, in the gaseous phase upsidethe liquid. In this way the large amount of light has been produced using
127
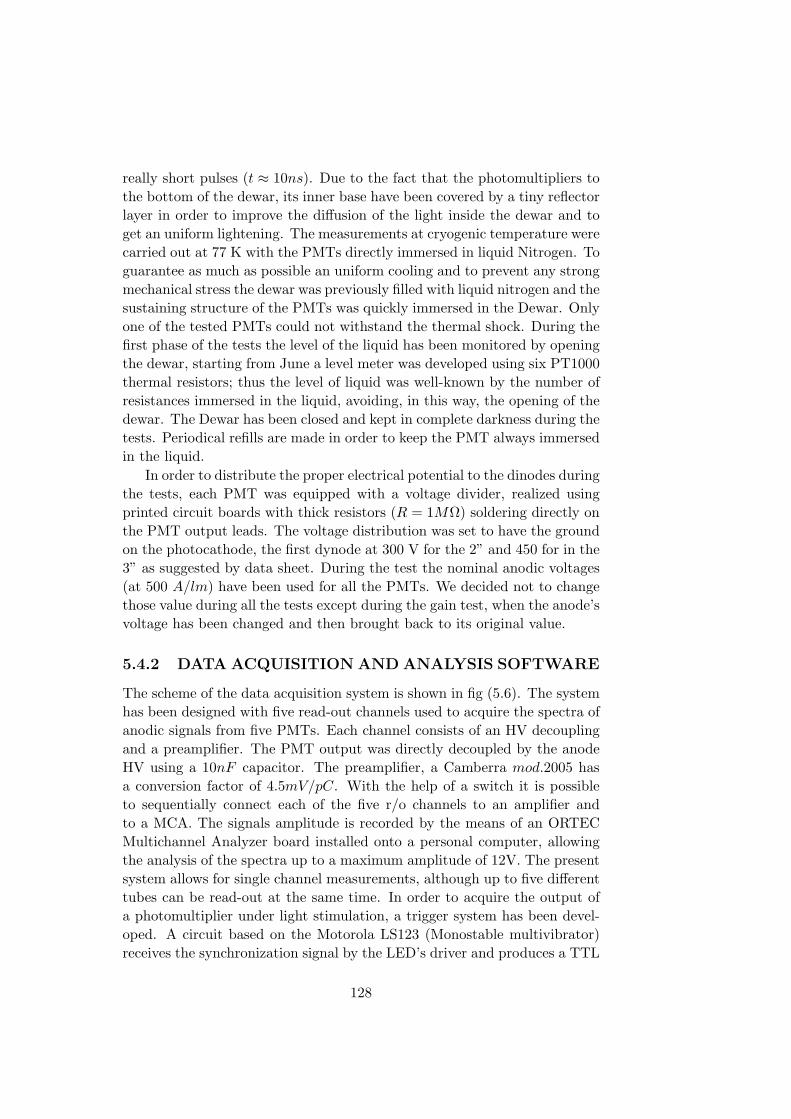
really short pulses (t ≈ 10ns). Due to the fact that the photomultipliers tothe bottom of the dewar, its inner base have been covered by a tiny reflectorlayer in order to improve the diffusion of the light inside the dewar and toget an uniform lightening. The measurements at cryogenic temperature werecarried out at 77 K with the PMTs directly immersed in liquid Nitrogen. Toguarantee as much as possible an uniform cooling and to prevent any strongmechanical stress the dewar was previously filled with liquid nitrogen and thesustaining structure of the PMTs was quickly immersed in the Dewar. Onlyone of the tested PMTs could not withstand the thermal shock. During thefirst phase of the tests the level of the liquid has been monitored by openingthe dewar, starting from June a level meter was developed using six PT1000thermal resistors; thus the level of liquid was well-known by the number ofresistances immersed in the liquid, avoiding, in this way, the opening of thedewar. The Dewar has been closed and kept in complete darkness during thetests. Periodical refills are made in order to keep the PMT always immersedin the liquid.
In order to distribute the proper electrical potential to the dinodes duringthe tests, each PMT was equipped with a voltage divider, realized usingprinted circuit boards with thick resistors (R = 1MΩ) soldering directly onthe PMT output leads. The voltage distribution was set to have the groundon the photocathode, the first dynode at 300 V for the 2” and 450 for in the3” as suggested by data sheet. During the test the nominal anodic voltages(at 500 A/lm) have been used for all the PMTs. We decided not to changethose value during all the tests except during the gain test, when the anode’svoltage has been changed and then brought back to its original value.
5.4.2 DATA ACQUISITION AND ANALYSIS SOFTWARE
The scheme of the data acquisition system is shown in fig (5.6). The systemhas been designed with five read-out channels used to acquire the spectra ofanodic signals from five PMTs. Each channel consists of an HV decouplingand a preamplifier. The PMT output was directly decoupled by the anodeHV using a 10nF capacitor. The preamplifier, a Camberra mod.2005 hasa conversion factor of 4.5mV/pC. With the help of a switch it is possibleto sequentially connect each of the five r/o channels to an amplifier andto a MCA. The signals amplitude is recorded by the means of an ORTECMultichannel Analyzer board installed onto a personal computer, allowingthe analysis of the spectra up to a maximum amplitude of 12V. The presentsystem allows for single channel measurements, although up to five differenttubes can be read-out at the same time. In order to acquire the output ofa photomultiplier under light stimulation, a trigger system has been devel-oped. A circuit based on the Motorola LS123 (Monostable multivibrator)receives the synchronization signal by the LED’s driver and produces a TTL
128
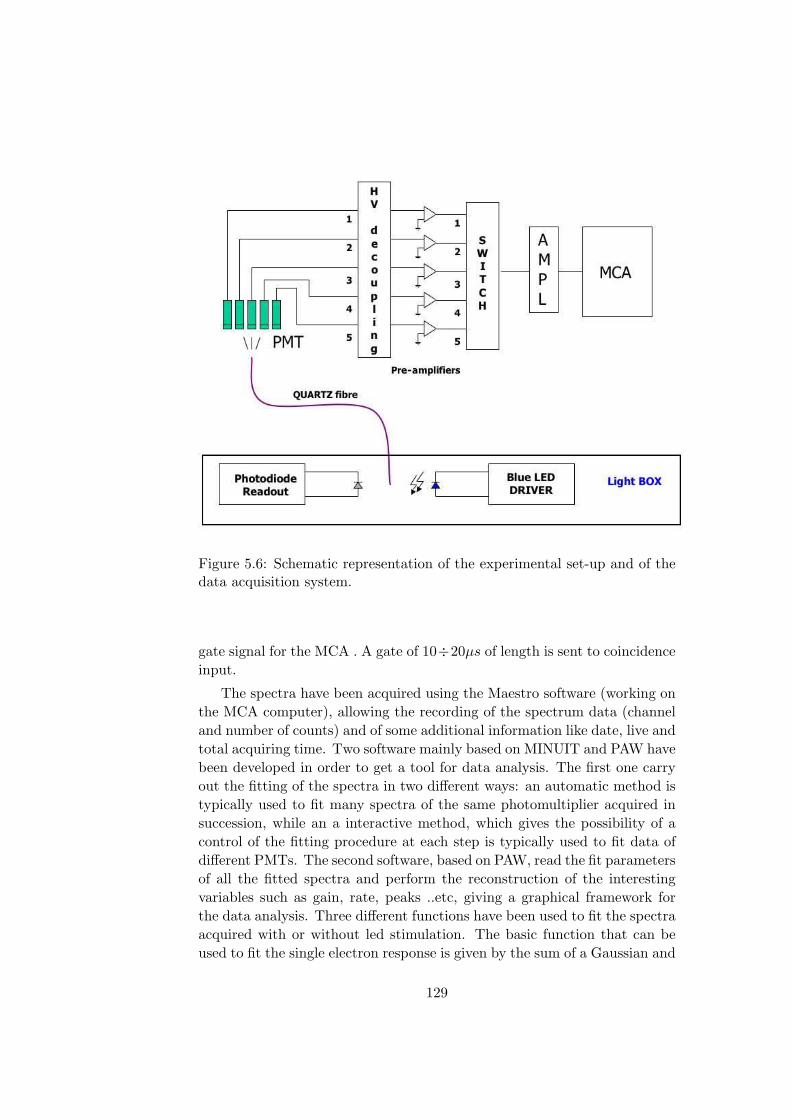
Figure 5.6: Schematic representation of the experimental set-up and of thedata acquisition system.
gate signal for the MCA . A gate of 10÷20µs of length is sent to coincidenceinput.
The spectra have been acquired using the Maestro software (working onthe MCA computer), allowing the recording of the spectrum data (channeland number of counts) and of some additional information like date, live andtotal acquiring time. Two software mainly based on MINUIT and PAW havebeen developed in order to get a tool for data analysis. The first one carryout the fitting of the spectra in two different ways: an automatic method istypically used to fit many spectra of the same photomultiplier acquired insuccession, while an a interactive method, which gives the possibility of acontrol of the fitting procedure at each step is typically used to fit data ofdifferent PMTs. The second software, based on PAW, read the fit parametersof all the fitted spectra and perform the reconstruction of the interestingvariables such as gain, rate, peaks ..etc, giving a graphical framework forthe data analysis. Three different functions have been used to fit the spectraacquired with or without led stimulation. The basic function that can beused to fit the single electron response is given by the sum of a Gaussian and
129
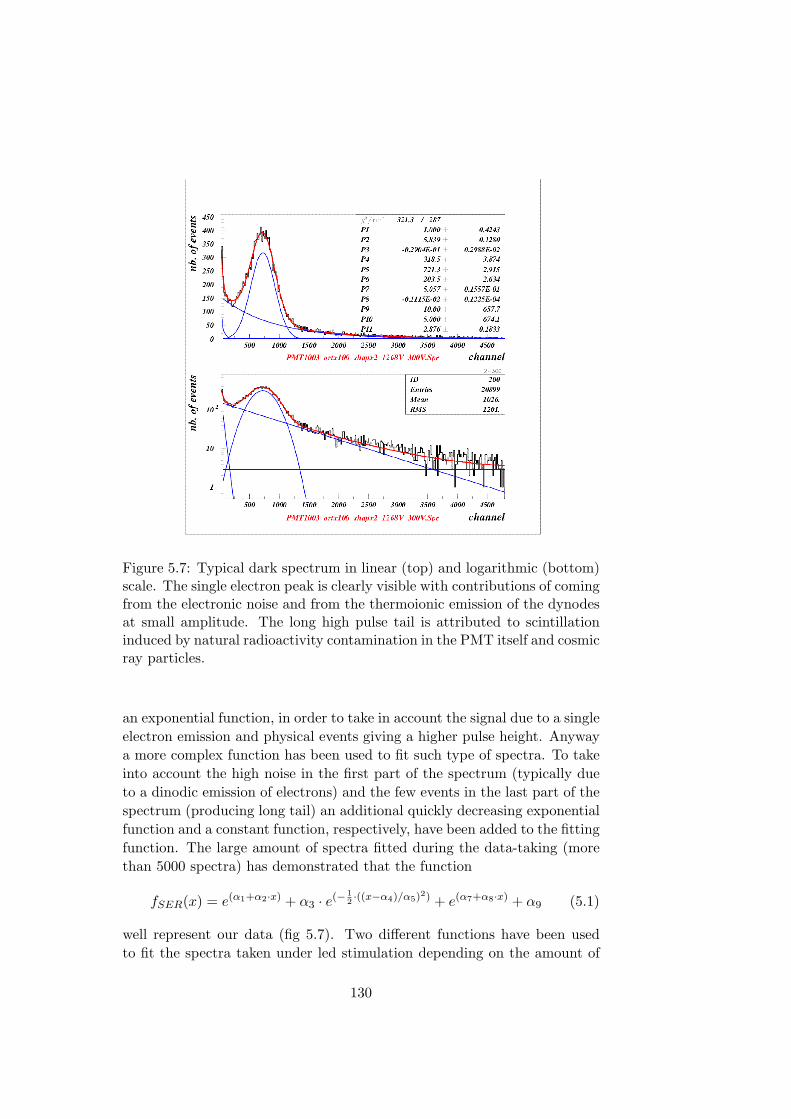
Figure 5.7: Typical dark spectrum in linear (top) and logarithmic (bottom)scale. The single electron peak is clearly visible with contributions of comingfrom the electronic noise and from the thermoionic emission of the dynodesat small amplitude. The long high pulse tail is attributed to scintillationinduced by natural radioactivity contamination in the PMT itself and cosmicray particles.
an exponential function, in order to take in account the signal due to a singleelectron emission and physical events giving a higher pulse height. Anywaya more complex function has been used to fit such type of spectra. To takeinto account the high noise in the first part of the spectrum (typically dueto a dinodic emission of electrons) and the few events in the last part of thespectrum (producing long tail) an additional quickly decreasing exponentialfunction and a constant function, respectively, have been added to the fittingfunction. The large amount of spectra fitted during the data-taking (morethan 5000 spectra) has demonstrated that the function
fSER(x) = e(α1+α2·x) + α3 · e(− 12·((x−α4)/α5)2) + e(α7+α8·x) + α9 (5.1)
well represent our data (fig 5.7). Two different functions have been usedto fit the spectra taken under led stimulation depending on the amount of
130
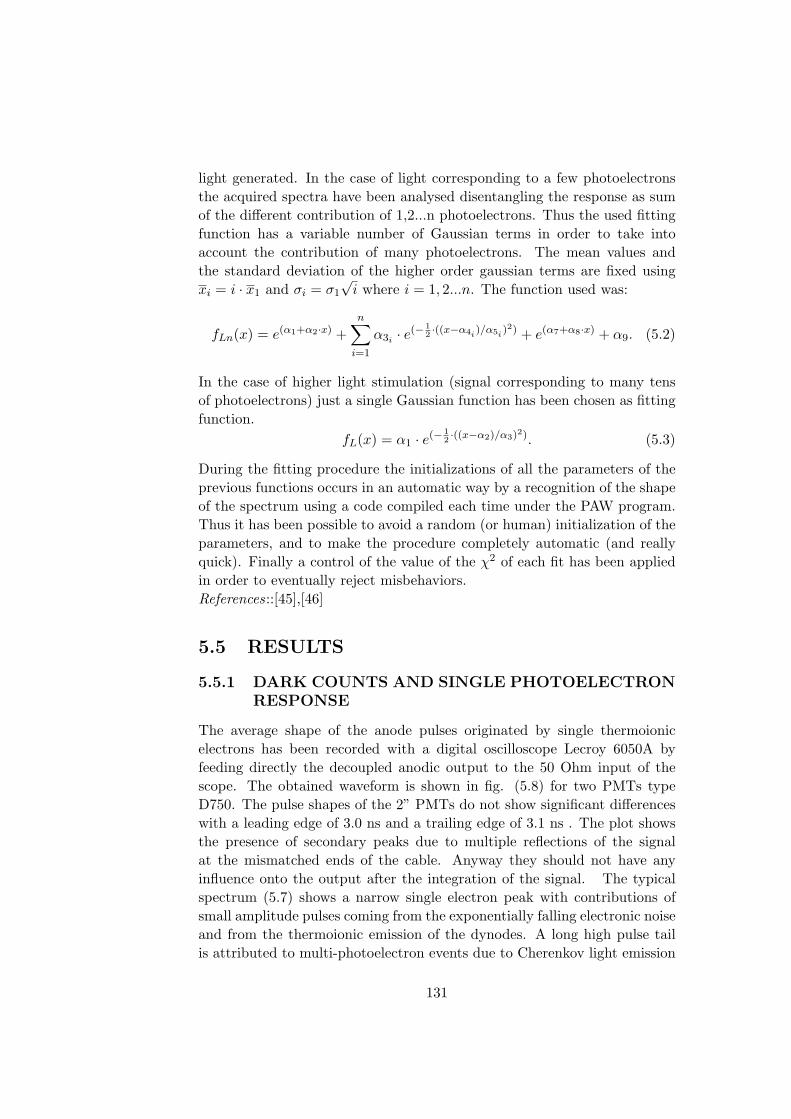
light generated. In the case of light corresponding to a few photoelectronsthe acquired spectra have been analysed disentangling the response as sumof the different contribution of 1,2...n photoelectrons. Thus the used fittingfunction has a variable number of Gaussian terms in order to take intoaccount the contribution of many photoelectrons. The mean values andthe standard deviation of the higher order gaussian terms are fixed usingxi = i · x1 and σi = σ1
√i where i = 1, 2...n. The function used was:
fLn(x) = e(α1+α2·x) +n∑
i=1
α3i · e(− 12·((x−α4i
)/α5i)2) + e(α7+α8·x) + α9. (5.2)
In the case of higher light stimulation (signal corresponding to many tensof photoelectrons) just a single Gaussian function has been chosen as fittingfunction.
fL(x) = α1 · e(− 12·((x−α2)/α3)2). (5.3)
During the fitting procedure the initializations of all the parameters of theprevious functions occurs in an automatic way by a recognition of the shapeof the spectrum using a code compiled each time under the PAW program.Thus it has been possible to avoid a random (or human) initialization of theparameters, and to make the procedure completely automatic (and reallyquick). Finally a control of the value of the χ2 of each fit has been appliedin order to eventually reject misbehaviors.References::[45],[46]
5.5 RESULTS
5.5.1 DARK COUNTS AND SINGLE PHOTOELECTRONRESPONSE
The average shape of the anode pulses originated by single thermoionicelectrons has been recorded with a digital oscilloscope Lecroy 6050A byfeeding directly the decoupled anodic output to the 50 Ohm input of thescope. The obtained waveform is shown in fig. (5.8) for two PMTs typeD750. The pulse shapes of the 2” PMTs do not show significant differenceswith a leading edge of 3.0 ns and a trailing edge of 3.1 ns . The plot showsthe presence of secondary peaks due to multiple reflections of the signalat the mismatched ends of the cable. Anyway they should not have anyinfluence onto the output after the integration of the signal. The typicalspectrum (5.7) shows a narrow single electron peak with contributions ofsmall amplitude pulses coming from the exponentially falling electronic noiseand from the thermoionic emission of the dynodes. A long high pulse tailis attributed to multi-photoelectron events due to Cherenkov light emission
131
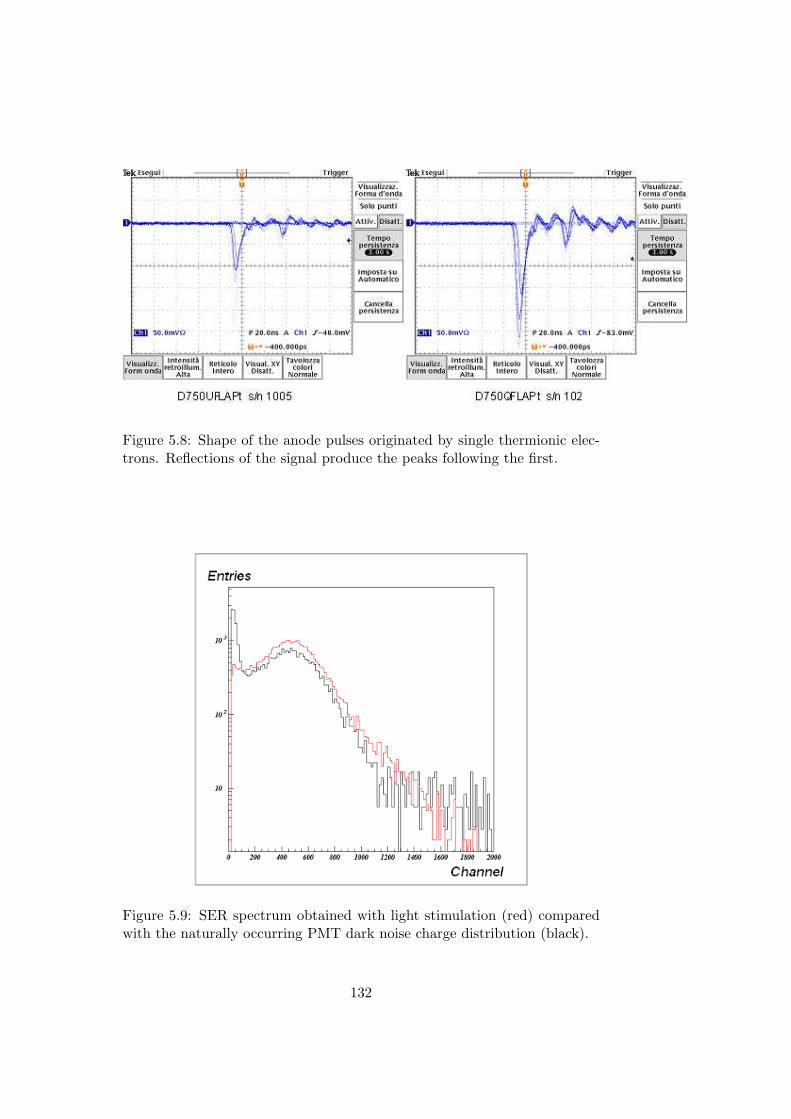
Figure 5.8: Shape of the anode pulses originated by single thermionic elec-trons. Reflections of the signal produce the peaks following the first.
Figure 5.9: SER spectrum obtained with light stimulation (red) comparedwith the naturally occurring PMT dark noise charge distribution (black).
132
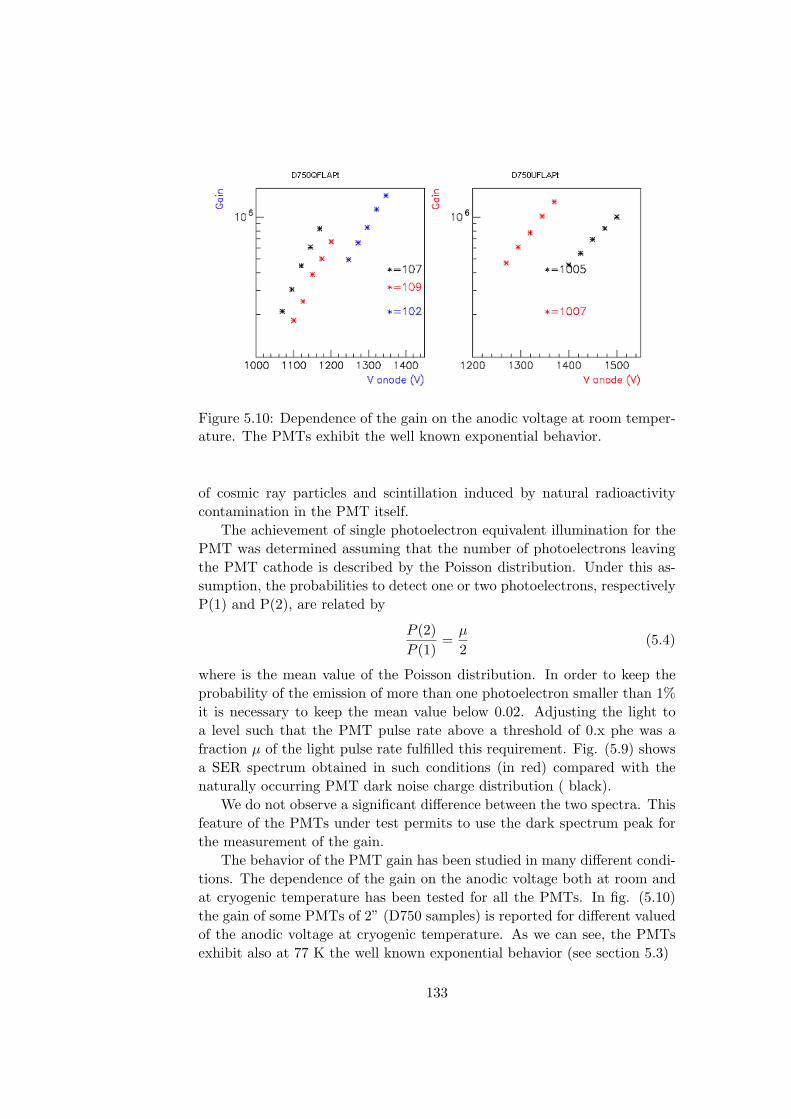
Figure 5.10: Dependence of the gain on the anodic voltage at room temper-ature. The PMTs exhibit the well known exponential behavior.
of cosmic ray particles and scintillation induced by natural radioactivitycontamination in the PMT itself.
The achievement of single photoelectron equivalent illumination for thePMT was determined assuming that the number of photoelectrons leavingthe PMT cathode is described by the Poisson distribution. Under this as-sumption, the probabilities to detect one or two photoelectrons, respectivelyP(1) and P(2), are related by
P (2)P (1)
=µ
2(5.4)
where is the mean value of the Poisson distribution. In order to keep theprobability of the emission of more than one photoelectron smaller than 1%it is necessary to keep the mean value below 0.02. Adjusting the light toa level such that the PMT pulse rate above a threshold of 0.x phe was afraction µ of the light pulse rate fulfilled this requirement. Fig. (5.9) showsa SER spectrum obtained in such conditions (in red) compared with thenaturally occurring PMT dark noise charge distribution ( black).
We do not observe a significant difference between the two spectra. Thisfeature of the PMTs under test permits to use the dark spectrum peak forthe measurement of the gain.
The behavior of the PMT gain has been studied in many different condi-tions. The dependence of the gain on the anodic voltage both at room andat cryogenic temperature has been tested for all the PMTs. In fig. (5.10)the gain of some PMTs of 2” (D750 samples) is reported for different valuedof the anodic voltage at cryogenic temperature. As we can see, the PMTsexhibit also at 77 K the well known exponential behavior (see section 5.3)
133
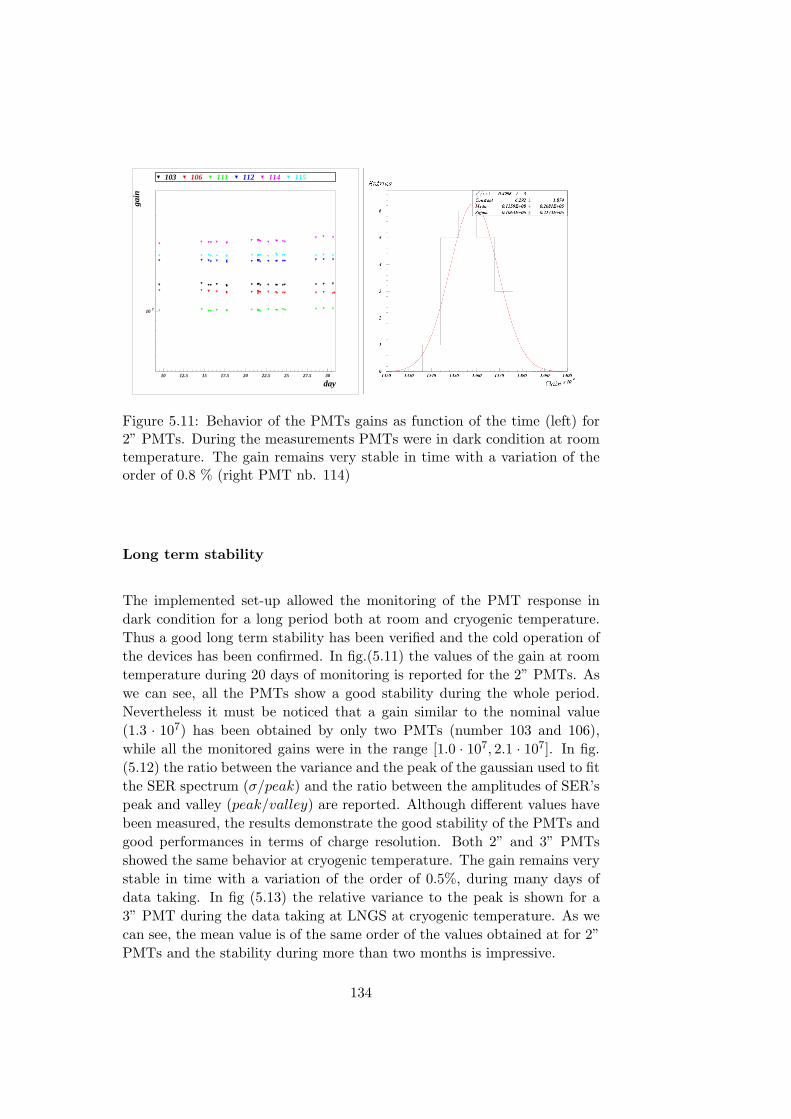
10 7
10 12.5 15 17.5 20 22.5 25 27.5 30
day
gain
103 106 111 112 114 115
Figure 5.11: Behavior of the PMTs gains as function of the time (left) for2” PMTs. During the measurements PMTs were in dark condition at roomtemperature. The gain remains very stable in time with a variation of theorder of 0.8 % (right PMT nb. 114)
Long term stability
The implemented set-up allowed the monitoring of the PMT response indark condition for a long period both at room and cryogenic temperature.Thus a good long term stability has been verified and the cold operation ofthe devices has been confirmed. In fig.(5.11) the values of the gain at roomtemperature during 20 days of monitoring is reported for the 2” PMTs. Aswe can see, all the PMTs show a good stability during the whole period.Nevertheless it must be noticed that a gain similar to the nominal value(1.3 · 107) has been obtained by only two PMTs (number 103 and 106),while all the monitored gains were in the range [1.0 · 107, 2.1 · 107]. In fig.(5.12) the ratio between the variance and the peak of the gaussian used to fitthe SER spectrum (σ/peak) and the ratio between the amplitudes of SER’speak and valley (peak/valley) are reported. Although different values havebeen measured, the results demonstrate the good stability of the PMTs andgood performances in terms of charge resolution. Both 2” and 3” PMTsshowed the same behavior at cryogenic temperature. The gain remains verystable in time with a variation of the order of 0.5%, during many days ofdata taking. In fig (5.13) the relative variance to the peak is shown for a3” PMT during the data taking at LNGS at cryogenic temperature. As wecan see, the mean value is of the same order of the values obtained at for 2”PMTs and the stability during more than two months is impressive.
134
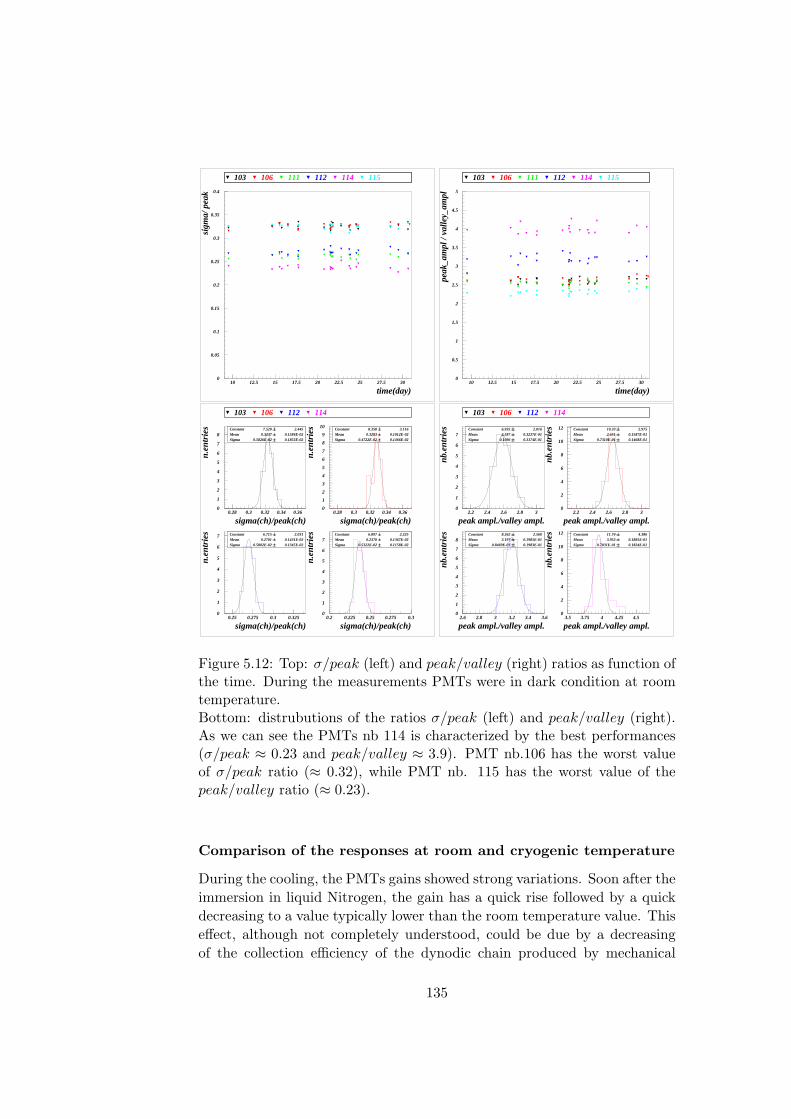
0
0.05
0.1
0.15
0.2
0.25
0.3
0.35
0.4
10 12.5 15 17.5 20 22.5 25 27.5 30
time(day)
sigm
a/ p
eak
103 106 111 112 114 115
0
0.5
1
1.5
2
2.5
3
3.5
4
4.5
5
10 12.5 15 17.5 20 22.5 25 27.5 30
time(day)
peak
_am
pl /
valle
y_am
pl
103 106 111 112 114 115
0
1
2
3
4
5
6
7
8
0.28 0.3 0.32 0.34 0.360
1
2
3
4
5
6
7
8
9
10
0.28 0.3 0.32 0.34 0.36
0
1
2
3
4
5
6
7
0.25 0.275 0.3 0.3250
1
2
3
4
5
6
7
0.2 0.225 0.25 0.275 0.3
Constant 7.520 2.445Mean 0.3237 0.1584E-02Sigma 0.5826E-02 0.1853E-02
103
sigma(ch)/peak(ch)
n.en
trie
s Constant 8.358 3.116Mean 0.3283 0.1012E-02Sigma 0.4722E-02 0.1466E-02
sigma(ch)/peak(ch)
n.en
trie
s
106
Constant 6.715 2.031Mean 0.2701 0.1431E-02Sigma 0.5802E-02 0.1345E-02
sigma(ch)/peak(ch)
n.en
trie
s
112
Constant 6.897 2.225Mean 0.2370 0.1367E-02Sigma 0.5322E-02 0.1158E-02
sigma(ch)/peak(ch)
n.en
trie
s
114
0
1
2
3
4
5
6
7
2.2 2.4 2.6 2.8 30
2
4
6
8
10
12
2.2 2.4 2.6 2.8 3
0
1
2
3
4
5
6
7
8
2.6 2.8 3 3.2 3.4 3.60
2
4
6
8
10
12
3.5 3.75 4 4.25 4.5
Constant 6.935 2.016Mean 2.587 0.3237E-01Sigma 0.1096 0.3174E-01
103
peak ampl./valley ampl.
nb.e
ntri
es Constant 10.33 2.975Mean 2.651 0.1587E-01Sigma 0.7310E-01 0.1468E-01
peak ampl./valley ampl.
nb.e
ntri
es
106
Constant 8.262 2.560Mean 3.197 0.1985E-01Sigma 0.8469E-01 0.1983E-01
peak ampl./valley ampl.
nb.e
ntri
es
112
Constant 11.74 4.386Mean 3.952 0.1885E-01Sigma 0.7031E-01 0.1824E-01
peak ampl./valley ampl.
nb.e
ntri
es
114
Figure 5.12: Top: σ/peak (left) and peak/valley (right) ratios as function ofthe time. During the measurements PMTs were in dark condition at roomtemperature.Bottom: distrubutions of the ratios σ/peak (left) and peak/valley (right).As we can see the PMTs nb 114 is characterized by the best performances(σ/peak ≈ 0.23 and peak/valley ≈ 3.9). PMT nb.106 has the worst valueof σ/peak ratio (≈ 0.32), while PMT nb. 115 has the worst value of thepeak/valley ratio (≈ 0.23).
Comparison of the responses at room and cryogenic temperature
During the cooling, the PMTs gains showed strong variations. Soon after theimmersion in liquid Nitrogen, the gain has a quick rise followed by a quickdecreasing to a value typically lower than the room temperature value. Thiseffect, although not completely understood, could be due by a decreasingof the collection efficiency of the dynodic chain produced by mechanical
135
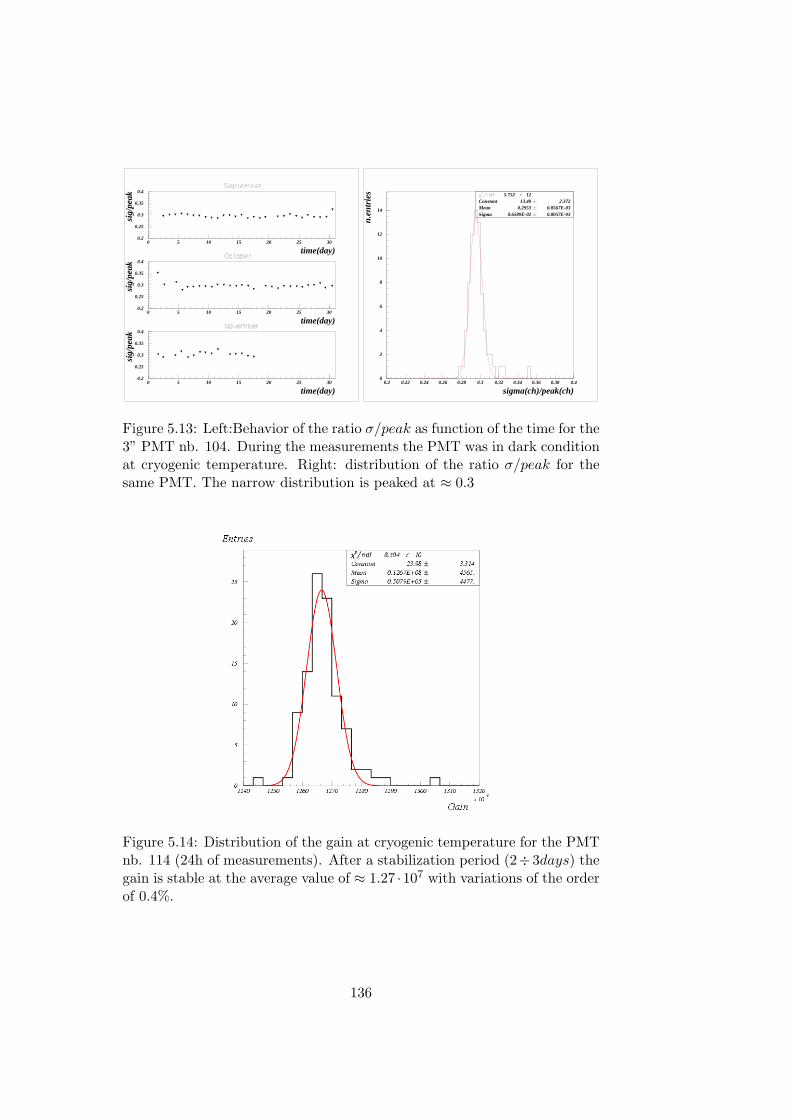
0.2
0.25
0.3
0.35
0.4
0 5 10 15 20 25 30
0.2
0.25
0.3
0.35
0.4
0 5 10 15 20 25 30
0.2
0.25
0.3
0.35
0.4
0 5 10 15 20 25 30
time(day)
sig/
peak
time(day)
sig/
peak
time(day)
sig/
peak
5.752 / 12Constant 13.40 2.372Mean 0.2953 0.8567E-03Sigma 0.6589E-02 0.8057E-03
sigma(ch)/peak(ch)
n.en
trie
s0
2
4
6
8
10
12
14
0.2 0.22 0.24 0.26 0.28 0.3 0.32 0.34 0.36 0.38 0.4
Figure 5.13: Left:Behavior of the ratio σ/peak as function of the time for the3” PMT nb. 104. During the measurements the PMT was in dark conditionat cryogenic temperature. Right: distribution of the ratio σ/peak for thesame PMT. The narrow distribution is peaked at ≈ 0.3
Figure 5.14: Distribution of the gain at cryogenic temperature for the PMTnb. 114 (24h of measurements). After a stabilization period (2÷ 3days) thegain is stable at the average value of ≈ 1.27 ·107 with variations of the orderof 0.4%.
136
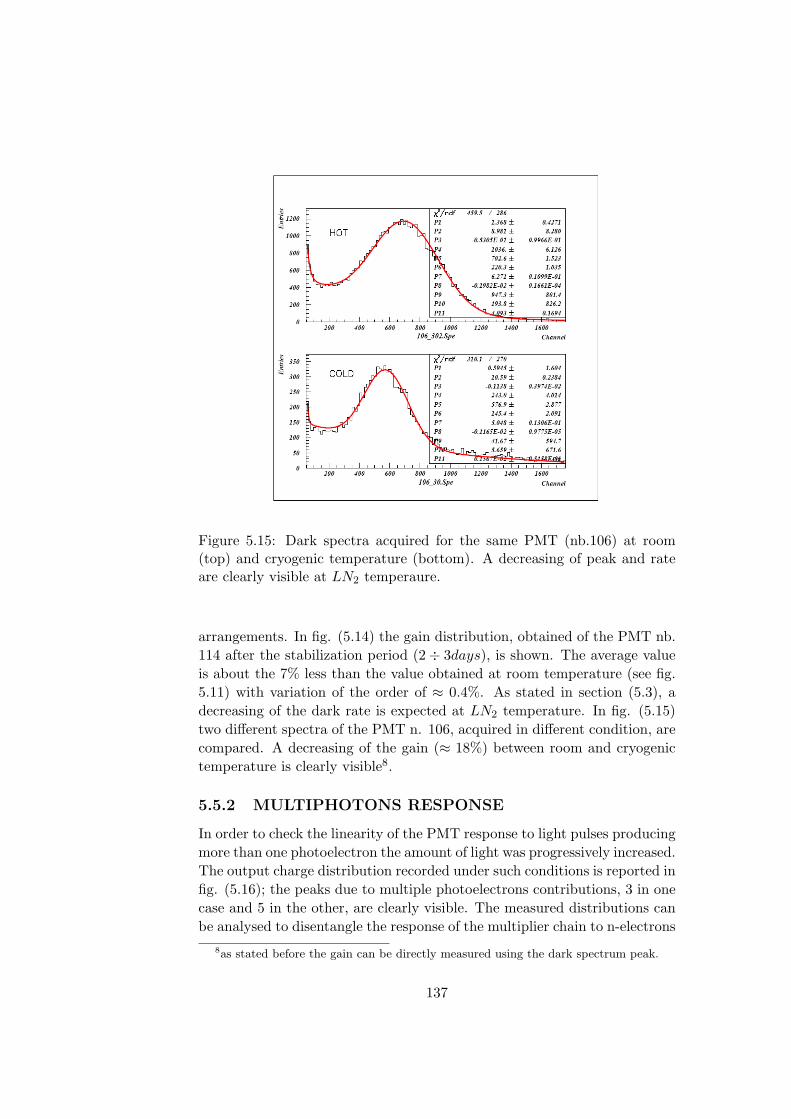
Figure 5.15: Dark spectra acquired for the same PMT (nb.106) at room(top) and cryogenic temperature (bottom). A decreasing of peak and rateare clearly visible at LN2 temperaure.
arrangements. In fig. (5.14) the gain distribution, obtained of the PMT nb.114 after the stabilization period (2÷ 3days), is shown. The average valueis about the 7% less than the value obtained at room temperature (see fig.5.11) with variation of the order of ≈ 0.4%. As stated in section (5.3), adecreasing of the dark rate is expected at LN2 temperature. In fig. (5.15)two different spectra of the PMT n. 106, acquired in different condition, arecompared. A decreasing of the gain (≈ 18%) between room and cryogenictemperature is clearly visible8.
5.5.2 MULTIPHOTONS RESPONSE
In order to check the linearity of the PMT response to light pulses producingmore than one photoelectron the amount of light was progressively increased.The output charge distribution recorded under such conditions is reported infig. (5.16); the peaks due to multiple photoelectrons contributions, 3 in onecase and 5 in the other, are clearly visible. The measured distributions canbe analysed to disentangle the response of the multiplier chain to n-electrons
8as stated before the gain can be directly measured using the dark spectrum peak.
137
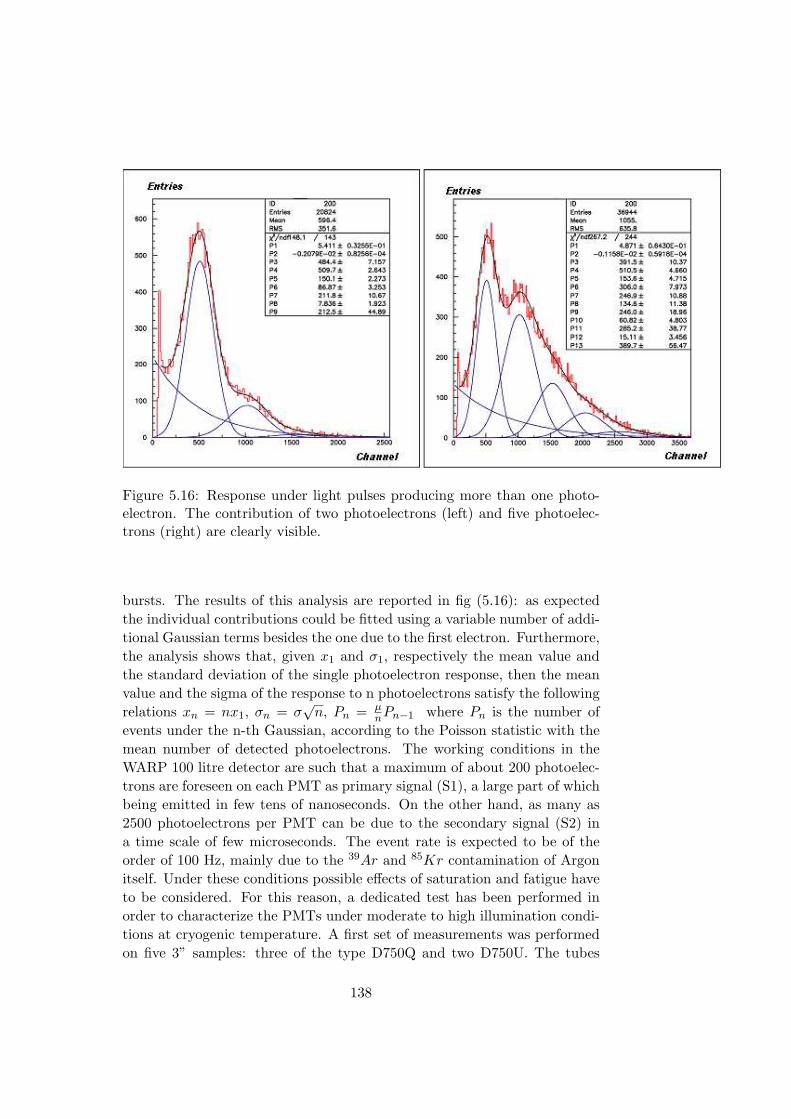
Figure 5.16: Response under light pulses producing more than one photo-electron. The contribution of two photoelectrons (left) and five photoelec-trons (right) are clearly visible.
bursts. The results of this analysis are reported in fig (5.16): as expectedthe individual contributions could be fitted using a variable number of addi-tional Gaussian terms besides the one due to the first electron. Furthermore,the analysis shows that, given x1 and σ1, respectively the mean value andthe standard deviation of the single photoelectron response, then the meanvalue and the sigma of the response to n photoelectrons satisfy the followingrelations xn = nx1, σn = σ
√n, Pn = µ
nPn−1 where Pn is the number ofevents under the n-th Gaussian, according to the Poisson statistic with themean number of detected photoelectrons. The working conditions in theWARP 100 litre detector are such that a maximum of about 200 photoelec-trons are foreseen on each PMT as primary signal (S1), a large part of whichbeing emitted in few tens of nanoseconds. On the other hand, as many as2500 photoelectrons per PMT can be due to the secondary signal (S2) ina time scale of few microseconds. The event rate is expected to be of theorder of 100 Hz, mainly due to the 39Ar and 85Kr contamination of Argonitself. Under these conditions possible effects of saturation and fatigue haveto be considered. For this reason, a dedicated test has been performed inorder to characterize the PMTs under moderate to high illumination condi-tions at cryogenic temperature. A first set of measurements was performedon five 3” samples: three of the type D750Q and two D750U. The tubes
138
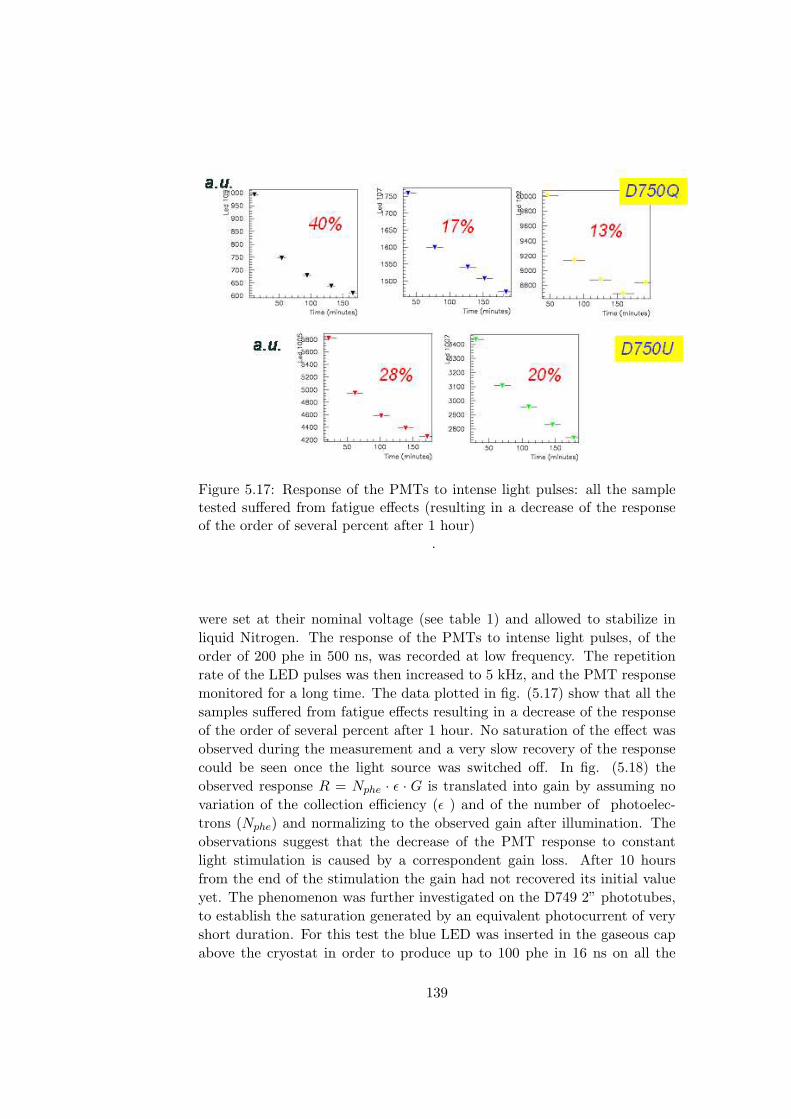
Figure 5.17: Response of the PMTs to intense light pulses: all the sampletested suffered from fatigue effects (resulting in a decrease of the responseof the order of several percent after 1 hour)
.
were set at their nominal voltage (see table 1) and allowed to stabilize inliquid Nitrogen. The response of the PMTs to intense light pulses, of theorder of 200 phe in 500 ns, was recorded at low frequency. The repetitionrate of the LED pulses was then increased to 5 kHz, and the PMT responsemonitored for a long time. The data plotted in fig. (5.17) show that all thesamples suffered from fatigue effects resulting in a decrease of the responseof the order of several percent after 1 hour. No saturation of the effect wasobserved during the measurement and a very slow recovery of the responsecould be seen once the light source was switched off. In fig. (5.18) theobserved response R = Nphe · ε · G is translated into gain by assuming novariation of the collection efficiency (ε ) and of the number of photoelec-trons (Nphe) and normalizing to the observed gain after illumination. Theobservations suggest that the decrease of the PMT response to constantlight stimulation is caused by a correspondent gain loss. After 10 hoursfrom the end of the stimulation the gain had not recovered its initial valueyet. The phenomenon was further investigated on the D749 2” phototubes,to establish the saturation generated by an equivalent photocurrent of veryshort duration. For this test the blue LED was inserted in the gaseous capabove the cryostat in order to produce up to 100 phe in 16 ns on all the
139
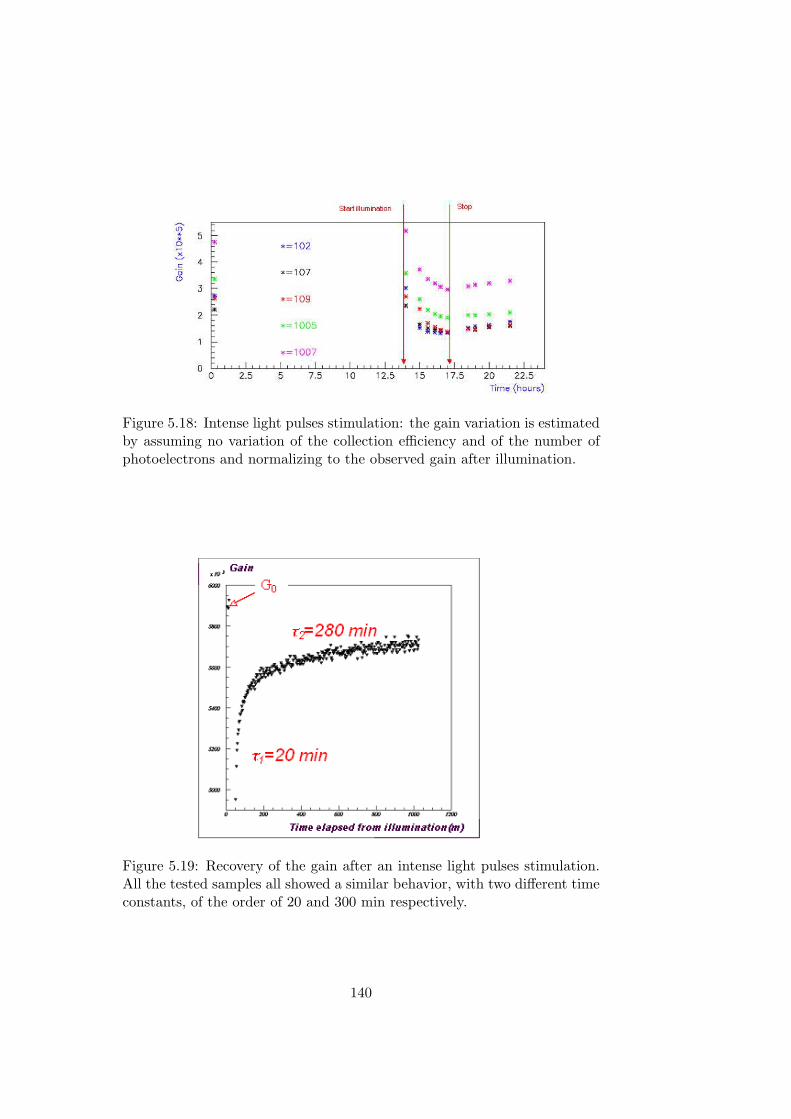
Figure 5.18: Intense light pulses stimulation: the gain variation is estimatedby assuming no variation of the collection efficiency and of the number ofphotoelectrons and normalizing to the observed gain after illumination.
Figure 5.19: Recovery of the gain after an intense light pulses stimulation.All the tested samples all showed a similar behavior, with two different timeconstants, of the order of 20 and 300 min respectively.
140
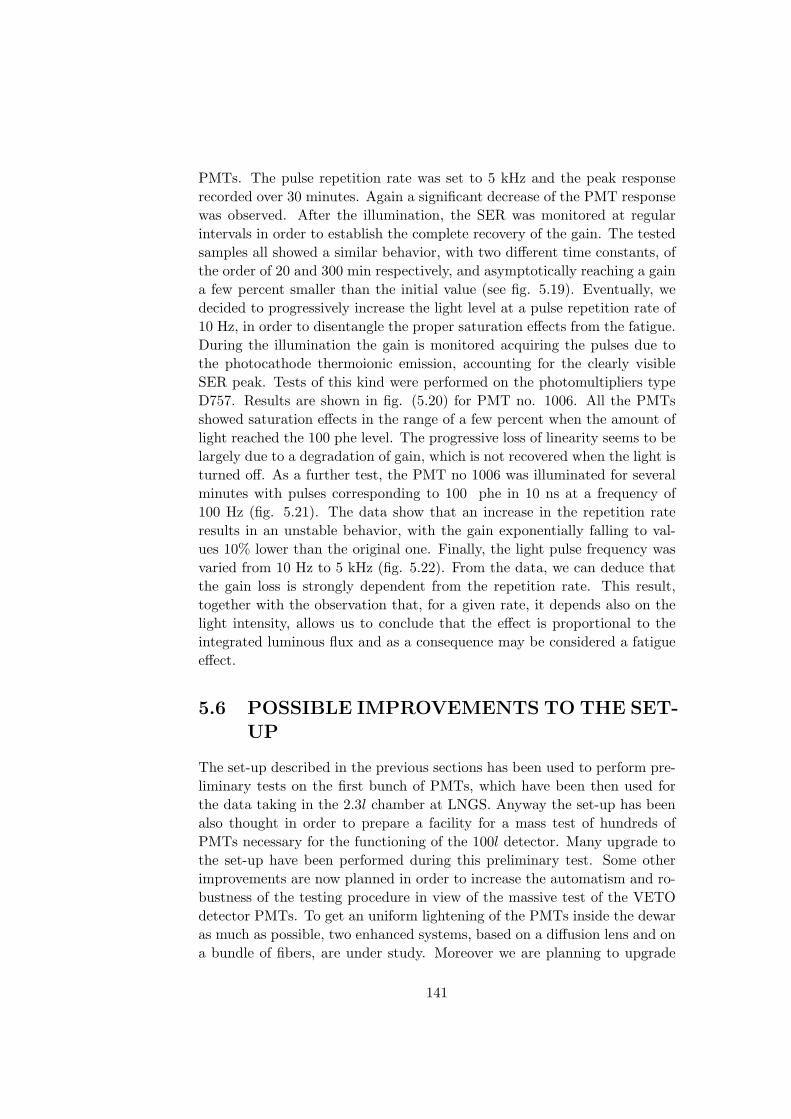
PMTs. The pulse repetition rate was set to 5 kHz and the peak responserecorded over 30 minutes. Again a significant decrease of the PMT responsewas observed. After the illumination, the SER was monitored at regularintervals in order to establish the complete recovery of the gain. The testedsamples all showed a similar behavior, with two different time constants, ofthe order of 20 and 300 min respectively, and asymptotically reaching a gaina few percent smaller than the initial value (see fig. 5.19). Eventually, wedecided to progressively increase the light level at a pulse repetition rate of10 Hz, in order to disentangle the proper saturation effects from the fatigue.During the illumination the gain is monitored acquiring the pulses due tothe photocathode thermoionic emission, accounting for the clearly visibleSER peak. Tests of this kind were performed on the photomultipliers typeD757. Results are shown in fig. (5.20) for PMT no. 1006. All the PMTsshowed saturation effects in the range of a few percent when the amount oflight reached the 100 phe level. The progressive loss of linearity seems to belargely due to a degradation of gain, which is not recovered when the light isturned off. As a further test, the PMT no 1006 was illuminated for severalminutes with pulses corresponding to 100 phe in 10 ns at a frequency of100 Hz (fig. 5.21). The data show that an increase in the repetition rateresults in an unstable behavior, with the gain exponentially falling to val-ues 10% lower than the original one. Finally, the light pulse frequency wasvaried from 10 Hz to 5 kHz (fig. 5.22). From the data, we can deduce thatthe gain loss is strongly dependent from the repetition rate. This result,together with the observation that, for a given rate, it depends also on thelight intensity, allows us to conclude that the effect is proportional to theintegrated luminous flux and as a consequence may be considered a fatigueeffect.
5.6 POSSIBLE IMPROVEMENTS TO THE SET-UP
The set-up described in the previous sections has been used to perform pre-liminary tests on the first bunch of PMTs, which have been then used forthe data taking in the 2.3l chamber at LNGS. Anyway the set-up has beenalso thought in order to prepare a facility for a mass test of hundreds ofPMTs necessary for the functioning of the 100l detector. Many upgrade tothe set-up have been performed during this preliminary test. Some otherimprovements are now planned in order to increase the automatism and ro-bustness of the testing procedure in view of the massive test of the VETOdetector PMTs. To get an uniform lightening of the PMTs inside the dewaras much as possible, two enhanced systems, based on a diffusion lens and ona bundle of fibers, are under study. Moreover we are planning to upgrade
141
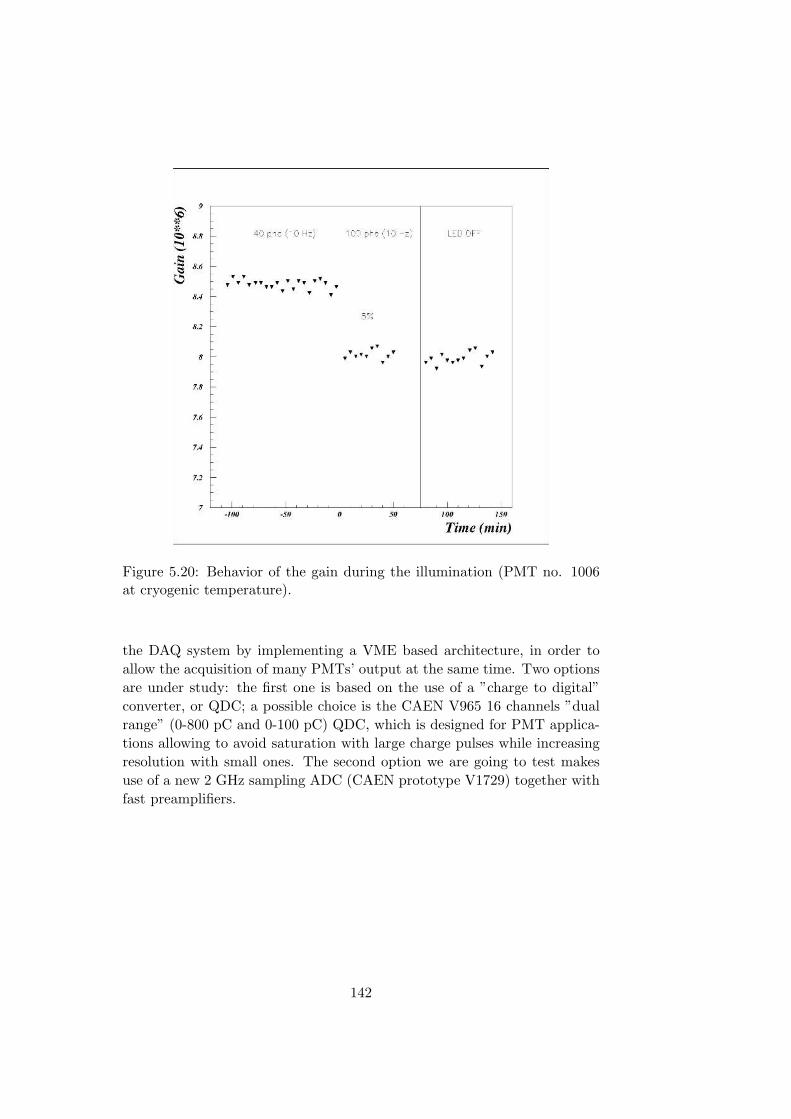
Figure 5.20: Behavior of the gain during the illumination (PMT no. 1006at cryogenic temperature).
the DAQ system by implementing a VME based architecture, in order toallow the acquisition of many PMTs’ output at the same time. Two optionsare under study: the first one is based on the use of a ”charge to digital”converter, or QDC; a possible choice is the CAEN V965 16 channels ”dualrange” (0-800 pC and 0-100 pC) QDC, which is designed for PMT applica-tions allowing to avoid saturation with large charge pulses while increasingresolution with small ones. The second option we are going to test makesuse of a new 2 GHz sampling ADC (CAEN prototype V1729) together withfast preamplifiers.
142
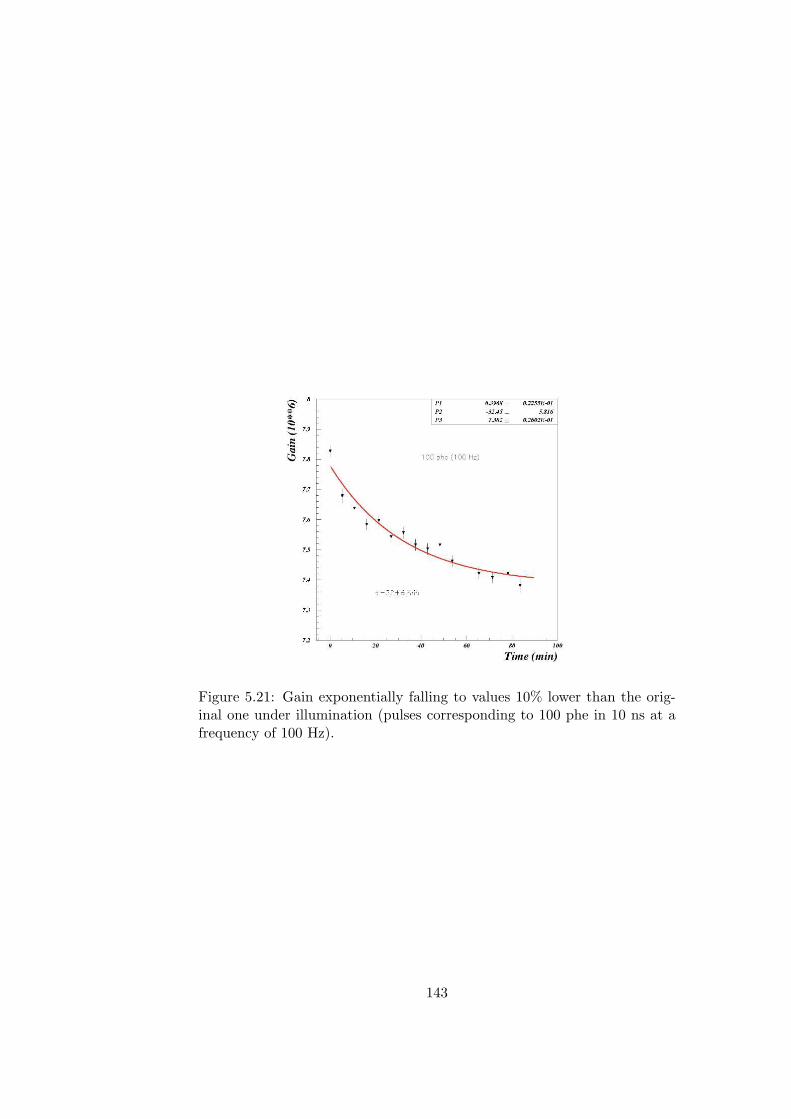
Figure 5.21: Gain exponentially falling to values 10% lower than the orig-inal one under illumination (pulses corresponding to 100 phe in 10 ns at afrequency of 100 Hz).
143
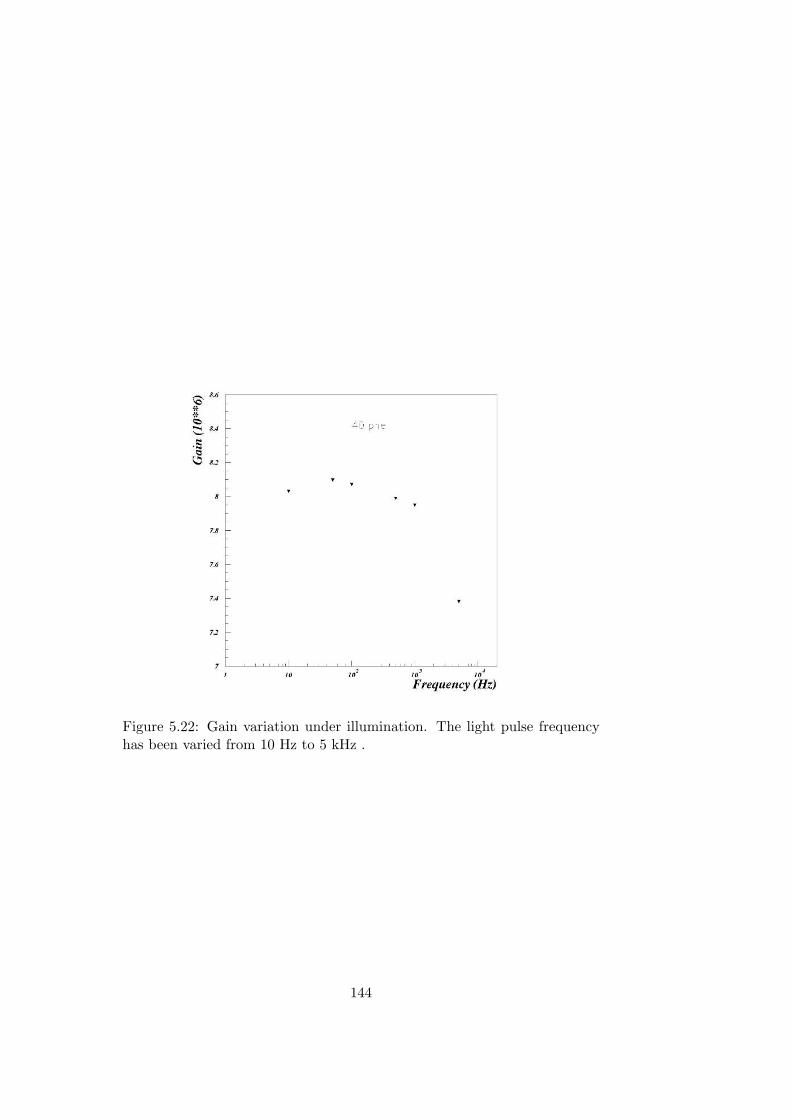
Figure 5.22: Gain variation under illumination. The light pulse frequencyhas been varied from 10 Hz to 5 kHz .
144
SUMMARY
One of the most important goals of modern physics has been the determi-nation of the value and composition of the energy density of the universe.Today several experimental observations, based on different experimentaltechniques, suggest that the dominant contributions to matter density hasan unknown nature: only the 15% of the matter density of the Universecan be explained in terms of baryonic matter, while the largest part con-stitutes the missing mass of the Universe, the so-called dark matter, i.e.that doesn’t emit or absorb electromagnetic radiation. The experimentalresults showed in chapter 1 point out that this unknown mass should bemade of a generic class of neutral, non-baryonic and non-relavistic particlescalled Weakly Interacting Massive Particles (WIMPs). Theoretical predic-tions suggest that this particles could be relics of the Big Bang and still existtoday. Impressively, particle physics predicts the existence of such a type ofparticle starting from a completely different point of view. Supersymmetrycan solve one of the major problems within the Standard Model called theHiggs divergence problem and can make a step towards a theory of the uni-fication of the forces. The theory assumes that, for every Standard Modelparticle there is a corresponding supersymmetric particle with a differentmass. The most promising WIMP candidate is represented by the LightestSupersymmetric Particle (LSP).
WIMPs are believed to exist in a spherical halo in the galaxy, throughwhich the solar system, and hence the Earth, moves. Those particles couldbe detectable through the elastic collisions with the atomic nuclei of detec-tors placed on Earth, although the interactions should be characterized bya very low cross section. Such type of processes can produce a nuclear recoilin a range up to 100keV .
The WARP programme (WIMP ARgon Programme) aims to obtainan evidence of the WIMPs existence through direct detections of elastic scat-tering of WIMPs over the Argon nuclei. Very rare WIMP elastic scatteringswith matter have to be discriminated from the the dominant electromag-netic background, in order to detect the tiny energy deposition produced bya recoiled nucleus.
As shown in chapter 3, liquid Argon provides the main requests in order
145
to represent a good sensitive material to detect WIMPs. First of all, it allowsto realize large mass detectors; moreover liquid Argon technology is matureenough and well supported at an industrial level to provide the radio-purityrequired in rare event search; finally it is possible to provide an efficientevent by event identification of nuclear recoil and electron interactions. Theresults presented in chapter 3 show that the simultaneous measurementsof the ionization charges and scintillation light, that occur when a particleinteraction takes place, can be used to discriminate the nature of the in-teracting particle. A second (and independent) identification technique isprovided by prompt scintillation signal shape analysis. The experimentaltechniques have been tested using a 2.3l double phase argon chamber pro-totype, and a really good background rejection power has been shown. Thecombination of the two proposed identification techniques is able to providea rejection power of the order of 10−7 ÷ 10−8. A 100l (140kg) of sensitivetarget detector has been proposed by the WARP collaboration, in order toreach a sensitivity of the order of 10−8pb in the WIMP-nucleon cross section.The detector has been designed particulary taking care of the backgroundreduction.
An active shield is used to reject the events due to neutrons or otherparticles penetrating from outside or travelling out from the central part.Dimensions of the outer LAr volume are chosen in such a way that the prob-ability for a neutron to interact in the inner detector without producing asignal in the VETO system is negligible, thus only events with no signalsin it are potential WIMP-nucleus interactions. Moreover an external pas-sive shield is added to adequately reduce environmental neutron and gammabackground and all the materials are characterized by an high radiopurity.Data taking at Gran Sasso national laboratory showed that the most dan-gerous background component is represented by the 39Ar contamination ofthe commercial Argon. A β-emission activity of about 0.76Bq ·(kg of Ar)−1
has been measured using the test chamber. As shown in chapter 4, the re-jection power obtained from the combination of the two event-identificationtechniques is able to reduce the probability of a β interaction mislabeledas nuclear recoil, and a background rate of 1 event each 10 ÷ 100 days isexpected for the 100l detector.
One of the most interesting activity concerns the test and the character-ization of the cryogenic photomultiplier tubes, necessary for the detection ofthe scintillation light produced in both phases, that, inside the 100l detector,work directly immersed in LAr. As stressed in chapter 5 a PMTs test facil-ity has been prepared in Naples laboratory. The results reported in chapter5 show that all the tested phototubes are characterized by an high gain andby a good stability at cryogenic temperature. Moreover they showed a verynarrow single electron response, indicating a good energy resolution and low
146
dark noise.Concluding, the promising result obtained by the 2.3l chamber shows
the effectiveness of a LAr detector for Dark Matter search. On this base,the 100l detector gives not only the possibility of a significant enhancementof actual experimental limits, but allows to test the more favored SUSYmodels. Moreover, the LAr technique is even more promising: althoughWIMPs signatures could be found with higher event rates, larger sensitivemasses are allowed to the LAr technology, giving, in principle, access to thefull range of theoretical predictions.
147
Bibliography
[1] G. Jungman,M. Kamiankosky,K. Griest, Phys. Rep. 267 (1996),195;
[2] M. Roncadelli, Aspetti astrofisici della materia oscura Ed. Bibliopolis(2004);
[3] D. H.Perkins, Particle Astrophysics Ed. Oxford Univ. Press (2003);
[4] G. Bertone, D. Hooper, J. Silk, hep-ph/0404175 (2004);
[5] T. J. Sumner, Liv. Rev. in Relativity 5 (2002),4;
[6] G. Chardin, astro-ph/0411503 (2005);
[7] A. Morales, astro-ph/0211446 (2002);
[8] L. Bergstrom, hep-ph/0002126 (2000);
[9] G. Bertone, D. Merrit, astro-ph/0504422 (2005);
[10] M. Kamionkowski, A. Kinkhabwala, Ph. Review D 57 (1998);
[11] M.S. Turner, E.W. Kolb the early Universe (1990);
[12] G.F. Smoot, D. Scott, astro-ph/9603157 (1995);
[13] J. D. Cohn, K. Kadota, astro-ph/0409657 (2005);
[14] W. Hu, The Astrop. journal, 506 (1998), 485;
[15] M. White, D. Scott, J. Silk, Ann. Rev. Astron. and Astroph., 32(1994), 319;
[16] J. L. Feng, Annals of Physics 315 (2005), 2;
[17] C. Munoz, hep-ph/0309346 (2004);
[18] G. L. Kane, Contemp. Physics 41 (2000), 359 ;
[19] D. Wagner, Introduction to Supersymmetry at the NLC (1999)
148
[20] S. Ei, K. Fujii, T. Kunihiro, hep-th/9905088 (1999);
[21] Y. A. Simonov, Jour. of Nonlinear Mat. Phys. 12, (2005), 625 ;
[22] J. G. Bellido, astro-ph/0502139 (2005);
[23] J.D. Lewin, P.F. Smith, Astropart. Phys. 6 (1996),87;
[24] Y.G. Kim et al., hep-ex/0208069 (2005);
[25] Y. Ramachers, astro-ph/0211500 (2002);
[26] R. Abusaidi, PHYSICAL REVIEW LETTERS 84 (2000), 5699;
[27] N. Mirabolfathi, astro-ph/0412103 (2004);
[28] J. Gascon, Nuclear Physics B 143 (2005), 423;
[29] Y. Ramachers, M. Hirsch, H.V. Klapdor-Kleingrothaus, Eur. Phys. J.A 3 (1998), 93;
[30] N. Spooner, Phys. Reports 307 (1998), 253;
[31] A. Drukier, L.Stodolsky Phys. Rev D 30 (1984), 2295;
[32] K. Scholberg, hep-ex/0511042 (2005);
[33] G. Battistoni et al., stroparticle Physics 19 (2003), 269;
[34] R. Baranbei et al., Phys. Lett. B 349 (2000), 23;
[35] R. Baranbei et al., Int. J. Mod. Phys. D 13 (2004), 2127;
[36] W. Seidel, Nucl. Phys. B 138 (2005), 130;
[37] T. Doke, K. Masuda, Nucl. Instr. and Meth. A 420 (1999), 62;
[38] S. Kubota et al., Phys. Rev. B 20 (1979) 3486;
[39] S. Kubota et al., Phys. Rev. B 17 (1978) 2762;
[40] T. Doke et al., Nucl. Instr. and Meth. A 291 (1990), 617;
[41] M. Suzuki et al., Nucl. Instr. and Meth. A 327 (1993), 67;
[42] A. Hitachi et al., Phys. Rev. B 27 (1983), 5279;
[43] Hamamatzu Photonics, Photomultiplier tube, Japan (1994);
[44] Photonis, PHOTOMULTIPLIER TUBES principles & applications ,France (2002);
149
[45] M. Ichige et al., Nucl. Instr. and Meth. in Ph. Res. A327, (1993) 144;
[46] R. Dossi et al., Nucl. Instr. and Meth. in Ph. Res. A 451, (2000) 623;
[47] M. C. Prata et al., Characterization of ETL 9357FLA PhotomuliplierTubes for Cryogenic Temperature Applications, ICARUS TM/04-18(2004);
150